
Next Article in Journal
The Molecular Landscape of the Senescence–EMT Interplay: Deciphering Tumour Plasticity Through Molecular Signatures and Multi-Omic Profiling
Previous Article in Journal
Metabolic Reprogramming in Bladder Cancer: Molecular Drivers, Immune Regulation and Therapeutic Opportunities
 
 
cancers-logo
► Article Menu

Article Menu

Article

Consumption of Processed Meat and Unprocessed Red Meat and Risk of Bladder Cancer: A Pooled Analysis of 30 Cohort Studies

by
Ziyu Wang
1,2,
Nina Afshar
1,2,
Allison M. Hodge
1,2,
Harindra Jayasekara
1,2,3,
Stella Koutros
4,
Piet A. van den Brandt
5,
Alicja Wolk
6,
Molin Wang
7,8,9,
Tao Hou
10,
Hans-Olov Adami
11,12,
Agneta Åkesson
6,
Chrisa Arcan
13,
Kimberly A. Bertrand
14,
Marisa Bittoni
15,16,
David Bogumil
17,
Hui Cai
18,
Amanda J. Cross
19,
A. Heather Eliassen
8,9,10,
Jo L. Freudenheim
20,
Gretchen L. Gierach
4,
Edward L. Giovannucci
8,10,
Wen-Yi Huang
4,
Paula Jakszyn
21,
Rieko Kanehara
22,
Victoria A. Kirsh
23,24,
Woon-Puay Koh
25,
Candyce H. Kroenke
26,27,
James V. Lacey
28,
Linda M. Liao
4,
Erikka Loftfield
4,
Chaoran Ma
29,
Loic Le Marchand
30,
Maria Elena Martinez
31,
Anthony B. Miller
24,
Steven C. Moore
4,
Lorelei A. Mucci
8,32,
Heather M. Munro
33,
Marian L. Neuhouser
34,
Jessica L. Petrick
14,
Jenny N. Poynter
35,
Mark A. Preston
36,37,
Anna Prizment
38,
Samantha Rees
20,
Kim Robien
39,
Thomas E. Rohan
40,
Sven Sandin
12,
Norie Sawada
22,
Eva S. Schernhammer
8,9,41,
Marissa M. Shams-White
42,
Martha J. Shrubsole
18,
Xiao-Ou Shu
18,
Rashmi Sinha
4,
Sabina Sieri
43,
Mingyang Song
8,10,
Meir J. Stampfer
8,9,10,
Rachael Z. Stolzenberg-Solomon
4,
Matthew Triplette
34,
Caroline Y. Um
42,
Kala Visvanathan
44,45,
Trang VoPham
34,
Fenglei Wang
10,
Renwei Wang
46,47,
Sophia S. Wang
28,
Ying Wang
42,
Elisabete Weiderpass
48,
Lynne Wilkens
49,
Walter C. Willett
8,10,
Jian-Min Yuan
46,47,
Wei Zheng
18,
Nathaniel Rothman
4,
Brigid M. Lynch
1,2,
Debra T. Silverman
4,
Stephanie A. Smith-Warner
8,10,† and
Roger L. Milne
1,2,50,*,†
add Show full author list remove Hide full author list
1
Cancer Epidemiology Division, Cancer Council Victoria, Melbourne, Victoria 3002, Australia
2
Centre for Epidemiology and Biostatistics, Melbourne School of Population and Global Health, The University of Melbourne, Melbourne, Victoria 3010, Australia
3
School of Public Health and Preventive Medicine, Faculty of Medicine, Nursing and Health Sciences, Monash University, Clayton, Victoria 3168, Australia
4
Division of Cancer Epidemiology and Genetics, National Cancer Institute, National Institutes of Health, Bethesda, MD 20892, USA
5
Department of Epidemiology, Maastricht University, 6200 MD Maastricht, The Netherlands
6
Institute of Environmental Medicine, Karolinska Institutet, 171 77 Stockholm, Sweden
7
Department of Biostatistics, Harvard T.H. Chan School of Public Health, Boston, MA 02115, USA
8
Department of Epidemiology, Harvard T.H. Chan School of Public Health, Boston, MA 02115, USA
9
Channing Division of Network Medicine, Brigham and Women’s Hospital, Harvard Medical School, Boston, MA 02115, USA
10
Department of Nutrition, Harvard T.H. Chan School of Public Health, Boston, MA 02115, USA
11
Clinical Effectiveness Research Group, Institute of Health and Society, University of Oslo, 0318 Oslo, Norway
12
Department of Medical Epidemiology and Biostatistics, Karolinska Institutet, 171 77 Stockholm, Sweden
13
Department of Nutritional Sciences, College of Health and Human Development, University Park, PA 16802, USA
14
Slone Epidemiology Center, Boston University, Boston, MA 02118, USA
15
Division of Medical Oncology, College of Medicine, The Ohio State University, Columbus, OH 43210, USA
16
The Ohio State University Comprehensive Cancer Center, Columbus, OH 43210, USA
17
Department of Preventive Medicine, Keck School of Medicine, University of Southern California, Los Angeles, CA 90032, USA
18
Division of Epidemiology, Department of Medicine, Vanderbilt Epidemiology Center, Vanderbilt-Ingram Cancer Center, Vanderbilt University Medical Center, Nashville, TN 37203, USA
19
Cancer Screening and Prevention Research Group (CSPRG), Department of Surgery and Cancer, Imperial College London, London W2 1NY, UK
20
Department of Epidemiology and Environmental Health, School of Public Health and Health Professions, University at Buffalo, Buffalo, NY 14214, USA
21
Unit of Nutrition and Cancer, Cancer Epidemiology Research Programme, Catalan Institute of Oncology (ICO-IDIBELL), 08908 Barcelona, Spain
22
Department of Cohort Research, Institute for Cancer Control, National Cancer Center, Tokyo 104-0045, Japan
23
Ontario Institute for Cancer Research, Toronto, ON M5G 0A3, Canada
24
Dalla Lana School of Public Health, University of Toronto, Toronto, ON M5T 3M7, Canada
25
Healthy Longevity Translational Research Programme, Yong Loo Lin School of Medicine, National University of Singapore, Singapore 117456, Singapore
26
Division of Research, Kaiser Permanente Northern California, Pleasanton, CA 94588, USA
27
Kaiser Permanente School of Medicine, Pasadena, CA 91101, USA
28
Division of Health Analytics, Department of Computational and Quantitative Medicine, City of Hope, Duarte, CA 91010, USA
29
Department of Nutrition, School of Public Health & Health Sciences, University of Massachusetts Amherst, Amherst, MA 01003, USA
30
Epidemiology Program, University of Hawaii Cancer Center, Honolulu, HI 96813, USA
31
Department of Family and Preventive Medicine, University of California at San Diego, San Diego, CA 92093, USA
32
Discovery Sciences, American Cancer Society, Atlanta, GA 30303, USA
33
International Epidemiology Field Station, Vanderbilt-Ingram Cancer Center, Vanderbilt University Medical Center, Nashville, TN 37203, USA
34
Division of Public Health Sciences, Fred Hutchinson Cancer Center, Seattle, WA 98109, USA
35
Division of Epidemiology and Clinical Research, Department of Pediatrics, University of Minnesota, Minneapolis, MN 55455, USA
36
Department of Urology, Mass General Brigham, Boston, MA 02114, USA
37
Dana-Farber Cancer Institute, Lank Center for Genitourinary Oncology, Boston, MA 02215, USA
38
Department of Laboratory Medicine and Pathology, University of Minnesota, Minneapolis, MN 55455, USA
39
Department of Exercise and Nutrition Sciences, Milken Institute School of Public Health, George Washington University, Washington, DC 20052, USA
40
Department of Epidemiology and Population Health, Albert Einstein College of Medicine, Bronx, NY 10461, USA
41
Department of Epidemiology, Center for Public Health, Medical University of Vienna, 1090 Vienna, Austria
42
Department of Population Science, American Cancer Society, Atlanta, GA 30303, USA
43
Epidemiology and Prevention Unit, Fondazione IRCCS Istituto Nazionale dei Tumori, Milan 20133, Italy
44
Department of Epidemiology, Johns Hopkins Bloomberg School of Public Health, Baltimore, MD 21205, USA
45
Sidney Kimmel Comprehensive Cancer Center, Johns Hopkins, Baltimore, MD 21287, USA
46
Medical Center (UPMC) Hillman Cancer Center, University of Pittsburgh, Pittsburgh, PA 15232, USA
47
Department of Epidemiology, School of Public Health, University of Pittsburgh, Pittsburgh, PA 15261, USA
48
International Agency for Research on Cancer (IARC), CEDEX 07 69366 Lyon, France
49
Cancer Center, University of Hawaii, Honolulu, HI 96813, USA
50
Precision Medicine, School of Clinical Sciences at Monash Health, Monash University, Clayton, Victoria 3168, Australia
*
Author to whom correspondence should be addressed.
†
These authors contributed equally to this work.
Cancers 2026, 18(19), 3203; https://doi.org/10.3390/cancers18193203
Submission received: 7 September 2026 / Revised: 26 September 2026 / Accepted: 30 September 2026 / Published: 3 October 2026
(This article belongs to the Section Cancer Epidemiology and Prevention)

Simple Summary

Bladder cancer is one of the most common cancers worldwide, but there is still uncertainty about whether eating red and processed meat increases the risk of developing this disease. To provide clearer evidence, we analysed data from more than 2.5 million adults participating in 30 long-term studies conducted across North America, Europe, Australia and Asia. We examined whether people who consumed higher amounts of processed meat, such as bacon, ham and sausages, or unprocessed red meat, such as beef, lamb and pork, were more likely to be diagnosed with bladder cancer over time. We found that higher consumption of both processed meat and unprocessed red meat was associated with a small increase in bladder cancer risk, with stronger evidence for processed meat. These findings strengthen the evidence linking meat consumption to bladder cancer risk and are in line with public health recommendations to limit intake of red and processed meat.

Abstract

Background: Processed meat and unprocessed red meat are considered carcinogenic and ‘probably carcinogenic’ to humans, respectively, but findings for bladder cancer remain inconsistent. Objectives: We assessed associations between processed meat and unprocessed red meat intake and bladder cancer risk using data from the Pooling Project of Prospective Studies of Diet and Cancer. Methods: Associations with bladder cancer risk were assessed using individual-level data from 30 cohort studies from North America, Europe, Australia and Asia. Diet was assessed at enrolment using validated food frequency questionnaires or diet histories. Following a pre-specified analysis plan, study- and sex-specific hazard ratios (HRs) and 95% confidence intervals (CIs) were estimated using Cox regression, adjusted for smoking status and duration and other potential confounders, and pooled using inverse-variance-weighted random-effects meta-analysis. Results: During median follow-up across cohorts of 8–29 years, among 2,575,971 participants, 20,780 were diagnosed with bladder cancer. Processed meat intake was associated with increased bladder cancer risk (HR comparing ≥40 with <5 g/day = 1.08; 95% CI: 1.02–1.15; HR per 20 g/day = 1.02; 95% CI: 1.00–1.03). Weaker evidence of association with increased risk was also observed for unprocessed red meat (HR comparing ≥100 with <20 g/day = 1.06; 95% CI: 1.00–1.13; HR per 50 g/day = 1.01; 95% CI: 0.99–1.03). There was no evidence of heterogeneity by study, sex, or region. Conclusions: Higher intakes of processed meat and unprocessed red meat were associated with a small increase in risk of bladder cancer. These findings are consistent with existing public health recommendations to limit consumption of red and processed meat.

1. Background

Bladder cancer is the 9th most common cancer globally and the 6th most common in males, with an estimated 613,791 new cases and 220,349 deaths in 2022 [1]. Most bladder cancers are urothelial carcinomas, while less common histological types include squamous cell carcinoma and adenocarcinoma [2]. Clinically, bladder cancer is generally classified as non-muscle-invasive or muscle-invasive disease, with approximately 70–75% of patients diagnosed with non-muscle-invasive bladder cancer [2,3]. Non-muscle-invasive bladder cancer is characterised by high recurrence rates, resulting in substantial treatment costs, making bladder cancer the most expensive cancer per patient to treat [4,5]. Bladder cancer risk is influenced by demographic, genetic and lifestyle factors, as well as environmental exposures [3,6,7]. Males have 3–5 times higher incidence than females [8]. Other established risk factors for bladder cancer include age, cigarette smoking, consuming water contaminated with arsenic or certain disinfection byproducts, and occupational exposure to bladder carcinogens, such as some arylamines, which are excreted in the urine, exposing the lining of the bladder to these agents [3,9].
Dietary factors may also influence bladder cancer risk due to the presence of carcinogens and their potentially carcinogenic metabolites, which are excreted through the urinary tract [10]. Identifying dietary factors associated with the risk of bladder cancer could inform prevention strategies [11].
Based on consistent evidence for colorectal cancer, the International Agency for Research on Cancer (IARC) has classified processed meat (of all types) as a Group 1 carcinogen (carcinogenic to humans) and unprocessed red meat as a Group 2A carcinogen (probably carcinogenic to humans) [12]. Meat-related carcinogens and their metabolites may be excreted in urine, where they can come into contact with the urothelium [13]. However, the evidence is more limited for bladder cancer. A recent meta-analysis of eight cohort studies and twelve case–control studies reported that higher intakes of processed meat and red meat were associated with 16%–23% increased risk, comparing highest and lowest categories. Stronger positive associations were observed in the case–control studies than in the cohort studies [14]. Further, findings from prospective studies included in the meta-analysis were inconsistent and limited by relatively small sample sizes, ranging from 114 to 1001 incident cases across eight cohorts [14]. In addition, the meta-analysis was subject to potential publication bias, as well as substantial heterogeneity across studies in dietary exposure assessment and adjustment for smoking and other confounders. The World Cancer Research Fund (WCRF) Continuous Update Project concluded that the evidence for associations between intakes of processed meat and unprocessed red meat with bladder cancer risk remains limited and inconclusive [15].
We aimed to address the limited available evidence on the associations between processed meat and unprocessed red meat consumption and bladder cancer risk by pooling harmonised individual-level data from 30 cohort studies from four continents, using standardised exposure categories and detailed adjustment for smoking status and duration.

2. Methods

2.1. Study Sample

The Pooling Project of Prospective Studies of Diet and Cancer (DCPP) is a consortium established to examine associations between dietary factors and cancer risk [16]. Thirty cohorts from North America, Europe, Australia and Asia were included in this pooled analysis (Table 1 and Supplementary Figure S1). The European Prospective Investigation into Cancer and Nutrition study (EPIC) included 8 European countries: Denmark, France, Germany, Italy, the Netherlands, Spain, Sweden, and the United Kingdom. Each included study met the following predefined criteria: (i) at least one publication on any diet and cancer association; (ii) ≥50 incident cases of bladder cancer for males or females; (iii) usual assessment of long-term diet sufficiently comprehensive to estimate total energy intake; (iv) validation of the dietary assessment tool or a closely related instrument [17,18,19,20,21,22,23,24,25,26,27,28,29,30,31,32,33,34,35,36,37,38,39,40,41,42,43,44,45,46]; and (v) assessment of processed meat or unprocessed red meat intake [16]. Participants in the included studies either provided written informed consent or were considered to have given informed consent through the completion of study questionnaires.

2.2. Dietary Assessment

Diet was assessed at baseline using self-administered food frequency questionnaires (FFQs), diet histories or interviewer-administered quantitative dietary questionnaires [16,27]. The dietary assessment tool used in each study, or a closely related instrument, had been evaluated in a validation study [17,18,19,20,21,22,23,24,25,26,27,28,29,30,31,32,33,34,35,36,37,38,39,40,41,42,43,44,45,46]. Most cohorts did not assess the validity of intakes of food groups [18,20,21,23,25,26,29,31,32,37,39,40,44,45,46], but cohort-specific correlations comparing the intake estimates from the FFQs versus multiple dietary records or 24-h recalls for total fat, saturated fat, total protein and cholesterol were generally greater than 0.40 [17,18,19,20,21,22,23,24,25,26,27,28,29,30,31,32,33,34,35,36,37,38,39,40,41,42,43,44,45,46]. Food intake data were converted to grams consumed per day using study-specific portion sizes and frequency of intake responses. Food group intakes were calculated by summing all related individual items within each cohort, with processed meat including sausages, hot dogs, bacon, ham and luncheon meats of any type (including poultry-based products), and unprocessed red meat including beef, pork, lamb and other red meat such as game meat and rabbit (but excluding organ meat). Total intakes of each of these two food groups were categorised using absolute cut-offs to maximise the exposure contrast while also ensuring sufficient incident case numbers across categories in each cohort: processed meat <5, 5 to <10, 10 to <20, 20 to <40 and ≥40 g/day and unprocessed red meat <20, 20 to <40, 40 to <60, 60 to <100 and ≥100 g/day.
Processed meat intake was generally very low for participants in the Shanghai Women’s Health Study (SWHS), so this study was excluded from the processed meat analyses.

2.3. Ascertainment of Cases

Incident cases of first primary bladder cancer were defined using International Classification of Diseases, Ninth Revision (ICD-9) codes 188.0–188.9 or 233.7, or International Classification of Diseases, Tenth Revision (ICD-10) codes C67.0–C67.9, and ascertained by record linkage to cancer and death registries or self-report confirmed by review of medical records [16]. Cases with behaviour codes 2 (Tis, Ta) or 3 (T1–T4) were included. Cases with unknown or missing histology were included, while those with behaviour code 0 (benign), 1 (uncertain), 6 (metastatic, not originating in the bladder), or 9 (unknown) were censored at diagnosis and not classified as bladder cancer cases.

2.4. Participant-Level Exclusions

In addition to study-specific exclusions that were applied by individual cohorts, participants were excluded from the analyses if they met any of the following criteria: (i) personal history of cancer (except for non-melanoma skin cancer) at baseline; (ii) total energy intake beyond three standard deviations from their study- and sex-specific loge-transformed mean energy intake; (iii) missing data on smoking status; (iv) missing data for the exposure of interest.

2.5. Statistical Analysis

We analysed individual participant-level data separately by cohort and by sex. The Netherlands Cohort Study (NLCS) and the Canadian Study of Diet, Lifestyle and Health (CSDLH) were analysed as case–cohort studies [16,47].
The primary analysis was conducted in two stages. In stage 1, study- and sex-specific hazard ratios and 95% confidence intervals were calculated using Cox regression [48]. We stratified jointly by age at baseline (years), the year in which the baseline questionnaire was returned, and country (for EPIC only), treating follow-up time since study entry as the time scale (until the date of any incident cancer diagnosis, death, loss to follow-up, or administrative end of follow-up, whichever came first). In stage 2, random-effects meta-analysis was used to pool study- and sex-specific hazard ratios, which were weighted by the inverse of the sum of their variance and the estimated between-studies variance component [49]. Heterogeneity of associations across studies was evaluated by I2 and Q statistics [49,50,51]. The assumption of proportional hazards was assessed for each sex-specific cohort based on scaled Schoenfeld residuals [52], with p < 0.001 considered evidence of departure for a given cohort and exposure, given the hundreds of tests conducted.
Epidemiological studies have consistently demonstrated that bladder cancer risk is strongly associated with smoking history, with smoking status and duration being key determinants of risk [3]. Therefore, in the primary analyses, smoking habits were adjusted for by including smoking status and duration in multivariable models. For the Swedish Mammography Cohort (SMC), 1997 was considered baseline because smoking habits were first assessed in that year.
A causal diagram was used to determine which potentially confounding variables to include in stage 1 multivariable models (Supplementary Figure S2). Multivariable models included the following covariates: self-identified race and ethnicity (Asian, Black, Hispanic, White, other), educational level (<high school, high school, >high school), smoking status and duration (never smoker, former smoker < 30 years duration, former smoker ≥ 30 years duration, current smoker < 45 years duration, current smoker ≥ 45 years duration), alcohol consumption (continuous, g/day), physical activity (low, medium, high), total fruit (including fruit juice) intake (continuous, g/day), total vegetable (including vegetable juice) intake (continuous, g/day) and total energy intake (continuous, kcal/day). Participants from cohorts without smoking duration data (NIH-AARP, CLUE II, JPHC I, and JPHC II) were categorised based on smoking status only. Models assessing processed meat intake were additionally adjusted for unprocessed red meat intake (continuous, g/day), and vice versa. For studies with at least 200 incident cases, we adjusted for covariates directly in the model; for studies with less than 200 cases, we applied propensity scores to reduce overfitting [53,54]. For continuous exposures, propensity scores were calculated using linear regression of the exposure on the same covariates in the multivariable model, while for categorical exposures, a logistic regression model was used to estimate the probability of each exposure category. The predicted values or probabilities were included as adjustment variables in the Cox model together with the exposure. The missing indicator method was used for covariates with missing data.
To assess linearity of associations between intake of each type of meat and risk of bladder cancer, we compared models with a linear term to the corresponding models with additional cubic spline terms with 4 knots placed at the 5th, 35th, 65th, and 95th percentiles using the likelihood ratio test, based on the aggregated analysis method in which individual-level data were combined and analysed together with study and sex as additional stratifying variables; participants with intake above the 99th percentile, calculated by pooling consumption data across all cohorts, were excluded.
Trend tests were conducted by including the median value of each exposure category as a continuous variable in the models and evaluating the p-value for trend, calculated based on the Wald test.
Effect modification by sex, smoking status (never, former, current), geographic region (North America, Asia, Europe/Australia), attained age (<70, 70–74.9 and ≥75 years), and duration of follow-up (<5, 5–9.9, and ≥10 years) was assessed via meta-regression of study-specific results [55]. Effect modification by race (Asian, Black, White) was assessed using aggregated analysis.
To evaluate potential reverse causation, we conducted sensitivity analyses examining associations between processed meat and unprocessed red meat consumption and bladder cancer risk after excluding the first two years of follow-up. We performed another sensitivity analysis restricted to the 21 cohorts in which non-invasive papillary carcinoma (Ta) and carcinoma in situ (Tis) were systematically ascertained, as confirmed by the principal investigators of each cohort, to reduce heterogeneity in the definition of cases.
To evaluate the potential confounding effects of smoking on the associations between intake of processed meat and unprocessed red meat and bladder cancer risk, we performed two sensitivity analyses. In the first, we restricted analyses to cohorts with complete data on smoking status and duration (excluding CLUE II, NIH-AARP, JPHC I, and JPHC II) and compared hazard ratios from models with minimal adjustments (stratified only on baseline age, questionnaire completion year, and country [EPIC]) to models additionally adjusted for: (i) smoking status (never, former, or current smoker) and (ii) combined smoking status and duration (never smoker, former smoker with less than 30 years duration, former smoker with at least 30 years duration, current smoker with less than 45 years duration, current smoker with at least 45 years duration). Additionally, we compared these results with models adjusting for all covariates except smoking, progressively incorporating smoking status and duration. In the second sensitivity analysis, we included only participants with complete data on smoking status, duration, intensity (number of cigarettes smoked per day, available for current smokers only), and time since cessation for former smokers, and only studies with <10% missing data across all of these smoking-related variables. We compared models including all covariates except smoking with those sequentially adding smoking status, duration, intensity, and time since quitting. To evaluate potential residual confounding from occupational exposures, we conducted two sensitivity analyses. The first was restricted to participants with more than a high school education. The second was limited to cohorts of teachers and health professionals, including the California Teachers Study (CTS), Nurses’ Health Study (NHS) and NHS II (all female-only), and the Health Professionals Follow-up Study (HPFS; male-only; ClinicalTrials.gov Registration ID: NCT00005182; specific registration page: https://clinicaltrials.gov/study/NCT00005182 (accessed on 1 September 2026)). Each cohort and the consortium received approval from its institutional review board, and participants either provided informed consent directly or informed consent was implied through completion of study questionnaires by participants. All analyses were conducted using SAS software version 9.4 (SAS Institute, Cary, NC, USA).

3. Results

Across 30 cohort studies with a median follow-up of 8–29 years, analyses of unprocessed red meat included 2,575,971 participants (1,538,168 female and 1,037,803 male), of whom 20,780 (5297 female and 15,483 male) were diagnosed with incident bladder cancer; the corresponding numbers for analyses of processed meat (excluding SWHS) were 2,502,700 cohort study participants (1,465,201 female and 1,037,499 male) and 20,672 incident cases (5199 female and 15,473 male) (Table 1). There was considerable variation across studies in processed meat and unprocessed red meat intake, with differences in the study-specific median intakes ranging from 6-fold for unprocessed red meat (CTS: 16.0 g/day vs. Canadian National Breast Screening Study [CNBSS]: 91.0 g/day, Supplementary Figure S4A,B) to 25-fold for processed meat (Singapore Chinese Health Study [SCHS]: 1.4 g/day vs. EPIC: 36.0 g/day, Supplementary Figure S3A,B).
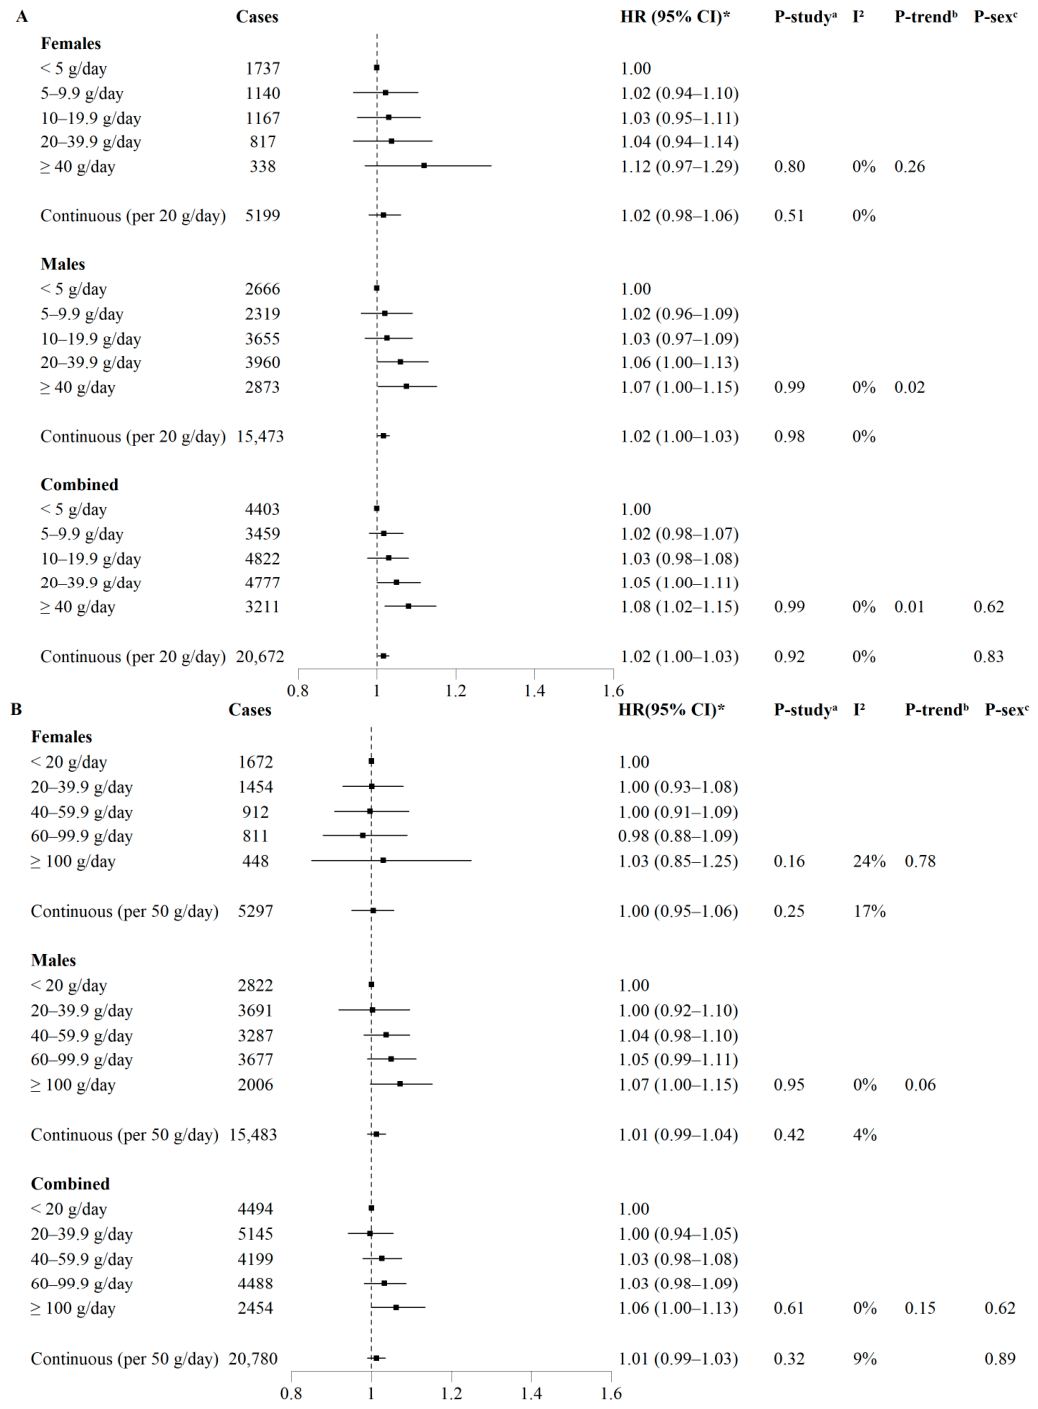
In multivariable analyses, consuming ≥40 g/day of processed meat was associated with an estimated 8% increased risk of bladder cancer overall (HR = 1.08; 95% CI: 1.02–1.15), relative to consuming <5 g/day (Figure 1A). Compared with minimally adjusted models, these estimates reflect substantial attenuation after adjustment, indicating confounding by the covariates considered (Supplementary Figure S5A). There was no evidence of heterogeneity by study (p = 0.99) or by sex (p = 0.62) for the comparisons of highest and lowest categories (Figure 1A and Supplementary Figure S6A,B).
In multivariable analyses, consuming ≥100 g/day of unprocessed red meat was associated with an estimated 6% increased risk of bladder cancer compared to consuming <20 g/day (HR 1.06; 95% CI: 1.00–1.13, Figure 1B). Compared with minimally adjusted models (Supplementary Figure S5B), this and other HR estimates were also substantially attenuated. There was no evidence of heterogeneity by study (p = 0.61) or by sex (p = 0.62; Figure 1B and Supplementary Figure S7A,B).
There was no evidence of departure from linearity, overall or by sex, for the associations between either processed meat or unprocessed red meat consumption and bladder cancer risk (p ≥ 0.23). When processed meat intake was modelled linearly in multivariable-adjusted models, the estimated HR per 20 g/day increment was 1.02 (95% CI: 1.00–1.03; p = 0.01) (Figure 1A). For unprocessed red meat, the estimated HR per 50 g/day increment was 1.01 (95% CI: 0.99–1.03; p = 0.15; Figure 1B).
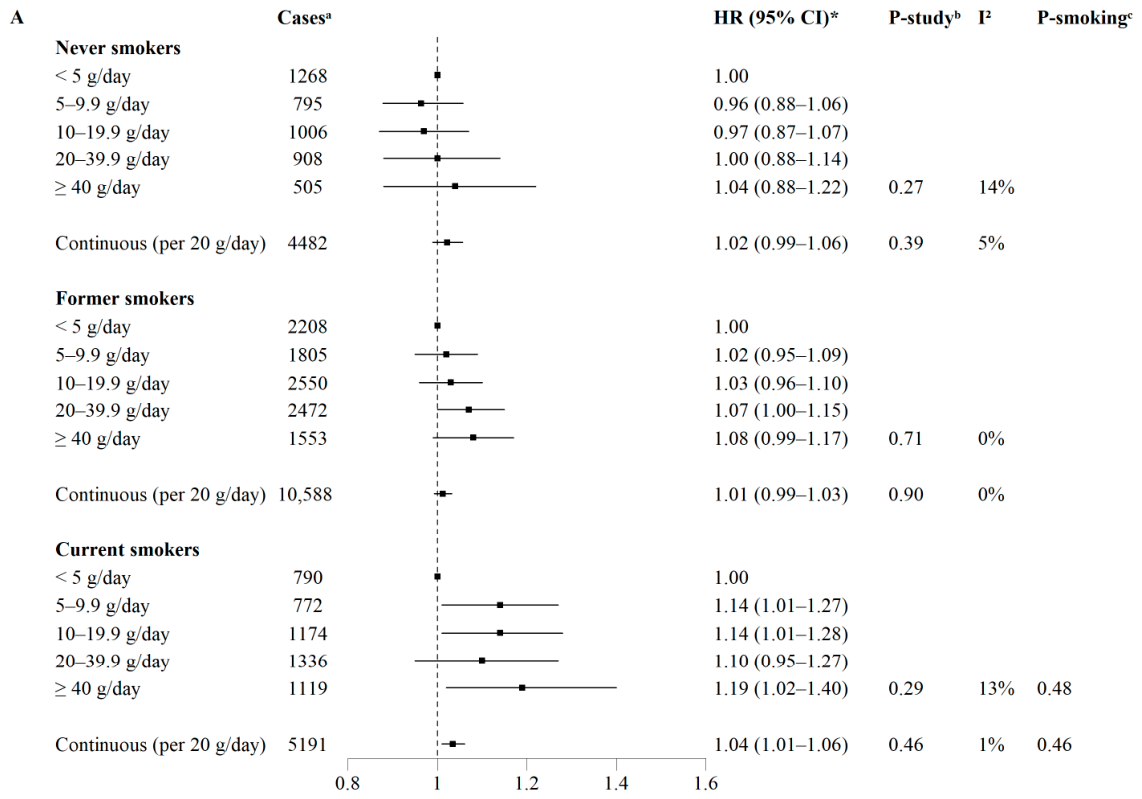
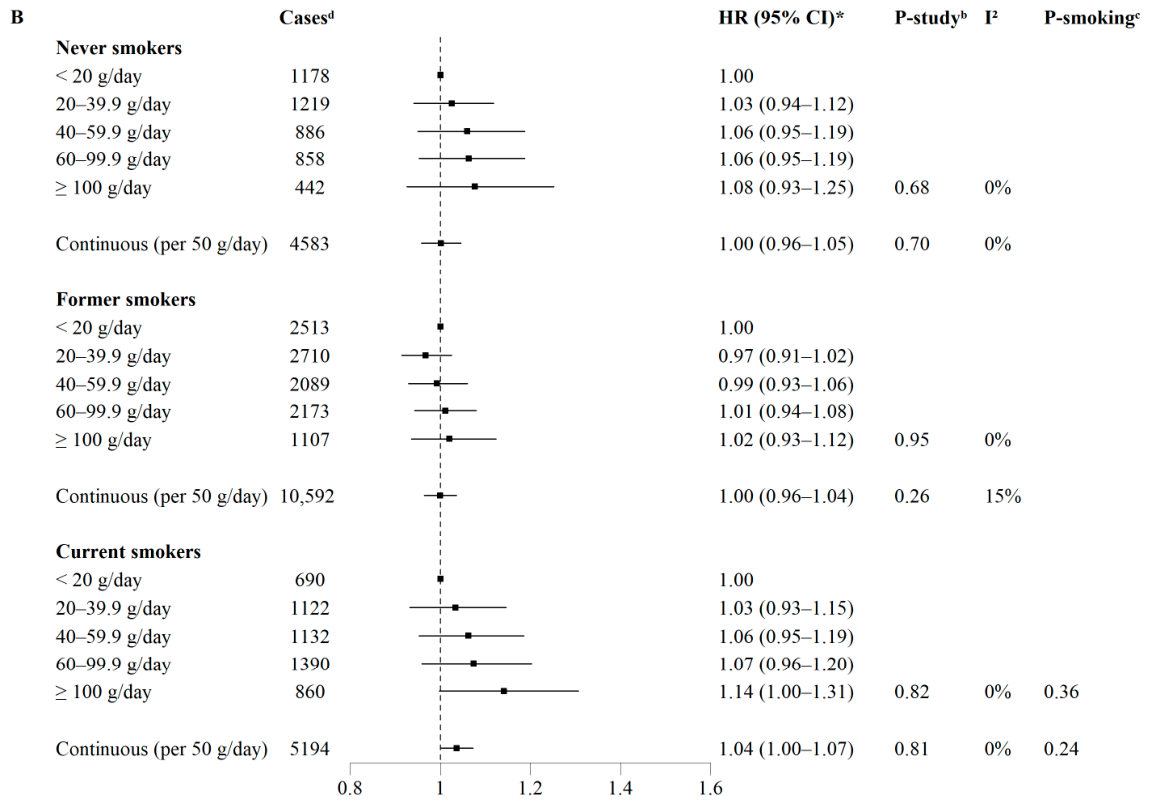
There was no statistical evidence of heterogeneity in associations with bladder cancer risk by smoking status for the highest versus lowest categories of intake or when intake was modelled continuously for processed meat (p ≥ 0.46) or unprocessed red meat (p ≥ 0.24), although HR estimates were substantially higher for current smokers. Among current smokers, the HRs comparing the highest versus lowest categories were 1.19 (95% CI: 1.02–1.40, Figure 2A) for processed meat and 1.14 (95% CI: 1.00–1.31, Figure 2B) for unprocessed red meat, and the HRs per 20 g/day and 50 g/day increment were 1.04 (95% CI: 1.01–1.06) and 1.04 (95% CI: 1.00–1.07), respectively.
Results from analyses restricted to the 25 cohorts that had assessed smoking status and duration suggested that, compared with minimally adjusted models, adjusting for smoking status (never, former, current) substantially attenuated associations of processed meat and unprocessed red meat intakes with bladder cancer risk (Supplementary Table S5). Further adjustment for smoking duration had a limited effect on HR estimates, as did adjusting for covariates other than those related to smoking. Additional sensitivity analyses restricted to participants with complete data on smoking status, duration, intensity, and time since cessation, from studies with <10% missing data on any of these covariates, showed that further adjustment for smoking intensity and time since cessation also had minimal effect on estimates (Supplementary Table S6).
We observed no evidence of heterogeneity in associations by geographic region or race for processed meat or unprocessed red meat (p ≥ 0.15; Supplementary Tables S1 and S2), although the estimated association for processed meat intake was strongest among Black participants (HR = 1.51; 95% CI: 1.10–2.08). For processed meat intake, we found some evidence of heterogeneity by follow-up time (p = 0.03), but no clear trend was observed across the follow-up time strata (e.g., for the highest vs. lowest intake category comparison, less than 5 years: HR 1.08; 95% CI: 0.95–1.22; 5–9.9 years: HR 1.24; 95% CI: 1.09–1.41; 10 years or more: HR 1.01; 95% CI: 0.92–1.11; Supplementary Table S3). For unprocessed red meat intake, we found some evidence of heterogeneity by attained age: the HR comparing ≥100 g/day with <20 g/day was 1.15 (95% CI: 1.04–1.27) for participants aged less than 70 years, 1.14 (95% CI: 0.95–1.35) for participants aged between 70 and 75 years, and 0.97 (95% CI: 0.85–1.11) for those aged 75 years or older (p = 0.08; Supplementary Table S4).
Results were consistent for both processed meat and unprocessed red meat when we excluded the first 2 years of follow-up from the analyses (Supplementary Figure S8), after restricting analyses to the 21 studies that systematically included Tis and Ta bladder cancer cases (Supplementary Figure S9), and after excluding data from sex-specific cohorts for which evidence of departure from proportional hazards was observed at p < 0.001 (Cancer Prevention Study [CPS II] males for red meat and Multiethnic Cohort Study [MEC] females for both meat groups; Supplementary Figure S10). Results were also consistent when analyses were restricted to cohorts of teachers or health professionals and among participants with more than a high school education (Supplementary Table S7).

4. Discussion

In this pooled analysis of over 2.5 million participants in 30 prospective cohort studies, including more than 20,000 incident cases, we found that higher intakes of processed meat and unprocessed red meat were associated with small increases in risk of bladder cancer. Results were generally consistent across studies and strata defined by sex and geographical region, with much wider confidence intervals for females due to the substantially smaller number of cases.
Our findings extend the evidence from prior research on meat consumption and bladder cancer risk. A recent meta-analysis estimated a relative risk for bladder cancer comparing the highest versus lowest processed meat intake categories of 1.16 (95% CI: 1.08–1.25) [14]. When the meta-analysis was limited to cohort studies, five [23,28,33,35,38] of which were also included in our pooled analyses, the association was weaker (relative risk (RR) 1.08; 95% CI: 0.95–1.22) and similar to our findings in the 30 cohort studies included here. Our study provides a more precise estimate, based on categories of exposure that were consistent across cohorts. Approximately 7% of females and 19% of males reported consuming more than 40 g of processed meat per day, which is roughly equivalent to one hot dog, a small sausage or two slices of bacon per day.
For unprocessed red meat, previous meta-analyses have consistently reported stronger associations in case–control studies and weak evidence of associations in cohort studies [14,56]. A meta-analysis conducted in 2018 yielded a modest positive dose–response relationship between red meat intake and bladder cancer overall (RR per 100 g/day = 1.27; 95% CI: 1.03–1.57), whereas little evidence of association was observed across cohort studies (RR per 100 g/day = 0.95; 95% CI: 0.82–1.11), up to six of which [23,27,28,33,35,41] were included in our pooled analyses [56].
For both processed meat and unprocessed red meat, the stronger associations observed in case–control studies might be explained by recall and selection bias [57]. In contrast, our findings based on pooled prospective data from 30 cohorts suggest there is a weak, positive association, which likely provides a more valid estimate of the true association. While previous meta-analyses also included cohorts from multiple regions, our harmonised individual-level data from 30 cohorts allowed a more consistent assessment of effect modification by race or geographic region.
Smoking is one of the most important risk factors for bladder cancer [3]. Experimental studies suggest that cigarette smoking may amplify the carcinogenic potential of meat, possibly exerting a synergistic effect on cancer risk [58,59]. More specifically, a higher total intake of N-nitroso compounds (NOCs) may elevate bladder cancer risk among meat consumers who are current smokers, given the presence of NOCs in meat and the formation of tobacco-specific nitrosamines from cigarette smoking [60]. Consistent with this, we observed stronger associations in current smokers than in never and former smokers, although in this very large sample there was little statistical evidence of heterogeneity in associations by smoking status [61,62].
Our pooled analysis found that associations for processed meat consumption differed by follow-up time, but there was no clear pattern with increasing time. We also found some evidence that intake of unprocessed red meat was associated with increased bladder cancer risk before age 75 years and little evidence of association after age 75 years. The decline in immune surveillance with aging contributes to an increased overall cancer risk [63]. It is also possible that individuals remaining cancer-free after age 75 are less susceptible to cancer [64]. This selection may attenuate the associations between dietary intake and bladder cancer risk in older age groups.
Notably, the estimated association between processed meat intake and bladder cancer risk was strongest in Black participants. In our pooled analyses, 16.9% of Black participants, 16.3% of White participants and 4.8% of Asian participants were in the highest category for processed meat intake. At the upper end of the distribution (95th and 99th percentiles), Black individuals reported higher processed meat consumption (78.2 and 148.8 g/day, respectively), compared with White individuals (64.2 and 112.9 g/day) and Asian individuals (30.4 and 57.4 g/day), which could partly explain the stronger association observed. Although the test for heterogeneity by race was not statistically significant, the small number of Black cases may have limited the power to detect interaction.
There are several biological mechanisms that could explain associations between intakes of processed meat and unprocessed red meat and risk of bladder cancer. One proposed mechanism involves the formation of chemical carcinogens during meat cooking and processing [12]. Processed meat and unprocessed red meat cooked at high temperatures contain pro-carcinogenic compounds such as heterocyclic amines and polycyclic aromatic hydrocarbons. Some heterocyclic amines have been shown to induce urinary bladder tumours in experimental animals, and human bladder epithelial cells can bioactivate certain heterocyclic aromatic amines to DNA-damaging metabolites [13,65]. Nitrates and nitrites, added to processed meat for preservation, colour and flavour enhancement, are precursors to NOCs [66]. Additionally, both unprocessed and processed red meats contain heme iron, which increases the endogenous synthesis of NOCs [67,68]. Experimental studies have also shown that some N-nitroso compounds can induce mutagenesis in the urothelium and cause bladder tumours [69]. NOCs are potentially carcinogenic compounds known to enhance tumour growth [70,71].
This pooled analysis has several strengths. First, it combined data from 30 cohort studies across four continents, with more than 20,000 incident bladder cancer cases. The large sample size provided much greater statistical power to examine associations than individual studies and allowed us to examine whether associations varied by population subgroups, although power remained limited to detect modest differences in some subgroup analyses, particularly those by race. Second, the prospective design minimised the effects of recall bias and selection bias, which are common in case–control studies [57]. Third, the variation in meat consumption across cohorts allowed us to assess associations over the full range of exposure. We also harmonised exposure, covariate, and outcome definitions across studies, which helped reduce heterogeneity and ensured more consistent comparisons. In addition, our findings are less likely to be influenced by publication bias, as 20 of the 30 cohort studies in our pooled analyses, contributing 7530 bladder cancer cases, had not previously published on associations between meat consumption and bladder cancer risk. Finally, the comprehensive baseline data from DCPP, including detailed demographic and smoking information, allowed us to apply the most comprehensive smoking adjustment models and control for other potential confounders. We conducted sensitivity analyses that incorporated more detailed smoking information, including smoking intensity and time since cessation, in addition to smoking status and duration. Results were consistent with those from the main analyses, suggesting that residual confounding by smoking was minimal, although it cannot be entirely ruled out.
Our study has some limitations. First, we were unable to account for occupational exposure to carcinogenic chemicals, which is an established risk factor for bladder cancer. However, in our sensitivity analyses limited to cohorts of teachers, nurses and health professionals (which are likely low-risk occupations) or restricted to participants with education more than high school, the associations were generally consistent, indicating that our results are unlikely to be explained by occupational confounding. Although we adjusted for various lifestyle-related risk factors, we cannot completely rule out the possibility that our findings may partly reflect associations with unmeasured lifestyle factors associated with meat intake [72]. Another limitation is that dietary intake was assessed primarily using food frequency questionnaires, which are subject to measurement error and potential misclassification [73]. Biomarker data on meat intake were not available in the pooled dataset used for this analysis. Given that median follow-up ranged from 8 to 29 years across cohorts, our baseline dietary assessment may not fully represent long-term intake or changes in dietary and lifestyle factors during follow-up. However, given the relatively long latency of bladder cancer, baseline dietary intake may still capture an etiologically relevant exposure period. Non-differential measurement error from a single baseline dietary assessment may have attenuated the observed associations towards the null. Further, we were unable to capture variation in meat preparation and cooking methods across cohorts or assess potential differences in composition of processed meats. Factors such as trimming fat, use of lean versus fatty cuts, cooking temperature, and cooking methods like roasting, grilling or stewing may influence the production of carcinogens [74].

5. Conclusions

In summary, our pooled analysis found small positive associations between intakes of processed and unprocessed red meat and bladder cancer risk. Our findings are consistent with existing public health recommendations to limit consumption of red and processed meat.

Supplementary Materials

The following supporting information can be downloaded at: https://www.mdpi.com/article/10.3390/cancers18193203/s1, Figure S1: Flow chart for cohort and participant selection in the pooled analysis; Figure S2: Directed acyclic graph (DAG) showing assumed causal associations between processed meat and unprocessed red meat and bladder cancer risk; Figure S3: Median and interquartile range of intake of processed meat, by sex, for females (A) and males (B); Figure S4: Median and interquartile range of intake of unprocessed red meat, by sex, for females (A) and males (B); Figure S5: Minimally-adjusted associations between processed meat (A) and unprocessed red meat (B) intake and risk of bladder cancer, by sex; Figure S6: Study-specific multivariable-adjusted hazard ratios for bladder cancer comparing consumption of ≥40 g/day with <5 g/day of processed meat, by sex, for females (A) and males (B); Figure S7: Study-specific multivariable-adjusted hazard ratios for bladder cancer comparing consumption of ≥100 g/day with <20 g/day of unprocessed red meat in association, by sex, for females (A) and males (B); Figure S8: Associations between processed meat and unprocessed red meat consumption and risk of bladder cancer in all participants after excluding the first 2 years of follow-up; Figure S9: Associations between processed meat and unprocessed red meat consumption and risk of bladder cancer in all participants after restricting analyses to the 21 studies that systematically ascertained all types of bladder cancers; Figure S10: Associations between processed meat and unprocessed red meat consumption and risk of bladder cancer in all participants, after excluding data from sex-specific cohorts for which evidence of departure from proportional hazards was observed at p < 0.001; Table S1: Association between the consumption of processed meat and unprocessed meat, and risk of bladder cancer, by geographic region; Table S2: Association between the consumption of processed meat and unprocessed meat, and risk of bladder cancer, by race; Table S3: Association between consumption of processed meat and unprocessed meat, and risk of bladder cancer, by follow-up time; Table S4: Association between consumption of processed meat and unprocessed meat, and risk of bladder cancer, by attained age; Table S5: Minimally-adjusted and multivariable hazard ratios for bladder cancer risk associated with processed meat and unprocessed meat consumption; Table S6: Multivariable hazard ratios for bladder cancer risk associated with processed meat and unprocessed meat consumption among participants with complete data on all smoking variables; Table S7: Multivariable hazard ratios for bladder cancer risk associated with processed meat and unprocessed meat consumption, restricted to participants in cohorts of teachers and health professionals and those with more than a high school education.

Author Contributions

Z.W., N.A., S.K., P.A.v.d.B., A.W., N.R., B.M.L., D.T.S., S.A.S.-W., and R.L.M. designed the research. P.A.v.d.B., A.W., A.H.E., J.L.F., G.L.G., W.-P.K., J.V.L., S.C.M., L.A.M., M.L.N., A.P., T.E.R., S.S. (Sven Sandin), N.S., X.-O.S., R.S., R.Z.S.-S., K.V., E.W., W.C.W., J.-M.Y., W.Z., S.A.S.-W., and R.L.M. conducted the research. P.A.v.d.B., A.W., A.H.E., J.L.F., G.L.G., J.V.L., S.C.M., L.A.M., A.P., T.E.R., S.S. (Sven Sandin), N.S., E.S.S., X.-O.S., R.S., R.Z.S.-S., K.V., E.W., J.-M.Y., W.Z., S.A.S.-W., and R.L.M. provided essential reagents or provided essential materials. Z.W., N.A., T.H., and S.A.S.-W. analysed data or performed statistical analysis. All authors wrote the paper. All authors hold primary responsibility for the final content. All authors have read and agreed to the published version of the manuscript.

Funding

This research was funded by Wereld Kanker Onderzoek Fonds (WKOF), as part of the World Cancer Research Fund International grant programme, grant number IIG_FULL_2020_036. The participating cohorts were supported by the following funding sources: The Breast Cancer Detection Demonstration Project Follow-Up Study was supported by the Intramural Research Program of the Division of Cancer Epidemiology and Genetics, National Cancer Institute, National Institutes of Health, U.S. Department of Health and Human Services. The Black Women’s Health Study was supported by the National Institutes of Health (grant U01-CA164974). Cancer registry data were supported by the Centers for Disease Control and Prevention’s National Program of Cancer Registries and/or the National Cancer Institute’s Surveillance, Epidemiology, and End Results Program, as well as by relevant state agencies, universities and cancer centres. The Beta-Carotene and Retinol Efficacy Trial was funded by the National Cancer Institute, National Institutes of Health (grants U01-CA063673, UM1-CA167462 and U01-CA167462). The Campaign Against Cancer and Heart Disease II cohort was supported by the National Cancer Institute (grant U01-CA-086308) and the National Institute on Aging (grant U01-AG-18033). Cancer data were provided by the Maryland Cancer Registry, Center for Cancer Prevention and Control, Maryland Department of Health, with funding from the State of Maryland and the Maryland Cigarette Restitution Fund. The collection and availability of cancer registry data were also supported by the Centers for Disease Control and Prevention (Cooperative Agreement NU58DP007114). The Canadian National Breast Screening Study was supported by the Canadian Cancer Society, the Department of National Health and Welfare, the National Cancer Institute of Canada, the Alberta Heritage Fund for Cancer Research, the Manitoba Health Services Commission, the Medical Research Council of Canada, the Ministry of Health and Social Services of Québec, the Nova Scotia Department of Health and the Ontario Ministry of Health. The Cohort of Swedish Men is part of the Swedish Infrastructure for Medical Population-based Life-course and Environmental Research, which receives funding from the Swedish Research Council (grants 2017-00644 and 2021-00160). The American Cancer Society funds the creation, maintenance and updating of the Cancer Prevention Study-II Nutrition Cohort. The Canadian Study of Diet, Lifestyle and Health was supported by the Medical Research Council of Canada (grant MT-14833). The California Teachers Study was supported by the National Cancer Institute, National Institutes of Health (awards U01-CA199277, P30-CA033572, P30-CA023100, UM1-CA164917 and R01-CA077398). The coordination of the European Prospective Investigation into Cancer and Nutrition in Europe is financially supported by the International Agency for Research on Cancer and the Department of Epidemiology and Biostatistics, School of Public Health, Imperial College London, with additional infrastructure support provided by the National Institute for Health and Care Research Imperial Biomedical Research Centre. The national cohorts are supported by the Danish Cancer Society (Denmark); Ligue Nationale Contre le Cancer, Institut Gustave Roussy, Mutuelle Générale de l’Education Nationale, Institut National de la Santé et de la Recherche Médicale, the French National Research Agency (ANR-10-COHO-0006) and the French Ministry for Higher Education (subsidies 2102918823, 2103236497 and 2103586016) (France); German Cancer Aid, the German Cancer Research Center, the German Institute of Human Nutrition Potsdam-Rehbruecke and the Federal Ministry of Education and Research (Germany); Associazione Italiana per la Ricerca sul Cancro, the Italian Ministry of Health, the Italian Ministry of University and Research and Compagnia di San Paolo (Italy); the Dutch Ministry of Health, Welfare and Sport, the Netherlands Organisation for Health Research and Development and the World Cancer Research Fund (the Netherlands); UiT The Arctic University of Norway (Norway); the Health Research Fund–Instituto de Salud Carlos III, the regional governments of Andalucía, Asturias, the Basque Country, Murcia and Navarra, and the Catalan Institute of Oncology (Spain); the Swedish Cancer Society, the Swedish Research Council and the county councils of Skåne and Västerbotten (Sweden); and Cancer Research UK (grants C864/A14136 to EPIC-Norfolk and C8221/A29017 to EPIC-Oxford) and the Medical Research Council (grants MR/N003284/1, MC-UU_12015/1 and MC_UU_00006/1 to EPIC-Norfolk, and MR/Y013662/1 to EPIC-Oxford) (United Kingdom). Previous support was provided by the Europe Against Cancer Programme of the European Commission. The Health Professionals Follow-up Study was supported by the National Institutes of Health (grant U01 CA167552). Cancer registry data were supported by the Centers for Disease Control and Prevention’s National Program of Cancer Registries and/or the National Cancer Institute’s Surveillance, Epidemiology, and End Results Program. The Iowa Women’s Health Study was supported by the National Cancer Institute, United States (grant R01 CA039742). The Japan Public Health Center-based Prospective Study I and II were supported by National Cancer Center Research and Development Fund (23-A-31[toku], 26-A-2, 29-A-4, 2020-J-4, 2023-J-04, and 2026-J-4) (since 2011) and a Grant-in-Aid for Cancer Research from the Ministry of Health, Labour and Welfare of Japan (from 1989 to 2010). Recruitment for the Melbourne Collaborative Cohort Study was funded by VicHealth and Cancer Council Victoria. The cohort was further supported by the Australian National Health and Medical Research Council (grants 209057, 396414 and 1074383) and by infrastructure provided by Cancer Council Victoria. The Multiethnic Cohort Study was supported by the National Institutes of Health/National Cancer Institute (grant U01 CA164973). The Nurses’ Health Study was supported by the National Institutes of Health (grants UM1 CA186107 and P01 CA87969). Cancer registry data were supported by the Centers for Disease Control and Prevention’s National Program of Cancer Registries and/or the National Cancer Institute’s Surveillance, Epidemiology, and End Results Program. The Nurses’ Health Study II was supported by the National Institutes of Health (grant U01 CA176726). Cancer registry data were supported by the Centers for Disease Control and Prevention’s National Program of Cancer Registries and/or the National Cancer Institute’s Surveillance, Epidemiology, and End Results Program. The NIH-AARP Diet and Health Study was supported by the Intramural Research Program of the Division of Cancer Epidemiology and Genetics, National Cancer Institute, National Institutes of Health. The Netherlands Cohort Study was supported by the Dutch Cancer Society and the World Cancer Research Fund. The New York State Cohort had no source of funding to declare. The Prostate, Lung, Colorectal, and Ovarian Cancer Screening Trial was supported by the Intramural Research Program of the Division of Cancer Epidemiology and Genetics and by contracts from the Division of Cancer Prevention, National Cancer Institute, National Institutes of Health, U.S. Department of Health and Human Services. Cancer registry data were supported in part by funds from the Centers for Disease Control and Prevention’s National Program of Cancer Registries, local states, and/or the National Cancer Institute’s Surveillance, Epidemiology, and End Results Program. The Southern Community Cohort Study was funded by the National Cancer Institute, National Institutes of Health (grant U01CA202979). The Singapore Chinese Health Study was supported by the United States National Institutes of Health (grants R01 CA144034 and UM1 CA182876) and the Singapore Ministry of Health’s National Medical Research Council under its Strategic Cohorts Funding programme (project P2022-02). The Swedish Mammography Cohort is part of the Swedish Infrastructure for Medical Population-based Life-course and Environmental Research, which receives funding from the Swedish Research Council (grants 2017-00644 and 2021-00160). The Shanghai Men’s Health Study was supported by the United States National Institutes of Health (grant UM1CA173640). The Shanghai Women’s Health Study was supported by the United States National Institutes of Health (grant UM1CA182910). The Women’s Health Initiative programme is funded by the National Heart, Lung, and Blood Institute, National Institutes of Health, U.S. Department of Health and Human Services (contracts 75N92021D00001, 75N92021D00002, 75N92021D00003, 75N92021D00004 and 75N92021D00005). The Women’s Lifestyle and Health Study had no source of funding to declare.

Institutional Review Board Statement

Each individual cohort study and this consortial project were conducted with the approval of their local institutional review board (IRB) or boards and those of participating registries as required. This consortial project was also approved by the Harvard T.H. Chan School of Public Health IRB and the Cancer Council Victoria Human Research Ethics Committee. The study protocol was approved by the institutional review boards of the Brigham and Women’s Hospital, Harvard T.H. Chan School of Public Health, and those of participating registries as required.

Informed Consent Statement

All participants provided informed consent directly, or informed consent was implied through completion of study questionnaires.

Data Availability Statement

The sharing of data will be coordinated by the corresponding author and governed by executed data use agreements between the home institution of each cohort study and the Harvard T.H. Chan School of Public Health, as well as with approval from lead investigators or leadership group, for each cohort.

Acknowledgments

We thank the participants in the 30 cohorts involved in this project. We acknowledge the contributions of Shiaw-Shyuan (Sherry) Yaun and Amelia Zhang from the Harvard T.H. Chan School of Public Health for data analysis and quality control support and administrative coordination. Black Women’s Health Study (BWHS): The authors acknowledge the contributions of the BWHS participants and staff and the following participating central cancer registries: Alabama, Arkansas, Arizona, California, Colorado, Connecticut, Delaware, District of Columbia, Florida, Georgia, Hawaii, Iowa, Illinois, Indiana, Kentucky, Louisiana, Maryland, Massachusetts, Michigan, Missouri, Mississippi, Nebraska, New Jersey, New Mexico, New York, North Carolina, Ohio, Oklahoma, Oregon, Pennsylvania, South Carolina, Tennessee, Texas, Virginia, SEER Seattle and Wisconsin. Campaign Against Cancer and Heart Disease II (CLUE II): Cancer data were provided by the Maryland Cancer Registry, Center for Cancer Prevention and Control, Maryland Department of Health. Cancer Prevention Study-II Nutrition Cohort (CPS II): The authors express their sincere appreciation to all Cancer Prevention Study-II participants and to each member of the study and biospecimen management group. The authors would like to acknowledge the contribution to this study from central cancer registries supported through the Centers for Disease Control and Prevention’s National Program of Cancer Registries and cancer registries supported by the National Cancer Institute’s Surveillance, Epidemiology and End Results Program. Health Professionals Follow-Up Study (HPFS): The authors are grateful to the study participants and staff of the Health Professionals Follow-Up Study. The authors also acknowledge the contributions of the following participating central cancer registries: Alabama, Alaska, Arizona, Arkansas, California, Colorado, Connecticut, Delaware, Florida, Georgia, Hawaii, Idaho, Indiana, Iowa, Kentucky, Louisiana, Maine, Maryland, Massachusetts, Michigan, Mississippi, Montana, Nebraska, Nevada, New Hampshire, New Jersey, New Mexico, New York, North Carolina, North Dakota, Ohio, Oklahoma, Oregon, Pennsylvania, Puerto Rico, Rhode Island, Seattle SEER Registry, South Carolina, Tennessee, Texas, Utah, Virginia, West Virginia and Wyoming. Melbourne Collaborative Cohort Study (MCCS): Cancer cases and vital status were ascertained through the Victorian Cancer Registry. Nurses’ Health Study (NHS): The authors acknowledge the contributions of the following participating central cancer registries: Alabama, Alaska, Arizona, Arkansas, California, Colorado, Connecticut, Delaware, Florida, Georgia, Hawaii, Idaho, Indiana, Iowa, Kentucky, Louisiana, Maine, Maryland, Massachusetts, Michigan, Mississippi, Montana, Nebraska, Nevada, New Hampshire, New Jersey, New Mexico, New York, North Carolina, North Dakota, Ohio, Oklahoma, Oregon, Pennsylvania, Puerto Rico, Rhode Island, Seattle SEER Registry, South Carolina, Tennessee, Texas, Utah, Virginia, West Virginia and Wyoming. Nurses’ Health Study II (NHS II): The authors acknowledge the contributions of the following participating central cancer registries: Alabama, Alaska, Arizona, Arkansas, California, Colorado, Connecticut, Delaware, Florida, Georgia, Hawaii, Idaho, Indiana, Iowa, Kentucky, Louisiana, Maine, Maryland, Massachusetts, Michigan, Mississippi, Montana, Nebraska, Nevada, New Hampshire, New Jersey, New Mexico, New York, North Carolina, North Dakota, Ohio, Oklahoma, Oregon, Pennsylvania, Puerto Rico, Rhode Island, Seattle SEER Registry, South Carolina, Tennessee, Texas, Utah, Virginia, West Virginia and Wyoming. NIH-AARP Diet and Health Study (NIH-AARP): We are indebted to the participants in the NIH-AARP Diet and Health Study for their cooperation. We thank Sigurd Hermansen and Kerry Grace Morrissey from Westat for study outcome ascertainment and management and Leslie Carroll from Information Management Services for data support and analysis. Cancer incidence data were provided by the Georgia Center for Cancer Statistics, Department of Epidemiology, Rollins School of Public Health, Emory University; the California Cancer Registry, California Department of Public Health; the Michigan Cancer Surveillance Program; the Florida Cancer Data System; the Louisiana Tumor Registry, Louisiana State University Health Sciences Center School of Public Health; the New Jersey State Cancer Registry, Rutgers Cancer Institute of New Jersey; the North Carolina Central Cancer Registry; the Pennsylvania Department of Health; the Arizona Cancer Registry, Arizona Department of Health Services; the Texas Cancer Registry, Texas Department of State Health Services; and the Nevada Central Cancer Registry, State of Nevada Department of Health and Human Services. Prostate, Lung, Colorectal, and Ovarian Cancer Screening Trial (PLCO): The authors thank the study participants, the National Cancer Institute study management team, the screening centre investigators, and staff at Information Management Services, Inc. and Westat, Inc. Cancer incidence data were provided by the Colorado Central Cancer Registry, District of Columbia Cancer Registry, Georgia Cancer Registry, Hawaii Cancer Registry, Cancer Data Registry of Idaho, Minnesota Cancer Surveillance System, Missouri Cancer Registry, Nevada Central Cancer Registry, Pennsylvania Cancer Registry, Texas Cancer Registry, Virginia Cancer Registry and Wisconsin Cancer Reporting System. VITamins and Lifestyle Study (VITAL): VITAL cohort data were provided by its Principal Investigator, Emily White.

Conflicts of Interest

The authors declare no competing interests. This research was supported in part by the Intramural Research Program of the National Institutes of Health (NIH). The contributions of the NIH authors are considered works of the United States Government. The findings and conclusions presented in this paper are those of the authors and do not necessarily reflect the views of the NIH or the U.S. Department of Health and Human Services. Where authors are identified as personnel of the International Agency for Research on Cancer/World Health Organization, the authors alone are responsible for the views expressed in this article, and they do not necessarily represent the decisions, policy or views of the International Agency for Research on Cancer/World Health Organization.

Abbreviations

CIconfidence interval
DCPPPooling Project of Prospective Studies of Diet and Cancer
HRhazard ratio
IARCInternational Agency for Research on Cancer
ICDInternational Classification of Diseases
NCINational Cancer Institute
NOCN-nitroso compounds
RRrelative risk
WCRFWorld Cancer Research Fund
BCDDPBreast Cancer Detection Demonstration Project Follow-Up Study
BWHSBlack Women’s Health Study
CARETBeta-Carotene and Retinol Efficacy Trial
CLUE IICampaign Against Cancer and Heart Disease
CNBSSCanadian National Breast Screening Study
COSMCohort of Swedish Men
CPS IICancer Prevention Study II Nutrition Cohort
CSDLHCanadian Study of Diet, Lifestyle and Health
CTSCalifornia Teachers Study
EPICEuropean Prospective Investigation into Cancer and Nutrition
HPFSHealth Professionals Follow-up Study (ClinicalTrials.gov Registration ID: NCT00005182; Registration URL: https://clinicaltrials.gov/study/NCT00005182 (accessed on 1 September 2026))
IWHSIowa Women’s Health Study
JPHC IJapan Public Health Center-based Prospective Study I
JPHC IIJapan Public Health Center-based Prospective Study II
MCCSMelbourne Collaborative Cohort Study
MECMultiethnic Cohort Study
NHSNurses’ Health Study
NHS IINurses’ Health Study II
NIH-AARPNIH-AARP Diet and Health Study
NLCSNetherlands Cohort Study
NYSCNew York State Cohort
PLCOProstate, Lung, Colorectal, and Ovarian Cancer Screening Trial
SCCSSouthern Community Cohort Study
SCHSSingapore Chinese Health Study
SMCSwedish Mammography Cohort
SMHSShanghai Men’s Health Study
SWHSShanghai Women’s Health Study
VITALVITamins And Lifestyle Study: Cohort Study of Dietary Supplements and Cancer Risk
WHIWomen’s Health Initiative
WLHSWomen’s Lifestyle and Health Study

References

  1. Bray, F.; Laversanne, M.; Sung, H.; Ferlay, J.; Siegel, R.L.; Soerjomataram, I.; Jemal, A. Global cancer statistics 2022: GLOBOCAN estimates of incidence and mortality worldwide for 36 cancers in 185 countries. CA Cancer J. Clin. 2024, 74, 229–263. [Google Scholar] [CrossRef] [Scilit] [PubMed]
  2. Lopez-Beltran, A.; Cookson, M.S.; Guercio, B.J.; Cheng, L. Advances in diagnosis and treatment of bladder cancer. BMJ 2024, 384, e076743. [Google Scholar] [CrossRef] [Scilit] [PubMed]
  3. Silverman, D.T.; Koutros, S.; Figueroa, J.D.; Prokunina-Olsson, L.; Rothman, N. Bladder cancer. In Schottenfeld and Fraumeni Cancer Epidemiology and Prevention, 4th ed.; Oxford University Press: New York, NY, USA, 2017; pp. 977–996. [Google Scholar]
  4. Grabe-Heyne, K.; Henne, C.; Mariappan, P.; Geiges, G.; Pöhlmann, J.; Pollock, R.F. Intermediate and high-risk non-muscle-invasive bladder cancer: An overview of epidemiology, burden, and unmet needs. Front. Oncol. 2023, 13, 1170124. [Google Scholar] [CrossRef] [Scilit] [PubMed]
  5. Kurnot, J.A.; Kaye, D.R. Reducing financial toxicity in bladder cancer care. Curr. Opin. Urol. 2024, 34, 484–488. [Google Scholar] [CrossRef] [Scilit] [PubMed]
  6. Koutros, S.; Kiemeney, L.A.; Pal Choudhury, P.; Milne, R.L.; Lopez de Maturana, E.; Ye, Y.; Joseph, V.; Florez-Vargas, O.; Dyrskjøt, L.; Figueroa, J.; et al. Genome-wide Association Study of Bladder Cancer Reveals New Biological and Translational Insights. Eur. Urol. 2023, 84, 127–137. [Google Scholar] [CrossRef] [Scilit] [PubMed]
  7. Prokunina-Olsson, L.; Florez-Vargas, O.; Levin, M.G.; Dutta, D.; Breeze, C.E.; Hurwitz, L.M.; Yan, W.; Lamy, P.; Papenberg, B.W.; Wang, K. Multi-population GWAS meta-analysis identifies bladder cancer susceptibility loci and highlights genetic regulation of smoking-related risk. Nat. Commun. 2026, 17, 9591. [Google Scholar] [CrossRef] [Scilit] [PubMed]
  8. Sung, H.; Ferlay, J.; Siegel, R.L.; Laversanne, M.; Soerjomataram, I.; Jemal, A.; Bray, F. Global Cancer Statistics 2020: GLOBOCAN Estimates of Incidence and Mortality Worldwide for 36 Cancers in 185 Countries. CA Cancer J. Clin. 2021, 71, 209–249. [Google Scholar] [CrossRef] [Scilit] [PubMed]
  9. Letašiová, S.; Medveďová, A.; Šovčíková, A.; Dušinská, M.; Volkovová, K.; Mosoiu, C.; Bartonová, A. Bladder cancer, a review of the environmental risk factors. Environ. Health 2012, 11, S11. [Google Scholar] [CrossRef] [Scilit] [PubMed]
  10. Jubber, I.; Ong, S.; Bukavina, L.; Black, P.C.; Comperat, E.; Kamat, A.M.; Kiemeney, L.; Lawrentschuk, N.; Lerner, S.P.; Meeks, J.J.; et al. Epidemiology of Bladder Cancer in 2023: A Systematic Review of Risk Factors. Eur. Urol. 2023, 84, 176–190. [Google Scholar] [CrossRef] [Scilit] [PubMed]
  11. Piyathilake, C. Dietary factors associated with bladder cancer. Investig. Clin. Urol. 2016, 57, S14–S25. [Google Scholar] [CrossRef] [Scilit] [PubMed]
  12. Bouvard, V.; Loomis, D.; Guyton, K.Z.; Grosse, Y.; El Ghissassi, F.; Benbrahim-Tallaa, L.; Guha, N.; Mattock, H.; Straif, K. Carcinogenicity of consumption of red and processed meat. Lancet Oncol. 2015, 16, 1599–1600. [Google Scholar] [CrossRef] [Scilit] [PubMed]
  13. Beland, F.A.; Marques, M.M. Aromatic amines and aristolochic acids. In Tumour Site Concordance and Mechanisms of Carcinogenesis; Baan, R.A., Stewart, B.W., Straif, K., Eds.; International Agency for Research on Cancer: Lyon, France, 2019; IARC Scientific Publications. [Google Scholar]
  14. Yu, J.; Li, H.; Liu, Z.; Wang, T.; Zhou, F.; Ma, S.; Chen, B.; Chen, W. Meat intake and the risk of bladder cancer: A systematic review and meta-analysis of observational studies. Nutr. Cancer 2023, 75, 825–845. [Google Scholar] [CrossRef] [Scilit] [PubMed]
  15. Clinton, S.K.; Giovannucci, E.L.; Hursting, S.D. The world cancer research fund/American institute for cancer research third expert report on diet, nutrition, physical activity, and cancer: Impact and future directions. J. Nutr. 2020, 150, 663–671. [Google Scholar] [CrossRef] [Scilit] [PubMed]
  16. Smith-Warner, S.A.; Spiegelman, D.; Ritz, J.; Albanes, D.; Beeson, W.L.; Bernstein, L.; Berrino, F.; van den Brandt, P.A.; Buring, J.E.; Cho, E.; et al. Methods for pooling results of epidemiologic studies: The Pooling Project of Prospective Studies of Diet and Cancer. Am. J. Epidemiol. 2006, 163, 1053–1064. [Google Scholar] [CrossRef] [Scilit] [PubMed]
  17. Pietinen, P.; Hartman, A.M.; Haapa, E.; Räsänen, L.; Haapakoski, J.; Palmgren, J.; Albanes, D.; Virtamo, J.; Huttunen, J.K. Reproducibility and validity of dietary assessment instruments: I. A self-administered food use questionnaire with a portion size picture booklet. Am. J. Epidemiol. 1988, 128, 655–666. [Google Scholar] [PubMed]
  18. Block, G. A review of validations of dietary assessment methods. Am. J. Epidemiol. 1982, 115, 492–505. [Google Scholar] [CrossRef] [Scilit] [PubMed]
  19. Kumanyika, S.K.; Mauger, D.; Mitchell, D.C.; Phillips, B.; Smiciklas-Wright, H.; Palmer, J.R. Relative validity of food frequency questionnaire nutrient estimates in the Black Women’s Health Study. Ann. Epidemiol. 2003, 13, 111–118. [Google Scholar] [CrossRef] [Scilit] [PubMed]
  20. Neuhouser, M.L.; Patterson, R.E.; Thornquist, M.D.; Omenn, G.S.; King, I.B.; Goodman, G.E. Fruits and vegetables are associated with lower lung cancer risk only in the placebo arm of the β-carotene and retinol efficacy trial (CARET). Cancer Epidemiol. Biomark. Prev. 2003, 12, 350–358. [Google Scholar]
  21. McAdams, M.A.; maynard, J.W.; Baer, A.N.; Köttgen, A.; Clipp, S.; Coresh, J.; Gelber, A.C. Reliability and sensitivity of the self-report of physician-diagnosed gout in the campaign against cancer and heart disease and the atherosclerosis risk in the community cohorts. J. Rheumatol. 2011, 38, 135–141. [Google Scholar] [CrossRef] [Scilit] [PubMed]
  22. Jain, M.; Howe, G.R.; Rohan, T. Dietary assessment in epidemiology: Comparison of a food frequency and a diet history questionnaire with a 7-day food record. Am. J. Epidemiol. 1996, 143, 953–960. [Google Scholar] [CrossRef] [Scilit] [PubMed]
  23. Messerer, M.; Wolk, A.; Johansson, S.-E. The validity of questionnaire-based micronutrient intake estimates is increased by including dietary supplement use in Swedish men. J. Nutr. 2004, 134, 1800–1805. [Google Scholar] [CrossRef] [Scilit] [PubMed]
  24. Flagg, E.W.; Coates, R.J.; Calle, E.E.; Potischman, N.; Thun, M.J. Validation of the American Cancer Society Cancer Prevention Study II nutrition survey cohort food frequency questionnaire. Epidemiology 2000, 11, 462–468. [Google Scholar] [CrossRef] [Scilit] [PubMed]
  25. Jain, M.G.; Rohan, T.E.; Soskolne, C.L.; Kreiger, N. Calibration of the dietary questionnaire for the Canadian Study of Diet, Lifestyle and Health cohort. Public Health Nutr. 2003, 6, 79–86. [Google Scholar] [CrossRef] [Scilit] [PubMed]
  26. Horn-Ross, P.L.; Lee, V.S.; Collins, C.N.; Stewart, S.L.; Canchola, A.J.; Lee, M.M.; Reynolds, P.; Clarke, C.A.; Bernstein, L.; Stram, D.O. Dietary assessment in the California Teachers Study: Reproducibility and validity. Cancer Causes Control 2008, 19, 595–603. [Google Scholar] [CrossRef] [Scilit] [PubMed]
  27. Riboli, E.; Kaaks, R. The EPIC Project: Rationale and study design. European Prospective Investigation into Cancer and Nutrition. Int. J. Epidemiol. 1997, 26, S6. [Google Scholar] [CrossRef] [Scilit] [PubMed]
  28. Hu, F.B.; Rimm, E.; Smith-Warner, S.A.; Feskanich, D.; Stampfer, M.J.; Ascherio, A.; Sampson, L.; Willett, W.C. Reproducibility and validity of dietary patterns assessed with a food-frequency questionnaire. Am. J. Clin. Nutr. 1999, 69, 243–249. [Google Scholar] [CrossRef] [Scilit] [PubMed]
  29. Munger, R.G.; Folsom, A.R.; Kushi, L.H.; Kaye, S.A.; Sellers, T.A. Dietary assessment of older Iowa women with a food frequency questionnaire: Nutrient intake, reproducibility, and comparison with 24-hour dietary recall interviews. Am. J. Epidemiol. 1992, 136, 192–200. [Google Scholar] [CrossRef] [Scilit] [PubMed]
  30. Tsubono, Y.; Sasaki, S.; Kobayashi, M.; Akabane, M.; Tsugane, S. Food composition and empirical weight methods in predicting nutrient intakes from food frequency questionnaire. Ann. Epidemiol. 2001, 11, 213–218. [Google Scholar] [CrossRef] [Scilit] [PubMed]
  31. Bassett, J.K.; English, D.R.; Fahey, M.T.; Forbes, A.B.; Gurrin, L.C.; Simpson, J.A.; Brinkman, M.T.; Giles, G.G.; Hodge, A.M. Validity and calibration of the FFQ used in the Melbourne Collaborative Cohort Study. Public Health Nutr. 2016, 19, 2357–2368. [Google Scholar] [CrossRef] [Scilit] [PubMed]
  32. Stram, D.O.; Hankin, J.H.; Wilkens, L.R.; Pike, M.C.; Monroe, K.R.; Park, S.; Henderson, B.E.; Nomura, A.M.; Earle, M.E.; Nagamine, F.S. Calibration of the dietary questionnaire for a multiethnic cohort in Hawaii and Los Angeles. Am. J. Epidemiol. 2000, 151, 358–370. [Google Scholar] [CrossRef] [Scilit] [PubMed]
  33. Willett, W.C.; Sampson, L.; Browne, M.L.; Stampfer, M.J.; Rosner, B.; Hennekens, C.H.; Speizer, F.E. The use of a self-administered questionnaire to assess diet four years in the past. Am. J. Epidemiol. 1988, 127, 188–199. [Google Scholar] [CrossRef] [Scilit] [PubMed]
  34. Maruti, S.S.; Feskanich, D.; Colditz, G.A.; Frazier, A.L.; Sampson, L.A.; Michels, K.B.; Hunter, D.J.; Spiegelman, D.; Willett, W.C. Adult recall of adolescent diet: Reproducibility and comparison with maternal reporting. Am. J. Epidemiol. 2005, 161, 89–97. [Google Scholar] [CrossRef] [Scilit] [PubMed]
  35. Thompson, F.E.; Kipnis, V.; Midthune, D.; Freedman, L.S.; Carroll, R.J.; Subar, A.F.; Brown, C.C.; Butcher, M.S.; Mouw, T.; Leitzmann, M.; et al. Performance of a food-frequency questionnaire in the US NIH-AARP (National Institutes of Health-American Association of Retired Persons) Diet and Health Study. Public Health Nutr. 2008, 11, 183–195. [Google Scholar] [CrossRef] [Scilit] [PubMed]
  36. van den Brandt, P.A.; Goldbohm, R.A.; Veer, P.V.T.; Volovics, A.; Hermus, R.J.; Sturmans, F. A large-scale prospective cohort study on diet and cancer in The Netherlands. J. Clin. Epidemiol. 1990, 43, 285–295. [Google Scholar] [CrossRef] [Scilit] [PubMed]
  37. Feskanich, D.; Marshall, J.; Rimm, E.B.; Litin, L.B.; Willett, W.C. Simulated validation of a brief food frequency questionnaire. Ann. Epidemiol. 1994, 4, 181–187. [Google Scholar] [CrossRef] [Scilit] [PubMed]
  38. Subar, A.F.; Thompson, F.E.; Kipnis, V.; Midthune, D.; Hurwitz, P.; McNutt, S.; McIntosh, A.; Rosenfeld, S. Comparative validation of the Block, Willett, and National Cancer Institute food frequency questionnaires: The Eating at America’s Table Study. Am. J. Epidemiol. 2001, 154, 1089–1099. [Google Scholar] [PubMed]
  39. Signorello, L.B.; Buchowski, M.S.; Cai, Q.; Munro, H.M.; Hargreaves, M.K.; Blot, W.J. Biochemical validation of food frequency questionnaire-estimated carotenoid, α-tocopherol, and folate intakes among African Americans and non-Hispanic whites in the southern community cohort study. Am. J. Epidemiol. 2010, 171, 488–497. [Google Scholar] [CrossRef] [Scilit] [PubMed]
  40. Hankin, J.H.; Stram, D.O.; Arakawa, K.; Park, S.; Low, S.H.; Lee, H.P.; Yu, M.C. Singapore Chinese Health Study: Development, validation, and calibration of the quantitative food frequency questionnaire. Nutr. Cancer 2001, 39, 187–195. [Google Scholar] [CrossRef] [Scilit] [PubMed]
  41. BR, K. Reproducibility and validity of major dietary patterns among Swedish women assessed with a food-frequency questionnaire. J. Nutr. 2004, 134, 1541–1545. [Google Scholar] [CrossRef] [Scilit] [PubMed]
  42. Villegas, R.; Yang, G.; Liu, D.; Xiang, Y.-B.; Cai, H.; Zheng, W.; Shu, X.O. Validity and reproducibility of the food-frequency questionnaire used in the Shanghai men’s health study. Br. J. Nutr. 2007, 97, 993–1000. [Google Scholar] [CrossRef] [Scilit] [PubMed]
  43. Xo, S. Validity and reproducibility of the food frequency questionnaire used in the Shanghai Women’s Health Study. Eur. J. Clin. Nutr. 2004, 58, 17–23. [Google Scholar] [CrossRef] [Scilit] [PubMed]
  44. Satia-Abouta, J.; Patterson, R.E.; King, I.B.; Stratton, K.L.; Shattuck, A.L.; Kristal, A.R.; Potter, J.D.; Thornquist, M.D.; White, E. Reliability and validity of self-report of vitamin and mineral supplement use in the vitamins and lifestyle study. Am. J. Epidemiol. 2003, 157, 944–954. [Google Scholar] [CrossRef] [Scilit] [PubMed]
  45. Patterson, R.E.; Kristal, A.R.; Tinker, L.F.; Carter, R.A.; Bolton, M.P.; Agurs-Collins, T. Measurement characteristics of the Women’s Health Initiative food frequency questionnaire. Ann. Epidemiol. 1999, 9, 178–187. [Google Scholar] [CrossRef] [Scilit] [PubMed]
  46. Roswall, N.; Sandin, S.; Adami, H.O.; Weiderpass, E. Cohort Profile: The Swedish Women’s Lifestyle and Health cohort. Int. J. Epidemiol. 2017, 46, e8. [Google Scholar] [CrossRef] [Scilit] [PubMed]
  47. Prentice, R.L. A case-cohort design for epidemiologic cohort studies and disease prevention trials. Biometrika 1986, 73, 1–11. [Google Scholar] [CrossRef]
  48. Cox, D.R. Regression models and life-tables. J. R. Stat. Soc. Ser. B (Methodol.) 1972, 34, 187–202. [Google Scholar] [CrossRef] [Scilit]
  49. DerSimonian, R.; Laird, N. Meta-analysis in clinical trials. Control. Clin. Trials 1986, 7, 177–188. [Google Scholar] [CrossRef] [Scilit] [PubMed]
  50. Higgins, J.P.; Thompson, S.G.; Deeks, J.J.; Altman, D.G. Measuring inconsistency in meta-analyses. BMJ 2003, 327, 557–560. [Google Scholar] [CrossRef] [Scilit] [PubMed]
  51. Cochran, W.G. The combination of estimates from different experiments. Biometrics 1954, 10, 101–129. [Google Scholar] [CrossRef] [Scilit] [PubMed]
  52. Grambsch, P.M.; Therneau, T.M. Proportional hazards tests and diagnostics based on weighted residuals. Biometrika 1994, 81, 515–526. [Google Scholar] [CrossRef]
  53. Joffe, M.M.; Rosenbaum, P.R. Invited commentary: Propensity scores. Am. J. Epidemiol. 1999, 150, 327–333. [Google Scholar] [CrossRef] [Scilit] [PubMed]
  54. Cepeda, M.S.; Boston, R.; Farrar, J.T.; Strom, B.L. Comparison of logistic regression versus propensity score when the number of events is low and there are multiple confounders. Am. J. Epidemiol. 2003, 158, 280–287. [Google Scholar] [CrossRef] [Scilit] [PubMed]
  55. Stram, D.O. Meta-analysis of published data using a linear mixed-effects model. Biometrics 1996, 52, 536–544. [Google Scholar] [CrossRef] [Scilit]
  56. Crippa, A.; Larsson, S.C.; Discacciati, A.; Wolk, A.; Orsini, N. Red and processed meat consumption and risk of bladder cancer: A dose–response meta-analysis of epidemiological studies. Eur. J. Nutr. 2018, 57, 689–701. [Google Scholar] [CrossRef] [Scilit] [PubMed]
  57. Sedgwick, P. Bias in observational study designs: Case-control studies. BMJ 2015, 350, h560. [Google Scholar] [CrossRef] [Scilit] [PubMed]
  58. Hoffmann, D.; Rivenson, A.; Abbi, R.; Wynder, E.L. A study of tobacco carcinogenesis: Effect of the fat content of the diet on the carcinogenic activity of 4-(methylnitrosamino)-1-(3-pyridyl)-1-butanone in F344 rats. Cancer Res. 1993, 53, 2758–2761. [Google Scholar] [PubMed]
  59. Hebert, J.R.; Kabat, G.C. Distribution of smoking and its association with lung cancer: Implications for studies on the association of fat with cancer. JNCI J. Natl. Cancer Inst. 1991, 83, 872–875. [Google Scholar] [CrossRef] [Scilit] [PubMed]
  60. Hoffmann, D.; Adams, J.D.; Piade, J.J.; Hecht, S.S. Chemical studies on tobacco smoke LXVIII. Analysis of volatile and tobacco-specific nitrosamines in tobacco products. IARC Sci. Publ. 1980, 31, 507–516. [Google Scholar]
  61. Taylor, E.; Simonavičius, E.; McNeill, A.; Brose, L.S.; East, K.; Marczylo, T.; Robson, D. Exposure to tobacco-specific nitrosamines among people who vape, smoke, or do neither: A systematic review and meta-analysis. Nicotine Tob. Res. 2024, 26, 257–269. [Google Scholar] [CrossRef] [Scilit] [PubMed]
  62. Goniewicz, M.L.; Havel, C.M.; Peng, M.W.; Jacob, P., 3rd; Dempsey, D.; Yu, L.; Zielinska-Danch, W.; Koszowski, B.; Czogala, J.; Sobczak, A.; et al. Elimination kinetics of the tobacco-specific biomarker and lung carcinogen 4-(methylnitrosamino)-1-(3-pyridyl)-1-butanol. Cancer Epidemiol. Biomark. Prev. 2009, 18, 3421–3425. [Google Scholar] [CrossRef] [Scilit] [PubMed]
  63. Lian, J.; Yue, Y.; Yu, W.; Zhang, Y. Immunosenescence: A key player in cancer development. J. Hematol. Oncol. 2020, 13, 151. [Google Scholar] [CrossRef] [Scilit] [PubMed]
  64. Harding, C.; Pompei, F.; Wilson, R. Peak and decline in cancer incidence, mortality, and prevalence at old ages. Cancer 2012, 118, 1371–1386. [Google Scholar] [CrossRef] [Scilit] [PubMed]
  65. Bellamri, M.; Yao, L.; Bonala, R.; Johnson, F.; Von Weymarn, L.B.; Turesky, R.J. Bioactivation of the tobacco carcinogens 4-aminobiphenyl (4-ABP) and 2-amino-9H-pyrido[2,3-b]indole (AαC) in human bladder RT4 cells. Arch. Toxicol. 2019, 93, 1893–1902. [Google Scholar] [CrossRef] [Scilit] [PubMed]
  66. Baer-Dubowska, W.; Bartoszek, A.; Malejka-Giganti, D. Carcinogenic and Anticarcinogenic Food Components; CRC Press: Boca Raton, FL, USA, 2005. [Google Scholar]
  67. Bingham, S.; Pignatelli, B.; Pollock, J.; Ellul, A.; Malaveille, C.; Gross, G.; Runswick, S.; Cummings, J.; O’Neill, I. Does increased endogenous formation of N-nitroso compounds in the human colon explain the association between red meat and colon cancer? Carcinogenesis 1996, 17, 515–523. [Google Scholar] [CrossRef] [Scilit] [PubMed]
  68. Bastide, N.M.; Chenni, F.; Audebert, M.; Santarelli, R.L.; Tache, S.; Naud, N.; Baradat, M.; Jouanin, I.; Surya, R.; Hobbs, D.A.; et al. A central role for heme iron in colon carcinogenesis associated with red meat intake. Cancer Res. 2015, 75, 870–879. [Google Scholar] [CrossRef] [Scilit] [PubMed]
  69. He, Z.; Kosinska, W.; Zhao, Z.L.; Wu, X.R.; Guttenplan, J.B. Tissue-specific mutagenesis by N-butyl-N-(4-hydroxybutyl)nitrosamine as the basis for urothelial carcinogenesis. Mutat. Res. 2012, 742, 92–95. [Google Scholar] [CrossRef] [Scilit] [PubMed]
  70. Grosse, Y.; Baan, R.; Straif, K.; Secretan, B.; El Ghissassi, F.; Cogliano, V. Carcinogenicity of nitrate, nitrite, and cyanobacterial peptide toxins. Lancet Oncol. 2006, 7, 628–629. [Google Scholar] [CrossRef] [Scilit] [PubMed]
  71. Mirvish, S.S. Role of N-nitroso compounds (NOC) and N-nitrosation in etiology of gastric, esophageal, nasopharyngeal and bladder cancer and contribution to cancer of known exposures to NOC. Cancer Lett. 1995, 93, 17–48. [Google Scholar] [CrossRef] [Scilit] [PubMed]
  72. Flood, A.; Rastogi, T.; Wirfält, E.; Mitrou, P.N.; Reedy, J.; Subar, A.F.; Kipnis, V.; Mouw, T.; Hollenbeck, A.R.; Leitzmann, M. Dietary patterns as identified by factor analysis and colorectal cancer among middle-aged Americans. Am. J. Clin. Nutr. 2008, 88, 176–184. [Google Scholar] [CrossRef] [Scilit] [PubMed]
  73. Freedman, L.S.; Schatzkin, A.; Midthune, D.; Kipnis, V. Dealing with dietary measurement error in nutritional cohort studies. J. Natl. Cancer Inst. 2011, 103, 1086–1092. [Google Scholar] [CrossRef] [Scilit] [PubMed]
  74. Di Maso, M.; Turati, F.; Bosetti, C.; Montella, M.; Libra, M.; Negri, E.; Ferraroni, M.; La Vecchia, C.; Serraino, D.; Polesel, J. Food consumption, meat cooking methods and diet diversity and the risk of bladder cancer. Cancer Epidemiol. 2019, 63, 101595. [Google Scholar] [CrossRef] [Scilit] [PubMed]
Figure 1. Associations between processed meat (A) and unprocessed red meat (B) consumption and risk of bladder cancer in females, males and all participants. HR, hazard ratio; CI, confidence interval. * All models were stratified jointly on baseline age (in years), year of baseline questionnaire completion, and centre (EPIC only) and adjusted for race and ethnicity, smoking status and duration, educational level, alcohol consumption, physical activity, total fruit (including fruit juice) intake, total vegetable (including vegetable juice) intake, and total energy intake; analyses for processed meat were additionally adjusted for unprocessed red meat and vice versa; these variables were entered directly into the multivariable model or, for studies with less than 200 cases, modelled using propensity scores. a Between-study heterogeneity was tested using the Q-statistic. b Linear trend was tested using a continuous variable based on the median of each category. c Heterogeneity by sex was examined using meta-regression.
Cancers 18 03203 g001
Figure 2. Association between processed meat (A) and unprocessed red meat (B) consumption and risk of bladder cancer by smoking status. HR, hazard ratio; CI, confidence interval. * All models were stratified jointly on baseline age (in years), year of baseline questionnaire completion, and centre (EPIC only) and adjusted for race and ethnicity, smoking duration for former and current smokers, educational level, alcohol consumption, and physical activity; analyses for processed meat were additionally adjusted for unprocessed red meat and vice versa, total fruit (including fruit juice) intake, total vegetable (including vegetable juice) intake, and total energy intake; these variables were entered directly into the multivariable model or, for studies with less than 200 cases, modelled using propensity scores. a For processed meat, BWHS, CARET, CLUE II, JPHC I, NYSC (females only), SCCS, and WLHS were excluded from the never-smoker analysis; JPHC I was excluded from the former smokers analysis for males; and BWHS, CARET, NHS II, NYSC, SCCS and WLHS were excluded from the former smokers analysis for females, in each case because there were fewer than 25 cases; SMC was excluded from female analysis due to 0 cases in the reference category. For current smokers, CLUE II and CSDLH were excluded from the male analysis, and BCDDP, BWHS, MCCS, NHS II, NYSC, PLCO, and VITAL were excluded from the female analysis, all due to small case numbers (<25). b Between-study heterogeneity was tested using the Q-statistic. c Heterogeneity by smoking status was tested using meta-regression. d For red meat, BWHS, CARET, CLUE II, JPHC I, NYSC (females only), SCCS, and WLHS were excluded from the never-smoker analysis; JPHC I was excluded from the former smokers analysis for males; and BWHS, CARET, NHS II, NYSC, SCCS, SWHS, and WLHS were excluded from the former smokers analysis for females, in each case because there were fewer than 25 cases. For current smokers, CLUE II and CSDLH were excluded from the male analysis, and BCDDP, BWHS, MCCS, NHS II, NYSC, PLCO, SWHS, and VITAL were excluded from the female analysis, all due to small case numbers (<25). p-values for heterogeneity by sex for processed meat intake among never smokers, former smokers and current smokers were 0.39, 0.82 and 0.40, respectively, for the continuous term and 0.07, 0.71 and 0.57, respectively, for the comparison of the highest versus lowest consumption category. p-values for heterogeneity by sex for unprocessed red meat intake among never smokers, former smokers and current smokers were 0.27, 0.66 and 0.77, respectively, for the continuous term and 0.13, 0.82 and 0.97, respectively, for the comparison of the highest versus lowest consumption category.
Cancers 18 03203 g002aCancers 18 03203 g002b
Table 1. Characteristics of the cohort studies in the pooled analysis of unprocessed red meat and bladder cancer risk. (A) Cohort characteristics, meat intake, and smoking status. (B) Participants excluded and missing covariate data.
(A)
Study †Country/ContinentSexBaseline Cohort
Size ‡
Total CasesAge at Baseline
(Years) §
Year of Baseline
Questionnaire
Follow-Up Time
(Years) §
Meat Intake, Median (IQR), g/DaySmoking Status (%)
Unprocessed
Red Meat
Processed
Meat
NeverPastCurrent
BCDDPUSAfemale41,7548760 (51–72)1987–19899 (9–10)24 (12–41)6 (2–15)573112
BWHSUSAfemale50,7436637 (25–53)199525 (16–25)18 (8–36)8 (2–18)652015
CARETUSAmale10,47433357 (50–66)1985–199413 (5–16)50 (31–79)16 (8–31)14356
CARETUSAfemale60006457 (51–66)1985–199413 (6–16)29 (17–47)7 (2–13)03268
CLUE IIUSAmale62299548 (29–69)198929 (8–29)44 (27–70)22 (11–39)434017
CNBSSCanadafemale48,78819048 (41–57)1980–198522 (17–24)91 (64–124)14 (7–23)512920
COSMSwedenmale43,96376559 (48–74)199819 (5–19)57 (38–80)33 (20–47)363925
CPS IIUSAmale65,465148964 (56–72)1992–199314 (4–25)44 (26–70)13 (5–27)33589
CPS IIUSAfemale73,72639962 (54–71)1992–199318 (5–25)26 (14–43)6 (1–13)55369
CSDLHCanadamale34,29110470 (56–83)1991–199911 (3–16)37 (23–54)19 (9–36)40564
CTSUSAfemale92,24335050 (34–71)1995–199924 (6–24)16 (6–29)5 (1–13)68275
EPICEuropemale129,580132452 (40–63)1991–200016 (8–18)47 (22–80)36 (19–60)343729
EPICEuropefemale278,50752151 (37–63)1991–200015 (8–18)34 (13–59)21 (10–38)582318
HPFSUSAmale45,86683554 (42–68)1986–198726 (7–31)56 (30–98)7 (2–13)464410
IWHSUSAfemale34,10823561 (56–68)198622 (6–28)80 (44–109)5 (1–9)661915
JPHC IJapanmale18,1869955 (46–63)199518 (7–18)37 (21–65)4 (2–11)361747
JPHC IIJapanmale21,54911958 (47–70)1998–199915 (5–15)33 (18–58)3 (1–7)351946
MCCSAustraliamale14,45641255 (42–66)1990–199421 (8–23)70 (46–104)21 (10–36)434215
MCCSAustraliafemale21,91812554 (42–66)1990–199421 (11–23)49 (30–72)13 (6–23)69229
MECUSAmale80,372147660 (47–72)1993–199821 (5–27)39 (21–65)15 (7–27)305218
MECUSAfemale89,84749059 (47–72)1993–199824 (7–27)26 (14–45)9 (4–18)562914
NHSUSAfemale68,24938153 (43–63)1986–198728 (10–29)48 (33–85)7 (3–10)443521
NHS IIUSAfemale92,9335736 (30–42)1991–199322 (21–22)55 (35–85)6 (2–8)662212
NIH-AARPUSAmale283,685533262 (54–68)1995–199716 (3–16)39 (20–68)17 (8–33)305911
NIH-AARPUSAfemale192,34798662 (53–68)1995–199716 (4–16)23 (11–43)8 (4–17)464015
NLCSNetherlandsmale58,279152662 (56–67)198614 (4–17)60 (45–78)18 (9–30)115039
NLCSNetherlandsfemale62,57327061 (56–68)198617 (8–17)52 (36–69)12 (6–21)572122
NYSCUSAmale28,75119960 (47–74)19808 (4–8)60 (52–60)15 (7–27)295021
NYSCUSAfemale21,6685765 (47–80)19808 (5–8)54 (12–60)10 (4–18)502723
PLCOUSAmale49,42456865 (59–74)1997–20049 (4–11)51 (29–87)15 (8–28)385210
PLCOUSAfemale52,22012565 (58–73)1997–20049 (6–11)32 (17–55)7 (4–14)58348
SCCSUSAmale29,05413450 (42–63)2002–200911 (4–15)78 (40–147)33 (14–62)242452
SCCSUSAfemale41,9916051 (42–65)2002–200912 (7–15)48 (23–94)14 (5–34)462133
SCHSSingaporemale27,17613256 (46–68)1993–199914 (6–17)26 (16–42)1 (0–4)422137
SMCSwedenfemale33,76813860 (51–75)199719 (7–19)29 (14–44)21 (12–33)542323
SMHSChinamale61,13620953 (43–70)2001–200612 (9–14)49 (31–73)2 (0–6)301159
SWHS aChinafemale72,8489850 (42–66)1996–200018 (13–19)42 (25–63)—9712
VITALUSAmale29,86733260 (52–72)2000–200210 (5–11)59 (28–100)15 (6–30)40519
VITALUSAfemale30,0658559 (52–72)2000–200210 (7–11)35 (16–64)5 (2–13)57367
WHIUSAfemale84,48345463 (53–73)1992–199522 (7–25)26 (12–50)6 (2–14)51427
WLHSSwedenfemale47,3895940 (32–48)1991–199221 (20–21)46 (30–63)4 (2–7)413722
Total 2,575,97120,780
(B)
Study †SexParticipants Excluded, n ‖Missing Covariate Data (%) #
Race/EthnicityEducationPhysical ActivityAlcohol Intake
BCDDPfemale39000.812.20
BWHSfemale5600.20.30
CARETmale0<0.111.01000
CARETfemale0<0.17.31000
CLUE IImale0<0.101000
CNBSSfemale001.315.40
COSMmale125700.76.80
CPS IImale4310.30.61.00
CPS IIfemale8780.20.60.90
CSDLHmale6<0.1<0.1<0.10
CTSfemale545000.40
EPICmale137702.41.80
EPICfemale512304.31.10
HPFSmale19021.700.40
IWHSfemale4701.00.21.40
JPHC Imale228019.100
JPHC IImale2118010000
MCCSmale10000
MCCSfemale00000
MECmale9897.10.42.80
MECfemale180000.64.50
NHSfemale1936.400.50
NHS IIfemale1551.500.40
NIH-AARPmale11,6171.02.50.70
NIH-AARPfemale71251.43.11.10
NLCSmale00<0.1<0.10
NLCSfemale00<0.1<0.10
NYSCmale15850.33.41000
NYSCfemale8670.76.81000
PLCOmale10<0.10.252.00
PLCOfemale3<0.10.255.00
SCCSmale2440.50.51.30
SCCSfemale2050.30.31.20
SCHSmale00000
SMCfemale121400.24.90
SMHS amale000.200
SWHSfemale00<0.100
VITALmale3030.40.21.30
VITALfemale910.40.51.20
WHIfemale10650.20.81.20
WLHSfemale149016.64.40
Total 42,397
† Study abbreviations: BCDDP: Breast Cancer Detection Demonstration Project Follow-Up Study; BWHS: Black Women’s Health Study; CARET: Beta-Carotene and Retinol Efficacy Trial; CLUE II: Campaign against Cancer and Heart Disease; CNBSS: Canadian National Breast Screening Study; COSM: Cohort of Swedish Men; CPS II: Cancer Prevention Study II Nutrition Cohort; CSDLH: Canadian Study of Diet, Lifestyle and Health; CTS: California Teachers Study; EPIC: European Prospective Investigation into Cancer and Nutrition; HPFS: Health Professionals Follow-up Study; IWHS: Iowa Women’s Health Study; JPHC I: Japan Public Health Center-based Prospective Study I; JPHC II: Japan Public Health Center-based Prospective Study II; MCCS: Melbourne Collaborative Cohort Study; MEC: Multiethnic Cohort Study; NHS: Nurses’ Health Study; NHS II: Nurses’ Health Study II; NIH-AARP: NIH-AARP Diet and Health Study; NLCS: Netherlands Cohort Study; NYSC: New York State Cohort; PLCO: Prostate, Lung, Colorectal, and Ovarian Cancer Screening Trial; SCCS: Southern Community Cohort Study; SCHS: Singapore Chinese Health Study; SMC: Swedish Mammography Cohort; SMHS: Shanghai Men’s Health Study; SWHS: Shanghai Women’s Health Study; VITAL: VITamins And Lifestyle Study: Cohort Study of Dietary Supplements and Cancer Risk; WHI: Women’s Health Initiative; WLHS: Women’s Lifestyle and Health Study. ‡ Total participants included in unprocessed red meat analyses after applying exclusion criteria, with the exception of NLCS and CSDLH, which were analysed as case–cohort studies; for NLCS, a subcohort of 3653 males and 2479 females was randomly selected from 58,279 and 62,573 participants respectively; for CSDLH, a subcohort of 2560 males was randomly selected from 34,291. Females in CLUE II, CSDLH, JPHC I, JPHC II and SCHS were not included because the number of bladder cancer cases was lower than 50; EPIC included participants from 8 European countries: Denmark, France, Germany, Italy, the Netherlands, Spain, Sweden, and United Kingdom; for the Swedish Mammography Cohort, 1997 was considered the baseline because the questionnaire from that year included information on smoking habits, an important risk factor for bladder cancer, and only cases diagnosed from 1997 onward were included in the analysis. § Age at baseline and follow-up time are presented as median (10th–90th percentiles). Unprocessed red meat and processed meat intakes are presented as median (interquartile range), g/day. ‖ Number of participants excluded from the unprocessed red meat analysis. a SWHS was excluded from the processed meat analysis because of very low processed meat intake. The processed meat analysis included 2,502,700 participants (1,465,201 females and 1,037,499 males) and 20,672 bladder cancer cases (5199 females and 15,473 males). # Missing covariate data are presented as percentages of the baseline cohort size. Values greater than 0% but less than 0.1% are shown as <0.1.
Disclaimer/Publisher’s Note: The statements, opinions and data contained in all publications are solely those of the individual author(s) and contributor(s) and not of MDPI and/or the editor(s). MDPI and/or the editor(s) disclaim responsibility for any injury to people or property resulting from any ideas, methods, instructions or products referred to in the content.