Review

Effect of Glycemic Index of Breakfast on Energy Intake at Subsequent Meal among Healthy People: A Meta-Analysis

1
Department of Health and Physical Education, Hong Kong Institute of Education, 10 Lo Ping Road, Tai Po, Hong Kong, China
2
School of Humanities and Social Science, Chinese University of Hong Kong, Shenzhen 2001, China
3
Department of Sports Science and Physical Education, Chinese University of Hong Kong, Shatin, Hong Kong, China
4
Key Laboratory of Exercise and Health Science of the Ministry of Education, Shanghai University of Sport, Shanghai 200438, China
*
Author to whom correspondence should be addressed.
These authors contributed equally to this work.
Nutrients 2016, 8(1), 37; https://doi.org/10.3390/nu8010037
Submission received: 14 November 2015 / Revised: 9 December 2015 / Accepted: 18 December 2015 / Published: 4 January 2016
(This article belongs to the Special Issue Food and Appetite)

Abstract

:
Meals with low glycemic index (GI) may suppress short-term appetite and reduce subsequent food intake compared with high-GI meals. However, no meta-analysis has been conducted to synthesize the evidence. This meta-analytic study was conducted to assess the effect of high- and low-GI breakfast on subsequent short-term food intake. Trials were identified through MEDLINE, EMBASE, Web of Science, and Cochrane Central Register of Controlled trials, and manual searches of bibliographies until May 2015. Randomized controlled and cross-over trials comparing the effect of low- with high-GI breakfast on subsequent energy intake among healthy people were included. Nine studies consisting of 11 trials met the inclusion criteria. Only one trial was classified with high methodological quality. A total of 183 participants were involved in the trials. The meta-analytic results revealed no difference in breakfast GI (high-GI vs. low-GI) on subsequent short-term energy intake. In conclusion, it seems that breakfast GI has no effect on short-term energy intake among healthy people. However, high quality studies are still warranted to provide more concrete evidence.

1. Introduction

The glycemic index (GI), first introduced in 1981 [1], is a physiological assessment of the quality of carbohydrate (CHO)-rich foods in terms of their post-prandial glycemia in vivo in human. The GI is defined as the incremental area under the blood glucose response curve (iAUC) after a portion of food containing 50 g of available carbohydrate (aCHO), expressed as a percentage of that after the same amount of CHO from a reference food, usually glucose or white bread, taken by the same subject. The GI value of high-GI foods is over 70, and that of low-GI foods is less than 55 [2]. Generally, low-GI foods are regarded as being digested and absorbed slowly, while high-GI foods are believed to be rapidly digested and absorbed, resulting in different glycemic responses [3]. Compared with low-GI foods, high-GI foods may elicit hyperglycemia and hyperinsulinemia during early postprandial period and subsequent dynamic fall to even hypoglycemic levels. Recent evidence suggests that the general curve shape may be similar between low- and high-GI foods, although the highest glucose peaks and iAUC values are different between them [4]. This physiological response may induce many hormonal and metabolic changes that may affect health and disease parameters. The benefits of low-GI foods are advocated for diabetes mellitus [5], cancer [6], sport performance [7], cardiovascular disease [8], appetite control [9,10], and weight reduction [11].
The traditional glucostatic theory [12] has hypothesized that there is causal relationship between glycemia and short-term appetite regulation, and one’s appetite is stimulated when glycemia drops below a “static” level. This theory has been supported by recent studies [13,14,15], showing that transient and dynamic fall of glycemia can signal sense of appetite and meal initiation. These findings imply that short-term appetite control may be affected by the source of energy such as the GI of foods [9,10]. Two opposite opinions regarding the effect of GI on short-term appetite have been proposed previously [16,17]. This debate seems to be partially addressed by a systematic review study [9], in which the authors concluded that low-GI foods may suppress short-term appetite, compared with high-GI foods. However, a meta-analysis was not conducted in this study. Additionally, this systematic review was published in 2007. Therefore, an updated systematic review and meta-analysis is warranted to further clarify the effect of GI on short-term appetite control. The present meta-analytic study aims to quantify the effect of GI of breakfast (i.e., low-GI vs. high-GI) on short-term appetite regulation as measured by energy intake among healthy people.
In the present study, high-GI and low-GI are classified according to the reported GI value [2]. However, given that most studies did not report the GI value, we also classified breakfast as high-GI and low-GI if significant difference was found in the iAUC value between the treatments. Considering the effect of aCHO amount on the overall glycemic responses, the glycemic load (GL) was introduced previously [18,19]. To control the influence of GL, only the trials with similar aCHO amount were included in the present meta-analysis. Additionally, as energy and macronutrient intakes are the main confounding factors in affecting GI of foods [9], only trials with similar energy and macronutrients were included in our research. To avoid the influence of so-called “second-meal effect” [20], only trials after an overnight fast were included.

2. Methods

A published review protocol for the current meta-analysis was not available. The Preferred Reporting Items for Systematic Reviews and Meta-Analysis guideline (PRISMA [21]) was followed when carrying out the current research.

2.1. Eligibility Criteria

The articles included in this review meet the following inclusion criteria: (i) the study subject must be related to compare the effect of breakfast GI (i.e., low-GI vs. high-GI) on energy intake at subsequent meal, and breakfast was defined as food or meal consumed after an overnight fast; (ii) the compared breakfast had similar energy and macronutrients content; (iii) used healthy humans as participants; (iv) applied randomized controlled or cross-over trials with short duration (i.e., ≤1 day [17,22]); (v) reported GI values and/or significant difference in iAUC value between treatments; (vi) used food or meal in breakfast as the only treatment; (vii) outcome measures must be related to appetite and evaluated through objective approaches (i.e., the food or energy intake in subsequent meals); and (viii) provided adequate information for effect size calculation. The studies were excluded if: (i) the study was not related to the effect of breakfast GI on energy intake at subsequent meal; (ii) animal models or unhealthy participants (e.g., obese and diabetic participants) were used; (iii) the study design were not randomized controlled or cross-over trials; (iv) the duration of the trial was long (i.e., >1 day); (v) used other treatments rather than only food or meal, e.g., exercise; (vi) employed subjective measures to evaluate appetite; (vii) lack of information for calculating the effect size, even when efforts had been made to obtain the relevant data from the correspondences; (viii) they were abstracts; and (ix) they were published in non-English journals.

2.2. Search

We searched studies from four major electronic databases from inception until 27 May 2015: MEDLINE (1946–), EMBASE (1947–), Web of Science (1900–), and Cochrane Central Register of Controlled Trials (1898–). The following two groups of keywords were combined for the search: (i) “glycemic index” OR “glycemic indices” OR “glycemic index number *” OR “glycaemic index” OR “glycaemic indices” OR “glycaemic index number *”; AND (ii) “appetite *” OR “appetite regulation” OR “hunger” OR “satiety” OR “satiation”. In addition to the database search, the reference lists of the identified articles and relevant review articles [9,17] were also manually searched. Finally, a number of experts from the field of GI were contacted to find additional studies.

2.3. Study Selection

Two authors (F.S. and C.L.) conducted the literature search and removed the duplicates. Two reviewers (F.S. and Y.Z.) independently screened the eligible articles from the initial search by reading through the titles and abstracts. Full texts were further sought if the titles or abstracts did not provide enough information to decide whether the study should be included or excluded. Advice was sought from the third reviewer (C.L.) to reach a consensus when disparity on the inclusion or exclusion of an article occurred between the two reviewers.

2.4. Data Collection Process and Items

Two authors (F.S. and C.L.) independently extracted the following data from the included studies: (i) author and year of publication; (ii) characteristics of the participants: sample size, sex, and age; (iii) study design; (iv) treatment or test food/meal; and (v) effect size (ES: i.e., standardized mean difference) or raw data for ES calculation. No disparities of data abstraction between the two authors were observed.

2.5. Risk of Bias in Individual Studies

Two authors (F.S. and Y.Z.) independently assessed the risk of bias of the included studies using the Jadad scale [23]. The scale has been widely used in assessing methodological quality in the nutritional field [24,25]. The scale has three components: randomization (2 points), blinding (2 points) and reported withdrawals (1 point). The Jadad score ranges from 0 to 5. A study with a score higher than 3 is considered to have high quality. Disagreements were solved after discussion between the two authors.

2.6. Synthesis of Results

Meta-analysis was conducted through Comprehensive Meta-Analysis Software. The Q-test was used to examine whether the pooled ES vary between studies. A statistical significant Q-value indicates differences of study heterogeneity. The I2 statistic was calculated to measure the effect of heterogeneity. The values for I2 at 25%, 50%, and 75% indicates low, moderate, and high heterogeneity, respectively [26]. If substantial heterogeneity was not found (i.e., a non-significant Q-test result and/or an I2 statistic smaller than 50%), a meta-analysis with a fixed-effects model was conducted to pool ESs with 95% confidence interval (CI); otherwise, a random-effects model was employed [27]. Finally, the Egger regression asymmetry test and Begg’s funnel plot were applied to assess publication bias.

3. Results

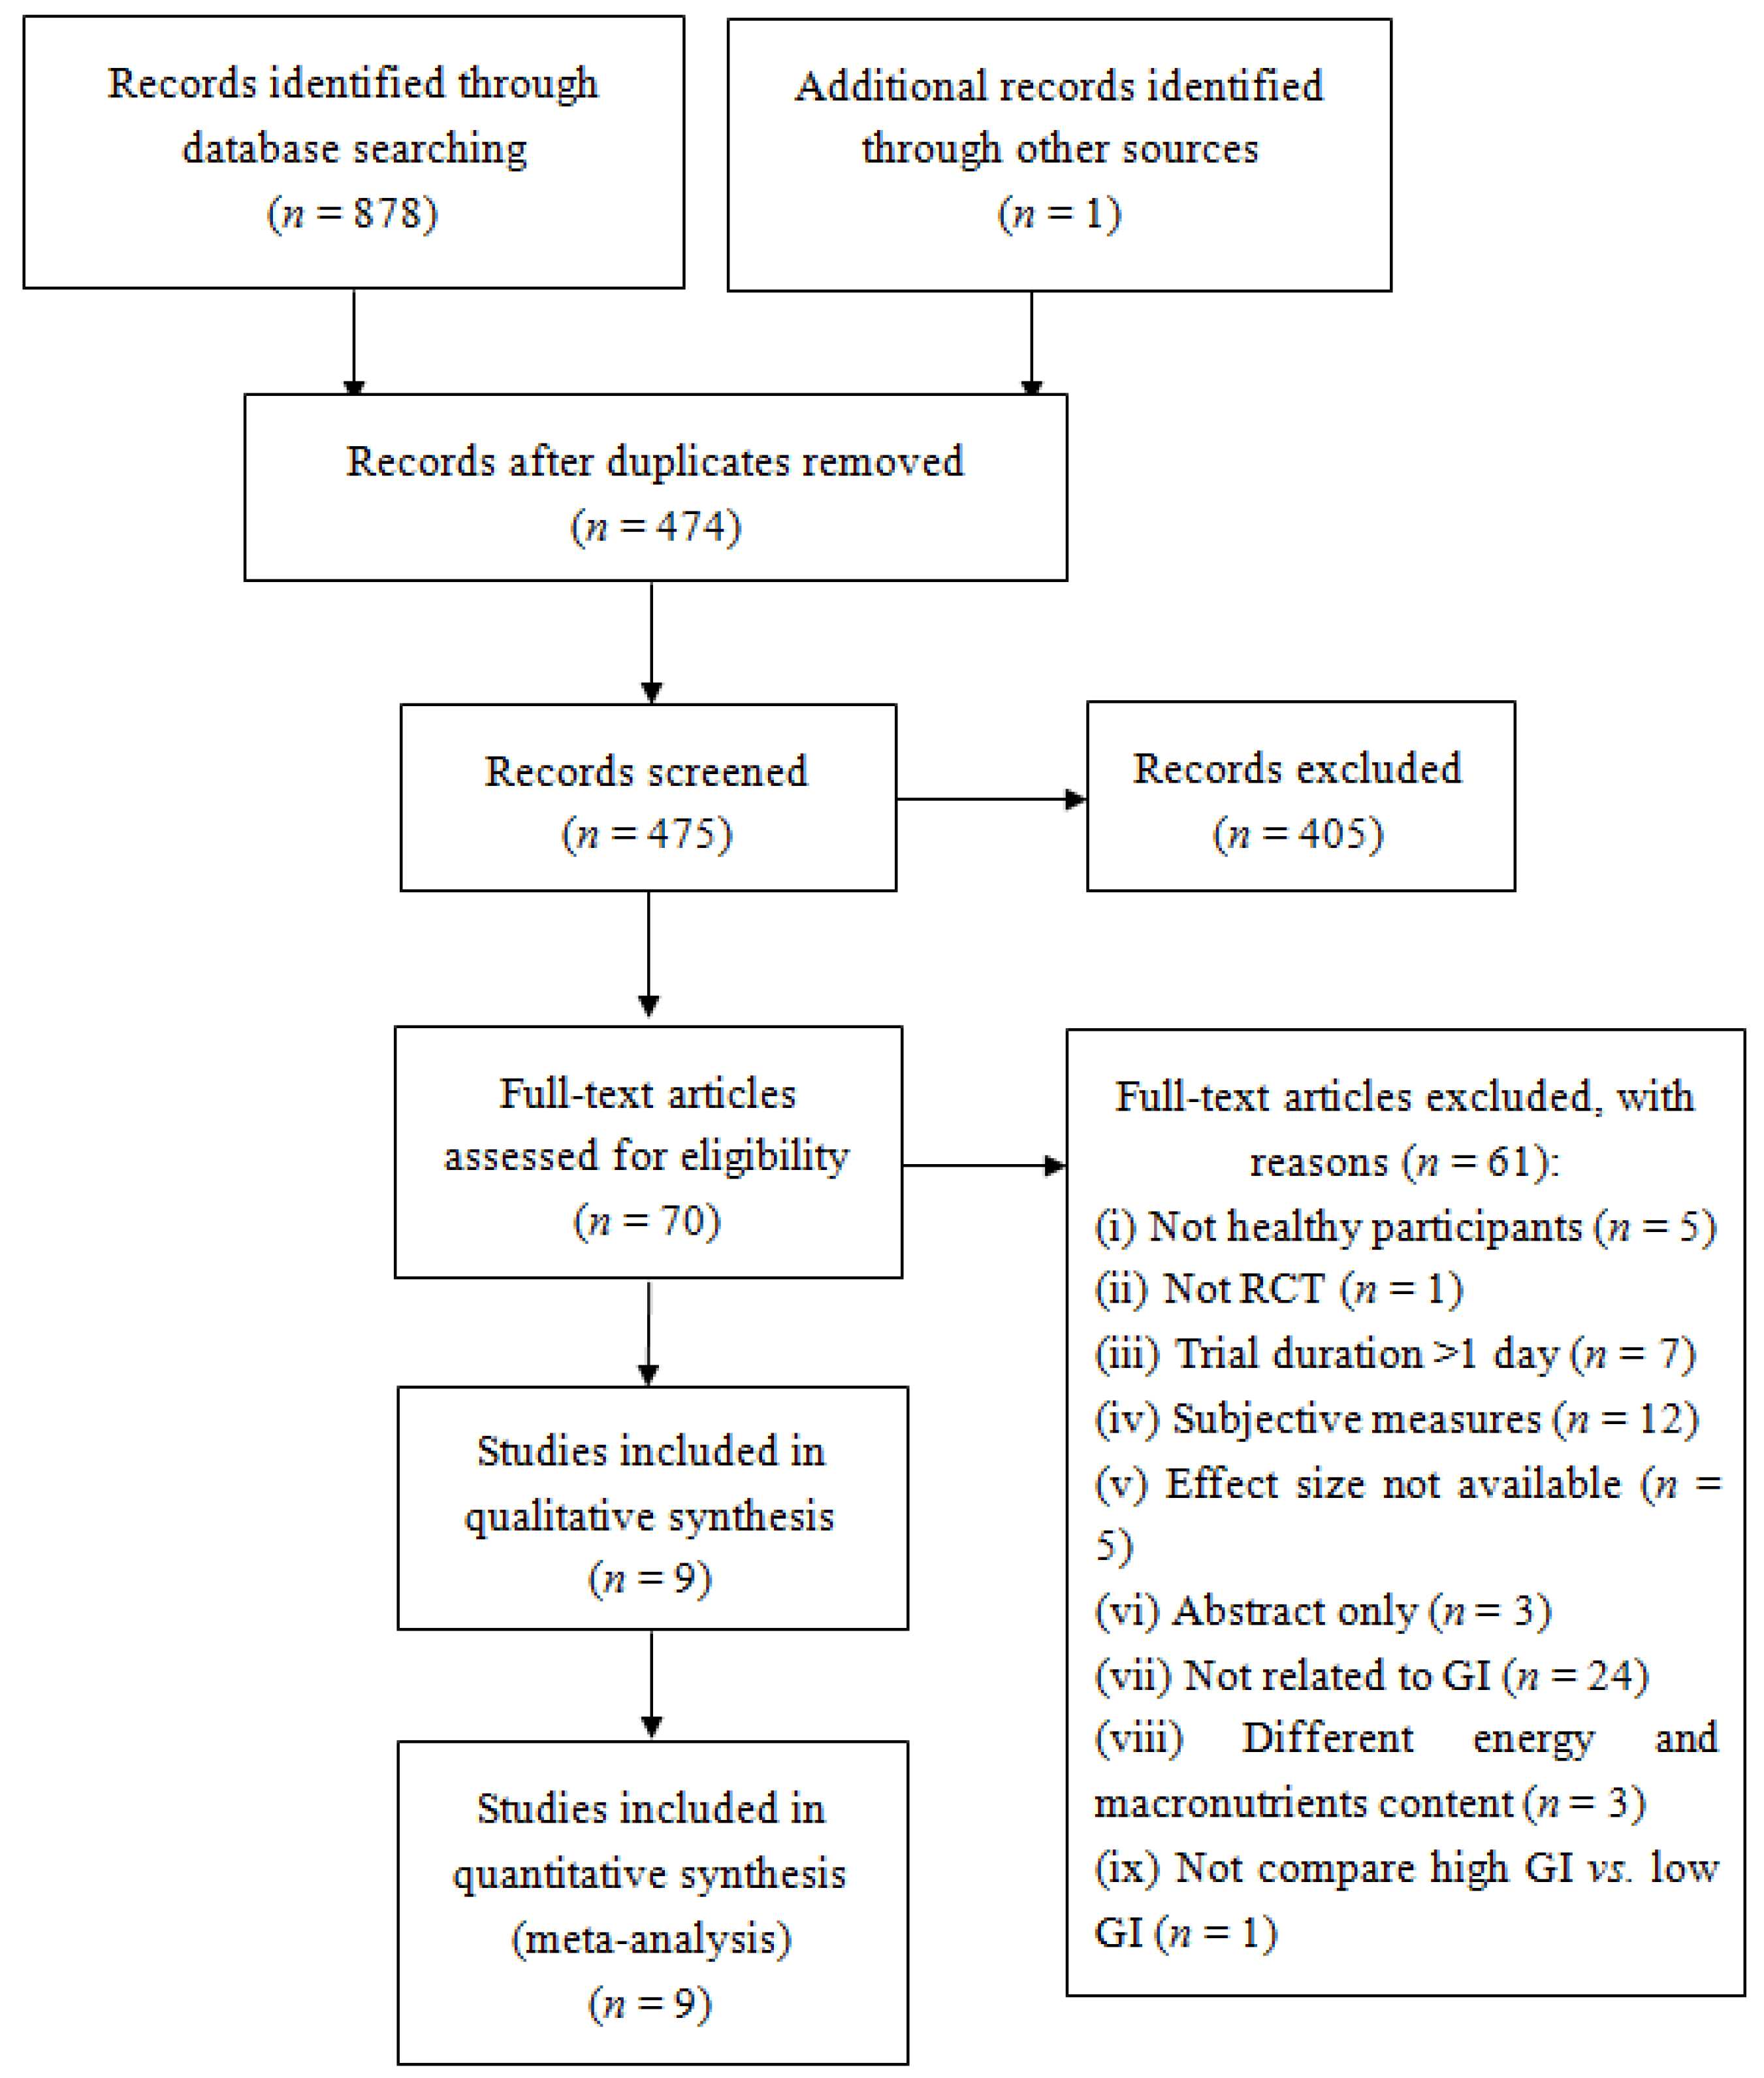
3.1. Study Selection

The flow of the study selection is shown in Figure 1. A total of 879 papers were searched. After removing duplications (n = 474), 405 articles were excluded after reading the titles and abstracts. The remaining articles (n = 70) were further assessed for eligibility based on the full texts. Finally, nine studies consisting of 11 trials (two studies had two eligible trials) were included in this review [28,29,30,31,32,33,34,35,36,37].
Figure 1. Flow diagram of study selection process.
Nutrients 08 00037 g001

3.2. Study Characteristics

The main characteristics of included studies are summarized in Table 1. The included studies were published between 1991 and 2012 (two studies were published before 2000). A total of 183 participants were involved in the 11 trials. The sample size for these trials ranged from six to 28. Most participants were male adults (Male = 128, Female = 55). The test meal (breakfast) varied a lot among the trials. As described, GI and/or iAUC/AUC values were used to classify low- and high-GI breakfast. Most trials (n = 10) reported iAUC/AUC values. The interval between breakfast and subsequent energy intake ranged from 30 to 180 min. In terms of subsequent energy intake (ad libitum meals), different types of food were provided, with pizza being the most popular among the trials (n = 5).

3.3. Risk of Bias within Studies

All the included trials had relatively high risk of bias. In particular, none of the included trials used double blinding. Although all the included trials used a randomization design, most (n = 10) failed to report randomization approaches. Moreover, only four trials explained the number of withdrawals or reasons for dropout (Table 2).
Table 1. Characteristics of eligible studies included in this meta-analysis.
First Author and YearParticipantsDesignCriteria for GI Level (Duration)Test MealSubsequent Food IntakeKey Findings
Low-GIHigh-GI
Anderson (2002) [28], Trial 2n = 18
Age: 20–30
Gender: 18 M
RCTAUC (60 min)Amylose (75 g aCHO, 0 g protein, 0 g fat, 0 g fiber, 300 kcal) beverageAmylopectin (75 g aCHO, 0 g protein, 0 g fat, 0 g fiber, 300 kcal); Sucrose (75 g aCHO, 0 g protein, 0 g fat, 0 g fiber, 300 kcal); Polycose (75 g aCHO, 0 g protein, 0 g fat, 0 g fiber, 300 kcal) beveragePizza meal according to one’s preference served at 60 minPolycose resulted in significantly less food intake than did amylopectin
Anderson (2002) [28], Trial 3n = 18
Age: 18–35
Gender: 18 M
RCTAUC (60 min)Fructose-glucose (75 g aCHO, 0 g protein, 0 g fat, 0 g fiber, 300 kcal) beverageSucrose (75 g aCHO, 0 g protein, 0 g fat, 0 g fiber, 300 kcal); Polycose (75 g aCHO, 0 g protein, 0 g fat, 0 g fiber, 300 kcal); Glucose (75 g aCHO, 0 g protein, 0 g fat, 0 g fiber, 300 kcal) beveragePizza meal according to one’s preference served at 60 minNo difference
Anderson (2010) [29], Trial 1n = 17
Age: 20–30
Gender: 17 M
RCTAUC (30 min)Regular cornstarch with tomato soup (a high-amylopectin granular starch, 46.5 g aCHO, 1 g protein, 0 g fat, <1.5 g fiber, 190 kcal)Malto-dextrin with tomato soup (a highly processed, non-granular starch, 47 g aCHO, 1 g protein, 0 g fat, 1 g fiber, 192 kcal)Pizza meal according to one’s preference served at 30 minNo difference
Anderson (2010) [29], Trial 2n = 16
Age: 20–30
Gender: 16 M
RCTAUC (120 min)Regular cornstarch with tomato soup (46.5 g aCHO, 1 g protein, 0 g fat, <1.5 g fiber, 190 kcal)Malto-dextrin with tomato soup (47 aCHO, 1 g protein, 0 g fat, 1 g fiber, 192 kcal)Pizza meal according to one’s preference served at 120 minNo difference
Flint (2006) [30]n = 28
Age: 24.8 (0.5)
Gender: 28 M
RCTiAUC (180 min)Reference bread (50 g aCHO, 12 g protein, 7 g fat, 5 g fiber, 319 kcal); Frosties + milk (50 g aCHO, 9 g protein, 3 g fat, 1 g fiber, 270 kcal)Porridge + rolled oats + water + applesauce (50 g aCHO, 8 g protein, 5 g fat, 6 g fiber, 289 kcal)A pasta salad served at 180 minNo difference
Furchner-Evanson (2010) [31]n = 21
Age: 20–30
Gender: 21 F
RCTAUC (120 min)Dried plums (48 g aCHO, 3 g protein, 0 g fat, 6 g fiber, 238 kcal)Low-fat cookies (54 g aCHO, 4 g protein, 0 g fat, 0 g fiber, 238 kcal); White bread (42 g aCHO, 6 g protein, 3 g fat, 3 g fiber, 238 kcal)A meal (strawberry flavored low-fat yogurt and granola) served at 120 minNo difference
Holt (1995) [33]n = 9
Age: 19.3–29.0
Gender: 4 M, 5 F
RCTAUC (120 min)Ordinary boilded rice (50 g aCHO, 4.2 g protein, 0.4 g fat, 1.5 g fiber, 218 kcal); High amylose puffed rice cakes (50 g aCHO, 6.3 g protein, 2.1 g fat, fiber 2.7 g, 235 kcal)Quick-cooking rice (50 g aCHO, 5.4 g protein, 0.6 g fat, 1.1 g fiber, 214 kcal); Low amylose puffed rice cakes (50 g aCHO, 4.8 g protein, 2.0 g fat, 2.6 g fiber, 228 kcal)Eat freely from a limited range of food items served at 120 minNo difference
Kaplan (2002) [34]n = 20
Age: 60–82
Gender: 10 M, 10 F
RCTAUC (105 min) + GI value (white bread as the reference)Pearled barley (46.6 aCHO, 5.9 g protein, 2.7 g fat, 9.4 g fiber, GI = 36, 228 kcal)Instant mashed potato (49.5 g aCHO, 5.1 g protein, 2.2 g fat, 3.1 g fiber, GI = 118, 233 kcal)Lunch (sandwiches, muffins, cookies) served at 120 minNo difference
Kristensen (2010) [35]n = 16
Age: 24.1 (3.8)
Gender: 6 M, 10 F
RCTGI value (white bread as the reference)Refined wheat pasta (50 g aCHO, 24 g protein, 17 g fat, 2.2 g fiber, 454 kcal, GI = 38)Refined wheat bread (50 g aCHO, 23 g protein, 17 g fat, 3.6 g fiber, 444 kcal, GI = 100)Pizza meal served at 180 minNo difference
Lumaga (2012) [36]n = 14
Age: 24–39
Gender: 8 M, 6 F
RCTAUC (180 min)Control beverage (37.3 g aCHO, 0 g Protein, 0 g fat, 0 g fiber, 149 kcal)Fruit-based beverage (34.3 g aCHO, 1.0 g protein, 0.3 g fat, 2.5 g fiber, 149 kcal)Compose lunch tray based on one’s own desire to eat served at 180 minNo difference
Rodin (1991) [37]n = 6
Age: 35.6 (2.4)
Gender: 3 M, 3 F
RCTAUC value (135 min)Pudding sweetened with fructose (50 g aCHO, 24% protein, 41% fat, 530 kcal)Pudding sweetened with glucose (50 g aCHO, 24% protein, 41% fat, 520 kcal)Buffet lunch served at 135 minLower energy intake after low-GI food intake
Table 2. Methodological quality of included trials.
First Author and YearRandomizationDouble BlindingWithdrawalsAppropriate RandomizationAppropriate Double BlindingTotal
Anderson (2002) [28], Trial 2100001
Anderson (2002) 28], Trial 3101002
Anderson (2010) [29], Trial 1100001
Anderson (2010) [29], Trial 2100001
Flint (2006) [30]100102
Furchner-Evanson (2010) [31]101002
Holt (1995) [33]100001
Kaplan (2002) [34]101002
Kristensen (2010) [35]101002
Lumaga (2012) [36]100001
Rodin (1991) [37]100001

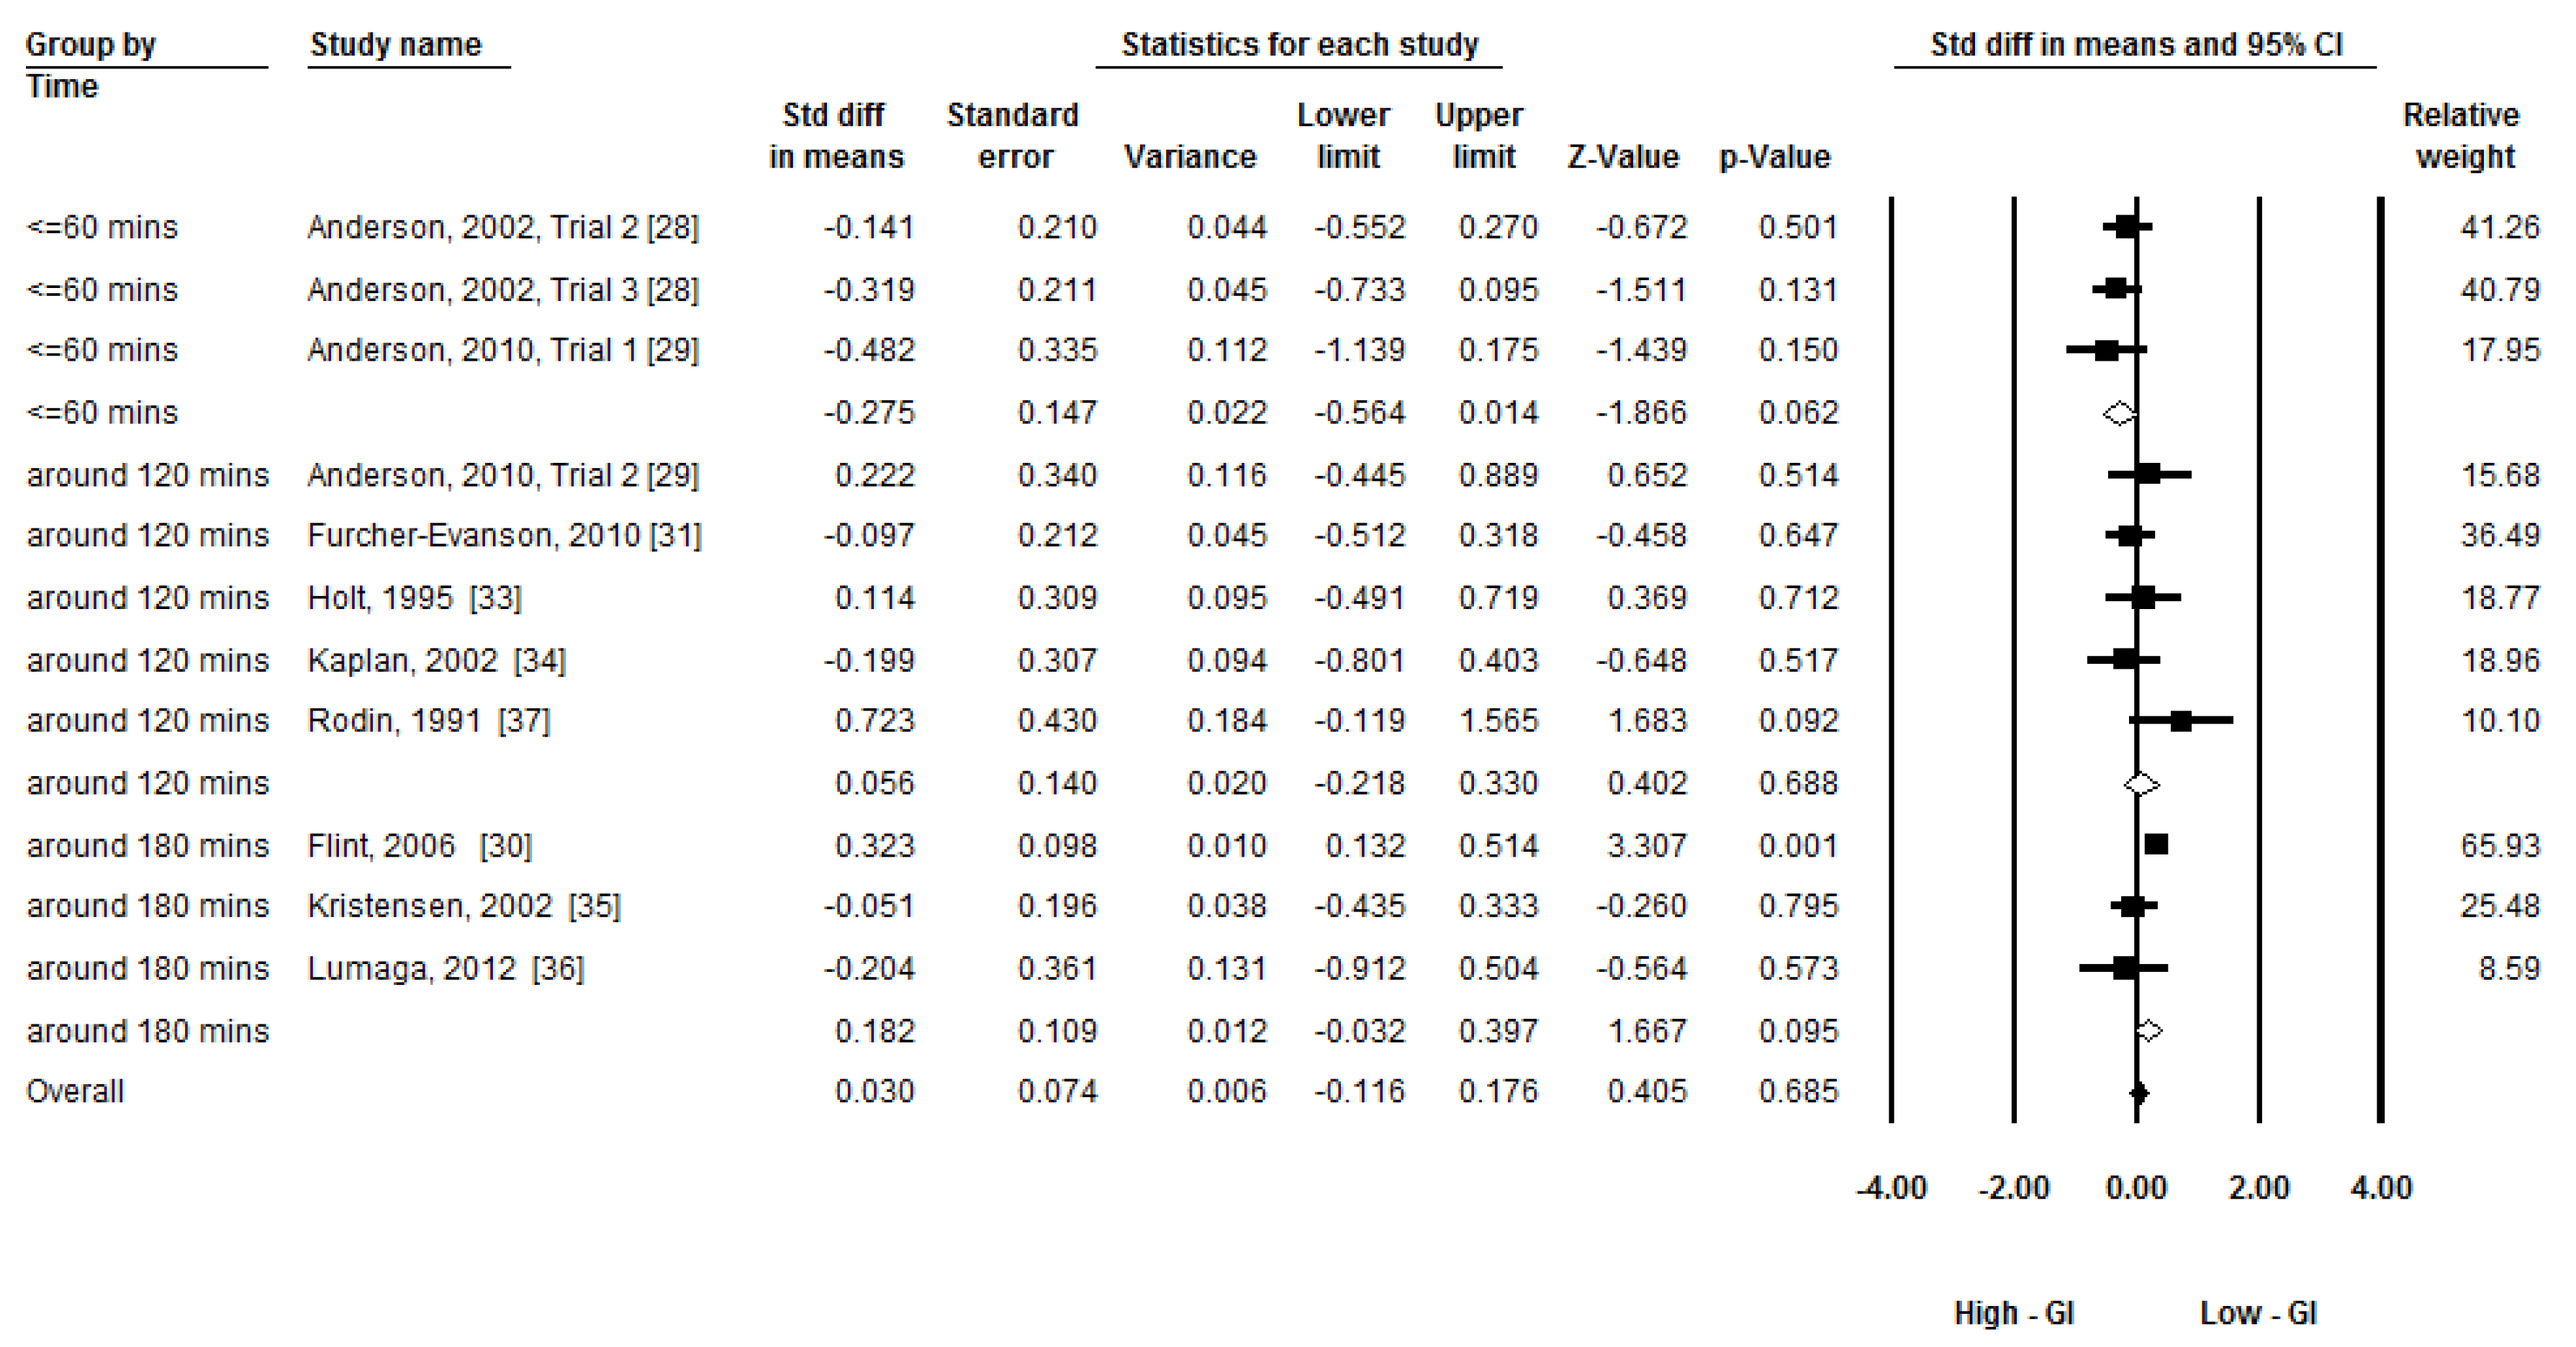
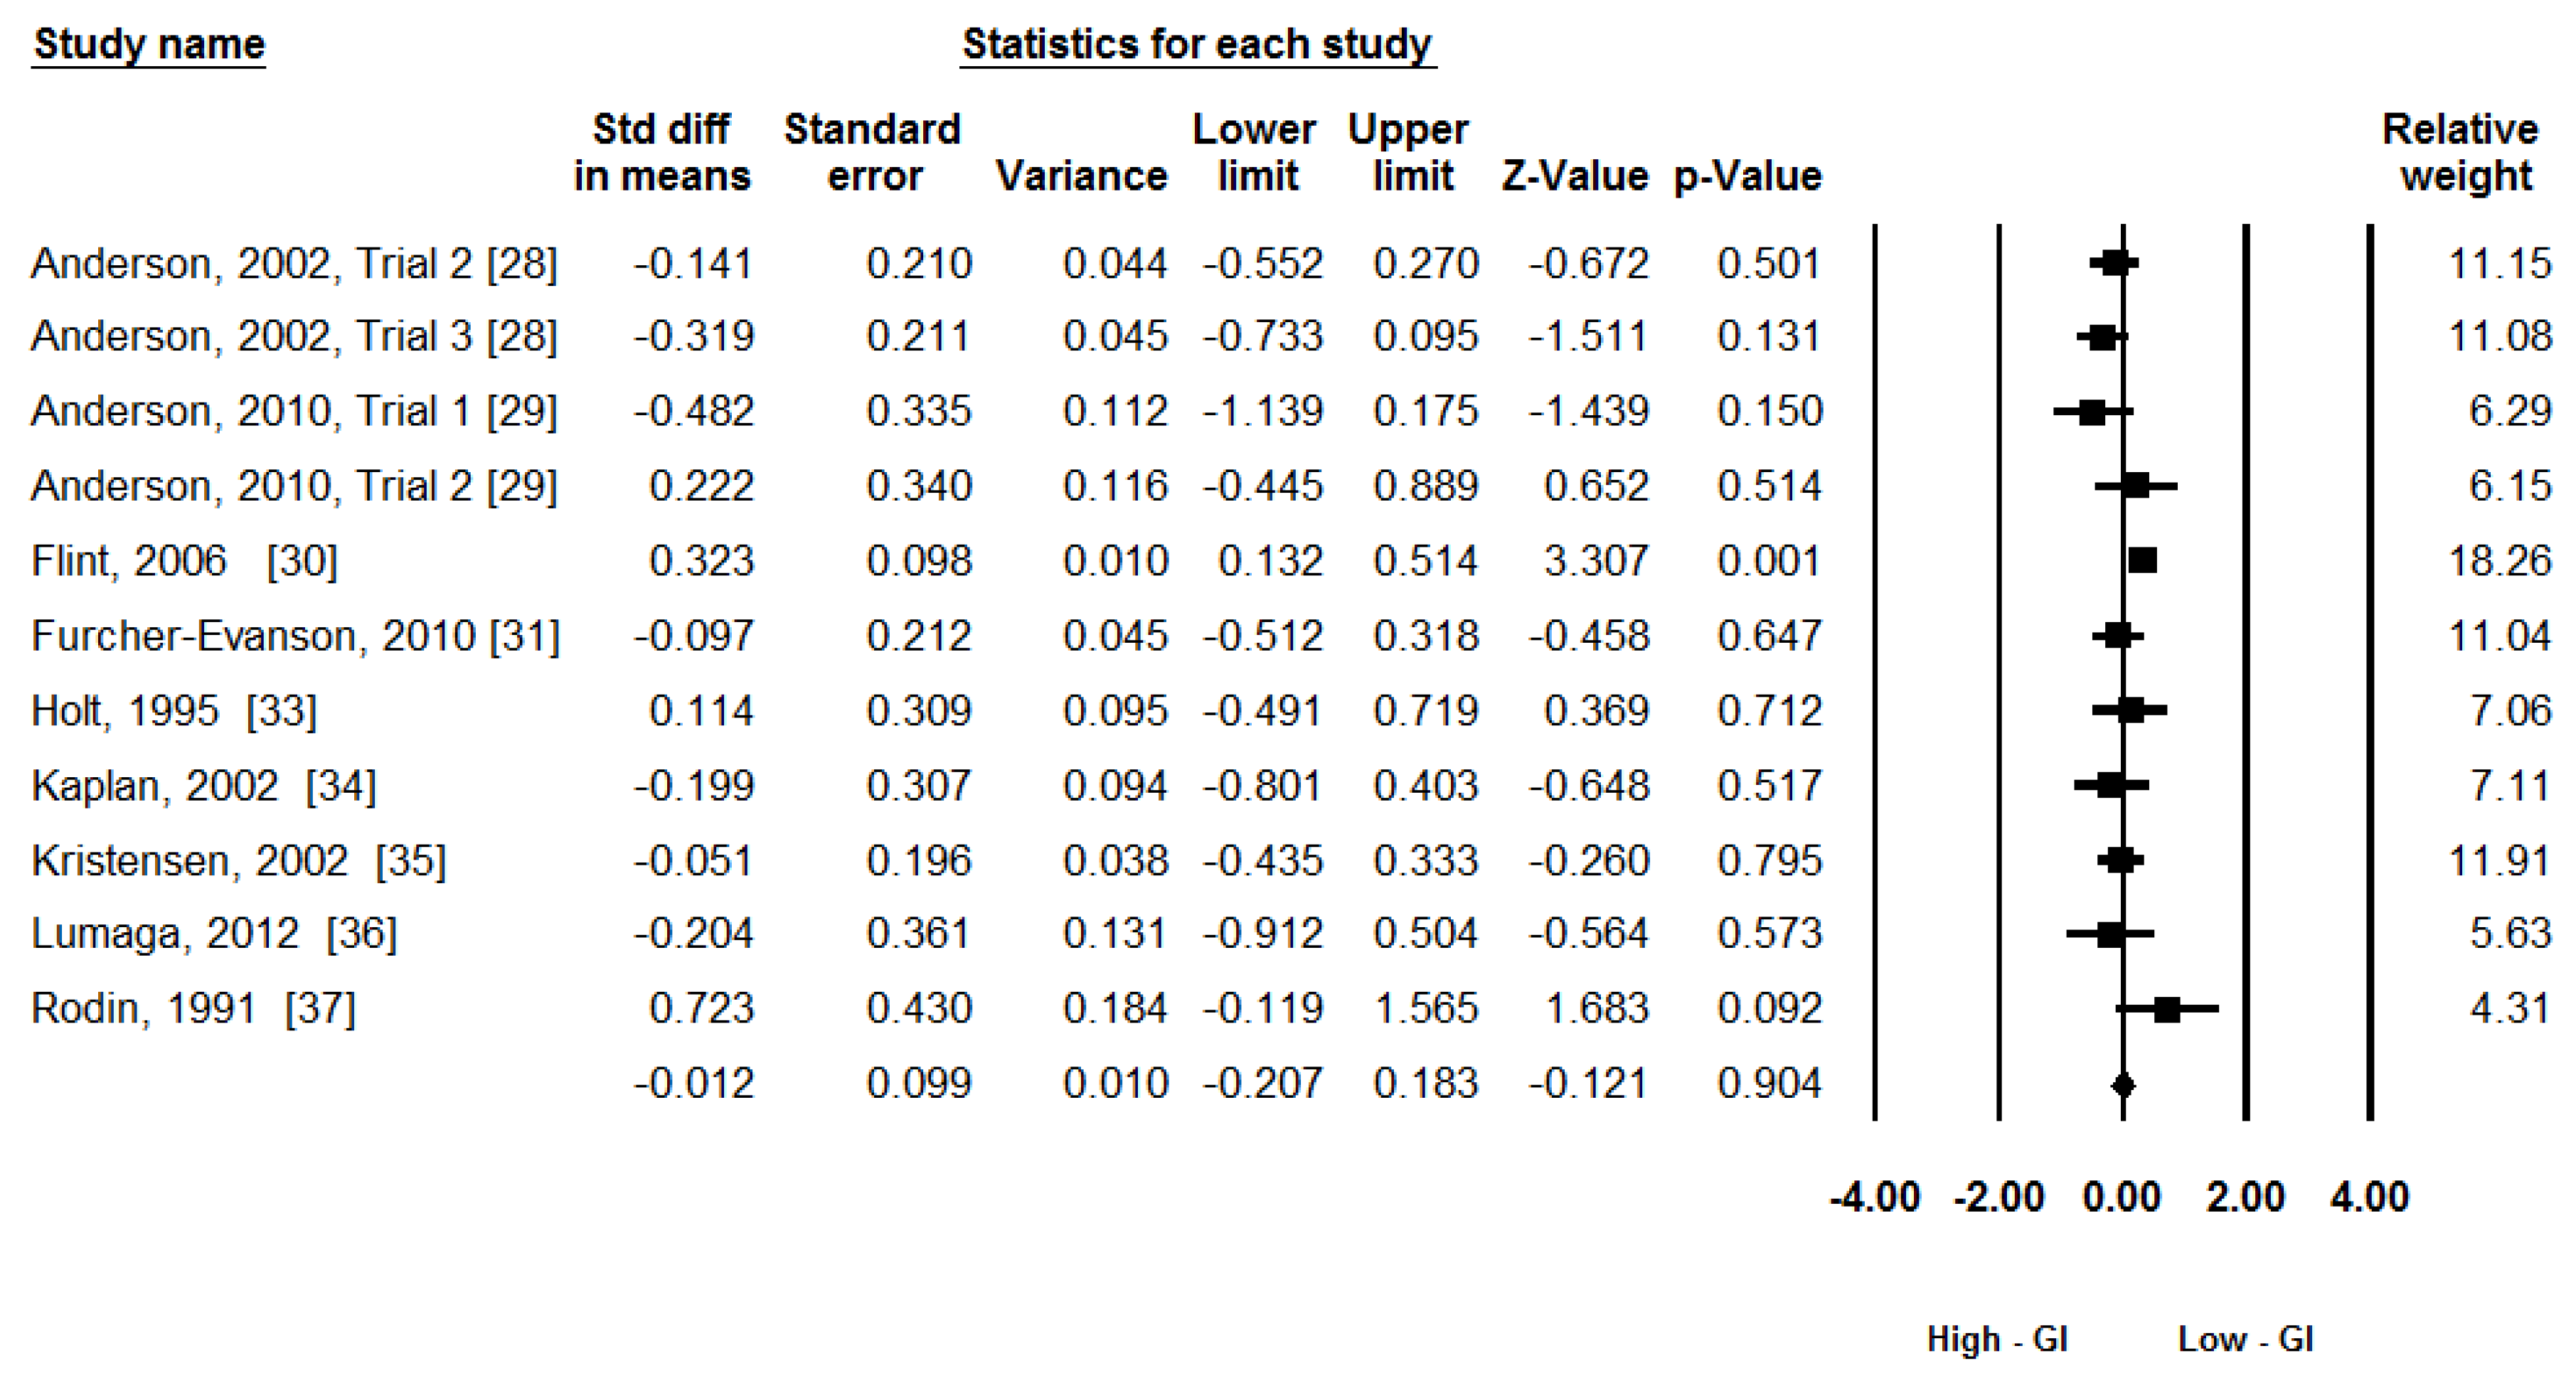
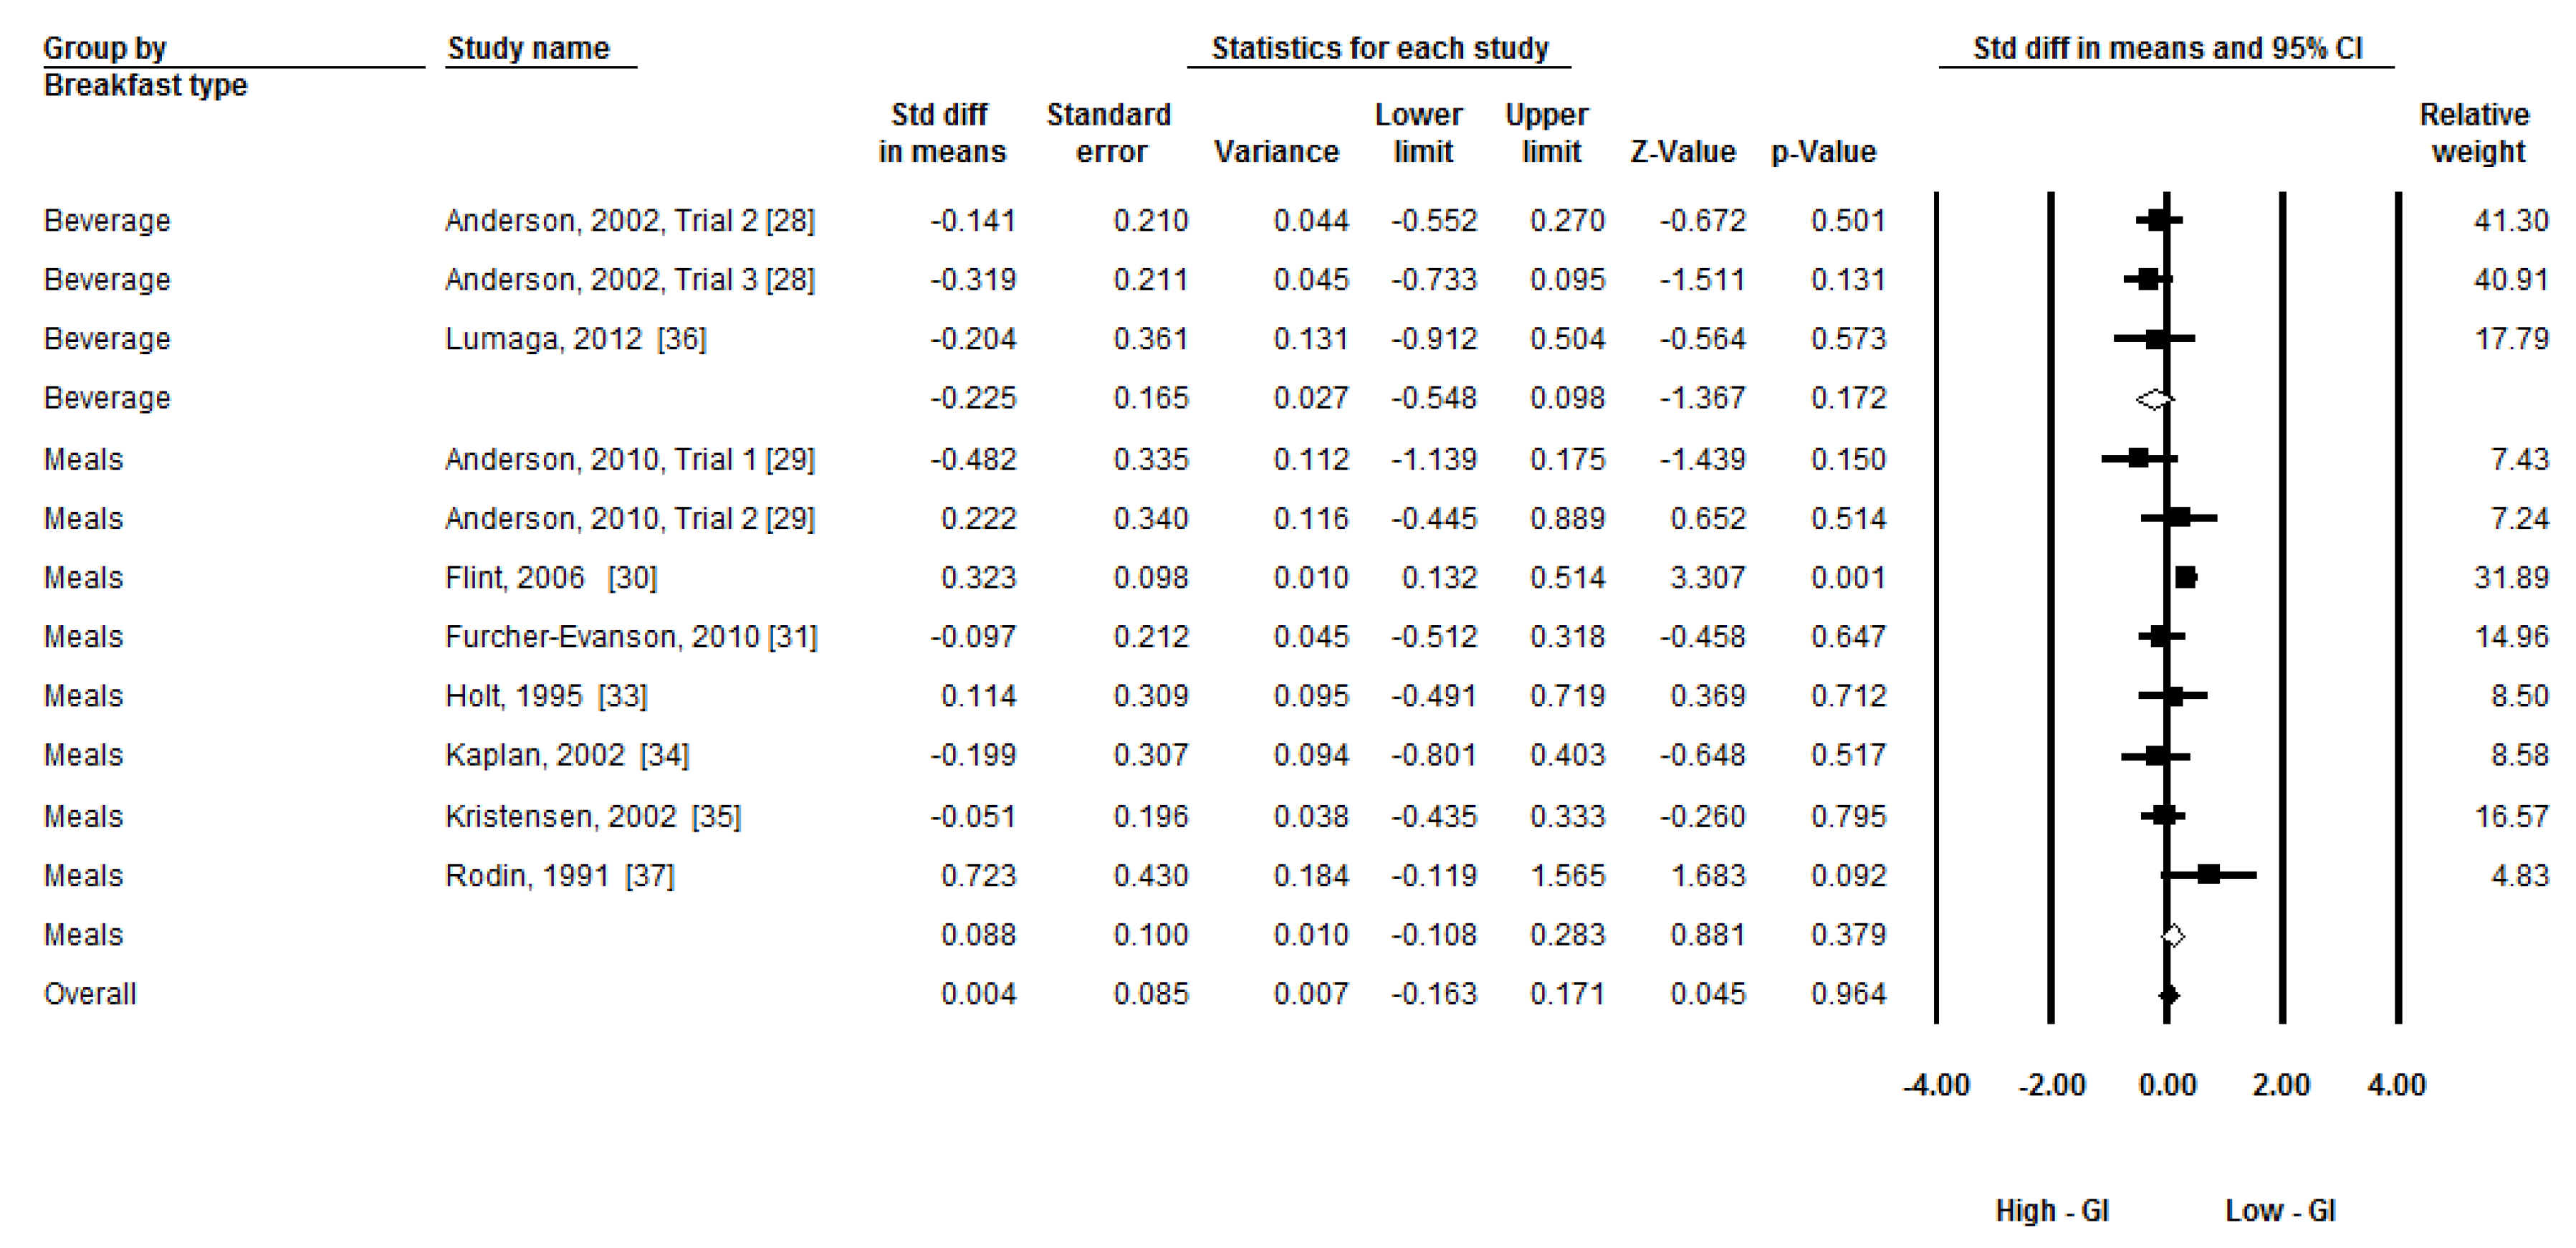
3.4. Synthesis of Results

Energy intake (kJ) was used as the principal outcome measure in this meta-analysis with 11 trials. A random-effects model was used given the moderate heterogeneity: Q(10) = 18.70, p = 0.04, I2 = 46%. Figure 2 shows the forest plot of the analysis. The meta-analytic results didn’t show any effect of GI on subsequent energy intake: ES = −0.01, 95% CI (−0.21, 0.18), z = −0.12, p = 0.90.
Figure 2. The effects of low-GI and high-GI breakfast on subsequent energy intake. (GI: Glycemic Index).
Nutrients 08 00037 g002

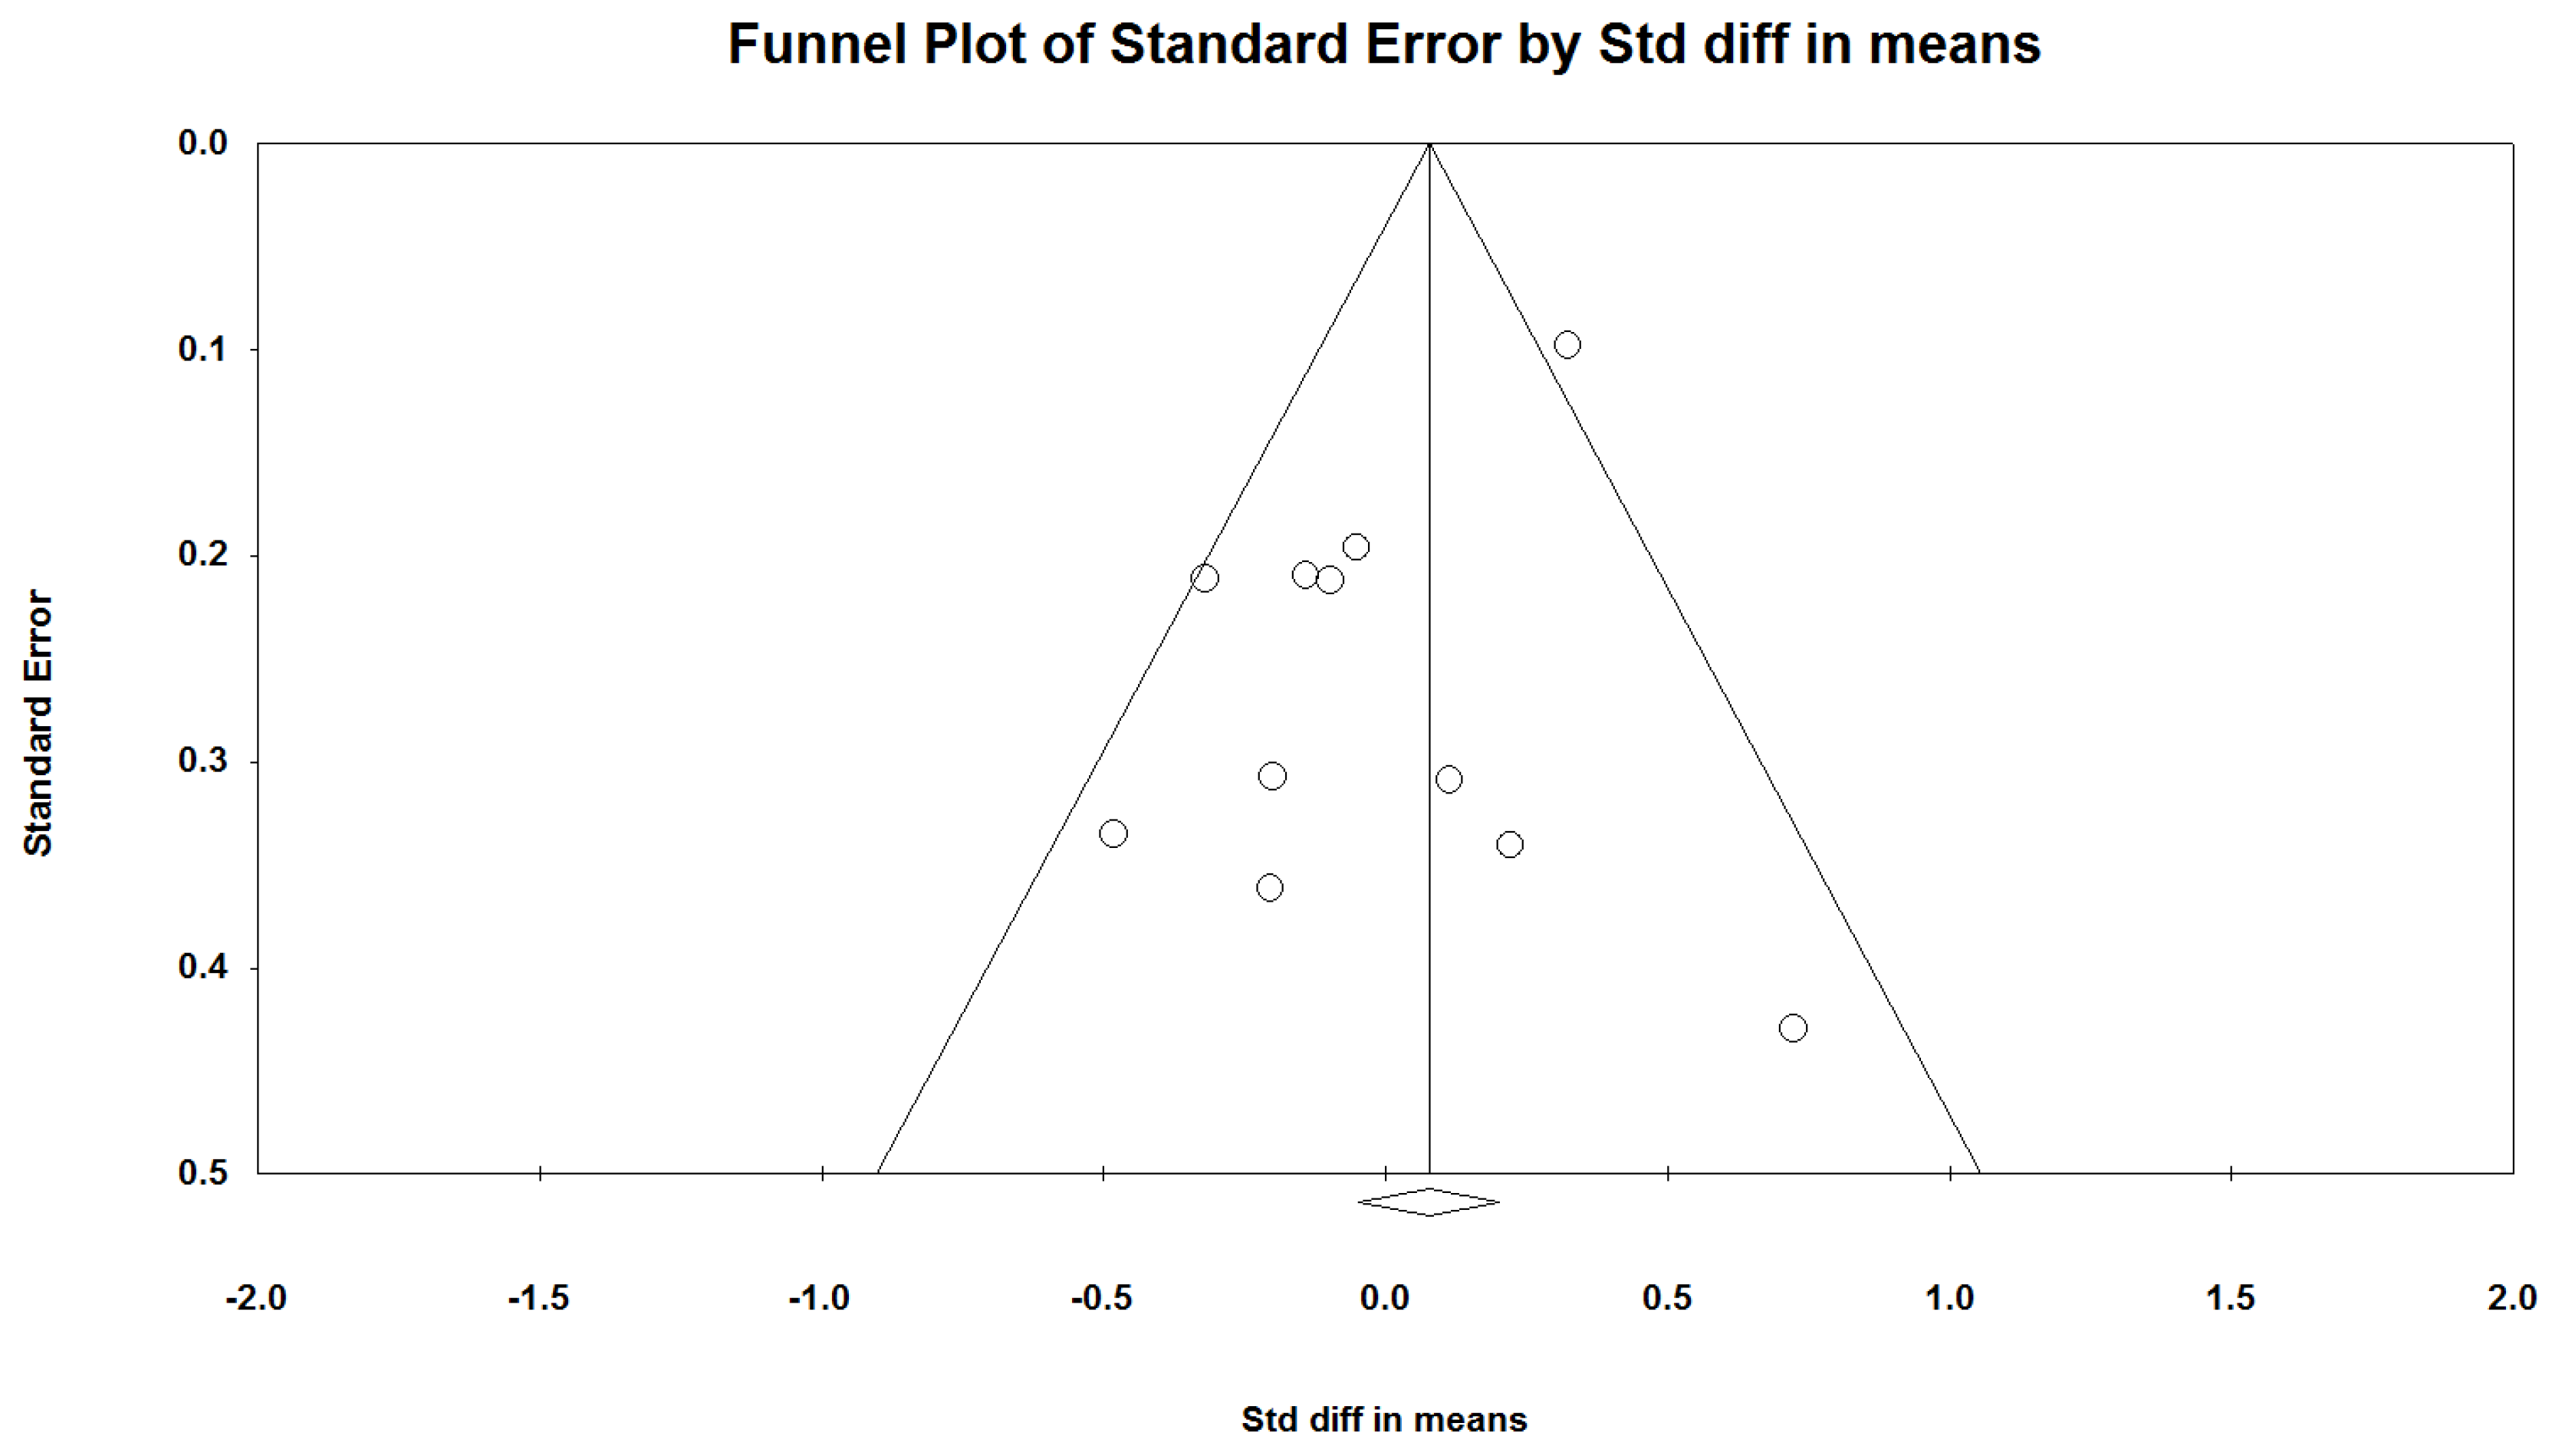
3.5. Publication Bias

The non-significant results of Egger’s test indicated no publication bias (p = 0.46). However, the funnel plot was not symmetrical (Figure 3). The unsymmetrical plot may be due to the heterogeneity among the included studies rather than publication bias.
Figure 3. Funnel plot.
Nutrients 08 00037 g003

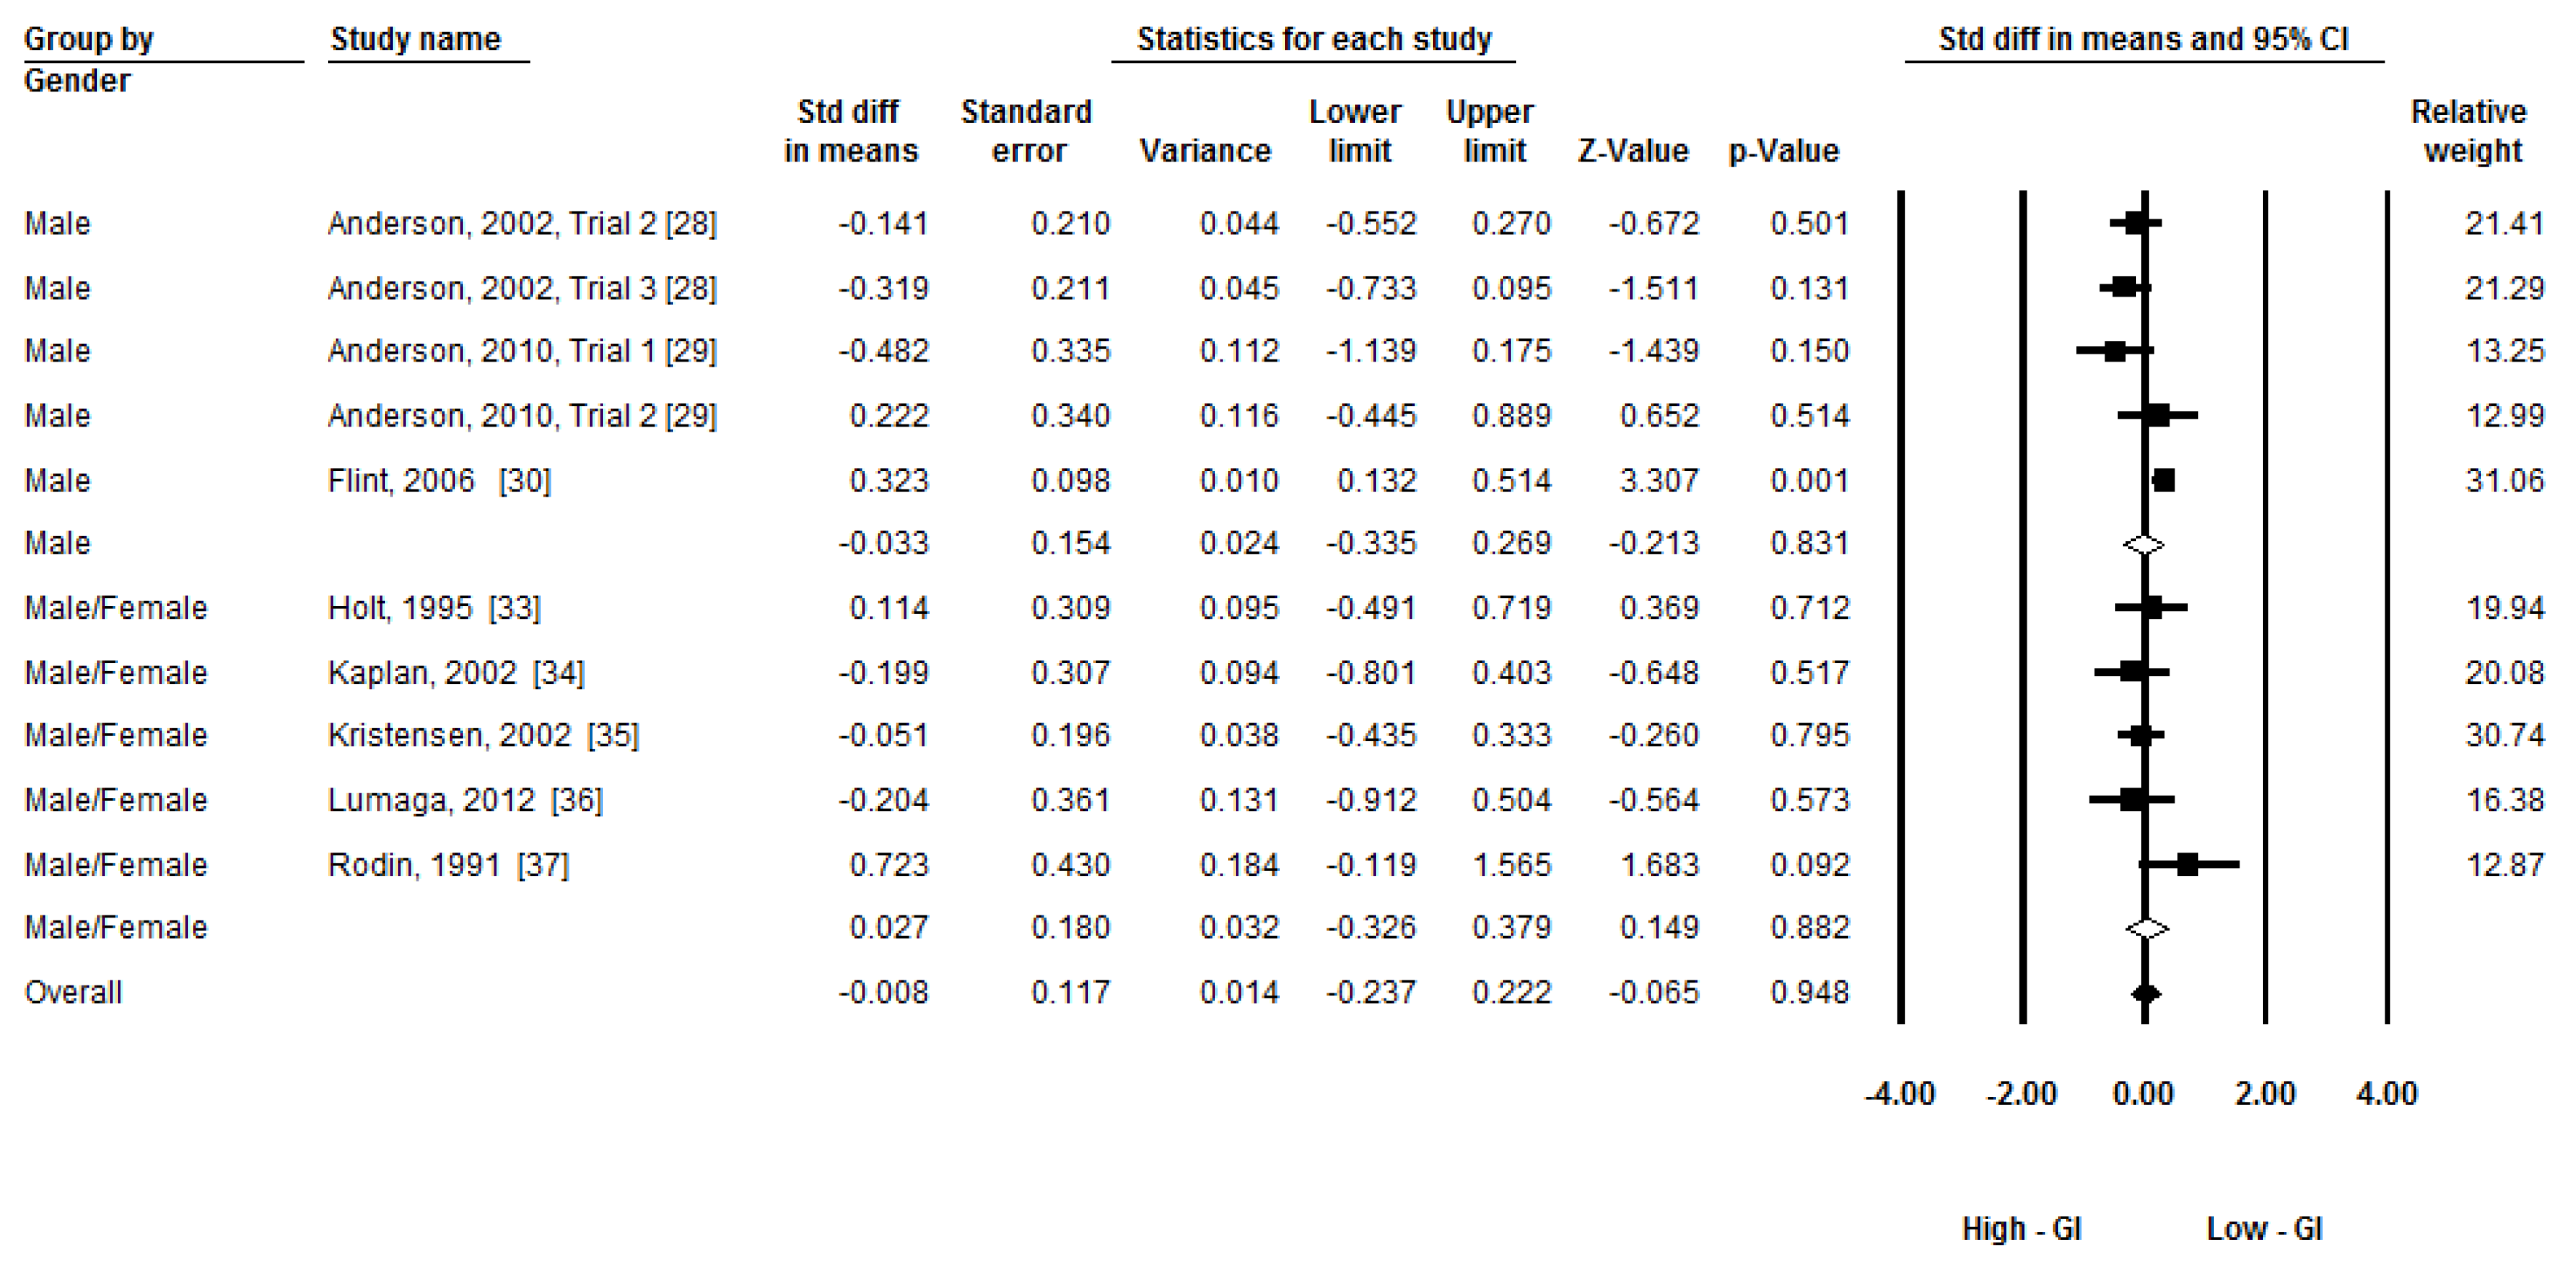
3.6. Additional Analysis

Given the moderate heterogeneity, three subgroup analyses were conducted to compare the group differences by time of subsequent food/meal intake (less than 60 min, around 120 min, and around 180 min), types of breakfast (beverage, food/meal other than beverage), and gender (male, both). A random-effects model was applied to conduct the subgroup analyses [27]. Figure 4, Figure 5 and Figure 6 present the forest plots of the subgroup analyses. There was a group difference on subsequent energy intake in time (Q(2) = 6.26, p = 0.04). There was a trend that breakfast GI had an effect on subsequent food intake within 60 min (ES = −0.28, p = 0.06). No group differences in types of breakfast (Q(1) = 2.64, p = 0.10) and gender (Q(1) = 0.06, p = 0.80) were observed.
Figure 4. Subgroup meta-analysis: The effect of low-GI and high-GI breakfast on subsequent energy intake at 60, 120, and 180 min. (GI: Glycemic Index).
Nutrients 08 00037 g004
Figure 5. Subgroup meta-analysis: The effect low-GI and high-GI breakfast with different types on subsequent energy intake. (GI: Glycemic Index).
Nutrients 08 00037 g005
Figure 6. Subgroup meta-analysis: The effect of low-GI and high-GI breakfast on subsequent energy intake between gender groups. (GI: Glycemic Index).
Nutrients 08 00037 g006

4. Discussion

This meta-analytic study was conducted to examine the effect of different GI breakfast (low-GI vs. high-GI) on subsequent short-term energy intake among healthy people. The major finding of this research was that, based on the pooled ESs of 11 randomized cross-over trials, different GI breakfast did not show any effect on subsequent short-term energy intake. This finding is inconsistent with an early systematic review [9], in which low-GI foods was suggested to suppress short-term appetite compared with high-GI foods. The different findings may be due to the varying research scopes. For example, the current study focused on the effect of breakfast rather than other meals, such as lunch or dinner. In addition, the previous systematic review used participants with different health conditions (e.g., obese, diabetes). The current review was confined to healthy participants only. Thus, the study characteristics of the current review are more homogenous than those of the previous systematic review. More importantly, in the previous systematic review [9], no meta-analysis was conducted, and the conclusion was largely based on a simple counting of positive results. Therefore, the current review provided the first piece of evidence on the effect of breakfast GI on subsequent energy intake through meta-analysis.
According to our meta-analytic results, it is still premature to conclude that breakfast GI affects short-term energy intake among healthy individuals. According to the previous systematic review [9], by using a subjective assessment method, most of the included studies supported an increase in satiety after low-GI versus high-GI food/meal consumption. As studies with subjective measurement are not included in the present review, it is hard to make the direct comparison between the two studies. However, according to the results of these two studies, it is possible that subjective appetite feelings are not directly linked to energy intake. It should also be noted that most of the included studies have low research quality (Table 2). A few limitations should be accounted while interpreting the current findings. Similar to other meta-analytic studies, only articles published in English were included. The studies that did not report GI values or iAUC/AUC results were excluded from this meta-analysis. Additionally, although we have tried to exclude the potential influences of confounding factors, it is very difficult to control all of them. Small differences in fiber contents (~5 g) still exist between two trials in some studies [30,34]. Viscosity of beverages may also affect gastrointestinal hormonal responses and appetite [38], which was not controlled in the present systematic review. Because of these limitations, the research findings may be biased. More high-quality studies are warranted, especially those with strictly controlled energy, macronutrients, fiber, viscosity, and with higher Jadad scores.
Three subgroup meta-analytic analyses were conducted in our research to investigate the possible explanations of heterogeneity. The postprandial time (≤60 min, around 120 min, around 180 min) after breakfast consumption and types of breakfast (beverage vs. breakfast other than beverage) showed no effect on subsequent energy intake. However, the results of the present study show that food intake time (≤60 min) tends to affect the effect of GI on subsequent energy intake (p = 0.06). Glucostatic theory [12,13] may be one possible reason to explain the effect of GI on subsequent energy intake. It indicates that transient glycemia drops after high-GI food consumption may stimulate appetite and may be responsible for short-term appetite regulation. By contrast, low-GI food consumption blunts the hyperglycemia and hyperinsulinemia, which may reduce the subsequent fall in glycemia and prevented reactive hypoglycemia. The sustained exogenous supply of blood glucose may be caused by slower and lengthened digestion and absorption of low-GI food. However, this theory only accounts for the difference in effect of GI on food intake for several, but not all of previous studies [9]. One previous study also suggests that insulin itself does not affect short-term feeding behavior [39]. Furthermore, recent evidence shows that slowly digestible starch may not always result in reduced postprandial glycemia because of a slower glucose clearance rate [40]. According to Brand-Miller [4], the peak glucose concentration occurs at around 30 min after high- or low-GI food/meal consumption. Therefore, it is possible that the most significant difference in blood glucose concentrations during the postprandial period will be observed within 60 min. However, the lowest blood glucose concentrations were observed at around 120 min in both trials. Therefore, the different glycemic responses after high- or low-GI food consumption are expected at different postprandial periods. This may affect energy intake to a certain degree. However, it cannot be explained by glucostatic theory.
The subgroup analyses indicated that breakfast GI has no effect on subsequent energy intake in males and in both genders (Figure 6). Among all the included studies, only one study used female participants [31]. Therefore, the study (female group) is not included in the sub-group analysis regarding gender. Although several studies have included both male and female participants [32,33,34,35,36,37], the results of both genders have been combined for further analysis, which may partly be attributed to the fact that both males and females were considered to be equal in GI measurement [3]. However, recent evidence suggests that females may be more sensitive to macronutrients and overfeeding, which may result in different subsequent energy intake between genders [41,42]. This gender difference may be caused by estrogens in females [43]. Therefore, it is possible that breakfast with different GI has different effect on subsequent short-term energy intake among healthy females. Furthermore, another two excluded studies [44,45] using female participants found that low-GI beverage/food may suppress subsequent energy intake compared with high-GI beverage/food, although different macronutrients between two trials in these two studies may affect the final results. Therefore, because of limited number of included studies, further studies are still needed to analyze the research findings by gender groups.
Except for the glucostatic theory [12], several other possible mechanisms may also mediate appetite regulation after different GI meal intake. First, the gut–brain axis is the key component in the recently established model of appetite regulation [46]. Various peptide hormones are secreted in the gastrointestinal tract that may regulate appetite, including ghrelin, cholecystokinin, glucagon-like-peptide-1, and peptide-YY [47]. The satietogenic effect of low-GI foods over high-GI foods was hypothesized for their slower digestion and prolonged presence in the gastrointestinal tract, and thus stimulation of gut satiety signals [48]. Second, low-GI starchy foods were associated with an increased amount of CHO escaping digestion in the small intestine [49,50], and hence an increase in colonic fermentation [51,52]. Dietary fibers, resistant starch, and non-digestible oligosaccharides are unavailable CHO to humans in vivo [53]. One recent review suggested the possible mechanism of the appetite suppressing effect mediated by colonic fermentation of unavailable CHO in low-GI foods [54]. Third, brain activities may be involved in appetite regulation. One recent study found that high-GI meal consumption may selectively stimulate the brain regions associated with reward and craving four hours after meal consumption, compared with iso-caloric low-GI meal intake [55]. Although these different mechanisms have been proposed for appetite regulation after low- and high-GI meal consumption, they may only account for a part of the previous studies. According to the results of the present review, more carefully designed studies are still needed to further clarify the effect of GI on appetite, especially considering the gender difference and potential mechanisms.
The practical utility of GI for long-term appetite control and weight management were more complicated because of the truthfulness of predicted GI [56], least significant difference of GI [57], limitations of dietary recommendations and counseling [58], as well as redundant homeostatic mechanisms to offset negative energy balance [59]. These questions cannot be answered by the present review.

5. Conclusions

In conclusion, it seems that breakfast GI has no effect on short-term energy intake among healthy people. However, this conclusion should be interpreted with caution given that most of the included trials are of low research quality, and some confounding factors are not well controlled.

Acknowledgments

This study was supported by Innovation Program of Shanghai Municipal Education Commission (No. 14ZZ149) and Shanghai Committee of Science and Technology (14490503800).

Author Contributions

Feng-Hua Sun, Stephen Heung-Sang Wong, and Lin Wang designed the whole study; Feng-Hua Sun, Chunxiao Li, and Yan-Jie Zhang completed the literature search and data collection; and Chunxiao Li and Yan-Jie Zhang conducted the meta-analysis. All authors contributed to the data interpretation and manuscript preparation.

Conflicts of Interest

The authors declare no conflict of interest.

References

  1. Jenkins, D.J.A.; Wolever, T.M.S.; Taylor, R.H.; Barker, H.; Fielden, H.; Baldwin, J.M.; Bowling, A.C.; Newman, H.C.; Jenkins, A.L.; Goff, D.V. Glycemic index of foods: A physiological basis for carbohydrate exchange. Am. J. Clin. Nutr. 1981, 34, 362–366. [Google Scholar] [PubMed]
  2. Brand-Miller, J.C.; Foster-Powell, K.; Colagiuri, S.; Leeds, A. The Gi Factor; Hodder Headline: Rydalmere, Australia, 1998. [Google Scholar]
  3. Brouns, F.; Bjorck, I.; Frayn, K.N.; Gibbs, A.L.; Lang, V.; Slama, G.; Wolever, T.M.S. Glycaemic index methodology. Nutr. Res. Rev. 2005, 18, 145–171. [Google Scholar] [CrossRef] [PubMed]
  4. Brand-Miller, J.C.; Stockmann, K.; Atkinson, F.; Petocz, P.; Denyer, G.S. Glycemic index, postprandial glycemia, and the shape of the curve in healthy subjects: Analysis of a database of more than 1000 foods. Am. J. Clin. Nutr. 2009, 89, 97–105. [Google Scholar] [CrossRef] [PubMed]
  5. Thomas, D.E.; Elliott, E.J. Low glycaemic index, or low glycaemic load, diets for diabetes mellitus. Cochrane Database Syst. Rev. 2009. [Google Scholar] [CrossRef]
  6. Gnagnarella, P.; Gandini, S.; la Vecchia, C.; Maisonneuve, P. Glycemic index, glycemic load, and cancer risk: A meta-analysis. Am. J. Clin. Nutr. 2008, 87, 1793–1801. [Google Scholar] [PubMed]
  7. O’Reilly, J.; Wong, S.H.S.; Chen, Y.J. Glycaemic index, glycaemic load and exercise performance. Sports Med. 2010, 40, 27–39. [Google Scholar] [CrossRef] [PubMed]
  8. Barclay, A.W.; Petocz, P.; McMillan-Price, J.; Flood, V.M.; Prvan, T.; Mitchell, P.; Brand-Miller, J.C. Glycemic index, glycemic load, and chronic disease risk—A meta-analysis of observational studies. Am. J. Clin. Nutr. 2008, 87, 627–637. [Google Scholar] [PubMed]
  9. Bornet, F.R.J.; Jardy-Gennetier, A.E.; Jacquet, N.; Stowell, J. Glycaemic response to foods: Impact on satiety and long-term weight regulation. Appetite 2007, 49, 535–553. [Google Scholar] [CrossRef] [PubMed]
  10. Livesey, G. Low-glycaemic diets and health: Implications for obesity. Proc. Nutr. Soc. 2005, 64, 105–113. [Google Scholar] [CrossRef] [PubMed]
  11. Thomas, D.E.; Elliott, E.J.; Baur, L. Low glycaemic index or low glycaemic load diets for overweight and obesity. Cochrane Database Syst. Rev. 2007. [Google Scholar] [CrossRef]
  12. Mayer, J. Glucostatic mechanism of regulation of food intake. N. Engl. J. Med. 1953, 249, 13–16. [Google Scholar] [CrossRef] [PubMed]
  13. Chaput, J.P.; Tremblay, A. The glucostatic theory of appetite control and the risk of obesity and diabetes. Int. J. Obes. 2009, 33, 46–53. [Google Scholar] [CrossRef] [PubMed]
  14. Arumugam, V.; Lee, J.S.; Nowak, J.K.; Pohle, R.J.; Nyrop, J.E.; Leddy, J.J.; Pelkman, C.L. A high-glycemic meal pattern elicited increased subjective appetite sensations in overweight and obese women. Appetite 2008, 50, 215–222. [Google Scholar] [CrossRef] [PubMed]
  15. Smith, F.J.; Campfield, L.A. Meal initiation occurs after experimental induction of transient declines in blood glucose. Am. J. Physiol. 1993, 265, R1423–R1429. [Google Scholar] [PubMed]
  16. Pawlak, D.B.; Ebbeling, C.B.; Ludwig, D.S. Should obese patients be counselled to follow a low-glycaemic index diet? Yes. Obes. Rev. 2002, 3, 235–243. [Google Scholar] [CrossRef] [PubMed]
  17. Raben, A. Should obese patients be counselled to follow a low-glycaemic index diet? No. Obes. Rev. 2002, 3, 245–256. [Google Scholar] [CrossRef] [PubMed]
  18. Salmeron, J.; Manson, J.E.; Stampfer, M.J.; Colditz, G.A.; Wing, A.L.; Willett, W.C. Dietary fiber, glycemic load, and risk of non-insulin-dependent diabetes mellitus in women. JAMA 1997, 277, 472–477. [Google Scholar] [CrossRef] [PubMed]
  19. Salmeron, J.; Ascherio, A.; Rimm, E.B.; Colditz, G.A.; Spiegelman, D.; Jenkins, D.J.; Stampfer, M.J.; Wing, A.L.; Willett, W.C. Dietary fiber, glycemic load, and risk of NIDDM in men. Diabetes Care 1997, 20, 545–550. [Google Scholar] [CrossRef] [PubMed]
  20. Jenkins, D.J.A.; Wolever, T.M.S.; Taylor, R.H.; Griffiths, C.; Krzeminska, K.; Lawrie, J.A.; Bennett, C.M.; Goff, D.V.; Sarson, D.L.; Bloom, S.R. Slow release dietary carbohydrate improves second meal tolerance. Am. J. Clin. Nutr. 1982, 35, 1339–1346. [Google Scholar] [PubMed]
  21. Moher, D.; Liberati, A.; Tetzlaff, J.; Altman, D.G. Preferred reporting items for systematic reviews and meta-analyses: The prisma statement. Ann. Intern. Med. 2009, 151, 264–269. [Google Scholar] [CrossRef] [PubMed]
  22. Roberts, S.B. Glycemic index and satiety. Nutr. Clin. Care 2002, 6, 20–26. [Google Scholar]
  23. Jadad, A.R.; Moore, A.R.; Carroll, D.; Jenkinson, C.; Reynolds, J.D.M.; Gavaghan, D.J.; McQuay, H.J. Assessing the quality of reports of randomized clinical trials: Is blinding necessary? Controll. Clin. Trials 1996, 17, 1–12. [Google Scholar] [CrossRef]
  24. Jiao, J.; Li, Q.; Chu, J.; Zeng, W.; Yang, M.; Zhu, S. Effect of n−3 PUFA supplementation on cognitive function throughout the life span from infancy to old age: A systematic review and meta-analysis of randomized controlled trials. Am. J. Clin. Nutr. 2014, 100, 1422–1436. [Google Scholar] [CrossRef] [PubMed]
  25. Lee, E.H.; Myung, S.K.; Jeon, Y.J.; Kim, Y.; Chang, Y.J.; Ju, W.; Seo, H.G.; Huh, B.Y. Effects of selenium supplements on cancer prevention: Meta-analysis of randomized controlled trials. Nutr. Cancer 2011, 63, 1185–1195. [Google Scholar] [CrossRef] [PubMed]
  26. Higgins, J.P.T.; Thompson, S.G.; Deeks, J.J.; Altman, D.G. Measuring inconsistency in meta-analyses. BMJ 2003, 327. [Google Scholar] [CrossRef] [PubMed] [Green Version]
  27. Higgins, J.P.T.; Green, S.; Collaboration, C. Cochrane Handbook for Systematic Reviews of Interventions; Wiley Online Library: Hoboken, NJ, USA, 2008; Volume 5. [Google Scholar]
  28. Anderson, G.H.; Catherine, N.L.A.; Woodend, D.M.; Wolever, T.M.S. Inverse association between the effect of carbohydrates on blood glucose and subsequent short-term food intake in young men. Am. J. Clin. Nutr. 2002, 76, 1023–1030. [Google Scholar] [PubMed]
  29. Anderson, G.H.; Cho, C.E.; Akhavan, T.; Mollard, R.C.; Luhovyy, B.L.; Finocchiaro, E.T. Relation between estimates of cornstarch digestibility by the englyst in vitro method and glycemic response, subjective appetite, and short-term food intake in young men. Am. J. Clin. Nutr. 2010, 91, 932–939. [Google Scholar] [CrossRef] [PubMed]
  30. Flint, A.; Moller, B.K.; Raben, A.; Sloth, B.; Pedersen, D.; Tetens, I.; Holst, J.J.; Astrup, A. Glycemic and insulinemic responses as determinants of appetite in humans. Am. J. Clin. Nutr. 2006, 84, 1365–1373. [Google Scholar] [PubMed]
  31. Furchner-Evanson, A.; Petrisko, Y.; Howarth, L.; Nemoseck, T.; Kern, M. Type of snack influences satiety responses in adult women. Appetite 2010, 54, 564–569. [Google Scholar] [CrossRef] [PubMed]
  32. Hall, R.S.; Thomas, S.J.; Johns, S.K. Australian sweet lupin flour addition reduces the glycaemic index of a white bread breakfast without affecting palatability in healthy human volunteers. Asia Pac. J. Clin. Nutr. 2005, 14, 91–97. [Google Scholar] [PubMed]
  33. Holt, S.H.A.; Miller, J.B. Increased insulin responses to ingested foods are associated with lessened satiety. Appetite 1995, 24, 43–54. [Google Scholar] [CrossRef]
  34. Kaplan, R.J.; Greenwood, C.E. Influence of dietary carbohydrates and glycaemic response on subjective appetite and food intake in healthy elderly persons. Int. J. Food Sci. Nutr. 2002, 53, 305–316. [Google Scholar] [CrossRef] [PubMed]
  35. Kristensen, M.; Jensen, M.G.; Riboldi, G.; Petronio, M.; Bugel, S.; Toubro, S.; Tetens, I.; Astrup, A. Wholegrain vs. Refined wheat bread and pasta: Effect on postprandial glycemia, appetite, and subsequent ad libitum energy intake in young healthy adults. Appetite 2010, 54, 163–169. [Google Scholar] [CrossRef] [PubMed]
  36. Lumaga, R.B.; Azzali, D.; Fogliano, V.; Scalfi, L.; Vitaglione, P. Sugar and dietary fibre composition influence, by different hormonal response, the satiating capacity of a fruit-based and a β-glucan-enriched beverage. Food Funct. 2012, 3, 67–75. [Google Scholar] [CrossRef] [PubMed]
  37. Rodin, J. Effects of pure sugar vs. mixed starch fructose loads on food-intake. Appetite 1991, 17, 213–219. [Google Scholar] [CrossRef]
  38. Juvonen, K.R.; Purhonen, A.K.; Salmenkallio-Marttila, M.; Lahteenmaki, L.; Laaksonen, D.E.; Herzig, K.H.; Uusitupa, M.I.J.; Poutanen, K.S.; Karhunen, L.J. Viscosity of oat bran-enriched beverages influences gastrointestinal hormonal responses in healthy humans. J. Nutr. 2009, 139, 461–466. [Google Scholar] [CrossRef] [PubMed]
  39. Chapman, I.M.; Goble, E.A.; Wittert, G.A.; Morley, J.E.; Horowitz, M. Effect of intravenous glucose and euglycemic insulin infusions on short-term appetite and food intake. Am. J. Physiol. 1998, 274, R596–R603. [Google Scholar] [PubMed]
  40. Eelderink, C.; Schepers, M.; Preston, T.; Vonk, R.J.; Oudhuis, L.; Priebe, M.G. Slowly and rapidly digestible starchy foods can elicit a similar glycemic response because of differential tissue glucose uptake in healthy men. Am. J. Clin. Nutr. 2012, 96, 1017–1024. [Google Scholar] [CrossRef] [PubMed]
  41. Cornier, M.A.; Grunwald, G.K.; Johnson, S.L.; Bessesen, D.H. Effects of short-term overfeeding on hunger, satiety, and energy intake in thin and reduced-obese individuals. Appetite 2004, 43, 253–259. [Google Scholar] [PubMed]
  42. Westerterp-Plantenga, M.S.; Lejeune, M.P.G.M.; Smeets, A.J.P.G.; Luscombe-Marsh, N.D. Sex differences in energy homeostatis following a diet relatively high in protein exchanged with carbohydrate, assessed in a respiration chamber in humans. Physiol. Behav. 2009, 97, 414–419. [Google Scholar] [PubMed]
  43. Asarian, L.; Geary, N. Modulation of appetite by gonadal steroid hormones. Philos. Trans. R. Soc. B Biol. Sci. 2006, 361, 1251–1263. [Google Scholar] [CrossRef] [PubMed]
  44. Zafar, T.A.; Kabir, Y.; Ghazaii, C. Low glycemic index foods suppress glycemic responses, appetite and food intake in young Kuwaiti females. Kuwait J. Sci. Eng. 2011, 38, 111–123. [Google Scholar]
  45. Zafar, T.A.; Waslien, C.; AlRaefaei, A.; Alrashidi, N.; AlMahmoud, E. Whey protein sweetened beverages reduce glycemic and appetite responses and food intake in young females. Nutr. Res. 2013, 33, 303–310. [Google Scholar] [CrossRef] [PubMed]
  46. Chaudhri, O.B.; Salem, V.; Murphy, K.G.; Bloom, S.R. Gastrointestinal satiety signals. Annu. Rev. Physiol. 2008, 70, 239–255. [Google Scholar] [CrossRef] [PubMed]
  47. Woods, S.C. Gastrointestinal satiety signals I.—An overview of gastrointestinal signals that influence food intake. Am. J. Physiol. 2004, 286, G7–G13. [Google Scholar] [CrossRef] [PubMed]
  48. Anderson, G.H.; Woodend, D. Effect of glycemic carbohydrates on short-term satiety and food intake. Nutr. Rev. 2003, 61, S17–S26. [Google Scholar] [CrossRef] [PubMed]
  49. Wolever, T.M.S.; Cohen, Z.; Thompson, L.U.; Thorne, M.J.; Jenkins, M.J.; Prokipchuk, E.J.; Jenkins, D.J.A. Ileal loss of available carbohydrate in man: Comparison of a breath hydrogen method with direct measurement using a human ileostomy model. Am. J. Gastroenterol. 1986, 81, 115–122. [Google Scholar] [PubMed]
  50. Jenkins, D.J.A.; Cuff, D.; Wolever, T.M.S.; Knowland, D.; Thompson, L.; Cohen, Z.; Prokipchuk, E. Digestibility of carbohydrate foods in an ileostomate: Relationship to dietary fiber, in vitro digestibility, and glycemic response. Am. J. Gastroenterol. 1987, 82, 709–717. [Google Scholar] [PubMed]
  51. Jenkins, D.J.A.; Wolever, T.M.S.; Collier, G.R.; Ocana, A.; Rao, A.V.; Buckley, G.; Lam, Y.; Mayer, A.; Thompson, L.U. Metabolic effects of a low-glycemic-index diet. Am. J. Clin. Nutr. 1987, 46, 968–975. [Google Scholar] [PubMed]
  52. Wolever, T.M.S.; Jenkins, D.J.A.; Vuksan, V.; Jenkins, A.L.; Buckley, G.C.; Wong, G.S.; Josse, R.G. Beneficial effect of a low glycaemic index diet in type 2 diabetes. Diabet. Med. 1992, 9, 451–458. [Google Scholar] [CrossRef] [PubMed]
  53. Champ, M.; Langkilde, A.M.; Brouns, F.; Kettlitz, B.; le Bail-Collet, Y. Advances in dietary fibre characterisation. 2. Consumption, chemistry, physiology and measurement of resistant starch; implications for health and food labelling. Nutr. Res. Rev. 2003, 16, 143–161. [Google Scholar] [CrossRef] [PubMed]
  54. Ford, H.; Frost, G. Glycaemic index, appetite and body weight. Proc. Nutr. Soc. 2010, 69, 199–203. [Google Scholar] [CrossRef] [PubMed]
  55. Lennerz, B.S.; Alsop, D.C.; Holsen, L.M.; Stern, E.; Rojas, R.; Ebbeling, C.B.; Goldstein, J.M.; Ludwig, D.S. Effects of dietary glycemic index on brain regions related to reward and craving in men. Am. J. Clin. Nutr. 2013, 98, 641–647. [Google Scholar] [CrossRef] [PubMed]
  56. Sloth, B.; Astrup, A. Low glycemic index diets and body weight. Int. J. Obes. 2006, 30, S47–S51. [Google Scholar] [CrossRef]
  57. Niwano, Y.; Adachi, T.; Kashimura, J.; Sakata, T.; Sasaki, H.; Sekine, K.; Yamamoto, S.; Yonekubo, A.; Kimura, S. Is glycemic index of food a feasible predictor of appetite, hunger, and satiety? J. Nutr. Sci. Vitaminol. 2009, 55, 201–207. [Google Scholar] [CrossRef] [PubMed]
  58. Dansinger, M.L.; Tatsioni, A.; Wong, J.B.; Chung, M.; Balk, E.M. Meta-analysis: The effect of dietary counseling for weight loss. Ann. Intern. Med. 2007, 147, 41–50. [Google Scholar] [CrossRef] [PubMed]
  59. Woods, S.C.; Seeley, R.J.; Porte, D.; Schwartz, M.W. Signals that regulate food intake and energy homeostasis. Science 1998, 280, 1378–1383. [Google Scholar] [CrossRef] [PubMed]

