Article

Red and Processed Meat and Mortality in a Low Meat Intake Population

1
School of Public Health, Loma Linda University, Loma Linda, CA 92354, USA
2
College of Applied Medical Sciences, King Khalid University, Abha 61421, Saudi Arabia
3
School of Medicine, Loma Linda University, Loma Linda, CA 92354, USA
*
Author to whom correspondence should be addressed.
Nutrients 2019, 11(3), 622; https://doi.org/10.3390/nu11030622
Submission received: 19 February 2019 / Revised: 6 March 2019 / Accepted: 8 March 2019 / Published: 14 March 2019

Abstract

:
Associations of low-to-moderate consumption of red and processed meat with mortality would add to the evidence of possible adverse effects of these common foods. This study aims to investigate the association of red and processed meat intake with mortality. The Adventist Health Study-2 (AHS-2) is a prospective cohort study of ~96,000 Seventh-day Adventist men and women recruited in the US and Canada between 2002 and 2007. The final analytic sample after exclusions was 72,149. Cox proportional hazards regression was used and hazard ratios (HR) and confidence intervals (CI) were obtained. Diet was assessed by a validated quantitative food frequency questionnaire (FFQ), calibrated using six 24-h dietary recalls. Mortality outcome data were obtained from the National Death Index. During a mean follow-up of 11.8 years, there were 7961 total deaths, of which 2598 were Cardiovascular diseases (CVD) deaths and 1873 were cancer deaths. Unprocessed red meat was associated with risk of all-cause mortality (HR: 1.18; 95% CI: 1.07–1.31) and CVD mortality (HR: 1.26; 95% CI: 1.05–1.50). Processed meat alone was not significantly associated with risk of mortality. The combined intake of red and processed meat was associated with all-cause mortality (HR: 1.23; 95% CI: 1.11–1.36) and CVD mortality (HR: 1.34; 95% CI: 1.12–1.60). These findings suggest moderately higher risks of all-cause and CVD mortality associated with red and processed meat in a low meat intake population.

1. Introduction

Over the last fifty years, global meat consumption has increased in both developing and developed countries [1]. In the United States, red meat is the most commonly consumed type of meat; and processed meat represents approximately one-fourth of the total meat consumed [2]. Red and/or processed meat have been associated with higher risk of coronary heart diseases (CHD) [3], diabetes [3,4,5], and some forms of cancer [6].
Several studies have found positive associations between intake of red and/or processed meat and total, cardiovascular disease (CVD), or cancer mortality [7,8,9]. These studies were mainly conducted in populations with moderate to high levels of meat intake, leaving unanswered whether zero consumption might correlate with even lower risk. The Adventist Health Study-2 (AHS-2) has a large number of vegetarians, with even most nonvegetarians having low intakes of red and processed meat [10]. Therefore, this analysis aims to investigate the association of such low intakes of red and processed meat with all-cause, CVD, and cancer mortality.

2. Materials and Methods

2.1. Study Population

The Adventist Health Study-2 (AHS-2) has been previously described in detail [11]. It is a prospective cohort study of approximately 96,000 Seventh-day Adventist men (~35%) and women (~65%) recruited from Adventist churches in the United States and Canada between 2002 and 2007. The cohort was formed primarily to study the possible effects of diet on cancer risk. The study was approved by the Institutional Review Board of Loma Linda University, and written informed consent was obtained from each participant upon enrolment.
For this analysis, exclusions were applied: missing dietary variables (n = 267); bad or inadequate data (e.g., unlikely response patterns including clearly invalid and identical responses to questions in a single page) (n = 507); missing more than 69 responses in the dietary section (2172); Canadian residents (n = 4393); extreme values of total energy (e.g., <500 kcal/day or >4500 kcal/day) (n = 2044); missing age, sex, or race (n = 538); age younger than 25 years at baseline (n = 8); and prevalent diseases related to mortality outcomes (i.e., prevalent cancers (except nonmelanoma skin cancers) or prevalent CVD defined as previous coronary bypass, angioplasty/stent, carotid artery surgery, myocardial infarction, stroke, or transient ischemic attack (TIA); or angina pectoris or congestive heart failure treated in the past 12 months) (n = 13,527). The analytic sample remaining was 72,149.

2.2. Assessment of Exposures

AHS-2 participants were requested at enrolment to complete a quantitative food frequency questionnaire (FFQ) consisting of more than 200 food items. Unprocessed red meat intake was reported as two items in the FFQ: “hamburger, ground beef (in casserole, meatballs, etc.)” and “beef or lamb as a main dish (e.g., steak, roast, stew, and pot pies)”. Processed meat was reported as: “processed beef, lamb (e.g., sausage, salami, and bologna)” and “processed chicken or turkey (e.g., turkey bologna, and turkey ham)”. Pork was classified as processed meat because most of the pork products listed in the single pork question in the FFQ were processed (i.e., “pork (bacon, sausage, ham, chops, ribs, and lunch-meat)”). The frequency of intake ranged from “never or rarely” to “2+ per day”, and serving sizes consisted of three levels (a half serving, standard serving (3–4 oz.), and one-and-a-half servings). The assigned weights for frequency and serving size in the FFQ used in AHS-2 have been previously described [12]. The intake in grams per day was calculated using the product-sum method [12,13].
The FFQ has been validated using six 24-h dietary recalls from a representative subset of the original AHS-2 cohort [12]. The deattenuated validity correlations for all types of meat, poultry, and fish combined were 0.86 and 0.85 for Whites and Blacks, respectively. Specifically, the validity correlations for unprocessed red and processed meats were 0.74 and 0.43 for Whites, respectively, and 0.68 and 0.36 for Blacks, respectively [12].

2.3. Ascertainment of Outcomes

Mortality outcome data were obtained from the National Death Index and were available through December 2015. International Statistical Classification of Diseases, 10th Revision (ICD-10) codes were used to determine the underlying cause of death. Individuals who died due to unnatural causes such as motor vehicle accidents and homicides (ICD-10 letters U, V, W, X, and Y) were censored at their time of death (i.e., they were not considered as cases in the analysis of all-cause mortality). ICD-10 codes for CVD mortality ranged from I00 to I78; cancer mortality ranged from C00 to C97.

2.4. Assessment of Covariates

Covariates were self-reported by questionnaire at enrolment, including information on demographics, medical history (including obstetrical and gynecological history), family medical history, socioeconomic factors, lifestyle factors, and diet. Covariates were selected a priori as possible confounders (see Tables footnotes for covariates details).

2.5. Statistical Analysis
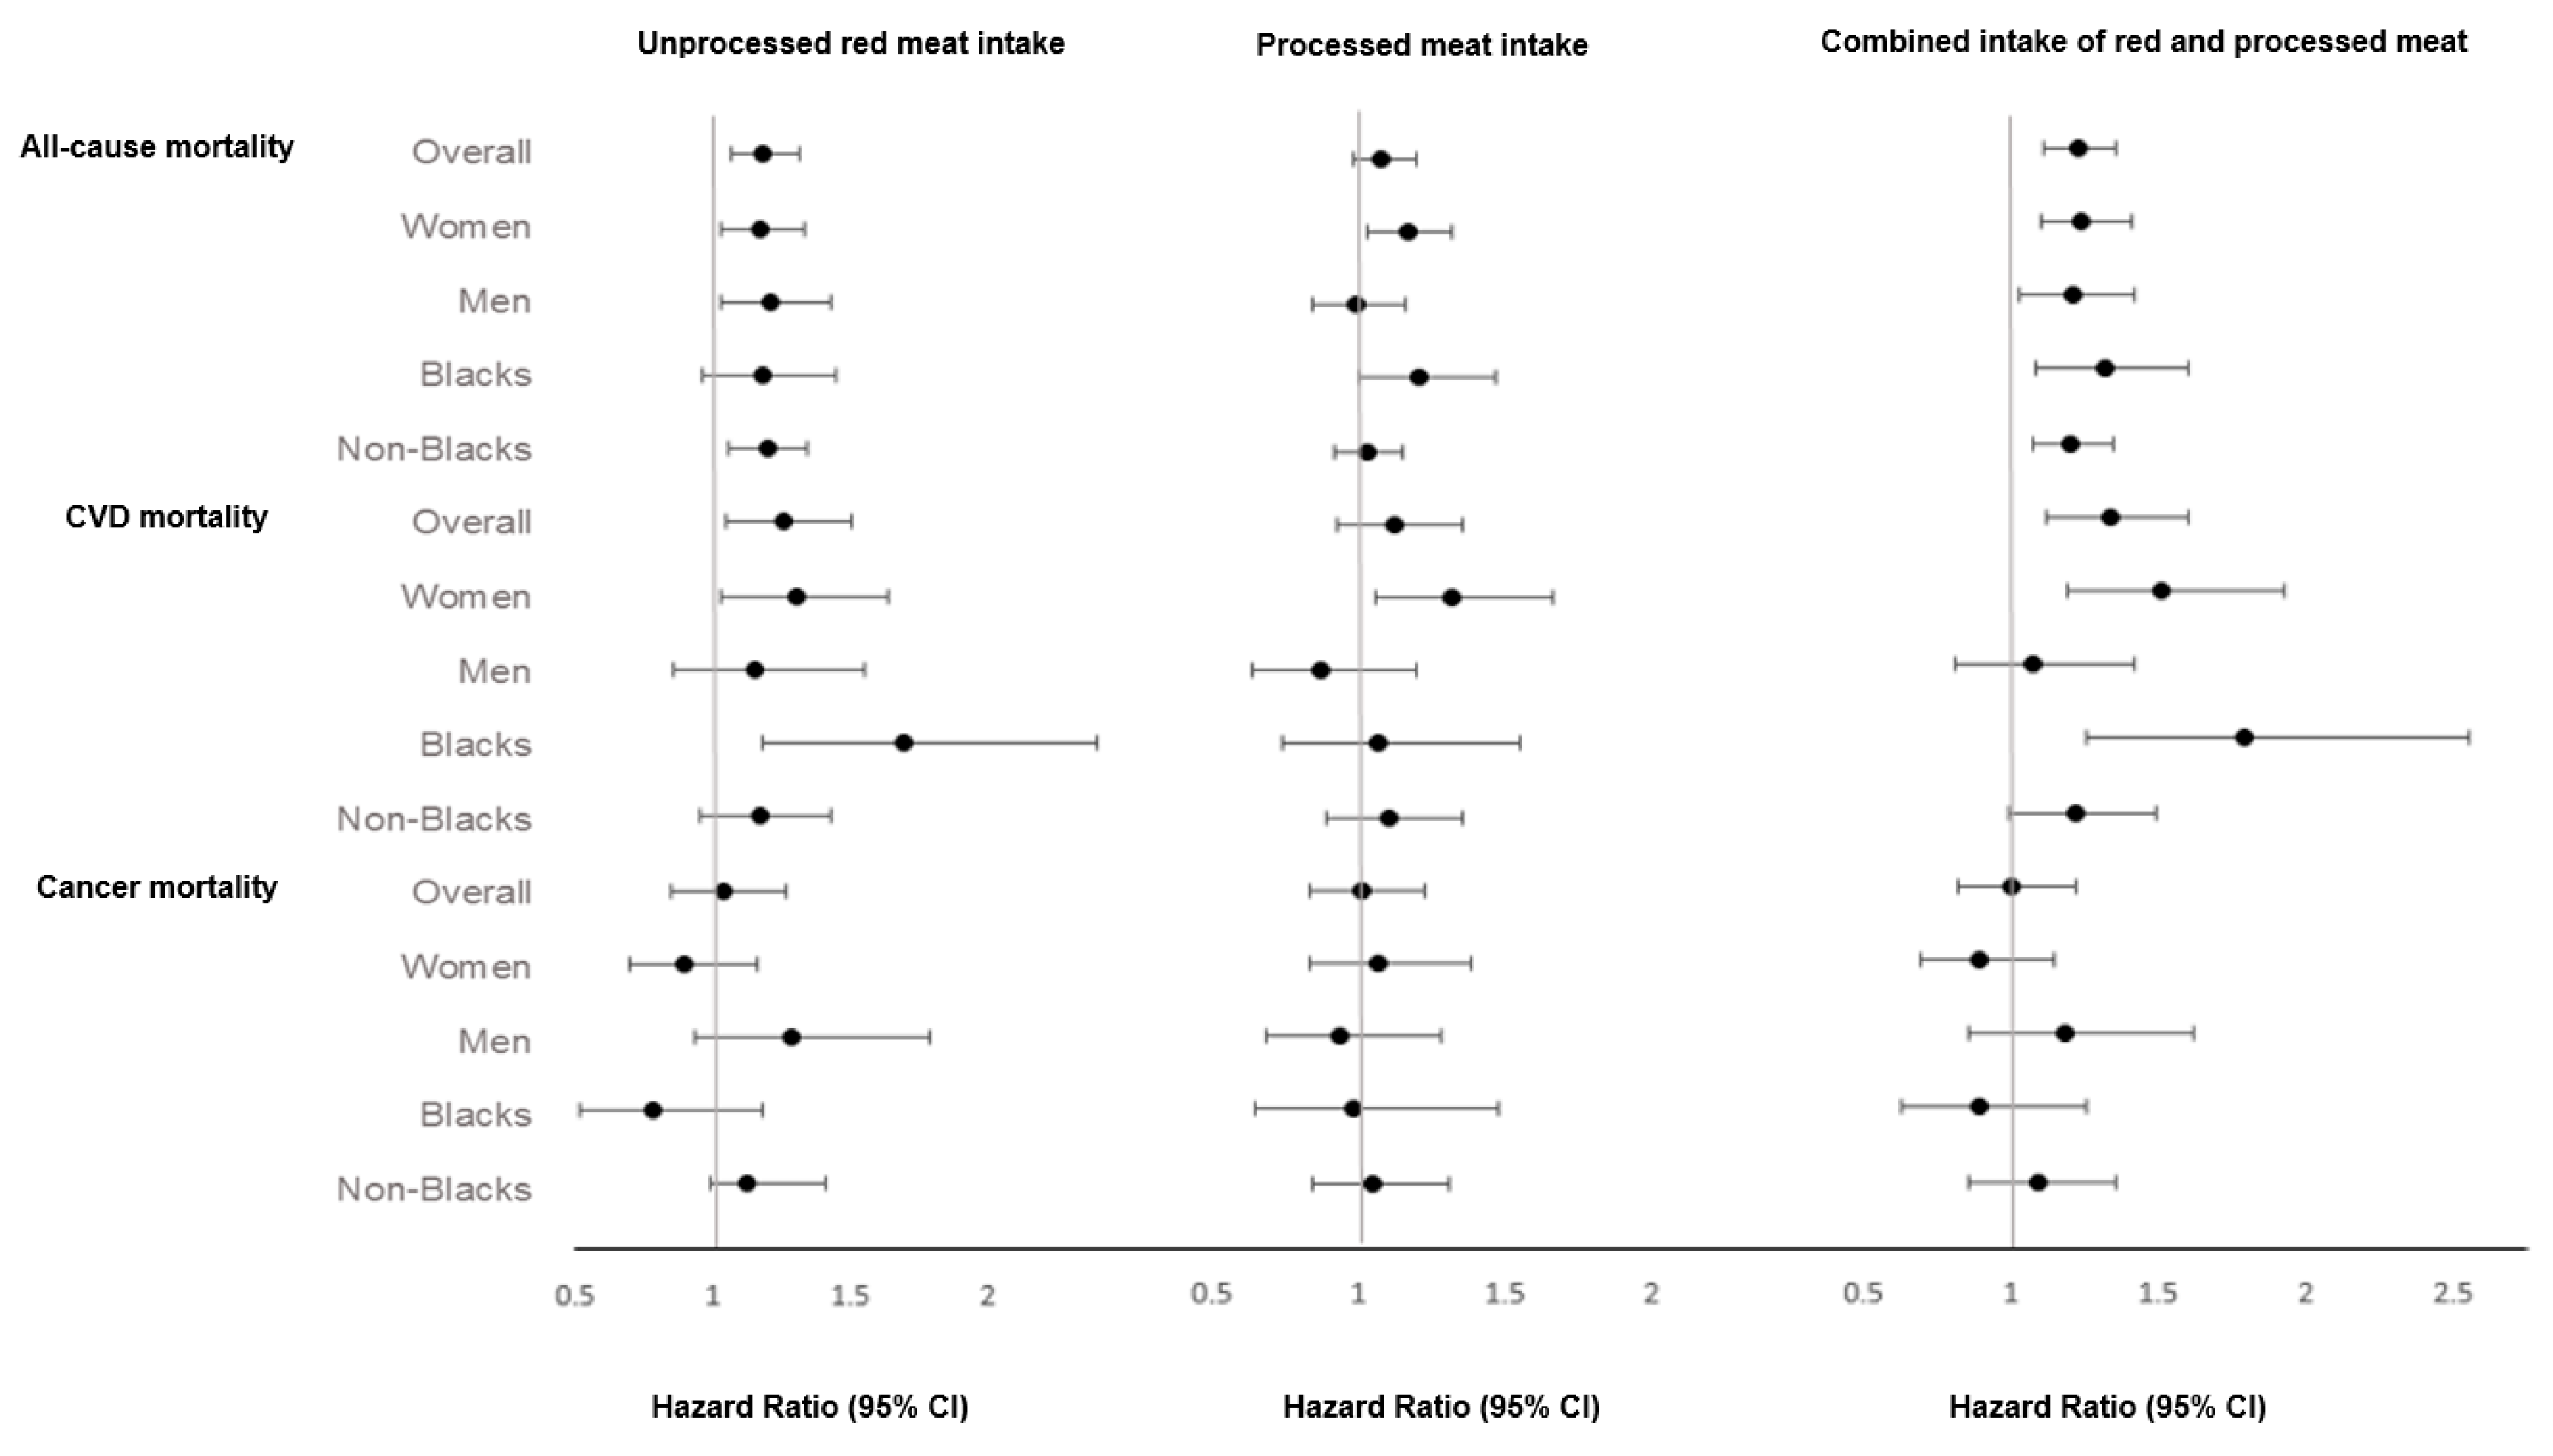
Time-dependent Cox-proportional hazards regression with attained age as the time variable and left truncation by age at study entry, controlling for potential confounding covariates, was used to assess the association between the consumption of red and processed meat and all-cause, CVD, and cancer mortality. We used multiple imputation, guided where possible, for missing data [14,15], in which the estimates were calculated from five imputed datasets, and then Rubin’s formula was applied to obtain the average estimates and corrected standard errors [16]. We analyzed intakes of unprocessed red and processed meats as continuous (log-transformed) variables measured in grams per day (g/day) comparing the 90th percentile of intake with zero-intake. To assess for possible common associations of unprocessed red and processed meats (which were highly correlated; R = 0.56), we combined both variables by summing the daily intakes from unprocessed red meat and processed meat together to create one single variable. Regression calibration of the exposures was used, where reported, to minimize the possible bias in the association estimates due to measurement error [17,18]. Only exposures of interest (red and processed meat) were calibrated, not all dietary covariates. In this procedure, a shortened version of the main questionnaire (limited to the dietary/FFQ portion), was administered to a 1000-subject (equal allocation for Whites and Blacks) subsample of the AHS-2 cohort. The subsample was approximately representative of the AHS-2 cohort in terms of gender, age, education, and vegetarian status [19]. Six 24-h dietary recalls were also collected from the subsample. From this data, a linear model was produced, regressing the intakes of red and processed meats from dietary recalls on the corresponding intakes from the food frequency questionnaire, controlling for the respective covariates present in each analytic model. The coefficients of the exposures of interest (red and processed meats) from the linear model were used to predict calibrated intake values from the intake values obtained from the FFQ of the original cohort. That is, predicted 24-h recall intake values produced by a linear model regressing intake values from the 24-h recalls against those from the FFQ, adjusted for the analytic covariates, are used in the analytic models to produce calibrated effect estimates. These calibrated intake variables were then used in the analytic models to produce calibrated hazard ratios. A 4000-round bootstrap was used to produce bias-corrected and accelerated (BCa) confidence intervals for these hazard ratios. We also conducted analyses using five categories of intake (i.e., a zero-intake group plus quartiles of consumers). Linear trends across the categories were tested by assigning the medians of intake in each quartile to all participants in that quartile and analyzing them as continuous variables. Also, we assessed the linearity of the relationship between the exposures and mortality outcomes using 4-knot restricted cubic spline regression. Dietary exposures and covariates were energy-adjusted using the residual method [20].
We tested for interaction of the exposures of interest with age, sex, and race. Other covariates were also tested for possible interactions with the exposures, and for possible interactions with each other where suspected. We separately conducted subgroup analyses by sex and race, in which we used sex- and race-specific ranges and values of intakes for the exposures. Further, we conducted separate analyses on those who reported they never smoked in order to address the effect of residual confounding by smoking in the original models. The proportional hazards assumption of the model was assessed using log(−log) plots, Schoenfeld residuals, and attained-age interaction terms; there was no violation. We also calculated population attributable risk comparing the 90th percentile of the combined intake of red and processed meat (~49 g/day) with zero-intake (assuming causality) [21]. SAS (version 9.4; SAS Institute, Inc., Cary, CA, USA) was used to perform the main analyses of the study. R (version 3.5.1 software; a Language and Environment for Statistical Computing; R Foundation for Statistical Computing, Vienna, Austria) [22] was used for multiple imputation (package “Hmisc”) [23], spline regression (package “rms”) [24], and regression calibration (package “boot”) [25].

3. Results

During a mean follow-up of 11.8 years, there were 7961 deaths, of which 2598 were due to CVD and 1873 were due to cancers. Compared with zero-intake subjects, those with the highest intake of unprocessed red meat were younger, less educated, and less physically active. They also had higher prevalence of current smoking, alcohol use, and slightly higher BMI. Regarding dietary characteristics, they tended to have lower intakes of cruciferous vegetables, fruits, whole grains, legumes, and nuts and seeds, and higher intakes of dairy, eggs, unprocessed poultry, and processed meat (Table 1).
Consumption of red and processed meat were associated with the risk of total, CVD, and cancer mortality among the total cohort when adjusted for age, sex, race and total energy intake (model 1, Table 2) when using all forms of the exposure (e.g., quartiles of intake versus zero-intake, p-trend, and both uncalibrated and calibrated 90th percentiles versus zero-intake). The associations were attenuated yet remained significant for total and CVD mortality, but not cancer mortality in the multivariable models without adjustment for other meats (model 2). In the multivariable model with mutual adjustment for other meats (model 3), participants in the 90th percentile intake of unprocessed red meat (compared with zero-intake) had a higher risk of all-cause mortality (uncalibrated, HR: 1.18; 95% CI: 1.07–1.31 and calibrated, HR: 1.51; 95% CI: 1.22–1.98; p < 0.001) and CVD mortality (uncalibrated, HR: 1.26; 95% CI: 1.05–1.50 and calibrated, HR: 1.64; 95% CI: 1.09–2.57; p = 0.017). Processed meat alone was not significantly associated with risk of mortality when adjusted for other meats. Red and processed meat (combined) were associated with higher risk of all-cause mortality (uncalibrated, HR: 1.23; 95% CI: 1.11–1.36 and calibrated, HR: 1.50; 95% CI: 1.26–1.83; p < 0.001) and CVD mortality (uncalibrated, HR: 1.34; 95% CI: 1.12–1.60 and calibrated, HR: 1.73; 95% CI: 1.27–2.51; p < 0.001) (Table 2).
Results from subgroups are presented as forest plots, where 90th percentiles versus zero-intake contrasts were used (Figure 1). Unprocessed red meat was significantly associated with risk of all-cause mortality among women (HR: 1.17; 95% CI: 1.03–1.33), men (HR: 1.21; 95% CI: 1.03–1.43), and non-Blacks (HR: 1.20; 95% CI: 1.06–1.34), but not among Blacks (HR: 1.18; 95% CI: 0.96–1.45); with CVD mortality among women (HR: 1.30; 95% CI: 1.03–1.64), but not men (HR: 1.15; 95% CI: 0.93–1.79), and among Blacks (HR: 1.69; 95% CI: 1.18–2.40), but not non-Blacks (HR: 1.17; 95% CI: 0.95–1.43). Processed meat was associated with all-cause mortality among women (HR: 1.17; 95% CI: 1.03–1.32), but not men (HR: 0.99; 95% CI: 0.84–1.16), and among Blacks (HR: 1.21; 95% CI: 1.00–1.47), but not non-Blacks (HR: 1.03; 95% CI: 0.92–1.15); with CVD mortality among women (HR: 1.32; 95% CI: 1.06–1.66), but not among men (HR: 0.87; 95% CI: 0.64–1.20), Blacks (HR: 1.07; 95% CI: 0.74–1.55), nor non-Blacks (HR: 1.10; 95% CI: 0.89–1.36). The combined intake of red and processed meat was associated with a higher risk of all-cause mortality among all subgroups and CVD mortality among women and Blacks (Figure 1). Complete results from subgroup analyses are available as online supplemental materials (Supplementary Tables S1–S4).
We also evaluated the linear relationships of these exposures with all-cause, CVD, and cancer mortality using 4-knot restricted cubic splines (Supplementary Figure S1). Unprocessed red meat intake and combined intake of red and processed meat appeared to have more clearly linear relationships with mortality outcomes as compared to processed meat intake.
To explore the effects of residual confounding by smoking, we conducted separate analyses among participants who had never smoked (Supplementary Table S5). We report results for the 90th percentiles versus zero-intake: Unprocessed red meat intake was associated with all-cause mortality (HR: 1.16; 95% CI: 1.02–1.31) and CVD mortality (HR: 1.26; 95% CI: 1.02–1.56). Processed meat intake was associated with all-cause mortality (HR: 1.13; 95% CI: 1.00–1.26), but not with CVD mortality (HR: 1.15; 95% CI: 0.94–1.41). Combined intake of red and processed meat was associated with higher risk of all-cause ((HR: 1.22; 95% CI: 1.08–1.37) and CVD (HR: 1.34; 95% CI: 1.08–1.65) mortality among never smokers.
We calculated population attributable risk, in which we compared the 90th percentile of the combined intake of red and processed meat (~49 g/day) with zero-intake. If the relationships were causal, approximately 6.3% and 9% of total and CVD deaths, respectively, could have been prevented if those in the 90th percentile of combined intake of red and processed meat had abstained.

4. Discussion

In the Adventist Health Study-2 (AHS-2), we found relatively low levels of consumption of red and processed meat to be positively associated with all-cause and CVD mortality in multivariable-adjusted models, compared to zero-intake. The associations appeared to be linear (i.e., exhibiting a dose–response relationship) and of moderate strength. Stronger associations—though less precise—were observed when the exposures were calibrated suggesting that measurement error biased the uncalibrated results towards the null.
Other studies from the U.S. and Europe have found positive associations between red or processed meat consumption and all-cause and CVD mortality [7,8,9,26,27,28]. In the U.S., three large cohort studies—the Health Professionals Follow-Up Study (HPFS), the Nurses’ Health Study (NHS), and the American Association of Retired Persons (NIH-AARP) study—found associations of red and processed meat intake with all-cause, CVD, and cancer mortality among both men and women [7,8,26]. The relative risks of all-cause and CVD mortality in these studies ranged from 14 to 50% for red meat, and from 9 to 72% for processed meat. From the European Prospective Investigation into Cancer and Nutrition (EPIC) study, Rohrmann et al. found a 14% higher risk of all-cause mortality associated with red meat intake, and found 44% and 72% higher risks of all-cause and CVD mortality, respectively, associated with processed meat [9]. Furthermore, Bellavia et al., in Sweden, found higher risks of all-cause and CVD mortality by 21% and 29%, respectively, associated with red meat consumption [27]. Recently, processed meat was associated with 21% and 26% higher (relative) risks of overall and CVD mortality, respectively, in The Netherlands Cohort Study [28]. These findings appear to be compatible with ours, though they examine higher intake ranges. Meta-analyses have also found positive associations of red and/or processed meat with all-cause and/or CVD mortality [29,30,31]. In contrast, studies in Asia have generally not found associations between red meat intake and mortality [32] (except for Takata et al., who found a 18% higher risk of all-cause mortality among men) [33].
Regarding cancer mortality, the three cohorts in the US have found significant associations, in contrast to our null findings. This could be due to insufficient dietary adjustments in those studies (we adjusted for multiple dietary variables including dairy, whole grains and legumes, which they have been associated with reduced risk of some cancers) [34,35,36]; low and infrequent meat consumption in our cohort (particularly processed meat that has been linked to cancer risk, especially in populations with higher intakes) [37,38,39]; or the relative power limitations of our sample from this low cancer incidence population [40]. Lack of association for cancer mortality does not necessarily indicate no relationship to cancer incidence; for example, vegetarian dietary patterns (which are low in red and processed meat) were not at lower risk of cancer mortality compared with nonvegetarians [41], although they have been linked to lower overall cancer incidence in this cohort [42].
Previously in AHS–2, Orlich et al. found that vegetarians had a 12% reduced risk of all-cause mortality as compared to nonvegetarians [41]; this could be due to lower intake of animal foods or higher intake of plant foods among vegetarians. In our analyses, we were able to control for foods commonly consumed by vegetarians such as legumes, whole grains, and nuts and seeds [10], yet we found that highest intakes of red and processed meat were associated with an 18–51% higher risk of all-cause mortality as compared to zero-intake participants. Such findings suggest a possible effect of red and processed meat in increasing mortality after controlling for plant foods.
Some possible causal mechanisms have been proposed for the link between red and processed meat consumption and mortality. Red meat is rich in saturated fatty acids, which have been associated with dyslipidemia, particularly elevated low-density lipoprotein (LDL) [43]. High LDL levels are associated with a higher risk of atherosclerosis [44] and acute myocardial infarction [45]. Furthermore, red meat intake has been associated with increased levels of inflammatory and oxidative stress markers such as C-reactive protein (CRP) and gamma-glutamyl transferase (GGT) that have been associated with cardiovascular diseases [46]. Heme iron in red and processed red meats has been associated with higher risk of type 2 diabetes [5] and cardiovascular diseases [47,48] including myocardial infarction [49] and coronary heart disease [50]. Also, red meat is rich in L-carnitine, and recent research found that L-carnitine metabolism by intestinal microbiota elevates the level of a metabolite known as trimethylamine-N-oxide (TMAO) [51], which was linked with a higher risk of cardiovascular diseases, particularly atherosclerosis [51,52]. Additionally, large amounts of sodium are used in some meat processing [53]; high intakes of sodium are associated with elevated blood pressure, a major risk factor for CVD [54,55,56].
This study fills an important gap in the literature, in that we were able to evaluate the association of red and processed meat at low consumption levels compared to zero-intake subjects, whereas other studies have only compared risk at higher intake levels. For example, the 90th percentile of unprocessed red meat intake in our population was 46.5 g/day, which is approximately equivalent to a half serving per day—meat serving size ranges from 3 to 4 ounces (85–113 g)—in the FFQ of AHS-2. However, in HPFS and NHS, men who consumed 1.46 serving/day were compared with those who consumed 0.17 serving/day, and women who consumed 1.64 serving/day were compared with those who consumed 0.37 serving/day [7]. In NIH-AARP, the highest intakes ranged from 65.9 to 68.1 g/1000 kcal and were compared with approximately 9 g/1000 kcal as a reference group [8]. These ranges of intakes are considerably higher than those in our population. No other studies compare low-to-moderate intake with zero-intake. Another strength of this study is the use of regression calibration to minimize the effects of dietary measurement error. Although regression calibration was only used for the exposures of interest, and not for other dietary covariates, it provided less biased association estimates—though also less precise—compared to the uncalibrated results. Another strength is the relatively low prevalence of smoking and alcohol use, reducing the potential residual confounding. To further minimize the effect of confounding by smoking, we separately explored the associations among never-smoked participants, and these findings were consistent with those from the main analyses. Finally, we included detailed adjustments for multiple confounders including lifestyle factors and food groups to minimize the effect of confounding. Intakes of red and processed meat have been associated with several unfavorable lifestyle and dietary confounders including obesity, smoking, physical inactivity, and low intakes of fruits and vegetable [57]. Besides adjusting for these factors, we additionally adjusted for multiple dietary factors such as dairy, legumes, whole grains, and nuts and seeds.
An inherent limitation in this type of study is measurement error in dietary assessment. In particular, processed meat measurement by FFQ showed low validity compared to multiple recalls. This low validity correlation for processed meat may be due to the infrequent consumption of processed meat; infrequently consumed foods may be missed by dietary recalls. However, validity for unprocessed red meat was relatively high. Another limitation is the single dietary assessment, whereas dietary habits may have changed. However, a majority of subjects in the AHS-2, especially middle-aged and elderly, tend to have fairly stable dietary intakes over time [58]. Finally, the possibility of unmeasured or residual confounding remains, despite our efforts to adjust for multiple potential confounders.

5. Conclusions

In conclusion, we found higher all-cause and CVD mortality to be associated with relatively low intake of red and processed meat (and of unprocessed red meat in particular), compared to zero intake. While caution is appropriate in inferring causation from observational data, these results suggest possible adverse effects of red and processed meat, even with low to moderate levels of intake.

Supplementary Materials

The following are available online at https://www.mdpi.com/2072-6643/11/3/622/s1. Table S1: The association between red and processed meat intake and all-cause, cardiovascular and cancer mortality among women, Table S2: The association between red and processed meat intake and all-cause, cardiovascular and cancer mortality among men, Table S3: The association between red and processed meat intake and all-cause, cardiovascular and cancer mortality among Blacks, Table S4: The association between red and processed meat intake and all-cause, cardiovascular and cancer mortality among non-Blacks, Table S5: The association between red and processed meat intake and all-cause, cardiovascular, and cancer mortality among participants who never smoked, Figure S1: Dose–response relationships of red and processed meats with the risk of all-cause, CVD, and cancer mortality in the AHS-2 cohort.

Author Contributions

Conceptualization, S.M.A., G.E.F., J.S., R.K., and M.J.O.; Data Curation, A.M. and J.I.L.; Formal Analysis, S.M.A., D.S., and A.M.; Funding Acquisition, G.E.F.; Methodology, S.M.A., G.E.F., D.S., and M.J.O.; Project Administration, G.E.F.; Supervision, M.J.O.; Writing—Original Draft, S.M.A.; Writing—Review.

Funding

The original study was funded by the National Cancer Institute (NCI), grant 1U01CA152939 (G.E.F.).

Acknowledgments

The authors thank Lars Sveen, Keiji Oda, and Larry Beeson for their support with National Death Index matching. We also thank Patti Herring, Synnove Knutsen, Terry Butler, Larry Beeson, and Hanni Bennett for their help during the cohort formation and recruitment.

Conflicts of Interest

The authors declare no conflicts of interest. The funder had no role in the design of the study; in the collection, analyses, or interpretation of data; in the writing of the manuscript, or in the decision to publish the results.

References

  1. Bruinsma, J. World Agriculture: Towards 2015/2030: An FAO Perspective; Earthscan: London, UK, 2003. [Google Scholar]
  2. Daniel, C.R.; Cross, A.J.; Koebnick, C.; Sinha, R. Trends in meat consumption in the USA. Public Health Nutr. 2011, 14, 575–583. [Google Scholar] [CrossRef] [PubMed]
  3. Micha, R.; Wallace, S.K.; Mozaffarian, D. Red and processed meat consumption and risk of incident coronary heart disease, stroke, and diabetes mellitus: A systematic review and meta-analysis. Circulation 2010, 121, 2271–2283. [Google Scholar] [CrossRef] [PubMed]
  4. Pan, A.; Sun, Q.; Bernstein, A.M.; Schulze, M.B.; Manson, J.E.; Willett, W.C.; Hu, F.B. Red meat consumption and risk of type 2 diabetes: 3 cohorts of US adults and an updated meta-analysis. Am. J. Clin. Nutr. 2011, 94, 1088–1096. [Google Scholar] [CrossRef]
  5. Yuan, J.-M.; Talaei, M.; Wang, Y.-L.; Pan, A.; Koh, W.-P. Meat, Dietary Heme Iron, and Risk of Type 2 Diabetes Mellitus: The Singapore Chinese Health Study. Am. J. Epidemiol. 2017, 186, 824–833. [Google Scholar] [CrossRef]
  6. Cross, A.J.; Leitzmann, M.F.; Gail, M.H.; Hollenbeck, A.R.; Schatzkin, A.; Sinha, R. A prospective study of red and processed meat intake in relation to cancer risk. PLoS Med. 2007, 4, e325. [Google Scholar] [CrossRef] [PubMed]
  7. Pan, A.; Sun, Q.; Bernstein, A.M.; Schulze, M.B.; Manson, J.E.; Stampfer, M.J.; Willett, W.C.; Hu, F.B. Red meat consumption and mortality: Results from 2 prospective cohort studies. Arch. Intern. Med. 2012, 172, 555–563. [Google Scholar] [CrossRef]
  8. Sinha, R.; Cross, A.J.; Graubard, B.I.; Leitzmann, M.F.; Schatzkin, A. Meat intake and mortality: A prospective study of over half a million people. Arch. Intern. Med. 2009, 169, 562–571. [Google Scholar] [CrossRef] [PubMed]
  9. Rohrmann, S.; Overvad, K.; Bueno-de-Mesquita, H.B.; Jakobsen, M.U.; Egeberg, R.; Tjonneland, A.; Nailler, L.; Boutron-Ruault, M.C.; Clavel-Chapelon, F.; Krogh, V.; et al. Meat consumption and mortality—Results from the European Prospective Investigation into Cancer and Nutrition. BMC Med. 2013, 11, 63. [Google Scholar] [CrossRef]
  10. Orlich, M.J.; Jaceldo-Siegl, K.; Sabaté, J.; Fan, J.; Singh, P.N.; Fraser, G.E. Patterns of food consumption among vegetarians and non-vegetarians. Br. J. Nutr. 2014, 112, 1644–1653. [Google Scholar] [CrossRef] [PubMed] [Green Version]
  11. Butler, T.L.; Fraser, G.E.; Beeson, W.L.; Knutsen, S.F.; Herring, R.P.; Chan, J.; Sabate, J.; Montgomery, S.; Haddad, E.; Preston-Martin, S.; et al. Cohort profile: The Adventist Health Study-2 (AHS-2). Int. J. Epidemiol. 2008, 37, 260–265. [Google Scholar] [CrossRef]
  12. Jaceldo-Siegl, K.; Fan, J.; Sabate, J.; Knutsen, S.F.; Haddad, E.; Beeson, W.L.; Herring, R.P.; Butler, T.L.; Bennett, H.; Fraser, G.E. Race-specific validation of food intake obtained from a comprehensive FFQ: The Adventist Health Study-2. Public Health Nutr. 2011, 14, 1988–1997. [Google Scholar] [CrossRef]
  13. Willett, W. Nutritional Epidemiology; Oxford University Press: Oxford, UK, 2012. [Google Scholar]
  14. Fraser, G.; Yan, R. Guided multiple imputation of missing data: Using a subsample to strengthen the missing-at-random assumption. Epidemiology 2007, 18, 246–252. [Google Scholar] [CrossRef]
  15. Fraser, G.E.; Yan, R.; Butler, T.L.; Jaceldo-Siegl, K.; Beeson, W.L.; Chan, J. Missing data in a long food frequency questionnaire: Are imputed zeroes correct? Epidemiology 2009, 20, 289–294. [Google Scholar] [CrossRef] [PubMed]
  16. Rubin, D.B. Inference and missing data. Biometrika 1976, 63, 581–592. [Google Scholar] [CrossRef]
  17. Fraser, G.E.; Stram, D.O. Regression calibration in studies with correlated variables measured with error. Am. J. Epidemiol. 2001, 154, 836–844. [Google Scholar] [CrossRef] [PubMed]
  18. Fraser, G.E.; Stram, D.O. Regression calibration when foods (measured with error) are the variables of interest: Markedly non-Gaussian data with many zeroes. Am. J. Epidemiol. 2012, 175, 325–331. [Google Scholar] [CrossRef] [PubMed]
  19. Jaceldo-Siegl, K.; Knutsen, S.F.; Sabate, J.; Beeson, W.L.; Chan, J.; Herring, R.P.; Butler, T.L.; Haddad, E.; Bennett, H.; Montgomery, S.; et al. Validation of nutrient intake using an FFQ and repeated 24 h recalls in black and white subjects of the Adventist Health Study-2 (AHS-2). Public Health Nutr. 2010, 13, 812–819. [Google Scholar] [CrossRef] [PubMed]
  20. Willett, W.C.; Howe, G.R.; Kushi, L.H. Adjustment for total energy intake in epidemiologic studies. Am. J. Clin. Nutr. 1997, 65, 1220S–1228S. [Google Scholar] [CrossRef] [PubMed] [Green Version]
  21. Spiegelman, D.; Hertzmark, E.; Wand, H.C. Point and interval estimates of partial population attributable risks in cohort studies: Examples and software. Cancer Causes Control. 2007, 18, 571–579. [Google Scholar] [CrossRef]
  22. Field, A.; Miles, J.; Field, Z. Discovering Statistics Using R; Sage Publications: Thousand Oaks, CA, USA, 2012. [Google Scholar]
  23. Hmisc: Harrell Miscellaneous. R Package Version 4.1-1. 2018. Available online: https://cran.r-project.org/package=Hmisc (accessed on 12 September 2018).
  24. Regression Modeling Strategies. R Package Version 5.1-2. 2018. Available online: https://CRAN.R-project.org/package=rms (accessed on 6 November 2018).
  25. Boot: Bootstrap R (S-Plus) Functions. R package version 1.3-20. 2017. Available online: : https://CRAN.R-project.org/package=boot (accessed on 27 September 2018).
  26. Etemadi, A.; Sinha, R.; Ward, M.H.; Graubard, B.I.; Inoue-Choi, M.; Dawsey, S.M.; Abnet, C.C. Mortality from different causes associated with meat, heme iron, nitrates, and nitrites in the NIH-AARP Diet and Health Study: Population based cohort study. BMJ 2017, 357, j1957. [Google Scholar] [CrossRef]
  27. Bellavia, A.; Stilling, F.; Wolk, A. High red meat intake and all-cause cardiovascular and cancer mortality: Is the risk modified by fruit and vegetable intake? Am. J. Clin. Nutr. 2016, 104, 1137–1143. [Google Scholar] [CrossRef] [PubMed]
  28. Van den Brandt, P.A. Red meat, processed meat, and other dietary protein sources and risk of overall and cause-specific mortality in The Netherlands Cohort Study. Eur. J. Epidemiol. 2019, 1–19. [Google Scholar] [CrossRef] [PubMed]
  29. Abete, I.; Romaguera, D.; Vieira, A.R.; de Munain, A.L.; Norat, T. Association between total, processed, red and white meat consumption and all-cause, CVD and IHD mortality: A meta-analysis of cohort studies. Br. J. Nutr. 2014, 112, 762–775. [Google Scholar] [CrossRef] [PubMed]
  30. Larsson, S.C.; Orsini, N. Red meat and processed meat consumption and all-cause mortality: A meta-analysis. Am. J. Epidemiol. 2013, 179, 282–289. [Google Scholar] [CrossRef] [PubMed]
  31. Wang, X.; Lin, X.; Ouyang, Y.Y.; Liu, J.; Zhao, G.; Pan, A.; Hu, F.B. Red and processed meat consumption and mortality: Dose-response meta-analysis of prospective cohort studies. Public Health Nutr. 2016, 19, 893–905. [Google Scholar] [CrossRef]
  32. Lee, J.E.; McLerran, D.F.; Rolland, B.; Chen, Y.; Grant, E.J.; Vedanthan, R.; Inoue, M.; Tsugane, S.; Gao, Y.T.; Tsuji, I.; et al. Meat intake and cause-specific mortality: A pooled analysis of Asian prospective cohort studies. Am. J. Clin. Nutr. 2013, 98, 1032–1041. [Google Scholar] [CrossRef]
  33. Takata, Y.; Shu, X.O.; Gao, Y.T.; Li, H.; Zhang, X.; Gao, J.; Cai, H.; Yang, G.; Xiang, Y.B.; Zheng, W. Red meat and poultry intakes and risk of total and cause-specific mortality: Results from cohort studies of Chinese adults in Shanghai. PLoS ONE 2013, 8, e56963. [Google Scholar] [CrossRef]
  34. Aune, D.; Keum, N.; Giovannucci, E.; Fadnes, L.T.; Boffetta, P.; Greenwood, D.C.; Tonstad, S.; Vatten, L.J.; Riboli, E.; Norat, T. Whole grain consumption and risk of cardiovascular disease, cancer, and all cause and cause specific mortality: Systematic review and dose-response meta-analysis of prospective studies. BMJ 2016, 353, i2716. [Google Scholar] [CrossRef]
  35. Singh, P.N.; Fraser, G.E. Dietary risk factors for colon cancer in a low-risk population. Am. J. Epidemiol. 1998, 148, 761–774. [Google Scholar] [CrossRef]
  36. Zhu, B.; Sun, Y.; Qi, L.; Zhong, R.; Miao, X. Dietary legume consumption reduces risk of colorectal cancer: Evidence from a meta-analysis of cohort studies. Sci. Rep. 2015, 5, 8797. [Google Scholar] [CrossRef]
  37. Chan, D.S.; Lau, R.; Aune, D.; Vieira, R.; Greenwood, D.C.; Kampman, E.; Norat, T. Red and processed meat and colorectal cancer incidence: Meta-analysis of prospective studies. PLoS ONE 2011, 6, e20456. [Google Scholar] [CrossRef]
  38. Larsson, S.; Wolk, A. Red and processed meat consumption and risk of pancreatic cancer: Meta-analysis of prospective studies. Br. J. Cancer 2012, 106, 603. [Google Scholar] [CrossRef] [PubMed]
  39. Zhu, H.; Yang, X.; Zhang, C.; Zhu, C.; Tao, G.; Zhao, L.; Tang, S.; Shu, Z.; Cai, J.; Dai, S. Red and processed meat intake is associated with higher gastric cancer risk: A meta-analysis of epidemiological observational studies. PLoS ONE 2013, 8, e70955. [Google Scholar] [CrossRef]
  40. Fraser, G.E. Diet., life Expectancy, and Chronic Disease: Studies of Seventh-Day Adventists and Other Vegetarians; Oxford University Press: Oxford, UK, 2003. [Google Scholar]
  41. Orlich, M.J.; Singh, P.N.; Sabate, J.; Jaceldo-Siegl, K.; Fan, J.; Knutsen, S.; Beeson, W.L.; Fraser, G.E. Vegetarian dietary patterns and mortality in Adventist Health Study 2. JAMA Intern. Med. 2013, 173, 1230–1238. [Google Scholar] [CrossRef] [PubMed]
  42. Tantamango-Bartley, Y.; Jaceldo-Siegl, K.; Fan, J.; Fraser, G. Vegetarian diets and the incidence of cancer in a low-risk population. Cancer Epidemiol. Biomark. Prev. 2013, 22, 286–294. [Google Scholar] [CrossRef]
  43. American Heart Association. Saturated Fat. Available online: http://www.heart.org/en/healthy-living/healthy-eating/eat-smart/fats/saturated-fats (accessed on 14 October 2018).
  44. Mitra, S.; Goyal, T.; Mehta, J.L. Oxidized LDL, LOX-1 and atherosclerosis. Cardiovasc. Drugs Ther. 2011, 25, 419. [Google Scholar] [CrossRef] [PubMed]
  45. Madssen, E.; Laugsand, L.E.; Wiseth, R.; Morkedal, B.; Platou, C.; Vatten, L.; Janszky, I. Risk of acute myocardial infarction: Dyslipidemia more detrimental for men than women. Epidemiology 2013, 24, 637–642. [Google Scholar] [CrossRef]
  46. Montonen, J.; Boeing, H.; Fritsche, A.; Schleicher, E.; Joost, H.-G.; Schulze, M.B.; Steffen, A.; Pischon, T. Consumption of red meat and whole-grain bread in relation to biomarkers of obesity, inflammation, glucose metabolism and oxidative stress. Eur. J. Nutr. 2013, 52, 337–345. [Google Scholar] [CrossRef]
  47. Fang, X.; An, P.; Wang, H.; Wang, X.; Shen, X.; Li, X.; Min, J.; Liu, S.; Wang, F. Dietary intake of heme iron and risk of cardiovascular disease: A dose–response meta-analysis of prospective cohort studies. Nutr. Metab. Cardiovasc. Dis. 2015, 25, 24–35. [Google Scholar] [CrossRef]
  48. De Oliveira Otto, M.C.; Alonso, A.; Lee, D.-H.; Delclos, G.L.; Bertoni, A.G.; Jiang, R.; Lima, J.A.; Symanski, E.; Jacobs, D.R., Jr.; Nettleton, J.A. Dietary intakes of zinc and heme iron from red meat, but not from other sources, are associated with greater risk of metabolic syndrome and cardiovascular disease–3. J. Nutr. 2012, 142, 526–533. [Google Scholar] [CrossRef]
  49. Klipstein-Grobusch, K.; Grobbee, D.E.; den Breeijen, J.H.; Boeing, H.; Hofman, A.; Witteman, J.C. Dietary iron and risk of myocardial infarction in the Rotterdam Study. Am. J. Epidemiol. 1999, 149, 421–428. [Google Scholar] [CrossRef] [PubMed]
  50. Yang, W.; Li, B.; Dong, X.; Zhang, X.-Q.; Zeng, Y.; Zhou, J.-L.; Tang, Y.-H.; Xu, J.-J. Is heme iron intake associated with risk of coronary heart disease? A meta-analysis of prospective studies. Eur. J. Nutr. 2014, 53, 395–400. [Google Scholar] [CrossRef]
  51. Koeth, R.A.; Wang, Z.; Levison, B.S.; Buffa, J.A.; Org, E.; Sheehy, B.T.; Britt, E.B.; Fu, X.; Wu, Y.; Li, L.; et al. Intestinal microbiota metabolism of L-carnitine, a nutrient in red meat, promotes atherosclerosis. Nat. Med. 2013, 19, 576–585. [Google Scholar] [CrossRef] [PubMed] [Green Version]
  52. Wang, Z.; Klipfell, E.; Bennett, B.J.; Koeth, R.; Levison, B.S.; Dugar, B.; Feldstein, A.E.; Britt, E.B.; Fu, X.; Chung, Y.M.; et al. Gut flora metabolism of phosphatidylcholine promotes cardiovascular disease. Nature 2011, 472, 57–63. [Google Scholar] [CrossRef] [PubMed] [Green Version]
  53. Scientific Advisory Committee on Nutrition. Salt and Health. Available online: https://assets.publishing.service.gov.uk/government/uploads/system/uploads/attachment_data/file/338782/SACN_Salt_and_Health_report.pdf (accessed on 14 October 2018).
  54. He, F.J.; Li, J.; MacGregor, G.A. Effect of longer term modest salt reduction on blood pressure: Cochrane systematic review and meta-analysis of randomised trials. BMJ 2013, 346, f1325. [Google Scholar] [CrossRef] [PubMed]
  55. Smith-Spangler, C.M.; Juusola, J.L.; Enns, E.A.; Owens, D.K.; Garber, A.M. Population strategies to decrease sodium intake and the burden of cardiovascular disease: A cost-effectiveness analysis. Ann. Intern. Med. 2010, 152, 481–487. [Google Scholar] [CrossRef]
  56. Bibbins-Domingo, K.; Chertow, G.M.; Coxson, P.G.; Moran, A.; Lightwood, J.M.; Pletcher, M.J.; Goldman, L. Projected effect of dietary salt reductions on future cardiovascular disease. N. Engl. J. Med. 2010, 362, 590–599. [Google Scholar] [CrossRef]
  57. Grosso, G.; Micek, A.; Godos, J.; Pajak, A.; Sciacca, S.; Galvano, F.; Boffetta, P. Health risk factors associated with meat, fruit and vegetable consumption in cohort studies: A comprehensive meta-analysis. PLoS ONE 2017, 12, e0183787. [Google Scholar] [CrossRef]
  58. Martins, M.C.; Jaceldo-Siegl, K.; Orlich, M.; Fan, J.; Mashchak, A.; Fraser, G.E. A New Approach to Assess Lifetime Dietary Patterns Finds Lower Consumption of Animal Foods with Aging in a Longitudinal Analysis of a Health-Oriented Adventist Population. Nutrients 2017, 9, 1118. [Google Scholar] [CrossRef]
Figure 1. Subgroup analysis by sex and race of the association between red meat and processed meat intake and all-cause, cardiovascular, and cancer mortality. Multivariable hazard ratios for mortality comparing the 90th percentiles (sex- and race-specific values) of unprocessed red and processed meats intakes and both combined with zero-intake (90th vs. 0) were adjusted for age; sex (not in sex subgroup analysis); race (not in race subgroup analysis); marital status; education level; multivitamin use; smoking; alcohol use; exercise; sleeping hours; body mass index (BMI); diabetes mellitus; hypertension; hypercholesterolemia; aspirin use; the use of blood pressure medications for at least 2 years in the last 5 years; the use of statin for at least 2 years in the last 5 years; menopausal status in women and hormone replacement therapy (HRT) among postmenopausal women; dietary energy; and dietary variables including cruciferous vegetables, fruits, whole grain, legumes, nuts and seeds, total dairy, eggs, fish, and unprocessed poultry.
Nutrients 11 00622 g001
Table 1. Selected characteristics of AHS-2 population by the intake of unprocessed red meat (N = 72,149).
Zero IntakeQuartiles of Intake g/day 1
Characteristic0Q1Q2Q3Q4
Age (year), mean (SD) *57.3 (14.0)56.4 (13.8)55.7 (13.4)54.1 (12.7)52.7 (12.4)
Female, n (%)31,124 (66.8)4306 (66.0)4266 (66.9)3989 (62.7)3704 (58.2)
Blacks, n (%)11,985 (25.7)2089 (32.5)2153 (33.8)1805 (28.4)1631 (25.6)
Married, n (%)34,550 (74.1)4409 (68.0)4446 (69.7)4565 (71.8)4632 (72.7)
Graduate degree, n (%)9956 (21.4)987 (15.4)903 (14.2)817 (12.9)684 (10.7)
Current multivitamin users, n (%)22,462 (48.2)3238 (50.4)3086 (48.4)2905 (45.7)2790 (43.8)
Current smokers, n (%)121 (0.3)82 (1.3)116 (1.8)205 (3.2)291 (4.6)
Alcohol daily users, n (%)140 (0.3)53 (0.8)79 (1.2)122 (1.9)171 (2.7)
Exercise (≥150 min/week), n (%) 29812 (21.1)1109 (17.2)1118 (17.5)975 (15.3)896 (14.1)
Postmenopausal, n (%) 322,538 (72.4)3082 (71.6)3020 (70.8)2744 (68.8)2418 (65.3)
Current HRT users, n (%) 411,659 (37.5)1701 (39.5)1682 (39.4)1572 (39.4)1348 (36.4)
Diabetes, n (%)2698 (5.8)636 (9.9)692 (10.9)711 (11.2)698 (11.0)
Hypertension, n (%)8328 (17.9)1626 (25.3)1635 (25.6)1601 (25.2)1649 (25.9)
Hypercholesterolemia, n (%)7309 (15.7)1439 (22.4)1383 (21.7)1326 (20.9)1399 (22.0)
Current aspirin users, n (%)6264 (13.4)1233 (19.2)1308 (20.5)1236 (19.4)1312 (20.6)
BMI (kg/m2), mean (SD) *26.1 (5.3)28 (6.0)28.7 (6.0)29.2 (6.4)29.9 (6.7)
Total energy (kcal), mean (SD) *1901.3 (739.2)1934.3 (800.7)1853.7 (768.2)1844.7 (777.6)2071.2 (783.3)
Dietary variables (g/day), median, mean (SD) *
Cruciferous vegetables22.9
32.6 (32.1)
18.5
27.7 (29.7)
18.6
26.6 (27.4)
17.7
24.6 (24.2)
15.4
23.1 (26.7)
Fruits306
356 (250.0)
246
302.7 (241.9)
231
281.9 (226.0)
199.1
243.2 (199.0)
155.9
200.3 (184.1)
Whole grain162.1
185.4 (123.1)
122.1
149.4 (109.5)
107.7
139 (110.5)
92.9
120.5 (97.2)
77.5
102.3 (87.5)
Legumes42.4
56 (48.0)
32.3
45.1 (43.6)
30.4
42 (41.9)
27.1
36.7 (36.9)
23.5
33.5 (34.6)
Nuts and seeds20.21
25.34 (21.7)
14.06
19.80 (19.9)
12.33
17.89 (18.4)
11.55
16.33 (16.3)
9.82
14.58 (15.5)
Total dairy46.8
115.7 (170.5)
143.6
199.1 (202.7)
163.7
215.1 (206.3)
178
228.1 (205.9)
184.1
232.9 (200.3)
Eggs3.3
7.7 (13.3)
6.7
12.6 (17.4)
7.1
13.7 (17.6)
8.5
15.4 (18.5)
15.2
18.9 (23.7)
Unprocessed poultry0
4.4 (13.9)
5.9
14.5 (20.5)
7.9
16.8 (21.1)
12.2
21.3 (22.4)
28.7
27.9 (23.3)
Processed meat0
0.3 (2.5)
0.5
1.8 (5.6)
0.9
2.6 (6.0)
1.9
4 (6.9)
3.3
7.4 (12.7)
Fish0
7.1 (17.3)
9.0
14.9 (20.7)
11.6
16 (19.5)
12.1
16.4 (18.9)
11.5
16 (18.8)
1 Quartiles based on percentiles of the energy-adjusted g/day intake of unprocessed red meat among the total cohort. Median quartiles (g/day) are as follows, Q1 = 4, Q2 = 9.1, Q3 = 15.6, and Q4 = 41.7. 2 Exercise defined as “vigorous activities, such as brisk walking, jogging, bicycling, etc., long enough or with enough intensity to work up a sweat, get your heart thumping, or get out of breath”. 3 Percentages were calculated among women only. 4 Current hormone replacement therapy users among postmenopausal women only. * SD: Standard deviation.
Table 2. The association between red meat and processed meat intake and all-cause, cardiovascular, and cancer mortality in the AHS-2 cohort (N = 72,149) 1.
Unprocessed Red Meat Intake (g/day) 2
Zero IntakeQuartiles of Intake 3p-trend90th vs. 0 490th vs. 0 4
0Q1Q2Q3Q4 UncalibratedCalibrated
No. of participants46,6136431637763596369
All-cause mortality
No. of deaths (n = 7961)5376727673593592
Model 11.001.16 (1.07–1.26)1.27 (1.17–1.38)1.39 (1.27–1.52)1.58 (1.45–1.72)<0.00011.56 (1.46–1.67)2.37 (1.99–2.93)
Model 21.001.08 (0.99–1.18)1.16 (1.06–1.27)1.19 (1.08–1.32)1.26 (1.14–1.39)<0.00011.25 (1.15–1.36)1.69 (1.40–2.16)
Model 31.001.06 (0.97–1.17)1.12 (1.02–1.24)1.14 (1.02–1.27)1.17 (1.05–1.32)<0.0011.18 (1.07–1.31)1.51 (1.22–1.98)
CVD mortality
No. of deaths (n = 2598)1785250204178181
Model 11.001.24 (1.08–1.43)1.27 (1.09–1.48)1.41 (1.20–1.65)1.55 (1.33–1.82)<0.00011.58 (1.40–1.78)2.41 (1.86–3.24)
Model 21.001.20 (1.03–1.39)1.18 (1.01–1.39)1.27 (1.07–1.50)1.32 (1.10–1.57)<0.0011.36 (1.18–1.57)2.02 (1.44–3.04)
Model 31.001.15 (0.98–1.34)1.11 (0.93–1.32)1.17 (0.96–1.43)1.20 (0.97–1.47)0.0511.26 (1.05–1.50)1.64 (1.09–2.57)
Cancer mortality
No. of deaths (n = 1873)1228175160159151
Model 11.001.13 (0.96–1.34)1.16 (0.98–1.37)1.38 (1.16–1.63)1.53 (1.29–1.82)<0.00011.50 (1.31–1.72)2.17 (1.66–2.95)
Model 2 51.001.04 (0.88–1.23)1.04 (0.87–1.24)1.14 (0.95–1.37)1.19 (0.95–1.37)0.0471.16 (0.99–1.37)1.41 (0.98–2.05)
Model 3 51.001.01 (0.85–1.21)1.00 (0.83–1.22)1.08 (0.88–1.33)1.07 (0.86–1.34)0.3571.04 (0.85–1.27)1.18 (0.78–1.84)
Processed Meat Intake (g/day) 2
No. of participants48,1276014604460165948
All-cause mortality
No. of deaths (n = 7961)5544657598552610
Model 11.001.04 (0.96–1.13)1.24 (1.14–1.35)1.27 (1.16–1.40)1.59 (1.46–1.74)<0.00011.54 (1.43–1.66)1.81 (1.59–2.12)
Model 21.000.98 (0.90–1.08)1.10 (0.99–1.21)1.09 (0.99–1.21)1.27 (1.15–1.40)<0.00011.20 (1.10–1.30)1.38 (1.18–1.68)
Model 31.000.95 (0.86–1.05)1.03 (0.94–1.14)1.02 (0.91–1.13)1.16 (1.04–1.29)0.0181.08 (0.98–1.20)1.25 (0.95–1.94)
CVD mortality
No. of deaths (n = 2598)1821224199176178
Model 11.001.11 (0.95–1.28)1.32 (1.13–1.55)1.38 (1.15–1.67)1.53 (1.30–1.80)<0.00011.54 (1.34–1.76)1.90 (1.56–2.37)
Model 21.001.05 (0.89–1.24)1.21 (1.02–1.44)1.24 (1.01–1.51)1.31 (1.09–1.57)<0.0011.28 (1.09–1.51)1.68 (1.28–2.32)
Model 31.001.01 (0.84–1.21)1.13 (0.93–1.37)1.14 (0.92–1.42)1.19 (0.97–1.47)0.0541.12 (0.93–1.36)1.62 (0.97–3.71)
Cancer mortality
No. of deaths (n = 1873)1294142148128161
Model 11.000.92 (0.77–1.10)1.15 (0.95–1.39)1.12 (0.92–1.36)1.58 (1.32–1.88)<0.00011.49 (1.28–1.73)1.61 (1.28–2.04)
Model 2 51.000.85 (0.71–1.02)1.00 (0.82–1.21)0.94 (0.77–1.15)1.19 (0.98–1.45)0.2291.12 (0.94–1.33)1.09 (0.79–1.50)
Model 3 51.000.80 (0.66–0.96)0.93 (0.75–1.14)0.86 (0.69–1.06)1.06 (0.86–1.32)0.9941.01 (0.83–1.23)0.74 (0.32–1.38)
Combined intake of red and processed meat (g/day) 2
No. of participants40,2877966796579667965
All-cause mortality
No. of deaths (n = 7961)4706860890752753
Model 11.001.07 (0.99–1.15)1.20 (1.11–1.30)1.35 (1.24–1.46)1.60 (1.47–1.73)<0.00011.55 (1.45–1.65)1.86 (1.68–2.09)
Model 21.001.03 (0.95–1.12)1.11 (1.02–1.21)1.18 (1.08–1.29)1.27 (1.16–1.40)<0.00011.25 (1.16–1.36)1.44 (1.27–1.65)
Model 3 61.001.02 (0.93–1.12)1.09 (0.99–1.21)1.17 (1.04–1.30)1.25 (1.12–1.40)<0.00011.23 (1.11–1.36)1.50 (1.26–1.83)
CVD mortality
No. of deaths (n = 2598)1564291290230223
Model 11.001.11 (0.96–1.27)1.27 (1.11–1.45)1.38 (1.20–1.58)1.56 (1.35–1.80)<0.00011.57 (1.40–1.77)1.90 (1.59–2.26)
Model 21.001.09 (0.93–1.27)1.21 (1.04–1.40)1.25 (1.07–1.47)1.33 (1.12–1.57)<0.00011.37 (1.19–1.58)1.66 (1.32–2.12)
Model 3 61.001.08 (0.90–1.28)1.18 (0.99–1.40)1.21 (1.00–1.47)1.29 (1.06–1.58)0.0051.34 (1.12–1.60)1.73 (1.27–2.51)
Cancer mortality
No. of deaths (n = 1873)1080196206194197
Model 11.001.00 (0.85–1.18)1.12 (0.96–1.30)1.25 (1.05–1.48)1.57 (1.35–1.84)<0.00011.48 (1.29–1.69)1.73 (1.44–2.09)
Model 2 51.000.94 (0.80–1.11)1.00 (0.85–1.18)1.05 (0.88–1.26)1.19 (1.00–1.43)0.1031.14 (0.97–1.34)1.25 (0.97–1.60)
Model 3 5,61.000.88 (0.73–1.05)0.92 (0.77–1.10)0.97 (0.78–1.20)1.07 (0.87–1.32)0.6041.00 (0.82–1.22)1.02 (0.70–1.42)
1 Data are given as hazard ratio (95% confidence interval). 2 Values based on energy-adjusted variables. 3 Quartiles are based on percentiles of the energy-adjusted g/day intake of total cohort. Median quartiles (g/day) are as follows, for unprocessed red meat, Q1 = 4, Q2 = 9.1, Q3 = 15.6, Q4 = 41.7; for processed meat, Q1 = 0.7, Q2 = 1.4, Q3 = 3.3, Q4 = 9.4; and for combined intake of red and processed meats, Q1 = 1.4, Q2 = 7.3, Q3 = 15.4, Q4 = 42.8. Model 1 adjusted for age (attained age as time variable), sex (male and female), race (Black and non-Black), and total energy intake (continuous). Model 2 adjusted for age (attained age as time variable), sex (male and female), race (Black and non-Black), total energy intake (continuous), marital status (married/common-law and single/widowed/divorced/separated), educational level (up to high school graduate, trade school/some college/associate degree, bachelor degree, and graduate degree), multivitamin use (current use), smoking status (current smoker, quit <1 year, quit 1–4 years, quit 5–9 years, quit 10–19 years, quit 20–29 years, quit ≥30 years, and never smoked), alcohol use (none, rarely, monthly, weekly, and daily), exercise (none, ≤20 min/week, 21–60 min/week, 61–150 min/week, and ≥151 min/week), sleep (≤4 h/night, 5–8 h/night, and ≥9 h/night), body mass index (<18.5, 18.5–24.9, 25.0–29.9, and ≥30.0), aspirin use (yes/no: used weekly for at least two years in the last five years), having ever been diagnosed with or received treatment in the last 12 months for diabetes (yes/no), having been diagnosed in the last 5 years with or received treatment in the last 12 months for hypertension or hypercholesterolemia (yes/no), the use of statin for at least 2 years in the last 5 years, the use of blood pressure medications for at least 2 years in the last 5 years (yes/no), and dietary variables (each variable has 5 levels in g/day) as follows. Cruciferous vegetables (Quintiles: <9.6, 9.6–16.7, >16.7–26.1, >26.1–45.2, >45.2), fruits (Quintiles: <130, 130–224.4, >224.4–322, >322–464.2, >464.2), whole grain (Quintiles: <65, 65–109.9, >109.9–170.3, >170.3–252.2, >252.2), legumes (Quintiles: <17, 17–29.7, >29.7–45.9, >45.9–77.1, >77.1), nuts and seeds (Quintiles: <6.4, 6.4–12.8, >12.8–21.6, >21.6–35.1, >35.1), total dairy (0 intake, quartiles of intake: >0–36, >36–108.1, >108.1–240.9, >240.9), eggs (0 intake, quartiles of intake: >0–3.6, >3.6–7.3, >7.3–20.1, >20.1); and in women, the model also adjusted for menopausal status (premenopausal, postmenopausal), and hormone therapy (in postmenopausal women) (not taking hormone therapy, taking hormone therapy). Model 3: In addition to covariates in model 2, also adjusted for other meat variables such as fish (0 intake, quartiles of intake: >0–7, >7–12.6, >12.6–21.4, >21.4), and unprocessed poultry (0 intake, quartiles of intake: >0–4.8, >4.8–10.4, >10.4–32.5, >32.5). Also, for model 3 in unprocessed red meat, processed meat was adjusted for (0 intake and quartiles of intake) and vice versa. 4 Models in these analyses are correspondents to models 1, 2, and 3, except energy-adjusted log-transformed continuous dietary variables were used instead of five-level adjustment (90th percentile for unprocessed red meat: 46.5 g/day; for processed meat: 11 g/day; and for combined intake of red and processed meats: 49.1 g/day). 5 Also adjusted for previous screening for colon, prostate, or breast cancers during the last four years. 6 Model 3 here did not adjust for either unprocessed red meat or processed meat, but rather both were combined and used as one exposure variable.

