Calorie Restriction in Adulthood Reduces Hepatic Disorders Induced by Transient Postnatal Overfeeding in Mice

 ,
, 
Abstract
:1. Introduction
2. Materials and Methods
2.1. Animal Model
2.2. Evaluation of Hepatic Structure by Histological Analysis
2.3. Detection of Superoxide Anion (O2•−) by Chemiluminescence
2.4. Detection of Oxidative DNA Double-Strand Break
2.5. Detection of Liver Senescence by Histological Staining
2.6. Western Blotting
2.7. Statistical Analyses
3. Results
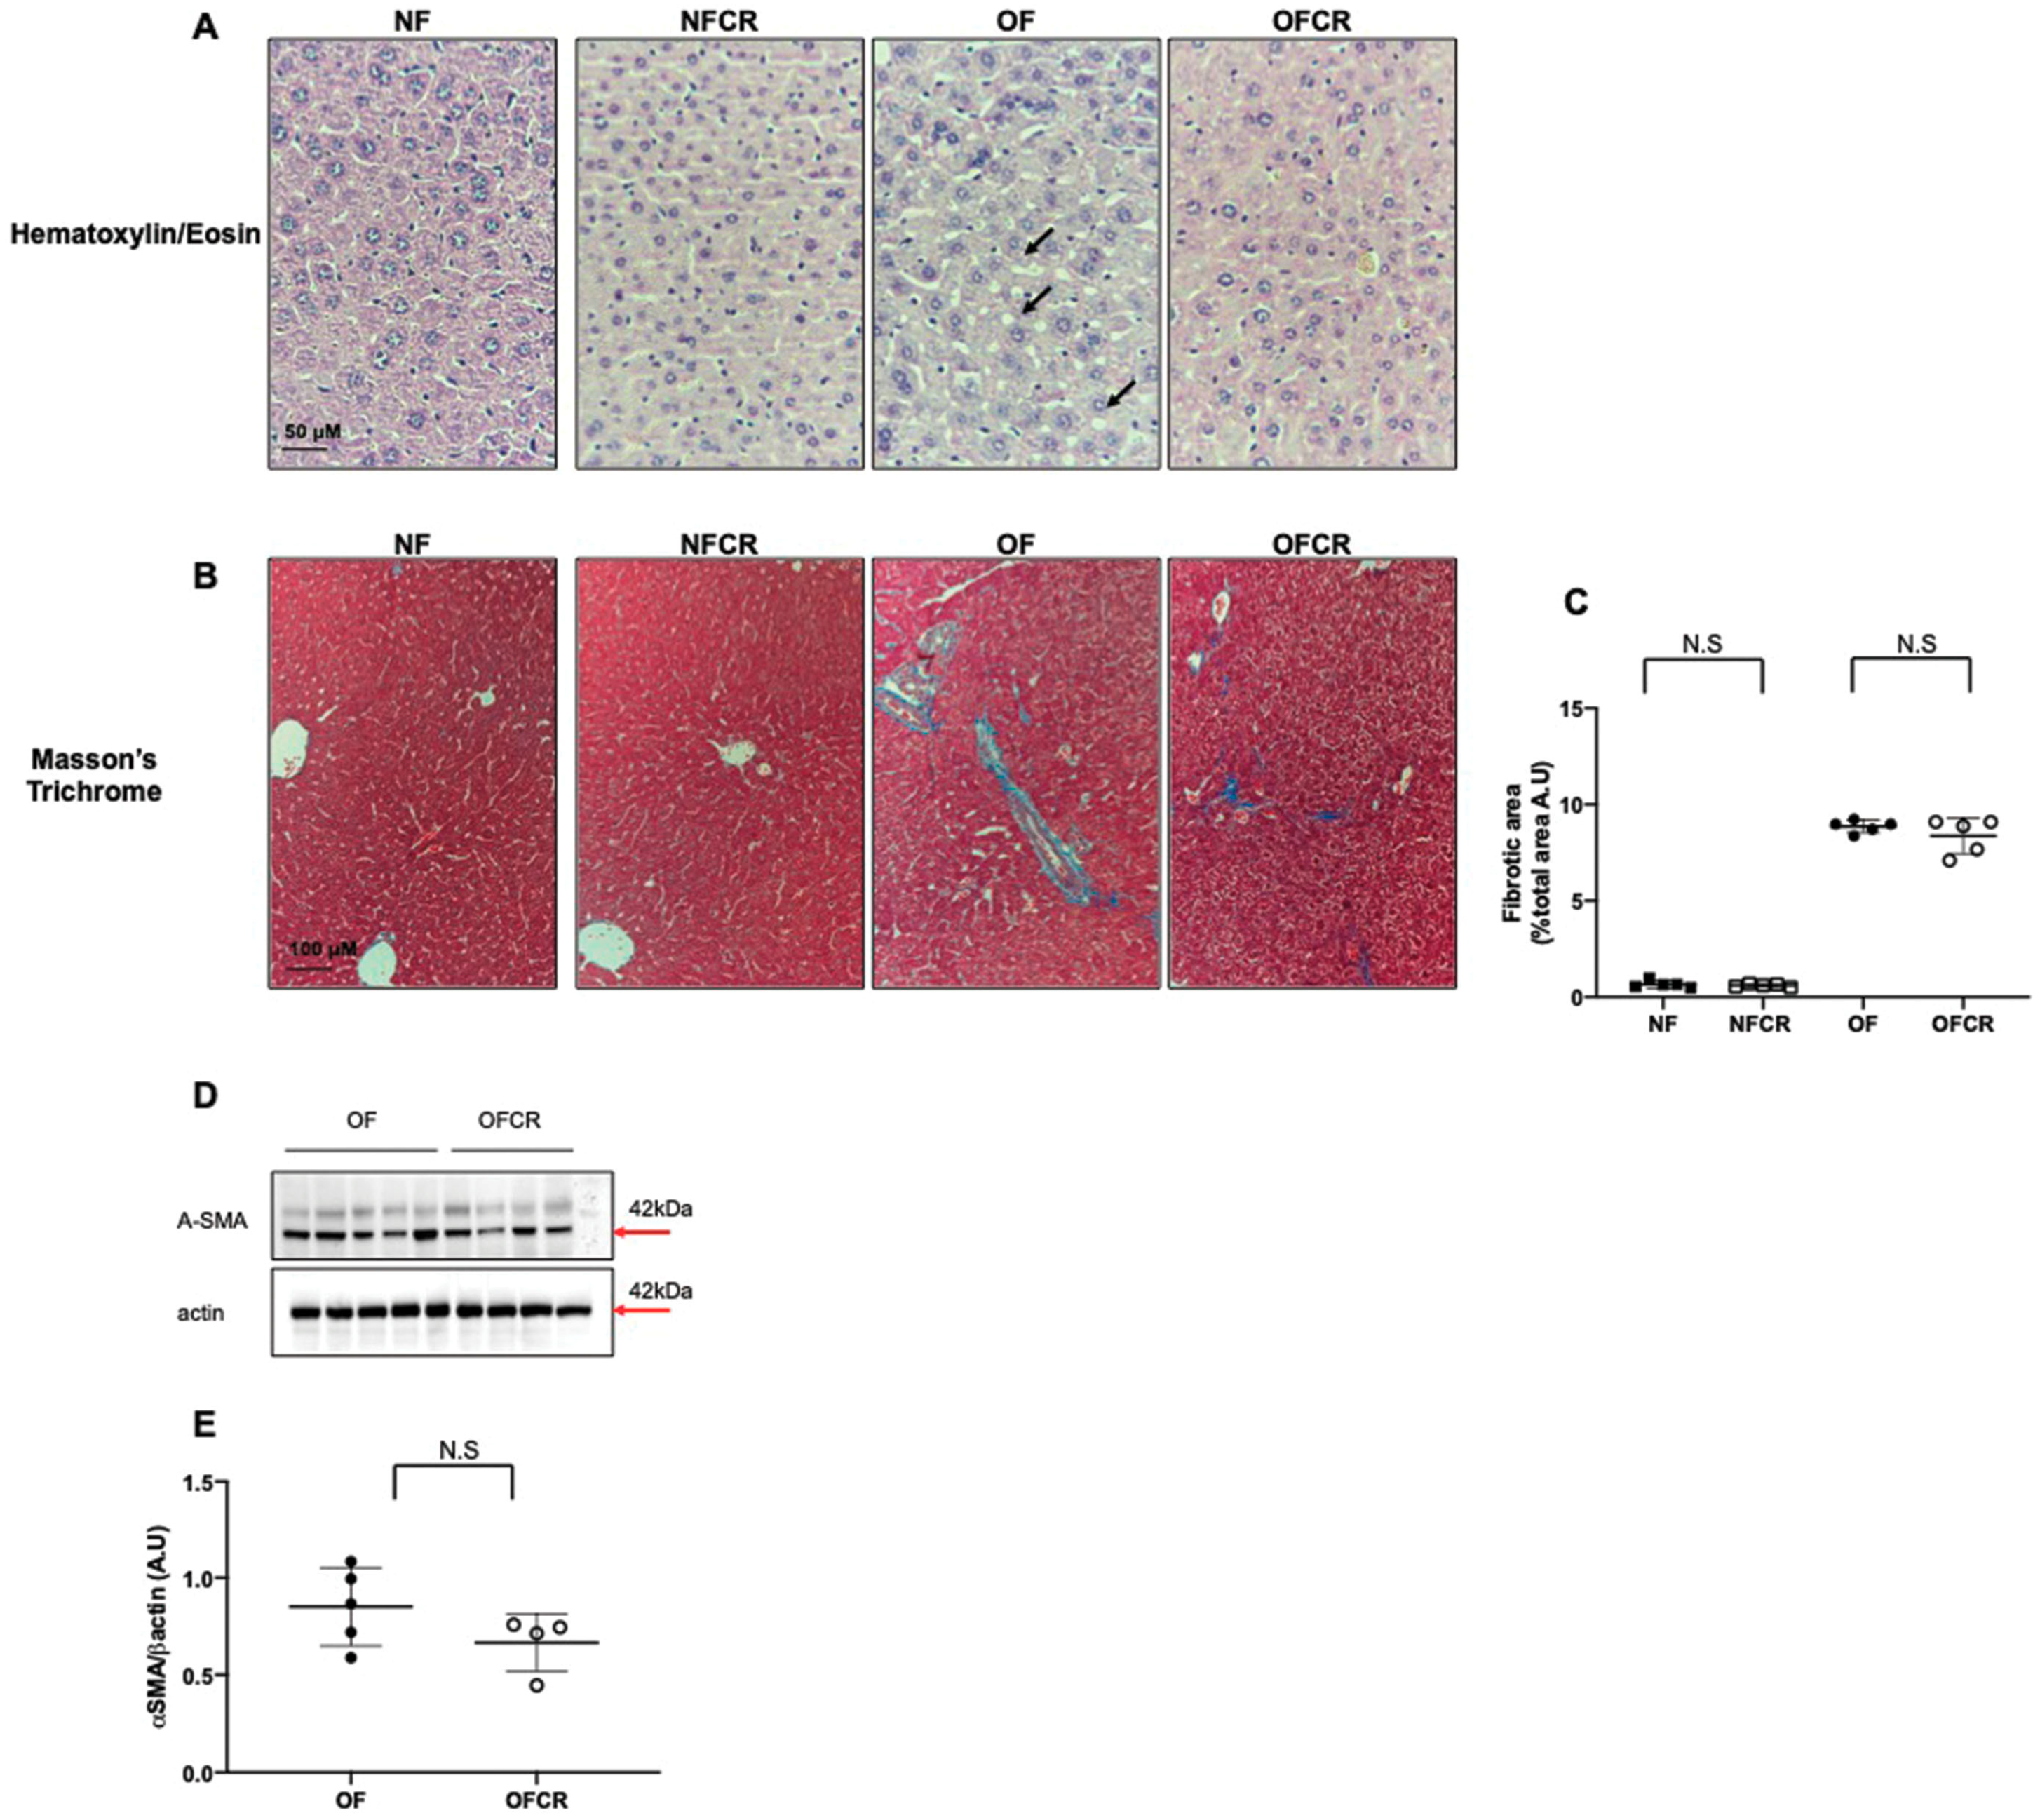
3.1. Effect of Calorie Restriction on Liver Structure
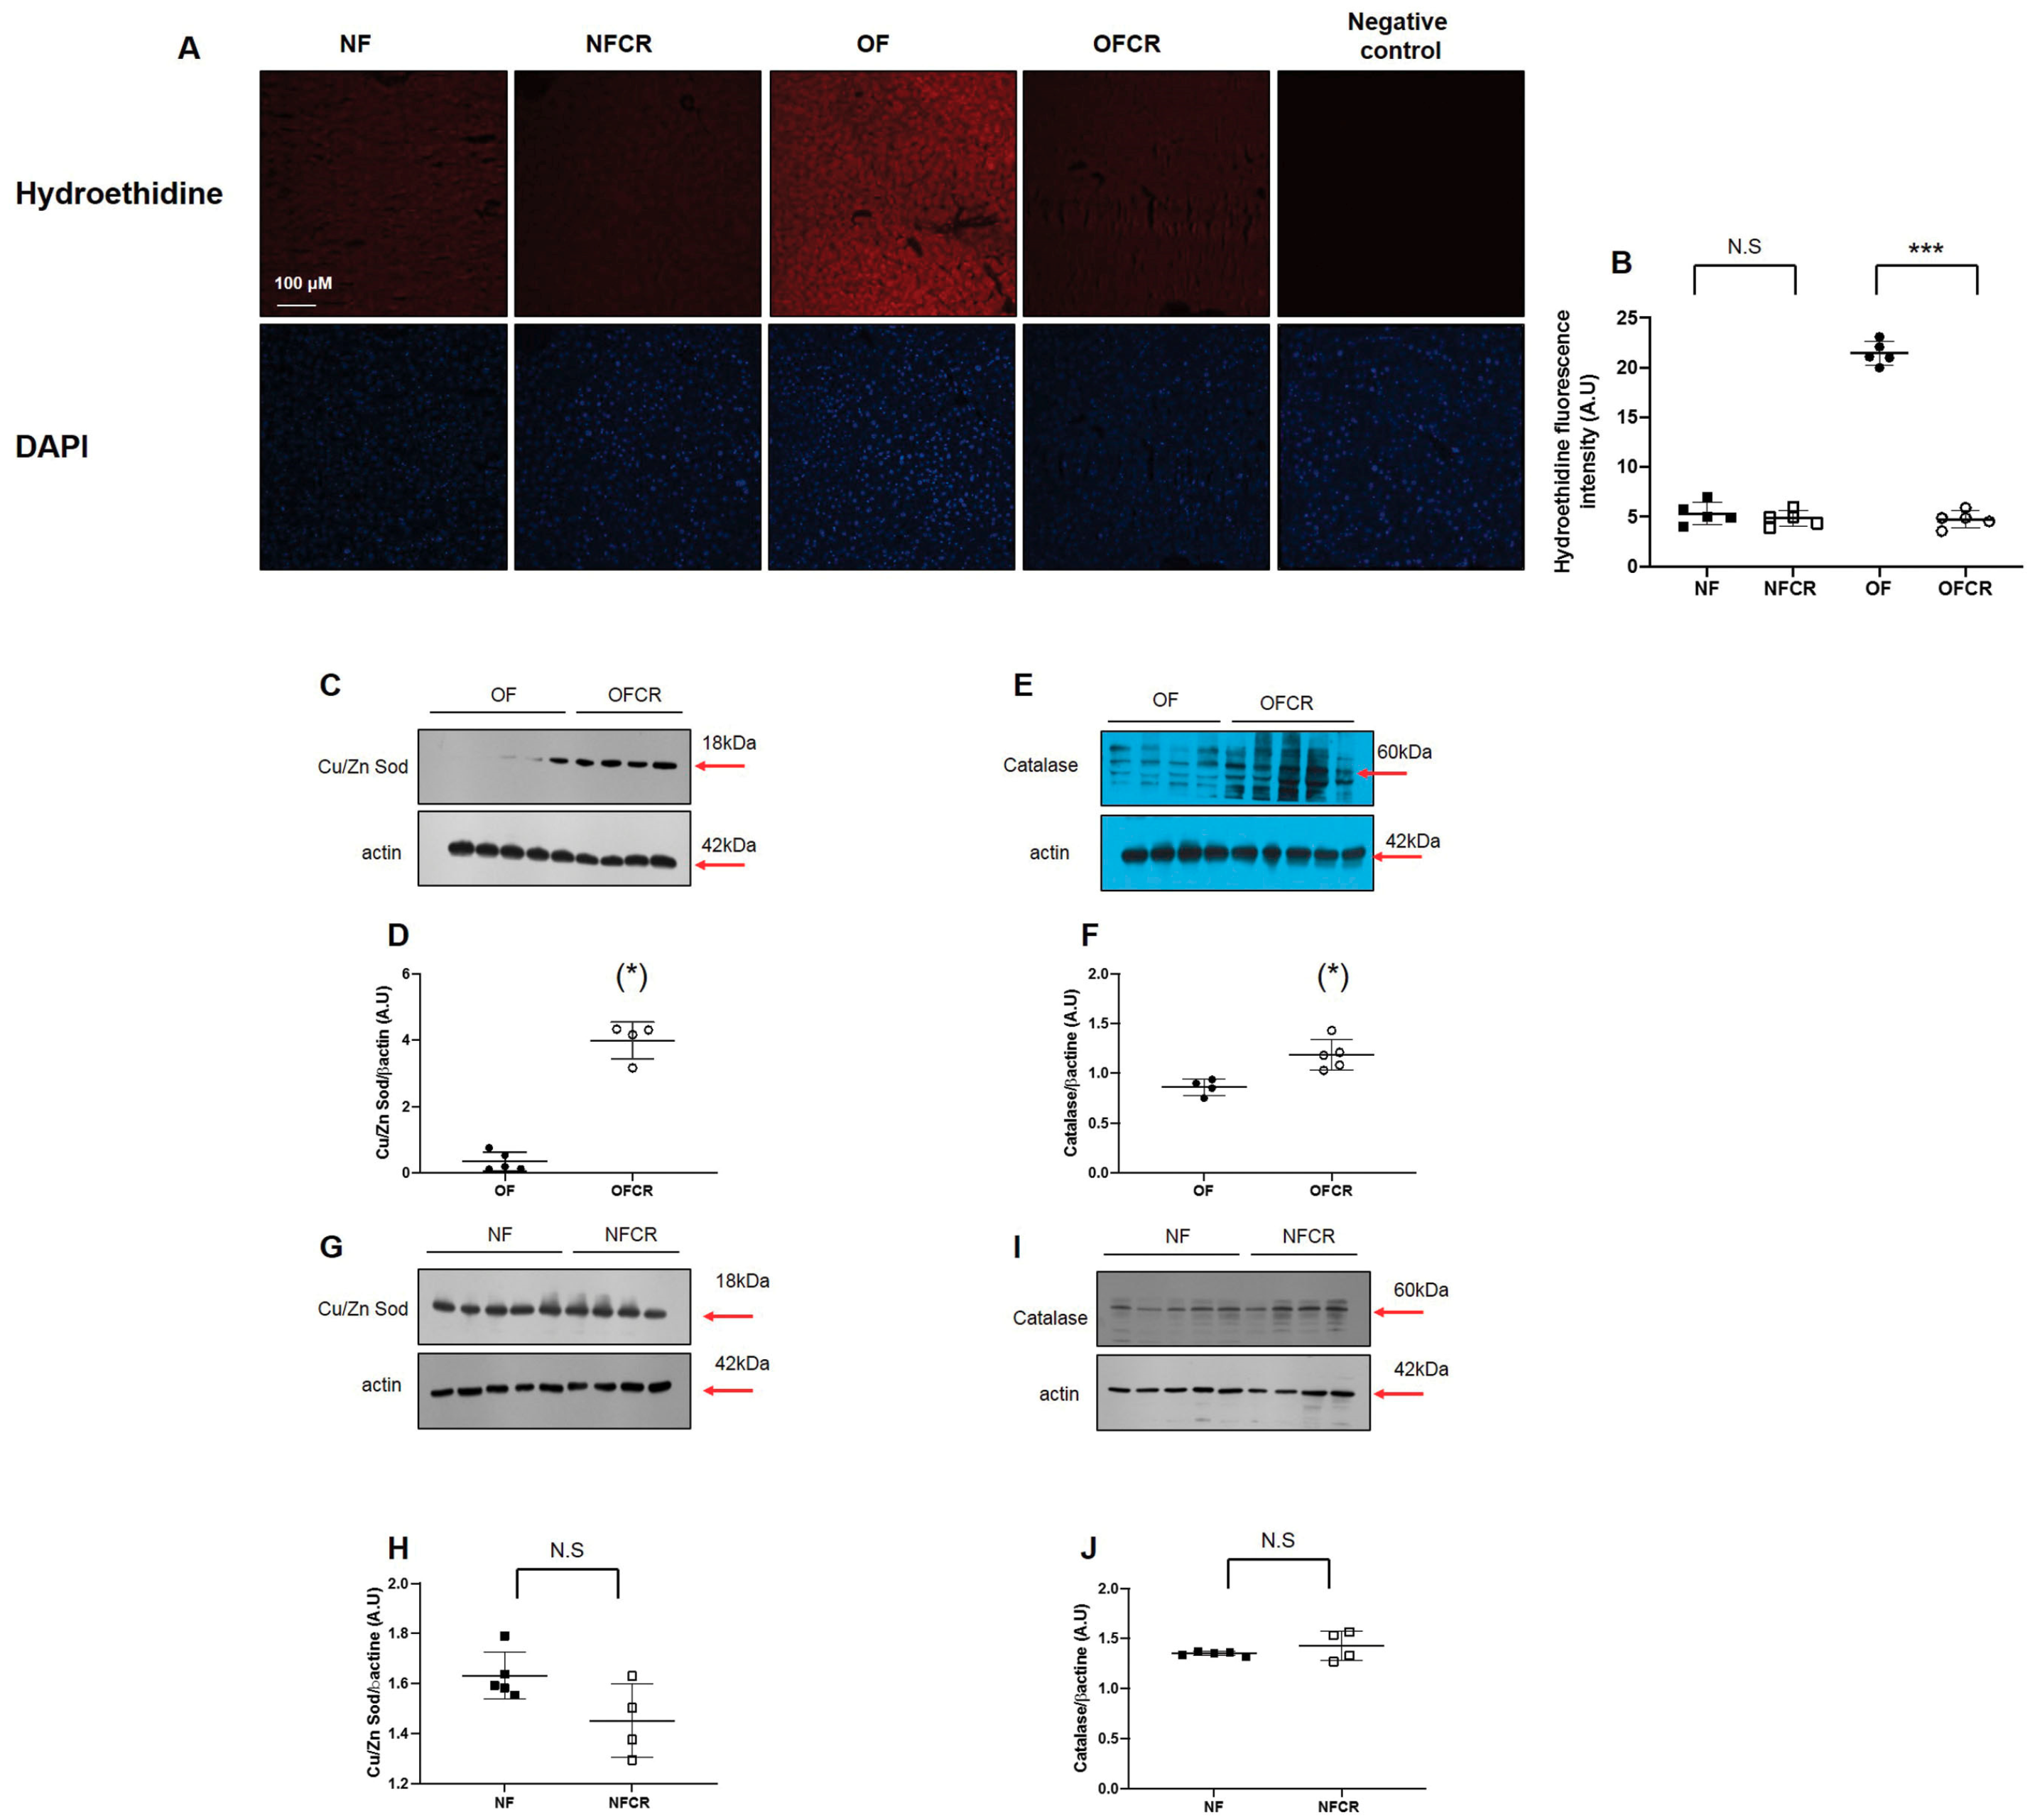
3.2. Effect of Calorie Restriction on Oxidative Stress in Hepatic Tissue
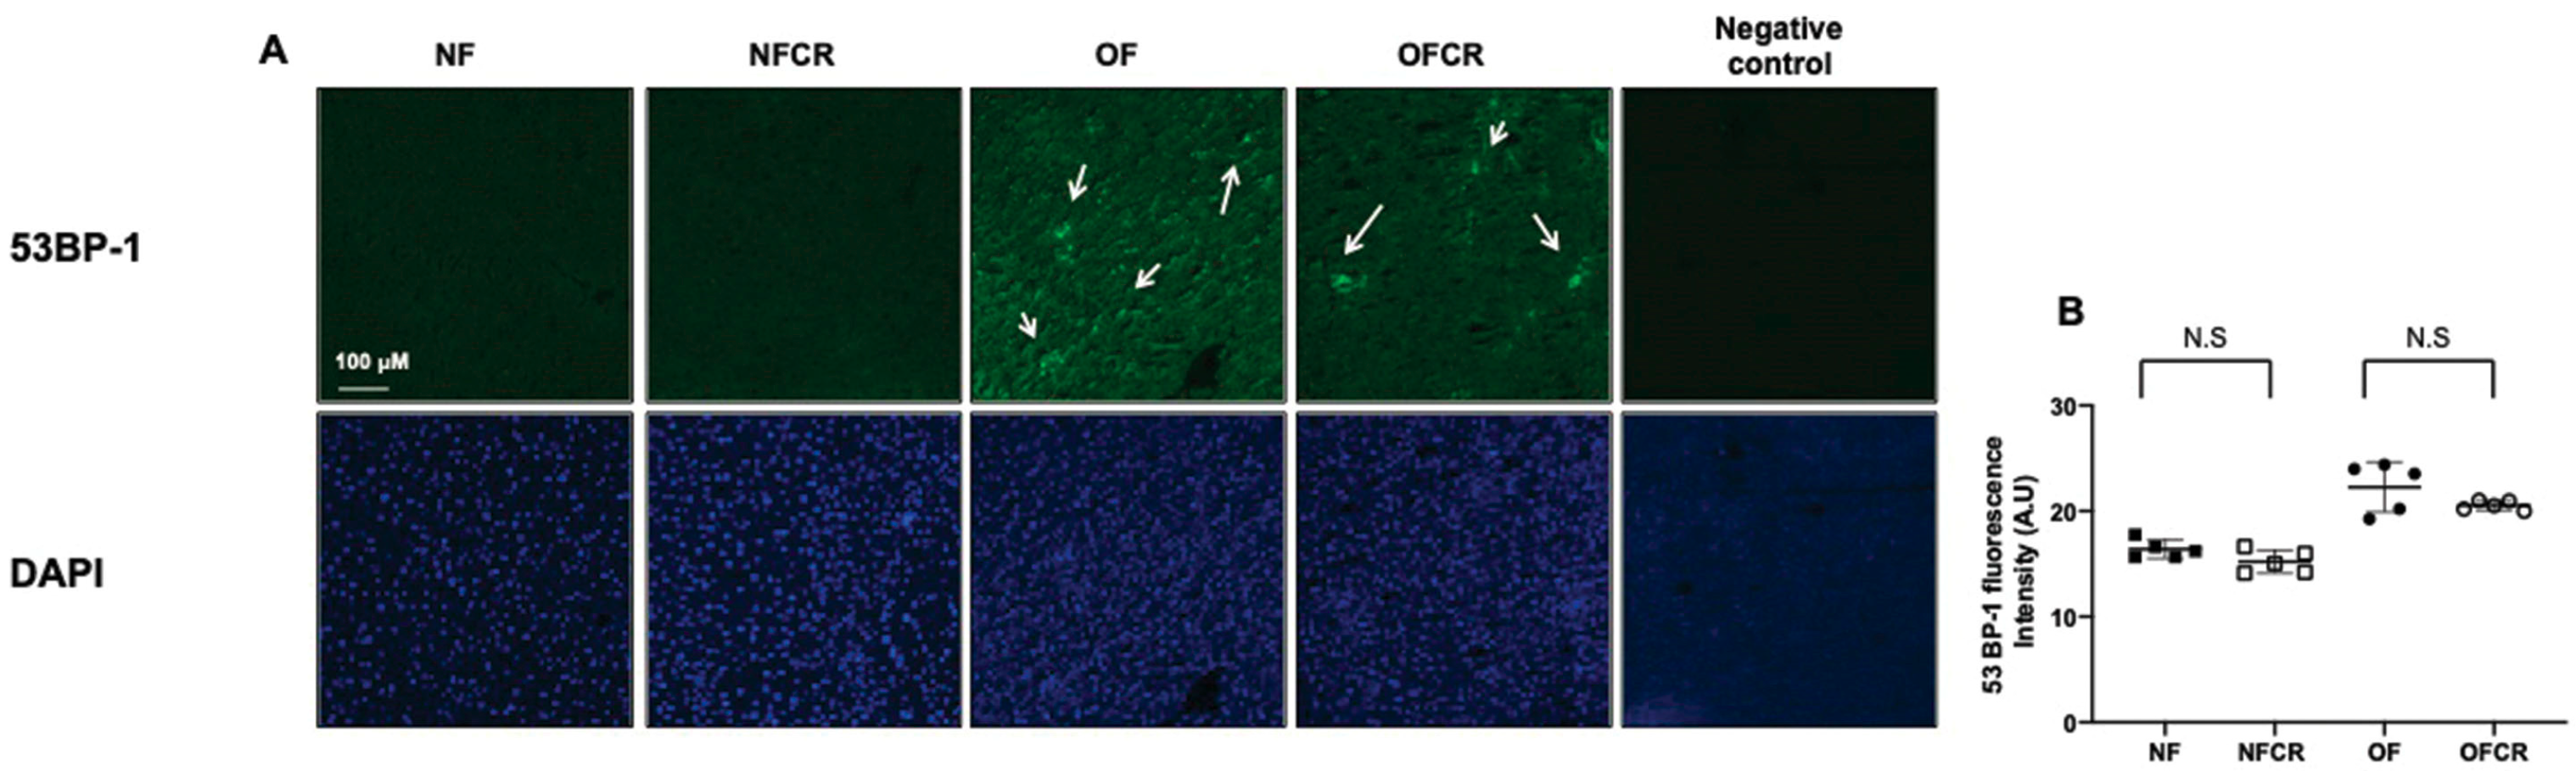
3.3. Effect of Calorie Restriction on DNA Double-Strand Break in Hepatic Tissue
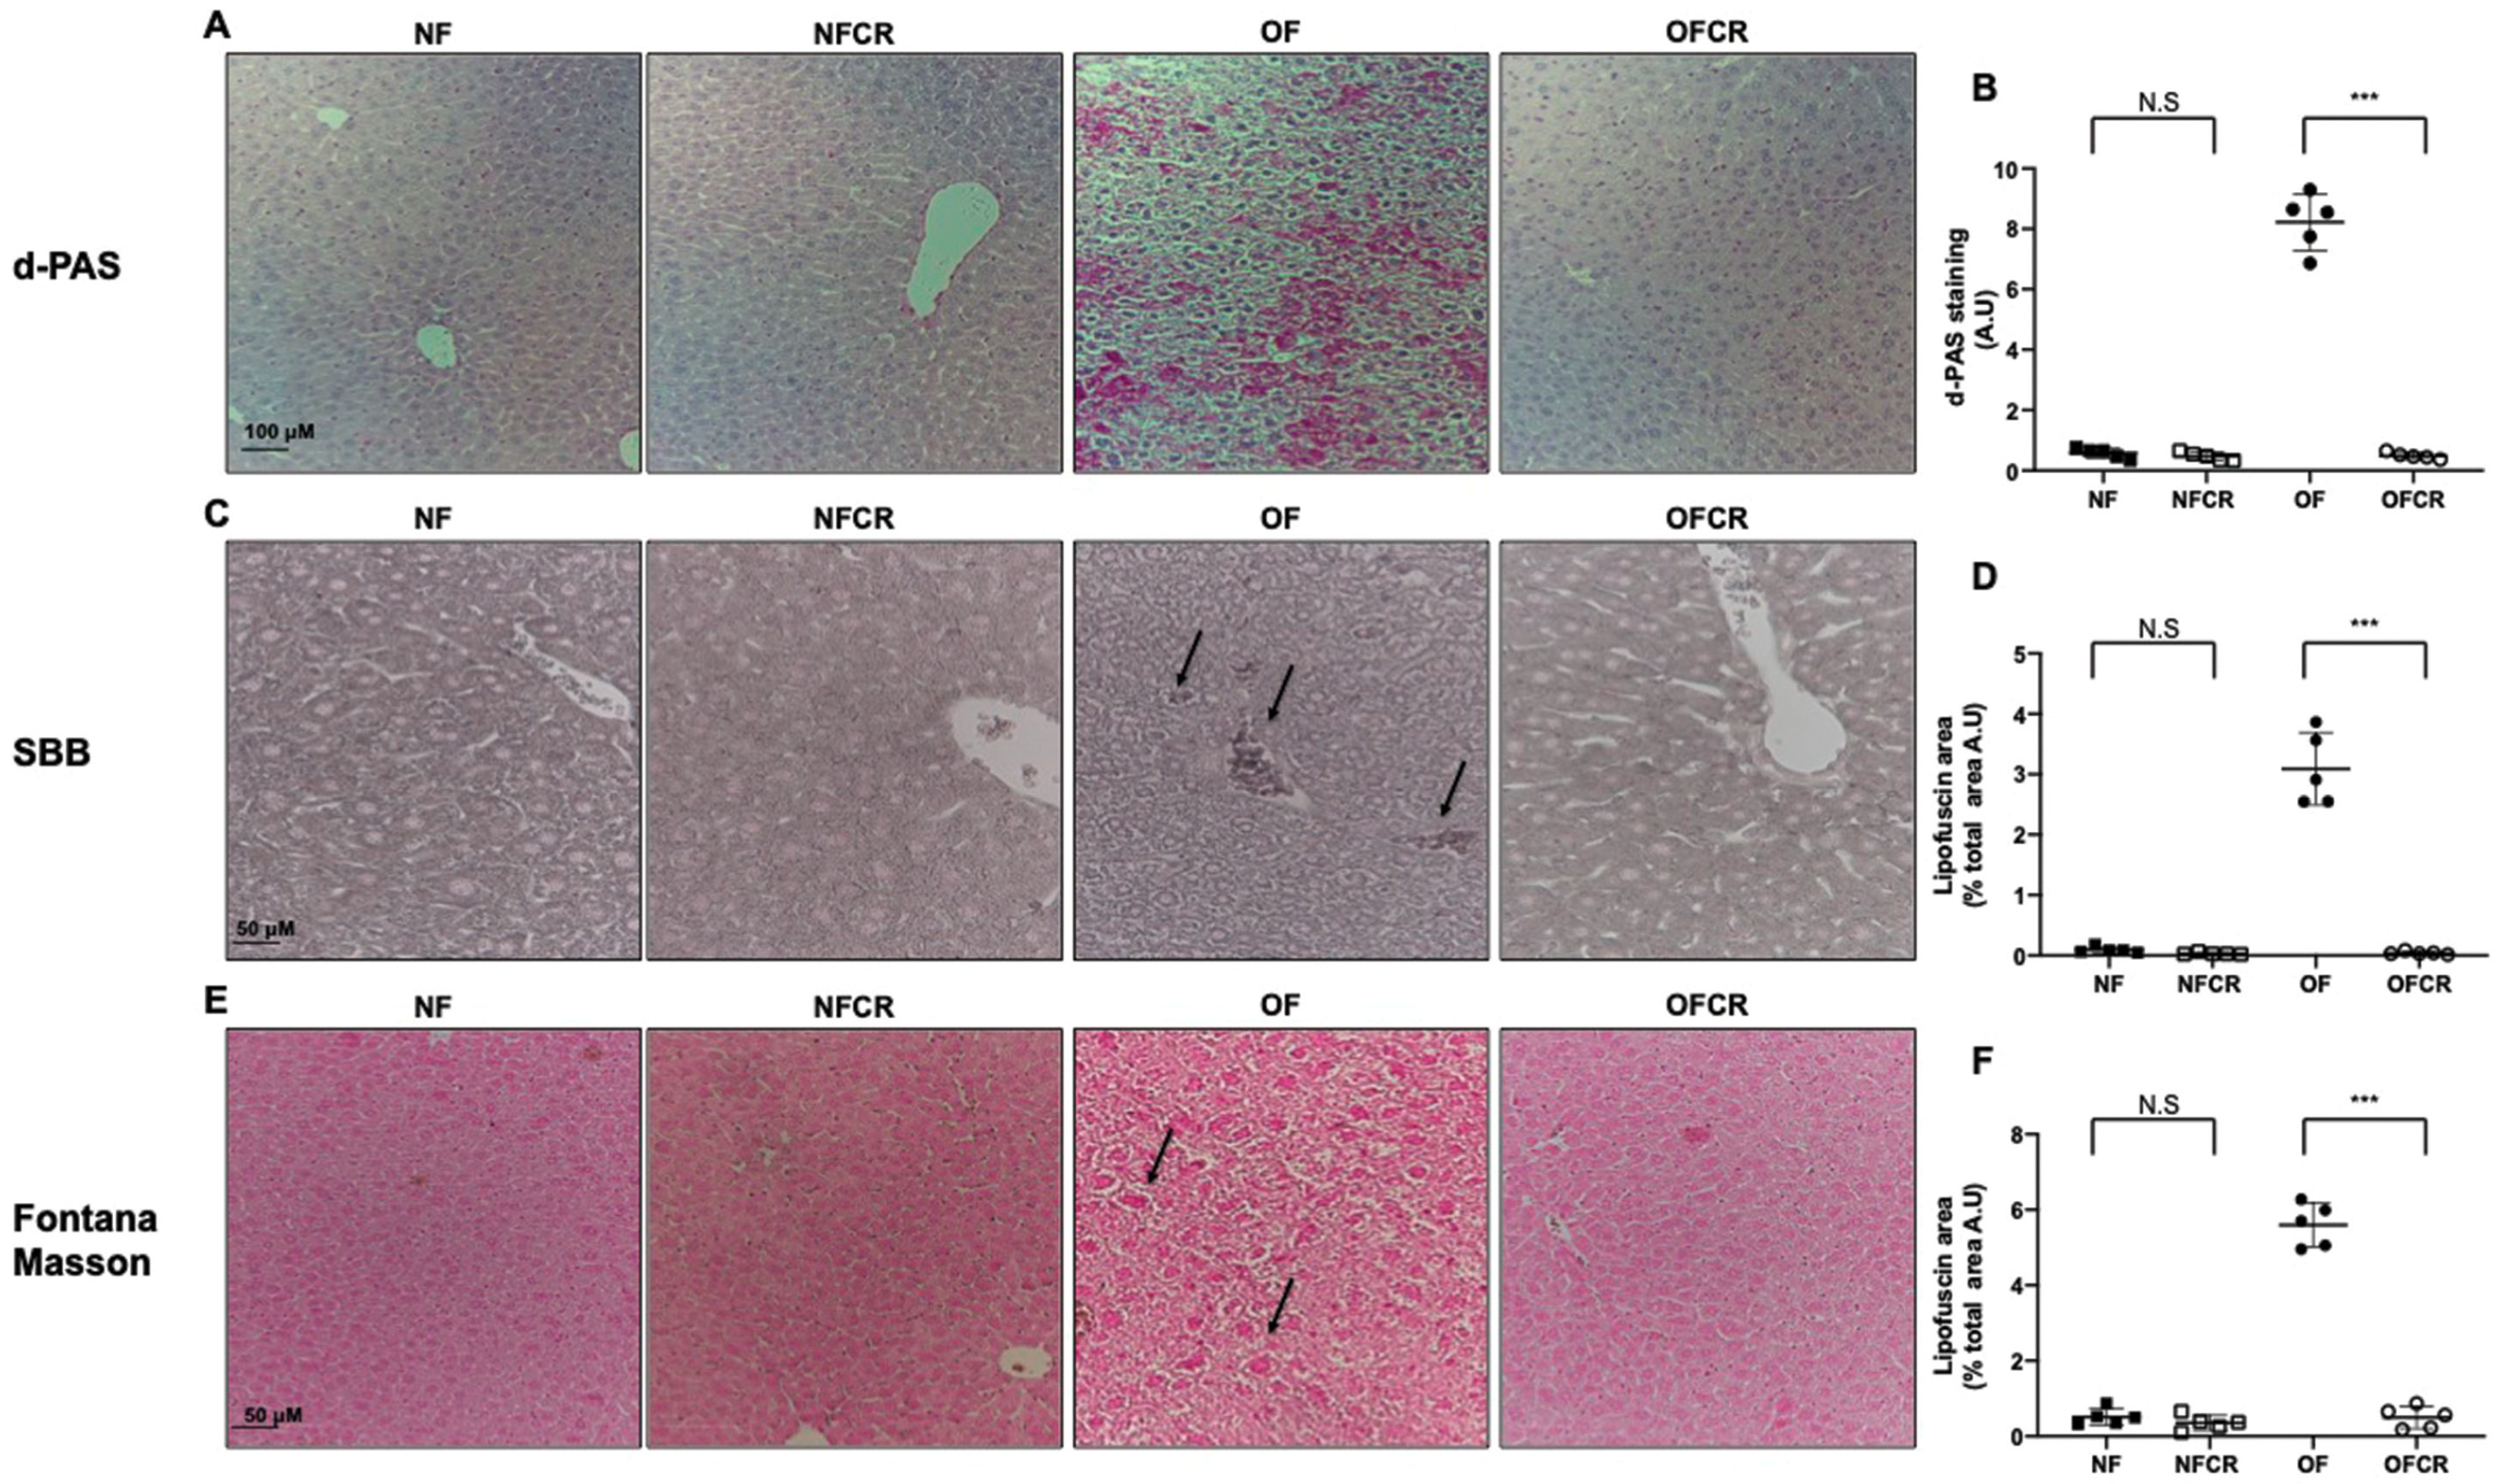
3.4. Effect of Calorie Restriction on Histological Detection of Senescence
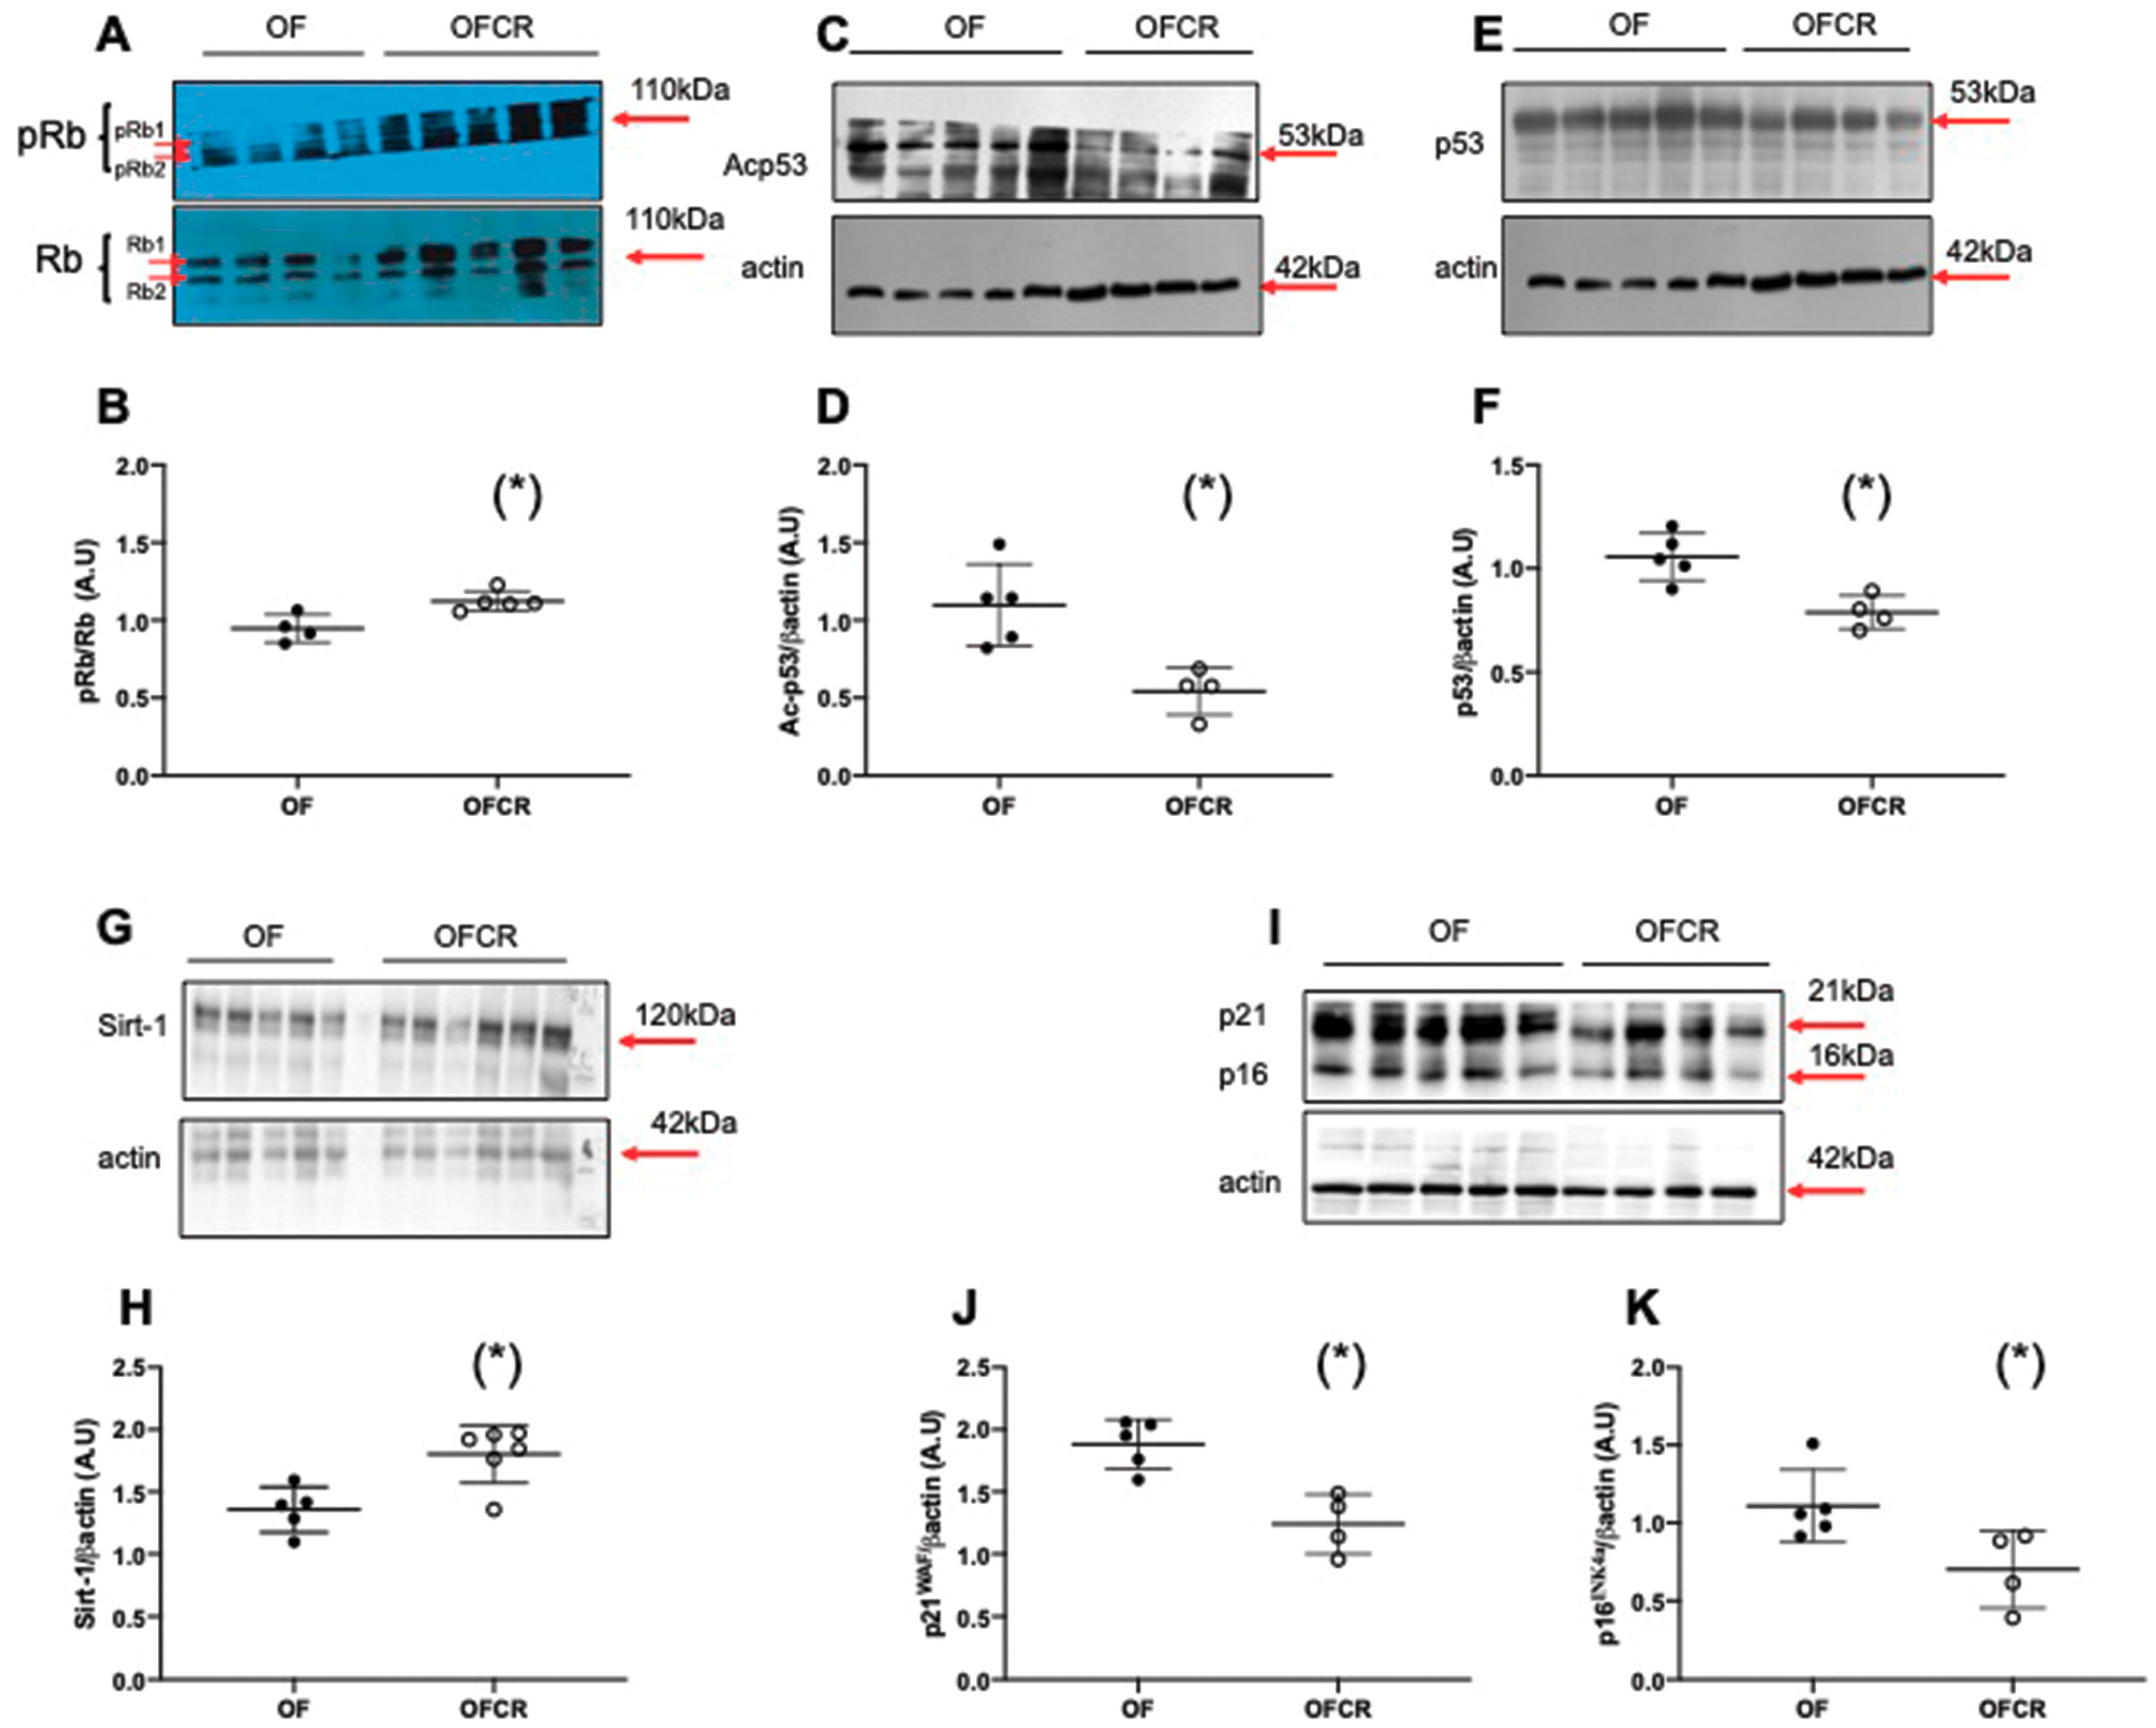
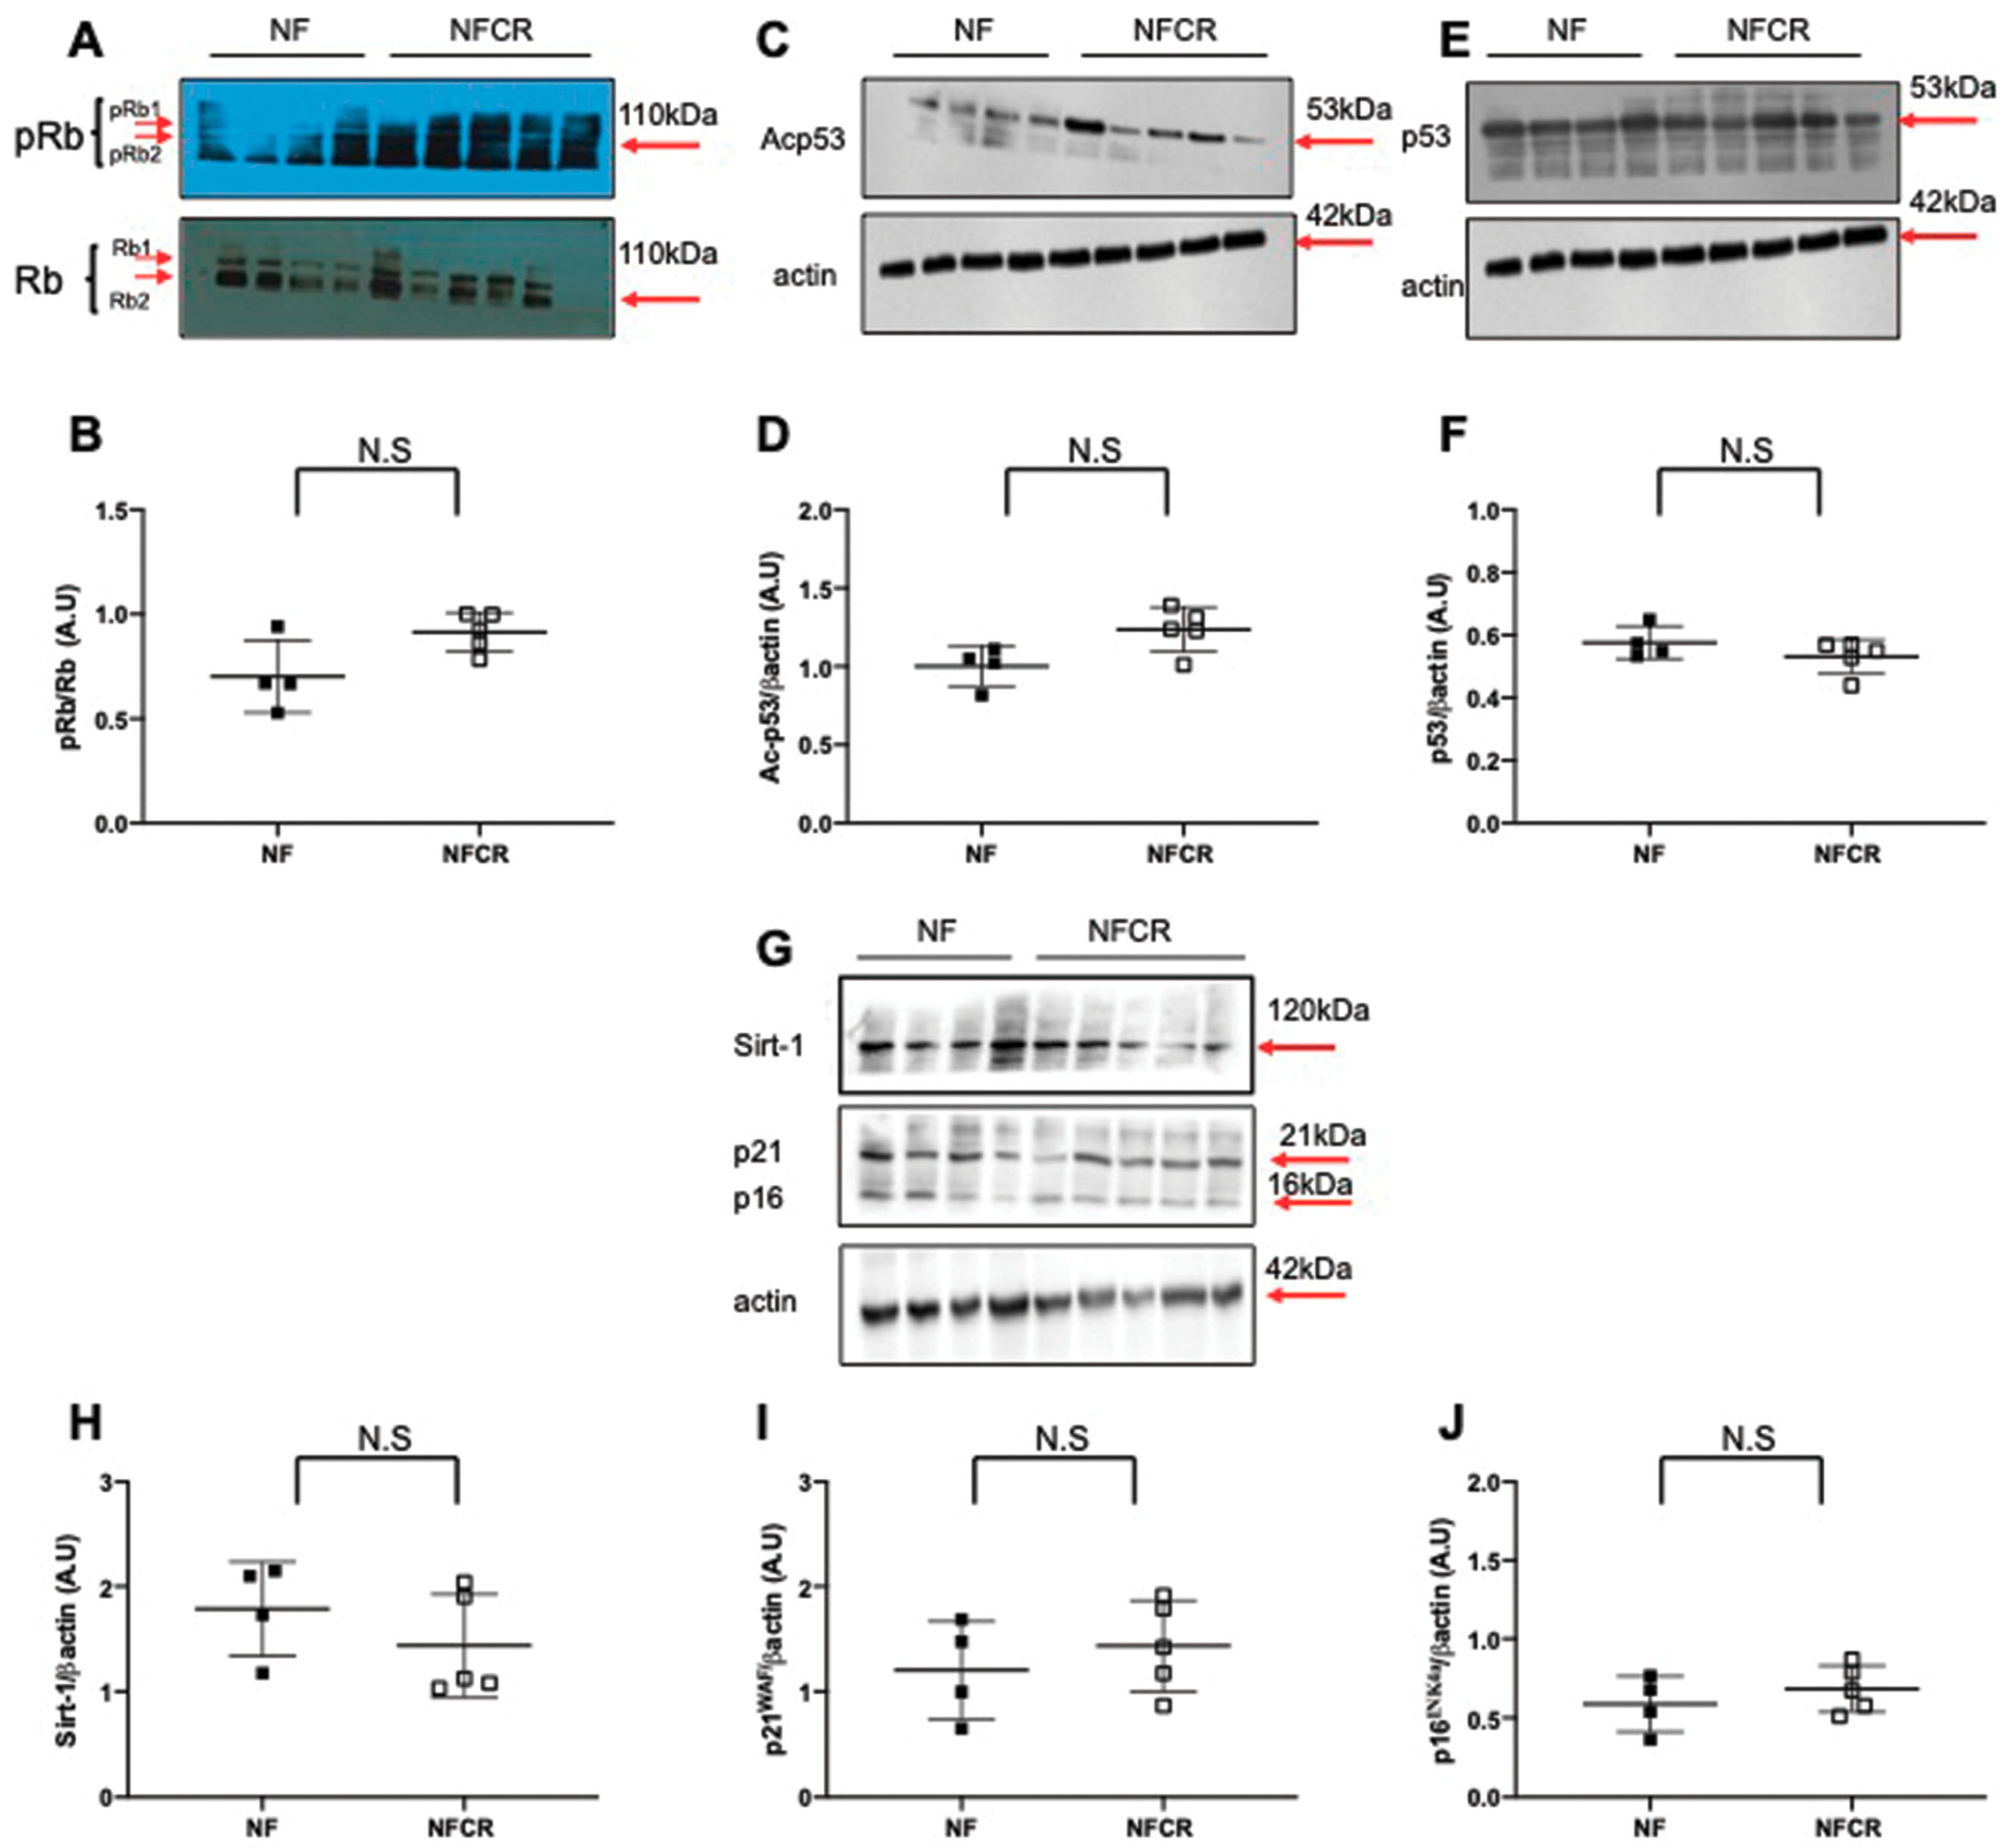
3.5. Effect of Calorie Restriction on Molecular Pathways of Senescence in Hepatic Tissue
4. Discussion
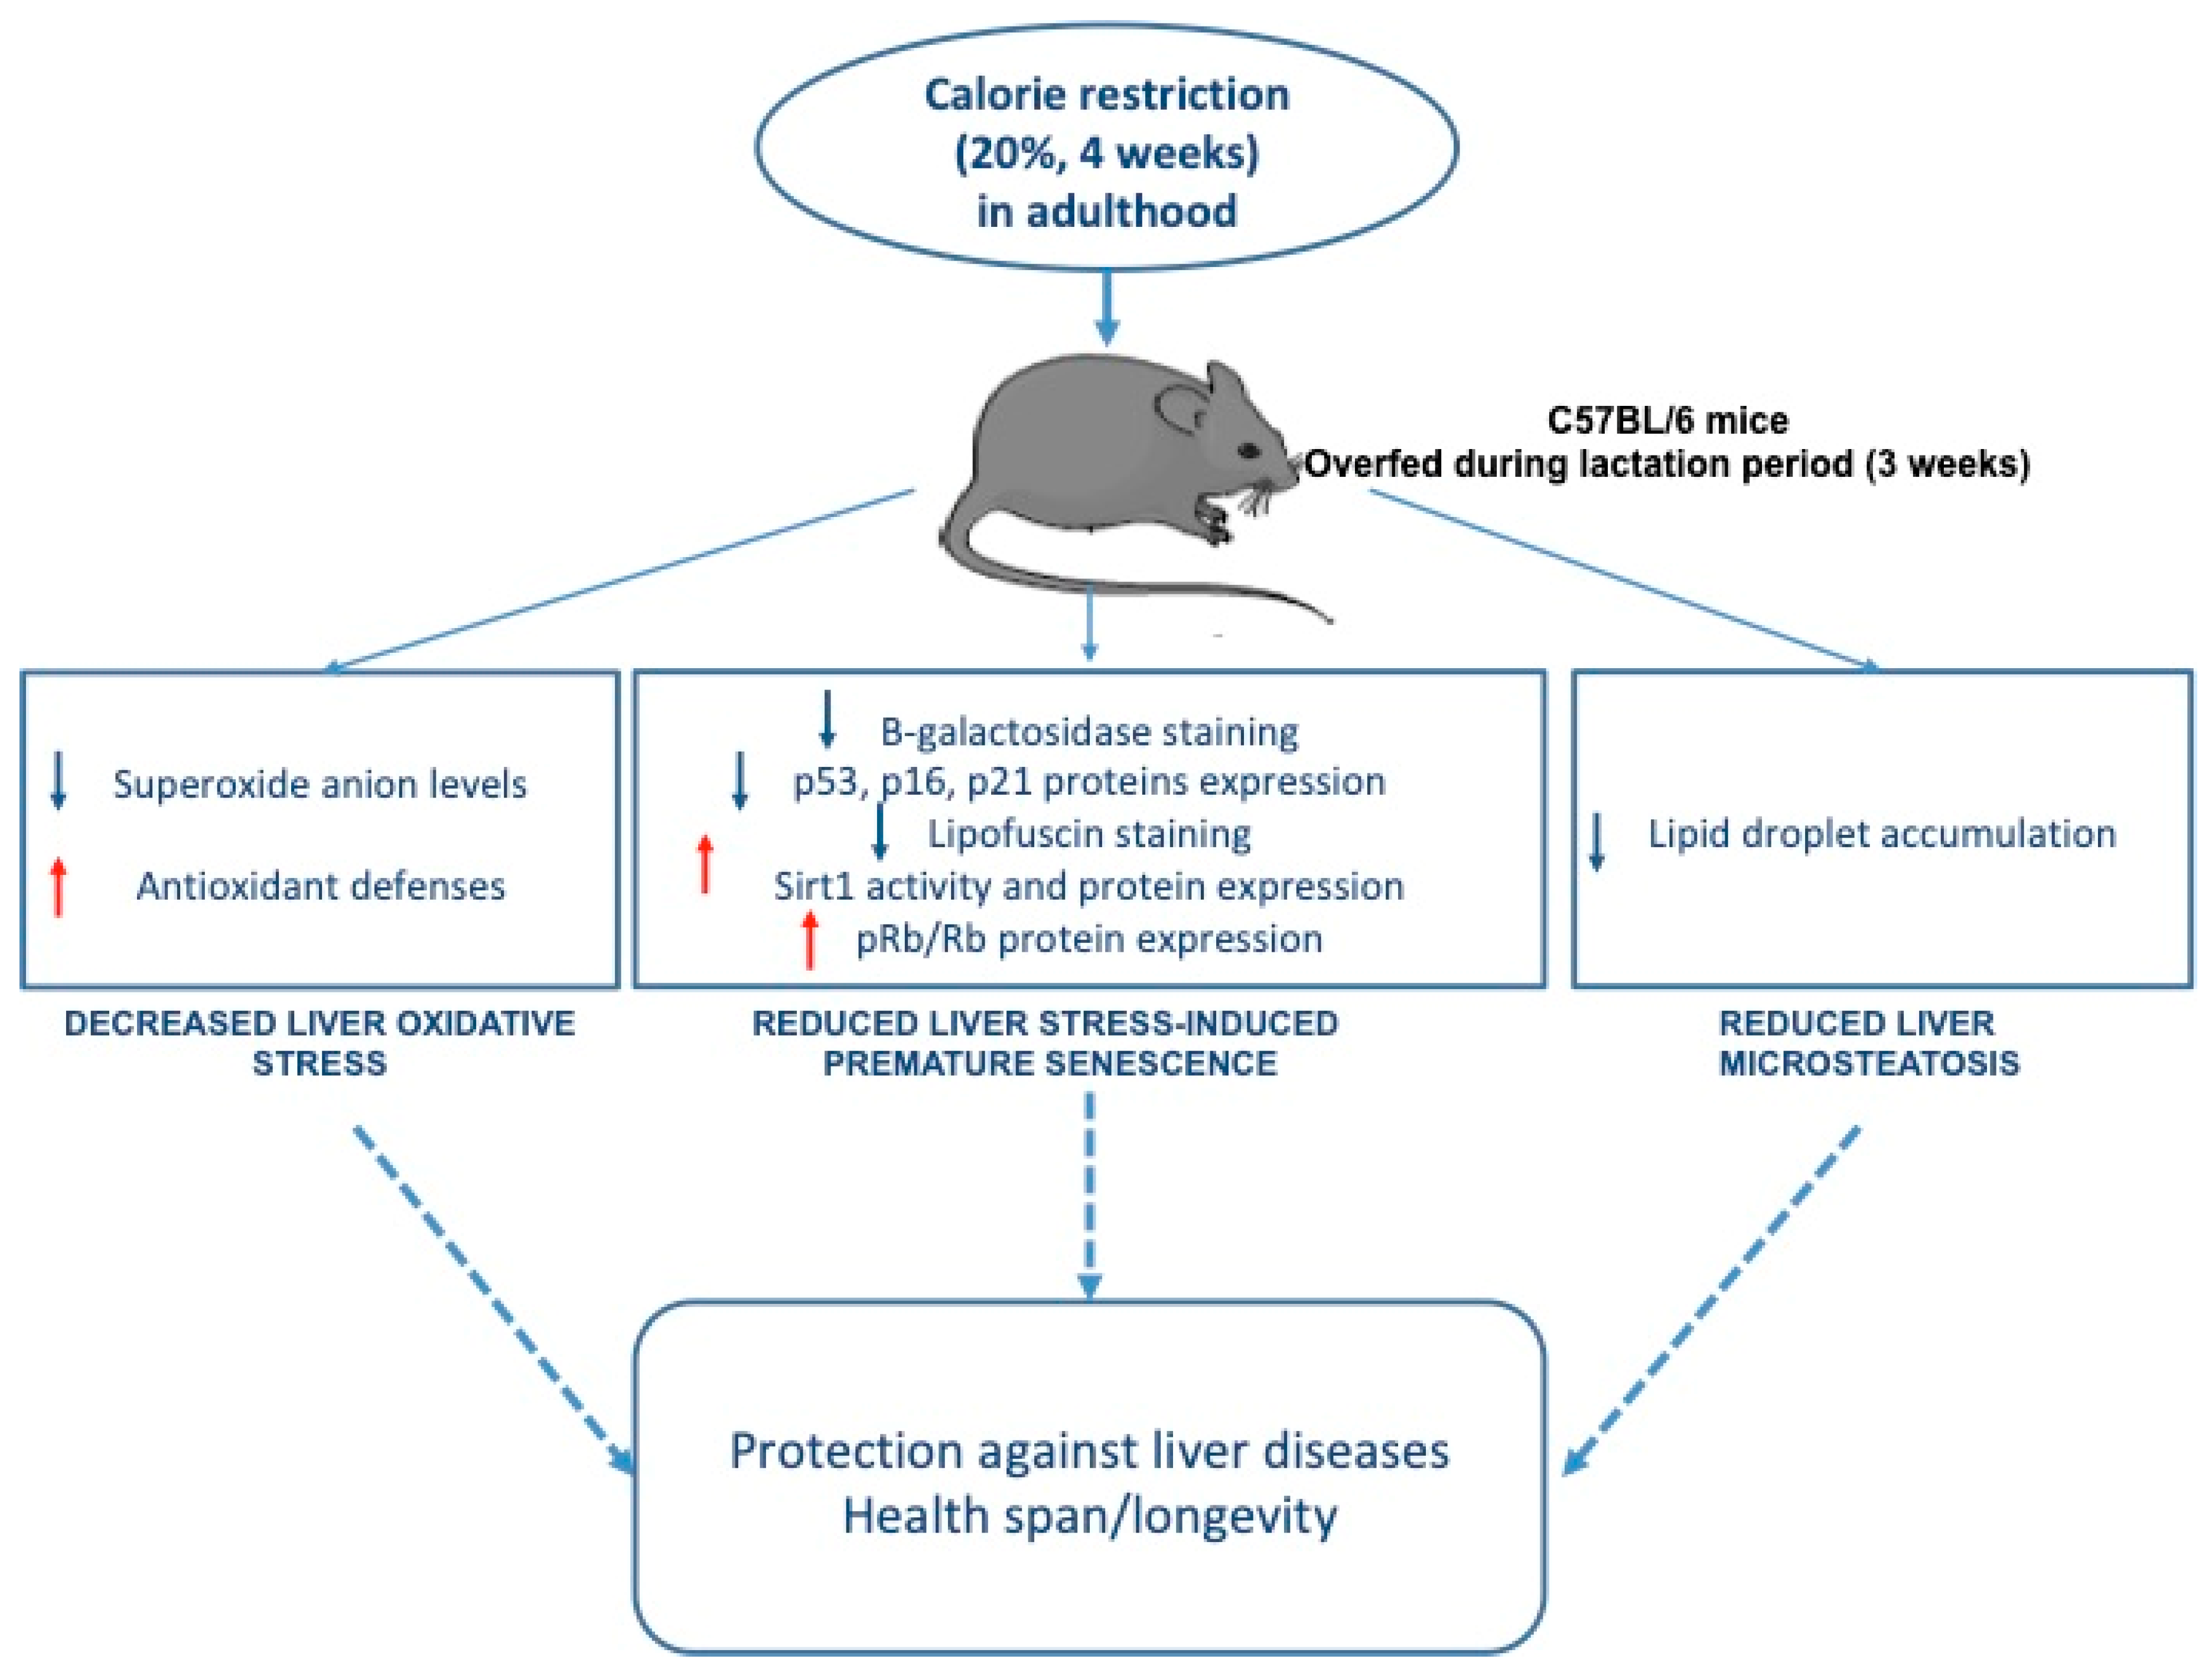
5. Conclusions
Author Contributions
Funding
Acknowledgments
Conflicts of Interest
Abbreviations
References
- NCD Risk Factor Collaboration (NCD-RisC). Worldwide trends in body-mass index, underweight, overweight, and obesity from 1975 to 2016: A pooled analysis of 2416 population-based measurement studies in 128.9 million children, adolescents, and adults. Lancet 2017, 390, 2627–2642. [Google Scholar] [CrossRef]
- Duque-Guimaraes, D.E.; Ozanne, S.E. Nutritional programming of insulin resistance: Causes and consequences. Trends Endocrinol. Metab. 2013, 24, 525–535. [Google Scholar] [CrossRef]
- Vernon, G.; Baranova, A.; Younossi, Z.M. Systematic review: The epidemiology and natural history of non-alcoholic fatty liver disease and non-alcoholic steatohepatitis in adults. Aliment. Pharmacol. Ther. 2011, 34, 274–285. [Google Scholar] [CrossRef] [PubMed]
- Bellentani, S. The epidemiology of non-alcoholic fatty liver disease. Liver Int. 2017, 37 (Suppl. 1), 81–84. [Google Scholar] [CrossRef] [PubMed]
- Cunha, A.C.; Pereira, R.O.; Pereira, M.J.; Soares Vde, M.; Martins, M.R.; Teixeira, M.T.; Souza, E.P.; Moura, A.S. Long-term effects of overfeeding during lactation on insulin secretion—The role of glut-2. J. Nutr. Biochem. 2009, 20, 435–442. [Google Scholar] [CrossRef] [PubMed]
- You, S.; Gotz, F.; Rohde, W.; Dorner, G. Early postnatal overfeeding and diabetes susceptibility. Exp. Clin. Endocrinol. 1990, 96, 301–306. [Google Scholar] [CrossRef]
- Plagemann, A.; Heidrich, I.; Gotz, F.; Rohde, W.; Dorner, G. Obesity and enhanced diabetes and cardiovascular risk in adult rats due to early postnatal overfeeding. Exp. Clin. Endocrinol. 1992, 99, 154–158. [Google Scholar] [CrossRef]
- Rodrigues, A.L.; De Souza, E.P.; Da Silva, S.V.; Rodrigues, D.S.; Nascimento, A.B.; Barja-Fidalgo, C.; De Freitas, M.S. Low expression of insulin signaling molecules impairs glucose uptake in adipocytes after early overnutrition. J. Endocrinol. 2007, 195, 485–494. [Google Scholar] [CrossRef]
- Habbout, A.; Li, N.; Rochette, L.; Vergely, C. Postnatal overfeeding in rodents by litter size reduction induces major short- and long-term pathophysiological consequences. J. Nutr. 2013, 143, 553–562. [Google Scholar] [CrossRef]
- Habbout, A.; Delemasure, S.; Goirand, F.; Guilland, J.C.; Chabod, F.; Sediki, M.; Rochette, L.; Vergely, C. Postnatal overfeeding in rats leads to moderate overweight and to cardiometabolic and oxidative alterations in adulthood. Biochimie 2012, 94, 117–124. [Google Scholar] [CrossRef]
- Li, N.; Guenancia, C.; Rigal, E.; Hachet, O.; Chollet, P.; Desmoulins, L.; Leloup, C.; Rochette, L.; Vergely, C. Short-term moderate diet restriction in adulthood can reverse oxidative, cardiovascular and metabolic alterations induced by postnatal overfeeding in mice. Sci. Rep. 2016, 6, 30817. [Google Scholar] [CrossRef] [PubMed]
- Li, S.; Tan, H.Y.; Wang, N.; Zhang, Z.J.; Lao, L.; Wong, C.W.; Feng, Y. The role of oxidative stress and antioxidants in liver diseases. Int. J. Mol. Sci. 2015, 16, 26087–26124. [Google Scholar] [CrossRef]
- Yzydorczyk, C.; Li, N.; Chehade, H.; Mosig, D.; Bidho, M.; Keshavjee, B.; Armengaud, J.B.; Nardou, K.; Siddeek, B.; Benahmed, M.; et al. Transient postnatal overfeeding causes liver stress-induced premature senescence in adult mice. Sci. Rep. 2017, 7, 12911. [Google Scholar] [CrossRef] [PubMed]
- Yu, H.; Jia, W.; Guo, Z. Reducing liver fat by low carbohydrate caloric restriction targets hepatic glucose production in non-diabetic obese adults with non-alcoholic fatty liver disease. J. Clin. Med. 2014, 3, 1050–1063. [Google Scholar] [CrossRef] [PubMed]
- Kirk, E.; Reeds, D.N.; Finck, B.N.; Mayurranjan, S.M.; Patterson, B.W.; Klein, S. Dietary fat and carbohydrates differentially alter insulin sensitivity during caloric restriction. Gastroenterology 2009, 136, 1552–1560. [Google Scholar] [CrossRef]
- Anderson, R.M.; Weindruch, R. The caloric restriction paradigm: Implications for healthy human aging. Am. J. Hum. Biol. 2012, 24, 101–106. [Google Scholar] [CrossRef] [PubMed]
- Bales, C.W.; Kraus, W.E. Caloric restriction: Implications for human cardiometabolic health. J. Cardiopulm. Rehabil. Prev. 2013, 33, 201–208. [Google Scholar] [CrossRef]
- Kim, K.E.; Jung, Y.; Min, S.; Nam, M.; Heo, R.W.; Jeon, B.T.; Song, D.H.; Yi, C.O.; Jeong, E.A.; Kim, H.; et al. Caloric restriction of db/db mice reverts hepatic steatosis and body weight with divergent hepatic metabolism. Sci. Rep. 2016, 6, 30111. [Google Scholar] [CrossRef]
- Rusli, F.; Boekschoten, M.V.; Zubia, A.A.; Lute, C.; Muller, M.; Steegenga, W.T. A weekly alternating diet between caloric restriction and medium fat protects the liver from fatty liver development in middle-aged c57bl/6j mice. Mol. Nutr. Food Res. 2015, 59, 533–543. [Google Scholar] [CrossRef]
- Guarente, L. Calorie restriction and sirtuins revisited. Genes Dev. 2013, 27, 2072–2085. [Google Scholar] [CrossRef]
- Sinclair, D.A. Toward a unified theory of caloric restriction and longevity regulation. Mech. Ageing Dev. 2005, 126, 987–1002. [Google Scholar] [CrossRef] [PubMed]
- Juif, J.G.; Langer, B. Maladies Endocriniennes Néonatales. In Médecine Néonatale et Fœtale; Haddad, J., Langer, B., Eds.; Springer: Paris, France, 2004; pp. 515–520. [Google Scholar]
- Yzydorczyk, C.; Comte, B.; Cambonie, G.; Lavoie, J.C.; Germain, N.; Ting Shun, Y.; Wolff, J.; Deschepper, C.; Touyz, R.M.; Lelievre-Pegorier, M.; et al. Neonatal oxygen exposure in rats leads to cardiovascular and renal alterations in adulthood. Hypertension 2008, 52, 889–895. [Google Scholar] [CrossRef] [PubMed]
- Georgakopoulou, E.A.; Tsimaratou, K.; Evangelou, K.; Fernandez Marcos, P.J.; Zoumpourlis, V.; Trougakos, I.P.; Kletsas, D.; Bartek, J.; Serrano, M.; Gorgoulis, V.G. Specific lipofuscin staining as a novel biomarker to detect replicative and stress-induced senescence. A method applicable in cryo-preserved and archival tissues. Aging 2013, 5, 37–50. [Google Scholar] [CrossRef] [PubMed]
- Watanabe, S.; Yaginuma, R.; Ikejima, K.; Miyazaki, A. Liver diseases and metabolic syndrome. J. Gastroenterol. 2008, 43, 509–518. [Google Scholar] [CrossRef] [PubMed]
- Alam, S.; Mustafa, G.; Alam, M.; Ahmad, N. Insulin resistance in development and progression of nonalcoholic fatty liver disease. World J. Gastrointest. Pathophysiol. 2016, 7, 211–217. [Google Scholar] [CrossRef]
- Sohal, R.S.; Weindruch, R. Oxidative stress, caloric restriction, and aging. Science 1996, 273, 59–63. [Google Scholar] [CrossRef]
- Stankovic, M.; Mladenovic, D.; Ninkovic, M.; Vucevic, D.; Tomasevic, T.; Radosavljevic, T. Effects of caloric restriction on oxidative stress parameters. Gen. Physiol. Biophys. 2013, 32, 277–283. [Google Scholar] [CrossRef]
- Mesquita, A.; Weinberger, M.; Silva, A.; Sampaio-Marques, B.; Almeida, B.; Leao, C.; Costa, V.; Rodrigues, F.; Burhans, W.C.; Ludovico, P. Caloric restriction or catalase inactivation extends yeast chronological lifespan by inducing h2o2 and superoxide dismutase activity. Proc. Natl. Acad. Sci. USA 2010, 107, 15123–15128. [Google Scholar] [CrossRef]
- Mura, C.V.; Gong, X.; Taylor, A.; Villalobos-Molina, R.; Scrofano, M.M. Effects of calorie restriction and aging on the expression of antioxidant enzymes and ubiquitin in the liver of emory mice. Mech. Ageing Dev. 1996, 91, 115–129. [Google Scholar] [CrossRef]
- Chen, L.H.; SaxonKelley, D.M.; Snyder, D.L. Effects of age and dietary restriction on liver endogenous antioxidant defenses in male lobund-wistar rats. Age 1996, 19, 101–109. [Google Scholar] [CrossRef]
- Yzydorczyk, C.; Mitanchez, D.; Buffat, C.; Ligi, I.; Grandvuillemin, I.; Boubred, F.; Simeoni, U. [oxidative stress after preterm birth: Origins, biomarkers, and possible therapeutic approaches]. Arch. Pediatr. 2015, 22, 1047–1055. [Google Scholar] [CrossRef] [PubMed]
- Joo, W.S.; Jeffrey, P.D.; Cantor, S.B.; Finnin, M.S.; Livingston, D.M.; Pavletich, N.P. Structure of the 53bp1 brct region bound to p53 and its comparison to the brca1 brct structure. Genes Dev. 2002, 16, 583–593. [Google Scholar] [CrossRef] [PubMed] [Green Version]
- Stuart, J.A.; Karahalil, B.; Hogue, B.A.; Souza-Pinto, N.C.; Bohr, V.A. Mitochondrial and nuclear DNA base excision repair are affected differently by caloric restriction. FASEB J. 2004, 18, 595–597. [Google Scholar] [CrossRef] [PubMed]
- Barja, G. The flux of free radical attack through mitochondrial DNA is related to aging rate. Aging 2000, 12, 342–355. [Google Scholar] [CrossRef]
- Bokov, A.; Chaudhuri, A.; Richardson, A. The role of oxidative damage and stress in aging. Mech. Ageing Dev. 2004, 125, 811–826. [Google Scholar] [CrossRef]
- Passos, J.F.; Nelson, G.; Wang, C.; Richter, T.; Simillion, C.; Proctor, C.J.; Miwa, S.; Olijslagers, S.; Hallinan, J.; Wipat, A.; et al. Feedback between p21 and reactive oxygen production is necessary for cell senescence. Mol. Syst. Biol. 2010, 6, 347. [Google Scholar] [CrossRef]
- Davalli, P.; Mitic, T.; Caporali, A.; Lauriola, A.; D’Arca, D. Ros, cell senescence, and novel molecular mechanisms in aging and age-related diseases. Oxid. Med. Cell Longev. 2016, 2016, 3565127. [Google Scholar] [CrossRef] [Green Version]
- Martin, B.; Mattson, M.P.; Maudsley, S. Caloric restriction and intermittent fasting: Two potential diets for successful brain aging. Ageing Res. Rev. 2006, 5, 332–353. [Google Scholar] [CrossRef] [Green Version]
- Jung, T.; Bader, N.; Grune, T. Lipofuscin: Formation, distribution, and metabolic consequences. Ann. N. Y. Acad. Sci. 2007, 1119, 97–111. [Google Scholar] [CrossRef]
- Huschtscha, L.I.; Reddel, R.R. P16 (ink4a) and the control of cellular proliferative life span. Carcinogenesis 1999, 20, 921–926. [Google Scholar] [CrossRef] [Green Version]
- Krishnamurthy, J.; Torrice, C.; Ramsey, M.R.; Kovalev, G.I.; Al-Regaiey, K.; Su, L.; Sharpless, N.E. Ink4a/arf expression is a biomarker of aging. J. Clin. Investig. 2004, 114, 1299–1307. [Google Scholar] [CrossRef] [PubMed]
- Wang, C.; Maddick, M.; Miwa, S.; Jurk, D.; Czapiewski, R.; Saretzki, G.; Langie, S.A.; Godschalk, R.W.; Cameron, K.; von Zglinicki, T. Adult-onset, short-term dietary restriction reduces cell senescence in mice. Aging 2010, 2, 555–566. [Google Scholar] [CrossRef] [PubMed] [Green Version]
- Vassallo, P.F.; Simoncini, S.; Ligi, I.; Chateau, A.L.; Bachelier, R.; Robert, S.; Morere, J.; Fernandez, S.; Guillet, B.; Marcelli, M.; et al. Accelerated senescence of cord blood endothelial progenitor cells in premature neonates is driven by sirt1 decreased expression. Blood 2014, 123, 2116–2126. [Google Scholar] [CrossRef] [PubMed]
- Olmos, Y.; Sanchez-Gomez, F.J.; Wild, B.; Garcia-Quintans, N.; Cabezudo, S.; Lamas, S.; Monsalve, M. Sirt1 regulation of antioxidant genes is dependent on the formation of a foxo3a/pgc-1alpha complex. Antioxid. Redox Signal. 2013, 19, 1507–1521. [Google Scholar] [CrossRef] [PubMed]
- Leibiger, I.B.; Berggren, P.O. Sirt1: A metabolic master switch that modulates lifespan. Nat. Med. 2006, 12, 34–36. [Google Scholar] [CrossRef] [PubMed]
- Cohen, H.Y.; Miller, C.; Bitterman, K.J.; Wall, N.R.; Hekking, B.; Kessler, B.; Howitz, K.T.; Gorospe, M.; de Cabo, R.; Sinclair, D.A. Calorie restriction promotes mammalian cell survival by inducing the sirt1 deacetylase. Science 2004, 305, 390–392. [Google Scholar] [CrossRef] [PubMed] [Green Version]
- Li, Y.; Tollefsbol, T.O. P16 (ink4a) suppression by glucose restriction contributes to human cellular lifespan extension through sirt1-mediated epigenetic and genetic mechanisms. PLoS ONE 2011, 6, e17421. [Google Scholar]
- Colak, Y.; Yesil, A.; Mutlu, H.H.; Caklili, O.T.; Ulasoglu, C.; Senates, E.; Takir, M.; Kostek, O.; Yilmaz, Y.; Yilmaz Enc, F.; et al. A potential treatment of non-alcoholic fatty liver disease with sirt1 activators. J. Gastrointest. Liver Dis. 2014, 23, 311–319. [Google Scholar]
- Tobita, T.; Guzman-Lepe, J.; Takeishi, K.; Nakao, T.; Wang, Y.; Meng, F.; Deng, C.X.; Collin de l’Hortet, A.; Soto-Gutierrez, A. Sirt1 disruption in human fetal hepatocytes leads to increased accumulation of glucose and lipids. PLoS ONE 2016, 11, e0149344. [Google Scholar] [CrossRef] [Green Version]
- Kurylowicz, A.; Owczarz, M.; Polosak, J.; Jonas, M.I.; Lisik, W.; Jonas, M.; Chmura, A.; Puzianowska-Kuznicka, M. Sirt1 and sirt7 expression in adipose tissues of obese and normal-weight individuals is regulated by micrornas but not by methylation status. Int. J. Obes. 2016, 40, 1635–1642. [Google Scholar] [CrossRef]
- Zhu, Y.; Huang, J.J.; Zhang, X.X.; Yan, Y.; Yin, X.W.; Ping, G.; Jiang, W.M. Qing gan zi shen tang alleviates adipose tissue dysfunction with up-regulation of sirt1 in spontaneously hypertensive rat. Biomed. Pharmacother. 2018, 105, 246–255. [Google Scholar] [CrossRef] [PubMed]


© 2019 by the authors. Licensee MDPI, Basel, Switzerland. This article is an open access article distributed under the terms and conditions of the Creative Commons Attribution (CC BY) license (http://creativecommons.org/licenses/by/4.0/).
Share and Cite
Yzydorczyk, C.; Li, N.; Rigal, E.; Chehade, H.; Mosig, D.; Armengaud, J.B.; Rolle, T.; Krishnasamy, A.; Orozco, E.; Siddeek, B.; et al. Calorie Restriction in Adulthood Reduces Hepatic Disorders Induced by Transient Postnatal Overfeeding in Mice. Nutrients 2019, 11, 2796. https://doi.org/10.3390/nu11112796
Yzydorczyk C, Li N, Rigal E, Chehade H, Mosig D, Armengaud JB, Rolle T, Krishnasamy A, Orozco E, Siddeek B, et al. Calorie Restriction in Adulthood Reduces Hepatic Disorders Induced by Transient Postnatal Overfeeding in Mice. Nutrients. 2019; 11(11):2796. https://doi.org/10.3390/nu11112796
Chicago/Turabian StyleYzydorczyk, Catherine, Na Li, Eve Rigal, Hassib Chehade, Dolores Mosig, Jean Baptiste Armengaud, Thibaud. Rolle, Anithan Krishnasamy, Eulalia Orozco, Benazir Siddeek, and et al. 2019. "Calorie Restriction in Adulthood Reduces Hepatic Disorders Induced by Transient Postnatal Overfeeding in Mice" Nutrients 11, no. 11: 2796. https://doi.org/10.3390/nu11112796