Differences in Tissue Distribution of Cyano–B12 and Hydroxo–B12 One Week after Oral Intake: An Experimental Study in Male Wistar Rats


Abstract
:1. Introduction
2. Materials and Methods
2.1. Animals
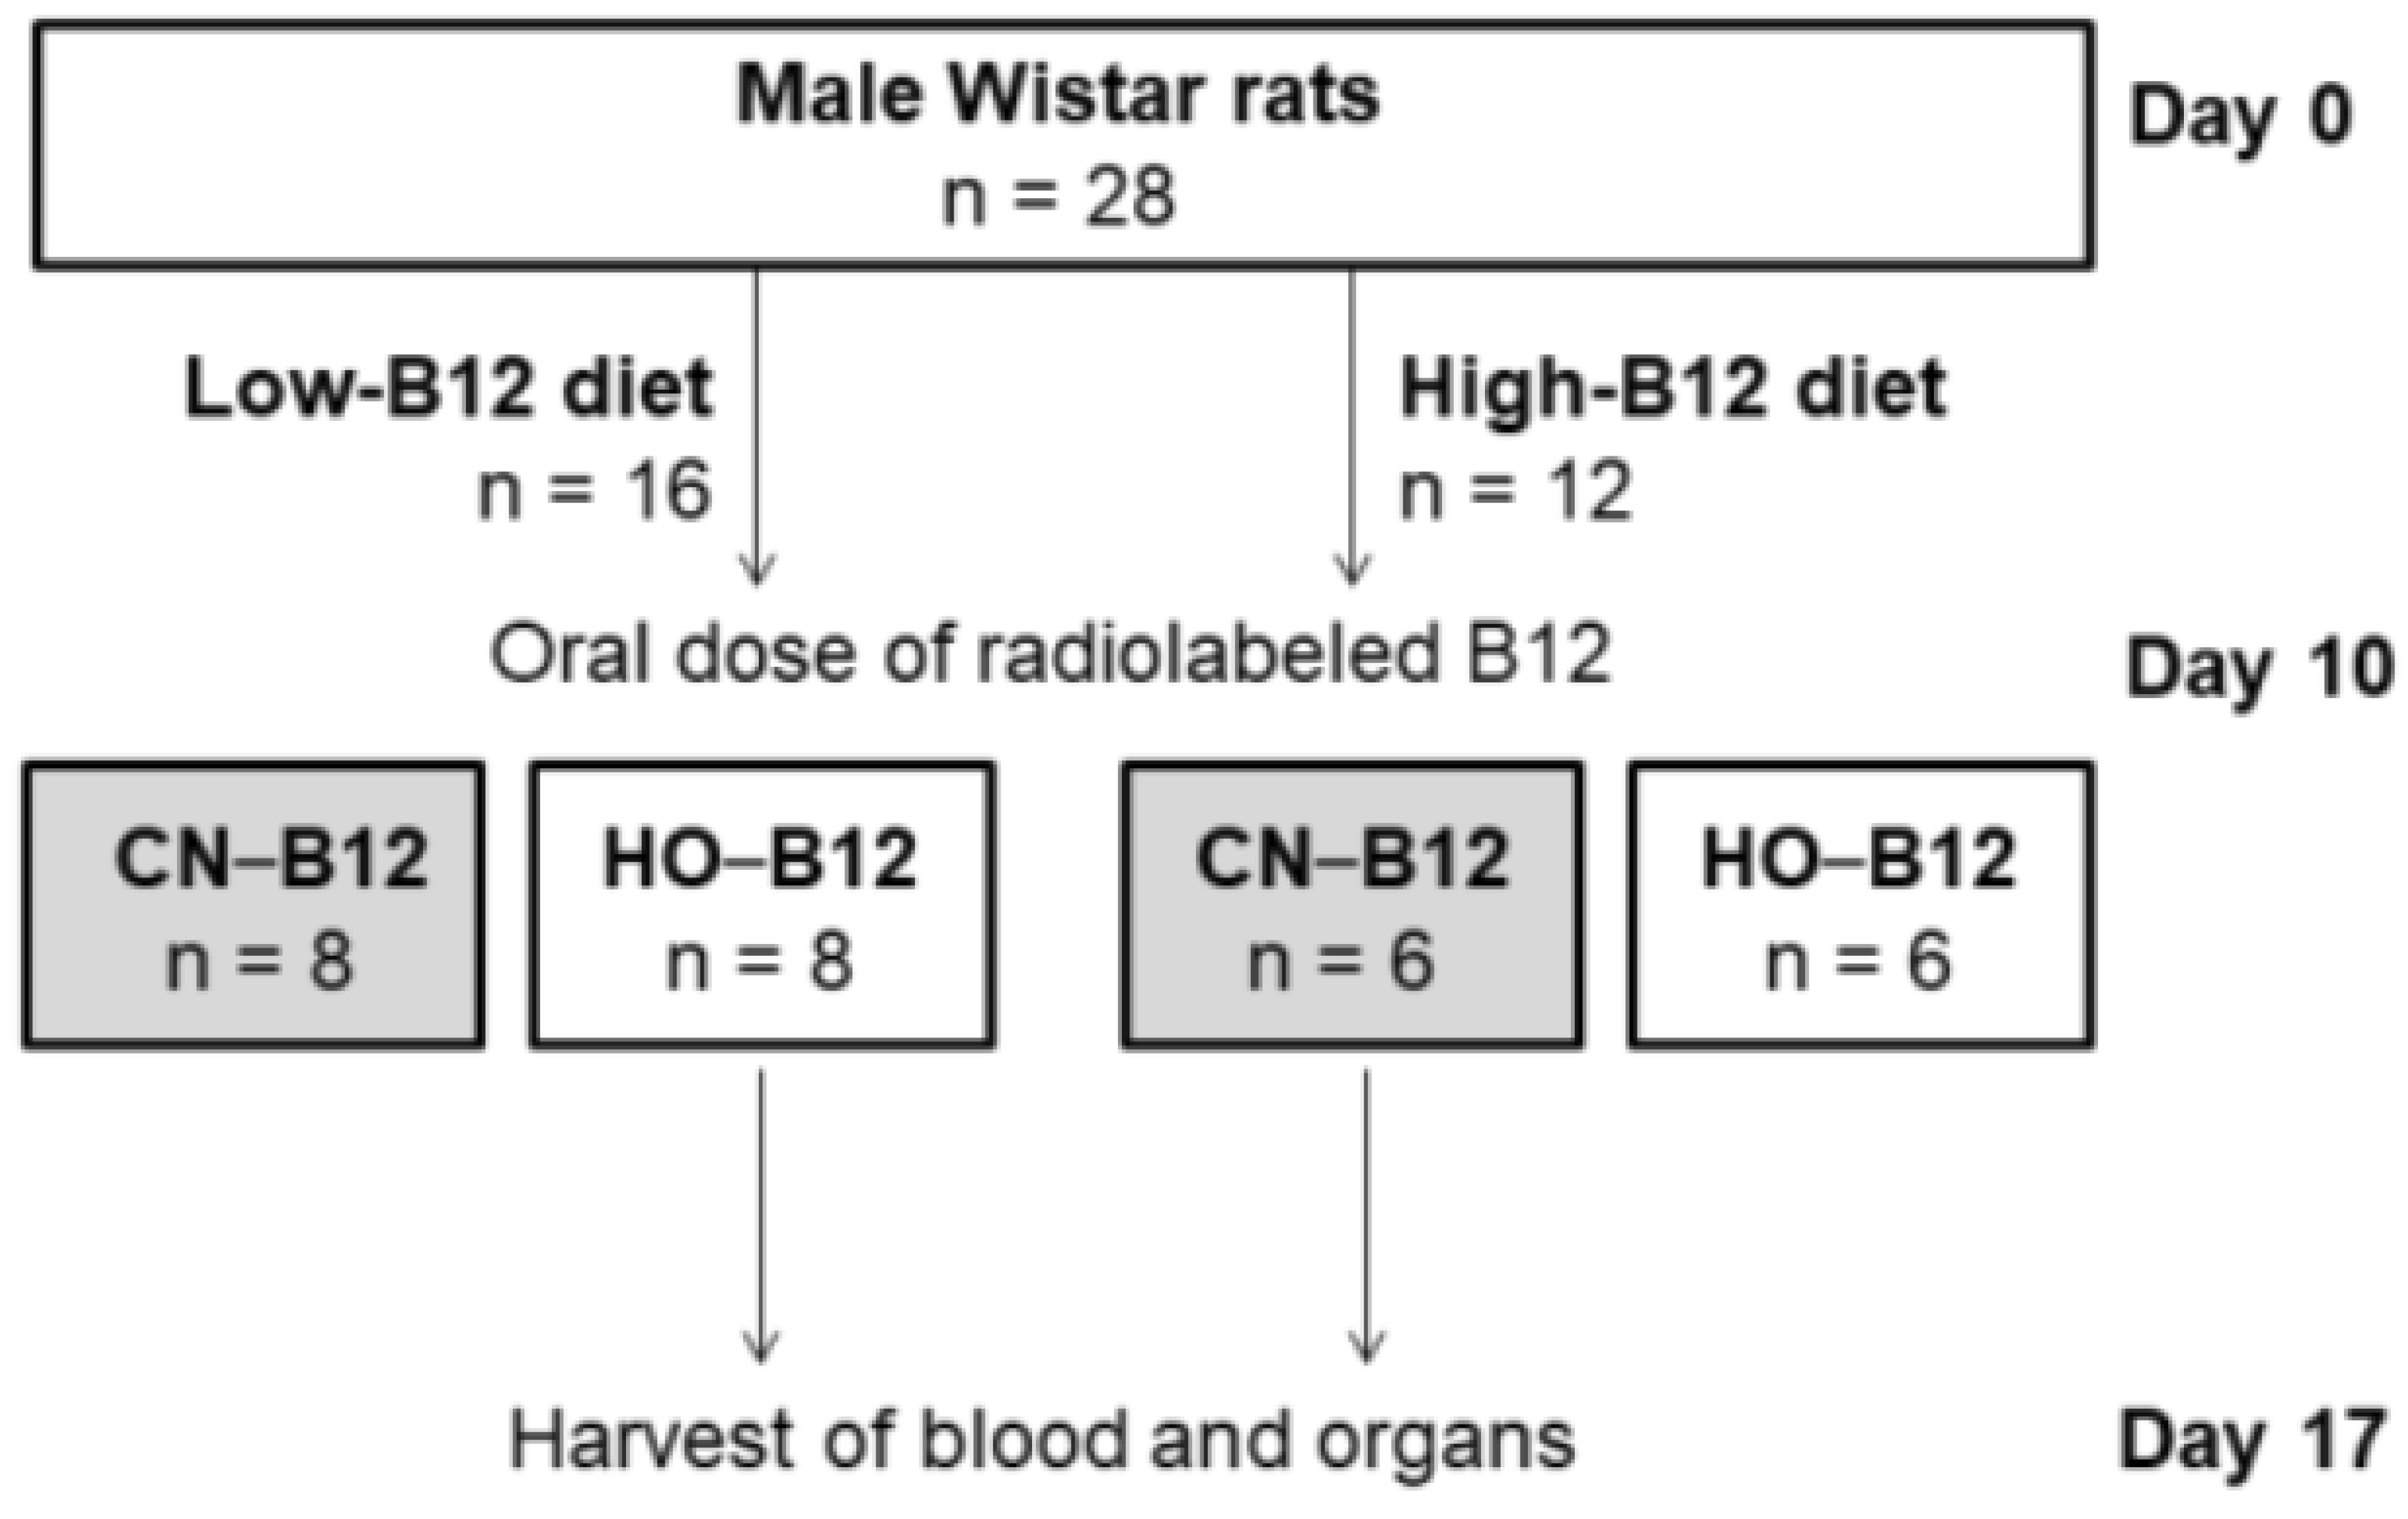
2.2. Study Design
2.3. Diets with Low and High B12 Content
2.4. Solutions for Oral Administration
2.5. Quantification of Endogenous B12 in Plasma and Tissues
2.6. Quantification of [57Co]B12 Accumulation in Plasma and Tissues
2.7. Statistical Methods
3. Results
3.1. B12 Content and Forms in the Diet
3.2. Endogenous B12 Distribution in B12-Deplete and B12-Replete Rats
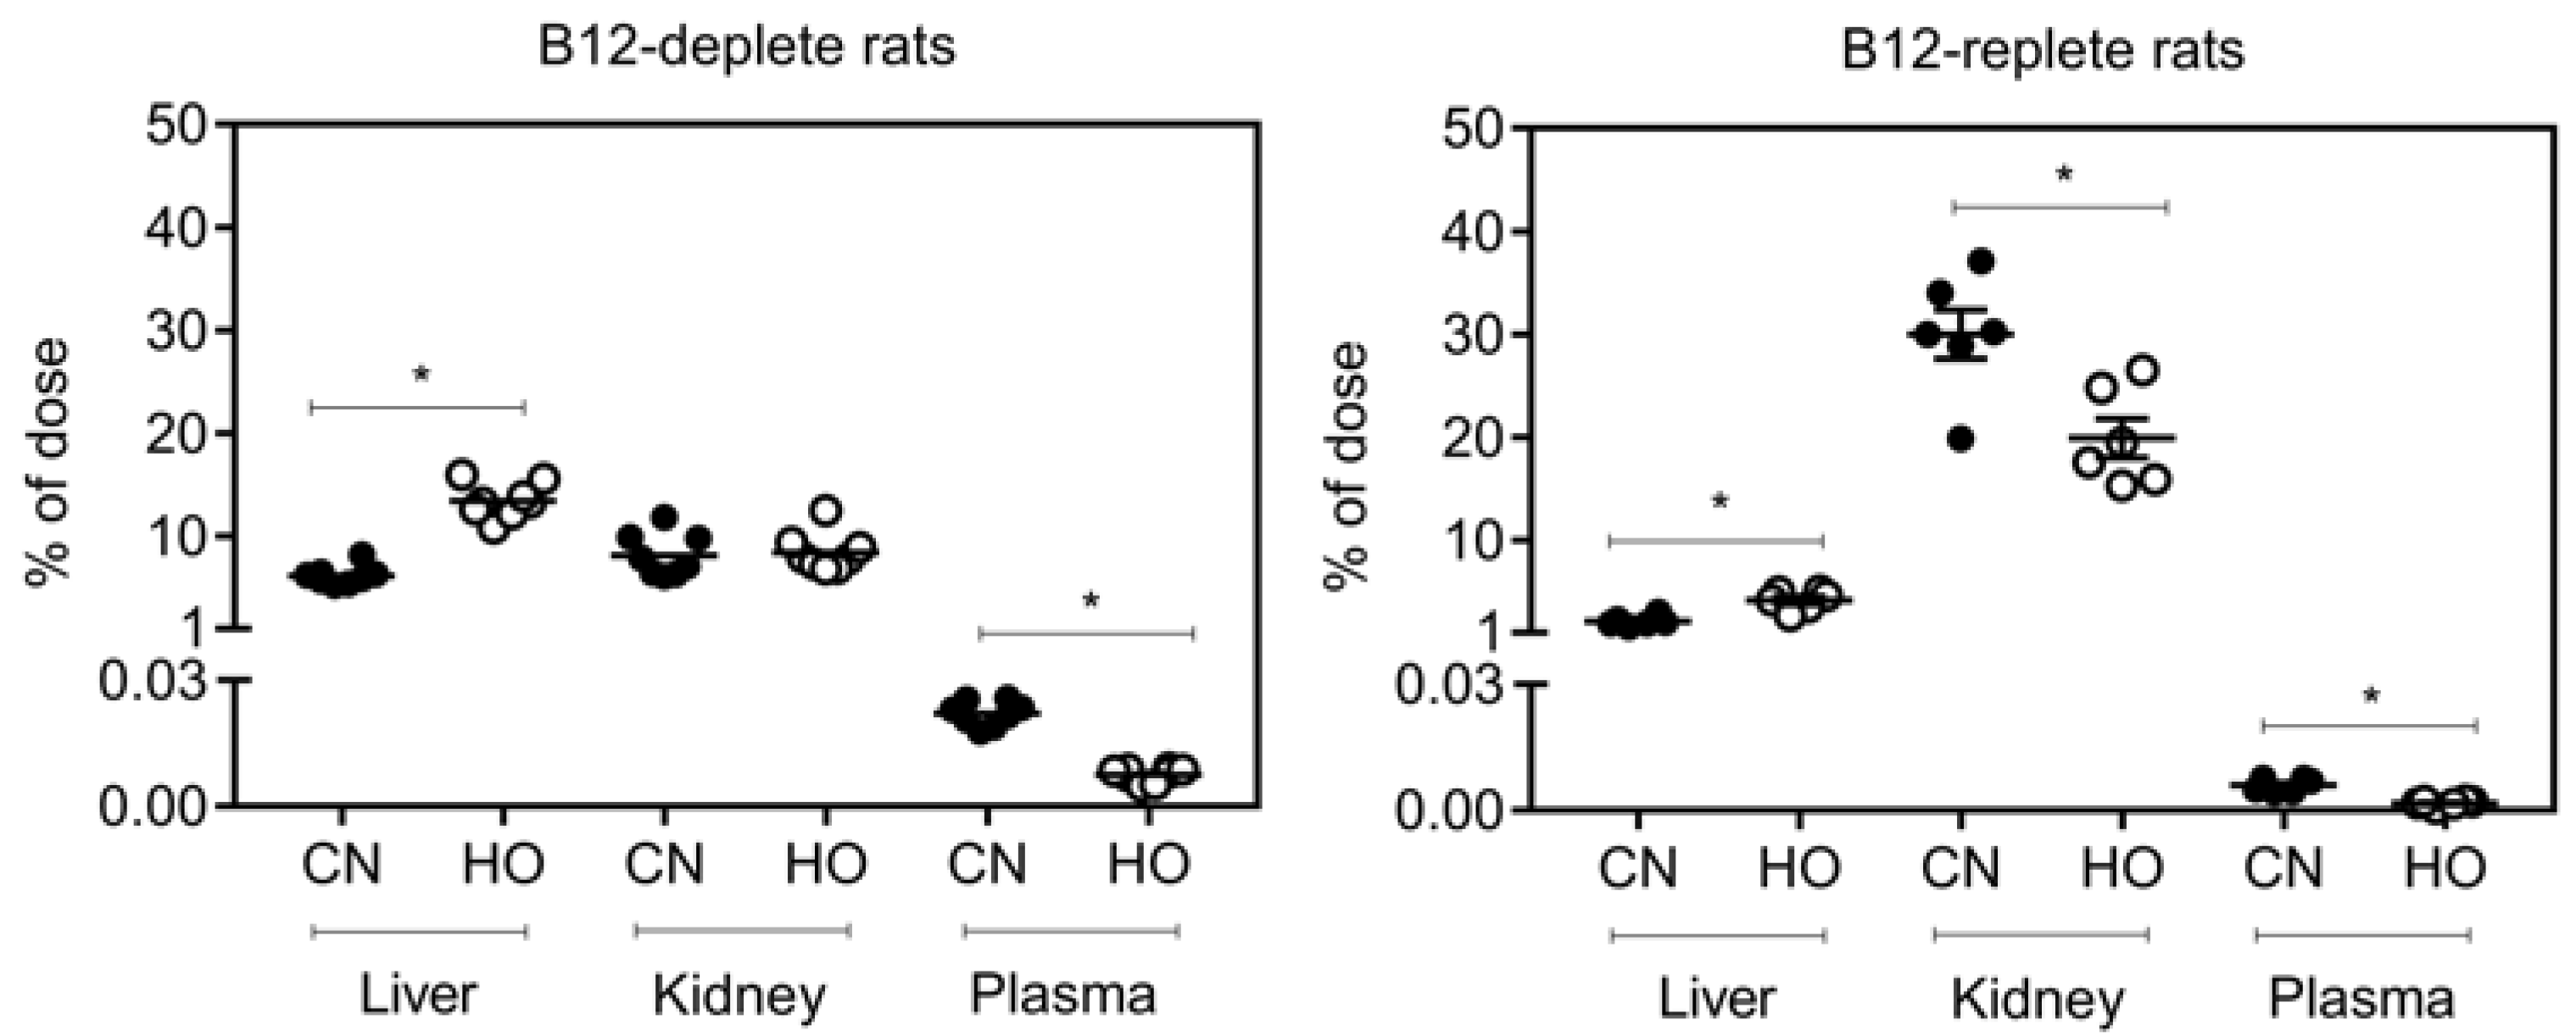
3.3. Distribution of [57Co]B12 One Week after Oral Administration to B12-Deplete and B12-Replete Rats
4. Discussion
4.1. Introduction of B12 Depletion
4.2. Distribution of Labeled CN–B12 and HO–B12
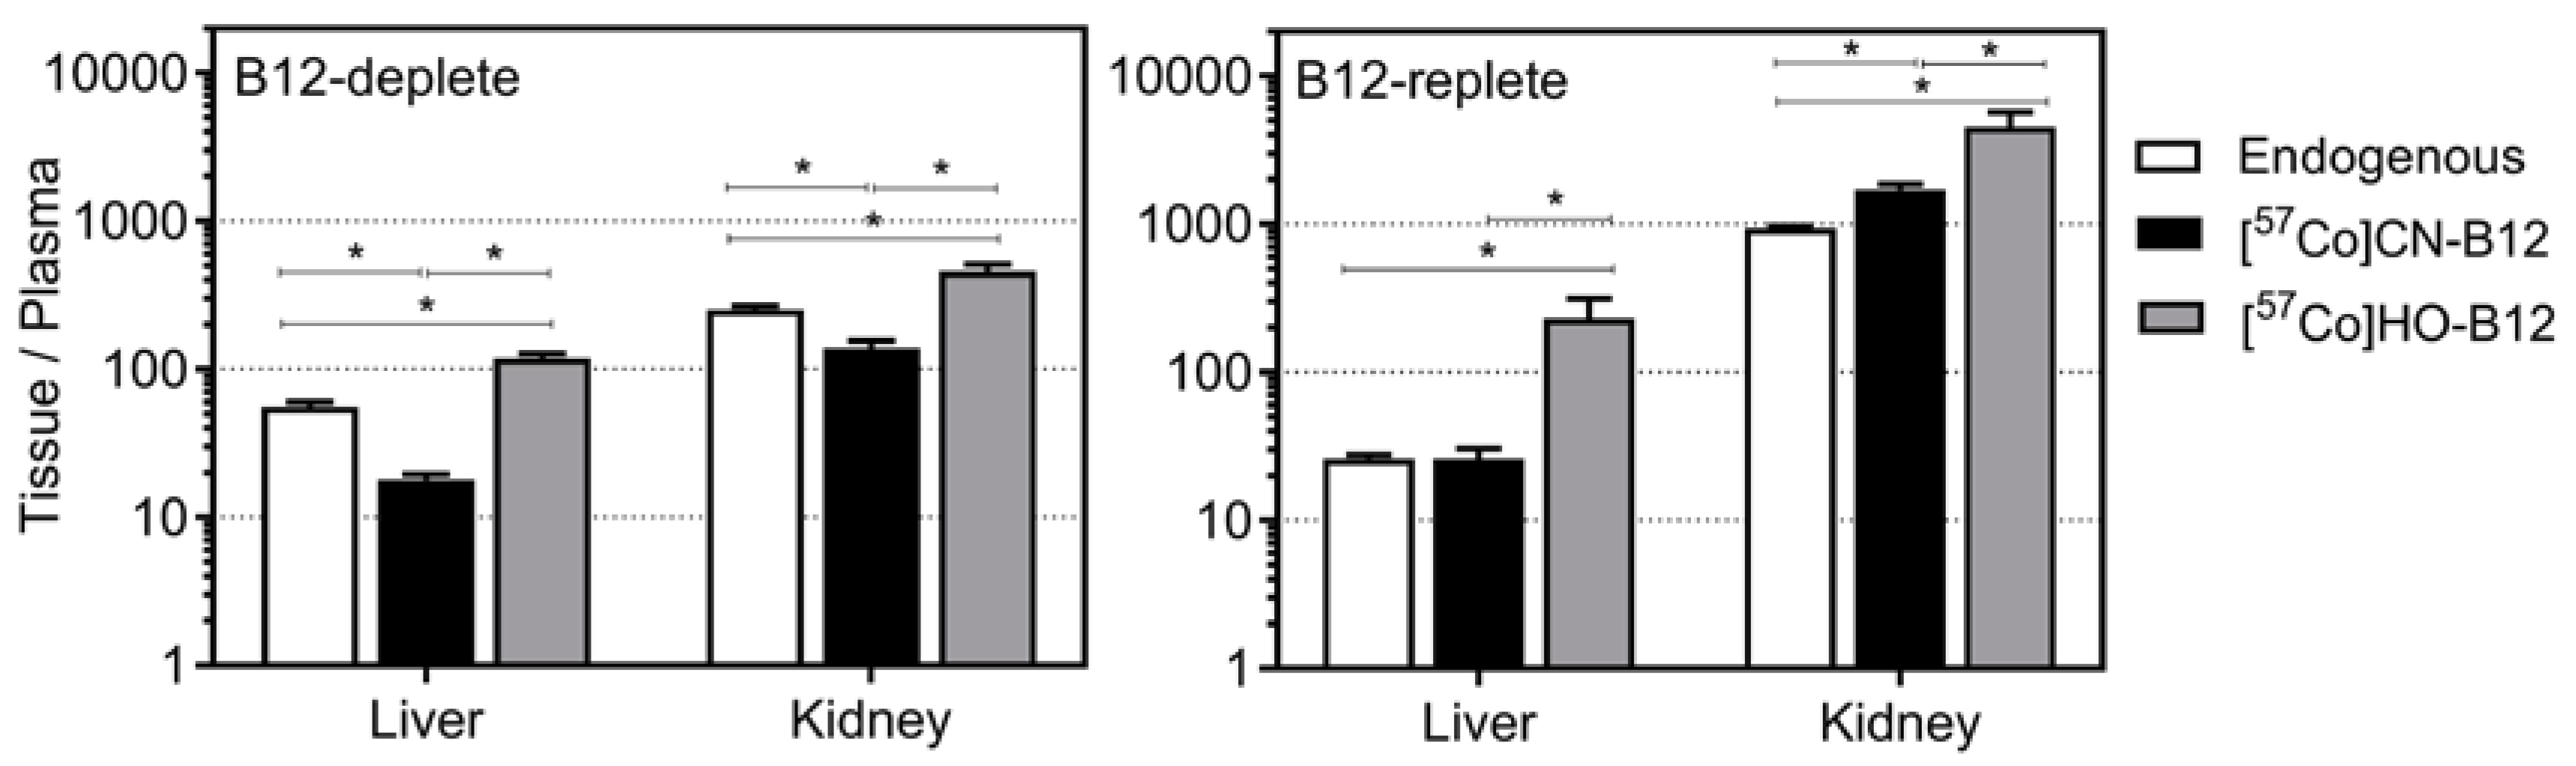
4.3. Tissues/Plasma Ratios for CN–B12 and HO–B12
4.4. Thoughts on the Isotope Dilution Technique
4.5. Study Limitations
5. Conclusions
Author Contributions
Funding
Acknowledgments
Conflicts of Interest
References
- Farquharson, J.; Adams, J.F. The forms of vitamin B12 in foods. Br. J. Nutr. 1976, 36, 127–136. [Google Scholar] [CrossRef] [PubMed]
- Kozlowski, P.M.; Garabato, B.D.; Lodowski, P.; Jaworska, M. Photolytic properties of cobalamins: A theoretical perspective. Dalton Trans. 2016, 45, 4457–4470. [Google Scholar] [CrossRef] [PubMed]
- Green, R.; Allen, L.H.; Bjorke-Monsen, A.L.; Brito, A.; Gueant, J.L.; Miller, J.W.; Molloy, A.M.; Nexo, E.; Stabler, S.; Toh, B.H.; et al. Vitamin B12 deficiency. Nat. Rev. Dis. Primers 2017, 3, 17040. [Google Scholar] [CrossRef] [PubMed]
- Adams, J.F.; Ross, S.K.; Mervyn, L.; Boddy, K.; King, P. Absorption of cyanocobalamin, coenzyme B12, methylcobalamin, and hydroxocobalamin at different dose levels. Scand. J. Gastroenterol. 1971, 6, 249–252. [Google Scholar] [CrossRef] [PubMed]
- Weisberg, H.; Jerzy Glass, G.B. Hydroxocobalamin. VI. Comparison of intestinal absorption in man of large doses of hydroxocobalamin and cyanocobalamin. Proc. Soc. Exp. Biol. Med. 1966, 122, 25–28. [Google Scholar] [CrossRef] [PubMed]
- Heinrich, H.C.; Gabbe, E.E. Metabolism of the vitamin B12 coenzyme in rats and man. Ann. N. Y. Acad. Sci. 1964, 112, 871–903. [Google Scholar] [CrossRef] [PubMed]
- Kornerup, L.S.; Juul, C.B.; Fedosov, S.N.; Heegaard, C.W.; Greibe, E.; Nexo, E. Absorption and retention of free and milk protein-bound cyano- and hydroxocobalamins. An experimental study in rats. Biochimie 2016, 126, 57–62. [Google Scholar] [CrossRef] [PubMed]
- Kornerup, L.S.; Fedosov, S.N.; Juul, C.B.; Greibe, E.; Heegaard, C.W.; Nexo, E. Tissue distribution of oral vitamin B12 is influenced by B12 status and B12 form: An experimental study in rats. Eur. J. Nutr. 2018, 57, 1459–1469. [Google Scholar] [CrossRef] [PubMed]
- Greibe, E.; Nymark, O.; Fedosov, S.; Ostenfeld, M.S.; Heegaard, C.W.; Nexo, E. Absorption of vitamin B12 administered in buffalo milk: An experimental study in rats. SciTz Nutr. Food Sci. 2017, 2, 1006–1012. [Google Scholar]
- Quadros, E.V.; Matthews, D.M.; Wise, I.J.; Linnell, J.C. Tissue distribution of endogenous cobalamins and other corrins in the rat, cat and guinea pig. Biochim. Biophys. Acta 1976, 421, 141–152. [Google Scholar] [CrossRef]
- Birn, H.; Nexo, E.; Christensen, E.I.; Nielsen, R. Diversity in rat tissue accumulation of vitamin b12 supports a distinct role for the kidney in vitamin B12 homeostasis. Nephrol. Dial. Transplant. 2003, 18, 1095–1100. [Google Scholar] [CrossRef] [PubMed]
- Greibe, E.; Kornerup, L.; Juul, C.; Fedosov, S.; Heegaard, C.; Nexo, E. The tissue profile of metabolically active coenzyme forms of vitamin B12 differs in B12-depleted rats treated with hydroxo-B12 and cyano-B12. Br. J. Nutr. 2018, 120, 49–56. [Google Scholar] [CrossRef] [PubMed]
- Scott, J.S.; Treston, A.M.; Bowman, E.P.; Owens, J.A.; Cooksley, W.G. The regulatory roles of liver and kidney in cobalamin (vitamin B12) metabolism in the rat: The uptake and intracellular binding of cobalamin and the activity of the cobalamin-dependent enzymes in response to varying cobalamin supply. Clin. Sci. (Lond.) 1984, 67, 299–306. [Google Scholar] [CrossRef] [PubMed]
- Newmark, P.A. The mechanism of vitamin B12 by the kidney of the rat in vivo. Biochim. Biophys. Acta 1972, 261, 85–93. [Google Scholar] [CrossRef]
- Uchino, H.; Yagiri, Y.; Yoshino, T.; Kondo, M.; Wakisaka, G. Conversion of cyano- and hydroxo-cobalamin in vivo into co-enzyme form of vitamin B12 in the rat. Nature 1965, 205, 176–177. [Google Scholar] [CrossRef] [PubMed]
- Zhang, Y.; Hodgson, N.W.; Trivedi, M.S.; Abdolmaleky, H.M.; Fournier, M.; Cuenod, M.; Do, K.Q.; Deth, R.C. Decreased brain levels of vitamin B12 in aging, autism and schizophrenia. PLoS ONE 2016, 11, e0146797. [Google Scholar] [CrossRef] [PubMed]
- Hardlei, T.F.; Morkbak, A.L.; Bor, M.V.; Bailey, L.B.; Hvas, A.M.; Nexo, E. Assessment of vitamin B(12) absorption based on the accumulation of orally administered cyanocobalamin on transcobalamin. Clin. Chem. 2010, 56, 432–436. [Google Scholar] [CrossRef] [PubMed]
- Thakkar, K.; Billa, G. Treatment of vitamin B12 deficiency-methylcobalamine? Cyancobalamine? Hydroxocobalamin?-clearing the confusion. Eur. J. Clin. Nutr. 2015, 69, 1–2. [Google Scholar] [CrossRef] [PubMed]
- Adams, J.F.; Tankel, H.I.; MacEwan, F. Estimation of the total body vitamin B12 in the live subject. Clin. Sci. 1970, 39, 107–113. [Google Scholar] [CrossRef] [PubMed]
- Koblin, D.D.; Tomerson, B.W.; Waldman, F.M. Disruption of folate and vitamin B12 metabolism in aged rats following exposure to nitrous oxide. Anesthesiology 1990, 73, 506–512. [Google Scholar] [CrossRef] [PubMed]

| B12-Deplete Rats (n = 16) | B12-Replete Rats (n = 12) | |
|---|---|---|
| Liver (pmol/g) | 28.2 (23.4–41.1) | 33.2 (25.2–46.7) |
| Kidneys (pmol/g) | 123 (104–188) | 1300 (1133–1512) |
| Plasma (pmol/L) | 565 (353–646) | 1410 (1150–1630) |
© 2018 by the authors. Licensee MDPI, Basel, Switzerland. This article is an open access article distributed under the terms and conditions of the Creative Commons Attribution (CC BY) license (http://creativecommons.org/licenses/by/4.0/).
Share and Cite
Greibe, E.; Nymark, O.; Fedosov, S.N.; Heegaard, C.W.; Nexo, E. Differences in Tissue Distribution of Cyano–B12 and Hydroxo–B12 One Week after Oral Intake: An Experimental Study in Male Wistar Rats. Nutrients 2018, 10, 1487. https://doi.org/10.3390/nu10101487
Greibe E, Nymark O, Fedosov SN, Heegaard CW, Nexo E. Differences in Tissue Distribution of Cyano–B12 and Hydroxo–B12 One Week after Oral Intake: An Experimental Study in Male Wistar Rats. Nutrients. 2018; 10(10):1487. https://doi.org/10.3390/nu10101487
Chicago/Turabian StyleGreibe, Eva, Ole Nymark, Sergey N. Fedosov, Christian W. Heegaard, and Ebba Nexo. 2018. "Differences in Tissue Distribution of Cyano–B12 and Hydroxo–B12 One Week after Oral Intake: An Experimental Study in Male Wistar Rats" Nutrients 10, no. 10: 1487. https://doi.org/10.3390/nu10101487