


Highlights
What are the main findings?
- Self-supervised learning of Meteosat infrared imagery identifies three convective cloud regimes over the Alps: early convection, deep convection, and overcast anvil systems.
- Extreme precipitation and hail events are associated with early-to-deep convection transitions or persistent deep-convective systems.
What are the implications of the main findings?
- Extreme-event cloud scenes represent intense realizations of existing cloud regimes within the current self-supervised representation.
- Infrared-based self-supervised representations provide an observational framework for characterizing convective evolution and evaluating cloud representation in weather and climate models.
Abstract
Extreme precipitation and hail events over complex terrain are strongly dependent on the multiscale evolution of convective systems, yet their development remains challenging to observe and model. In this study, we apply a self-supervised learning (SSL) framework to Meteosat infrared 10.8 μm imagery over the Alpine region to derive physically meaningful representations of convective cloud organization across the full daily cycle. The learned representation organizes convective cloud scenes into three primary regimes: early convection (EC), deep convection (DC), and overcast anvil systems (OA), each exhibiting distinct cloud-top properties, spatial structures, and day–night distributions consistent with established convective development stages. Within the developed SSL framework, reported extreme precipitation and hail events are preferentially associated with these regimes, occupying the upper tail of cloud-top height, optical thickness, and cloud coverage distributions within the latent space. This indicates that extremes correspond to rare, intense realizations of continuous convective variability. Two dominant pathways of cloud structure evolution are identified: a rapid EC→DC transition and a persistent DC mode. The former is characterized by fast cloud growth and intensification, while the latter corresponds to mature convective systems with sustained cloud properties. Overall, the results demonstrate that infrared-based SSL representations capture physically consistent convective stages and their transitions, providing a novel observational framework for characterizing extreme convective events and supporting the evaluation of convection-resolving numerical weather prediction models.
1. Introduction
The Alps are a hotspot for heavy rainfall and hailstorms [1,2,3], where climate change is projected to amplify precipitation extremes [4,5]. However, accurate and timely predictions of extreme precipitation in complex orographic areas are an open challenge in numerical weather prediction (NWP) models due to their poor representation of cloud systems [2,6,7].
NWP models exhibit persistent biases in representing convection and precipitation over the Alps [8,9,10], partly due to limitations in representing sub-kilometer-scale processes, such as turbulence and cloud microphysics. Additionally, cloud organization is generally not explicitly represented in NWP models, despite its potential influence on the intensification and evolution of convective systems [11,12].
Observations can enrich the model with critical information that can lead to the improvement of its performance. However, conducting observations is challenging over complex terrain. Weather radars provide valuable insights into deep moist convection over orography [13,14] but they might be affected by beam blockage and terrain-induced artifacts [15]. Similarly, Alpine field campaigns [16,17,18] provide helpful observations, but they are limited to relatively small domains and short periods.
Satellite observations, with their global coverage, constitute a valid alternative to ground-based measurements. Specifically, infrared (IR) observations from geostationary satellites provide continuous passive monitoring of cloud evolution at high temporal and moderate spatial resolution [19]. IR-based techniques are extensively used for the detection of convective clouds and their initiation [20,21,22,23], the characterization of their development and organization [24,25,26,27,28], and the identification of features related to storm severity, such as overshooting tops (OTs) [29,30]. Together, these capabilities demonstrate the value of IR observations for monitoring the evolution of convective systems throughout their life cycle, although overlying cirrus clouds can obscure the IR signature of underlying convection development stages [31].
To effectively exploit the large volume of available satellite data, cloud classification has emerged as a key tool to extract structured information, investigate convective processes and the different stages of cloud development. Early efforts such as the International Satellite Cloud Climatology Project (ISCCP) [32] laid the foundation for cloud classification based on radiative and microphysical properties, an approach that has since been facilitated by satellite observations providing increasingly comprehensive cloud products [33,34,35]. Cloud classification has also been an active area of research within machine learning (ML) applications [36]. Early approaches relied on manually engineered features extracted from satellite imagery [37,38,39]. With the increasing availability of large satellite image archives, deep learning (DL) methods have become particularly advantageous, as they eliminate the need for manual feature extraction and are highly effective at learning complex spatial patterns directly from image data [40]. DL methods have been widely applied to classify clouds [41,42,43], detect OTs [44,45], and investigate the spatiotemporal patterns of convective systems [46]. Because the majority of satellite observations remain unlabeled, unsupervised methods, such as self-organizing maps [47], contrastive learning [48], and rotationally-invariant clustering [49], have been used to identify cloud regimes across different regions and sensors. Among the unsupervised learning approaches, self-supervised learning (SSL) is particularly promising because it learns robust and transferable feature representations directly from the data [50], demonstrates resilience to dataset imbalance [51], and is therefore well suited to the study of rare extreme events. In the context of cloud classification, SSL methods have already been applied to geostationary satellite imagery. Chatterjee et al. (2023) used SSL to classify cloud systems over Germany based on high-resolution cloud optical thickness (COT) images [52,53].
Despite progress in SSL-based cloud classification, existing approaches have not been applied to learning convective organization from continuous geostationary IR imagery over complex terrain, where extreme precipitation is frequent and model representation remains limited. To address this gap, this study develops a cloud-regime classification framework based on SSL applied to all-day geostationary IR observations. Building on the methodology of Chatterjee et al. (2023) [52], we classify convective cloud spatial structures and analyze their evolution in relation to extreme precipitation and hail events over the Alpine region, identified from human-reported observations in the European Severe Weather Database (ESWD) [54]. We focus on cloud structures associated with precipitating convective systems over the Alps, encompassing phenomena ranging from individual convective cells (10–20 km) to organized mesoscale convective systems (100–500 km) [34,55]. We hypothesize that extreme precipitation events are associated with recurring spatial patterns (i.e., repeatedly observed cloud morphologies in geostationary IR imagery) and transition pathways that describe the typical sequence through which these patterns evolve during an event. Identifying such patterns from continuous geostationary observations may provide new insights into the organization and evolution of convection over complex terrain while also offering a benchmark for evaluating and improving NWP model representations. Accordingly, our objective is to assess whether the SSL model can extract robust and physically meaningful representations of convective cloud scenes from IR imagery, and to identify recurring mesoscale cloud spatial patterns and their dominant transition pathways associated with reported extreme precipitation and hail events over the Alps.
Specifically, this study addresses the following research questions:
- RQ1: Can convective scenes associated with extreme precipitation and hail events be identified among all IR-based cloud scenes using SSL?
- RQ2: Can the dominant transition pathways in convective cloud patterns related to extreme precipitation and hail be characterized using the SSL-based cloud regime classification?
2. Materials and Methods
2.1. Satellite Data
In this work, we use the brightness temperature (BT) at 10.8 μm of the Meteosat Second Generation Spinning Enhanced Visible and Infrared Imager (MSG-SEVIRI; [56]). MSG-SEVIRI has an adequate spatiotemporal resolution (i.e., a native spatial resolution of approximately 5 km and a temporal sampling of 15 min) on the Alpine domain (42–51.5°N, 5–16°E, Figure 1a). Moreover, it provides continuous long-term measurements, which are essential for assembling sufficiently large datasets for robust DL training, and the 10.8 μm IR channel is available both day and night, allowing the DL model to benefit from the variability of the all-day signal. The nighttime measurements allow us to include nocturnal convection in the analysis that is not included in Chatterjee et al. (2023) [52]. The selected wavelength at 10.8 μm lies within the atmospheric window, where the recorded BTs are primarily determined by the thermal emission from the cloud top for optically thick clouds [32], making them a useful proxy for cloud-top height.
Figure 1.
(a) Elevation map of the Alpine study domain. Training dataset: (b) Example of the random cropping procedure over the Alpine domain. Two randomly positioned 100 × 100 pixel crops (orange frame) are extracted at each timestep from the IR 10.8 μm channel. Black pixels correspond to a BT of 320 K (see colorbar in panel f) and represent clear-sky pixels masked using the cloud mask. In each crop, we extract a random pair of image views (pink and light-blue frames). (c) DeepCluster-v2 architecture used for the SSL model trained using the two views. Test dataset: (d) Collection of extreme precipitation and hail reports from the ESWD. (e) Aggregation of reports into 15-min intervals and spatial clustering (stars denote cluster centers). (f) Reconstruction of ESWD-based trajectories by linking cluster centers across consecutive timestamps, interpolating missing timestamps within 1 h, and extending trajectories by ±2 h beyond the observation period. Satellite crops (100 × 100 pixels) are then extracted at each cluster center.
We preprocessed MSG-SEVIRI data before ingesting it into the DL algorithm by applying a correction for parallax displacement since we merged satellite observations with ground-based human reports. Furthermore, the data were linearly interpolated onto a regular latitude–longitude grid with a grid spacing of 0.04°, which corresponds approximately to 4.5 km in the north-south direction and 3.3 to 2.8 km in the east-west direction. The Climate Monitoring Satellite Application Facility (CMSAF) cloud mask product (CLAAS-3; [57]), based on MSG-SEVIRI observations and resampled to the same spatial grid, is used to suppress unwanted contributions from surface features (e.g., snow-covered terrain or land-sea contrasts). We retained only cloudy pixels and assigned a baseline value of 320 K to clear-sky areas. We applied a morphological closing to fill small clear-sky gaps within cloudy regions, which occur predominantly in scenes affected by low-level clouds or snow-covered surfaces. A structuring element was used to reduce these small-scale artifacts in the CLAAS-3 cloud mask. Additional details on the selection of the structuring element and the impact of these artifacts on the dataset are provided in Appendix A.
The study period extends from 2013 to 2025, covering the summer months from April to September. The summer season experiences the highest convective activity [34] and minimizes the influence of snow-covered surfaces over the Alpine region, as snow is a major source of error for the cloud mask [57].
2.2. Training Dataset
For model training, we used the years 2013, 2017, 2021, and 2025 to sample the study period as evenly as possible. The input data for training the model consist of image subsets, hereafter referred to as crops, extracted from the full Alpine domain using a fixed window size of 100 × 100 pixels. This corresponds to an approximate physical extent of 445 km in the north-south direction and 280–330 km in the east-west direction, depending on latitude. The crop size encompasses the typical spatial scale of mesoscale convective systems in the region, which extends from approximately 100 to 500 km [34], while remaining sufficiently compact to limit computational cost. We extract two random crops per time step to increase sample diversity and improve model generalization (Figure 1b), resulting in an average pixel overlap of less than 5% between crops. In total, we generated 140,207 samples for model training. Each crop is further randomly cropped into two augmented views, which serve as the input to the SSL model (Figure 1c). More details on the multi-view strategy are given in Appendix B.
2.3. Test Dataset
For constructing the independent test dataset, we used the years that were not included in the training dataset, namely 2014, 2015, 2016, 2018, 2019, 2020, 2022, 2023, and 2024. The crops for the test dataset have the same size of 100 × 100 pixels but are no longer random. We selected precipitation and hail events with the highest quality control levels (QC1 and QC2, referring to confirmed reports and documented scientific case studies) from the ESWD [54] (Figure 1d). Hail reports correspond to hailstones with max diameters ≥2 cm, while precipitation reports indicate exceptionally heavy rainfall within 24 h. The temporal meaning of the reported event time differs between these two categories: hail reports are generally treated as instantaneous observations, whereas the timestamp of a heavy-precipitation report indicates the end of the period of heaviest rainfall. To associate ESWD reports with MSG observations, each report was assigned to the corresponding fixed 15-min MSG time slot based on its reported event timestamp, using four intervals per hour (HH:00:00–HH:14:59, HH:15:00–HH:29:59, HH:30:00–HH:44:59, and HH:45:00–HH:59:59 UTC). Within each time slot, ESWD reports were spatially clustered using DBSCAN [58] applied to their latitude–longitude coordinates, with a 150 km radius (Figure 1e). Then, consecutive cluster centroids were linked based on spatial proximity to construct continuous ESWD-based trajectories. Trajectories were obtained by linking centroids across consecutive time steps, following an approach conceptually similar to established cloud-tracking methods [59]. For each centroid, potential predecessors were searched up to 60 min backward in time at 15-min intervals, and the geographically closest to the centroid was selected. A cluster was assigned to an existing trajectory if the spatial displacement brought a propagation speed below ∼150 km h−1, which is consistent with observed propagation velocities of organized convective systems over Europe [34]; otherwise, a new trajectory was initiated. Trajectories with a total observed duration shorter than 30 min were discarded, as they contain too few timesteps to support a temporal analysis of the trajectory development. Moreover, missing 15-min steps were filled using linear interpolation in the latitude and longitude of the available cluster centroid positions to obtain temporally continuous trajectories, provided that the missing interval did not exceed 1 h. To account for reporting uncertainties inherent to human-submitted observations, trajectories were temporally extended by h to capture the broader evolution of convective systems around the reported impact. The extension was performed by linearly extrapolating the cluster centroid coordinates using the mean storm propagation velocity estimated from the trajectory, represented by latitude and longitude velocity components. Finally, we merged overlapping trajectories in time and space to avoid duplicate representations of the same cloud scenes’ evolution. Two trajectories were merged if they shared at least two common timesteps and their corresponding 100 × 100 pixel satellite crops overlapped by at least 50% of their area. Finally, satellite crops are extracted centered on the cluster centroids (Figure 1f). For cluster centroids located near the boundary of the study domain, the corresponding satellite crop was shifted inward toward the domain center to ensure that the full 100 × 100 pixel extent of the crop lies within the study domain boundaries.
2.4. Pathway Classification
For pathway analysis, we considered trajectories containing at least one of the three principal convective classes introduced in Section 3.1. Trajectories with gaps in the 15-min time series or only one timestamp were excluded to ensure consistent transition detection. Classes outside the three principal convective classes were removed, and consecutive occurrences of the same class were merged to obtain an ordered sequence of distinct states. Trajectories with more than three states after this merging step were excluded to limit interpretational ambiguity associated with complex sequences. Following this pathway-matching procedure, only 699 trajectories were retained (composed by 18,421 test crops) for the subsequent analysis. The remaining trajectories were classified as persistent (one distinct class), binary (two distinct classes), or trinary (three states involving two transitions, including sequences returning to the initial class). Further details are provided in Appendix C.
To characterize the average temporal evolution of each pathway, the 15-min satellite crops within each trajectory were first aggregated into hourly bins. All trajectories were then temporally aligned by defining the midpoint of each trajectory as the common reference (). Relative hourly bins were subsequently defined before and after this reference time. To ensure robust estimates, hourly bins with fewer than 50 test crops were excluded from the statistical analysis of pathway temporal evolution. For each pathway, temporal statistics were computed across all test crops available at each aligned time step. To account for the non-independence of crops belonging to the same trajectory, 95% confidence intervals were estimated from 1000 bootstrap resamples of trajectories, with all crops from each selected trajectory treated as a single sampling unit. The median across bootstrap estimates was reported as the central estimate.
2.5. Physical Characterization
To characterize the cloud regimes identified by the SSL framework, we use several cloud properties derived from the CM SAF CLAAS-3 dataset [33], including cloud cover (CC), cloud top height (CTH), and COT (Table 1). In addition to median CTH (CTHMedian) and median COT (COTMedian), we introduce two metrics designed to emphasize deep convective structures: the fraction of cloudy pixels with CTH exceeding 10 km (CTH10+) and the fraction with COT greater than 30 (COT30+). These thresholds are physically motivated by the typical characteristics of deep convection in mid-latitudes. CTH above 8–10 km generally indicates strong vertical development reaching the upper troposphere, while large COT values (COT > 20–30) are associated with dense, vertically developed convective clouds containing substantial ice content [32]. The CTH10+ and COT30+ metrics therefore provide proxies for the spatial extent and severity of deep convective cores within each cloud regime. CTH and COT quantities are computed over pixels identified as cloudy by the closed cloud mask, and missing retrievals are ignored during their calculation.
Table 1.
Physical variables used for characterizing cloud regimes computed for every crop.
To characterize precipitation in the test crops, we employed the satellite-based IMERG Final Run product [60], which provides rain rate estimates (mm h−1) at 30-min intervals and 0.1° spatial resolution. Although IMERG is known to exhibit uncertainties, particularly over complex terrain [61], IMERG Final Run incorporates gauge adjustment and provides a long-term, spatially continuous precipitation record with complete coverage over the Alpine region, which cannot be achieved using ground-based observations alone. The half-hourly IMERG rain-rate fields were temporally matched to the 15-min MSG observations by assigning each MSG timestamp to the corresponding IMERG 30-min interval. Specifically, the MSG timestamp was floored to the nearest lower half-hour. For each crop, the corresponding IMERG field was spatially subset to the crop extent and nearest-neighbor interpolated onto the MSG crop grid. This interpolation was used only to obtain a common grid for the spatial analysis and does not introduce information beyond the native IMERG resolution. To account for the varying area of latitude–longitude grid cells, precipitation statistics were calculated using cosine-latitude weighting. For a crop containing N valid IMERG pixels, the areal-mean precipitation rate () is defined as
where is the IMERG rain rate at pixel i and is its latitude. In addition, the fraction of the crop area receiving precipitation () was calculated as
where is the indicator function and a threshold of 0.1 mm h−1 is used to identify rainy pixels. Invalid IMERG values are excluded.
2.6. Self-Supervised Deep Learning Model
The SSL model used in this study, DeepCluster v.2, is implemented using the VISSL library developed by Facebook AI Research [62]. We adopted this model because it has been successfully used by Chatterjee et al. (2023) [52] for similar purposes. However, in this study, we train the model on 10.8 μm IR imagery to characterize cloud structures rather than using high-resolution COT data. All other architectural components and training hyperparameters are kept identical to those of the original implementation. The DeepCluster2 framework uses a Siamese ResNet-50 architecture with multi-view augmentation to learn robust semantic representations of cloud regimes from IR BT image crops. Through iterative clustering and pseudo-label assignment, these representations form the ensemble of representations of our cloud imagery dataset, the so-called feature space. The architecture is illustrated in Figure 1c and a detailed description of the data transformations, network architecture, and training procedure is provided in Appendix B.
Using a spherical k-means [63], the model classifies cloud scenes into a number of clusters (k) specified by the user based on the similarities among the features extracted from each crop. In this work, we adopted following [52]. The suitability of this choice is supported by the cluster-number sensitivity analysis presented in Section Sensitivity to the Number of Clusters.
For inference on the test dataset, the trained model backbone was used with frozen weights to compute feature vectors. Each test vector was then assigned to the nearest training centroid based on cosine similarity. The learned feature spaces reside in a 128-dimensional space, which requires dimensionality reduction for visualization. Following [52], we apply t-distributed stochastic neighbor embedding (t-SNE) [64], with principal component analysis initialization, perplexity set to 50 and cosine distance. The t-SNE embedding is fitted jointly to the combined training and test feature vectors, ensuring that both datasets are represented in the same two-dimensional space. The resulting two-dimensional embedding is used solely for visualization; all quantitative analyses are performed in the original 128-dimensional feature space.
3. Results
3.1. Characterization of the Training Dataset
The DeepCluster2 model identifies seven distinct clusters in the latent space, hereafter referred to as cloud regimes. However, 175 training crops received an invalid cluster label and were therefore excluded from subsequent analyses. Because the clustering is purely data-driven, these regimes have no predefined physical meaning. Their physical interpretation is obtained by analyzing the cloud properties of the samples assigned to each regime.
We identified three main groups of regimes: low CC regimes, which include clear sky (CS) and shallow clouds (SC); mid-level cloud regimes, split into two classes, MC1 and MC2; convective cloud regimes, identified as early convection (EC), deep convection (DC), and overcast anvil (OA). The two-dimensional t-SNE projection of the learned feature space derived from the image crops provides evidence that supports the classification presented (Figure 2a); the feature space localizes cloud images with an organization according to their morphology: low CC cloudy scenes are predominantly located on the right-hand side of the feature space, while overcast conditions occupy the left-hand side. In between these two regimes, a gradient in CC appears. The five closest and thus most representative crops to the centroids of each regime (Figure 2b) illustrate the typical morphology of each regime. Hereafter, white/gray shades correspond to lower BTs (cold, high cloud tops), while darker shades indicate higher BTs (warm surfaces or low-level clouds). Class CS is characterized by nearly uniform black scenes with very limited BT-based cloud features. Class SC exhibits sparse and fragmented dark-grey structures occupying a small fraction of the image. Classes MC1 and MC2 show increased CC, with a mixture of dark- and light-grey regions and subtle differences in their spatial fragmentation and organization. Class EC is characterized by weak and fragmented cloud features with predominantly darker-grey tones and limited spatial extent. Class DC displays large contiguous regions of very light-grey and white shades embedded within darker surroundings, resulting in strong spatial contrast across the scene. In contrast, class OA exhibits more homogeneous cloud coverage, with light-grey regions distributed more uniformly throughout the image and fewer areas of strong contrast.
Figure 2.
Visual inspection of the learned feature space after model training. (a) Two-dimensional representation obtained using the t-SNE technique, showing around 300 examples of image crops; stars indicate the centroid positions. The crop grid image is created by dividing the feature space into a regular grid, and selecting for each cell the image closest to the cell center. BT 10.8 μm images are reproduced using a greyscale colormap normalized between 240 K and 320 K. This IR BT representation is used throughout the text. (b) Example of image crops corresponding to the five samples closest to each class centroid for the seven regimes.
The OA class is the most frequent, whereas EC and MC1 occur the least often (Figure 3a). If we look at the occurrence during daytime and nighttime (Figure 3a), CS, EC, and DC are the only classes exhibiting a preference for daytime occurrence, while the rest of the classes show more similar contributions from nighttime and daytime observations. When looking at the hourly-based diurnal cycle (Figure 3b), the peak occurrence of EC between 10 and 14 UTC suggests its association with the convection onset stage, acting as a precursor to the DC class, more frequent between 12 and 19 UTC. In contrast, CS and OA exhibit a more uniform diurnal distribution, and SC, MC1 and MC2 show a slightly enhanced occurrence from 17 to 8 UTC.
Figure 3.
Physical characterization of the training set feature space. (a) Number of samples per class, separated into daytime (05-17 UTC) and nighttime (18-04 UTC) observations (hatched). (b) Hourly distribution of samples for each class, shown as stacked bars. (c–e) Boxplot distributions of CC (c), CTHmedian (d), and COTmedian (e) for each class. Classes dominated by nighttime samples may contain fewer data points due to the unavailability of COT retrievals during nighttime conditions.
The lowest CC values of 9% and 25% occur for CS and SC, respectively (Figure 3c). Both classes show low CTHmedian values (median < 3.5 km) and small COTmedian (median ) (Figure 3d,e). Although CTHmedian occasionally exceeds 8 km, these cases are not associated with an increase in optical thickness (COT below ), indicating that high cloud tops mainly correspond to thin cirrus layers rather than deep convection. As shown in Figure S1, both classes occur more frequently over the Italian part of our domain, with the strongest regional contrast observed for the CS class. The mid-level cloud regimes MC1 and MC2 are characterized by substantially higher CC than CS and SC, with MC2 exceeding 60% on average (Figure 3c). Both regimes occur preferentially during nighttime hours, suggesting an association with radiatively driven boundary-layer processes and large-scale stratiform conditions. As shown in Figure 3d,e, MC2 exhibits higher CTH (median: ∼4 km) compared to MC1 (median: ∼3.5 km), while MC1 shows larger COTmedian values (median ∼8 vs. ∼7). These classes are more prevalent on the northern side of the Alps, particularly for the MC1 class (Figure S1). The physical distinction between MC1 and MC2 remains uncertain and may reflect either distinct stratiform regimes or different stages of cloud evolution. Disentangling these interpretations would require a more detailed analysis of regime transitions, which is beyond the scope of this study.
Among the convective classes, EC exhibits moderate CC (mean ∼40%), higher than SC but lower than MC1 and MC2, despite its morphological similarity to SC (Figure 3c). With a CTHmedian of about 4 km and a COTmedian of 5, this class exhibits intermediate cloud properties between SC and the mid-level classes (Figure 3d,e). Combined with its pronounced appearance between 10 and 14 UTC, this pattern suggests the development of convective cells that reach moderate CTHs but remain limited in CC and COT, consistent with an early convective stage [27,32,34]. The DC class shows higher CC (median ∼72%) and larger CTHmedian values (nearly 9 km) compared to EC (Figure 3c), and COT (COTmedian generally ), larger than all other classes except OA (Figure 3d,e). This combination indicates vertically developed convective cores embedded within relatively clearer surroundings, consistent with mature convective cells [20,29,55]. The geographical distribution of classes EC and DC (Figure S1) shows a higher occurrence in the southern Alps, a region known to be more prone to convective events [65,66]. Finally, the OA class exhibits the largest CC (Figure 3c); however, it shows lower CTH than DC (median CTHmedian around 8 km) but substantially larger COTmedian, with median around 15 (Figure 3d,e). These characteristics indicate widespread optically thick cloud shields associated with mature convective anvils. Alternatively, some cases may correspond to convective systems embedded in frontal systems characterized by very high CC (around 90%) and extensive high-level cloud layers [55,67,68]. This is further supported by the geographical distribution in Figure S1, where this class appears more frequently on the northern side of the Alps, a region more strongly influenced by frontal systems [69].
3.2. Feature Space Representation of Extreme-Event Cloud Scenes
Subsequently, we investigated how the ESWD-based trajectories associated with extreme precipitation and hail in our independent test dataset evolve and are located in the learned feature space. By ingesting the test dataset into the model, we extract the associated feature vectors for each crop of the trajectory and investigate their characteristics. We first look at where the feature vectors of the extreme events are in the feature space (Figure 4a); the highest number of test feature vectors overlaps primarily with the convective classes EC, DC, and OA, with a minor contribution from MC2. In particular, the densest 50th percentile contoured region is centered on class DC, previously identified as mature deep convection, with only a minor superposition with EC. In the test set, 61.30% of samples are classified as DC, while EC and OA account for 15.29% and 15.62%, respectively, with the remaining regimes contributing only a small fraction (Figure 4b).
Figure 4.
Feature space representation of the test dataset. (a) Density contours of test feature spaces (50th solid, 90th dashed percentiles) overlaid on the training feature space (colored points) and class centroids (triangles). (b) Number of test samples assigned to each class. (c–e) Same as (a), but shown separately for each class: EC (c), DC (d), and OA (e). (f–h) Distributions of cosine similarity to the corresponding class centroid for training samples (dotted lines) and test samples (solid lines), shown for EC (f), DC (g), and OA (h).
Extreme events can be identified within the feature space; i.e., it can be assessed both visually in the t-SNE projection and quantitatively through the cosine similarity to class centroids. For EC (Figure 4c), test samples are predominantly located near the boundary with the DC class, suggesting that these cases already exhibit characteristics of more developed convection, consistent with the construction of the trajectories. The cosine similarity to the EC centroid (Figure 4f) is similar between training and test samples, with mean values of and , respectively. For DC, as shown in Figure 4d, test samples are distributed both close to the centroid and toward the outer edge of the class, away from neighboring regimes. This is reflected in the cosine similarity distribution (Figure 4g), with a lower mean similarity for test samples () than for training samples (). For OA (Figure 4e), the feature space distribution is more heterogeneous, with multiple high-density regions, including one near the centroid and others toward the class periphery. Consistently, the cosine similarity distribution (Figure 4h) is shifted toward lower values for test samples, with mean similarity decreasing from in the training set to in the test set.
Overall, extreme-event samples are not randomly distributed within the feature space but occupy specific regions, generally located farther from class centroids. This is consistent with their interpretation as tail realizations of the underlying cloud regimes, indicating that extreme events correspond to less frequent, specific realizations of each regime in the learned representation space. The OA class represents a partial exception, showing a more dispersed and irregular structure, which may reflect the inclusion in the OA class of different cloud regimes, including anvil outflow from isolated convective cells and embedded convection within frontal systems.
3.3. Physical Characteristics of Extreme-Event Cloud Scenes
To assess how extreme events differ from the training distribution, we compare their physical properties across the identified three convective regimes. The 24 h distribution (Figure 5a) shows that EC events are strongly daytime-driven, with a peak around 13 UTC, compared to a peak near 12 UTC in the training dataset. DC events occur throughout the diurnal cycle and reach a maximum near 16 UTC, whereas the training dataset exhibits a broader peak between 15 and 18 UTC. OA events are more evenly distributed in time, with only a modest late-afternoon enhancement. Relative to the training dataset, nighttime occurrences are markedly reduced in both EC and DC. Furthermore, EC events are shifted slightly toward later occurrence times. Overall, approximately 40% of events occur during nighttime (18–04 UTC), indicating a substantial contribution from nocturnal convection. This behavior agrees with previous studies of Alpine convection, reporting afternoon initiation over mountainous terrain followed by mature, organized convection and mesoscale system development later in the day [26,70,71].
Figure 5.
Physical characterization of the test dataset. (a) Diurnal distribution of test samples for convective classes EC, DC, and OA. (b) Distribution of CC across the three classes. (c–e) Two-dimensional histograms of vs. for EC, DC, and OA, respectively, overlaid with training-set density contours (50th, 75th, 90th, 99th percentiles from the innermost to the outermost contour) and mean values (crosses). (f–h) Same as (c–e), but for vs . (c–h) Since COT is available only during daytime conditions, we retained only crops with a timestamp going from 5 to 17 UTC.
In Figure 5b, all convective classes exhibit higher CC values in the test set than in the training dataset. The shift is largest for EC, increasing from to , while DC increases from to and OA from to . A clearer separation emerges in the joint distribution of and (Figure 5c–e). Across all convective classes, test samples are shifted toward higher CTHs and COTs. The shift in is largest for EC, increasing from km in the training set to km in the test set, while DC increases from km to km and OA from km to km. Similarly, increases from to for EC, from to for DC, and from to for OA. The largest increase in COT is therefore observed for OA, consistent with the development of optically thicker cloud shields during extreme events. This enhanced vertical and optical development is further highlighted by CTH10+ and COT30+ (Figure 5f–h). For EC, CTH10+ increases from to , while COT30+ increases from to . DC shows a stronger enhancement, with CTH10+ increasing from to and COT30+ from to . OA exhibits COT30+ increasing from to , while CTH10+ increases from to . Overall, these shifts indicate that test samples exhibit enhanced cloud properties across all convective regimes, with the greatest changes in the optically thick characteristics of OA and DC.
Extreme precipitation and hail events do not constitute a distinct cloud regime, but are preferentially associated with the DC regime and occur as more intense realizations within the broader convective-regime manifold. Within the convective regimes, extreme-event samples also exhibit systematically colder, optically thicker, and more extensive cloud tops are consistent with stronger vertical development and larger anvils, characteristic of organized deep convection [55,72,73]. This suggests that the SSL representation captures cloud morphology and storm organization from IR observations alone, consistent with previous studies linking IR cloud-top patterns to the dynamical state of deep convection [23,27,74].
Building on this representation, we next investigate how convective systems evolve within the feature space by analyzing transition pathways across the identified classes, providing further insight into the dynamical organization of extreme events.
3.4. Pathways Statistics
We first identify the most frequent convective pathways. In total, 337 trajectories follow persistence pathways, 281 follow binary pathways, and 81 follow trinary pathways. Overall, 14 of the 21 theoretically possible pathway combinations are observed. To ensure sufficient sample sizes for the pathway analysis, we retain only pathways occurring at least 10 times; the resulting 10 pathways are reported in Table S1. Two pathways clearly dominate the distribution: persistence DC, with 243 trajectories, and the EC→DC transition, with 188 trajectories. Although the two most frequent pathways are not associated with the highest values of the selected cloud properties, together they account for 61.7% of the identified trajectories.
In the t-SNE feature space (Figure 6a), trajectories following the EC→DC pathway span the regions associated with both classes, with their density extending from the EC region toward the DC region. In contrast, DC-persistence trajectories (Figure 6b) are concentrated around the DC centroid, although a secondary population extends toward the cluster periphery. These peripheral trajectories are associated with more developed cloud structures than those closer to the centroid, exhibiting higher CC (85% vs. 71%), greater CTHmedian (10.2 vs. 9.2 km), and higher COTmedian (12.1 vs. 10.2).
Figure 6.
T-SNE-based feature space of EC→DC (a) and DC persistence (b) pathways showing training samples, class centroids, density contours for the full test set, and density contours for the trajectories associated with each pathway. The density contours delineate the 50th percentile of the probability density. Selected crops from trajectories associated with EC→DC pathway (c) and DC persistence (d). The frame color around the image crops represents the assigned cloud class color (EC: yellow, DC: red).
Figure 6c presents representative BT image crops from one selected trajectory for the EC→DC pathway. The trajectory exhibits a gradual and organized expansion of the cold BT region (white), which is clearly contrasted against a predominantly dark background, indicative of clearer-sky or low-cloud surroundings. In contrast, the DC persistence pathway (Figure 6d) is characterized by an extensive cold BT area already at the initial stages with a non-regular expansion evolution, while the surrounding background appears more uniformly overcast throughout the trajectory.
The following analysis focuses on the temporal evolution of the two dominant pathways to characterize the typical evolution of severe convective cloud scenes.
3.5. EC → DC Transition
The cosine similarity evolution of the EC→DC pathway is illustrated in Figure 7a: similarity to the EC centroid decreases from to , while similarity to the DC centroid increases from onward. The largest number of EC→DC transitions occurs between approximately and , indicating that the main regime transition is concentrated around this period.
Figure 7.
Hourly binned and time-aligned characterization of the two most common pathways: EC→DC (left column) and DC persistence (right column). From top to bottom: (a,b) temporal evolution of cosine similarity for the classes characteristic of each pathway, with class-transition counts overlaid on the right-hand axis for EC→DC; (c,d) temporal evolution of CTHmedian and COTmedian; (e,f) temporal trends of the CC, CTH10+, and COT30+; (g,h) and ; and (i,j) daytime (05:00–17:00 UTC) and nighttime (18:00–04:00 UTC) crop counts, together with the corresponding trajectory counts. Only hourly bins containing at least 50 crops are shown. COTmedian and COT30+ are computed using daytime crops only, with a minimum of 50 daytime crops required per hourly bin. Lines show medians or, for the count panels, observed counts; shaded areas and error bars indicate 95% confidence intervals obtained from 1,000 trajectory-level bootstrap resamples.
The transition is accompanied by a pronounced evolution of cloud properties (Figure 7c). CTHmedian increases from approximately 5.9 km at to 9.8 km at , exceeding 10 km from onward and reaching approximately 10.6 km at . The strongest increase occurs between and , coinciding with the largest number of regime transitions. COTmedian increases from approximately 4.5 at to 7.2 at , followed by a decrease at later times. This late-stage decrease should be interpreted with caution because COT statistics increasingly represent only the daytime subset as the trajectories shift toward nighttime conditions.
The cloud-area metrics show a consistent increase in the spatial extent of deep-convective structures (Figure 7e). CC increases from approximately 51% at to 68% at and reaches about 76% at . CTH10+ also increases substantially, from approximately 23% at to 49% at and 67% at . Similarly, COT30+ increases from approximately 9% at to about 24% around , remaining broadly stable thereafter. Together, these changes indicate an increasing spatial extent of high, optically thick cloud associated with the development of the DC regime.
Precipitation activity increases concurrently with the cloud evolution (Figure 7g). The rain rate increases from approximately 0.10 mm h−1 at to 0.42 mm h−1 at , reaching approximately 0.49 mm h−1 at . The increases from approximately 5% to 21% over the same period and subsequently remains broadly stable. Thus, the EC→DC transition is accompanied by a marked increase in both precipitation intensity at the crop scale and the spatial extent of precipitation.
The temporal sampling of the trajectories progressively shifts from daytime toward nighttime conditions (Figure 7i). Nighttime crops become slightly more numerous than daytime crops at and increasingly dominate thereafter. This shift in sampling conditions is particularly relevant for interpreting the late-stage COT-based statistics.
The EC→DC pathway, characterized by fast vertical intensification, might resemble the convective development described in previous IR-based studies [23,27,74,75], in which storms undergo rapid cloud-top cooling prior to the onset of mature deep convection. Several IR-based studies also link cloud-top cooling to severe-weather development, described by glaciation processes, updraft strength, and precipitation intensity [20,28,74,75].
3.6. DC Persistence
Figure 7b shows that the cosine similarity to the DC centroid remains relatively stable, ranging from approximately 0.82 to 0.85 throughout the trajectory, indicating that the trajectory crops consistently occupy the vicinity of the DC cluster without systematic convergence toward or divergence from the DC centroid.
CTHmedian and COTmedian exhibit only modest changes (Figure 7d). CTHmedian increases from approximately 9.0 km at to 9.7 km around and reaches approximately 10.5 km at . COTmedian increases from approximately 6.1 at to 8.7 at , with a broadly stable evolution thereafter, although the estimate at is associated with substantially larger uncertainty. These values indicate that the systems are already characterized by high cloud tops and substantial optical thickness at the beginning of the persistence pathway. However, COT statistics at later stages are based only on the remaining daytime trajectories and should therefore be interpreted with caution.
The temporal evolution of the cloud-area fractions shown in Figure 7f indicates that CC remains broadly stable around 77–83%, with a slight increase toward approximately 82% at . In contrast, CTH10+ increases from approximately 33% at to 45% at , reaching about 63% at . COT30+ similarly increases from approximately 18% at to 26% at , with values remaining around 25–28% at later stages. These changes indicate an increasing fraction of the cloud-covered area occupied by very high cloud tops and optically thick cloud, despite the relatively stable overall cloud coverage.
The precipitation metrics shown in Figure 7h indicate substantial precipitation activity throughout the pathway. The rain rate increases from approximately 0.24 mm h−1 at to 0.46 mm h−1 around , reaching approximately 0.57 mm h−1 at . The follows a similar evolution, increasing from approximately 16% at to 22% around , with values remaining around 21–24% at later stages. Thus, precipitation remains spatially extensive throughout the DC persistence pathway, with a moderate increase in precipitation activity over time.
The trajectory crops progressively shift from daytime toward nighttime conditions (Figure 7j). Nighttime crops become more numerous than daytime crops from onward, reaching 441 versus 288 crops at . This shift reduces the number of daytime crops available for the late-stage COT-based statistics.
Persistent DC trajectories might represent organized deep convective systems characterized by sustained cold cloud tops that frequently extend into nighttime hours, consistent with mature mesoscale convection [55,70,72]. Over the Alpine region, such persistence could be associated with terrain-anchored convergence zones, moist southerly inflow from the Po Valley, and continuous CAPE replenishment, all of which support sustained updrafts and prolonged convection [65,76].
4. Discussion
Extreme events are associated with systematic increases in CTH, COT, and CC, yet remain embedded within the continuous cloud-regime manifold learned from the training data. Rather than forming distinct cloud regimes, they populate the upper tail of existing convective regimes. However, this finding applies to the current SSL representation and clustering configuration and does not exclude the possibility of distinct extreme-event clusters under alternative configurations.
The relationship between stronger convective organization and larger CC is not only observed in satellite data but is also reproduced in NWP simulations [77]. Nevertheless, convection-parameterizing NWP models tend to overestimate CC [26].
The two dominant pathways identified in this study represent two different modes of convective evolution. The EC→DC pathway resembles the rapid vertical intensification reported in previous IR studies, where cloud-top cooling precedes mature deep convection and severe weather [27,74,75]. The typical convective development represented by the EC→DC pathway has also been identified in convection-permitting climate models by [26]. In contrast, persistent DC trajectories might represent organized convective systems maintained by sustained moisture supply, instability, and orographic forcing over the Alpine region [65,70,73]. This behavior is also consistent with NWP-based studies of Alpine mesoscale convective systems [78,79,80]. Finally, the identified DC-persistent pathway includes extensive cold anvils and persistent deep convective cores, which might align with hail-favorable environmental conditions, where strong instability and vertical wind shear support long-lived deep convection [76,81,82].
Our SSL-derived classes are also consistent with previous cloud-regime classifications. Classical approaches based on joint histograms of COT and CTH recover comparable large-scale cloud structures [32,35,83], although they rely on manually designed feature spaces rather than learned representations. Likewise, the three convective regimes identified by [52] broadly correspond to our EC, DC, and OA classes, with the main difference being the presence of a distinct cirrus regime in their COT-based classification, which is expected given the reduced sensitivity of thermal IR observations to optically thin clouds [84]. A similar correspondence is found with the rotationally-invariant cloud regimes of [49], despite their model being trained globally on MODIS observations. Together, these comparisons suggest that the SSL latent space captures physically meaningful cloud regimes that find confirmation in other studies conducted with different methodologies, satellite sensors and geographical domains.
Several limitations should be considered when interpreting these results. First, the effective SEVIRI spatial resolution over the Alpine region (∼4 km) limits the representation of small-scale storm structures. In addition, IR observations have limited sensitivity to optically thin cirrus and cloud microphysics [84], while uncertainties in the CMSAF cloud mask may affect low-level cloud detection under weak thermal contrast conditions [57]. Consequently, the identified classes should be interpreted as mesoscale thermal-organizational regimes rather than fully resolved storm structures. Methodological limitations also arise from representing the continuous spectrum of cloud organization through discrete clusters. Cloud scenes may gradually evolve between organizational states, making sharp boundaries between regimes inherently ambiguous. For example, the OA class may encompass different forms of mature and dissipating convection that are difficult to distinguish reliably from IR imagery alone. The sensitivity analysis for –10 supports as a reasonable choice for obtaining physically interpretable cloud regimes, yielding the lowest median pairwise correlation among the cluster-wise distributions of CC, CTHmedian, and COTmedian (Section Sensitivity to the Number of Clusters). These correlations assess the similarity of physical-property distributions rather than clustering stability in the latent space; therefore, should not be interpreted as an optimal number of clusters. Other values of k or additional cloud properties may yield different partitions of the continuous cloud space. The identified regimes should therefore be interpreted as discrete representations of broader cloud-organizational states rather than sharply separated physical categories. This limitation is also connected to the ambiguity of regime assignment near cluster boundaries, which may introduce some uncertainty into the pathway analysis, which should be considered when interpreting individual trajectories. Moreover, since COT retrievals are unavailable at night, the temporal evolution of COT-based properties is subject to a day–night sampling limitation. Although a minimum of 50 daytime crops was imposed to ensure robust estimates, the late-stage evolution of COT-based properties should be interpreted with caution and should not necessarily be considered representative of the full population of trajectories. Finally, ESWD reports have variable spatial and temporal uncertainties and provide incomplete, uneven sampling of extreme events. Additional uncertainties arise from trajectory linking, interpolation, and extrapolation. The resulting ESWD-based trajectories characterize cloud-scene evolution around reported events, rather than complete or independently validated storm life cycles, and may not capture the full development of convective systems.
Future extensions, such as multispectral satellite observations, the higher spatial resolution of Meteosat Third Generation, and cluster-free SSL approaches that operate directly in a continuous latent space, may further improve the characterization of severe convection.
5. Conclusions
In this study, we applied an SSL framework to MSG-SEVIRI IR 10.8 μm imagery, combined with a cloud mask, to identify cloud regimes and characterize their relationship with extreme precipitation and hail over the Alpine region. By learning directly from unlabeled geostationary satellite observations, the model organizes cloud scenes according to their spatial morphology and thermal structure without requiring predefined classes. The use of IR imagery further enables continuous day-to-night analysis, an important advantage for severe convection, as approximately 40% of the trajectories in our dataset occur between 18:00 and 04:00 UTC.
Addressing RQ1, we show that cloud scenes associated with extreme precipitation and hail occupy preferential regions of the learned latent space, occurring predominantly within DC (61.3%), EC (15.3%), and OA (15.6%). Within these regimes, extreme-event samples exhibit systematically colder, higher, optically thicker, and more spatially extensive cloud tops than the broader convective population. The most pronounced changes include an increase in CTHmedian from 5.25 to 6.74 km for EC and in COTmedian from 14.52 to 20.71 for OA. COT30+ also increases substantially, from 15.9% to 26.0% for DC and from 24.0% to 35.9% for OA. These results demonstrate that the SSL representation captures physically meaningful variations in convective cloud organization directly from infrared satellite imagery, while representing extremes as intense realizations of existing convective regimes within the current representation and clustering configuration.
Addressing RQ2, two dominant evolution pathways emerge from the ESWD-based trajectories: the EC→DC transition (188 trajectories) and persistent DC (243 trajectories), together accounting for 61.7% of all analyzed trajectories. The EC→DC pathway is characterized by a marked increase in cloud-top height and spatial extent: CTHmedian rises from approximately 5.9 km to 10.6 km, CC increases from 51% to 76%, and CTH10+ increases from 23% to 67%. In contrast, DC-persistence trajectories begin with already extensive CC (approximately 77–83%), while CTH10+ increases from 33% to 63%. These results show that the learned latent space can be used to investigate both instantaneous cloud morphology and transitions among cloud regimes associated with reported extreme events.
Overall, this work demonstrates that SSL can recover physically interpretable representations of convective organization and evolution from geostationary IR satellite archives without supervision. The resulting cloud regimes and evolution pathways provide an observational benchmark for evaluating cloud representation in convection-permitting weather and climate models, complementing traditional pixel-based verification.
Supplementary Materials
The following supporting information can be downloaded at: https://www.mdpi.com/article/10.3390/rs18213647/s1, Figure S1: Spatial distribution of crops across the domain for all classes obtained from training dataset: CS (a), SC (b), MC1 (c), MC2 (d), EC (e), DC (f), OA (g). Crop frequency is computed by aggregating crop occurrences onto a 0.2° × 0.2° latitude–longitude grid. For each grid cell, we count how many crop centers fall within the cell and normalize by the total number of samples per class and dataset. To account for the spatial extent of the crops, the domain is appropriately padded and cropped. Table S1: Pathways with at least 10 trajectories, ranked by frequency. Values show the mean ± standard deviation across all trajectories belonging to each pathway for CTHmedian (km), COTmedian, CC (%), CTH10+ (%), and COT30+ (%). The two most frequent pathways are highlighted in gray.
Author Contributions
Conceptualization, D.C. (Daniele Corradini) and C.A.; methodology, D.C. (Daniele Corradini) and C.A.; software, D.C. (Daniele Corradini) and D.C. (Dwaipayan Chatterjee); validation, D.C. (Daniele Corradini); formal analysis, D.C. (Daniele Corradini) and C.A.; investigation, D.C. (Daniele Corradini) and C.A.; resources, D.C. (Daniele Corradini) and C.A.; data curation, D.C. (Daniele Corradini) and P.B.; writing—original draft preparation, D.C. (Daniele Corradini), P.B. and C.A.; writing—review and editing, D.C. (Daniele Corradini), C.A., E.C., P.B. and D.C. (Dwaipayan Chatterjee); visualization, D.C. (Daniele Corradini), P.B. and C.A.; supervision, C.A. and E.C.; project administration, C.A.; funding acquisition, C.A. All authors have read and agreed to the published version of the manuscript.
Funding
Daniele Corradini’s work, as part of the EXPATS research group, was supported by the IDEA-S4S network and in close collaboration with the Deutscher Wetterdienst (DWD) (grant number 4823IDEAP5), funded by the Federal Ministry for Transport, BMV. Claudia Acquistapace’s work was supported by the 2021 “Rita Levi Montalcini” young researcher program (Code PGR217DXNP).
Institutional Review Board Statement
Not applicable.
Data Availability Statement
All scripts, processed datasets, configuration files, model outputs, and supporting materials required to reproduce the analyses and figures presented in this study are publicly available in the associated Zenodo repository: https://doi.org/10.5281/zenodo.21699815. The original satellite and auxiliary datasets used in this study are available from their respective providers. MSG-SEVIRI Level 1.5 data can be accessed through the EUMETSAT Data Store (https://user.eumetsat.int/data-access/data-store, accessed on 27 October 2025). Cloud property products from the CM SAF CLAAS-3 dataset are available through the CM SAF data portal (https://wui.cmsaf.eu/safira/action/viewDoiDetails?acronym=CLAAS_V003, accessed on 24 October 2025). IMERG Final v07 precipitation products are distributed by the NASA GES DISC archive (https://disc.gsfc.nasa.gov/, accessed on 20 February 2026). Severe weather reports from the European Severe Weather Database (ESWD) are available through the European Severe Storms Laboratory (ESSL) database (https://www.essl.org/cms/european-severe-weather-database/, accessed on 15 December 2025).
Acknowledgments
The authors thank Susanne Crewell and Martin Schultz for their valuable feedback, guidance, and scientific discussions during the PhD advisory committee meetings, which substantially contributed to the development of this work. The authors acknowledge the support of the European Weather Cloud infrastructure for providing access to computational resources, including GPU systems used for data processing and model training. The authors gratefully acknowledge EUMETSAT for providing access to Meteosat Second Generation (MSG) observations and CMSAF datasets, NASA for the Integrated Multi-satellitE Retrievals for GPM (IMERG) precipitation products, and the European Severe Storms Laboratory (ESSL) for providing access to the European Severe Weather Database (ESWD). For figure preparation and data visualization, the color map suite by Crameri [85] was used. The authors acknowledge the Satpy developers and community [86] for the development and maintenance of the Satpy library (https://github.com/pytroll/satpy, accessed on 29 October 2025). Satpy provided essential functionalities for reading, calibrating, and processing MSG-SEVIRI Level 1.5 data, enabling the generation of the satellite crops used in this study. During the preparation of this manuscript, the authors used OpenAI ChatGPT (GPT-5 series) to improve the readability and clarity of the text, support code debugging, and assist with data-analysis workflows. The authors also used GitHub Copilot Pro to support software development and code implementation. All outputs generated by these tools were critically reviewed, validated, and edited by the authors, who take full responsibility for the content of this publication.
Conflicts of Interest
The authors declare no conflicts of interest.
Appendix A. Cloud Mask Correction
The CLAAS-3 cloud mask is based on a Bayesian approach trained using CALIOP observations [57]. As illustrated in Figure A1, the mask can contain small-scale gaps of clear-sky pixels within otherwise cloudy regions, particularly in scenes affected by low-level clouds or snow-covered areas. Such isolated pixels can introduce small-scale artifacts in the representation of cloud structures.
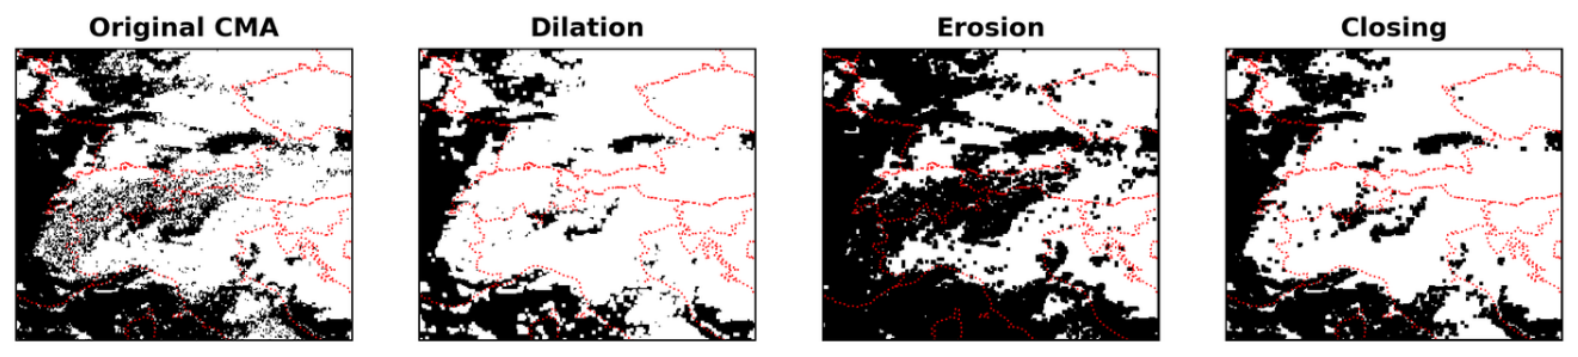
To reduce these artifacts, we apply a morphological closing, consisting of a dilation followed by an erosion, using a square structuring element (Figure A1). The size of the structuring element was selected by comparing the resulting cloud masks with the higher-resolution MODIS cloud mask at 1 km resolution. Among the tested configurations, a structuring element provided the best agreement with MODIS, yielding the highest Equitable Threat Score, while providing a suitable balance between removing small-scale gaps and preserving the overall cloud structure.
We quantified the extent of the modification introduced by the morphological closing across the full training dataset. Of all the training crops, 98.6% contain at least one pixel modified by the closing operation. However, the fraction of pixels affected within each crop is relatively small: 42.2 million pixels, corresponding to 3.00% of all pixels, are newly classified as cloudy, with an average of approximately 300 affected pixels per crop. We additionally identified crops for which at least 5% of the pixels were modified by the closing; these highly-affected crops account for 15.4% of the training dataset. Such substantial modifications may introduce artificial spatial patterns and potentially interfere with the SSL training.
Figure A1.
Application of the closing algorithm to the cloud mask, where black represents clear sky and white represents cloud, obtained through the combination of dilation and erosion operations in image processing.
Appendix B. Self-Supervised Training
The SSL strategy for learning which features are similar leverages multiple views of the same input image. Specifically, each crop is randomly sampled into two overlapping sub-crops, or views. These two views are not simple translations of the same crop. Instead, each view is generated by randomly shifting the crop location in space and allowing variations in both spatial extent and aspect ratio. This strategy introduces additional geometric diversity while preserving semantic consistency between views. To ensure comparability between inputs, both views are subsequently resampled to a common size of 75 × 75 pixels. For simplicity, Figure 1b illustrates only the spatial shift between the two views. This procedure encourages the model to learn features that are invariant not only to spatial displacement but also to moderate changes in scale and aspect ratio, thus improving the robustness of the learned representations [87]. The shift invariance and scale robustness of the SSL representations, learned through the multi-view augmentation strategy, ensure that the framework remains robust to the spatial uncertainty inherent in report-based crop placement, such that crops not perfectly centered over the convective core are still meaningfully represented in the learned feature space.
The backbone network is a ResNet-50 encoder [88] coupled with a Multilayer Perceptron (MLP) head that projects features extracted from an input crop to a 128-dimensional feature vector (Figure 1c). The Siamese architecture is based on two branches sharing the same backbone. Working in parallel, each branch sees only one of the two sub-views of each crop. In the first branch, a spherical k-means clustering [63] groups the feature vectors into k clusters, each represented by its centroid. As both sub-views of each pair are assumed to display similar cloud regimes, the second sub-view should end up in the same cluster. Thus, in the other branch, the extracted feature vectors of the second sub-views are directly compared to the centroids obtained from the first branch, which now act as pseudo-labels. The training loss is then computed as the cross-entropy function between these second feature vectors and their assigned pseudo-labels. Backpropagation of this loss promotes feature alignment for samples within the same cluster via cosine similarity (i.e., the normalized scalar product between two feature vectors), while increasing separation between different cloud regimes and morphologies.
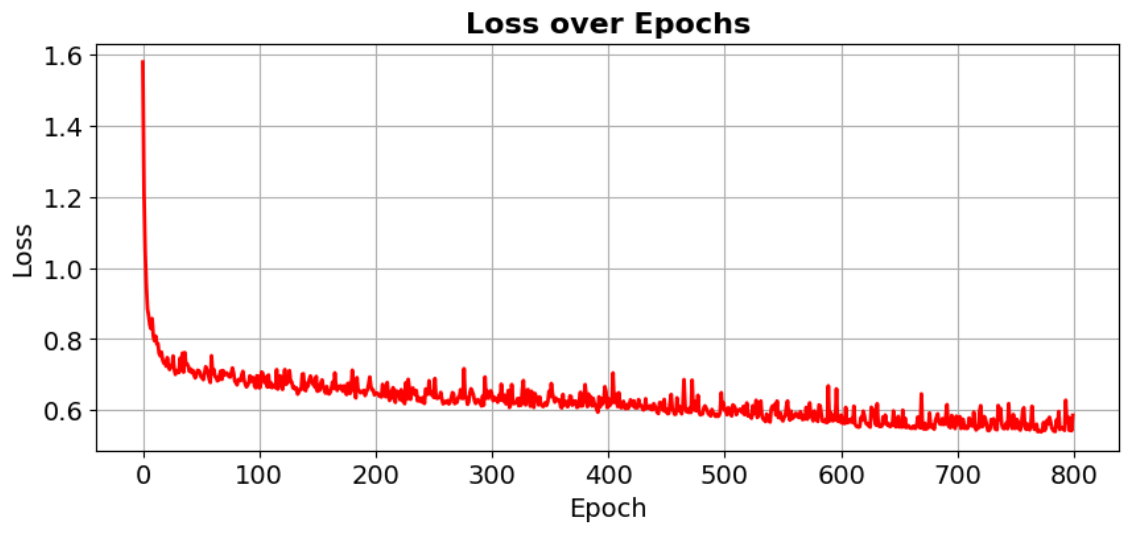
Training is performed for 800 epochs using stochastic gradient descent (SGD) with momentum (0.9) and weight decay (10−6). The learning rate follows a composite schedule consisting of linear warm-up followed by cosine annealing, with automatic scaling according to the effective batch size (256). Mixed-precision training and synchronized batch normalization are employed to improve stability and efficiency. Data augmentation is based on a multi-crop strategy producing two spatial views of size 75 × 75, using random resized cropping with scale range [0.08, 1] The loss decreases from approximately 1.6 to a stable plateau around 0.6 over training (Figure A2). We trained the DL model on the European Weather Cloud [89] infrastructure equipped with an NVIDIA RTX A6000 GPU (48 GB memory) and an AMD EPYC CPU (16 cores). An 800-epochs long training required approximately 60 h.
Figure A2.
Training loss over training epochs, computed as the cross-entropy averaged over all batches in each epoch.
Sensitivity to the Number of Clusters
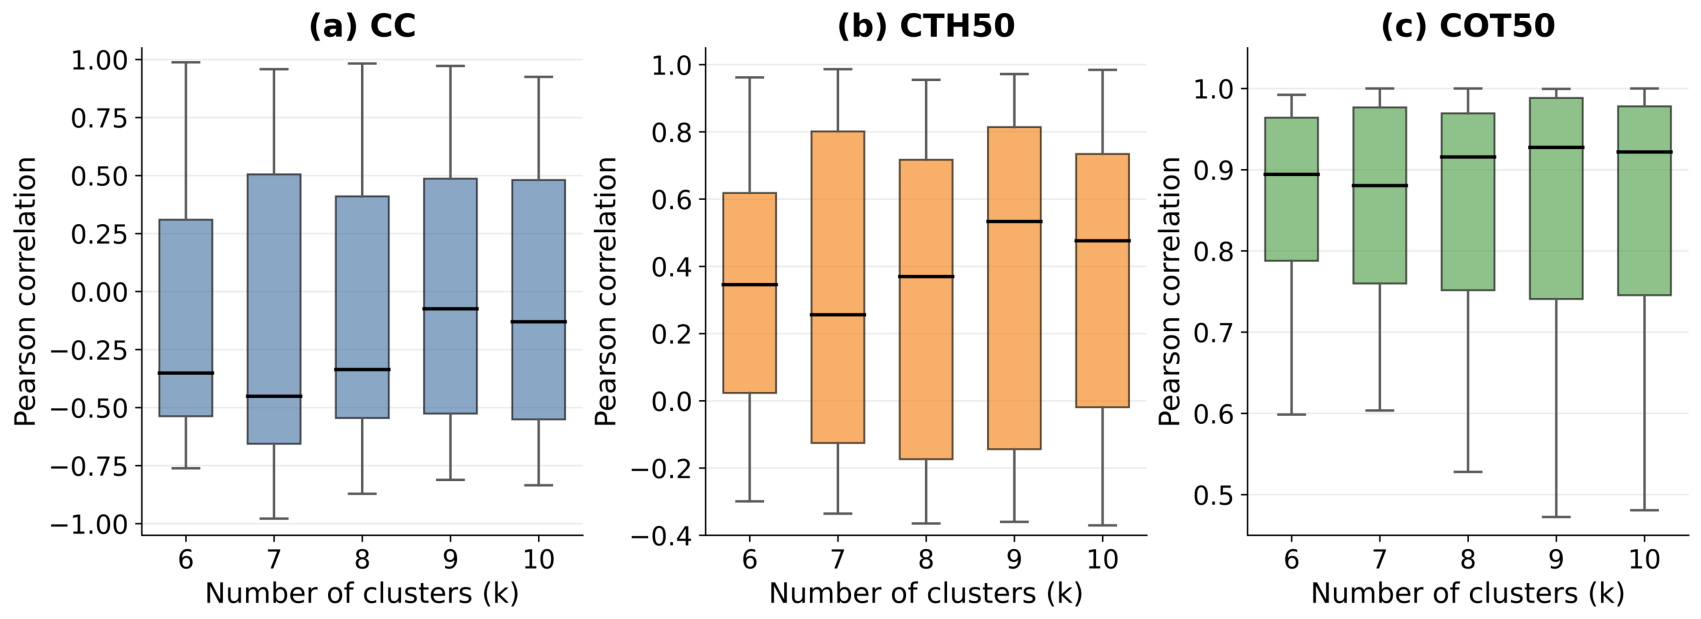
To assess the sensitivity of the cloud-property distributions to the number of clusters, we repeated the clustering analysis for k = 6–10. For each solution, we computed the normalized histograms of CC, CTHmedian, and COTmedian for each cluster and calculated the Pearson correlation for all pairwise combinations of clusters. Figure A3 shows the resulting distributions of pairwise correlations.
For all three properties, k = 7 yields the lowest median pairwise correlation, indicating the lowest overall similarity among the cluster-wise distributions. The effect is most pronounced for CC and CTHmedian, whereas COTmedian remains highly correlated across clusters for all values of k. Increasing k beyond 7 does not systematically reduce the pairwise correlations. These results support k = 7 as a reasonable choice for obtaining physically interpretable cloud regimes, without establishing it as an optimal number of clusters.
Figure A3.
Distributions of pairwise Pearson correlations between the normalized cluster-wise distributions of CC, CTHmedian, and COTmedian for different numbers of clusters (k = 6–10). Lower correlations indicate lower similarity between the corresponding cloud-property distributions. For each cloud property, for all clusters and tested values of k, we construct normalized histograms using 20 equal-width bins spanning the global minimum-to-maximum range of the corresponding property in the training data.
Appendix C. Pathway Definition and Construction
The pathway analysis considers three principal convective classes (EC, DC, and OA). By considering ordered sequences of up to three states, we defined 21 theoretically possible pathways, comprising three persistent pathways, six binary pathways, and twelve trinary pathways (Table A1). Persistent pathways represent a single distinct class, binary pathways represent transitions between two distinct classes, and trinary pathways comprise three states connected by two transitions, including sequences that return to their initial class.
Starting from 972 reconstructed trajectories, we excluded 86 trajectories containing gaps in the 15-min time series or consisting of only one timestamp. A further 10 trajectories containing none of the three principal convective classes were removed. After removing non-principal classes and merging consecutive repetitions of the same class, 177 trajectories with sequences longer than three states were excluded to limit ambiguity associated with complex pathways. The final dataset comprised 699 trajectories, corresponding to 18,421 satellite crops retained for pathway analysis, compared with 26,353 crops before trajectory-level quality control.
For each retained trajectory, the resulting ordered sequence was matched to one of the 21 predefined pathways. Of the 21 theoretically possible pathways, 14 were observed. Their occurrence frequencies are reported in Table S1.
Table A1.
Convective cloud regime pathways considered in the analysis.
References
- Battaglioli, F.; Groenemeijer, P.; Púčik, T.; Taszarek, M.; Ulbrich, U.; Rust, H. Modeled Multidecadal Trends of Lightning and (Very) Large Hail in Europe and North America (1950–2021). J. Appl. Meteorol. Climatol. 2023, 62, 1627–1653. [Google Scholar] [CrossRef] [Scilit]
- Fischer, J.; Groenemeijer, P.; Holzer, A.; Feldmann, M.; Schröer, K.; Battaglioli, F.; Schielicke, L.; Púčik, T.; Antonescu, B.; Gatzen, C.; et al. Invited perspectives: Thunderstorm intensification from mountains to plains. Nat. Hazards Earth Syst. Sci. 2025, 25, 2629–2656. [Google Scholar] [CrossRef] [Scilit]
- Lombardo, K.; Bitting, M. A Climatology of Convective Precipitation over Europe. Mon. Weather Rev. 2024, 152, 1555–1585. [Google Scholar] [CrossRef] [Scilit]
- Rädler, A.; Groenemeijer, P.; Faust, E.; Sausen, R.; Púčik, T. Frequency of severe thunderstorms across Europe expected to increase in the 21st century due to rising instability. npj Clim. Atmos. Sci. 2019, 2, 30. [Google Scholar] [CrossRef] [Scilit]
- Wilhelm, B.; Rapuc, W.; Amann, B.; Anselmetti, F.S.; Arnaud, F.; Blanchet, J.; Brauer, A.; Czymzik, M.; Giguet-Covex, C.; Gilli, A.; et al. Impact of warmer climate periods on flood hazard in the European Alps. Nat. Geosci. 2022, 15, 118–123. [Google Scholar] [CrossRef] [Scilit]
- Hentgen, L.; Ban, N.; Kröner, N.; Leutwyler, D.; Schär, C. Clouds in Convection-Resolving Climate Simulations Over Europe. J. Geophys. Res. Atmos. 2019, 124, 3849–3870. [Google Scholar] [CrossRef] [Scilit]
- Henderson, D.; Otkin, J.; Mecikalski, J. Evaluating Convective Initiation in High-Resolution Numerical Weather Prediction Models Using GOES-16 Infrared Brightness Temperatures. Mon. Weather Rev. 2021, 149, 1153–1172. [Google Scholar] [CrossRef] [Scilit]
- Panosetti, D.; Böing, S.; Schlemmer, L.; Schmidli, J. Idealized Large-Eddy and Convection-Resolving Simulations of Moist Convection over Mountainous Terrain. J. Atmos. Sci. 2016, 73, 4021–4041. [Google Scholar] [CrossRef] [Scilit]
- De Lucia, C.; Bucchignani, E.; Mastellone, A.; Adinolfi, M.; Montesarchio, M.; Cinquegrana, D.; Mercogliano, P.; Schiano, P. A Sensitivity Study on High Resolution NWP ICON—LAM Model over Italy. Atmosphere 2022, 13, 540. [Google Scholar] [CrossRef] [Scilit]
- Correa-Sánchez, N.; Dallan, E.; Marra, F.; Fosser, G.; Borga, M. Orographic control on bias and uncertainty in extreme sub-daily precipitation simulations from a convection-permitting ensemble. J. Hydrol. 2025, 659, 133324. [Google Scholar] [CrossRef] [Scilit]
- Moncrieff, M.W. The Multiscale Organization of Moist Convection and the Intersection of Weather and Climate. In Climate Dynamics: Why Does Climate Vary? American Geophysical Union (AGU): Washington, DC, USA, 2010; pp. 3–26. [Google Scholar] [CrossRef] [Scilit]
- Prein, A.F.; Langhans, W.; Fosser, G.; Ferrone, A.; Ban, N.; Goergen, K.; Keller, M.; Tölle, M.; Gutjahr, O.; Feser, F.; et al. A review on regional convection-permitting climate modeling: Demonstrations, prospects, and challenges. Rev. Geophys. 2015, 53, 323–361. [Google Scholar] [CrossRef] [Scilit]
- Feldmann, M.; Hering, A.; Gabella, M.; Berne, A. Hailstorms and rainstorms versus supercells—A regional analysis of convective storm types in the Alpine region. npj Clim. Atmos. Sci. 2023, 6, 19. [Google Scholar] [CrossRef] [Scilit]
- Franch, G.; Maggio, V.; Coviello, L.; Pendesini, M.; Jurman, G.; Furlanello, C. TAASRAD19, a high-resolution weather radar reflectivity dataset for precipitation nowcasting. Sci. Data 2020, 7, 234. [Google Scholar] [CrossRef] [Scilit]
- Borga, M.; Marra, F.; Gabella, M. Chapter 5—Rainfall estimation by weather radar. In Rainfall; Morbidelli, R., Ed.; Elsevier: Amsterdam, The Netherlands, 2022; pp. 109–134. [Google Scholar] [CrossRef] [Scilit]
- Khodayar, S.; Davolio, S.; Di Girolamo, P.; Lebeaupin Brossier, C.; Flaounas, E.; Fourrie, N.; Lee, K.O.; Ricard, D.; Vie, B.; Bouttier, F.; et al. Overview towards improved understanding of the mechanisms leading to heavy precipitation in the western Mediterranean: Lessons learned from HyMeX. Atmos. Chem. Phys. 2021, 21, 17051–17078. [Google Scholar] [CrossRef] [Scilit]
- Handwerker, J.; Barthlott, C.; Bauckholt, M.; Belleflamme, A.; Böhmländer, A.; Borg, E.; Dick, G.; Dietrich, P.; Fichtelmann, B.; Geppert, G.; et al. From initiation of convective storms to their impact—The Swabian MOSES 2023 campaign in southwestern Germany. Front. Earth Sci. 2025, 13, 1555755. [Google Scholar] [CrossRef] [Scilit]
- Rotach, M.W.; Serafin, S.; Ward, H.C.; Arpagaus, M.; Colfescu, I.; Cuxart, J.; Wekker, S.F.J.D.; Grubišic, V.; Kalthoff, N.; Karl, T.; et al. A Collaborative Effort to Better Understand, Measure, and Model Atmospheric Exchange Processes over Mountains. Bull. Am. Meteorol. Soc. 2022, 103, E1282–E1295. [Google Scholar] [CrossRef] [Scilit]
- Mecikalski, J.R.; MacKenzie, W.M.; Koenig, M.; Muller, S. Cloud-Top Properties of Growing Cumulus prior to Convective Initiation as Measured by Meteosat Second Generation. Part I: Infrared Fields. J. Appl. Meteorol. Climatol. 2010, 49, 521–534. [Google Scholar] [CrossRef] [Scilit]
- Mecikalski, J.; Rosenfeld, D.; Manzato, A. Evaluation of Geostationary Satellite Observations and the Development of a 1–2 hour Prediction Model for Future Storm Intensity: Forecasting Storm Intensity. J. Geophys. Res. Atmos. 2016, 121, 6374–6392. [Google Scholar] [CrossRef] [Scilit]
- Merino, A.; López, L.; Sánchez, J.L.; García-Ortega, E.; Cattani, E.; Levizzani, V. Daytime identification of summer hailstorm cells from MSG data. Nat. Hazards Earth Syst. Sci. 2014, 14, 1017–1033. [Google Scholar] [CrossRef] [Scilit]
- Kotarba, A.Z.; Wojciechowska, I. Satellite-based detection of deep-convective clouds: The sensitivity of infrared methods and implications for cloud climatology. Atmos. Meas. Tech. 2025, 18, 2721–2738. [Google Scholar] [CrossRef] [Scilit]
- Xu, Y.; Sun, K.; Lv, F.; Bian, Z.; Zhou, X.; Miao, S.; He, T. Identification of severe convective clouds and analysis of their relationship with severe convective weather based on Himawari-8/9 geostationary satellite. Atmos. Res. 2026, 327, 108349. [Google Scholar] [CrossRef] [Scilit]
- Levizzani, V.; Pinelli, F.; Pasqui, M.; Melani, S.; Laing, A.G.; Carbone, R.E. A 10-year climatology of warm-season cloud patterns over Europe and the Mediterranean from Meteosat IR observations. Atmos. Res. 2010, 97, 555–576. [Google Scholar] [CrossRef] [Scilit]
- Cintineo, J.L.; Pavolonis, M.J.; Sieglaff, J.M.; Heidinger, A.K. Evolution of Severe and Nonsevere Convection Inferred from GOES-Derived Cloud Properties. J. Appl. Meteorol. Climatol. 2013, 52, 2009–2023. [Google Scholar] [CrossRef] [Scilit]
- Keller, M.; Fuhrer, O.; Schmidli, J.; Stengel, M.; Stöckli, R.; Schär, C. Evaluation of convection-resolving models using satellite data: The diurnal cycle of summer convection over the Alps. Meteorol. Z. 2016, 25, 165–179. [Google Scholar] [CrossRef] [Scilit]
- Senf, F.; Deneke, H. Satellite-Based Characterization of Convective Growth and Glaciation and Its Relationship to Precipitation Formation over Central Europe. J. Appl. Meteorol. Climatol. 2017, 56, 1827–1845. [Google Scholar] [CrossRef] [Scilit]
- Galfione, A.; Battaglia, A.; Oue, M.; Cattani, E.; Kollias, P. Comparison of GOES16 Data with the TRACER-ESCAPE Field Campaign Dataset for Convection Characterization: A Selection of Case Studies and Lessons Learnt. Remote Sens. 2025, 17, 2621. [Google Scholar] [CrossRef] [Scilit]
- Bedka, K.M.; Dworak, R.; Brunner, J.; Feltz, W. Validation of Satellite-Based Objective Overshooting Cloud-Top Detection Methods Using CloudSat Cloud Profiling Radar Observations. J. Appl. Meteorol. Climatol. 2012, 51, 1811–1822. [Google Scholar] [CrossRef] [Scilit]
- Griffin, S.M.; Bedka, K.M.; Velden, C.S. A Method for Calculating the Height of Overshooting Convective Cloud Tops Using Satellite-Based IR Imager and CloudSat Cloud Profiling Radar Observations. J. Appl. Meteorol. Climatol. 2016, 55, 479–491. [Google Scholar] [CrossRef] [Scilit]
- Mecikalski, J.R.; Minnis, P.; Palikonda, R. Use of satellite derived cloud properties to quantify growing cumulus beneath cirrus clouds. Atmos. Res. 2013, 120–121, 192–201. [Google Scholar] [CrossRef] [Scilit]
- Rossow, W.B.; Schiffer, R.A. Advances in Understanding Clouds from ISCCP. Bull. Am. Meteorol. Soc. 1999, 80, 2261–2288. [Google Scholar] [CrossRef] [Scilit]
- Benas, N.; Holtermann, I.; Stengel, M.; Hüser, I.; Karlsson, K.G.; Häkansson, N.; Johansson, E.; Eliasson, S.; Schröder, M.; Hollmann, R.; et al. CLAAS-3: The third edition of the CM SAF cloud data record based on SEVIRI observations. Earth Syst. Sci. Data 2023, 15, 5153–5170. [Google Scholar] [CrossRef] [Scilit]
- Morel, C.; Senesi, S. A climatology of mesoscale convective systems over Europe using satellite infrared imagery. II: Characteristics of European mesoscale convective systems. Q. J. R. Meteorol. Soc. 2002, 128, 1973–1995. [Google Scholar] [CrossRef] [Scilit]
- Tzallas, V.; Hünerbein, A.; Stengel, M.; Meirink, J.F.; Benas, N.; Trentmann, J.; Macke, A. CRAAS: A European Cloud Regime dAtAset Based on the CLAAS-2.1 Climate Data Record. Remote Sens. 2022, 14, 5548. [Google Scholar] [CrossRef] [Scilit]
- Visa, A.; Iivarinen, J.; Valkealahti, K.; Simula, O. Neural Network Based Cloud Classifier. In Industrial Applications of Neural Networks; World Scientific: Singapore, 1998; pp. 303–309. [Google Scholar] [CrossRef] [Scilit]
- Christodoulou, C.; Michaelides, S.; Pattichis, C. Multifeature texture analysis for the classification of clouds in satellite imagery. IEEE Trans. Geosci. Remote Sens. 2003, 41, 2662–2668. [Google Scholar] [CrossRef] [Scilit]
- Fu, Y.; Fei, M.; Han, Z.; Zhang, W.; Liu, Q.; Gu, X.; Yu, T. A Machine-Learning-Based Study on All-Day Cloud Classification Using Himawari-8 Infrared Data. Remote Sens. 2023, 15, 5630. [Google Scholar] [CrossRef] [Scilit]
- Guo, B.; Zhang, F.; Li, W.; Zhao, Z. Cloud Classification by Machine Learning for Geostationary Radiation Imager. IEEE Trans. Geosci. Remote Sens. 2024, 62, 4102814. [Google Scholar] [CrossRef] [Scilit]
- Jing, L.; Tian, Y. Self-Supervised Visual Feature Learning With Deep Neural Networks: A Survey. IEEE Trans. Pattern Anal. Mach. Intell. 2021, 43, 4037–4058. [Google Scholar] [CrossRef] [Scilit]
- Lee, Y.; Kummerow, C.; Ebert-Uphoff, I. Applying machine learning methods to detect convection using Geostationary Operational Environmental Satellite-16 (GOES-16) advanced baseline imager (ABI) data. Atmos. Meas. Tech. 2021, 14, 2699–2716. [Google Scholar] [CrossRef] [Scilit]
- Kaps, A.; Lauer, A.; Kazeroni, R.; Stengel, M.; Eyring, V. Characterizing clouds with the CCClim dataset, a machine learning cloud class climatology. Earth Syst. Sci. Data 2024, 16, 3001–3016. [Google Scholar] [CrossRef] [Scilit]
- Lenhardt, J.; Quaas, J.; Sejdinovic, D.; Klocke, D. CloudViT: Exploring cloud type classification with vision transformers in global satellite data. Atmos. Chem. Phys. 2026, 26, 5447–5475. [Google Scholar] [CrossRef] [Scilit]
- Kim, M.; Lee, J.; Im, J. Deep Learning-based Monitoring of Overshooting Cloud Tops from Geostationary Satellite Data. GISci. Remote Sens. 2018, 55, 763–792. [Google Scholar] [CrossRef] [Scilit]
- Cintineo, J.L.; Pavolonis, M.J.; Sieglaff, J.M.; Wimmers, A.; Brunner, J.; Bellon, W. A Deep-Learning Model for Automated Detection of Intense Midlatitude Convection Using Geostationary Satellite Images. Weather Forecast. 2020, 35, 2567–2588. [Google Scholar] [CrossRef] [Scilit]
- Brüning, S.; Tost, H. A machine-learning-based perspective on deep convective clouds and their organisation in 3D—Part 2: Spatial–temporal patterns of convective organisation. Atmos. Chem. Phys. 2025, 25, 10797–10822. [Google Scholar] [CrossRef] [Scilit]
- Kim, D.; Kim, H.J.; Choi, Y.S. Unsupervised Clustering of Geostationary Satellite Cloud Properties for Estimating Precipitation Probabilities of Tropical Convective Clouds. J. Appl. Meteorol. Climatol. 2023, 62, 1083–1094. [Google Scholar] [CrossRef] [Scilit]
- Denby, L. Discovering the Importance of Mesoscale Cloud Organization Through Unsupervised Classification. Geophys. Res. Lett. 2020, 47, e2019GL085190. [Google Scholar] [CrossRef] [Scilit]
- Kurihana, T.; Moyer, E.; Willett, R.; Gilton, D.; Foster, I. Data-Driven Cloud Clustering via a Rotationally Invariant Autoencoder. IEEE Trans. Geosci. Remote Sens. 2022, 60, 1–25. [Google Scholar] [CrossRef] [Scilit]
- Hendrycks, D.; Mazeika, M.; Kadavath, S.; Song, D. Using Self-Supervised Learning Can Improve Model Robustness and Uncertainty. In Proceedings of the Advances in Neural Information Processing Systems (NeurIPS 2019), Vancouver, BC, Canada, 8–14 December 2019; Volume 33, pp. 15663–15674. [Google Scholar]
- Liu, H.; HaoChen, J.; Gaidon, A.; Ma, T. Self-supervised Learning is More Robust to Dataset Imbalance. Preprint 2021. [Google Scholar] [CrossRef] [Scilit]
- Chatterjee, D.; Acquistapace, C.; Deneke, H.; Crewell, S. Understanding Cloud Systems’ Structure and Organization Using a Machine’s Self-Learning Approach. Artif. Intell. Earth Syst. 2023, 2, e220096. [Google Scholar] [CrossRef] [Scilit]
- Chatterjee, D.; Raabe, N.; Crewell, S. Four low-level cloud regimes revealed by latent space analysis and their impact on solar energy variability. Mach. Learn. Earth 2026, 2, 015015. [Google Scholar] [CrossRef] [Scilit]
- Dotzek, N.; Groenemeijer, P.; Feuerstein, B.; Holzer, A. Overview of ESSL’s severe convective storms research using the European Severe Weather Database ESWD. Atmos. Res. 2009, 93, 575–586. [Google Scholar] [CrossRef] [Scilit]
- Schumacher, R.; Rasmussen, K. The formation, character and changing nature of mesoscale convective systems. Nat. Rev. Earth Environ. 2020, 1, 300–314. [Google Scholar] [CrossRef] [Scilit]
- Schmetz, J.; Pili, P.; Tjemkes, S.; Just, D.; Kerkmann, J.; Rota, S.; Ratier, A. An introduction to Meteosat Second Generation (MSG). Bull. Am. Meteorol. Soc. 2002, 83, 977–992. [Google Scholar] [CrossRef] [Scilit]
- Karlsson, K.G.; Johansson, E.; Häkansson, N.; Sedlar, J.; Eliasson, S. Probabilistic Cloud Masking for the Generation of CM SAF Cloud Climate Data Records from AVHRR and SEVIRI Sensors. Remote Sens. 2020, 12, 713. [Google Scholar] [CrossRef] [Scilit]
- Deng, D. DBSCAN Clustering Algorithm Based on Density. In Proceedings of the 2020 7th International Forum on Electrical Engineering and Automation (IFEEA), Hefei, China, 25–27 September 2020; pp. 949–953. [Google Scholar] [CrossRef] [Scilit]
- Heikenfeld, M.; Marinescu, P.J.; Christensen, M.; Watson-Parris, D.; Senf, F.; van den Heever, S.C.; Stier, P. tobac 1.2: Towards a flexible framework for tracking and analysis of clouds in diverse datasets. Geosci. Model Dev. 2019, 12, 4551–4570. [Google Scholar] [CrossRef] [Scilit]
- Huffman, G.J.; Bolvin, D.T.; Braithwaite, D.; Hsu, K.L.; Joyce, R.J.; Kidd, C.; Nelkin, E.J.; Sorooshian, S.; Stocker, E.F.; Tan, J.; et al. Integrated Multi-satellite Retrievals for the Global Precipitation Measurement (GPM) Mission (IMERG). In Satellite Precipitation Measurement: Volume 1; Levizzani, V., Kidd, C., Kirschbaum, D.B., Kummerow, C.D., Nakamura, K., Turk, F.J., Eds.; Springer International Publishing: Cham, Switzerland, 2020; pp. 343–353. [Google Scholar] [CrossRef] [Scilit]
- Navarro, A.; García-Ortega, E.; Merino, A.; Sánchez, J.L.; Kummerow, C.; Tapiador, F.J. Assessment of IMERG Precipitation Estimates over Europe. Remote Sens. 2019, 11, 2470. [Google Scholar] [CrossRef] [Scilit]
- Goyal, P.; Duval, Q.; Reizenstein, J.; Leavitt, M.; Xu, M.; Lefaudeux, B.; Singh, M.; Reis, V.; Caron, M.; Bojanowski, P.; et al. VISSL. 2021. Available online: https://github.com/facebookresearch/vissl (accessed on 23 September 2025).
- Hornik, K.; Feinerer, I.; Kober, M.; Buchta, C. Spherical k-Means Clustering. J. Stat. Softw. 2012, 50, 1–22. [Google Scholar] [CrossRef] [Scilit]
- van der Maaten, L.; Hinton, G. Visualizing Data using t-SNE. J. Mach. Learn. Res. 2008, 9, 2579–2605. [Google Scholar] [CrossRef] [Scilit]
- Miglietta, M.; Davolio, S. Dynamical forcings in heavy precipitation events over Italy: Lessons from the HyMeX SOP1 campaign. Hydrol. Earth Syst. Sci. 2022, 26, 627–646. [Google Scholar] [CrossRef] [Scilit]
- Feldmann, M.; Domeisen, D.I.V.; Martius, O. A pan-European analysis of large-scale drivers of severe convective outbreaks. Weather Clim. Dyn. 2025, 6, 1089–1106. [Google Scholar] [CrossRef] [Scilit]
- Houze, R.A. Cloud Dynamics, 2nd ed.; Academic Press: Oxford, UK, 2014. [Google Scholar]
- Roca, R.; Fiolleau, T.; Bouniol, D. A Simple Model of the Life Cycle of Mesoscale Convective Systems Cloud Shield in the Tropics. J. Clim. 2017, 30, 4283–4298. [Google Scholar] [CrossRef] [Scilit]
- Schaffer, A.; Lichtenegger, T.; Truhetz, H.; Ossó, A.; Martínez-Alvarado, O.; Maraun, D. Drivers of Cold Frontal Hourly Extreme Precipitation: A Climatological Study Over Europe. Geophys. Res. Lett. 2024, 51, e2024GL111025. [Google Scholar] [CrossRef] [Scilit]
- Da Silva, N.; Haerter, J. The Precipitation Characteristics of Mesoscale Convective Systems Over Europe. J. Geophys. Res. Atmos. 2023, 128, e2023JD039045. [Google Scholar] [CrossRef] [Scilit]
- Taszarek, M.; Allen, J.T.; Groenemeijer, P.; Edwards, R.; Brooks, H.E.; Chmielewski, V.; Enno, S.E. Severe Convective Storms across Europe and the United States. Part I: Climatology of Lightning, Large Hail, Severe Wind, and Tornadoes. J. Clim. 2020, 33, 10239–10261. [Google Scholar] [CrossRef] [Scilit]
- Houze, R.A., Jr. Mesoscale convective systems. Rev. Geophys. 2004, 42, RG4003. [Google Scholar] [CrossRef] [Scilit]
- Houze, R. Orographic effects on precipitating clouds. Rev. Geophys. 2012, 50, RG1001. [Google Scholar] [CrossRef] [Scilit]
- Coopman, Q.; Hoose, C.; Stengel, M. Analysis of the Thermodynamic Phase Transition of Tracked Convective Clouds Based on Geostationary Satellite Observations. J. Geophys. Res. Atmos. 2020, 125, e2019JD032146. [Google Scholar] [CrossRef] [Scilit]
- Mecikalski, J.R.; Williams, J.K.; Jewett, C.P.; Ahijevych, D.; LeRoy, A.; Walker, J.R. Probabilistic 0–1-h Convective Initiation Nowcasts that Combine Geostationary Satellite Observations and Numerical Weather Prediction Model Data. J. Appl. Meteorol. Climatol. 2015, 54, 1039–1059. [Google Scholar] [CrossRef] [Scilit]
- De Martin, F.; Manzato, A.; Carlon, N.; Setvák, M.; Miglietta, M.M. Dynamic and statistical analysis of giant hail environments in northeast Italy. Q. J. R. Meteorol. Soc. 2025, 151, e4945. [Google Scholar] [CrossRef] [Scilit]
- Groot, E.; Kuntze, P.; Miltenberger, A.; Tost, H. Divergent convective outflow in ICON deep-convection-permitting and parameterised deep convection simulations. Weather Clim. Dyn. 2024, 5, 779–803. [Google Scholar] [CrossRef] [Scilit]
- Davolio, S.; Buzzi, A.; Malguzzi, P. Orographic triggering of long lived convection in three dimensions. Meteorol. Atmos. Phys. 2009, 103, 35–44. [Google Scholar] [CrossRef] [Scilit]
- Davolio, S.; Mastrangelo, D.; Miglietta, M.M.; Drofa, O.; Buzzi, A.; Malguzzi, P. High resolution simulations of a flash flood near Venice. Nat. Hazards Earth Syst. Sci. 2009, 9, 1671–1678. [Google Scholar] [CrossRef] [Scilit]
- Degiacomi, T.; Zonato, A.; Davolio, S.; Miglietta, M.M.; Giovannini, L. Deep Banded Orographic Convection over an Idealized Mountain Range: Influence of Upstream Atmospheric Conditions. J. Atmos. Sci. 2025, 82, 1033–1055. [Google Scholar] [CrossRef] [Scilit]
- Fischer, J.; Kunz, M.; Lombardo, K.; Kumjian, M.R. Hail Trajectories in a Wide Spectrum of Supercell-Like Updrafts. J. Atmos. Sci. 2025, 82, 1403–1422. [Google Scholar] [CrossRef] [Scilit]
- Li, Q.; Shi, H.; Xie, Y.; Jiang, R.; Wang, C.; Teng, Y.; Jia, S.; Wen, J.; Fu, D.; Yang, J.; et al. Revealing the lifecycle evolution of hail-producing deep convective clouds by synergy of multi-source data. Atmos. Res. 2026, 336, 108845. [Google Scholar] [CrossRef] [Scilit]
- Oreopoulos, L.; Cho, N.; Lee, D.; Kato, S.; Huffman, G.J. An examination of the nature of global MODIS cloud regimes. J. Geophys. Res. Atmos. 2014, 119, 8362–8383. [Google Scholar] [CrossRef] [Scilit]
- Stubenrauch, C.J.; Rossow, W.B.; Kinne, S.; Ackerman, S.; Cesana, G.; Chepfer, H.; Girolamo, L.D.; Getzewich, B.; Guignard, A.; Heidinger, A.; et al. Assessment of Global Cloud Datasets from Satellites: Project and Database Initiated by the GEWEX Radiation Panel. Bull. Am. Meteorol. Soc. 2013, 94, 1031–1049. [Google Scholar] [CrossRef] [Scilit]
- Crameri, F. Geodynamic diagnostics, scientific visualisation and StagLab 3.0. Geosci. Model Dev. 2018, 11, 2541–2562. [Google Scholar] [CrossRef] [Scilit]
- Raspaud, M.; Hoese, D.; Lahtinen, P.; Holl, G.; Proud, S.; Finkensieper, S.; Meraner, A.; Dybbroe, A.; Strandgren, J.; Feltz, J.; et al. pytroll/satpy: Version 0.60.0. 2026. Available online: https://doi.org/10.5281/zenodo.18864547 (accessed on 29 October 2025).
- Caron, M.; Misra, I.; Mairal, J.; Goyal, P.; Bojanowski, P.; Joulin, A. Unsupervised Learning of Visual Features by Contrasting Cluster Assignments. In Proceedings of the Advances in Neural Information Processing Systems; Larochelle, H., Ranzato, M., Hadsell, R., Balcan, M., Lin, H., Eds.; Curran Associates, Inc.: Red Hook, NY, USA, 2020; Volume 33, pp. 9912–9924. [Google Scholar]
- He, K.; Zhang, X.; Ren, S.; Sun, J. Deep Residual Learning for Image Recognition. In Proceedings of the 2016 IEEE Conference on Computer Vision and Pattern Recognition (CVPR), Las Vegas, NV, USA, 27–30 June 2016; pp. 770–778. [Google Scholar] [CrossRef] [Scilit]
- Tervo, R.; Schulz, J.; Saalmueller, J.; Abellan, X.; Modigliani, U.; Baousis, V. The European Weather Cloud (EWC)—Collaboration Platform for Meteorological Application Development and Data Processing. In Proceedings of the EMS Annual Meeting 2022, Bonn, Germany, 4–9 September 2022; p. EMS2022-16. [Google Scholar] [CrossRef] [Scilit]
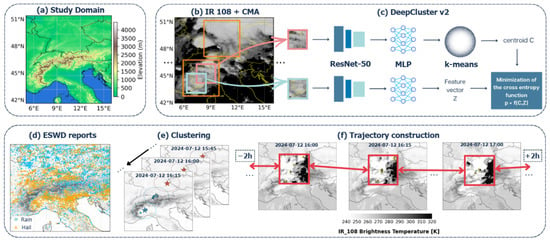
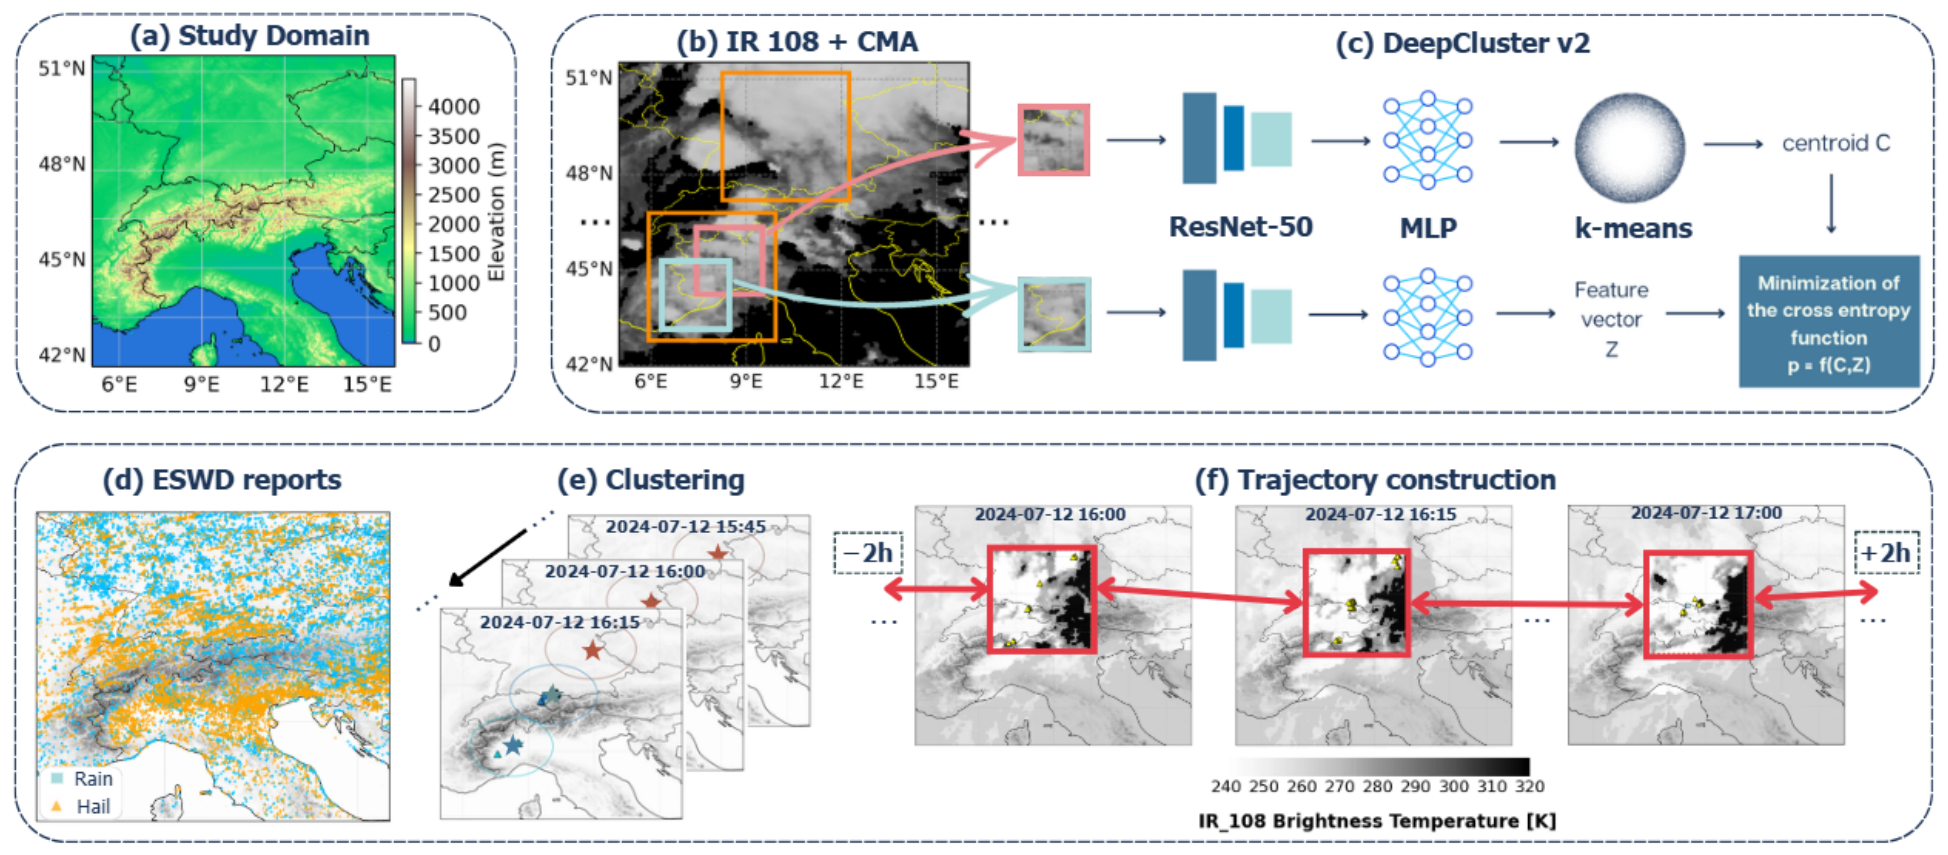
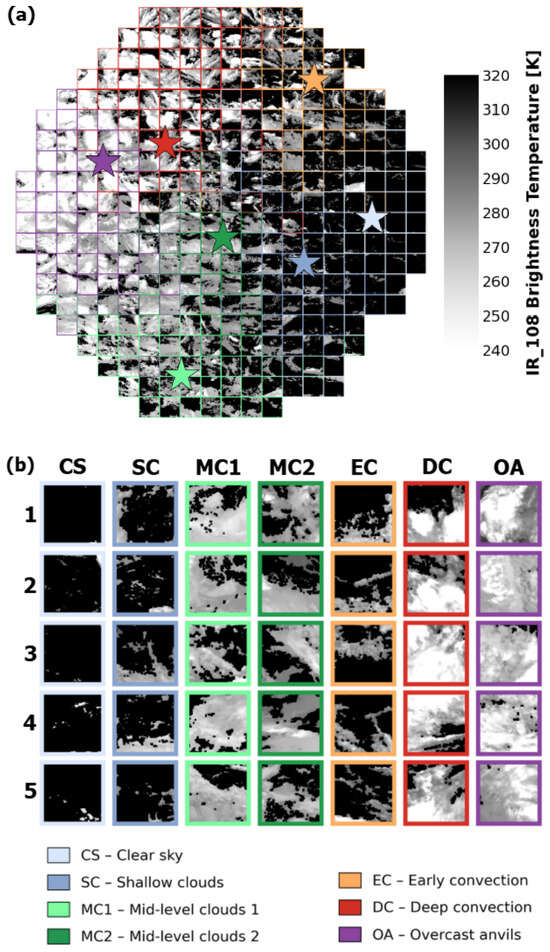
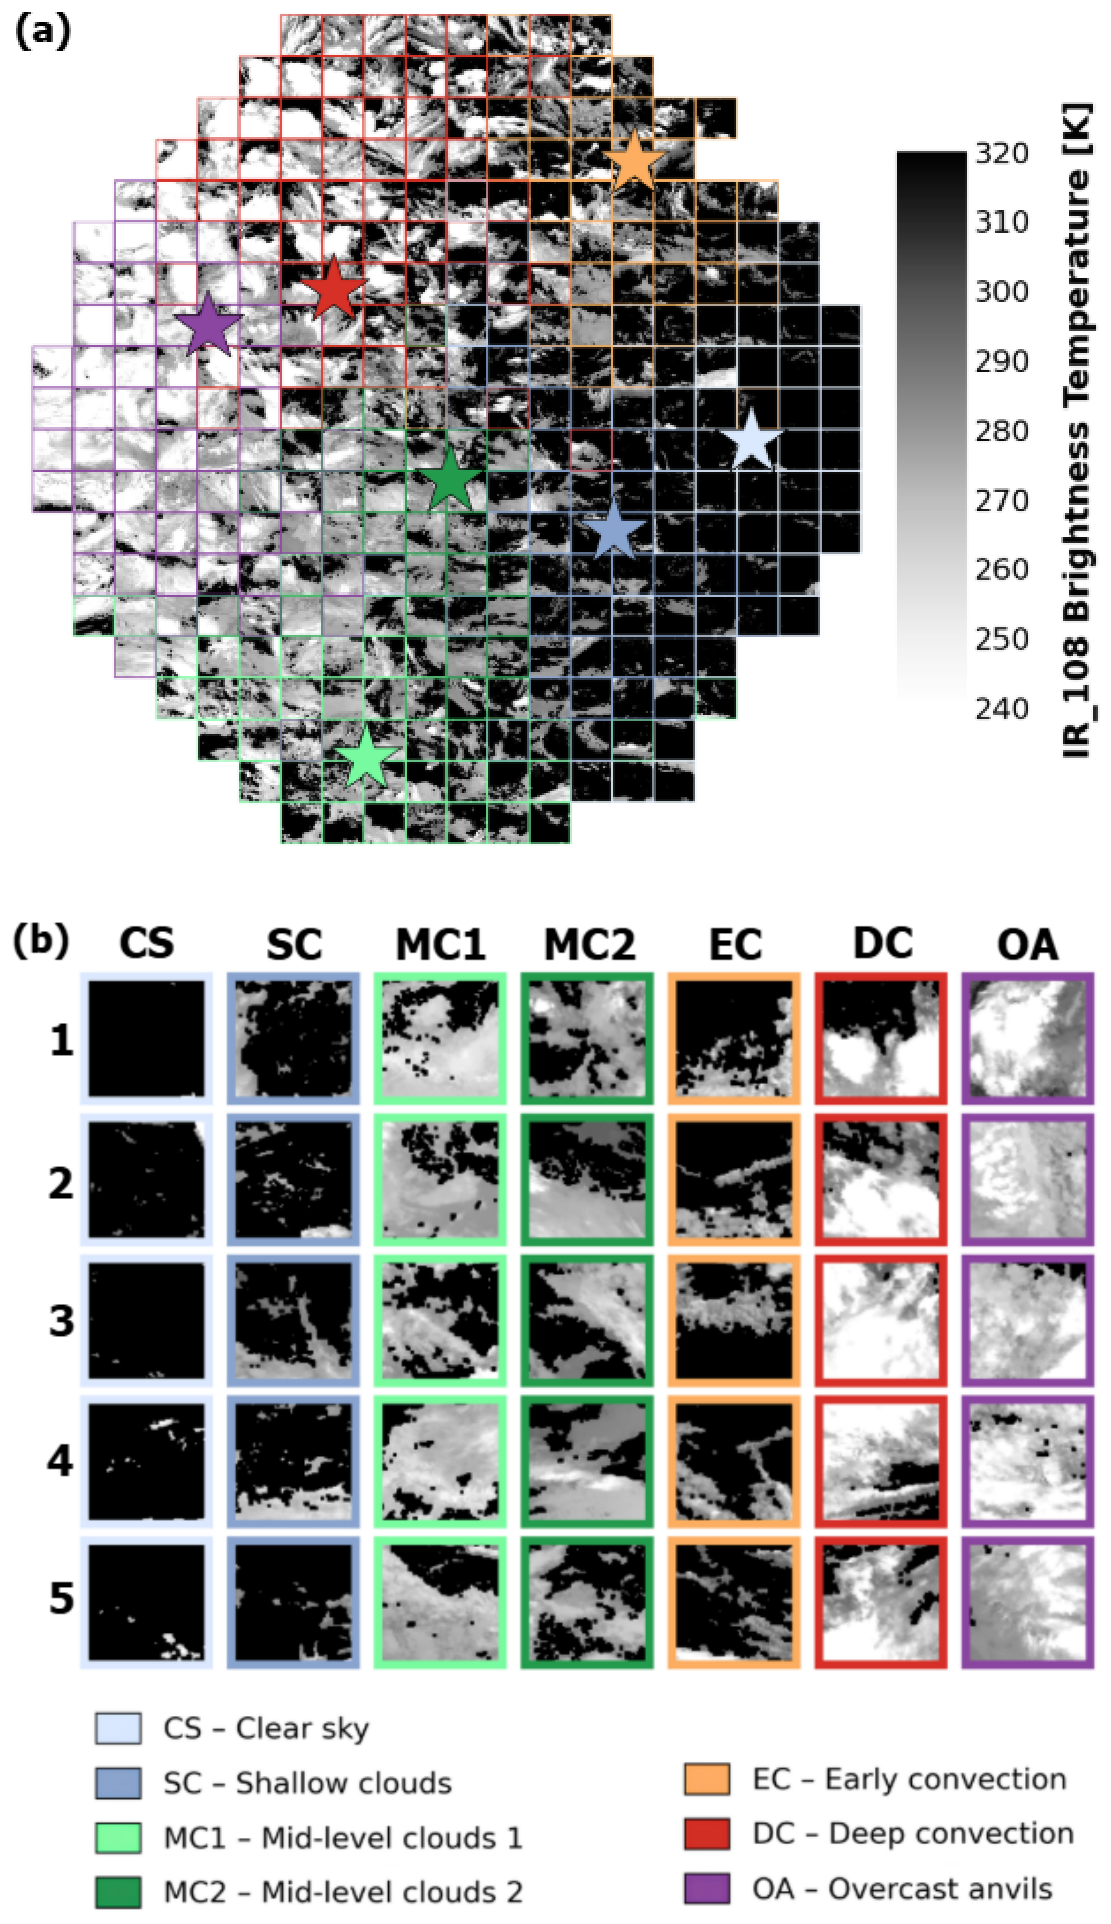
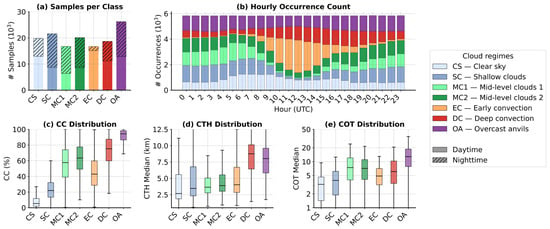
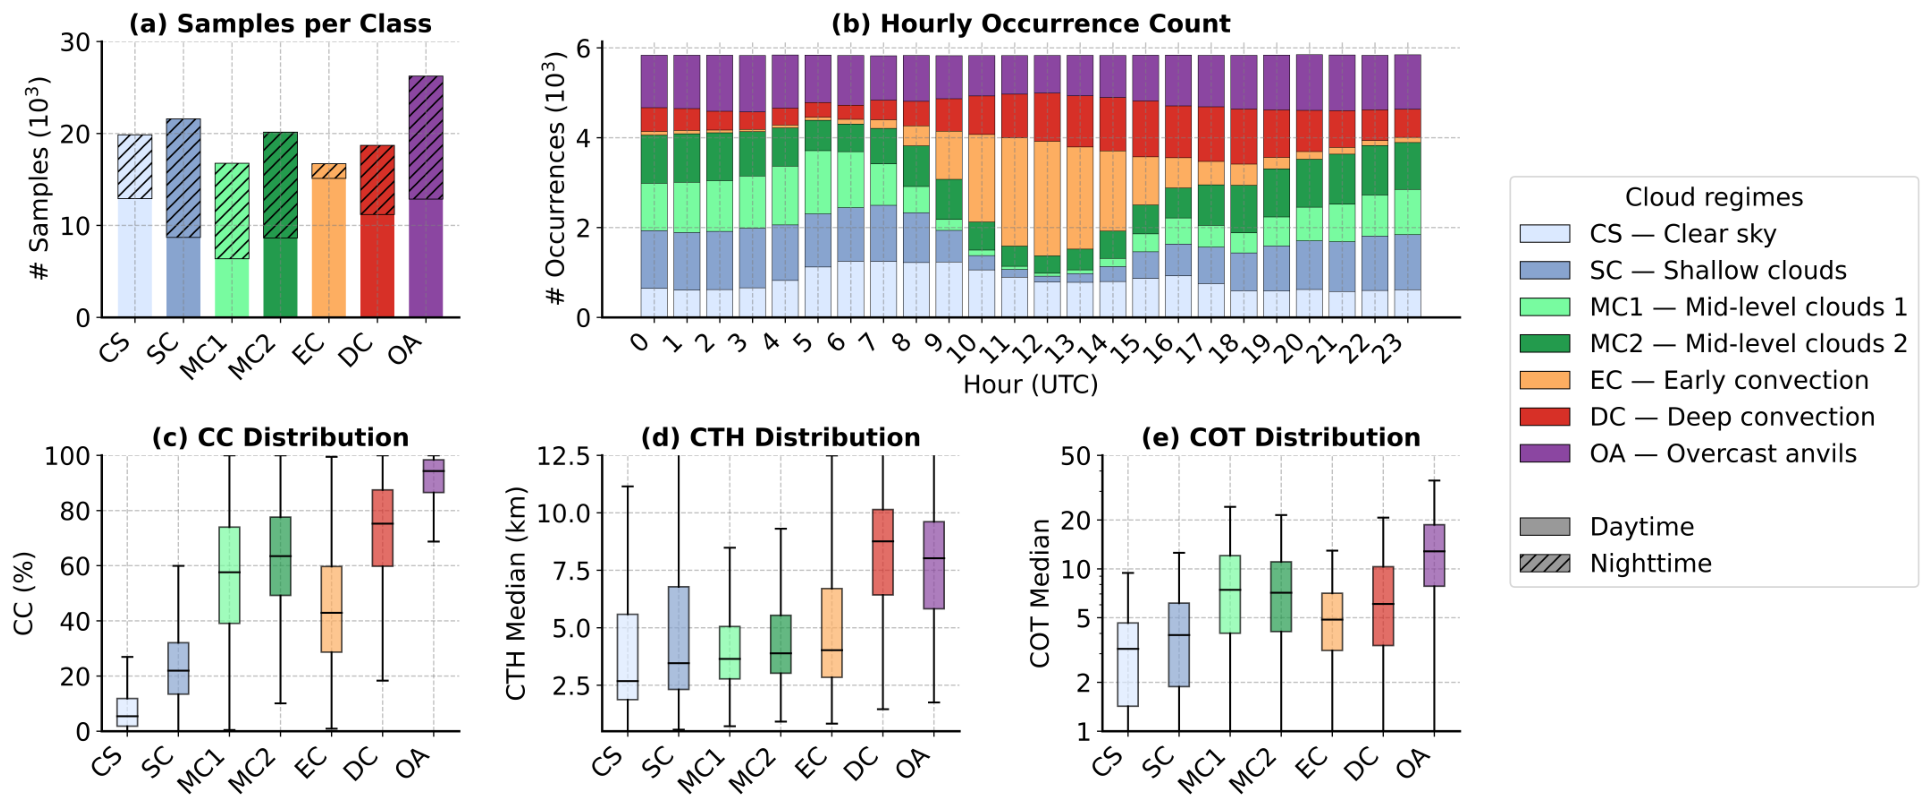
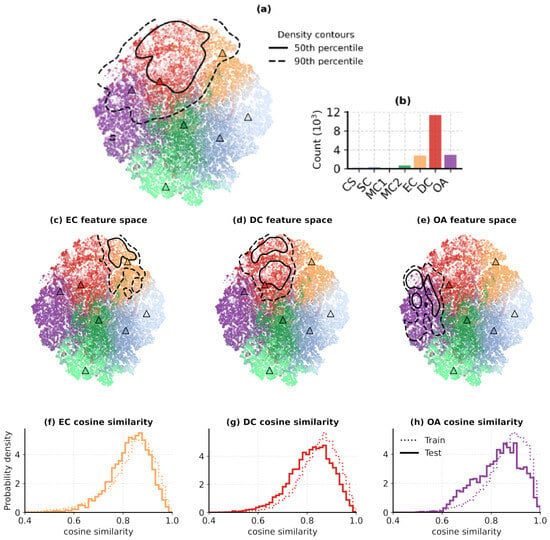
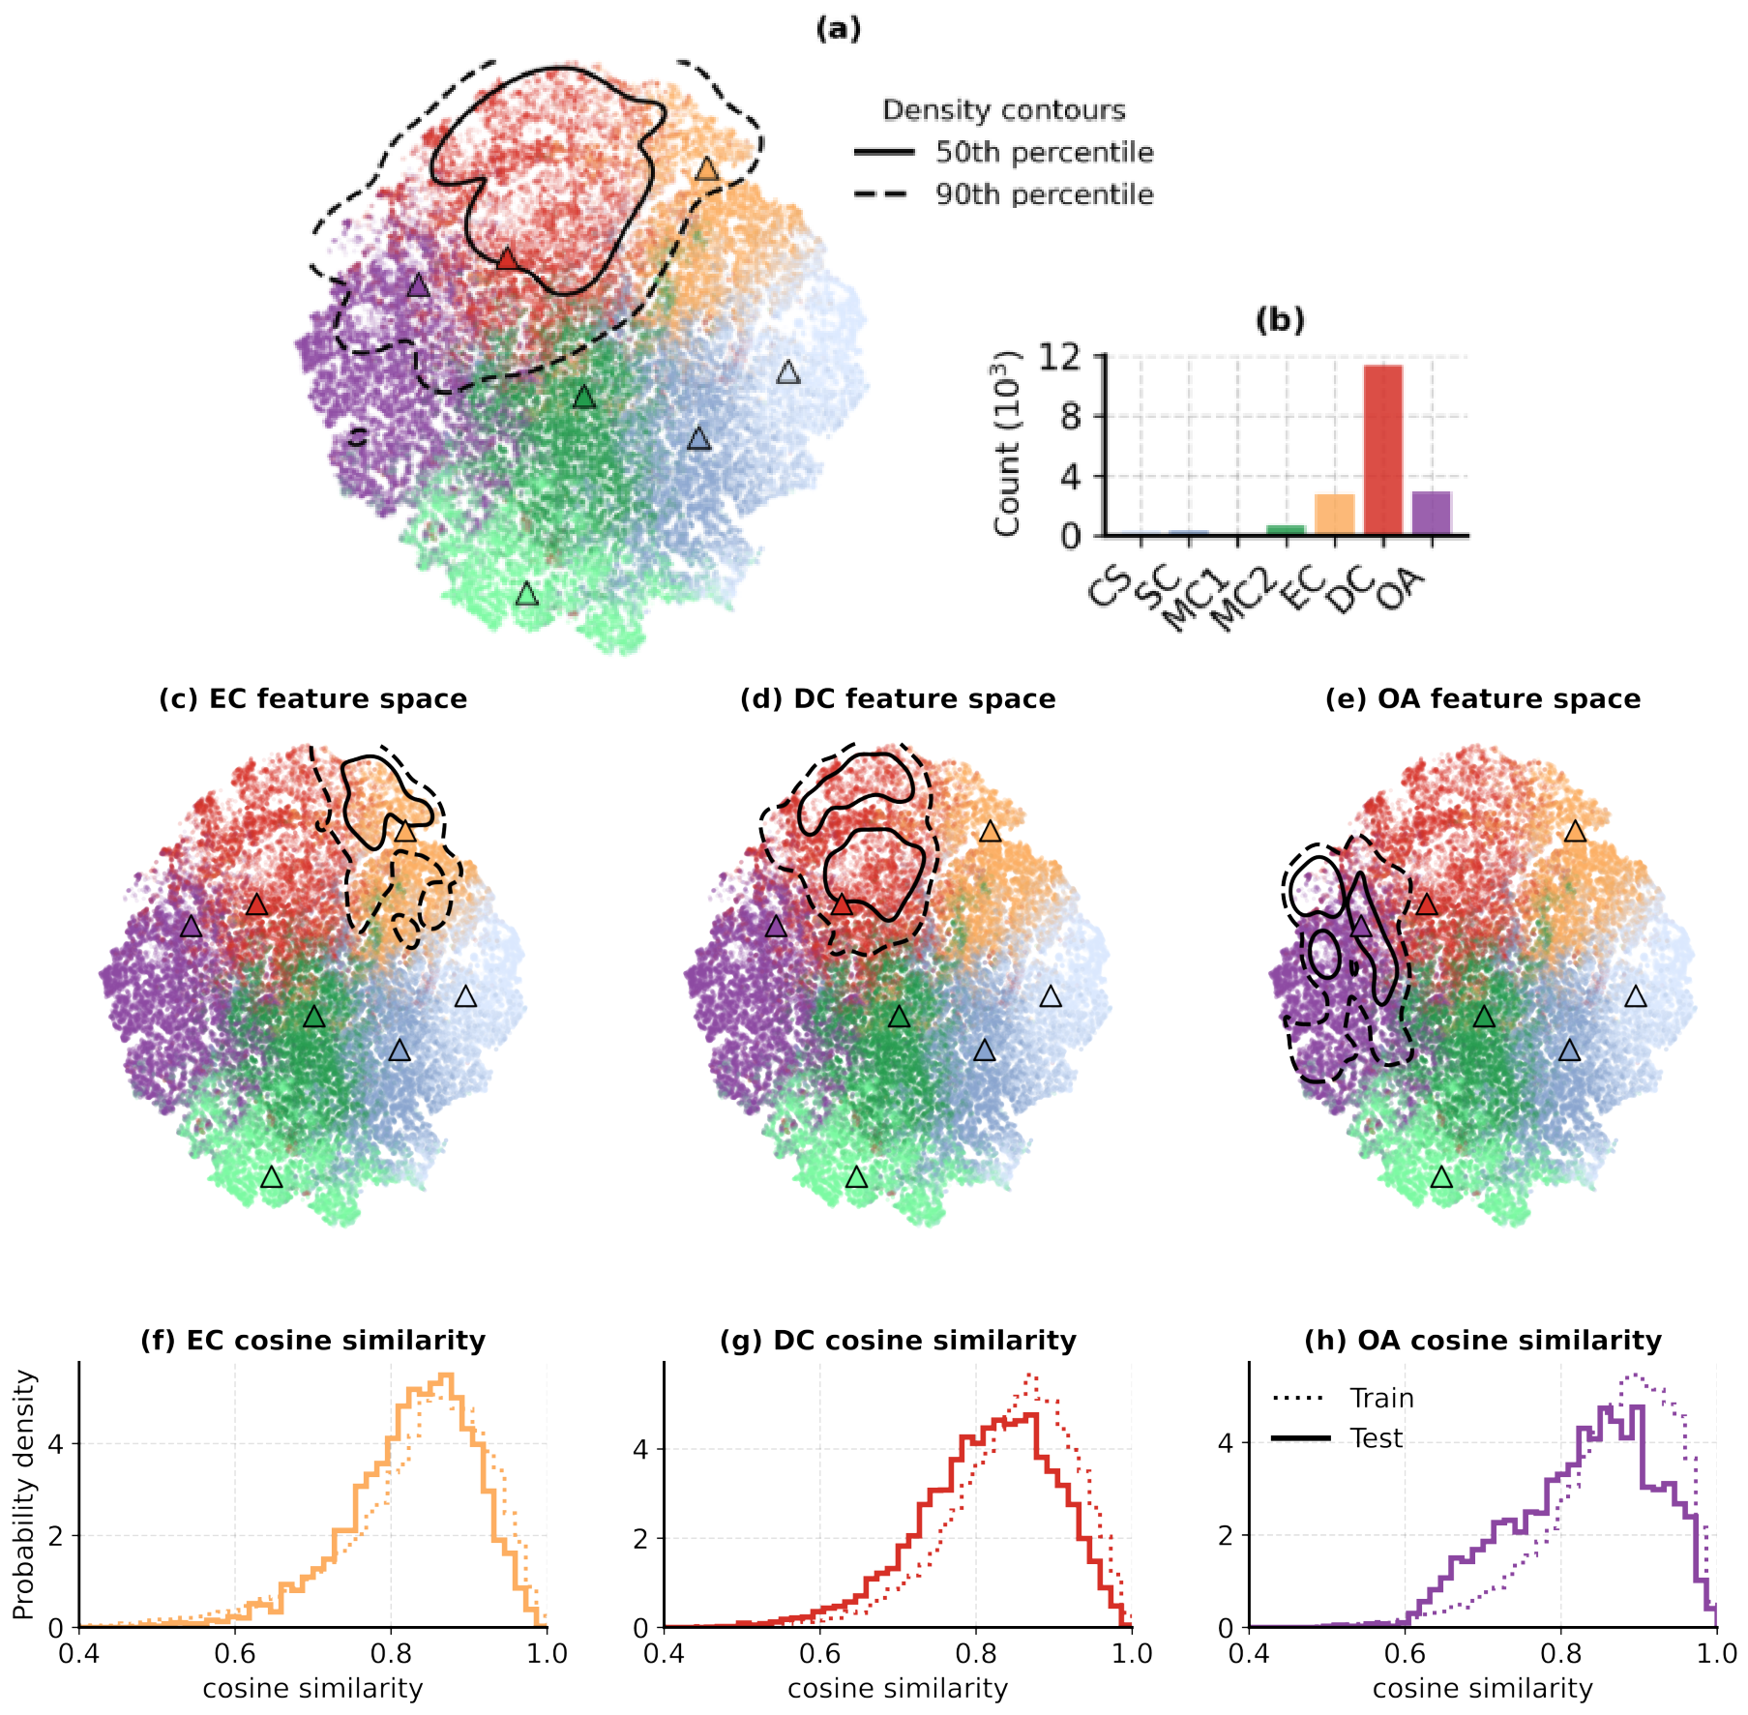
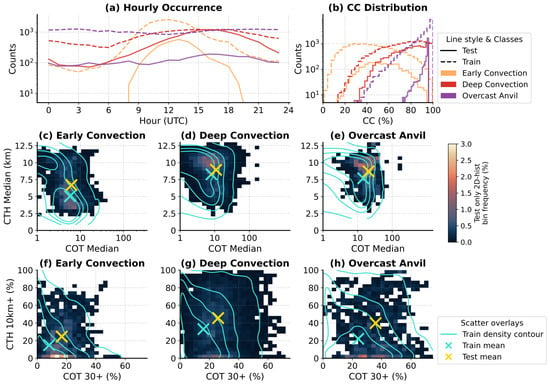
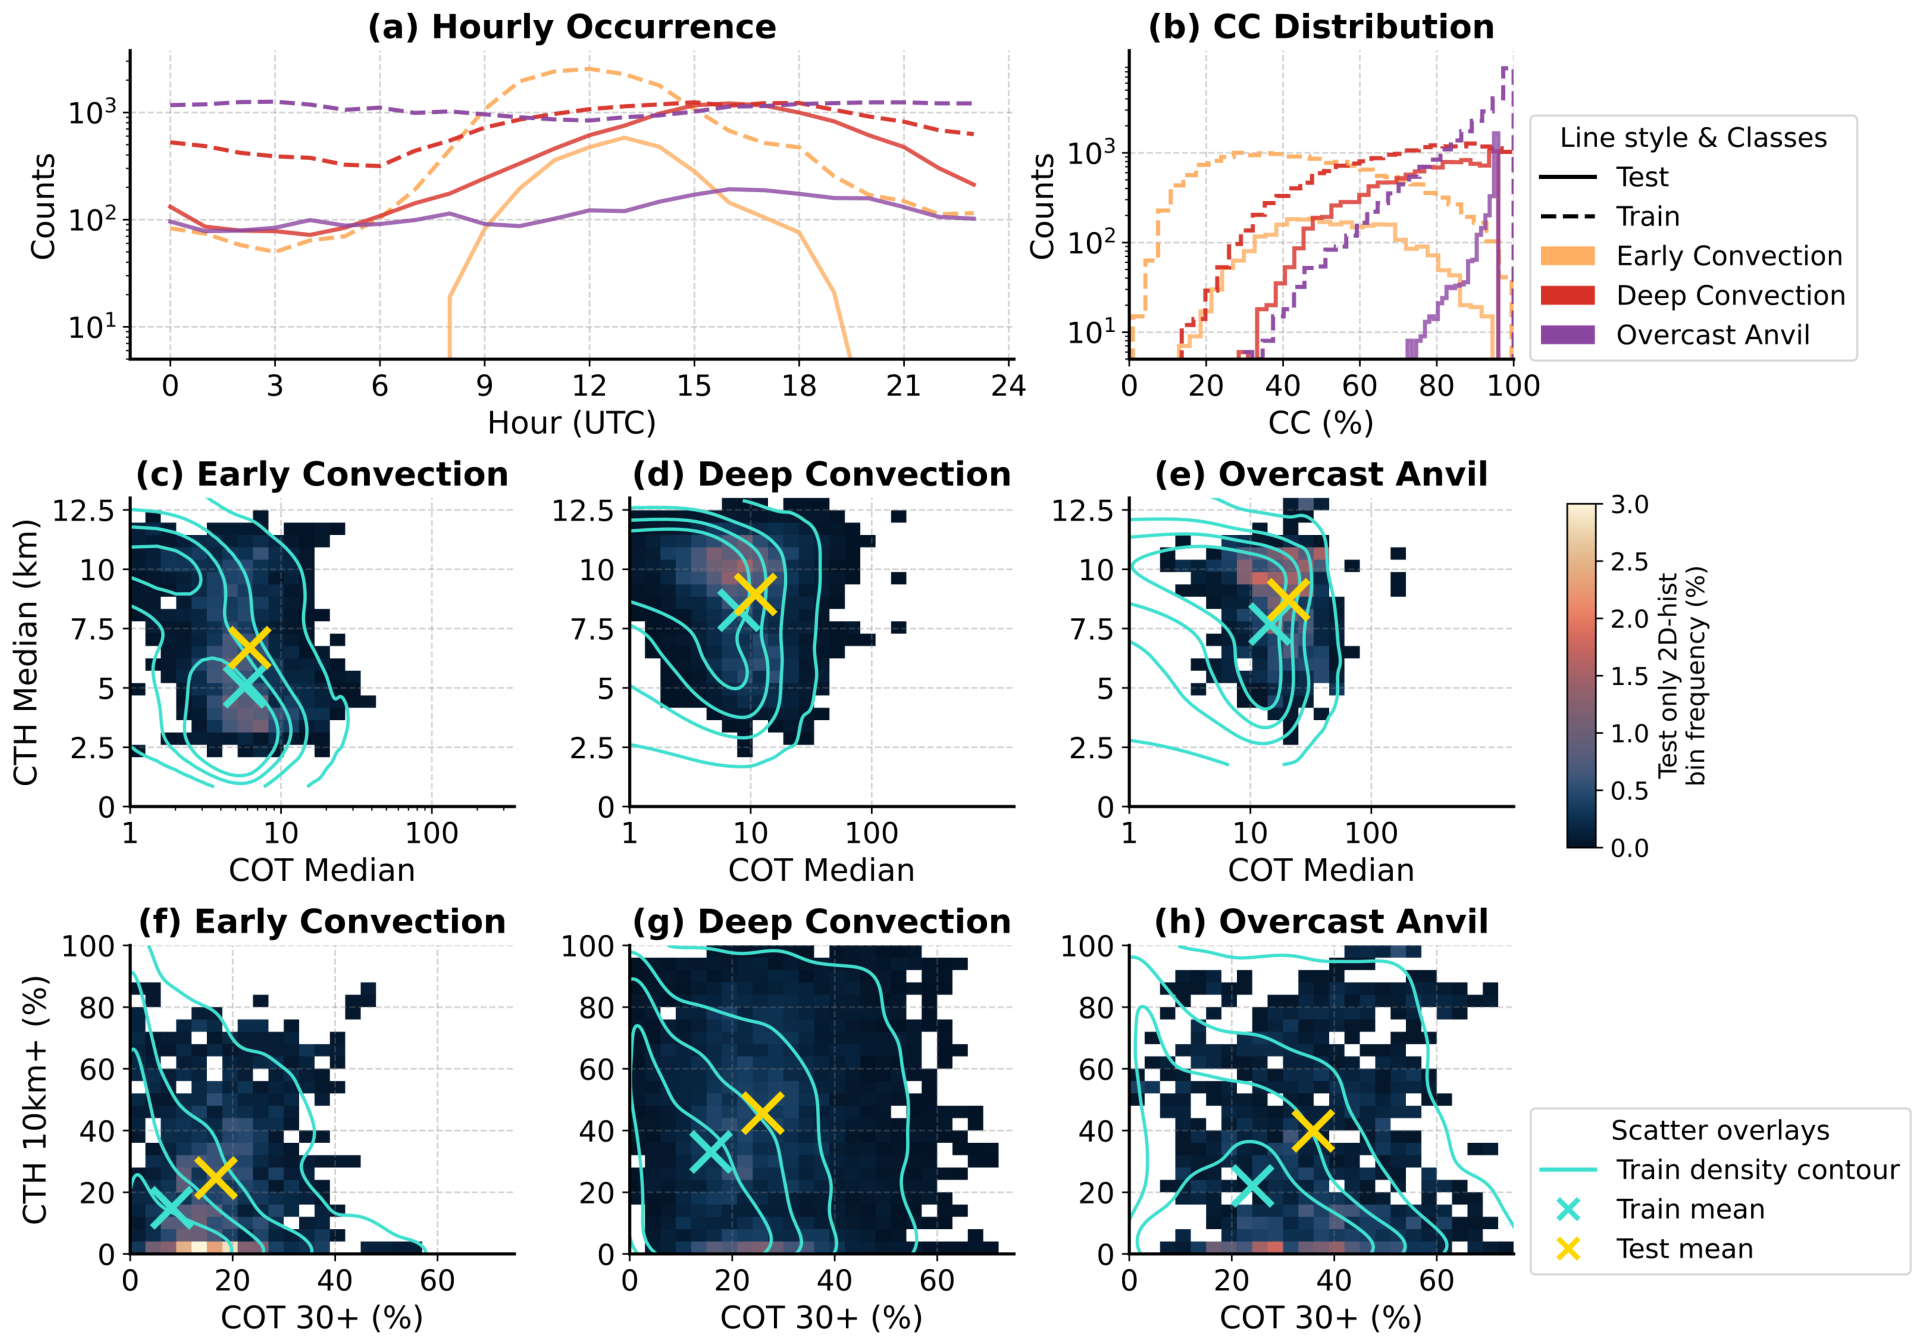
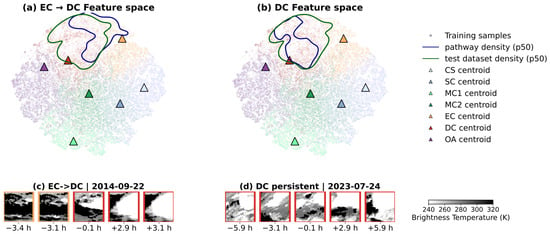
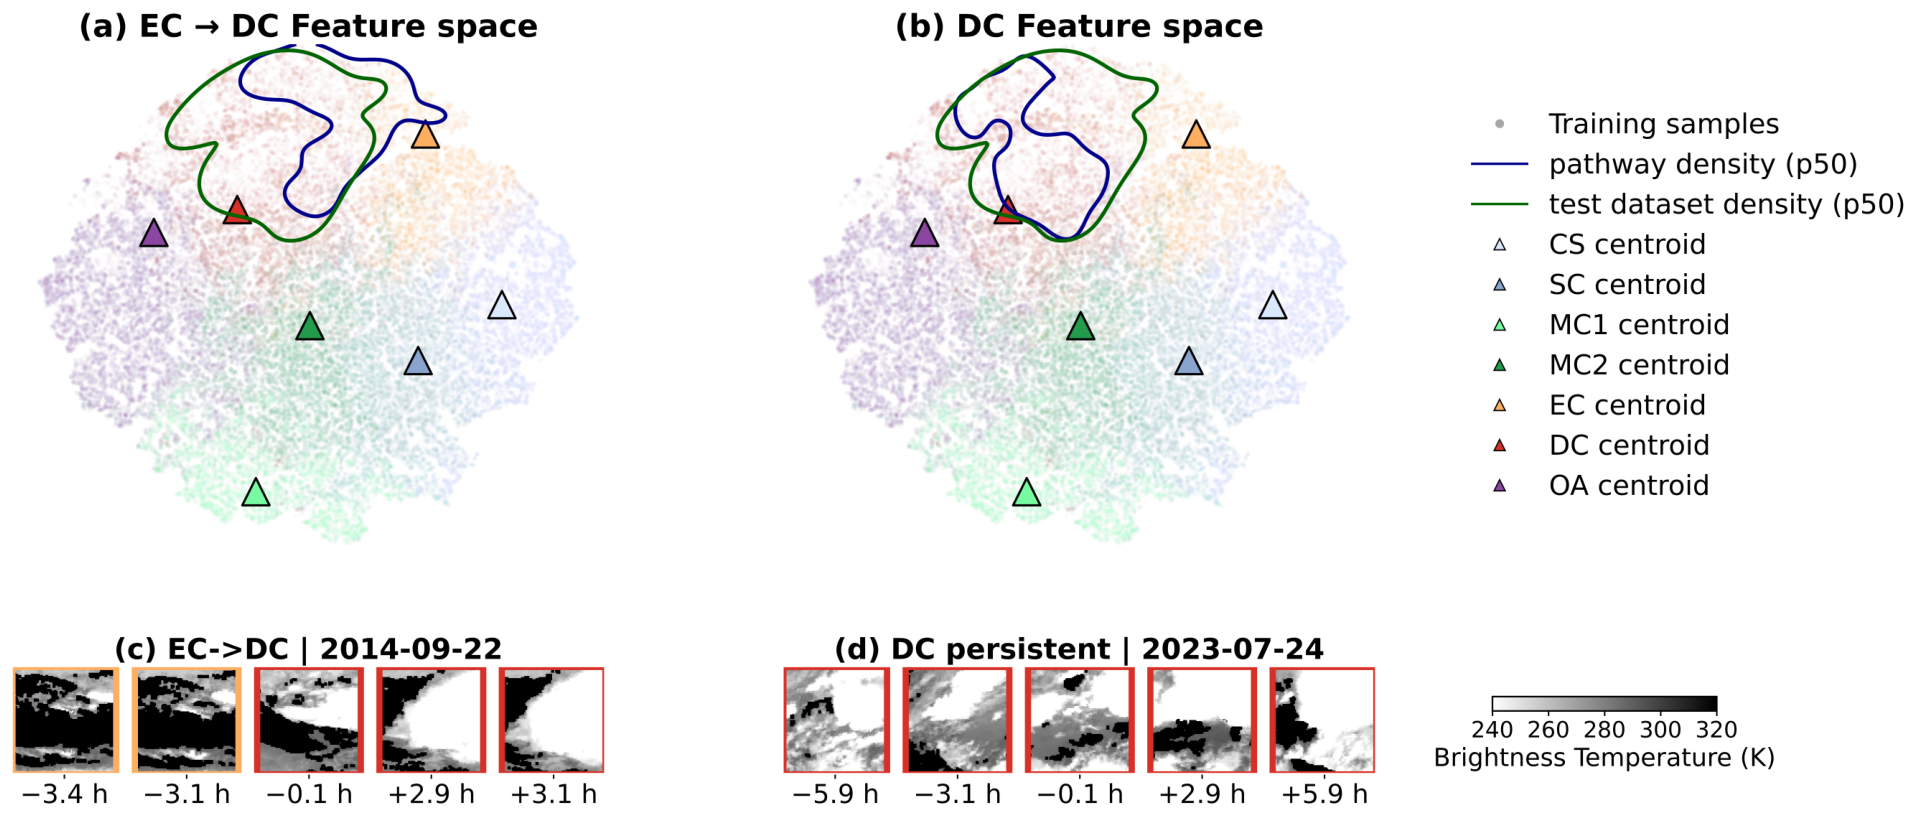
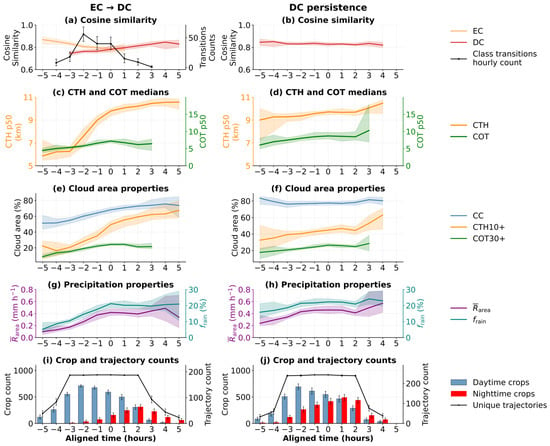
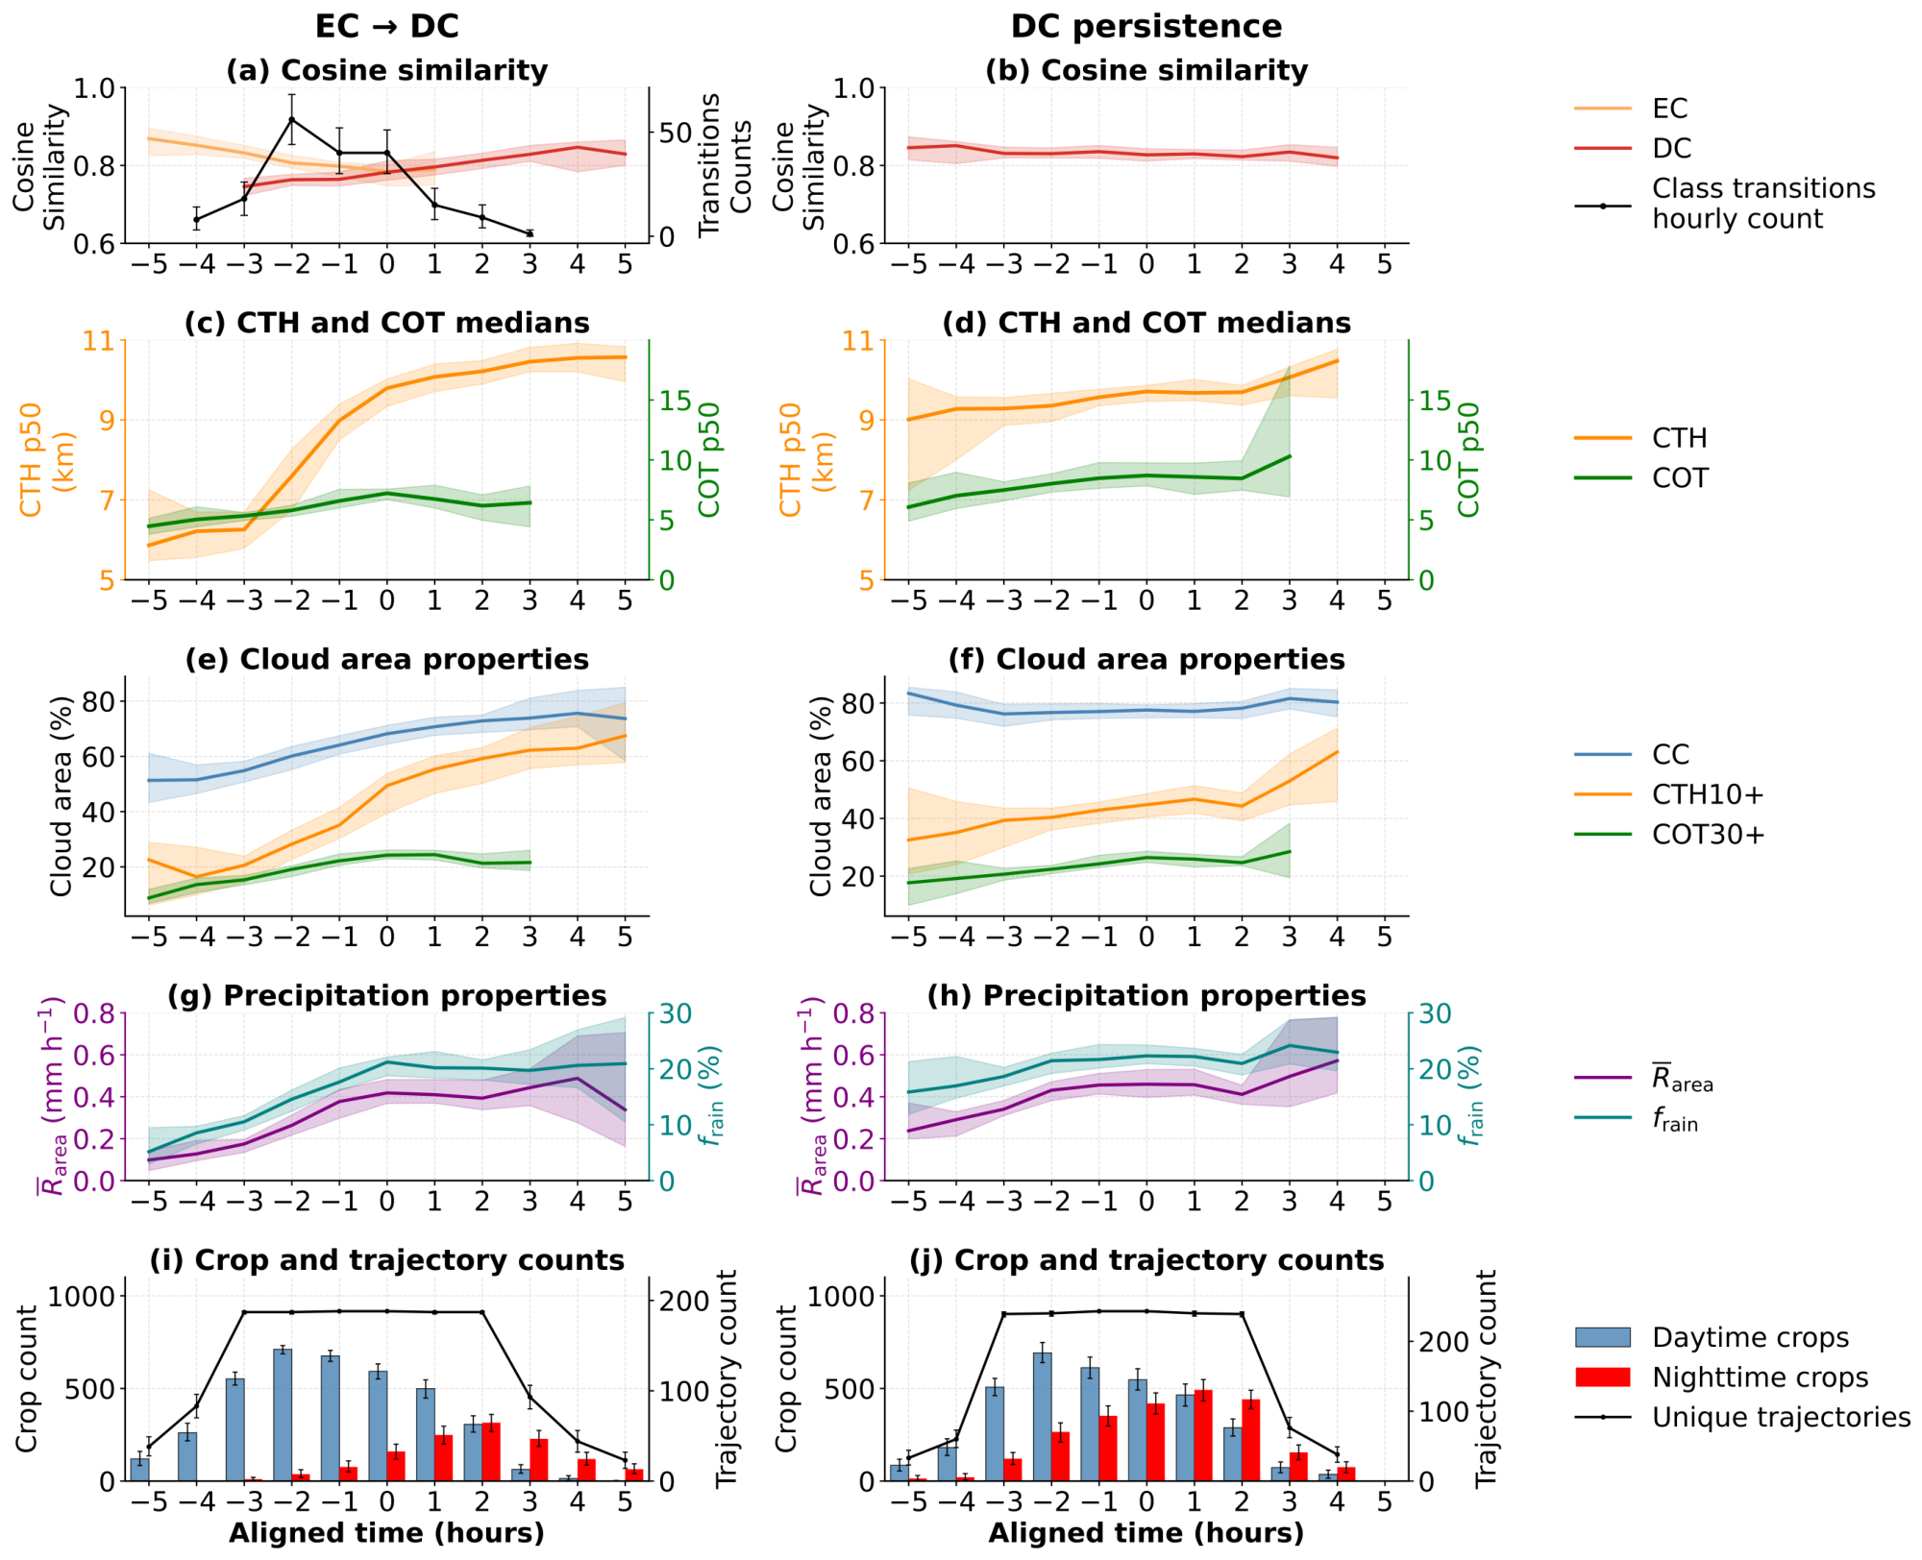

Disclaimer/Publisher’s Note: The statements, opinions and data contained in all publications are solely those of the individual author(s) and contributor(s) and not of MDPI and/or the editor(s). MDPI and/or the editor(s) disclaim responsibility for any injury to people or property resulting from any ideas, methods, instructions or products referred to in the content. |
© 2026 by the authors. Licensee MDPI, Basel, Switzerland. This article is an open access article distributed under the terms and conditions of the Creative Commons Attribution (CC BY) license.