


Highlights
What are the main findings?
- The regional subsidence centroid of the North China Plain remained spatially locked during 2016–2023 despite marked deceleration in deformation rates after 2019.
- Emerging Hot Spot Analysis revealed that 14.55% of the significant clustering area transitioned to diminishing or historical hot spots, while compaction inertia sustained persistent hot spots in the central-eastern thick-clay regions.
What are the implications of the main findings?
- The time-lag response of thick aquitards to groundwater recovery implies that short-term water-level rebounds cannot immediately reverse subsidence, necessitating sustained, decades-long groundwater management.
- The spatiotemporal diagnostic framework provides a practical reference for evaluating regional subsidence dynamics and guiding local groundwater conservation.
Abstract
The North China Plain (NCP) has entered a “New Water Regime” driven by water diversions, stringent groundwater management, and climatic fluctuations, resulting in the widespread recovery of regional groundwater levels. How land subsidence has responded spatiotemporally to these interventions remains unclear. To quantify the regional hydrogeological responses, we integrated Time-Series Interferometric Synthetic Aperture Radar (TS-InSAR) observations spanning 2016–2023 with weighted centroid tracking and Emerging Hot Spot Analysis (EHA) based on a Space-Time Cube. Centroid tracking indicated that the regional subsidence center remained spatially stable without significant directional drift. In the western and southern regions, Persistent and Intensifying Cold Spots dominated, corresponding to ground stabilization and rebound. In the central-eastern centers, 26.80% and 6.47% of the statistically significant clustering area were Persistent and Intensifying Hot Spots, reflecting continuous localized compaction, with Mann–Kendall and Sen’s slope analyses indicating a decelerating trend within these clusters. A further 4.92% and 9.63% were Diminishing and Historical Hot Spots, indicating reduced clustering after 2019. Overall, subsidence has decelerated markedly across most of the plain, yet compaction inertia in thick clay layers sustains localized hot spots despite rebounding groundwater levels. This time-lag response implies that short-term water-level recovery cannot immediately reverse subsidence, necessitating sustained groundwater management across the NCP.
1. Introduction
Land subsidence, a global geo-hazard characterized by the gradual settling of the Earth’s surface, poses a severe threat to urban infrastructure, geological stability, and regional sustainable development in major sedimentary basins [1,2]. The associated economic losses have prompted growing international efforts to quantify subsidence risks [3,4]. The North China Plain (NCP), one of the most populous and economically vital regions in China, has historically been one of the most severe subsidence areas globally [5,6,7]. Since the 1970s, prolonged groundwater overexploitation to sustain intensive agriculture and rapid urbanization has triggered widespread consolidation of thick Quaternary sediments [8,9,10], producing multiple large-scale subsidence cones [11,12]. By the 2010s, cumulative subsidence in certain areas had exceeded two meters, and the affected area continued to expand [13,14,15].
In recent years, the NCP has entered a distinct hydrological phase that has been identified in a number of recent hydrogeological studies which characterize it as a shift away from sustained head decline toward widespread recovery [16,17]. As no single term has yet been adopted consistently across these studies, we refer to this state as a “New Water Regime” for uniformity of description throughout this paper. This regime is primarily driven by the convergence of three main factors: (1) new water sources and managed aquifer recharge, which combines the South-to-North Water Diversion (SNWD) deliveries (since late 2014) with massive river replenishment and ecological flows that became a dominant water use sector post 2018 [18,19]; (2) the 2019 Comprehensive Governance of Groundwater Overexploitation, a major policy shift that integrates strict administrative controls (e.g., regional pumping caps and well-closure moratoriums) with profound demand management (e.g., agricultural crop restructuring, fallow periods, and industrial water-saving practices) [9,20]; and (3) increased precipitation in recent years [17].
Consequently, while these policy and engineering interventions, amplified by natural climatic variations, culminated in marked macro-scale inflection of groundwater levels around 2019–2020 [16,17,18,19,21], the hydro-mechanical response of the land surface remains complex. Recent InSAR-based studies indicate that these recovery-oriented interventions have contributed to a general deceleration of subsidence across the NCP [18,22]. However, localized studies reveal that severe subsidence persists in certain areas without significant mitigation; for instance, no significant mitigation trend was detected in Hengshui from 2017 to 2024 [23]. This discrepancy indicates the heterogeneous response of aquifer systems to groundwater recovery and suggests that the overall spatiotemporal restructuring of subsidence across the NCP remains poorly understood.
Research on land subsidence in the NCP has advanced along two related dimensions, spatial coverage and analytical focus. Early work concentrated on individual subsidence areas or single cities, where it provided detailed local characterization of the deformation field [24,25,26]. As InSAR processing over large areas matured, plain-wide assessments extended this coverage to the entire NCP; several of them focused on the period up to the 2019 transition (e.g., 2016–2018) [27], and mainly documented the deformation that preceded the recent groundwater-level recovery. More recent studies have combined plain-wide coverage with up-to-date observation periods, directing their analytical focus toward InSAR mapping and the inversion of deformation for aquifer storage change [28,29]. In parallel, at the regional scale, pixel-level time-series clustering has been used to categorize subsidence states across the Beijing–Tianjin–Hebei core region [30]. Because these analyses operate at the level of individual measurement points, they do not incorporate neighborhood spatial context or local spatial autocorrelation [31], which would help resolve how the spatial organization of subsidence clustering evolves across the region. Building on this progress, one question that remains open is whether the macro-scale subsidence centroid has shifted, and how the spatiotemporal structure of the deformation field has reorganized, under the combined influence of climatic variability and anthropogenic intervention.
To address this, we examine the spatiotemporal evolution of land subsidence in the NCP from 2016 to 2023, integrating TS-InSAR observations with Standard Deviational Ellipse (SDE) analysis and Space-Time Cube-based Emerging Hot Spot Analysis (EHA). The primary objective is to evaluate how the spatiotemporal structure of the deformation field reorganizes under the New Water Regime. To this end, the analysis operates on spatially aggregated bins with neighborhood-context statistics rather than at the level of individual measurement points. This approach incorporates spatial autocorrelation to separate systematic compaction trends from transient noise. Consequently, the field is resolved into ten spatiotemporal evolutionary modes, extending the conventional binary subsiding/stable classification. By anchoring our temporal classification to the 2019 policy turning point, these modes directly reflect the subsidence response to recent hydrogeological interventions. Specifically, we aim to (1) quantify the macro-scale geometric stability and migration of the regional deformation field; (2) identify and differentiate the spatiotemporal evolutionary states of subsidence clustering, and interpret their physical implications for aquifer system compaction; and (3) assess the correspondence between these subsidence patterns and long-term groundwater-level changes.
2. Study Area and Data
2.1. Study Area
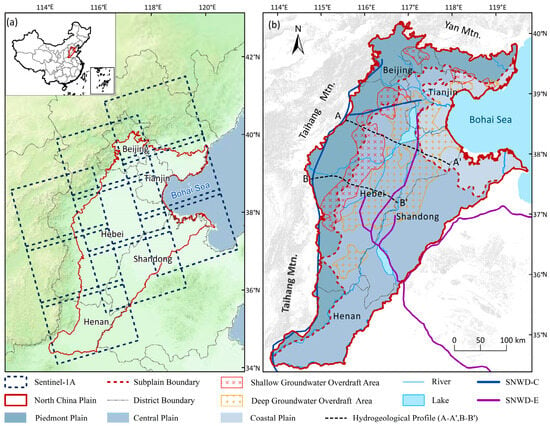
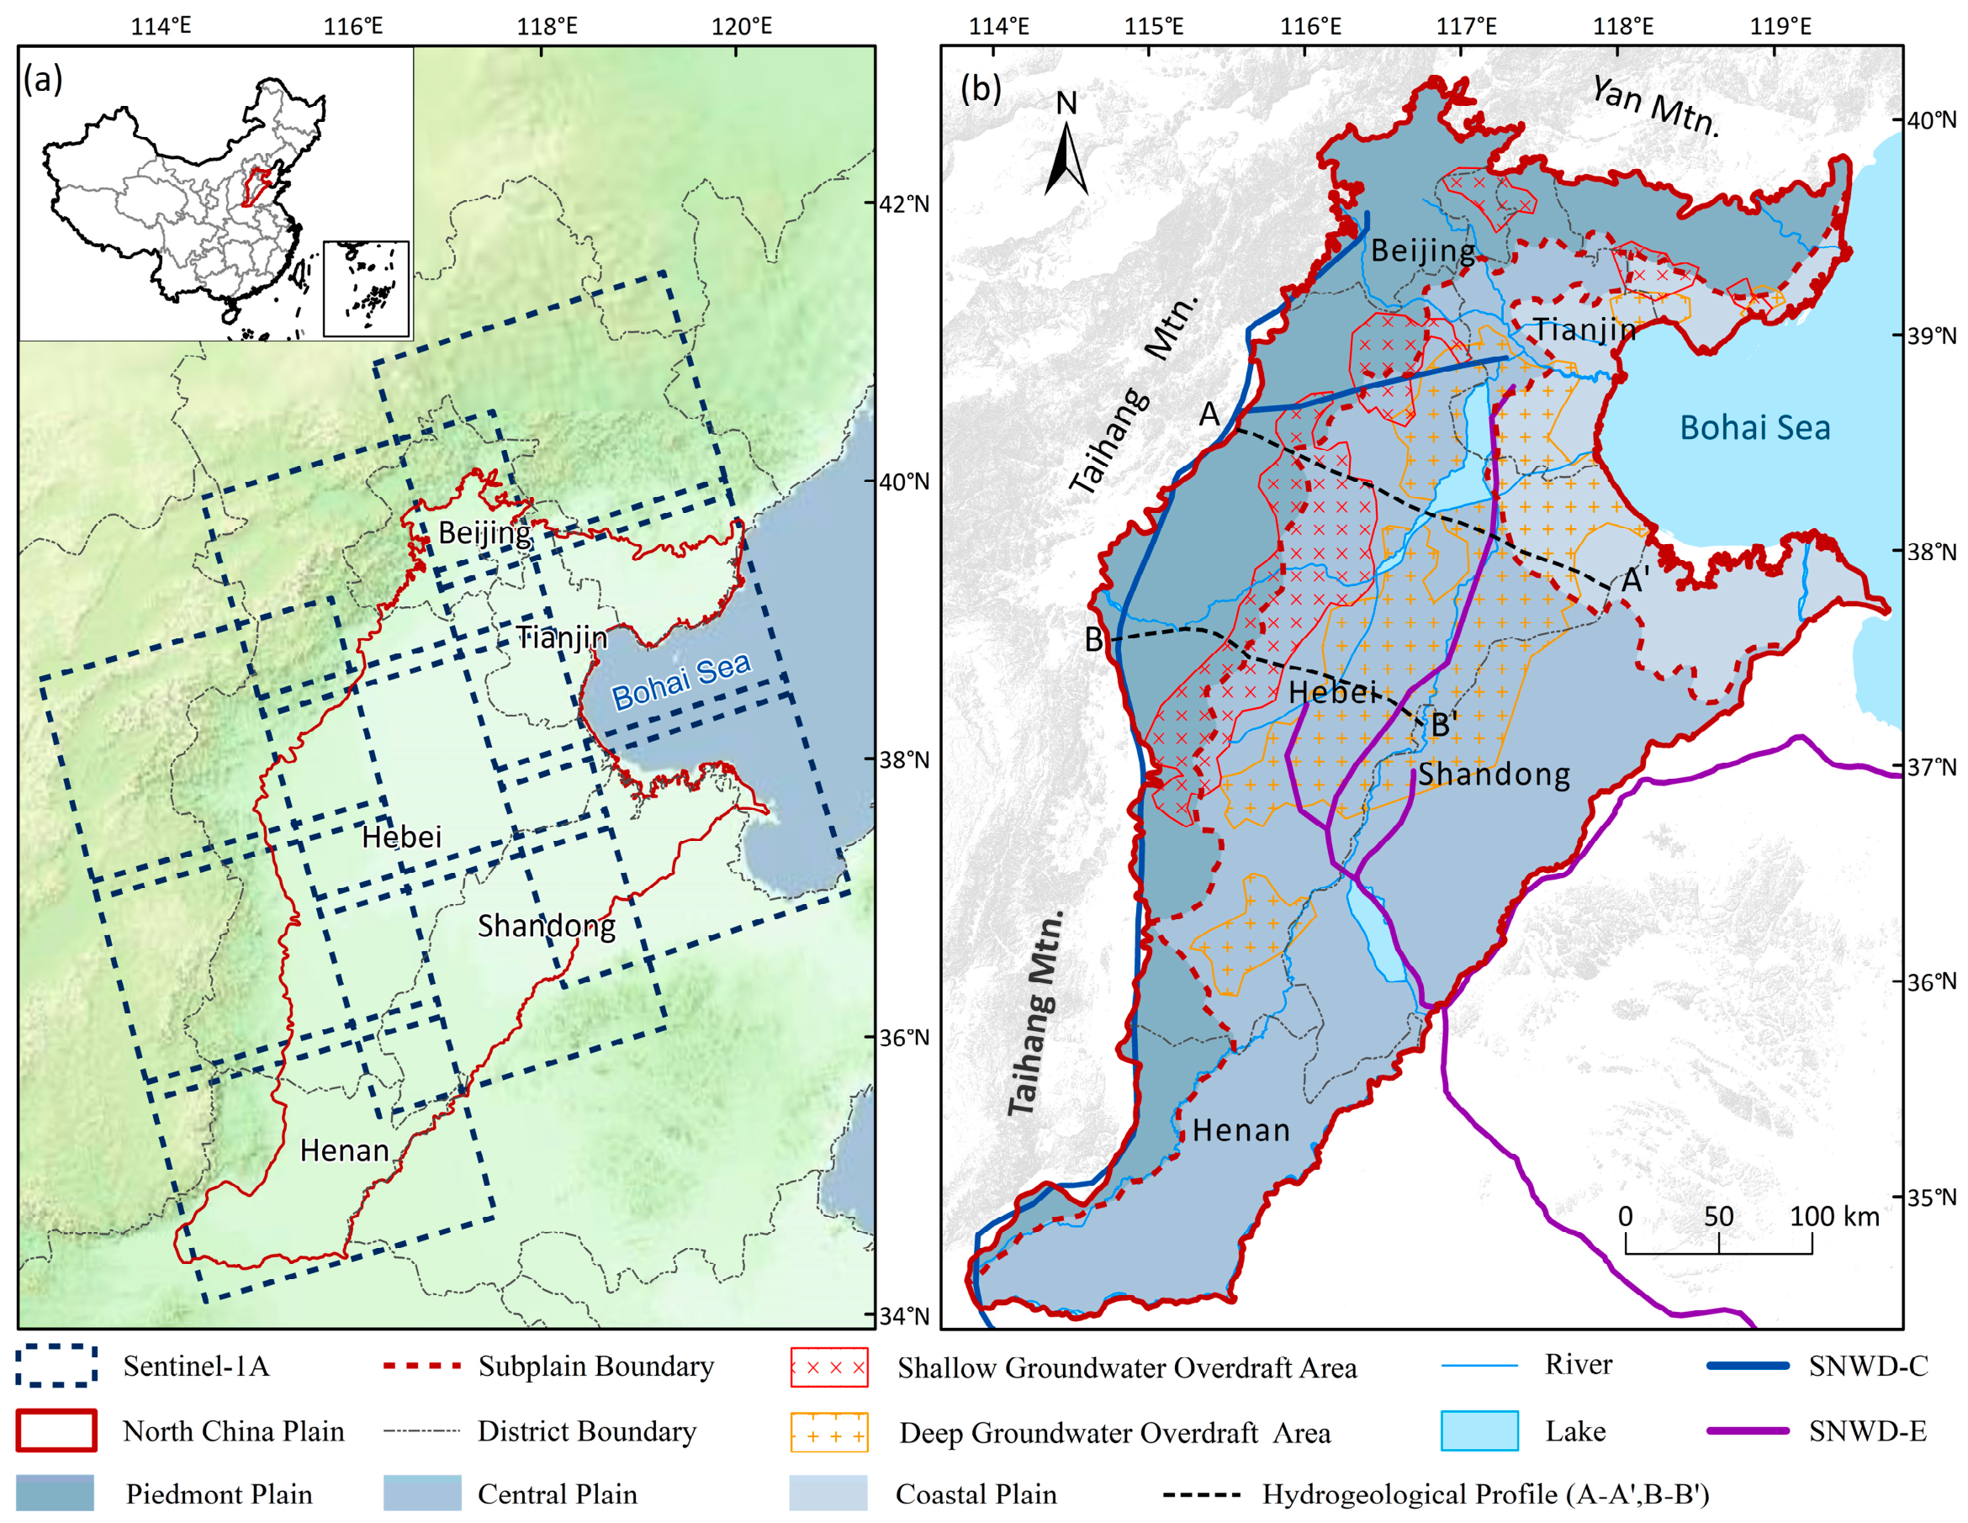
The North China Plain (NCP), located in eastern China (Figure 1), is one of the most populous and economically significant regions in the world. It covers an area of approximately 140,000 km2, encompassing Beijing, Tianjin, and vast portions of Hebei, Shandong, and Henan provinces. Topographically, the NCP is a typical alluvial–proluvial plain characterized by low-lying and flat terrain, with an elevation mostly below 50 m above sea level. The NCP is underlain by thick Quaternary unconsolidated sediments reaching depths of 600–1000 m in depocenter areas. The aquifer system is typically divided into four main groups (I–IV) [32]. The shallow aquifers (Groups I and II) are primarily unconfined or semi-confined, while the deep aquifers (Groups III and IV) are confined and have historically served as the primary source for industrial and agricultural water supply. The high compressibility of multi-layered clay and silt interbeds, combined with decades of groundwater overexploitation, has driven pronounced hydraulic head decline and widespread land subsidence, with storage depletion far outpacing natural recharge [33].
Figure 1.
Study Area and Data Distribution. (a) The location of the NCP. (b) Sub-plain divisions of the NCP.
Since 2014, the NCP has entered a new era of water resource management. The commissioning of the SNWD project, followed by strict groundwater pumping restrictions beginning in 2019 (e.g., the Comprehensive Governance of Groundwater Overexploitation initiative), combined with increased precipitation in recent years, has fundamentally altered regional hydraulic conditions. Groundwater levels have consequently recovered in several sub-regions, providing a natural experiment for investigating the non-linear relationship between hydraulic head changes and land deformation.
2.2. SAR Data
We retrieved land deformation from 594 Sentinel-1A Synthetic Aperture Radar (SAR) images acquired in Interferometric Wide (IW) swath mode between January 2016 and December 2023. To achieve complete coverage of the NCP, three ascending tracks (Path 40, Path 69, and Path 142) (Figure 1) were employed. All SAR images were obtained from the Alaska Satellite Facility (ASF) archive with a revisit interval of 12 days. The deformation time series was retrieved using the Interferometric Point Target Analysis (IPTA) workflow implemented in the GAMMA 2018 software package. Detailed information on the Sentinel-1A datasets is listed in Table 1.
Table 1.
Sentinel-1A SAR data used in this study.
2.3. Groundwater-Level Data
To characterize groundwater conditions across the study area, we used two representative spatial profiles rather than individual monitoring wells. Because a profile resolves the hydraulic head gradient continuously across the EHA evolutionary clusters, it corresponds more naturally to the continuous deformation field retrieved by InSAR than a set of scattered point measurements would. The groundwater data were provided by the Hebei Institute of Geological Environment Monitoring, which is the provincial groundwater-monitoring authority, drawing on the national and provincial monitoring networks. The shallow and deep aquifers were interpolated separately, each into an annual potentiometric surface by ordinary kriging with a spherical semivariogram model, and profiles A-A’ and B-B’ (Figure 1b) were then sampled from the corresponding surfaces. The records extend back to 1985; the network has been densified over this period, from relatively few stations in the earliest years to about two thousand in recent years, with near-complete coverage during 2019–2023. For each year we used the June value, which usually approximates the regional annual minimum water level. Since the profiles derive from interpolated surfaces rather than direct well readings, and since InSAR and groundwater levels differ in spatial support, we treat them as a spatially explicit comparison with the deformation field rather than a point-by-point comparison.
3. Methods
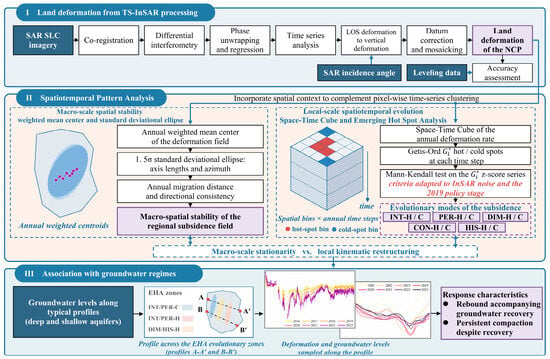
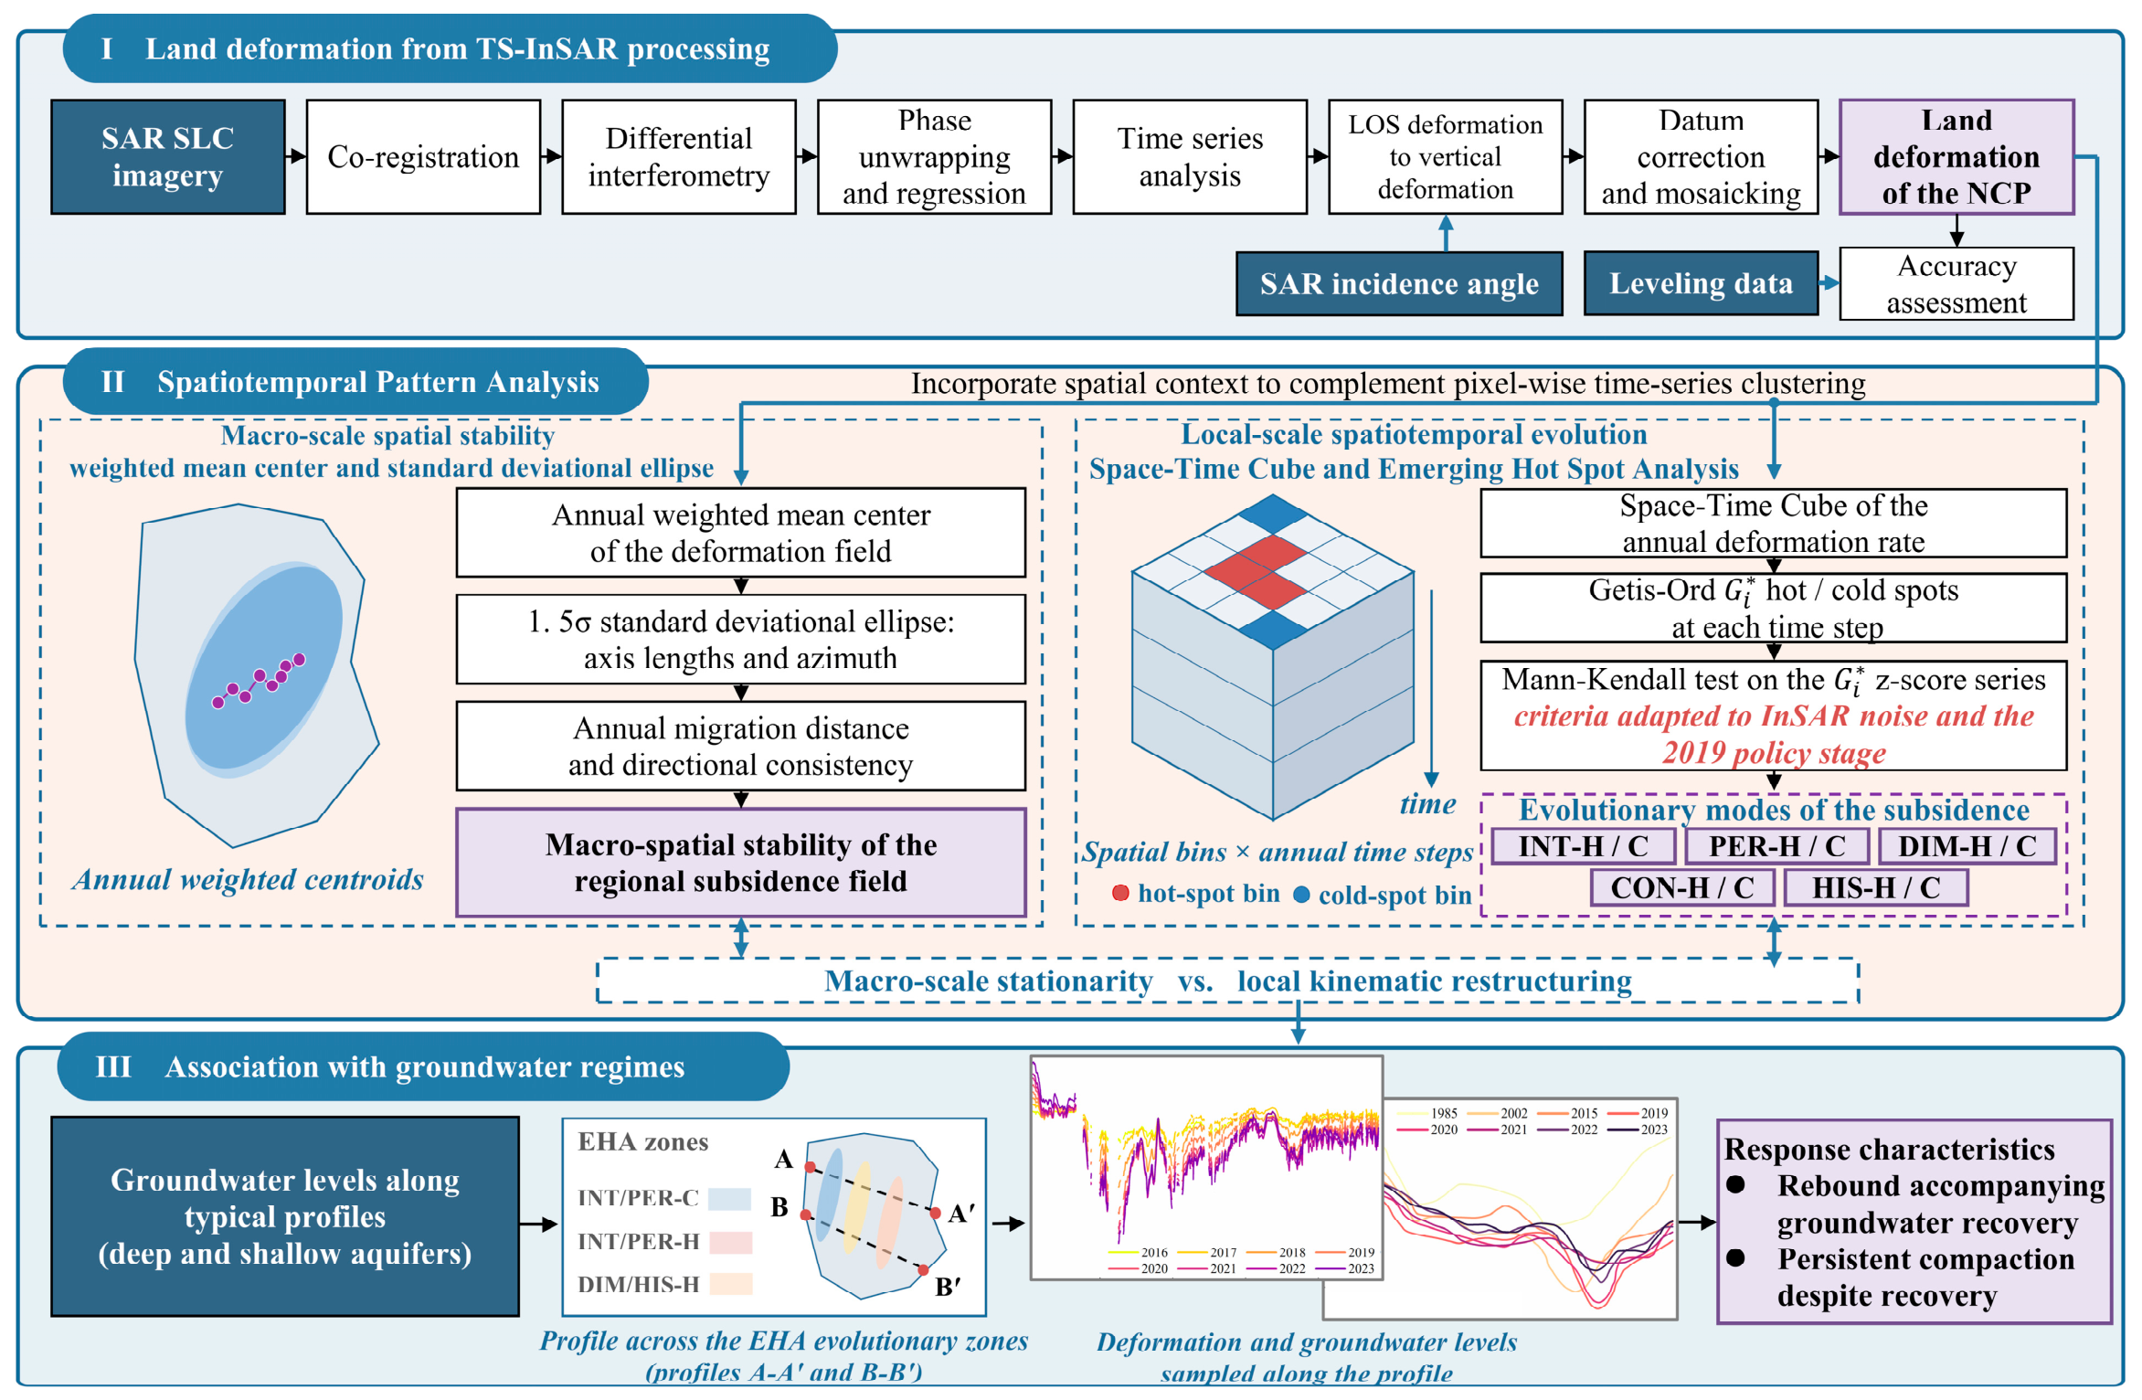
The methodology comprises three sequential stages (Figure 2). First, vertical deformation time series are extracted via TS-InSAR. Second, the macro-spatial stability of the subsidence field is quantified through weighted centroid migration and Standard Deviational Ellipse analysis. Third, localized spatiotemporal evolutionary patterns are diagnosed by applying Emerging Hot Spot Analysis to a Space-Time Cube, with the resulting patterns compared with representative groundwater monitoring records.
Figure 2.
Data processing and study flowchart. (Note: denotes the Getis-Ord local statistic).
3.1. Identification of Land Deformation with Time-Series InSAR Analysis
We retrieved land deformation across the NCP using the Interferometric Point Target Analysis (IPTA) technique [34] implemented in the GAMMA 2018 software package. IPTA identifies coherent point targets and estimates their long-term deformation through iterative phase modeling. In this study, IPTA was used as the coherent point target selection, phase modeling, error estimation, and time-series inversion framework, while a small-baseline multi-reference strategy was adopted for interferometric network construction. Although distributed scatterer approaches such as DS-InSAR and SqueeSAR can potentially increase measurement density over agricultural and seasonally vegetated surfaces, IPTA was selected because the primary objective of this study was to construct a temporally stable and regionally consistent long-term deformation field over the entire NCP rather than to maximize measurement density at the individual agricultural field scale. Accordingly, priority was given to the long-term phase stability and regional consistency of the retained deformation measurements.
In this study, a total of 594 Sentinel-1A Synthetic Aperture Radar (SAR) images acquired between January 2016 and December 2023 (as described in Section 2.2) were processed. The three orbital paths were processed independently. Within each path, Sentinel-1 TOPS acquisitions were co-registered, and Enhanced Spectral Diversity (ESD) was used to refine the azimuth co-registration to an accuracy better than 0.001 pixels, thereby minimizing phase discontinuities at burst boundaries. Azimuth de-ramping was subsequently applied to remove Doppler centroid shifts between adjacent bursts in TOPS mode.
To reduce temporal decorrelation while maintaining sufficient network connectivity, particularly over agricultural areas affected by seasonal vegetation changes, a small-baseline multi-reference interferometric network was constructed within the IPTA framework. Each SAR acquisition was interferometrically paired with up to the subsequent three acquisitions, thereby constructing a redundant multi-reference interferometric network with relatively short temporal baselines rather than a simple sequential chain. The resulting interferograms formed a multi-master network rather than a conventional single-master interferometric configuration. Here, the small-baseline strategy refers specifically to the interferometric pair selection scheme, whereas IPTA defines the coherent point target selection, phase modeling, error estimation, and time-series inversion framework. Therefore, the adopted processing scheme represents an IPTA-based coherent-target TS-InSAR approach incorporating a small-baseline multi-reference interferometric network, rather than a standard SBAS implementation. A multi-looking factor of 10 × 2 was applied in the range and azimuth directions, respectively, to reduce phase noise. Topographic phase contributions were removed using the 30 m Shuttle Radar Topography Mission (SRTM) digital elevation model (DEM). Adaptive filtering with progressively reduced window sizes of 64, 32, and 16 pixels was applied iteratively to suppress random phase noise, followed by phase unwrapping using the Minimum Cost Flow (MCF) algorithm. A track-specific reference point was selected for each independently processed orbital path to establish the relative deformation reference. The reference points for Paths 40, 142, and 69 were located at (115.214195°E, 38.184937°N), (116.343987°E, 39.916725°N), and (117.219459°E, 38.054751°N), respectively. These reference points were used to define the relative deformation reference during the independent processing of each orbital path and should be distinguished from the subsequent use of Path 142 as the regional reference track for inter-track datum unification.
Within the IPTA framework, the coherent point targets (CPTs) were identified based on their interferometric phase stability. CPTs with a mean interferometric coherence greater than 0.6, a coherence standard deviation lower than 0.3, and a minimum intensity threshold of 0.01 were retained for subsequent time-series analysis. Deformation parameters and residual topo-graphic errors were iteratively estimated through phase regression and network adjustment. Atmospheric phase screens (APS) were estimated and mitigated within the GAMMA IPTA time-series processing framework by exploiting the different spatiotemporal frequency characteristics of atmospheric artifacts and long-term deformation signals. No external atmospheric correction products, such as GACOS or ERA5, were used. After correction of these phase components, the multi-master interferometric phases were jointly inverted using Singular Value Decomposition (SVD) to retrieve the cumulative deformation time series and deformation rates for CPTs.
To construct a spatially continuous deformation field across the NCP, the independently processed deformation results from Paths 40, 142, and 69 were transformed into a common regional reference frame prior to mosaicking. Assuming that horizontal deformation was small relative to the dominant vertical subsidence at the regional scale, the LOS deformation measurements of each track were projected onto the vertical direction according to the following:
where and denote the vertical and LOS deformation, respectively, and θ is the local incidence angle. Path 142 was selected as the regional reference track for inter-track datum unification because its deformation measurements were independently evaluated against leveling observations. Here, Path 142 served as the regional vertical datum reference for cross-track adjustment and should be distinguished from the phase-reference points used during the independent processing of individual tracks.
Datum consistency between adjacent tracks was established using their overlapping areas. Spatially corresponding deformation observations between Path 142 and the adjacent Paths 40 and 69 were identified within the overlap areas using a spatial matching threshold of 0.5 pixel. Independent Delaunay triangulation networks were constructed from the corresponding observations of the reference and target tracks. Deformation differences along corresponding triangulation edges were then calculated to evaluate the consistency of local deformation gradients between adjacent tracks. When the local deformation structures were consistent, the residual inter-track discrepancy was represented as a constant vertical datum offset. For each time step, this offset was estimated as the median vertical deformation difference between the corresponding observations within the overlap area, thereby reducing the influence of outliers associated with residual atmospheric effects and localized decorrelation. The estimated offsets were subsequently applied to Paths 40 and 69, transforming their deformation measurements into the vertical reference frame defined by Path 142. This procedure was repeated for all time steps, after which the corrected deformation fields were mosaicked to generate a spatially continuous TS-InSAR deformation dataset for the entire NCP.
3.2. Spatial Evolution of the Subsidence Centroid and Extent
To quantify the macro-spatial evolution of the subsidence field, we employed the Weighted Mean Center and Standard Deviational Ellipse (SDE) methods [35,36,37]. By condensing the annual deformation distribution into a singular geometric center, this approach filters out localized inter-annual fluctuations, enabling detection of subtle spatial drifts otherwise obscured in 2D velocity maps.
where denotes the subsidence magnitude of deformation raster cell in year , serving as the weighting factor, and are the spatial coordinates. The trajectory of this centroid over the 8-year period reveals the stability or systematic drift of the regional subsidence core.
Furthermore, the 1.5σ SDE is constructed at each annual time step to capture the directional dispersion of the subsidence field. The SDE is defined by three parameters: the lengths of the semi-major and semi-minor axes, which quantify the spatial extent of deformation along the principal and orthogonal directions, and the azimuth angle of the semi-major axis, which indicates the dominant orientation of the subsidence distribution. By tracking these parameters over time, it is possible to assess whether the overall spatial footprint of subsidence has undergone systematic contraction, expansion, or rotation in response to groundwater management interventions.
3.3. Spatiotemporal Diagnosis of Subsidence Evolutionary Patterns
Diagnosing land subsidence in the NCP requires accounting for both aquifer heterogeneity and complex human interventions. Traditional pixel-based InSAR time-series analysis, while providing high resolution, is often hampered by stochastic noise and a lack of spatial context, making it difficult to distinguish systematic trends from localized fluctuations. To address this, following the conceptual framework of the EHA [38], we implement a unified spatiotemporal analytical workflow based on the Space-Time Cube (STC).
The study area is discretized into spatial bins of 1 km × 1 km with an annual temporal resolution. Consistent with scaling practices in prior EHA studies, which range from 200 m for local valleys [39] to 4 km for national scales [40]. The 1 km grid is commensurate with the regional extent (~140,000 km2). Temporally, the annual step aligns with the groundwater abstraction–recharge cycle and the timescale of recent interventions. Sub-annual binning would introduce the seasonal signal of the irrigation abstraction–recovery cycle, which would obscure the multi-year trends targeted here.
Subsequently, the Getis–Ord statistic [41,42] is utilized as a local spatial autocorrelation metric to identify statistically significant clusters of high-rate subsidence (hot spots) for each time step. This method addresses the spatial nonstationarity of the NCP subsidence field, as it differentiates systematic subsidence depression centers from isolated anomalies. The statistic for a bin i at time t is calculated as follows:
where denotes the subsidence magnitude of neighboring spatial bins at time , is the spatial weight between spatial bins and , is the mean deformation rate of the study area, and is the standard deviation. The spatial weight was defined using a fixed-distance band of 3000 m with binary weights. A fixed-distance band is the recommended conceptualization for analysis, for which a primary consideration is that each bin has a sufficient number of neighbors for a reliable local statistic [41,42]. Defining the band by the number of nearest neighbors is an established practice in hot spot analysis [43]. The distance band was set to 3000 m, which provides each bin with approximately 30 neighbors, sufficient for a stable estimate while remaining well below the subsidence cones (on the order of tens of kilometers). Statistical significance was set at |Z| ≥ 1.96 (p < 0.05) for the hot/cold-spot classification.
Finally, the Mann–Kendall (M-K) trend test [44] is applied to the sequence of z-scores generated at each location over the 8-year period. The M-K test is a non-parametric method selected for its robustness against non-normal distributions and outliers, making it suitable for diagnosing non-linear trends in human-natural coupled systems influenced by policy interventions and climatic variability. Statistical significance was set at p < 0.05 for the Mann–Kendall trend test used to assign the evolutionary modes. Based on the trend significance, the subsidence field is categorized into distinct evolutionary modes (Table 2). To better accommodate the inherent noise characteristics of InSAR time-series data and align with the temporal stages of regional water resource management, we adapted the traditional spatiotemporal classification criteria [38,43,45].
Table 2.
Patterns resulting from emerging hot spot analysis.
- (1)
- Long-Term Modes (Intensifying, Persistent, and Diminishing): The temporal consistency threshold was relaxed from the conventional ≥7 of 8 years (≈90%) to ≥6 of 8 years (75%). For an 8-year period, the conventional 90% criterion is overly sensitive to occasional InSAR phase-unwrapping artifacts and transient seasonal anomalies. The 6-year threshold tolerates short-term observational noise while still capturing systematic, long-term compaction trends.
- (2)
- Consecutive and New Modes: The original “New” and “Consecutive” modes were merged into a single “Consecutive” category. In an 8-year time series, the distinction between “newly appeared in the final time step only” (New) and “continuously significant for the final two or more steps” (Consecutive) carries limited practical significance, as both indicate recent-onset clustering. Merging them simplifies interpretation without sacrificing diagnostic value.
- (3)
- Historical Mode: To evaluate subsidence responses under the new water regime, this mode is anchored to the 2019 policy turning point. The year 2019 serves as a critical inflection point for the NCP, marking the implementation of mandatory groundwater controls. Recent large-scale hydrological evaluations confirm that regional groundwater depletion transitioned into a recovery phase around 2019–2020 [17,20]. Consequently, this study anchors its temporal analysis to this specific year to capture the subsidence response to these interventions. The termination criterion was redefined to require significant clustering during 2016–2019, followed by a non-clustering state for at least three years during 2020–2023. This distinguishes systemic mitigation from random annual fluctuations. This anchor is further supported by our own observations that the groundwater levels along the two profiles reached their historic minima around 2019–2020 before entering a recovery phase (Section 5.1), providing an empirical basis for the temporal anchor.
To assess whether the modified classification is sensitive to these choices, the analysis was repeated with the long-term criterion set to 5, 6 and 7 years, and then with the historical criterion set to 2, 3 and 4. The regional pattern is reproduced in all cases; the procedures and results are documented in the Supplementary Materials (Text S1, Figure S1 and Tables S1–S4).
3.4. Trend Analysis of Annual Land Subsidence
We quantified the long-term trend rates using Sen’s slope estimator, a non-parametric method that provides robust estimates even for noisy datasets containing outliers [46]. A positive slope indicates an increasing (accelerating) trend, while a negative slope indicates a decreasing (decelerating) trend.
The statistical significance of the trends was evaluated using the Mann–Kendall test, which is well suited for non-normally distributed data [44]. Unlike the M-K test in Section 3.3 which operates on z-score series (clustering intensity), the test here operates on the annual subsidence magnitude series, evaluating whether the physical deformation amount is accelerating or decelerating. A significance level of 0.05 was used, corresponding to a critical threshold of |Z| ≥ 1.96. Trends were classified as significantly increasing when Z ≥ 1.96 and as significantly decreasing when Z ≤ −1.96.
4. Results
4.1. Accuracy Validation of InSAR Results
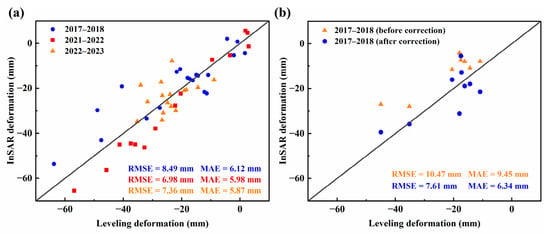
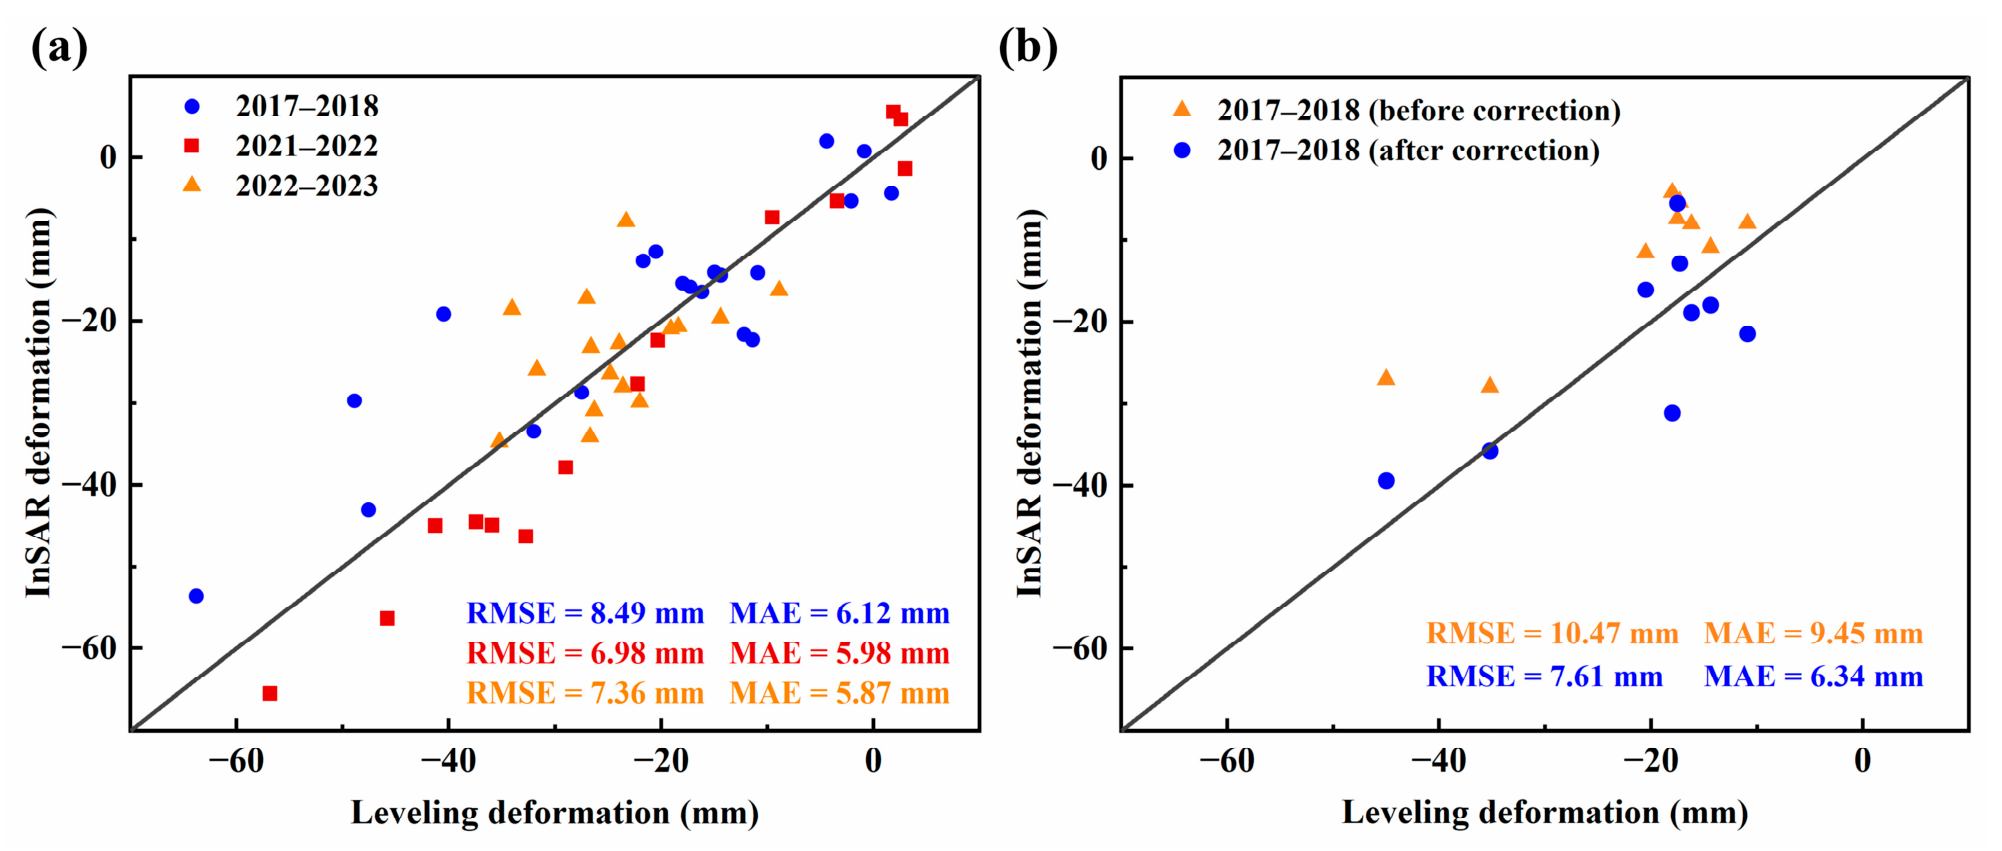
To evaluate the accuracy of the InSAR-derived deformation, the results from Sentinel-1A Path 142 were independently validated using leveling measurements for three periods: 2017–2018, 2021–2022, and 2022–2023. As shown in Figure 3a, most differences between the InSAR and leveling measurements were within ±10 mm. The RMSE values for the three periods were 8.49, 6.98, and 7.36 mm, respectively, while the corresponding MAE values were 6.12, 5.98, and 5.87 mm. These results indicate good agreement between the InSAR-derived deformation and the independent leveling observations and support the use of Path 142 as the regional reference track for inter-track datum unification.
Figure 3.
Accuracy validation of InSAR-derived deformation against leveling measurements: (a) Path 142; (b) Path 69.
Additional leveling observations were available within the coverage of Path 69 and were used to further evaluate the deformation results before and after the inter-track datum adjustment described in Section 3.1. As shown in Figure 3b, the agreement between the Path 69 InSAR deformation and the leveling measurements improved after datum correction. Specifically, the RMSE decreased from 10.47 mm before correction to 7.61 mm after correction, while the MAE decreased from 9.45 mm to 6.34 mm. These reductions indicate that the inter-track datum adjustment improved the agreement between the Path 69 InSAR results and the independent leveling observations. This supplementary validation provides additional ground-based support for the effectiveness of the cross-track datum adjustment and the subsequent multitrack mosaicking procedure.
4.2. Land Deformation Patterns
4.2.1. Spatial Pattern
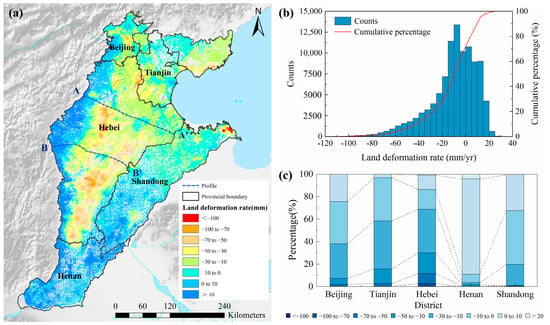
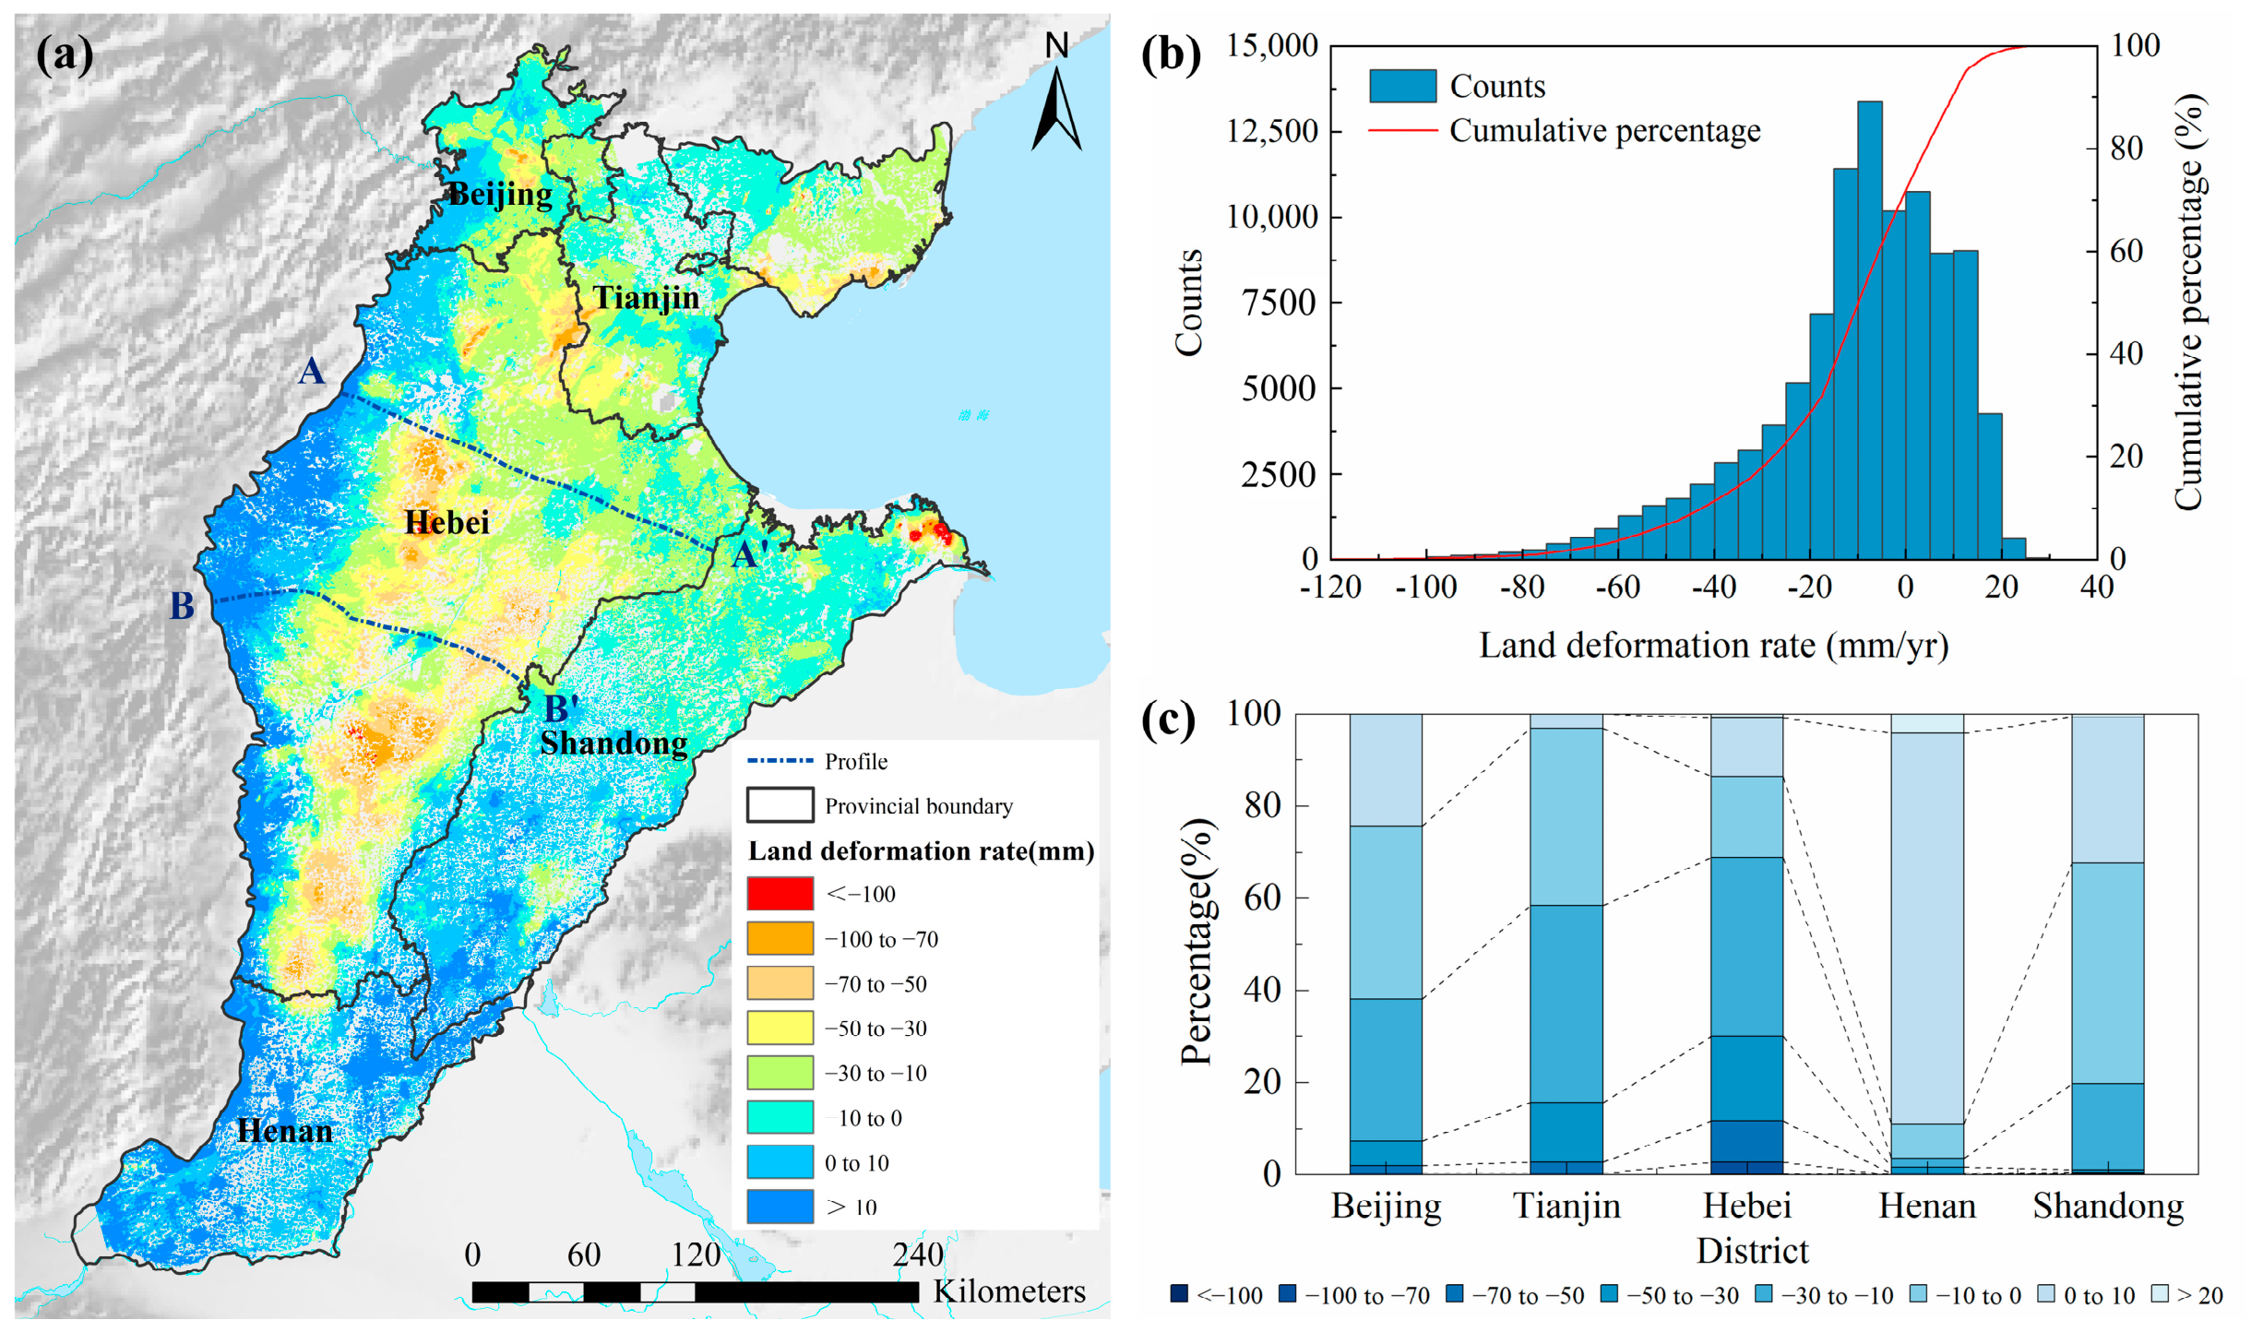
The spatial distribution of land subsidence across the NCP from 2016 to 2023 exhibits pronounced heterogeneity (Figure 4a). The primary subsidence centers (rates < −50 mm/yr) are concentrated in the central and southern regions, including Cangzhou, Hengshui, Xingtai, and Handan, extending northeastward to Dezhou and Dongying. Secondary localized subsidence areas are observed in Tangshan, southern Tianjin, and parts of Beijing. This spatial distribution pattern is consistent with the findings of previous studies [11,12,27,47].
Figure 4.
Spatial distribution and regional statistics of land subsidence (2016–2023). (a) Annual mean deformation velocity map derived from InSAR. (b) Histogram and cumulative percentage curve of deformation rates across entire study area. (c) Provincial-scale stacked bar chart detailing percentage of area within different deformation magnitude classes.
Statistical analyses (Figure 4b,c) further quantify these spatial differences. While the overall histogram (Figure 4b) illustrates the wide distribution of regional subsidence, provincial-scale statistics (Figure 4c) reveal distinct administrative disparities. Hebei province remains the primary subsidence region, dominated by high-magnitude deformation rates. In the northern region, Beijing and Tianjin present different trends. Beijing exhibits broad stabilization, with over 50% of its area recording low-magnitude rates (within ±10 mm/yr), coinciding with intensive groundwater regulation and SNWD water substitution. Tianjin shows intra-municipal contrasts: the central and northern districts are generally stable, whereas the southern periphery continues to subside, forming a spatial transition into the severe subsidence zone of Hebei.
4.2.2. Temporal Pattern
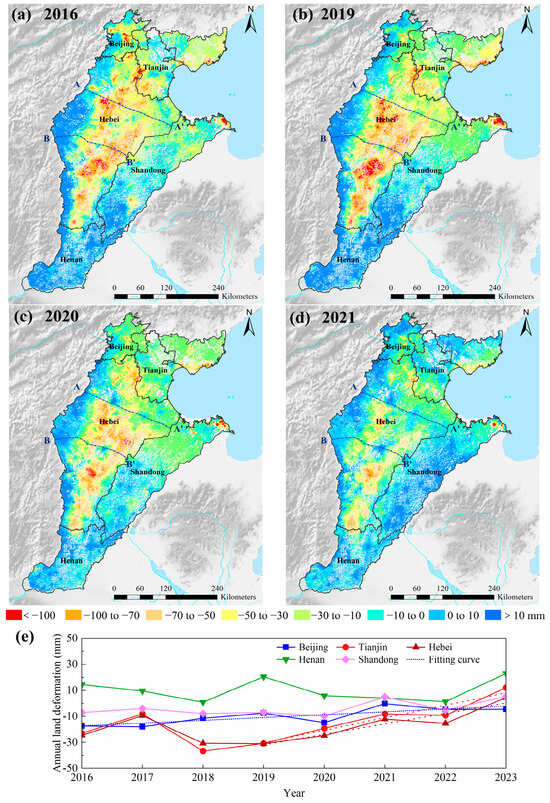
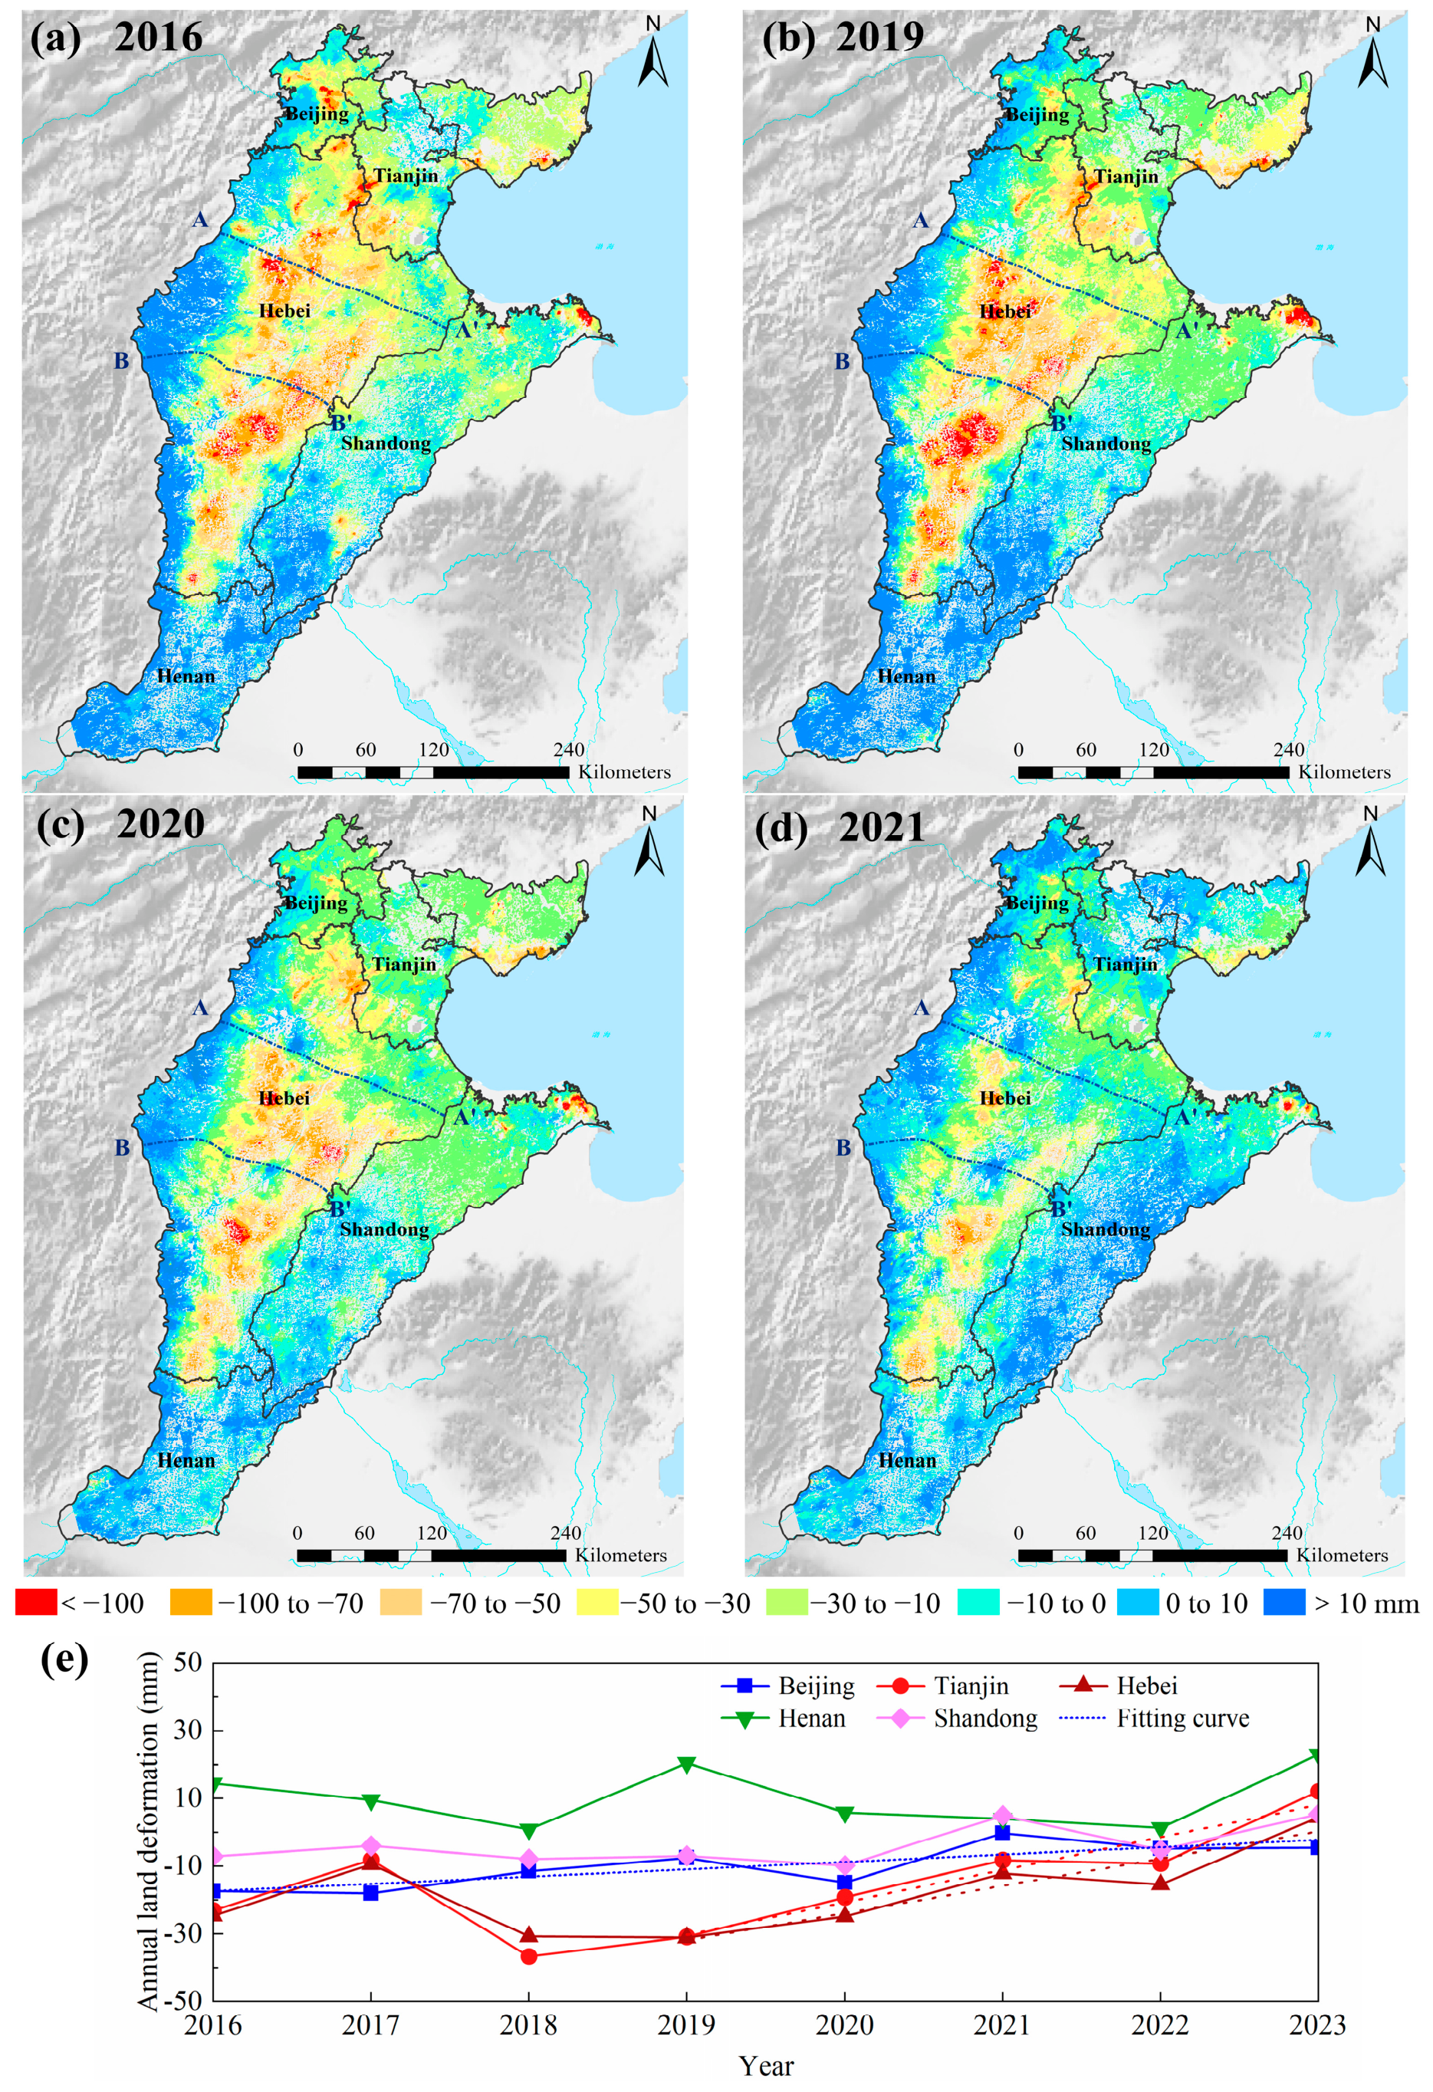
The regional annual deformation varied markedly in space and time across the NCP. To illustrate this progression, planar maps and profiles from selected representative years are presented, capturing the evolutionary stages (Figure 5 and Figure 6).
Figure 5.
Spatiotemporal evolution of land deformation across the NCP (2016–2023). (a–d) Annual land deformation in the representative years 2016, 2019, 2020, and 2021, respectively (unit: mm). (e) Temporal trajectories of the annual mean land deformation across the administrative sub-regions.
Figure 6.
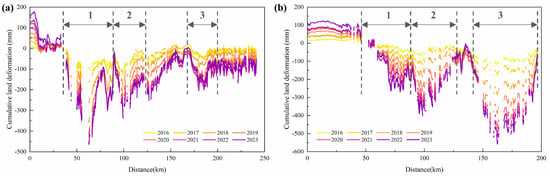
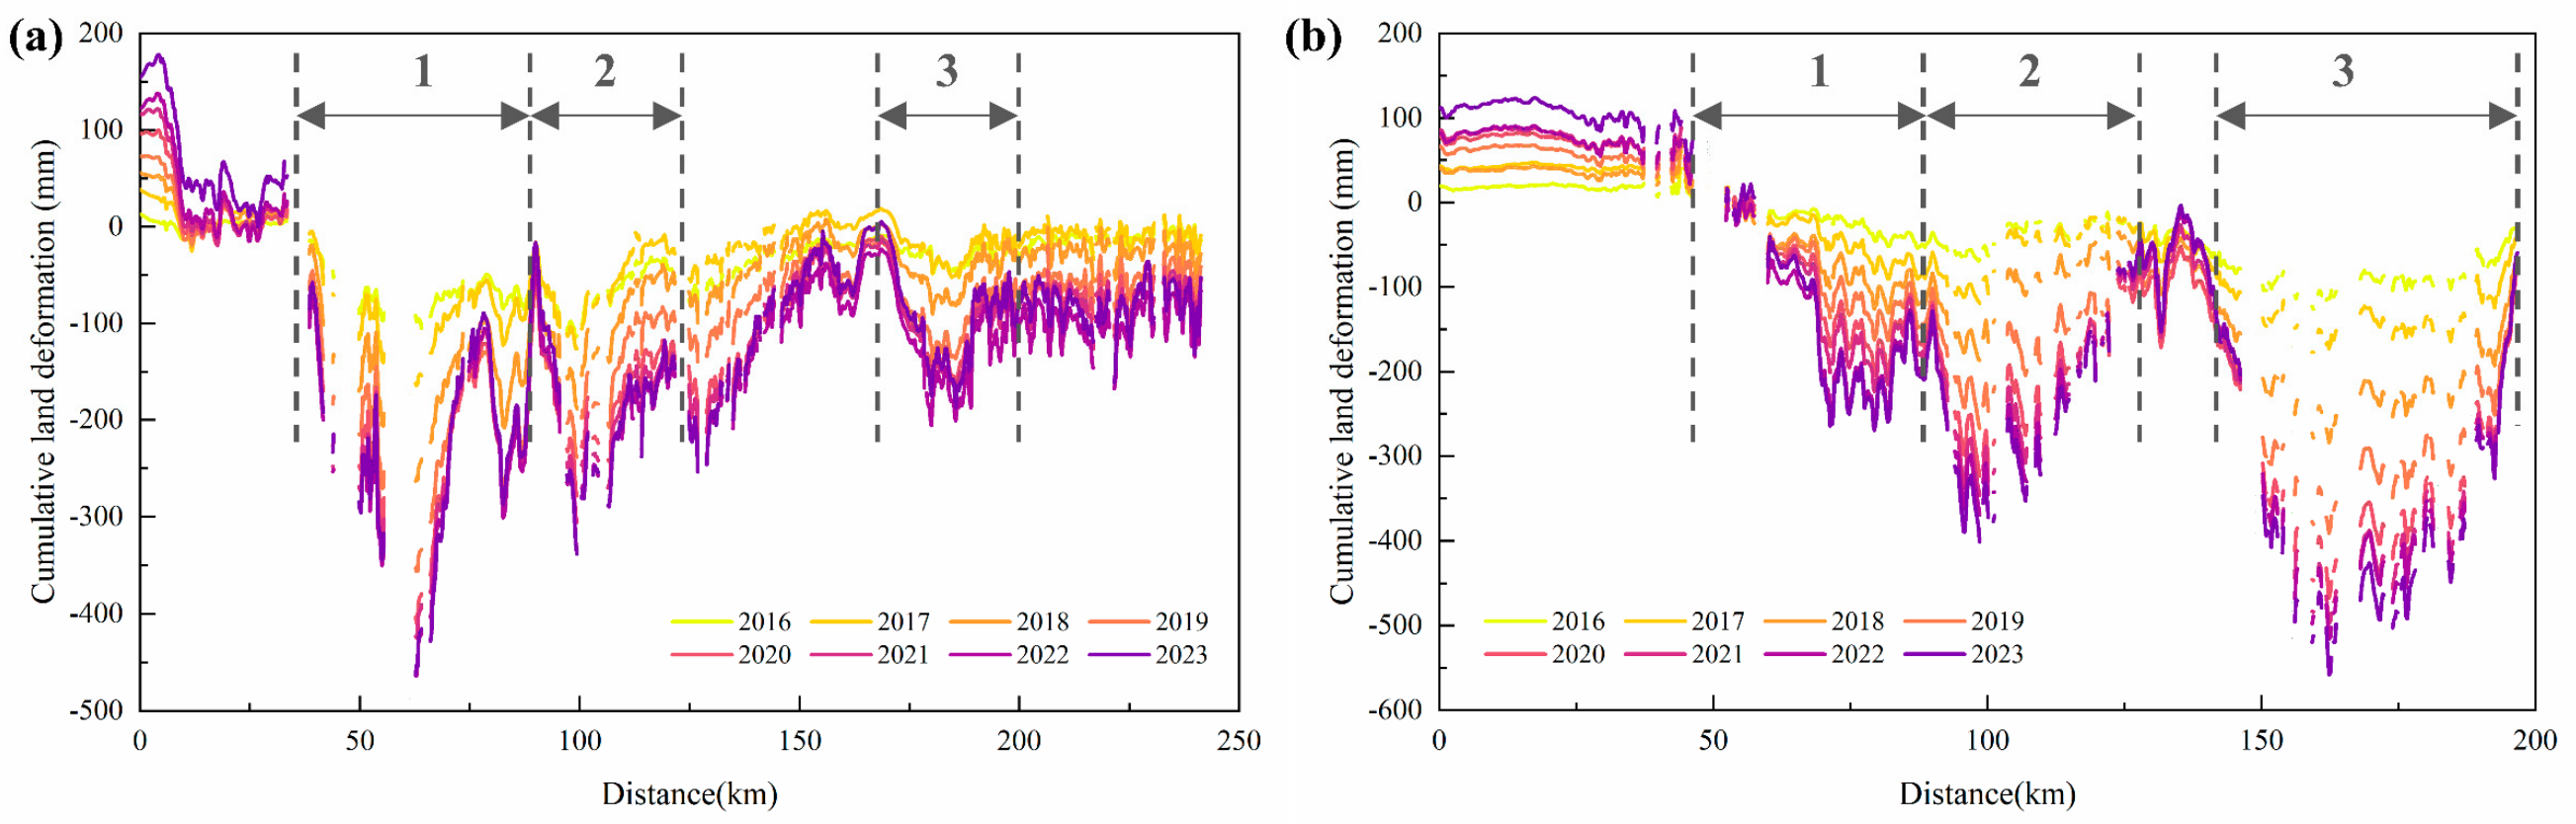
Cumulative land deformation along the typical profiles (2016–2023). (a) Profile A-A’. (b) Profile B-B’. (Note: The numbers 1–3 represent the main subsidence funnels identified along the profiles.)
The annual deformation maps (Figure 5a–d) suggest that the primary deformation cores maintained broadly consistent spatial positions throughout the study period, a pattern quantitatively assessed via centroid tracking and SDE analysis in Section 4.3. Yet, despite this broad structural stability, distinct mitigation patterns emerged at the sub-regional level. Time-series analysis shows that Beijing maintained a continuous, statistically significant decelerating trend throughout the entire 2016–2023 period (Mann–Kendall test, p < 0.05, Figure 5e). Meanwhile, Hebei and Tianjin experienced a fluctuating—but still significant—deceleration from 2019 to 2023 (p < 0.05). This temporal divergence indicates that although the primary subsidence footprint is largely anchored in place, gradual signs of attenuation had begun to emerge across different areas in recent years.
Two NW-SE cumulative deformation profiles (Figure 6) further tracked the spatio-temporal evolution of the subsidence cones. Both profiles indicated that while land subsidence continued to accumulate, the overall spatial morphology and geographical boundaries of the primary cones have remained stable over the observation period.
The annual increments in cumulative deformation reveal a temporal shift in subsidence severity. Along both profiles, the large inter-curve spacing from 2016 to 2020 marks a period of rapid aquifer compaction, with maximum cumulative subsidence approaching −500 mm (Profile A-A’) and −600 mm (Profile B-B’). After 2020, these annual increments narrowed markedly. Although subsidence continued, the rates decelerated substantially, coinciding with groundwater management measures and recent hydro-climatic shifts.
4.3. Annual Centroid Migration and SDE Evolution
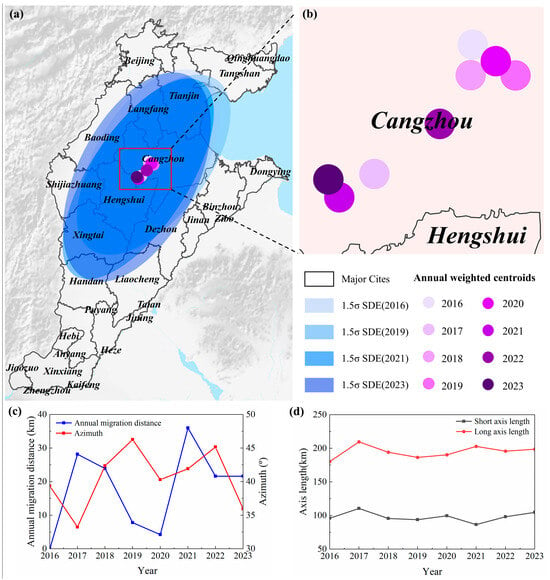
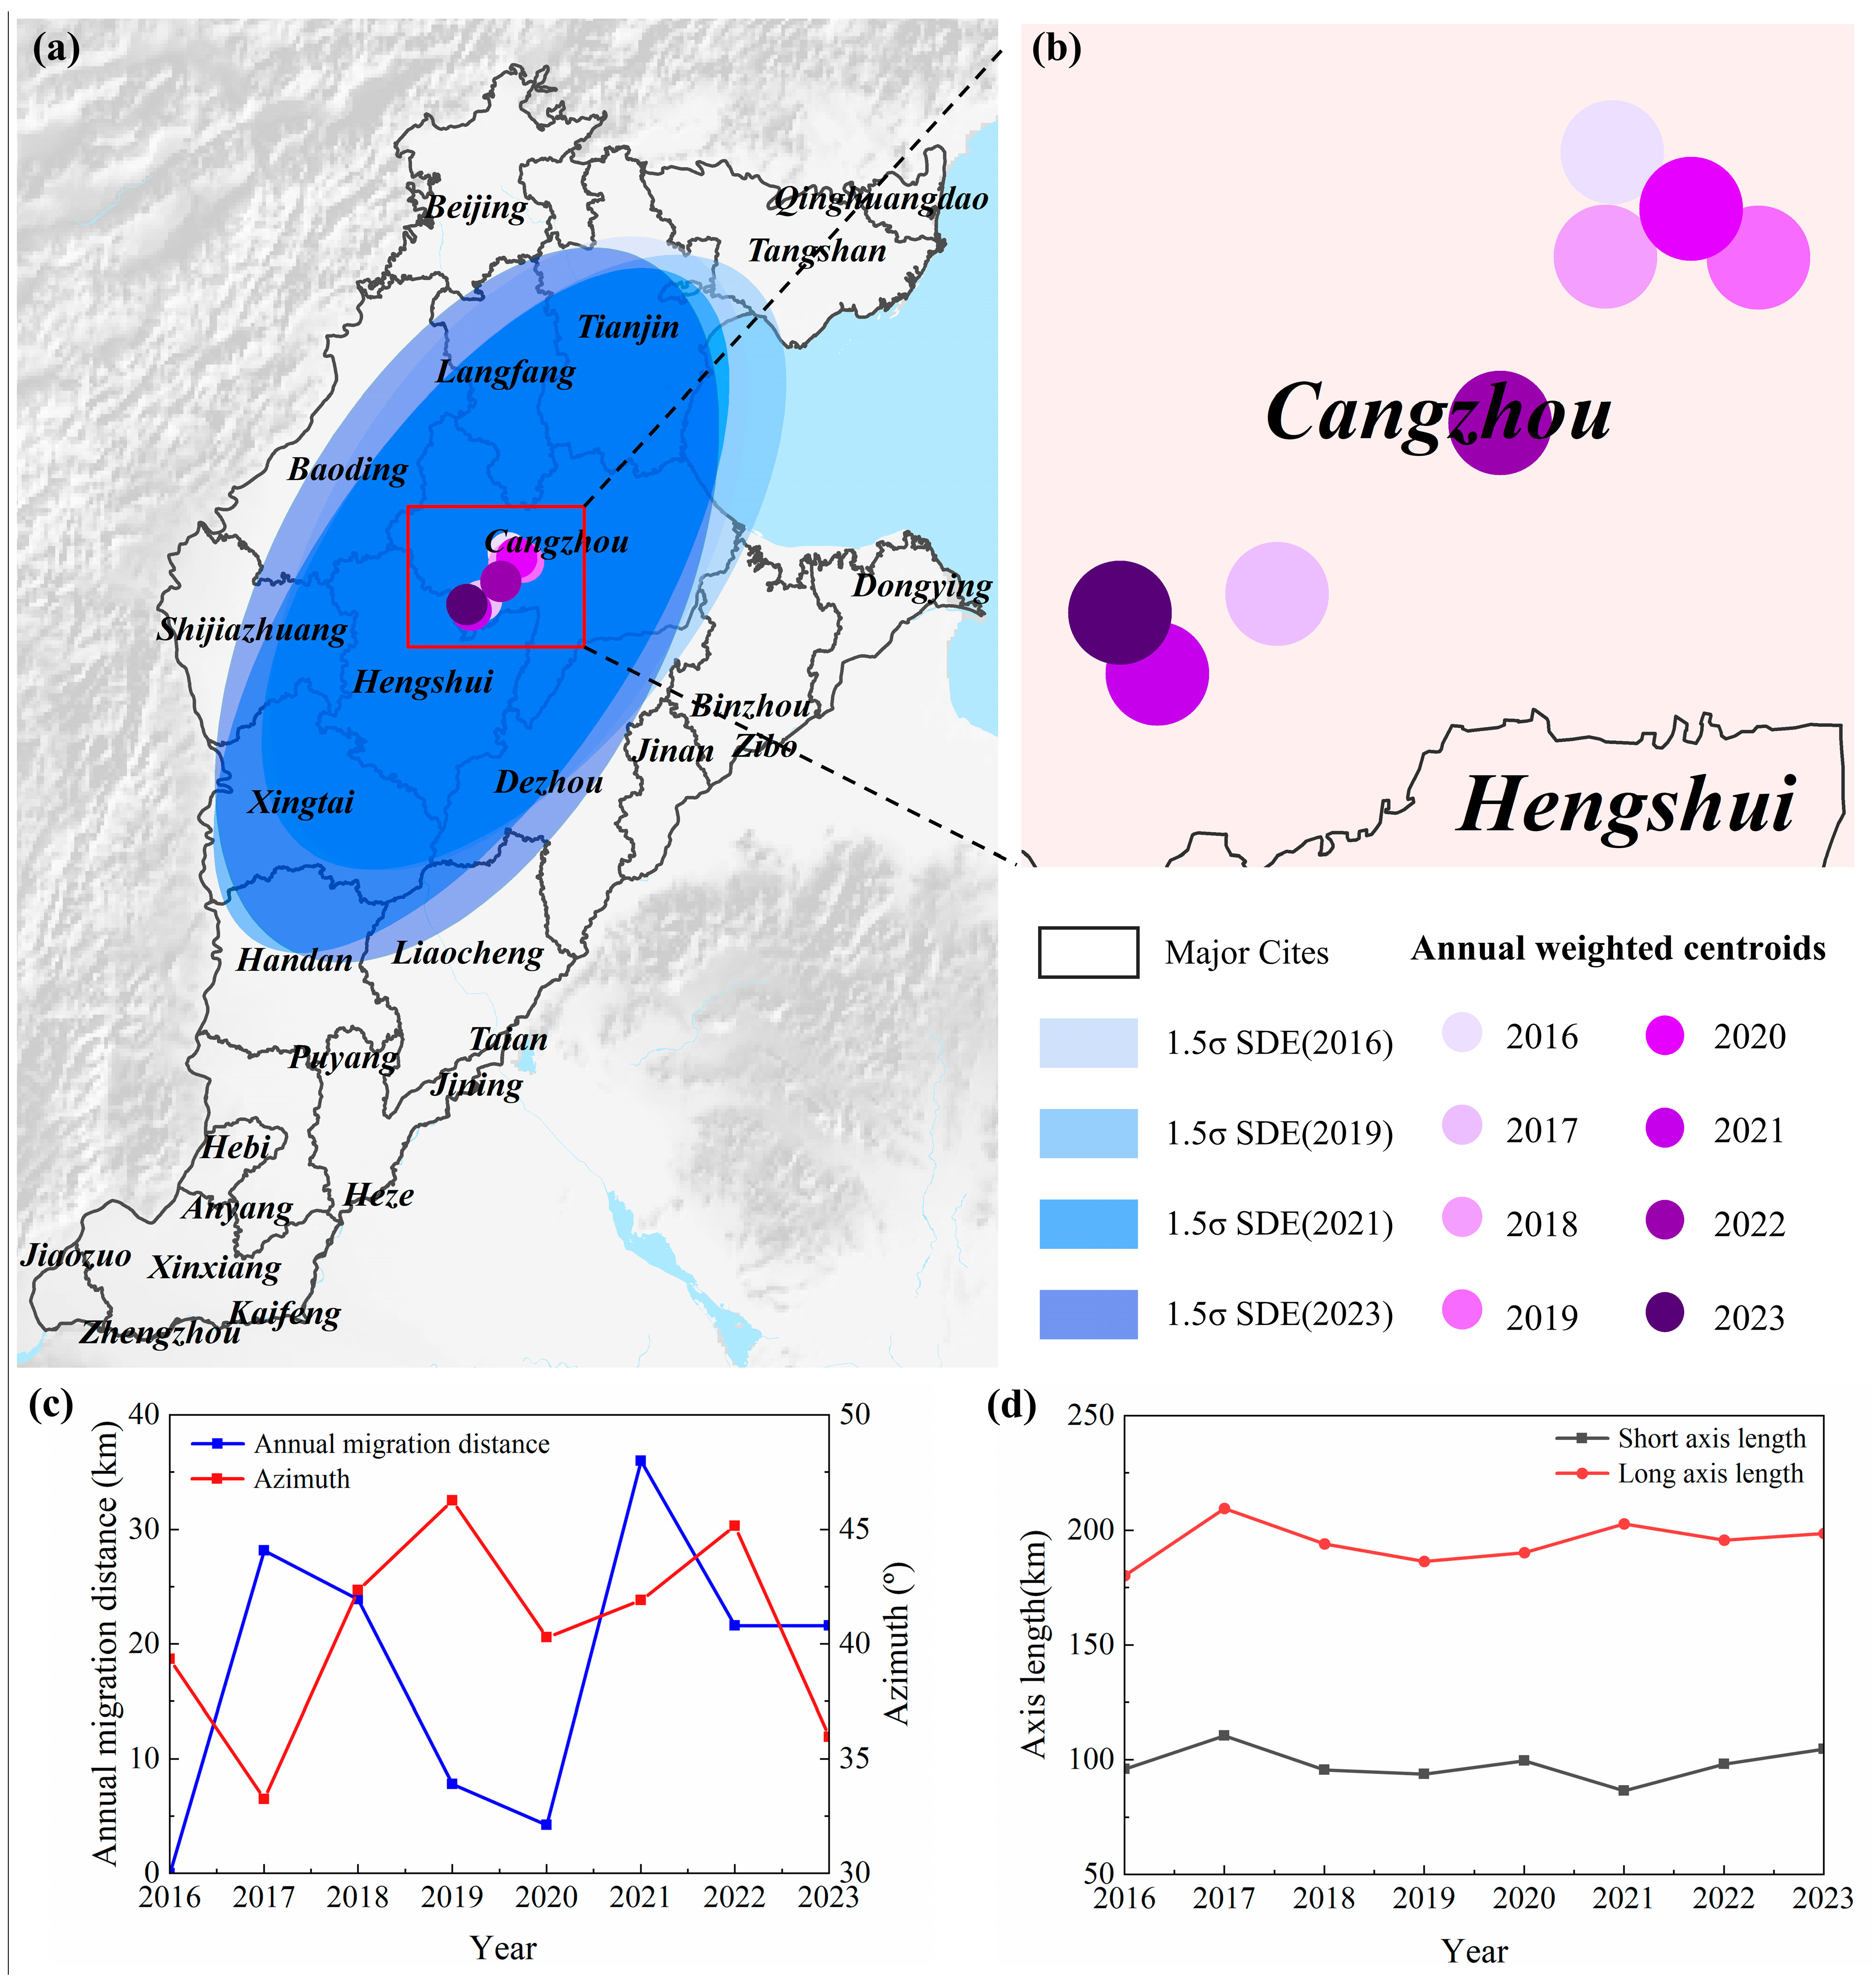
Figure 7 and Table 3 delineate the geometric and directional dynamics of the NCP subsidence field from 2016 to 2023. Overall, these spatial statistics indicate a relatively stable geometric pattern during this period, with the centroid and spatial extent showing limited systematic variations.
Figure 7.
Centroid migration and SDE parameters of land subsidence (2016–2023). (a) Spatial distribution of subsidence centroids and SDEs. (b) Enlarged view of centroid migration trajectory. (c) Temporal variations in annual centroid migration distance and SDE azimuthal angle. (d) Temporal variations in SDE major and minor axes lengths.
Table 3.
Coordinates and evolutionary parameters of subsidence centroid (2016–2023).
The weighted subsidence centroid remained anchored in the Cangzhou–Hengshui border region throughout 2016–2023, with longitude fluctuating between 116.14° and 116.51° and latitude between 38.04° and 38.28° (Table 3). Annual migration distances ranged from 4.23 to 35.98 km, exhibiting inter-annual fluctuations rather than sustained directional drift. This indicates that the primary barycenter of the deformation field remained spatially locked during the observation period.
The SDE parameters further reflect the general stability of the subsidence footprint. Over the study period, both the long axis and the short axis experienced inter-annual fluctuations. Specifically, the long axis length varied between 180.33 km and 209.54 km, while the short axis length fluctuated between 86.50 km and 110.62 km. The absence of a distinct temporal trend in these parameters indicates that the overall spatial extent of the main deformation zones did not experience substantial directional contraction or expansion.
Concurrently, the temporal evolution of the azimuth angle suggests a relatively consistent structural orientation. The azimuth fluctuated between 33.24° and 46.27°, concluding at 35.95° in 2023. These variations do not appear to form a sustained unidirectional rotation trend. The general stability in the principal alignment implies that the regional subsidence field has maintained spatial consistency since 2016. This geometric stability likely reflects the long-term consolidation characteristics of the local stratigraphy and the inherited spatial footprint of historical groundwater depletion.
4.4. Spatiotemporal Evolution of Subsidence Hot Spots and Deformation Trends
4.4.1. Spatial Distribution Characteristics of Land Subsidence Evolution Patterns
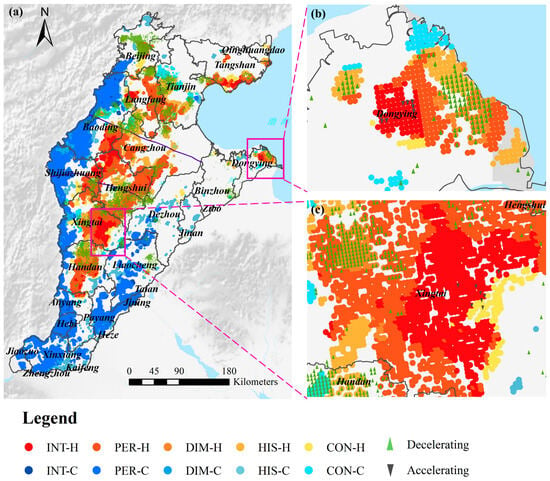
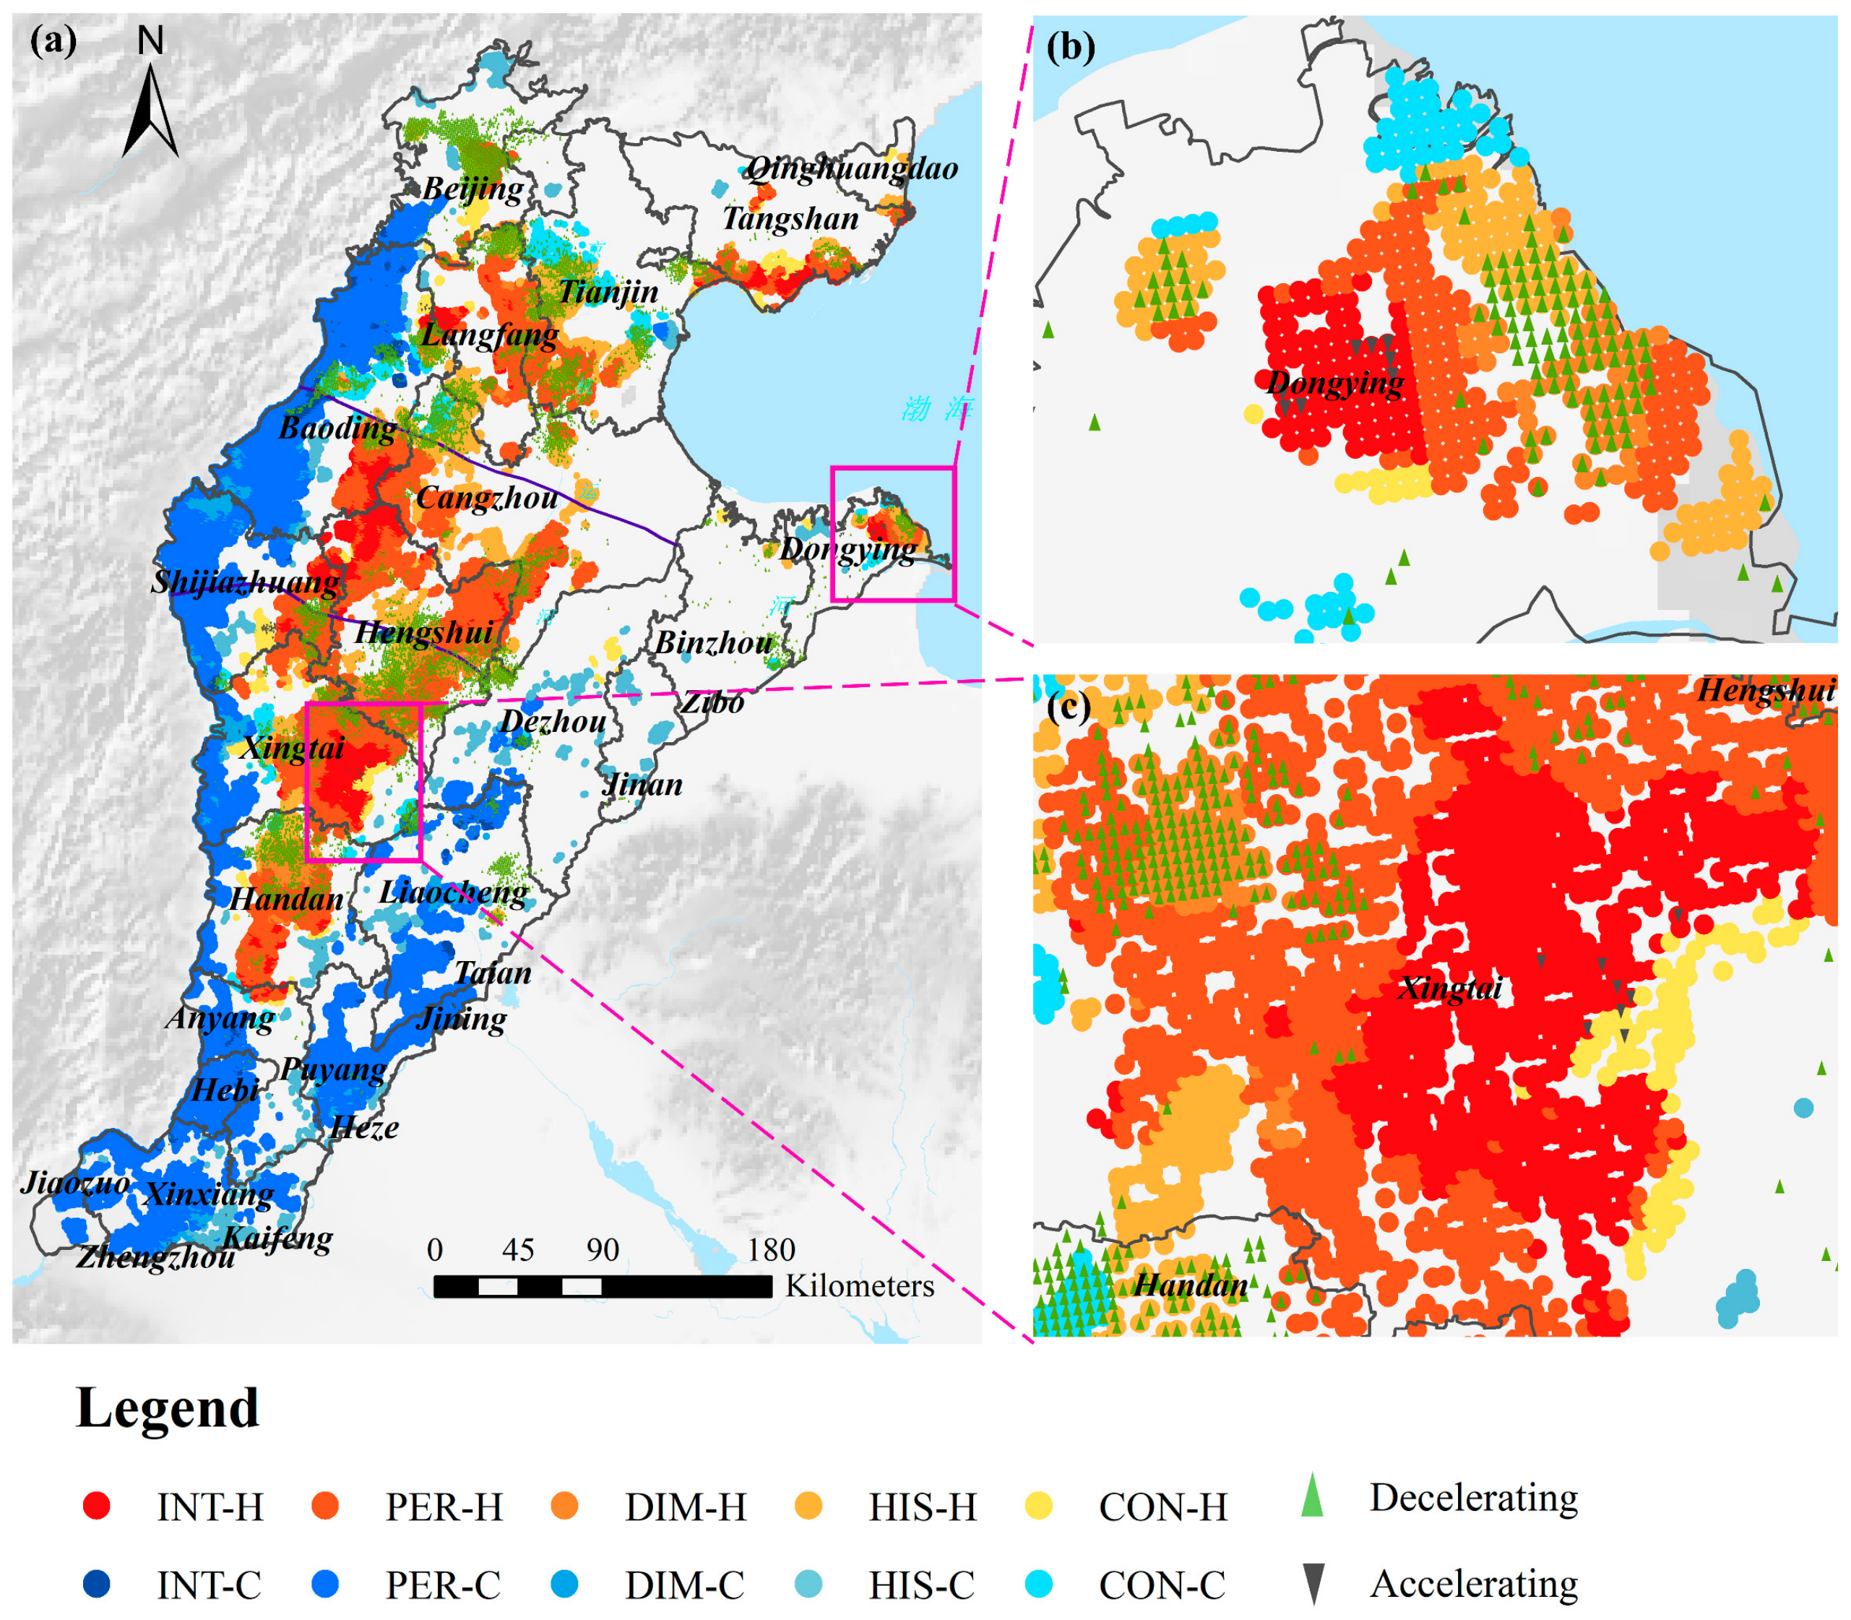
Although the macro-scale centroid remained locked (Section 4.3), the local field underwent restructuring, which we now resolve with EHA. The EHA identified statistically significant clusters across 38.04% of all valid spatial bins (Figure 8a; Table 4), with the remainder showing no distinct trends. Unless otherwise stated, all percentages in this subsection are expressed as a fraction of the statistically significant clustering area (38.04% of valid spatial bins).
Figure 8.
Spatiotemporal evolutionary patterns of land subsidence derived from EHA. (a) Regional distribution of EHA categories. (b,c) Enlarged view of subsidence intensification regions.
Table 4.
Statistical summary of EHA evolutionary modes (2016–2023).
Long-term hot spot patterns (6 consecutive years) accounted for 38.19% of the significant clustering area, comprising PER-H (26.80%), INT-H (6.47%), and DIM-H (4.92%). PER-H represents zones of continuous and stable compaction. INT-H indicates regions where high-subsidence clustering became more pronounced, diverging statistically from the broader regional mitigation trend; these intensifying clusters concentrate along the peripheries of Baoding, Hengshui, eastern Xingtai, and Dongying. DIM-H marks a gradual decay of peripheral subsidence, flanking the core zones.
Regarding recent temporal shifts, Historical Hot Spots (HIS-H, 9.63%) represent areas where significant subsidence clustering largely ceased after 2019, sharing similar spatial distributions with DIM-H. Conversely, Consecutive Hot Spots (CON-H, 1.71%) represent localized compaction signals that emerged after 2020 and warrant future high-resolution ground monitoring. These spatially independent patches developed west of Hengshui, east of Shijiazhuang, and peripherally to the intensifying hot spots.
Cold Spots (50.47%) represent locations where subsidence rates are statistically lower than their surroundings. As relative spatial metrics, their physical interpretation varies by context. In the western piedmont and southern regions, where observed deformation rates approach zero or become slightly positive, these cold spots correspond to ground stabilization or rebound. However, in transitional zones adjacent to active subsidence centers, they merely highlight areas subsiding slower than the adjacent high-hazard clusters, rather than indicating absolute stability. Among the cold spot subcategories, Historical (HIS-C, 4.21%) and Diminishing (DIM-C, 2.32%) Cold Spots point to a waning stabilization trend, where the rebound decelerated post-2019. In contrast, Intensifying (INT-C, 1.42%) and Consecutive (CON-C, 3.46%) Cold Spots signify strengthening recovery and relative uplift, dominating northern Beijing, urban Baoding, and Henan Province.
A threshold sensitivity analysis (Text S1, Tables S1–S4 and Figure S1) shows that the regional spatial pattern and the proportions of the long-term classes (e.g., PER-H, 25.68/26.80/24.39% at 5/6/7 significant years) are robust to the long-term criterion, with 97.65% of the bins significant under the adopted 6-year scheme retaining their classification at 5 years. The extent of the historical class is, by construction, more sensitive to N (combined DIM-H+HIS-H = 23.01/14.55/7.08% at N = 2/3/4); the deformation record (Table S4) supports N = 3, for which the added HIS-H bins decelerate from −41.49 to −6.88 mm/yr across 2019 (an 83% reduction), i.e., genuine termination, whereas N = 2 admits locations without an established or terminated cluster.
4.4.2. Quantitative Differentiation of Subsidence Trends Across Evolution Patterns
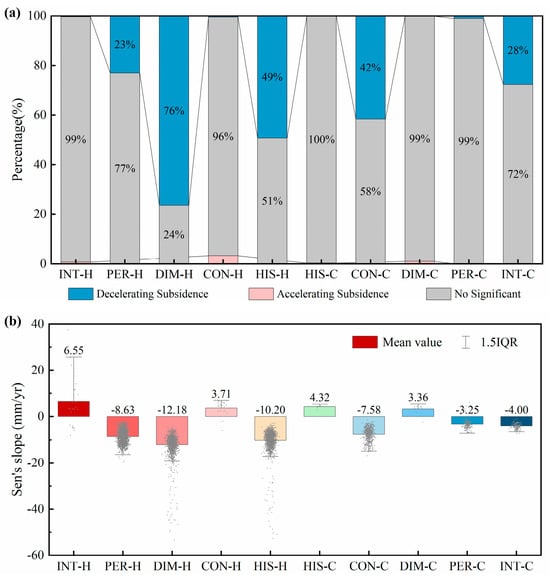
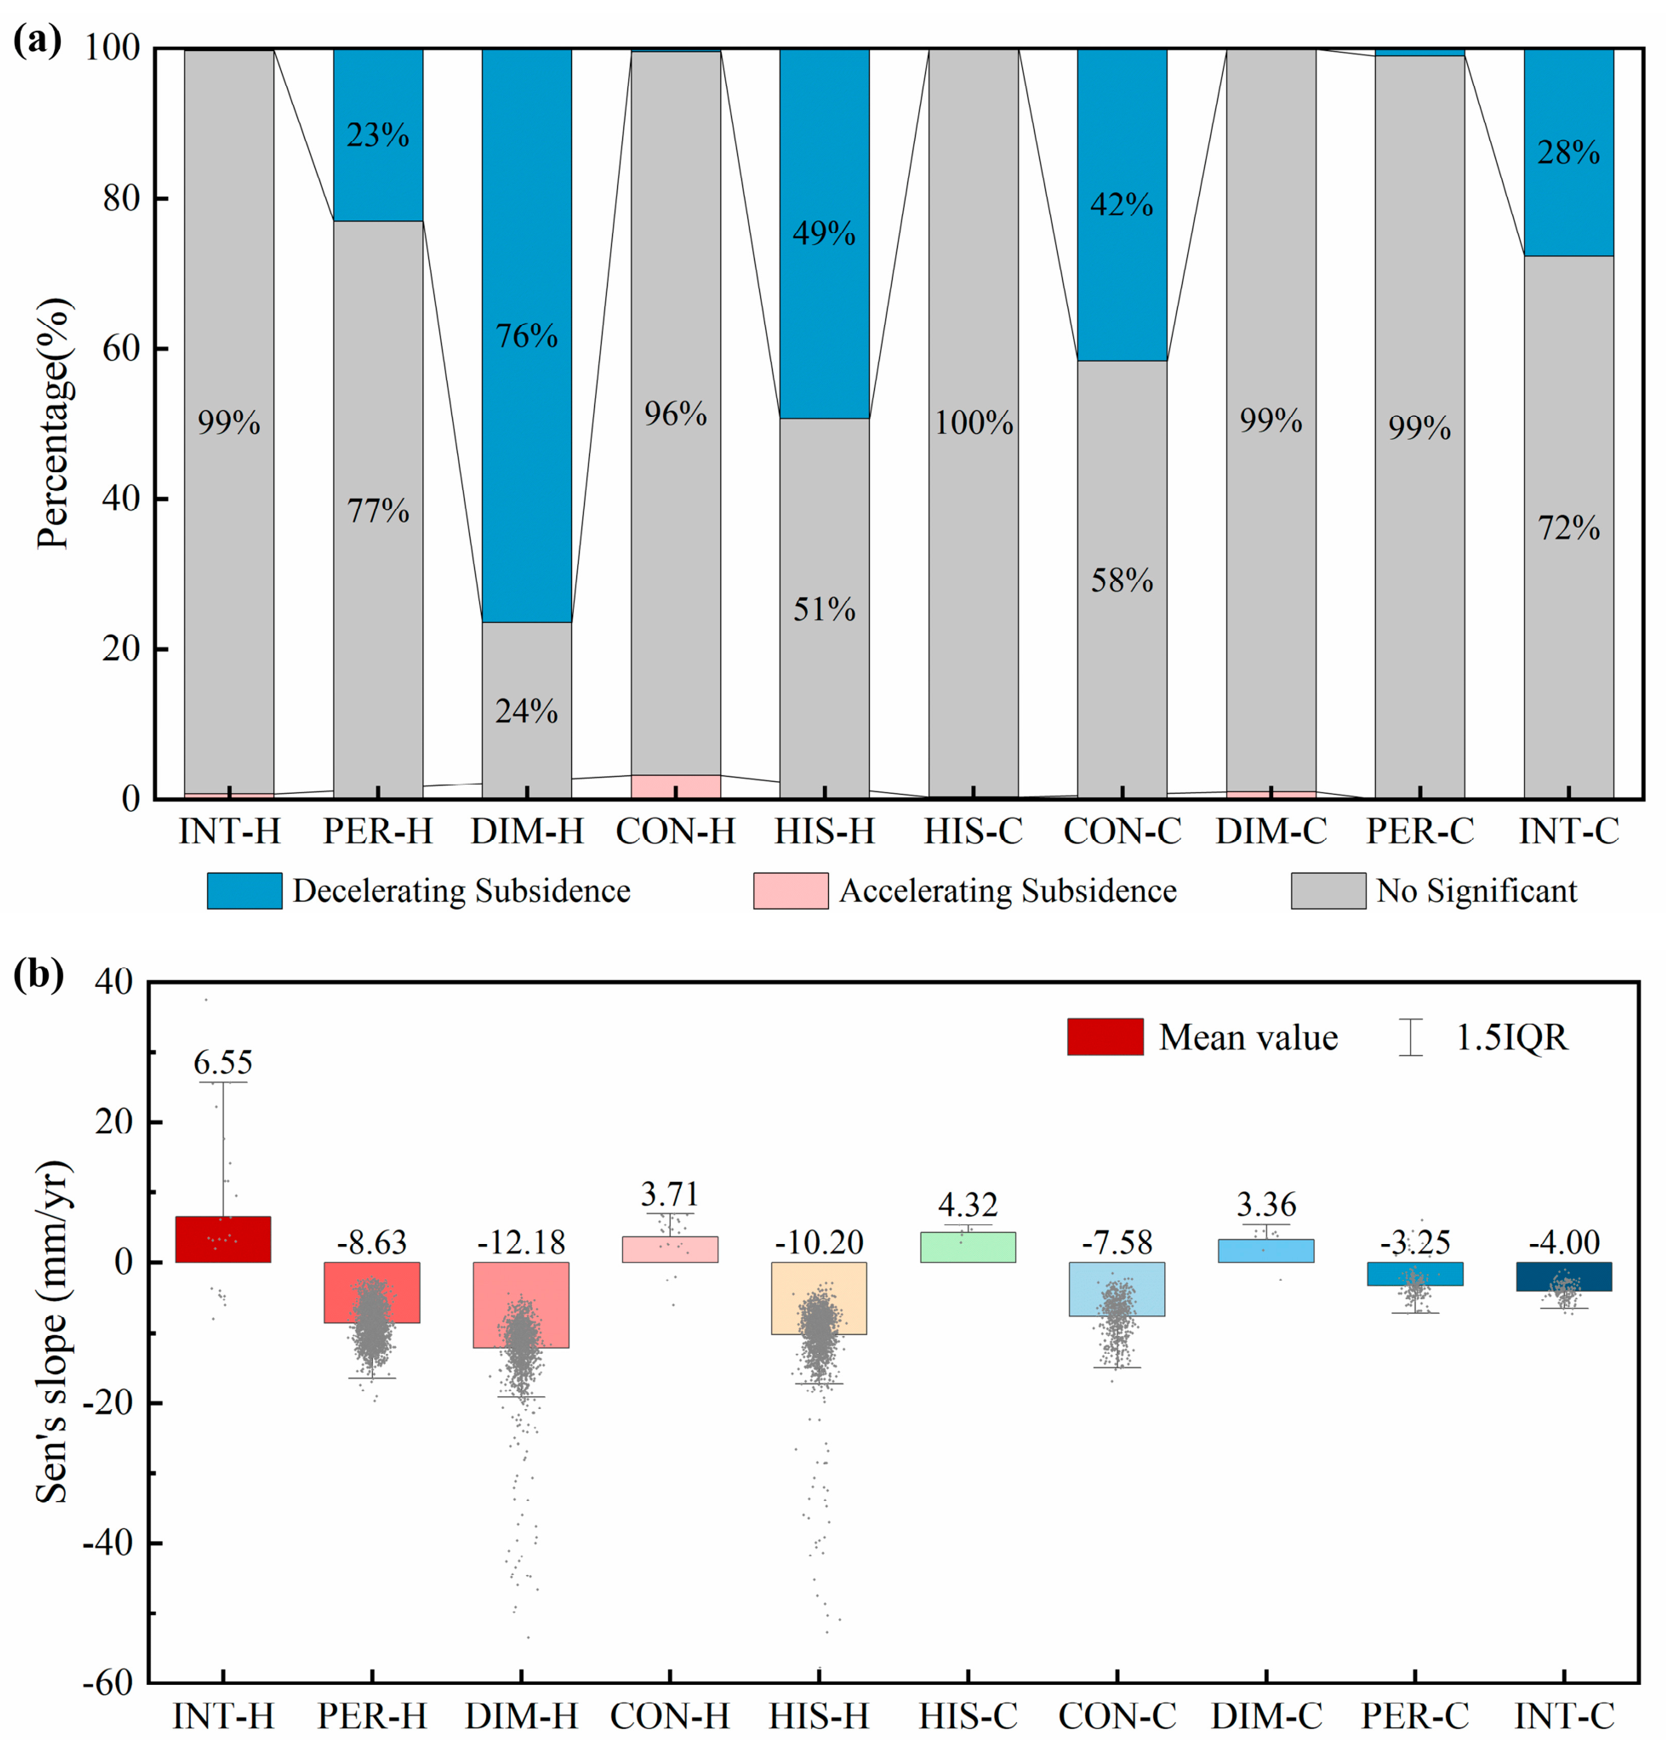
To quantify the evolutionary trends within the EHA boundaries, we calculated the Mann–Kendall (M-K) significance (Figure 9a) and Sen’s slopes (Figure 9b). Note that the M-K test here is applied to the annual subsidence magnitude series at each spatial bin, quantifying whether the physical deformation rate is accelerating or decelerating. These statistical metrics define three distinct kinematic states across the region:
Figure 9.
Quantitative statistics of subsidence dynamics within EHA patterns. (a) Proportions of M-K trend significance. (b) Trend of annual deformation quantified by Sen’s slope.
Unless otherwise stated, the percentages in this subsection denote the proportion of spatial bins within each EHA pattern, and each mean Sen’s slope is averaged over the bins of that pattern; these proportions are therefore relative to the pattern’s own bins rather than to the total significant clustering area.
Persistent Baseline and Localized Intensification. The PER-C zone was predominantly non-significant (99%) in the M-K trend test, with a mean Sen’s slope of −3.25 mm/yr, indicating a stable deformation rate without significant acceleration or deceleration. Similarly, PER-H exhibited a largely steady regime (77% non-significant) alongside a decelerating proportion (23%), yielding a mean slope of −8.63 mm/yr. In contrast, while INT-H also showed 99% non-significant spatial bins, its remaining 1% of significant spatial bins exhibited exclusive acceleration, recording the highest positive mean slope in the study area (6.55 mm/yr).
Subsidence Deceleration. Widespread decelerating trends dominated the diminishing and historical hot spots. DIM-H and HIS-H recorded substantial mitigation, with 76% and 49% of their spatial bins showing significant deceleration. These zones corresponded to mean slopes of −12.18 and −10.20 mm/yr, respectively. Significant deceleration was also observed in the cold spots, with CON-C (42% decelerating, slope −7.58 mm/yr) and INT-C (28% decelerating, slope −4.00 mm/yr) demonstrating clear trend mitigation.
Localized Acceleration and Stable Anomalies. Warranting close attention as a potential zone of renewed subsidence, CON-H contained 4% significantly accelerating spatial bins, with a mean acceleration of 3.71 mm/yr. Meanwhile, DIM-C (99% non-significant) and HIS-C (100% non-significant) exhibited a predominantly stable state, despite slightly positive mean Sen’s slopes (3.36 and 4.32 mm/yr, respectively).
5. Discussion
5.1. Spatiotemporal Association Between Subsidence Evolution and Groundwater Regimes
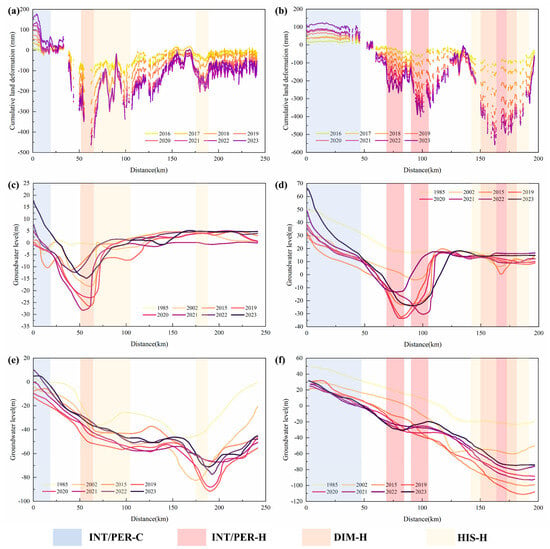
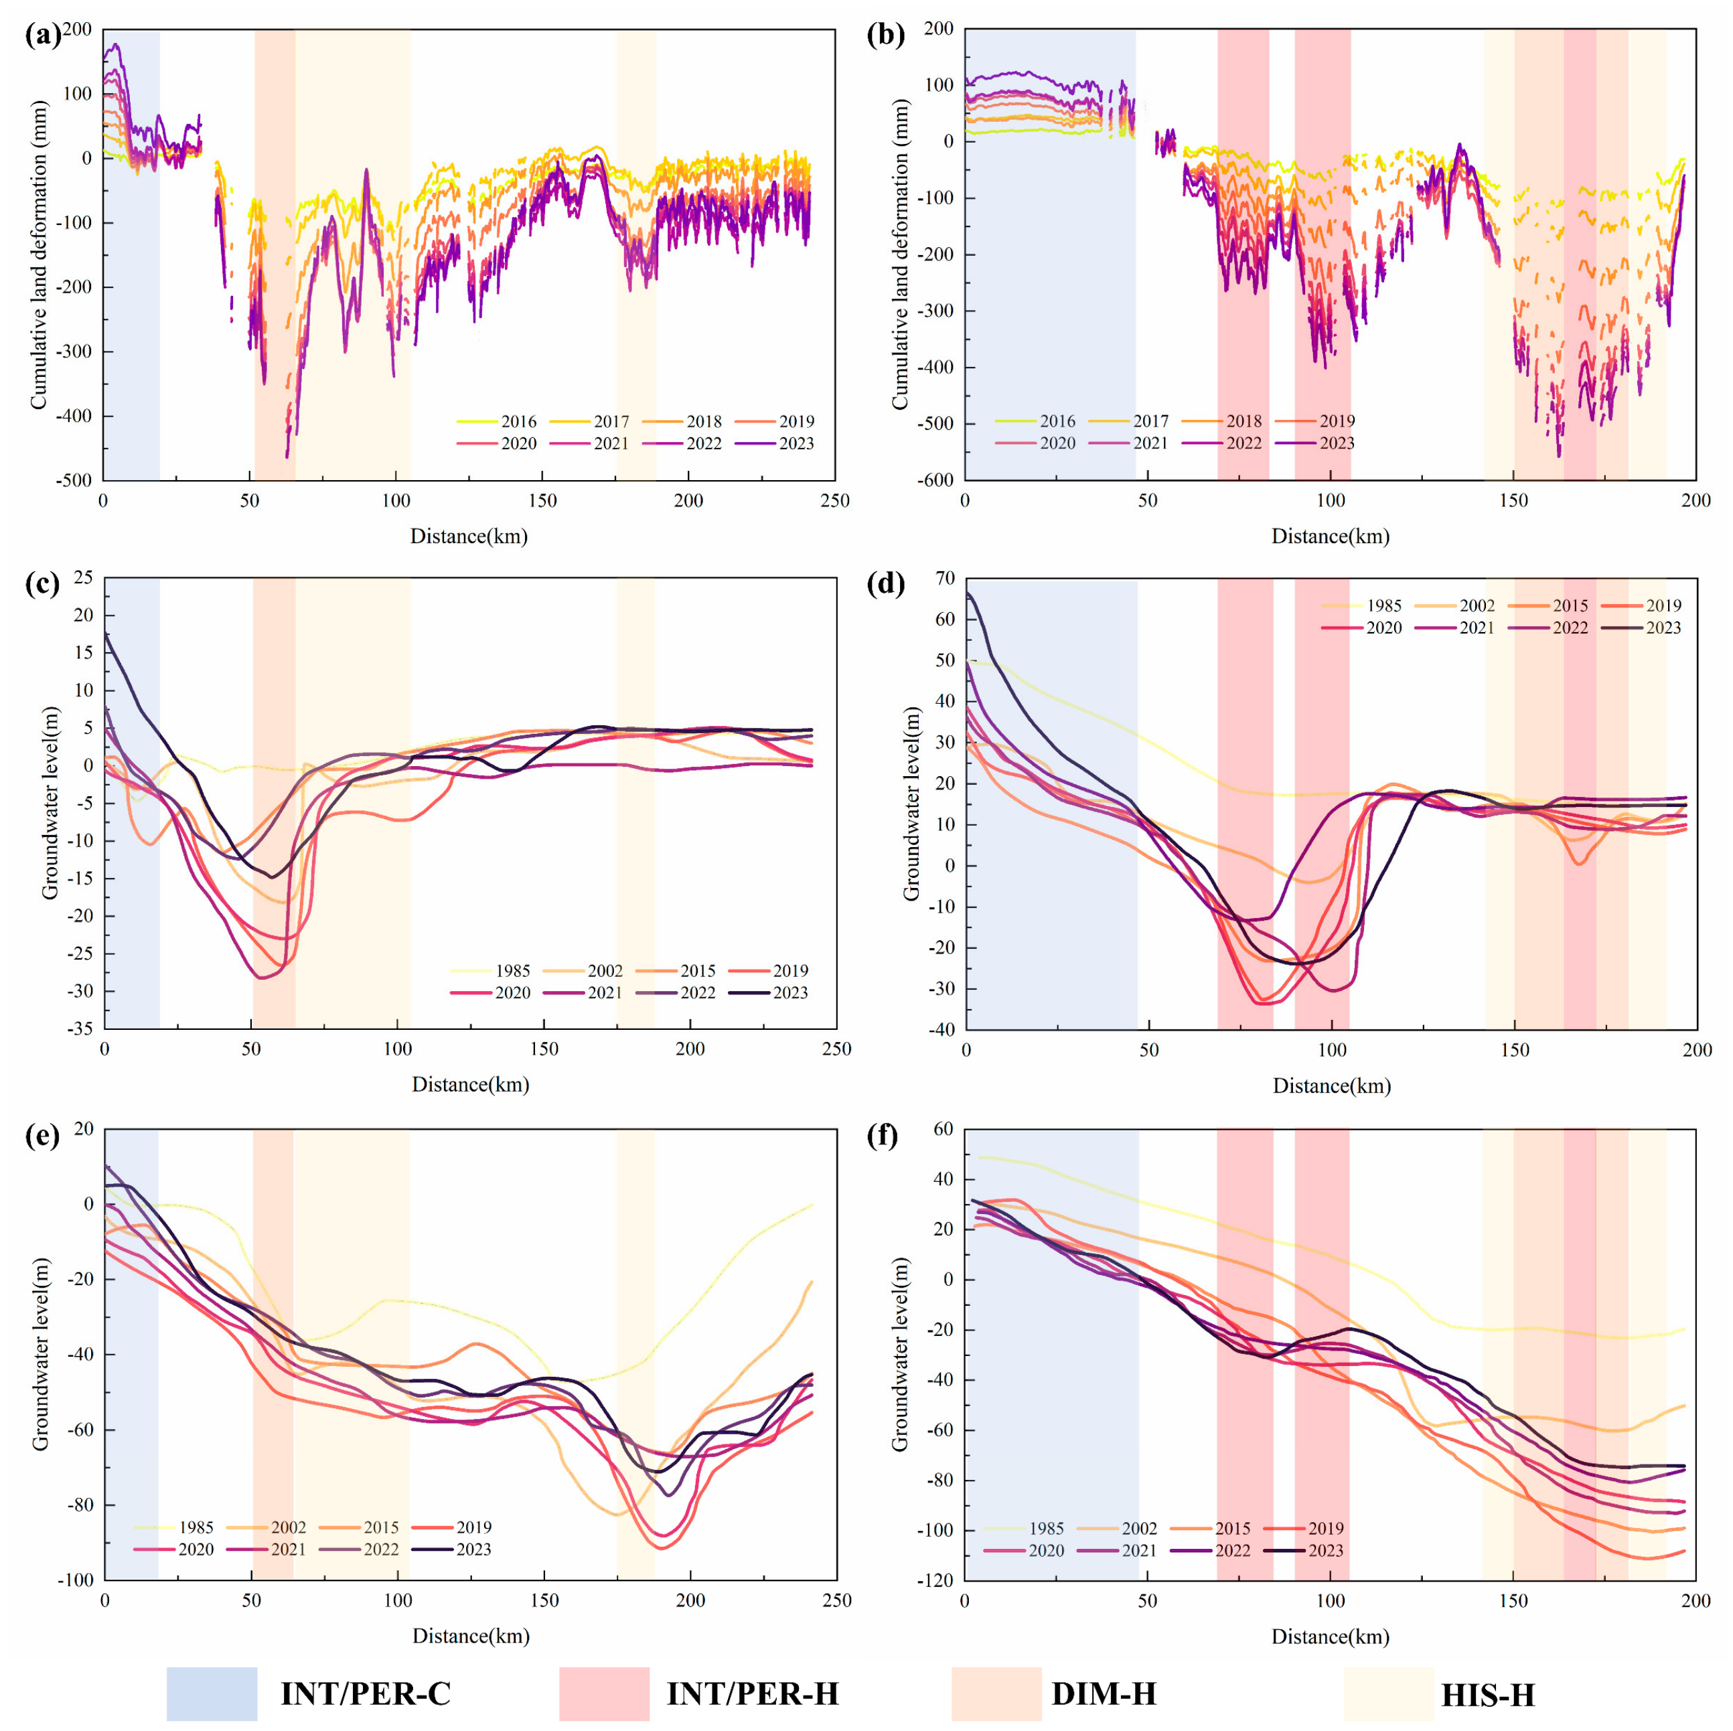
Groundwater level and land deformation are associated in space and time. Regional records show that following long-term decline, deep groundwater levels along both profiles reached their historic lows around 2019–2020, while the shallow levels exhibited a fluctuating recovery over a broader 2019–2021 window, before both entered a recovery phase. The timing supports our selection of 2019 as the critical reference year for the EHA. We examined the association along two cross-sections: Profile A-A’ (Baoding–Renqiu–Cangxian; Figure 10a,c,e) and Profile B-B’ (Shijiazhuang–Xinji–Hengshui; Figure 10b,d,f).
Figure 10.
Spatial comparison between land deformation and groundwater levels along typical profiles. (a,b) Land deformation, (c,d) shallow groundwater levels, and (e,f) deep groundwater levels along Profiles A and B, respectively.
For each EHA pattern, we correlated the net head recovery (ΔH) against the 2020–2023 annual subsidence rate across its 1 km bins. The shallow and deep aquifers were overdrafted to different degrees, so each pattern was paired with the aquifer of the overdraft domain it falls in. Shallow-overdraft patches were compared with the shallow head and deep-overdraft patches with the deep head (Figure 1b; Table S5), rather than with a single undifferentiated water table. We present the results by outcome. We first describe the zones where recovery has been sufficient and subsidence has stopped, and then the thick-clay cores where subsidence continues despite recovery.
Where recovery is sufficient, subsidence has stopped. In the western piedmont (0–20 km along A-A’ and 0–50 km along B-B’), both the deep and shallow levels rebounded and reached their highest observed values by 2022–2023 (Figure 10c–f). The surface uplifted accordingly, coinciding with the INT/PER-C areas in the shallow-overdraft reach (r = 0.92 on Profile A, r = 0.39 on Profile B). This recovery is partly attributed to the SNWD Middle Route replacing groundwater abstraction and to river-lake replenishment along the conveyance corridors. The stabilization appears in the terminated HIS-H zones of the deep-overdraft reach. On Profile A, the deep level recovered by about 15 m and subsidence essentially ceased (−5.6 mm/yr). Here recovery and the near-zero residual rate vary together, giving a positive within-pattern correlation (r = 0.45). On Profile B, the outer HIS-H margins had recovered by about 27 m and fully halted (−0.2 mm/yr), and the within-pattern correlation is negative (r = −0.85). This negative sign does not indicate ongoing subsidence. The residual rate is near zero across the whole margin while the recovery still varies in space, so the sign reflects completed stabilization rather than an active coupling between head and subsidence.
In the thick-clay cores, by contrast, subsidence continues despite the recovery, which we interpret as the signature of a response lag. On Profile B, the deep-overdraft INT/PER-H areas recovered by about 30 m yet still subside at 30 to 37 mm/yr (r = −0.57). On Profile A, the shallow-overdraft DIM-H and HIS-H patterns are likewise still mitigating slowly (r = −0.62 and r = −0.65, respectively). In these cases, the negative sign has a different origin. The sub-regions with the largest rebound tend to coincide with the centers of the historical depression cones, where the thickest compressible clays are likely to sustain the strongest compaction inertia, so that their subsidence lags farthest behind the recovery. One exception is the deep-overdraft DIM-H pattern of Profile B, which shows no significant correlation (r = −0.06) because its bins are internally uniform in both recovery and rate. Mitigation stays synchronized with recovery only where the inertia is weak. The shallow-overdraft INT/PER-H area of Profile B recovered by only about 6 m yet decelerated in step (r = 0.43), which may reflect thinner or less compressible aquitards there.
Mechanistically, pore water pressure transmission within these low-permeability aquitards involves a substantial time lag, typically years to decades depending on thickness and hydraulic diffusivity [48,49,50], so residual stresses from historical overexploitation are inferred to continue driving inelastic compaction. As indicated by the SDE analysis (Figure 7), the macro-scale extent of the subsidence field has not systematically contracted; the coexistence of local mitigation and a stable regional footprint is likely governed by this compaction inertia in the central and eastern cores. The physical implications of these zones for aquifer state and management are examined next.
5.2. Physical Implications of Land Deformation Evolution Zones
Although the overall regional subsidence field remains relatively stable, local evolutionary trajectories vary considerably. The EHA hot spot types not only classify land deformation trends but also indirectly reflect the underlying compaction states of aquifers driven by human activities and natural fluctuations. Analyzing the physical implications of these zones provides a basis for assessing regional groundwater management.
The central and eastern thick clay regions, such as Cangzhou and Hengshui, are mainly characterized by INT-H and PER-H areas. INT-H areas do not imply that absolute subsidence is increasing. Rather, they indicate that the statistical contrast between these high-subsidence areas and their neighborhood is intensifying over time. This can arise from continued local compaction or from faster deceleration in the surrounding areas. Within the PER-H areas, although they maintain a high subsidence baseline, our spatial statistics reveal that 23% of the PER-H areas are already experiencing subsidence mitigation. This suggests that as hydrodynamic conditions continue to improve, some areas are entering the early stages of decelerated compaction. This gradual response is consistent with observations in Tianjin, where subsidence stabilized only after groundwater levels recovered above the pre-consolidation head [51]. Mechanistically, the aquitards in these regions are likely still undergoing largely irreversible virgin consolidation, a process wherein effective stress exceeds the pre-consolidation pressure and induces irreversible skeletal compression [48,52]. Due to the extremely low permeability of thick clays, pore water drains very slowly. Recent geodetic inversion across the NCP indicates that inelastic compaction dominates total aquifer storage loss in the central plain [53]. Consequently, even though deep groundwater levels have rebounded in recent years driven by the SNWD Project and strict pumping restrictions, internal formation compaction persists. This geologically driven lag effect suggests that in areas with thick aquitards, water level recoveries cannot immediately reverse subsidence trends in the short term.
DIM-H and HIS-H areas are widely distributed around the periphery of the core subsidence cones and in some historically severe areas. Supported by the narrowing intervals observed in the aforementioned deformation profiles, the widespread appearance of DIM-H indicates a weakening in subsidence clustering and a slowing aquifer compaction rate. This shift is consistent with recently improved hydrodynamic conditions. However, the drivers behind this water level recovery and subsidence mitigation are multifaceted. The NCP has experienced multiple wet years recently, coinciding with the continuous implementation of comprehensive groundwater overexploitation controls. Although the weakening of these hot spots reflects an overall environmental improvement, spatial statistics alone cannot reliably disentangle the specific contributions of natural precipitation recharge and human policies.
Furthermore, the EHA identified local anomalies where evolutionary trends deviate from the overall regional mitigation pattern. Examples include newly emerging CON-H zones and DIM-C areas showing weakened stability or rebound. We propose several possible explanations for these anomalies: First, following strict controls on deep groundwater abstraction, pumping demand may have migrated spatially or shifted to alternative aquifer layers, potentially triggering localized compaction in previously unaffected areas (CON-H). This hypothesis requires verification through pumping records and hydrogeological surveys, and minor contributions from unmitigated local phase artifacts cannot be ruled out at this proportion. Second, the minor proportion of accelerating spatial bins within DIM-C (1%) is too small to support mechanistic interpretation and likely reflects statistical noise or relative effects from adjacent rapid rebound. Finally, heterogeneous geological conditions can lead to varying response rates to natural precipitation. These localized anomalies warrant continuous attention in future regional monitoring.
Overall, regional subsidence evolution exhibits spatial heterogeneity, indicating that aquifer responses to precipitation and pumping restrictions vary by location. Future research must incorporate quantitative evaluation methods that account for spatial differences to more objectively disentangle the relative contributions of natural factors and human pumping activities.
5.3. Uncertainties and Research Limitations
While the spatial diagnostic framework established in this study reveals the spatiotemporal evolution of regional land subsidence, certain limitations remain. These primarily stem from inherent observational constraints and data availability.
First, InSAR measurements carry inherent uncertainties. Vegetation and residual tropospheric delays can introduce decorrelation and phase artifacts [54], and independent leveling validation was available only for Paths 142 and 69, so the absolute accuracy of Path 40 relies on its cross-track adjustment to Path 142 (Section 3.1). Because InSAR records the integrated displacement of the whole stratigraphic column, the signal also contains non-groundwater contributions such as soil-moisture and thermal effects. The macroscopic patterns and magnitudes of compaction are therefore robust, whereas subtle micro-deformations are less well constrained.
Second, a scale and support mismatch persists between the groundwater and InSAR observations. The groundwater profiles are sampled from interpolated potentiometric surfaces rather than discrete wells, which introduces spatial smoothing and limits a direct pixel-by-pixel comparison. In addition, because the actual minimum may shift between months from year to year, it is difficult to consistently capture the true lowest level, introducing some uncertainty into the net recovery ΔH reported in Table S5. The associated correlations should therefore be read as indicative of the direction and relative strength of the association rather than as exact coupling coefficients.
Third, the 8-year window (2016–2023) captures the immediate response to the 2019 shift but not the full consolidation cycle of thick aquitards, so the classification reflects recent trend directions rather than long-term consolidation laws. For the same reason, the framework is tied to the policy timeline and hydrogeological context of the NCP, and applying it elsewhere requires redefining local intervention breakpoints rather than transferring the present thresholds.
To address these observational and methodological limitations, future research can be expanded in the following aspects. First, integrating data from high-density groundwater monitoring networks will enable a finer-scale characterization of groundwater dynamics, such as long-term trends, depths, amplitude, and their localized correlations with land subsidence. Second, to accurately capture the delayed consolidation process of clay layers, extended long-term monitoring should be combined with point-scale in situ measurements (e.g., deep extensometers). Finally, data-driven approaches and physics-based 3D hydro-mechanical modeling can be integrated to quantitatively distinguish the impacts of complex influencing factors (e.g., climatic variations versus anthropogenic pumping). This combination will facilitate more comprehensive interpretations of subsidence mechanisms and support predictions under future groundwater management scenarios.
6. Conclusions
This study integrated TS-InSAR observations with spatial statistics—specifically weighted centroid tracking and a modified Emerging Hot Spot Analysis—to evaluate regional subsidence under the new water regime in the NCP. By operating on spatially aggregated bins rather than individual measurement points, this framework filters localized noise and captures macroscopic trends. The main findings are as follows:
The primary subsidence centroid remained anchored in the Cangzhou–Hengshui border region without significant directional drift. Despite this geometric stability, the regional deformation rate has decelerated markedly since 2019, coinciding with rebounding groundwater levels under strict water management policies and increased precipitation in recent years.
Aquifer responses varied across hydrogeological units. The western piedmont and southern Henan regions were dominated by PER-C and INT-C, indicating ground stabilization and rebound. Conversely, the central-eastern plain exhibited pronounced hot spot clustering (PER-H and INT-H), reflecting the compaction inertia and delayed pore water dissipation of thick, low-permeability clays.
Despite persistent subsidence in the central-eastern region, regional mitigation is evident: 14.55% of the significant clustering area has transitioned to DIM-H and HIS-H, and 23% of the existing PER-H area shows initial deceleration. However, the minor CON-H proportion (1.71%) warrants continued monitoring to distinguish true emerging risks from localized transient noise.
Subsidence responds to hydrodynamic changes in a non-linear and hysteretic manner. Future research should decouple the relative contributions of anthropogenic extraction and natural climatic factors, either through data-driven methods supported by high-frequency, continuous groundwater profiling networks, or by coupling InSAR-derived deformation fields with 3D hydro-mechanical models. These approaches will support more precise predictions of land subsidence trajectories under various groundwater management scenarios.
Supplementary Materials
The following supporting information can be downloaded at: https://www.mdpi.com/article/10.3390/rs18183188/s1, Text S1: Sensitivity of the modified Emerging Hot Spot Analysis classification criteria; Figure S1: EHA classification under alternative threshold settings; Table S1: Effect of the long-term criterion on the EHA classification (N = 3); Table S2: Mean deformation rate (2016–2023) of the nested subsets of the long-term hot spot classes; Table S3: Effect of the historical criterion N on the EHA classification; Table S4: Mean deformation rate of the nested subsets of the historical classes before and after 2019; Table S5: Association between 2019–2023 groundwater level recovery and land subsidence rate, resolved by groundwater overdraft domain and EHA pattern along Profiles A-A’ and B-B’.
Author Contributions
Conceptualization, B.W. (Binjia Wang), J.S. and B.W. (Baoping Wen); methodology, B.W. (Binjia Wang) and J.S.; software, B.W. (Binjia Wang), D.M. and J.Y.; validation, B.C.; formal analysis, B.W. (Binjia Wang), T.C. and L.X.; investigation, B.W. (Binjia Wang) and T.C.; resources, T.C., J.S., B.C., H.W. and L.T.; data curation, B.W. (Binjia Wang), T.C., D.M., J.Y. and X.L.; writing—original draft preparation, B.W. (Binjia Wang); writing—review and editing, T.C., J.S. and L.X.; visualization, B.W. (Binjia Wang) and L.X.; supervision, J.S. and B.W. (Baoping Wen); project administration, B.W. (Binjia Wang), T.C. and J.S.; funding acquisition, T.C. and B.C. All authors have read and agreed to the published version of the manuscript.
Funding
This research was funded by the National Natural Science Foundation of China (U2344225, 42474012, 42371089), Asset Operation and Maintenance Project of the China Geological Survey for operating and maintaining the National Groundwater Monitoring Network (DD202513001).
Data Availability Statement
The data used to support the findings of this study are available from the corresponding author upon request.
Acknowledgments
We would like to thank the anonymous reviewers for their constructive suggestions and comments. We also acknowledge the European Space Agency (ESA) for providing the Copernicus Sentinel-1 data, which can be downloaded from the ASF data search vertex.
Conflicts of Interest
The authors declare no conflicts of interest.
Abbreviations
The following abbreviations are used in this manuscript:
| NCP | North China Plain |
| SNWD | South-to-North Water Diversion |
| SDE | Standard Deviational Ellipse |
| EHA | Emerging Hot Spot Analysis |
| STC | Space-Time Cube |
| IPTA | Interferometric Point Target Analysis |
| SAR | Synthetic Aperture Radar |
| SRTM | Shuttle Radar Topography Mission |
| DEM | digital elevation model |
| IW | Interferometric Wide |
| ASF | Alaska Satellite Facility |
| MCF | Minimum Cost Flow |
| SVD | Singular Value Decomposition |
| CPT | Coherent Point Target |
| APS | Atmospheric Phase Screen |
| M-K | Mann–Kendall |
| INT-H | Intensifying Hot Spot |
| PER-H | Persistent Hot Spot |
| DIM-H | Diminishing Hot Spot |
| CON-H | Consecutive Hot Spot |
| HIS-H | Historical Hot Spot |
| INT-C | Intensifying Cold Spot |
| PER-C | Persistent Cold Spot |
| DIM-C | Diminishing Cold Spot |
| CON-C | Consecutive Cold Spot |
| HIS-C | Historical Cold Spot |
References
- Galloway, D.L.; Burbey, T.J. Review: Regional Land Subsidence Accompanying Groundwater Extraction. Hydrogeol. J. 2011, 19, 1459–1486. [Google Scholar] [CrossRef] [Scilit]
- Herrera-García, G.; Ezquerro, P.; Tomás, R.; Béjar-Pizarro, M.; López-Vinielles, J.; Rossi, M.; Mateos, R.M.; Carreón-Freyre, D.; Lambert, J.; Teatini, P.; et al. Mapping the Global Threat of Land Subsidence. Science 2021, 371, 34–36. [Google Scholar] [CrossRef] [Scilit] [PubMed]
- Kok, S.; Costa, A.L. Framework for Economic Cost Assessment of Land Subsidence. Nat. Hazards 2021, 106, 1931–1949. [Google Scholar] [CrossRef] [Scilit]
- Huning, L.S.; Love, C.A.; Anjileli, H.; Vahedifard, F.; Zhao, Y.; Chaffe, P.L.B.; Cooper, K.; Alborzi, A.; Pleitez, E.; Martinez, A.; et al. Global Land Subsidence: Impact of Climate Extremes and Human Activities. Rev. Geophys. 2024, 62, e2023RG000817. [Google Scholar] [CrossRef] [Scilit]
- Xue, Y.; Zhang, Y.; Ye, S.; Wu, J.; Li, Q. Land Subsidence in China. Environ. Geol. 2005, 48, 713–720. [Google Scholar] [CrossRef] [Scilit]
- Ye, S.; Xue, Y.; Wu, J.; Yan, X.; Yu, J. Progression and Mitigation of Land Subsidence in China. Hydrogeol. J. 2016, 24, 685–693. [Google Scholar] [CrossRef] [Scilit]
- Li, W.; Wang, L.; Yang, H.; Zheng, Y.; Cao, W.; Liu, K. The Groundwater Overexploitation Status and Countermeasure Suggestions of the North China Plain. China Water Resour. 2020, 13, 26–30. [Google Scholar] [CrossRef]
- Shi, J.; Li, G.; Liang, X.; Chen, Z.; Shao, J.; Song, S. Evolution Mechanisms and Control of Groundwater in the North China Plain. Acta Geosci. Sin. 2014, 35, 527–534. [Google Scholar] [CrossRef]
- Yang, H.; Cao, W.; Zhi, C.; Li, Z.; Bao, X.; Ren, Y.; Liu, F.; Fan, C.; Wang, S.; Wang, Y. Evolution of Groundwater Level in the North China Plain in the Recent 40 Years and Suggestions on the Treatment of Over-Exploitation. Geol. China 2021, 48, 1142–1155. [Google Scholar] [CrossRef]
- Guo, H.; Bai, J.; Zhang, Y.; Wang, L.; Shi, J.; Li, W.; Zhang, Z.; Wang, Y.; Zhu, J.; Wang, H. The Evolution Characteristics and Mechanism of the Land Subsidence in Typical Areas of the North China Plain. Geol. China 2017, 44, 1115–1127. [Google Scholar] [CrossRef]
- Gong, H.; Pan, Y.; Zheng, L.; Li, X.; Zhu, L.; Zhang, C.; Huang, Z.; Li, Z.; Wang, H.; Zhou, C. Long-Term Groundwater Storage Changes and Land Subsidence Development in the North China Plain (1971–2015). Hydrogeol. J. 2018, 26, 1417–1427. [Google Scholar] [CrossRef] [Scilit]
- Su, G.; Wu, Y.; Zhan, W.; Zheng, Z.; Chang, L.; Wang, J. Spatiotemporal Evolution Characteristics of Land Subsidence Caused by Groundwater Depletion in the North China Plain during the Past Six Decades. J. Hydrol. 2021, 600, 126678. [Google Scholar] [CrossRef] [Scilit]
- Guo, H.; Li, W.; Wang, L.; Chen, Y.; Zang, X.; Wang, Y.; Zhu, J.; Bian, Y. Present Situation and Research Prospects of the Land Subsidence Driven by Groundwater Levels in the North China Plain. Hydrogeol. Eng. Geol. 2021, 48, 162–171. [Google Scholar] [CrossRef]
- Li, W.; Wang, L.; Guo, H.; Wang, H.; Wang, Y.; Zhu, J.; Zang, X. Achievements and Countermeasures of Land Subsidence Prevention in China. China Water Resour. 2021, 7, 32–35. [Google Scholar] [CrossRef]
- Bai, L.; Jiang, L.; Zhao, Y.; Li, Z.; Cao, G.; Zhao, C.; Liu, R.; Wang, H. Quantifying the Influence of Long-Term Overexploitation on Deep Groundwater Resources across Cangzhou in the North China Plain Using InSAR Measurements. J. Hydrol. 2022, 605, 127368. [Google Scholar] [CrossRef] [Scilit]
- Yang, H.; Li, Z.; Meng, R.; Bai, H.; Song, B.; Guo, W.; Bao, X. Evolution of Deep Groundwater Balance and Renewability Analysis in the North China Plain under New Hydrological Conditions. Hydrogeol. Eng. Geol. 2025, 52, 28–42. [Google Scholar] [CrossRef]
- Long, D.; Xu, Y.; Cui, Y.; Cui, Y.; Butler, J.J., Jr.; Dong, L.; Wang, L.; Liu, D.; Wada, Y.; Hu, L.; et al. Unprecedented Large-Scale Aquifer Recovery through Human Intervention. Nat. Commun. 2025, 16, 7296. [Google Scholar] [CrossRef] [Scilit] [PubMed]
- Lei, K.; Ma, F.; Chen, B.; Luo, Y.; Cui, W.; Zhao, L.; Wang, X.; Sun, A. Effects of South-to-North Water Diversion Project on Groundwater and Land Subsidence in Beijing, China. Bull. Eng. Geol. Environ. 2023, 82, 18. [Google Scholar] [CrossRef] [Scilit]
- Long, D.; Yang, W.; Scanlon, B.R.; Zhao, J.; Liu, D.; Burek, P.; Pan, Y.; You, L.; Wada, Y. South-to-North Water Diversion Stabilizing Beijing’s Groundwater Levels. Nat. Commun. 2020, 11, 3665. [Google Scholar] [CrossRef] [Scilit] [PubMed]
- Ministry of Water Resources; Ministry of Finance; National Development and Reform Commission; Ministry of Agriculture and Rural Affairs of the People’s Republic of China. Action Plan for Comprehensive Management of Groundwater Overexploitation in North China; Ministry of Water Resources: Beijing, China, 2019.
- Jasechko, S.; Seybold, H.; Perrone, D.; Fan, Y.; Shamsudduha, M.; Taylor, R.G.; Fallatah, O.; Kirchner, J.W. Rapid Groundwater Decline and Some Cases of Recovery in Aquifers Globally. Nature 2024, 625, 715–721. [Google Scholar] [CrossRef] [Scilit] [PubMed]
- Su, G.; Xiong, C.; Zhang, G.; Wang, Y.; Shen, Q.; Chen, X.; An, H.; Qin, L. Coupled Processes of Groundwater Dynamics and Land Subsidence in the Context of Active Human Intervention, a Case in Tianjin, China. Sci. Total Environ. 2023, 903, 166803. [Google Scholar] [CrossRef] [Scilit] [PubMed]
- An, Y.; Shen, Q.; Shum, C.K.; Gao, F.; Zhang, X.; Jiang, L.; Wang, H. TS-InSAR Assessment of Groundwater Overexploitation-Land Subsidence Linkage: Hengshui Case Study. J. Hydrol. Reg. Stud. 2025, 60, 102489. [Google Scholar] [CrossRef] [Scilit]
- Han, J.; Gong, H.; Guo, L.; Li, X.; Zhu, L.; Chen, B.; Zhang, Q.; Wu, L.; Lei, J.; Zhu, X. Mechanism the Land Subsidence from Multiple Spatial Scales and Hydrogeological Conditions—A Case Study in Beijing-Tianjin-Hebei, China. J. Hydrol. Reg. Stud. 2023, 50, 101531. [Google Scholar] [CrossRef] [Scilit]
- Meng, D.; Chen, B.; Gong, H.; Zhang, S.; Ma, R.; Zhou, C.; Lei, K.; Xu, L.; Wang, X. Land Subsidence and Rebound Response to Groundwater Recovery in the Beijing Plain: A New Hydrological Perspective. J. Hydrol. Reg. Stud. 2025, 57, 102127. [Google Scholar] [CrossRef] [Scilit]
- Zhang, R.; Wang, T.; Liu, G.; Shama, A.; Liu, A.; Wang, X.; Deng, L.; Mao, W. Ground Subsidence Evolution and Groundwater Variation in the Middle Route of South to North Water Diversion Project. Sci. Rep. 2025, 15, 19220. [Google Scholar] [CrossRef] [Scilit] [PubMed]
- Shi, M.; Gong, H.; Gao, M.; Chen, B.; Zhang, S.; Zhou, C. Recent Ground Subsidence in the North China Plain, China, Revealed by Sentinel-1A Datasets. Remote Sens. 2020, 12, 3579, Correction in Remote Sens. 2021, 13, 1115. [Google Scholar] [CrossRef] [Scilit]
- Zhang, X.; Hu, J.; Motagh, M.; Li, M.; Wang, Y.; Yang, Q.; Su, G.; Wang, H. Groundwater Volume Loss and Land Subsidence in the North China Plain Investigated Using Wide-Area InSAR Surveying and Mechanical Modeling. Remote Sens. Environ. 2026, 333, 115164. [Google Scholar] [CrossRef] [Scilit]
- Jiang, M.; Wu, Z.; Wang, X.; Bai, L.; Li, Z.; Lu, Z. Mapping Wide-Area Land Subsidence from Groundwater Use in the North China Plain by Machine Learning-Based InSAR Adjustment. Remote Sens. Environ. 2026, 334, 115226. [Google Scholar] [CrossRef] [Scilit]
- Meng, D.; Chen, B.; Zhang, S.; Gong, H.; Zhou, C.; Chen, S.; Lei, K.; Wang, H. Differential Land Deformation Patterns and Response Mechanism to Groundwater Recovery in the Beijing-Tianjin-Hebei Plain Revealed by Reconstructing and Clustering of TS-InSAR Observations. Int. J. Appl. Earth Obs. Geoinf. 2026, 147, 105196. [Google Scholar] [CrossRef] [Scilit]
- Haghshenas Haghighi, M.; Motagh, M. Ground Surface Response to Continuous Compaction of Aquifer System in Tehran, Iran: Results from a Long-Term Multi-Sensor InSAR Analysis. Remote Sens. Environ. 2019, 221, 534–550. [Google Scholar] [CrossRef] [Scilit]
- Foster, S.; Garduno, H.; Evans, R.; Olson, D.; Tian, Y.; Zhang, W.; Han, Z. Quaternary Aquifer of the North China Plain—Assessing and Achieving Groundwater Resource Sustainability. Hydrogeol. J. 2004, 12, 81–93. [Google Scholar] [CrossRef] [Scilit]
- Feng, W.; Zhong, M.; Lemoine, J.M.; Biancale, R.; Hsu, H.T.; Xia, J. Evaluation of Groundwater Depletion in North China Using the Gravity Recovery and Climate Experiment (GRACE) Data and Ground-Based Measurements. Water Resour. Res. 2013, 49, 2110–2118. [Google Scholar] [CrossRef] [Scilit]
- Werner, C.; Wegmuller, U.; Strozzi, T.; Wiesmann, A. Interferometric Point Target Analysis for Deformation Mapping. In Proceedings of the IGARSS 2003, IEEE International Geoscience and Remote Sensing Symposium, Toulouse, France, 21–25 July 2003; pp. 4362–4364. [Google Scholar] [CrossRef] [Scilit]
- Lefever, D.W. Measuring Geographic Concentration by Means of the Standard Deviational Ellipse. Am. J. Sociol. 1926, 32, 88–94. [Google Scholar] [CrossRef] [Scilit] [PubMed]
- Yuill, R.S. The Standard Deviational Ellipse: An Updated Tool for Spatial Description. Geogr. Ann. Ser. B 1971, 53, 28–39. [Google Scholar] [CrossRef]
- Wong, D.W.; Lee, J. Statistical Analysis of Geographic Information with ArcView GIS and ArcGIS; John Wiley & Sons: Hoboken, NJ, USA, 2005; p. 464. [Google Scholar]
- How Emerging Hot Spot Analysis Works. Available online: https://pro.arcgis.com/en/pro-app/latest/tool-reference/space-time-pattern-mining/learnmoreemerging.htm (accessed on 15 April 2026).
- Rawal, S.; Wang, G. Long-Term Subsidence Assessment by LiCSBAS and Emerging Hot Spot Analysis in Kathmandu Valley. Land 2025, 14, 700. [Google Scholar] [CrossRef] [Scilit]
- Kim, M.; Lee, S. Identification of Emerging Roadkill Hotspots on Korean Expressways Using Space–Time Cubes. Int. J. Environ. Res. Public Health 2023, 20, 4896. [Google Scholar] [CrossRef] [Scilit] [PubMed]
- Getis, A.; Ord, J.K. The Analysis of Spatial Association by Use of Distance Statistics. Geogr. Anal. 1992, 24, 189–206. [Google Scholar] [CrossRef] [Scilit]
- Ord, J.K.; Getis, A. Local Spatial Autocorrelation Statistics: Distributional Issues and an Application. Geogr. Anal. 1995, 27, 286–306. [Google Scholar] [CrossRef] [Scilit]
- Sultan, V.; Hilton, B. A Spatial Analytics Framework to Investigate Electric Power-Failure Events and Their Causes. ISPRS Int. J. Geo-Inf. 2020, 9, 54. [Google Scholar] [CrossRef] [Scilit]
- Panwar, M.; Agarwal, A.; Devadas, V. Analyzing Land Surface Temperature Trends Using Non-Parametric Approach: A Case of Delhi, India. Urban Clim. 2018, 24, 19–25. [Google Scholar] [CrossRef] [Scilit]
- Mohamadi, B.; Balz, T.; Younes, A. Towards a PS-InSAR Based Prediction Model for Building Collapse: Spatiotemporal Patterns of Vertical Surface Motion in Collapsed Building Areas—Case Study of Alexandria, Egypt. Remote Sens. 2020, 12, 3307. [Google Scholar] [CrossRef] [Scilit]
- Sen, P.K. Estimates of the Regression Coefficient Based on Kendall’s Tau. J. Am. Stat. Assoc. 1968, 63, 1379–1389. [Google Scholar] [CrossRef]
- Wang, Y.; Gong, H.; Zhou, C.; Wang, Q.; Wang, H.; Zhang, J. Decomposition and Attribution Analysis of the Coupled Evolution Characteristics of Groundwater and Land Subsidence in the Beijing-Tianjin-Hebei Plain. J. Hydrol. Reg. Stud. 2025, 59, 102393. [Google Scholar] [CrossRef] [Scilit]
- Helm, D.C. One-Dimensional Simulation of Aquifer System Compaction near Pixley, California: 1. Constant Parameters. Water Resour. Res. 1975, 11, 465–478. [Google Scholar] [CrossRef] [Scilit]
- Poland, J.F. Guidebook to Studies of Land Subsidence Due to Ground-Water Withdrawal; UNESCO: Paris, France, 1984; pp. 1–305. [Google Scholar]
- Hoffmann, J.; Galloway, D.L.; Zebker, H.A. Inverse Modeling of Interbed Storage Parameters Using Land Subsidence Observations, Antelope Valley, California. Water Resour. Res. 2003, 39, 1031. [Google Scholar] [CrossRef] [Scilit]
- Wang, K.; Wang, G.; Bao, Y.; Su, G.; Wang, Y.; Shen, Q.; Zhang, Y.; Wang, H. Preventing Subsidence Reoccurrence in Tianjin: New Preconsolidation Head and Safe Pumping Buffer. Groundwater 2024, 62, 778–794. [Google Scholar] [CrossRef] [Scilit] [PubMed]
- Gambolati, G.; Teatini, P. Geomechanics of Subsurface Water Withdrawal and Injection. Water Resour. Res. 2015, 51, 3922–3955. [Google Scholar] [CrossRef] [Scilit]
- Li, B.; Hu, J.; Motagh, M.; Li, M.; Wang, Y.; Yang, Q.; Su, G.; Wang, H. Characterizing Aquifer Properties and Groundwater Storage at North China Plain Using Geodetic and Hydrological Measurements. Water Resour. Res. 2025, 61, e2024WR037425. [Google Scholar] [CrossRef] [Scilit]
- Jiang, M.; Ding, X.; Hanssen, R.F.; Malhotra, R.; Chang, L. Fast Statistically Homogeneous Pixel Selection for Covariance Matrix Estimation for Multitemporal InSAR. IEEE Trans. Geosci. Remote Sens. 2015, 53, 1213–1224. [Google Scholar] [CrossRef] [Scilit]

Disclaimer/Publisher’s Note: The statements, opinions and data contained in all publications are solely those of the individual author(s) and contributor(s) and not of MDPI and/or the editor(s). MDPI and/or the editor(s) disclaim responsibility for any injury to people or property resulting from any ideas, methods, instructions or products referred to in the content. |
© 2026 by the authors. Licensee MDPI, Basel, Switzerland. This article is an open access article distributed under the terms and conditions of the Creative Commons Attribution (CC BY) license.