Article

Numerical Modeling of the Ash Cloud Movement from the Catastrophic Eruption of the Sheveluch Volcano in November 1964

1
Institute of Volcanology and Seismology of the Far Eastern Branch of the Russian Academy of Sciences, 683006 Petropavlovsk-Kamchatsky, Russia
2
Computing Center of the Far Eastern Branch of the Russian Academy of Sciences, 680000 Khabarovsk, Russia
3
Space Research Institute of the Russian Academy of Sciences, 117997 Moscow, Russia
*
Author to whom correspondence should be addressed.
Remote Sens. 2022, 14(14), 3449; https://doi.org/10.3390/rs14143449
Submission received: 12 April 2022 / Revised: 14 July 2022 / Accepted: 14 July 2022 / Published: 18 July 2022
(This article belongs to the Special Issue Assessment and Prediction of Volcano Hazard Using Remote Sensing)

Abstract

:
This paper reconstructs, for the first time, the motion dynamics of an eruptive cloud formed during the catastrophic eruption of the Sheveluch volcano in November 1964 (Volcanic Explosivity Index 4+). This became possible due to the public availability of atmospheric reanalysis data from the ERA-40 archive of the European Center for Medium-Range Weather Forecasts (ECMWF) and the development of numerical modeling of volcanic ash cloud propagation. The simulation of the eruptive cloud motion process, which was carried out using the FALL3D and PUFF models, made it possible to clarify the sequence of events of this eruption (destruction of extrusive domes in the crater and the formation of an eruptive column and pyroclastic flows), which lasted only 1 h 12 min. During the eruption, the ash cloud consisted of two parts: the main eruptive cloud that rose up to 15,000 m above sea level (a.s.l.), and the co-ignimbrite cloud that formed above the moving pyroclastic flows. The ashfall in Ust-Kamchatsk (Kamchatka) first occurred out of the eruptive cloud moving at a higher speed, then out of the co-ignimbrite cloud. In Nikolskoye (Bering Island, Commander Islands), ash fell only out of the co-ignimbrite cloud. Under the turbulent diffusion, the forefront of the main eruptive cloud rose slowly in the atmosphere and reached 16,500 m a.s.l. by 04:07 UTC on November 12. Three days after the eruption began, the eruptive cloud stretched for 3000 km over the territories of the countries of Russia, Canada, the USA, Mexico, and over both the Bering Sea and the Pacific Ocean. It is assumed that the well-known long-term decrease in the solar radiation intensity in the northern latitudes from 1963–1966, which was established according to the world remote sensing data, was associated with the spread of aerosol clouds formed not only by the Agung volcano, but those formed during the 1964 Sheveluch volcano catastrophic eruption.

Graphical Abstract

1. Introduction

Powerful and catastrophic explosive volcanic eruptions are highly dangerous for modern jet aviation as up to several cubic kilometers of volcanic ash and aerosols can be emitted in the atmosphere and stratosphere for hours and days as a result of such eruptions, e.g., [1,2,3,4,5,6,7,8,9]. Each explosive event, especially a catastrophic one, is unique. By studying such events, scientists can obtain data on juvenile magmatic matter, as well as changes in the planet’s atmosphere, through which the eruptive material is transported. Scientists obtain information about erstwhile volcanic eruptions by studying their deposits: the greater the volume of erupted products, the more powerful the eruption. There are many examples of the products’ volume recovery of large volcanic eruptions and the dynamics of their development, e.g., [10,11,12,13,14,15,16,17,18].
In the early 2000s, the reanalyzed atmospheric observations from the ERA-40 archive of the European Center for Medium-Range Weather Forecasts (ECMWF) became available in the public domain. This archive contained an extensive list of meteorological fields, including data on wind speed and direction, as well as air temperatures for various altitudes, e.g., [19,20]. These data span a period from September 1957 to August 2002. At the same time, mathematical and algorithmic software designed to simulate the spread of volcanic ash in the atmosphere, has received intensive development. Today, numerical modeling is successfully used to study and reconstruct the dynamics of eruptive events and the spread of ash clouds and aerosols from volcanoes, e.g., [21,22,23,24,25,26,27].
In the second half of the 20th century, there were two catastrophic eruptions in the Northern group of Kamchatka volcanoes—Bezymianny in 1956, and Sheveluch in 1964—that became well-known worldwide. The interest in these eruptions remains high due to ambiguous interpretations among different scientists of these catastrophic events and the processes that preceded them, e.g., [28,29,30,31,32,33,34]. While quite a lot is known about the deposits, rock composition, and geological effects of these eruptions, there is insufficient information about the distribution of eruptive clouds during these events; however, there are some data on the wind direction at the beginning of the events, wind speeds at certain time (weather balloon data), and estimates of tephra volumes deposited on land, e.g., [30,31,32,35,36].
Considering the absence of any satellite data on the Kamchatka territory in 1964, the appearance of the ERA-40 archive in the 2000s prompted us to study the 1964 Sheveluch volcano catastrophic eruption. The main question this study seeks to answer is: Is it possible to understand and describe the dynamics of the catastrophic Sheveluch eruption via modeling the eruptive cloud movement? In addition, we examine how the eruptive clouds were moving within three days after the eruption’s beginning and assess the hazard of this eruption for aviation.
In our research, we reconstruct the eruptive cloud movement dynamics during the catastrophic eruption of Sheveluch in November 1964. This represents the first time this work has been conducted for the 1964 eruption. During the first stage, we obtained the data on the movement of the eruptive cloud [37] by using the weather data for November 1964 from the ERA-40 archive and the PUFF model, in a modeling result visualization in the VolSatView Information System, which was designed for satellite monitoring of volcanoes, e.g., [11,38,39].
This article presents the modeling results of the Sheveluch volcano eruptive cloud propagation, using the ERA-40 archive and the FALL3D and PUFF models, and presents analysis of the cloud propagation movement dynamics. We also compare the results of our research with remote sensing data for the solar radiation intensity in northern latitudes from 1963–1966. The results of our research can provide useful information for recovery efforts based on the nature of eruptive cloud movements, not only those from the Sheveluch volcano, but also from other major volcanic eruptions.

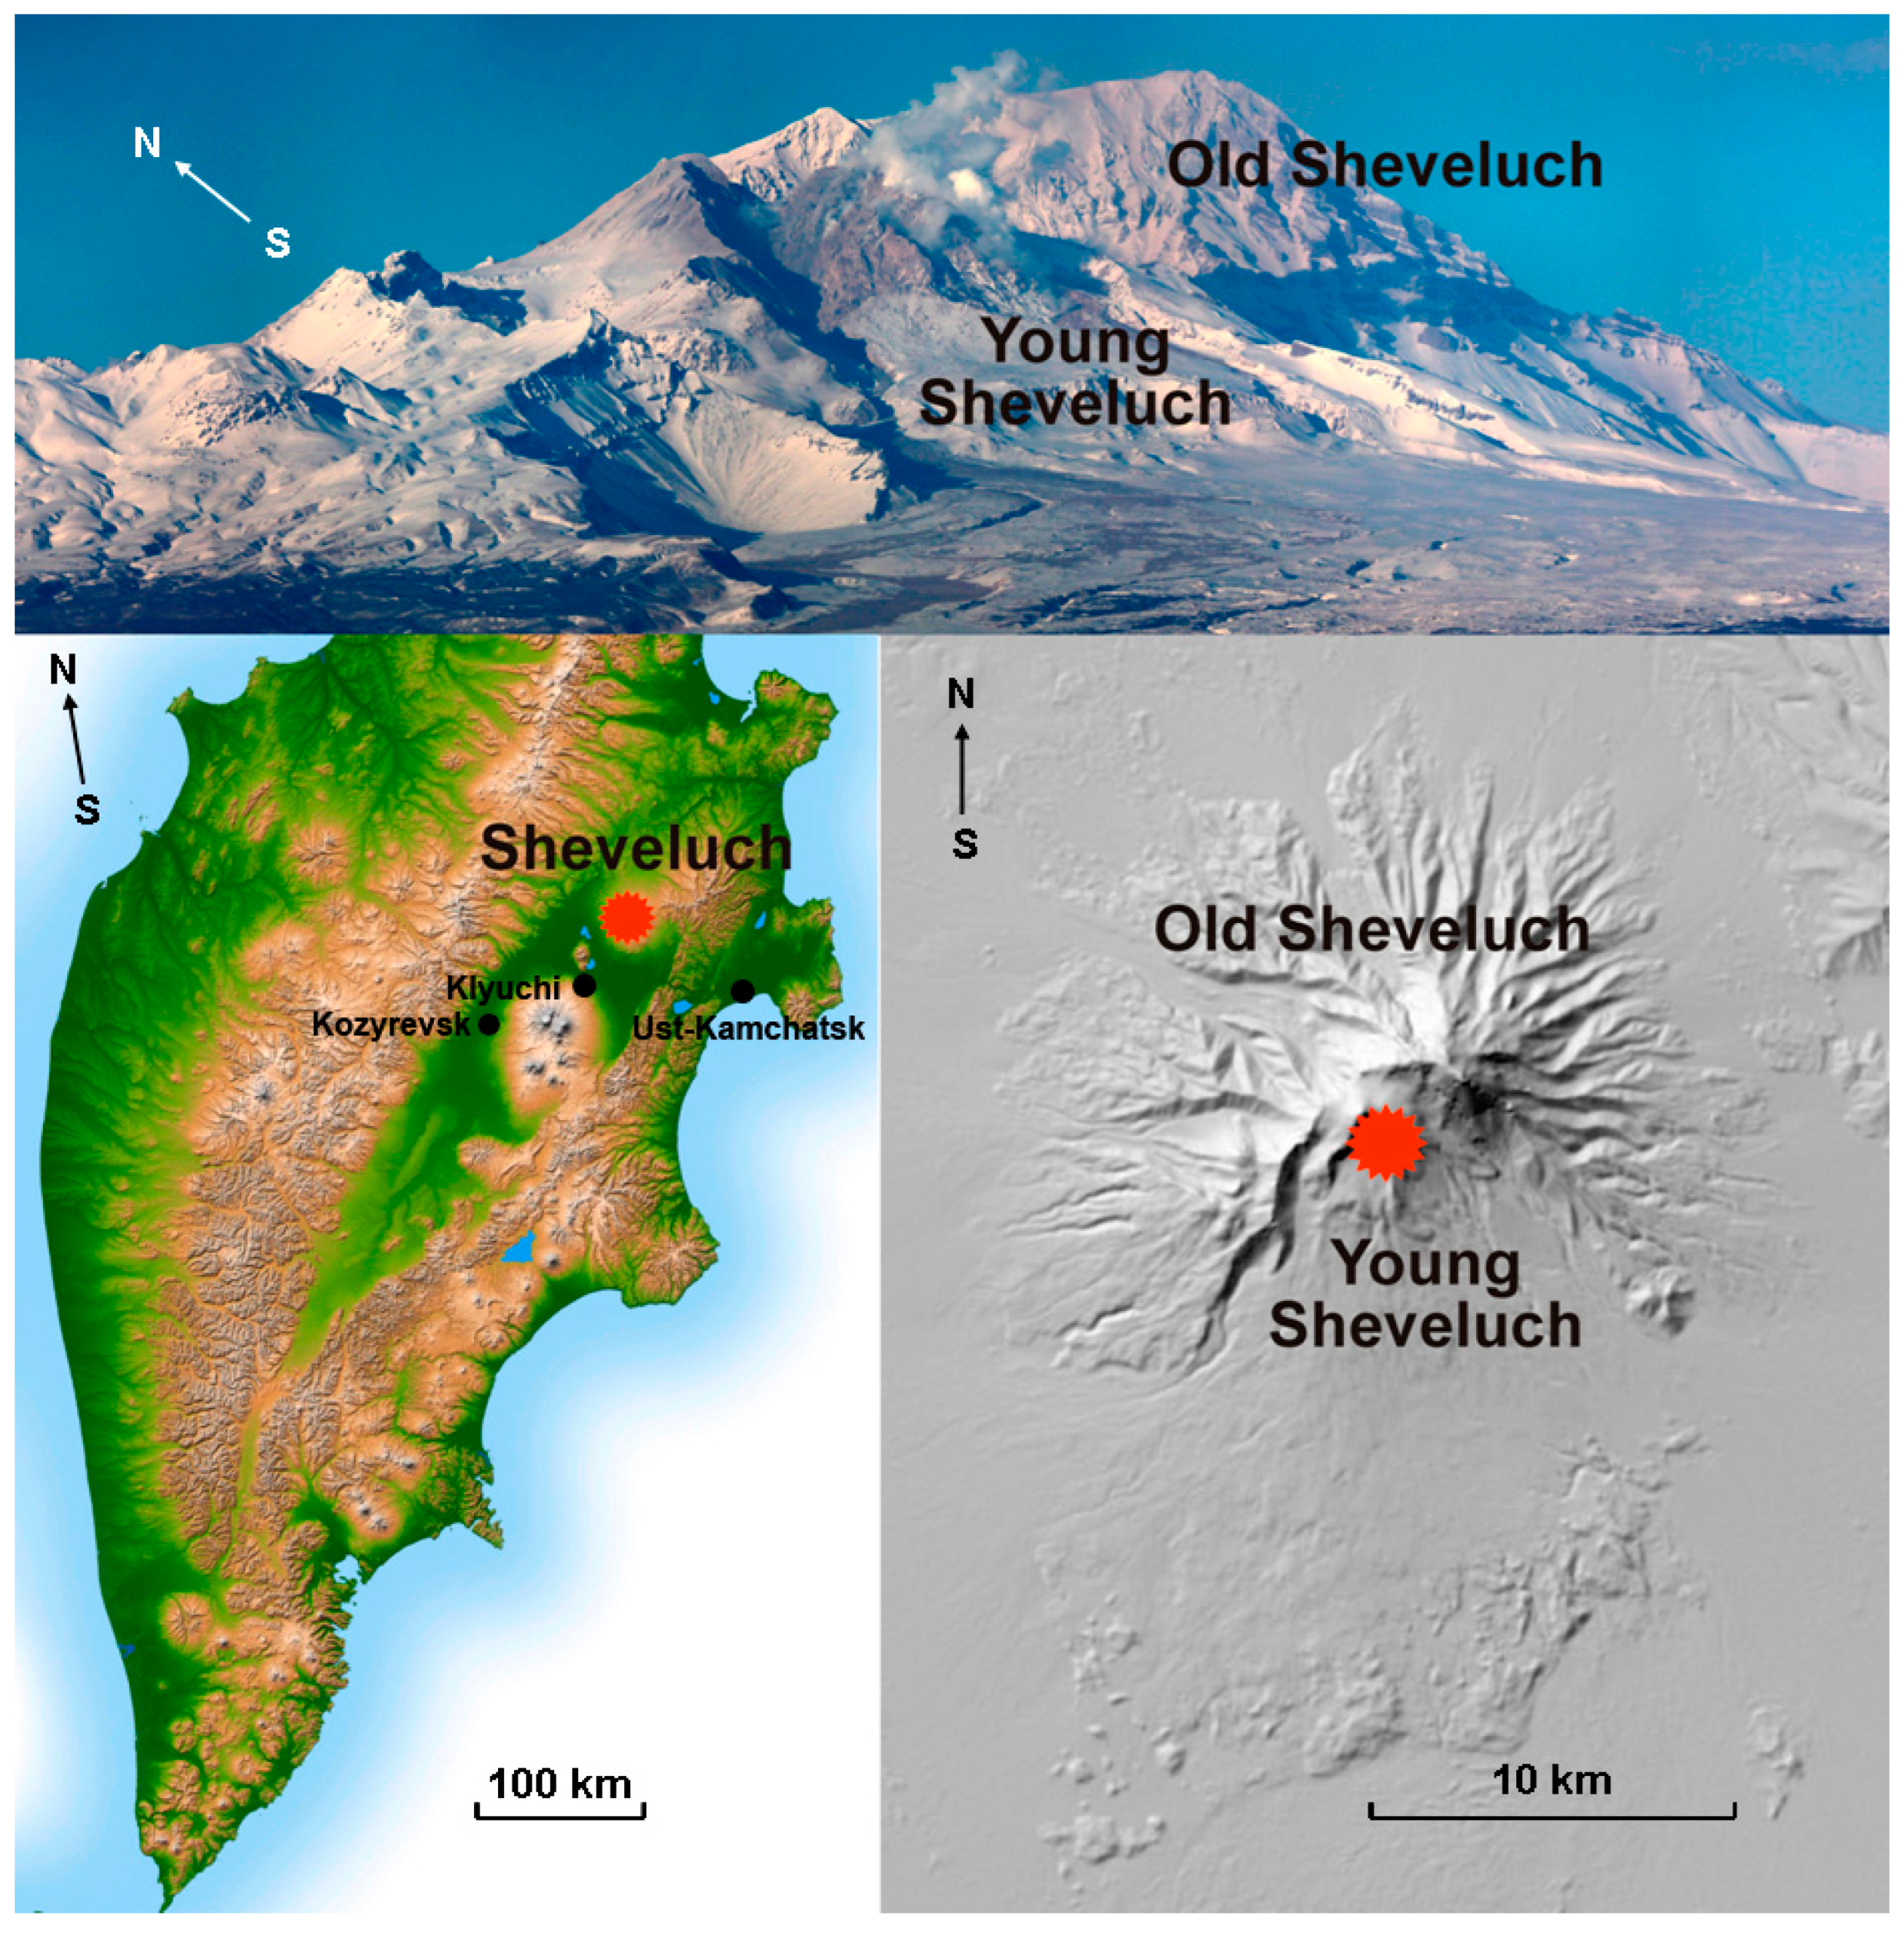
2. The Sheveluch Volcano

Young Sheveluch (56°38′10″N, 161°18′54″E, 2800 m) (hereinafter Sheveluch) is the northernmost active volcano on the Kamchatka peninsula (Figure 1), and one of the most active volcanoes in the world. It belongs to the Northern group of Kamchatka volcanoes. Sheveluch is located on the left bank of the Kamchatka River, 45 km from Klyuchi and 450 km from Petropavlovsk-Kamchatsky.
Sheveluch is located in the northwestern part of the 9 km caldera formed on the southern slope of the Old Sheveluch volcano during the late Pleistocene (~30 thousand 14 C years) [33,41]. The volcano was formed from a large number of merged andesitic extrusions, their agglomerate mantles, and short lava flows. It appeared during the time stretching from the late Pleistocene (?) to the early Holocene [33,41,42,43]. Two types of historical eruptions are known to have occurred at Sheveluch: (1) catastrophic (type of directed blast) producing 2–2.3 km3 of eruptive products (1854 and 1964), and (2) medium-power extrusive-explosive-effusive eruptions associated with the growth of the lava domes (1790–1810, 1879–1883, 1896–1897, 1925–1930, 1944–1950, and 1980–now) accompanied by paroxysmal explosive events emitting up to 0.5 km3 of erupted material, e.g., [32,33,43,44,45]. The rock composition of the volcano is represented mainly from andesites to dacites, e.g., [32,41,42,43].
Before the first known catastrophic eruption of 1854, the volcano had been quiet for 44 years. The next eruption after the disaster took place was 25 years later in 1879 [32,43]. The short eruption periods of Sheveluch during 1879–1883, 1896–1897, and 1925–1930 are probably linked to the absence of ongoing volcano monitoring and the registration by the eyewitnesses of only strong explosions. Since the 1935 establishment in Klyuchi of the Kamchatka Volcanological Station, named after F.Yu. Levinson-Lessing, the volcano has been monitored continuously; the data on Sheveluch activity and the content of its eruption products are published in academic journals. Therefore, we have reliable information on the volcano evolution from 1935 to the present.
On 24 December 1944, after a 14-year period of relative quiet, an extrusive-explosive eruption of Sheveluch began, which formed the Suelich lava dome. The eruption lasted about 5 years and 4 months, and ended in mid-April 1950 [32,43,46]. The volcano showed weak fumarole activity for 15 years and 9 months; its summit was occupied by extrusive domes (e.g., Tsentralny, Suelich, and Yuzhnye) [32,33,47].

3. The Catastrophic Eruption of Sheveluch in 1964

3.1. Seismic and Acoustic Data

From 1946–1958, the Volcanological Station had only one seismic station “Klyuchi”, and retrospective analysis of the data for this period revealed numerous weak seismic events near Sheveluch that had gone unnoticed [48]. By 1964, a regional network of seismic stations was established in Kamchatka [49,50], enabling the events near Sheveluch to be reliably recorded.
According to seismologists [49,50], the preparation of the 1964 Sheveluch eruption began on 24 January 1964, with single volcanic earthquakes. In May, seismologists recorded a swarm of such earthquakes that occurred 0–5 km beneath the volcano. This information was used by P.I. Tokarev [48] to forecast the probability of an eruption in 1964. Until mid-October of that year, earthquakes under Sheveluch were registered at intervals of 2–25 days. Beginning 21 October, a swarm of earthquakes began to form; starting 10 November, the speed and power of the seismic processes increased dramatically. The main shear earthquake, with a seismic origin radius of 3100 m, took place at 19:06 UTC on 11 November. The depth of the earthquakes during the eruption was 0–5 km [50].
The paroxysmal eruption lasted from 19:07 to 20:19 UTC on 11 November [32,49]. The eruption was accompanied by volcanic tremors, registered between 19:20 and 20:22 UTC on 11 November [32].
According to G.S. Gorshkov and Yu.M. Doubik [32], apart from the main explosion on 11 November at 19:07 UTC, there may have been a second explosion at 19:13 UTC; a resident of Kozyrevsk mentioned hearing two gunshots (see below). It is possible that weaker explosions began at night: microbarograms show 10 events between 13:00 and 19:00 UTC that can be attributed to either small explosions or surface waves from the stronger earthquakes [32].

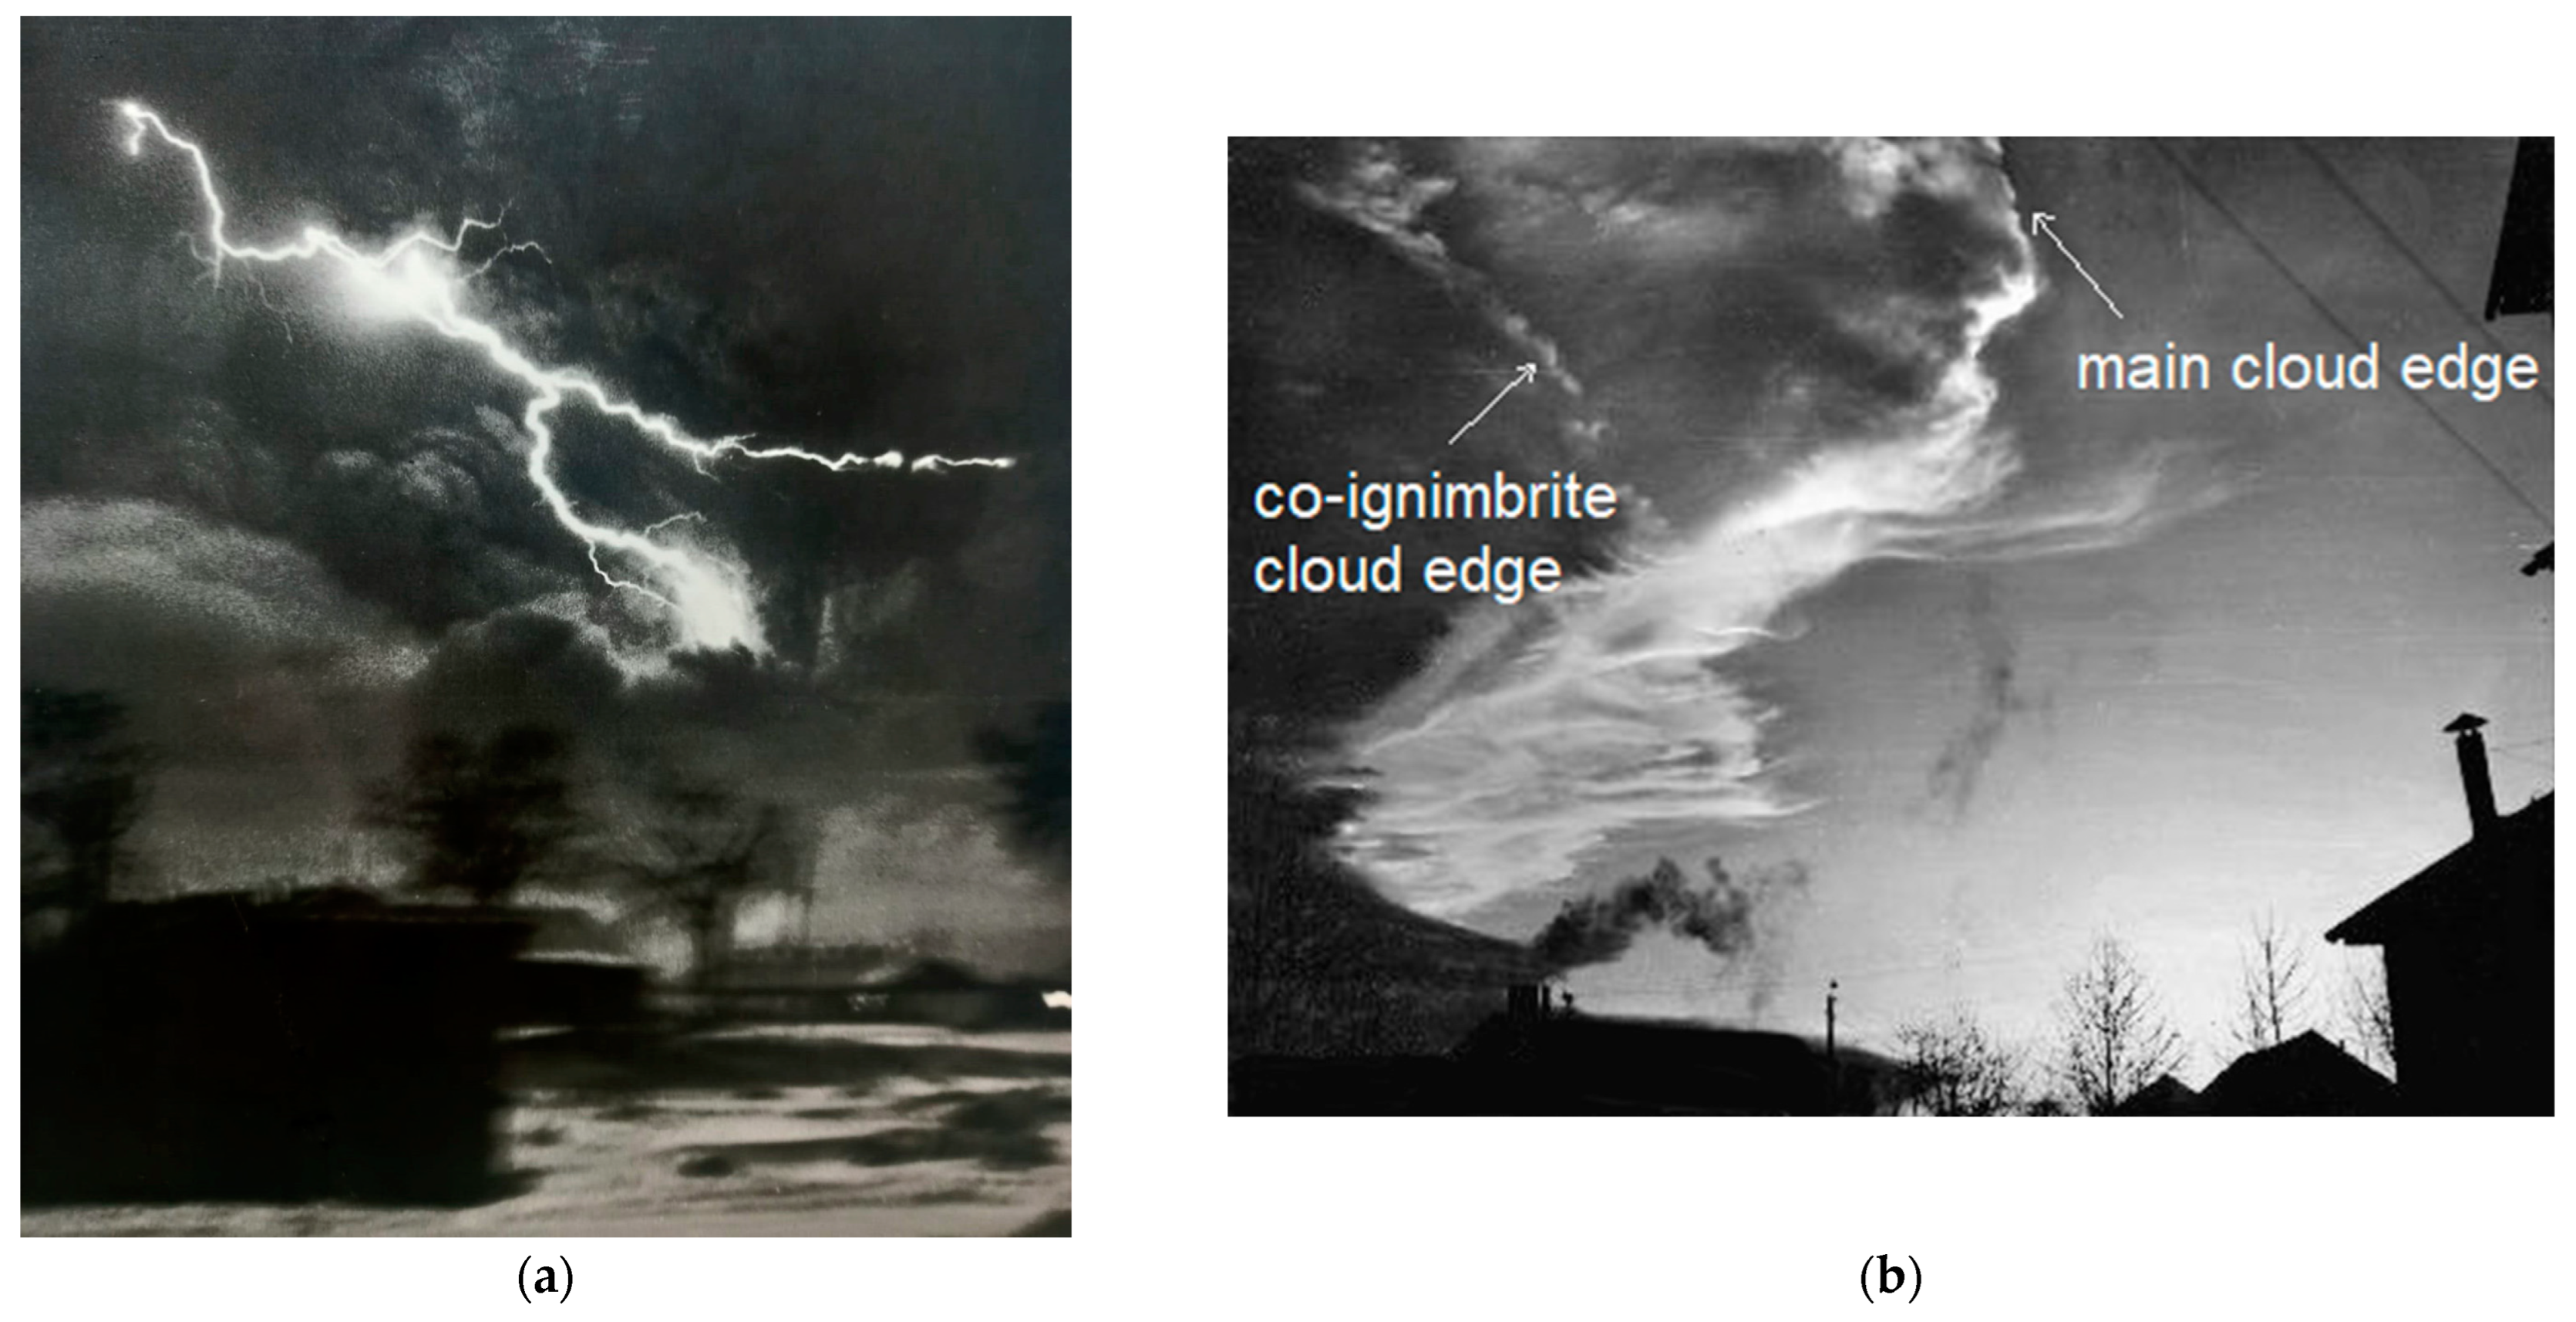
3.2. Visual Data on the Eruptive Cloud

Even though the catastrophic eruption of Sheveluch began early in the morning before dawn local time [32,51], witnesses included many residents of Klyuchi, Kozyrevsk (112 km from Sheveluch), and Ust-Kamchatsk (85 km from Sheveluch) (Figure 1). For example, the photograph (Figure 2a) taken from Klyuchi sometime after the eruption began, illustrates the eyewitness accounts provided in the work by [51].
A resident of Kozyrevsk heard one “gunshot” sound at 19:08 UTC and another 5–7 min later; at 19:15 UTC, he saw “a dark mushroom-like cloud with lightning bolts” over Sheveluch [51] (p. 29). Other observers reported that at 19:15 UTC, they saw a “narrow flame pillar on the left side of the crater with a little glow on the right”, and saw a huge black cloud of ash which rose up to 12,000–15,000 m above sea level (a.s.l.) that began to turn toward Klyuchi [51] (p. 29). Wide, bright lightning diverged from the center of the cloud toward its edges. The length of linear lightning in the eruptive cloud reached 1–2 km above the Sheveluch crater [52]. Another resident of Kozyrevsk reported seeing the ash cloud in the direction of Sheveluch at 19:08 UTC; the resident described the upper part of this cloud as white, the middle as black, and the lower area as lead-colored [51] (p. 30). These observations confirm that from the very beginning of the eruption, there was an eruptive column above the crater (black), and confirm that pyroclastic avalanches and flows moved along the volcano’s southern slope, above which rose ash clouds more saturated with ash (lead-colored). In addition, according to an account from Ust-Kamchatsk, at the beginning of the eruption, “a white swirling cloud with a blurred base formed above Sheveluch, from the center of which lightning ran, diverging to the sides in separate branches” [51] (p. 30).
At all altitudes from 300–15,000 m, there were steady westerly and northwesterly winds [6]. As a result, the ash cloud moved east and southeast of the volcano.
When the eruptive cloud reached Ust-Kamchatsk, it was saturated with electricity: the length of linear lightning bolts in it reached from 8–10 m. The bolts were mostly horizontal and most occurred 10–20 m above the land surface [52]. Further, many Ust-Kamchatsk residents saw St. Elmo’s fire [32]. This optical phenomenon means that eruptive ash cloud was supersaturated with electricity, which is characteristic of powerful magmatic eruptions.

3.3. Tephra Deposits and Geological Results of the Catastrophic Eruption

At 20:20 UTC on 11 November, an ashfall began in Ust-Kamchatsk: grain volcanic ash with particles of 1–3 Φ-units, which smelled like sulfuric gases, fell from the cloud. At 20:30 UTC, the ashfall grew stronger, and the grain volcanic ash changed to volcanic dust [51]. The ashfall lasted for more than 3 h, leaving a layer of ash 3–4 cm thick that amounted to 27–28 kg/m2 [32,51]. By 01:00 UTC on 12 November, the eruptive cloud began to move toward the Commander Islands. In Nikolskoye, on Bering Island, the ashfall lasted until 05:30 UTC (4.5 h) and left a 0.2–0.3 cm layer of ash that amounted to 2 kg/m2 [32]. Due to the small amounts of ash, no traces of it remained 20 years later [53].
Near the volcano, an area of 90 km2 was covered by a 20–50 cm thick tephra layer, consisting of large fragments of pumiceous andesite [32]. The ash layer 20 km away from Sheveluch near the Semkorok river was 26 cm thick (pumiceous lapilli and bombs, and volcanic ash); in the Kamchatka River valley, near Cherny Yar (75 km from the crater), it was 3–4 cm (grain volcanic ash with particles of 1–3 Φ-units); in Ust-Kamchatsk (85 km from the volcano), it was 2–3 cm (grain volcanic ash) [54]. The overall area of land and sea covered in ash exceeded 100,000 km2. The overall volume of tephra was 0.3 km3 [32]. In terms of composition, the products of pyroclastic flows of the 1964 eruption belong to andesites, and the ashes of eruptive clouds belong to dacites [32,33,41,54].
Among the tephra particles resulting from this eruption, sampled 60, 71, and 86 km from the volcano, the most common (73–84%) particle size is 0.25–0.5 mm [35]. Regarding the mineral composition, 75–90% of the ash consisted of volcanic glass particles (45–50%) and plagioclase (30–40%) [55].
As a result of the Sheveluch eruption in November 1964, a double 1.5 × 3.0 km explosive crater appeared, replacing the cluster of extrusive domes. This crater opened toward the south; its northern part was oval in shape (1.5 × 1.0 km), and its southern part trapezoidal (2.0 × 2.0 km). The deposit volumes were: directed blast 1.5 km3, pyroclastic flows about 0.3–0.5 km3, and tephra 0.3 km3 [32]. The overall volume of the erupted and displaced material from the 1964 eruption on November 11 amounted to 2.3 km3 [32]. The Volcanic Explosivity Index for this eruption was set at 4+ [56].

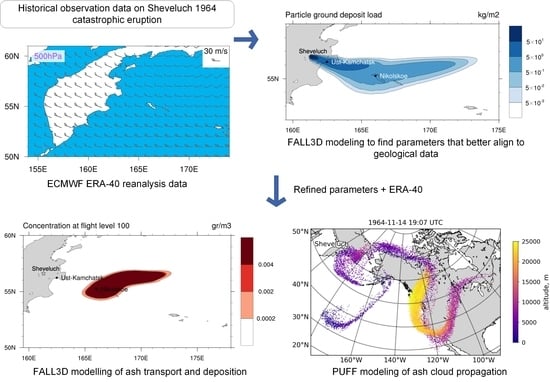
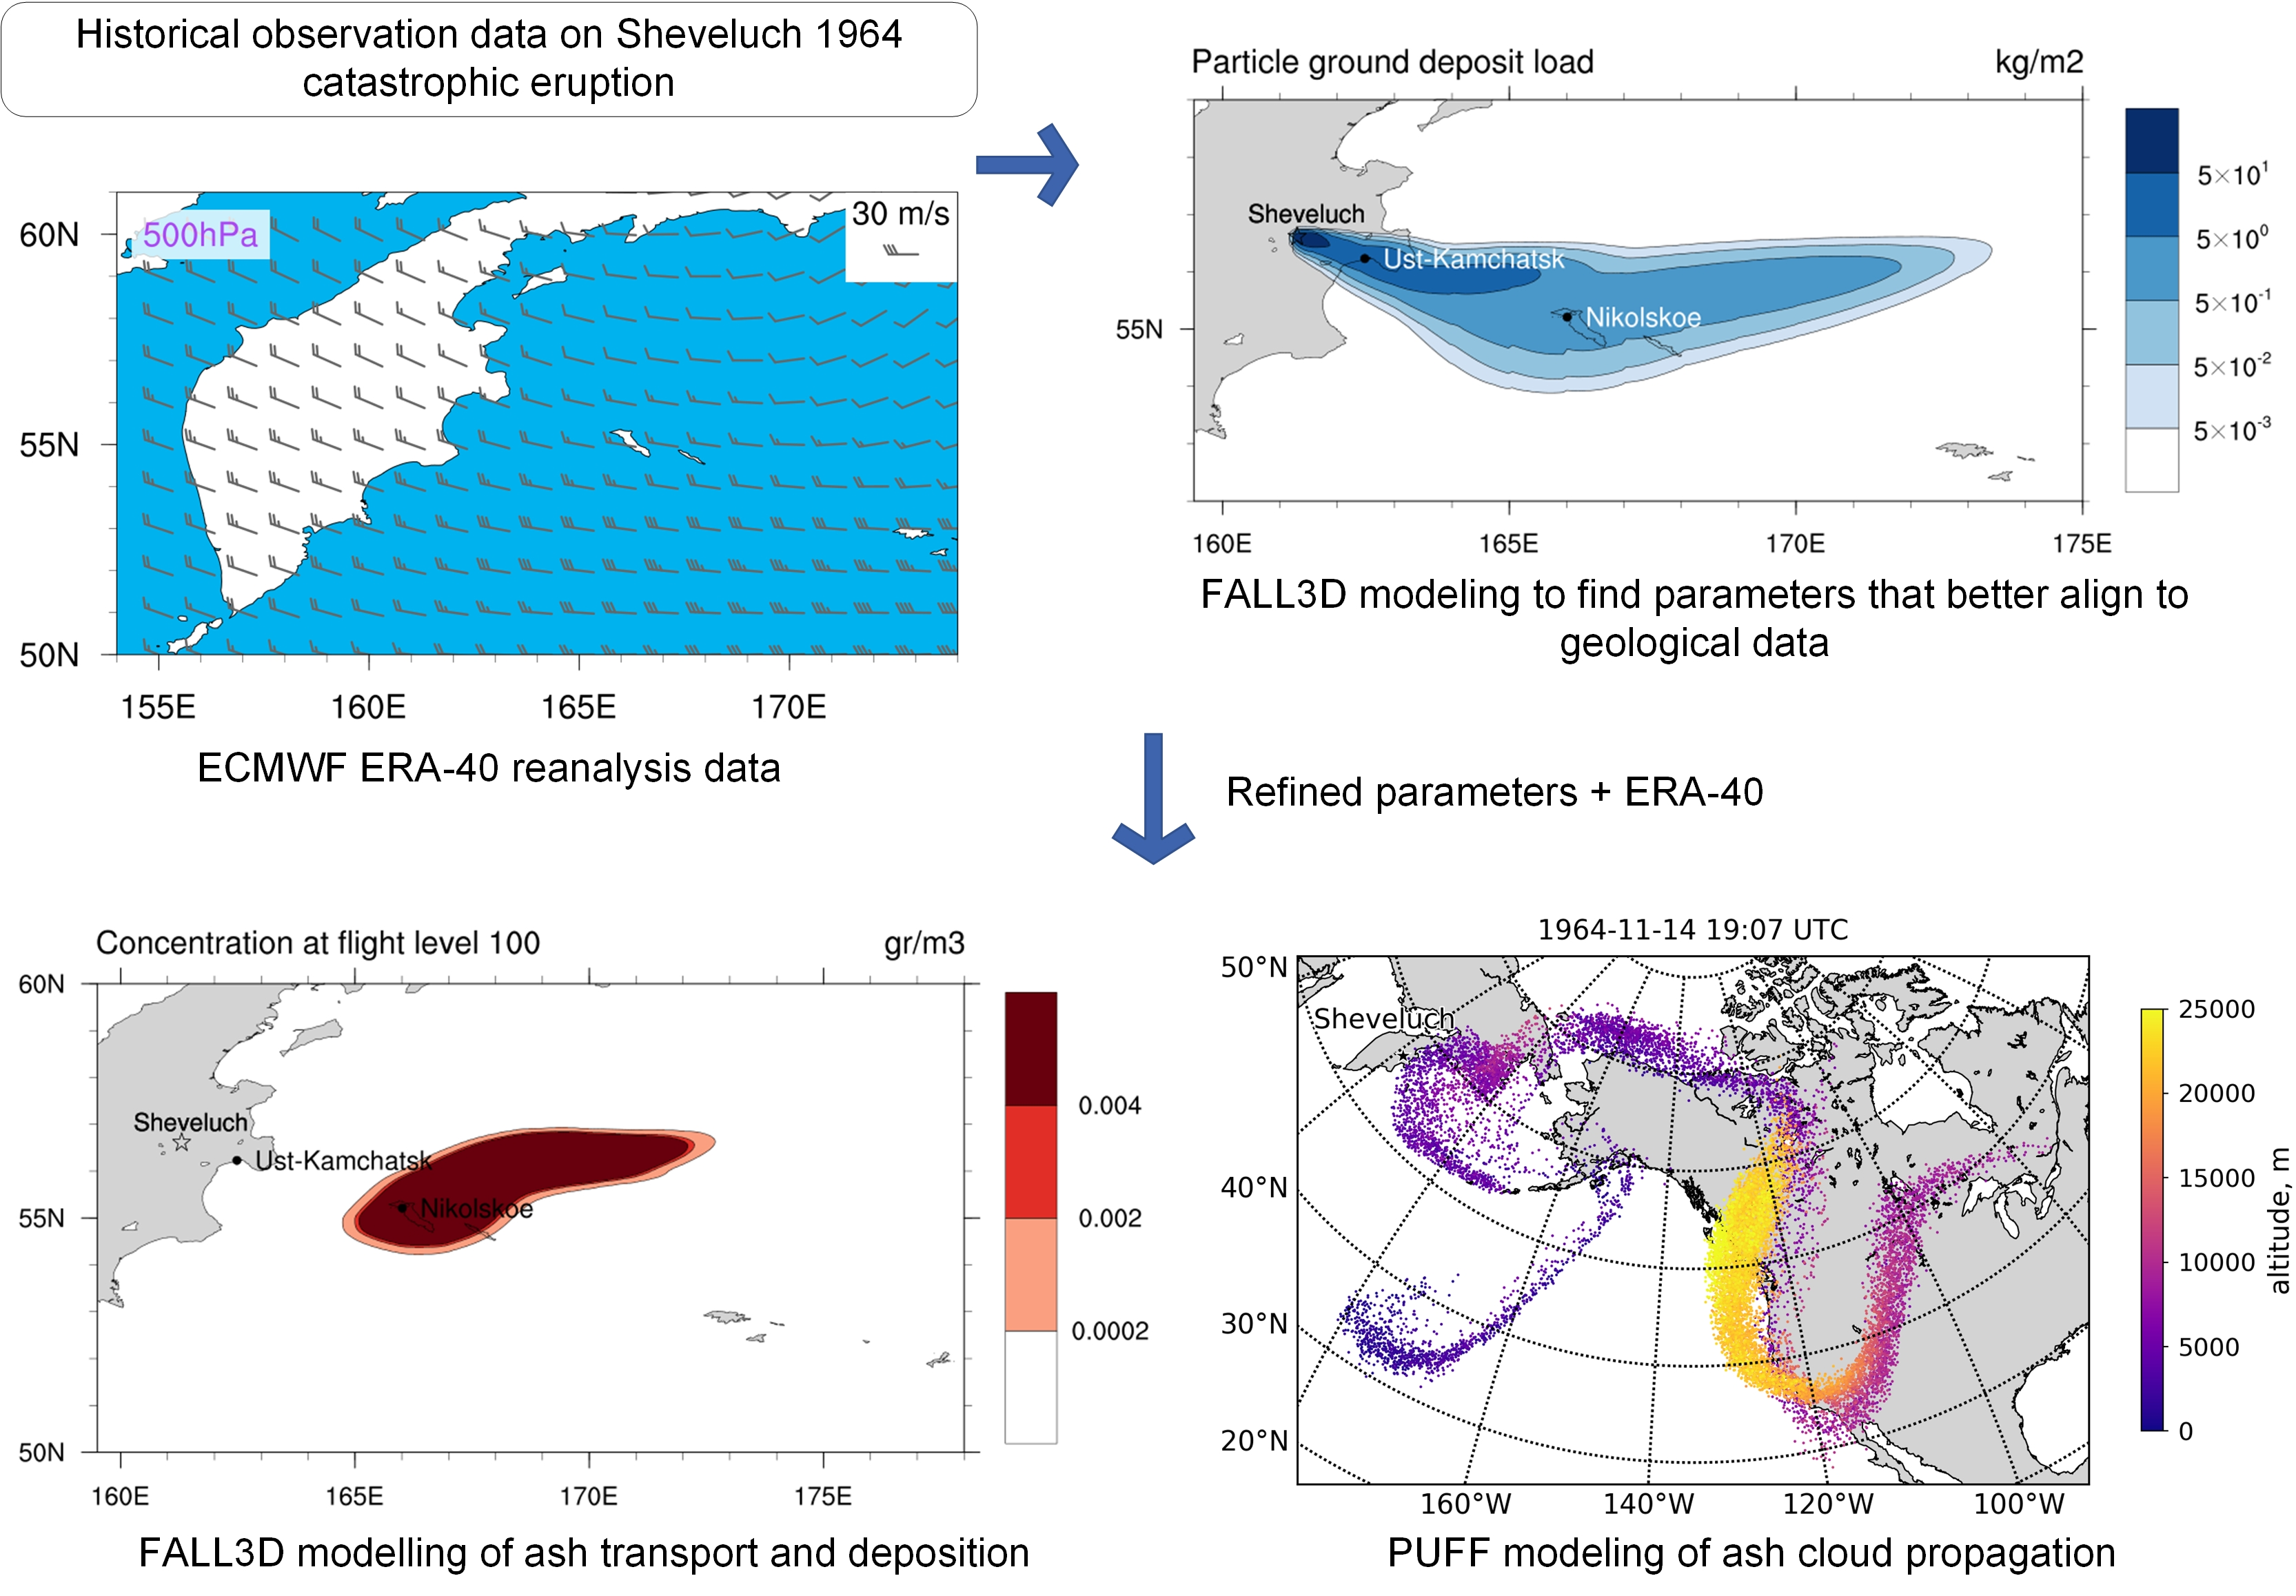
4. Materials and Methods
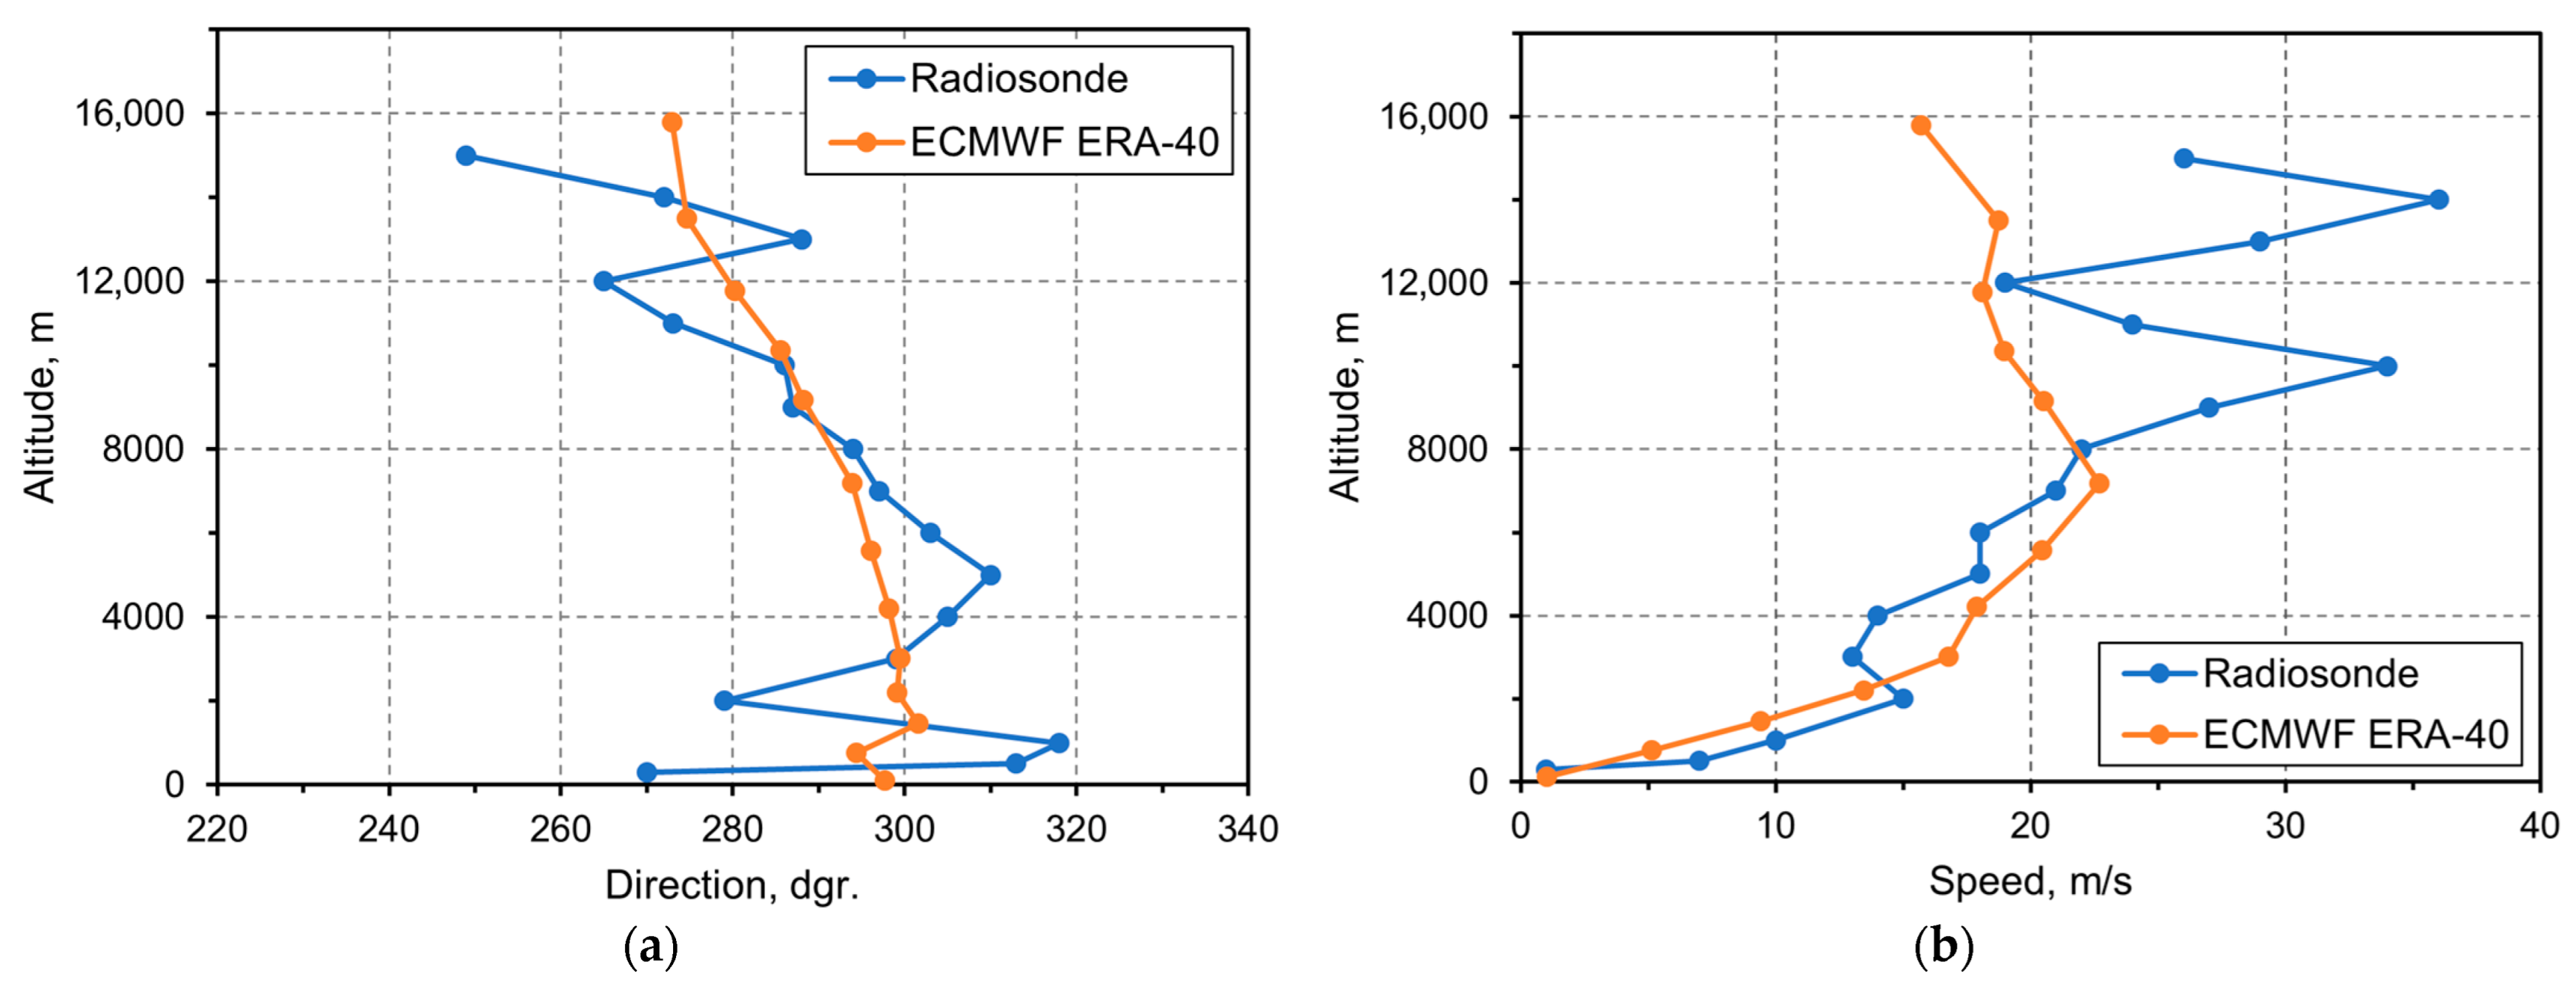
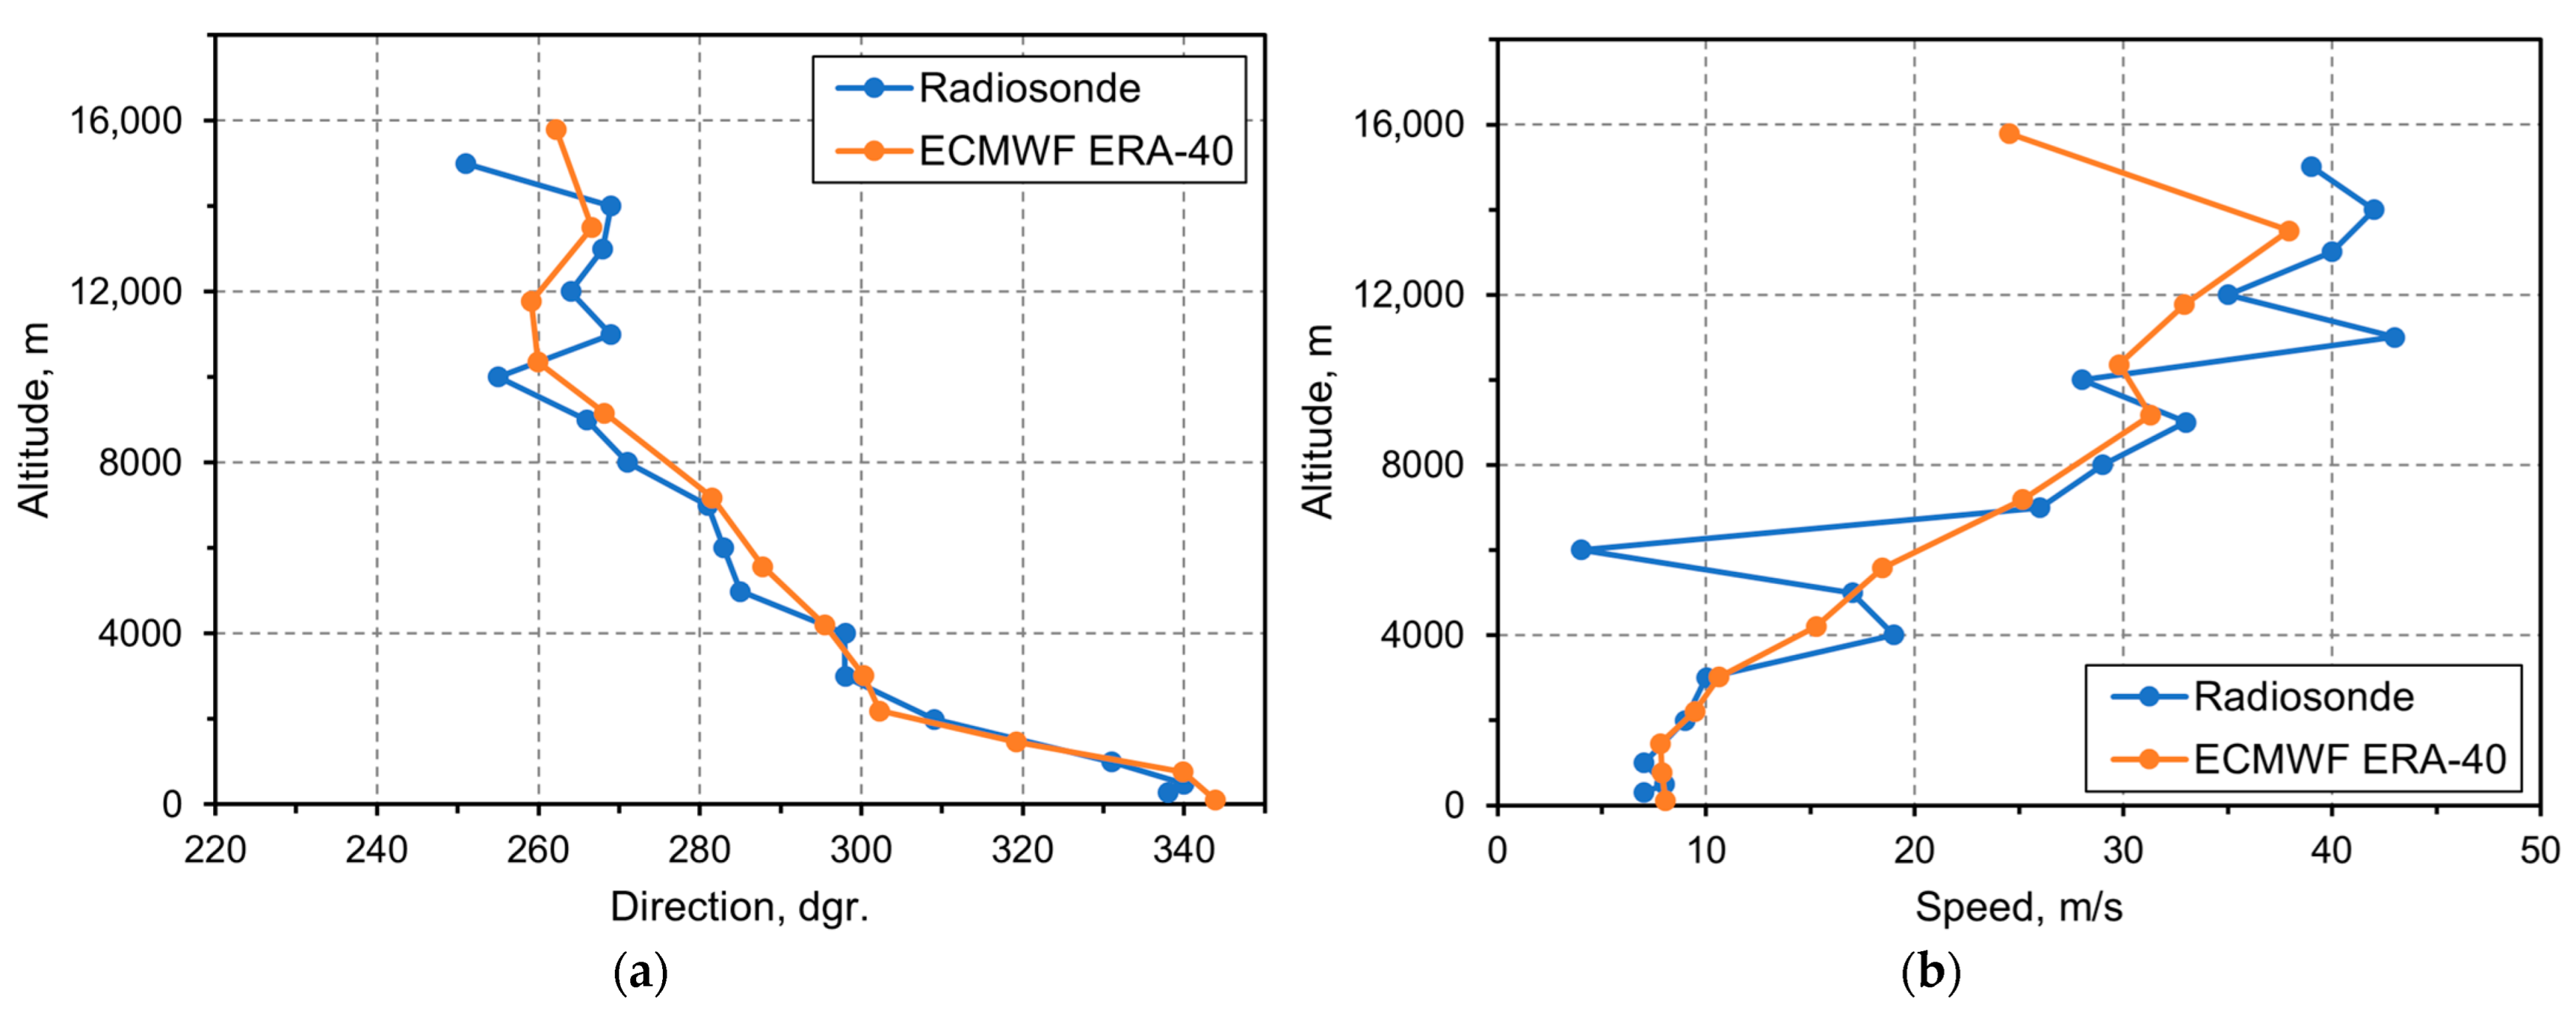
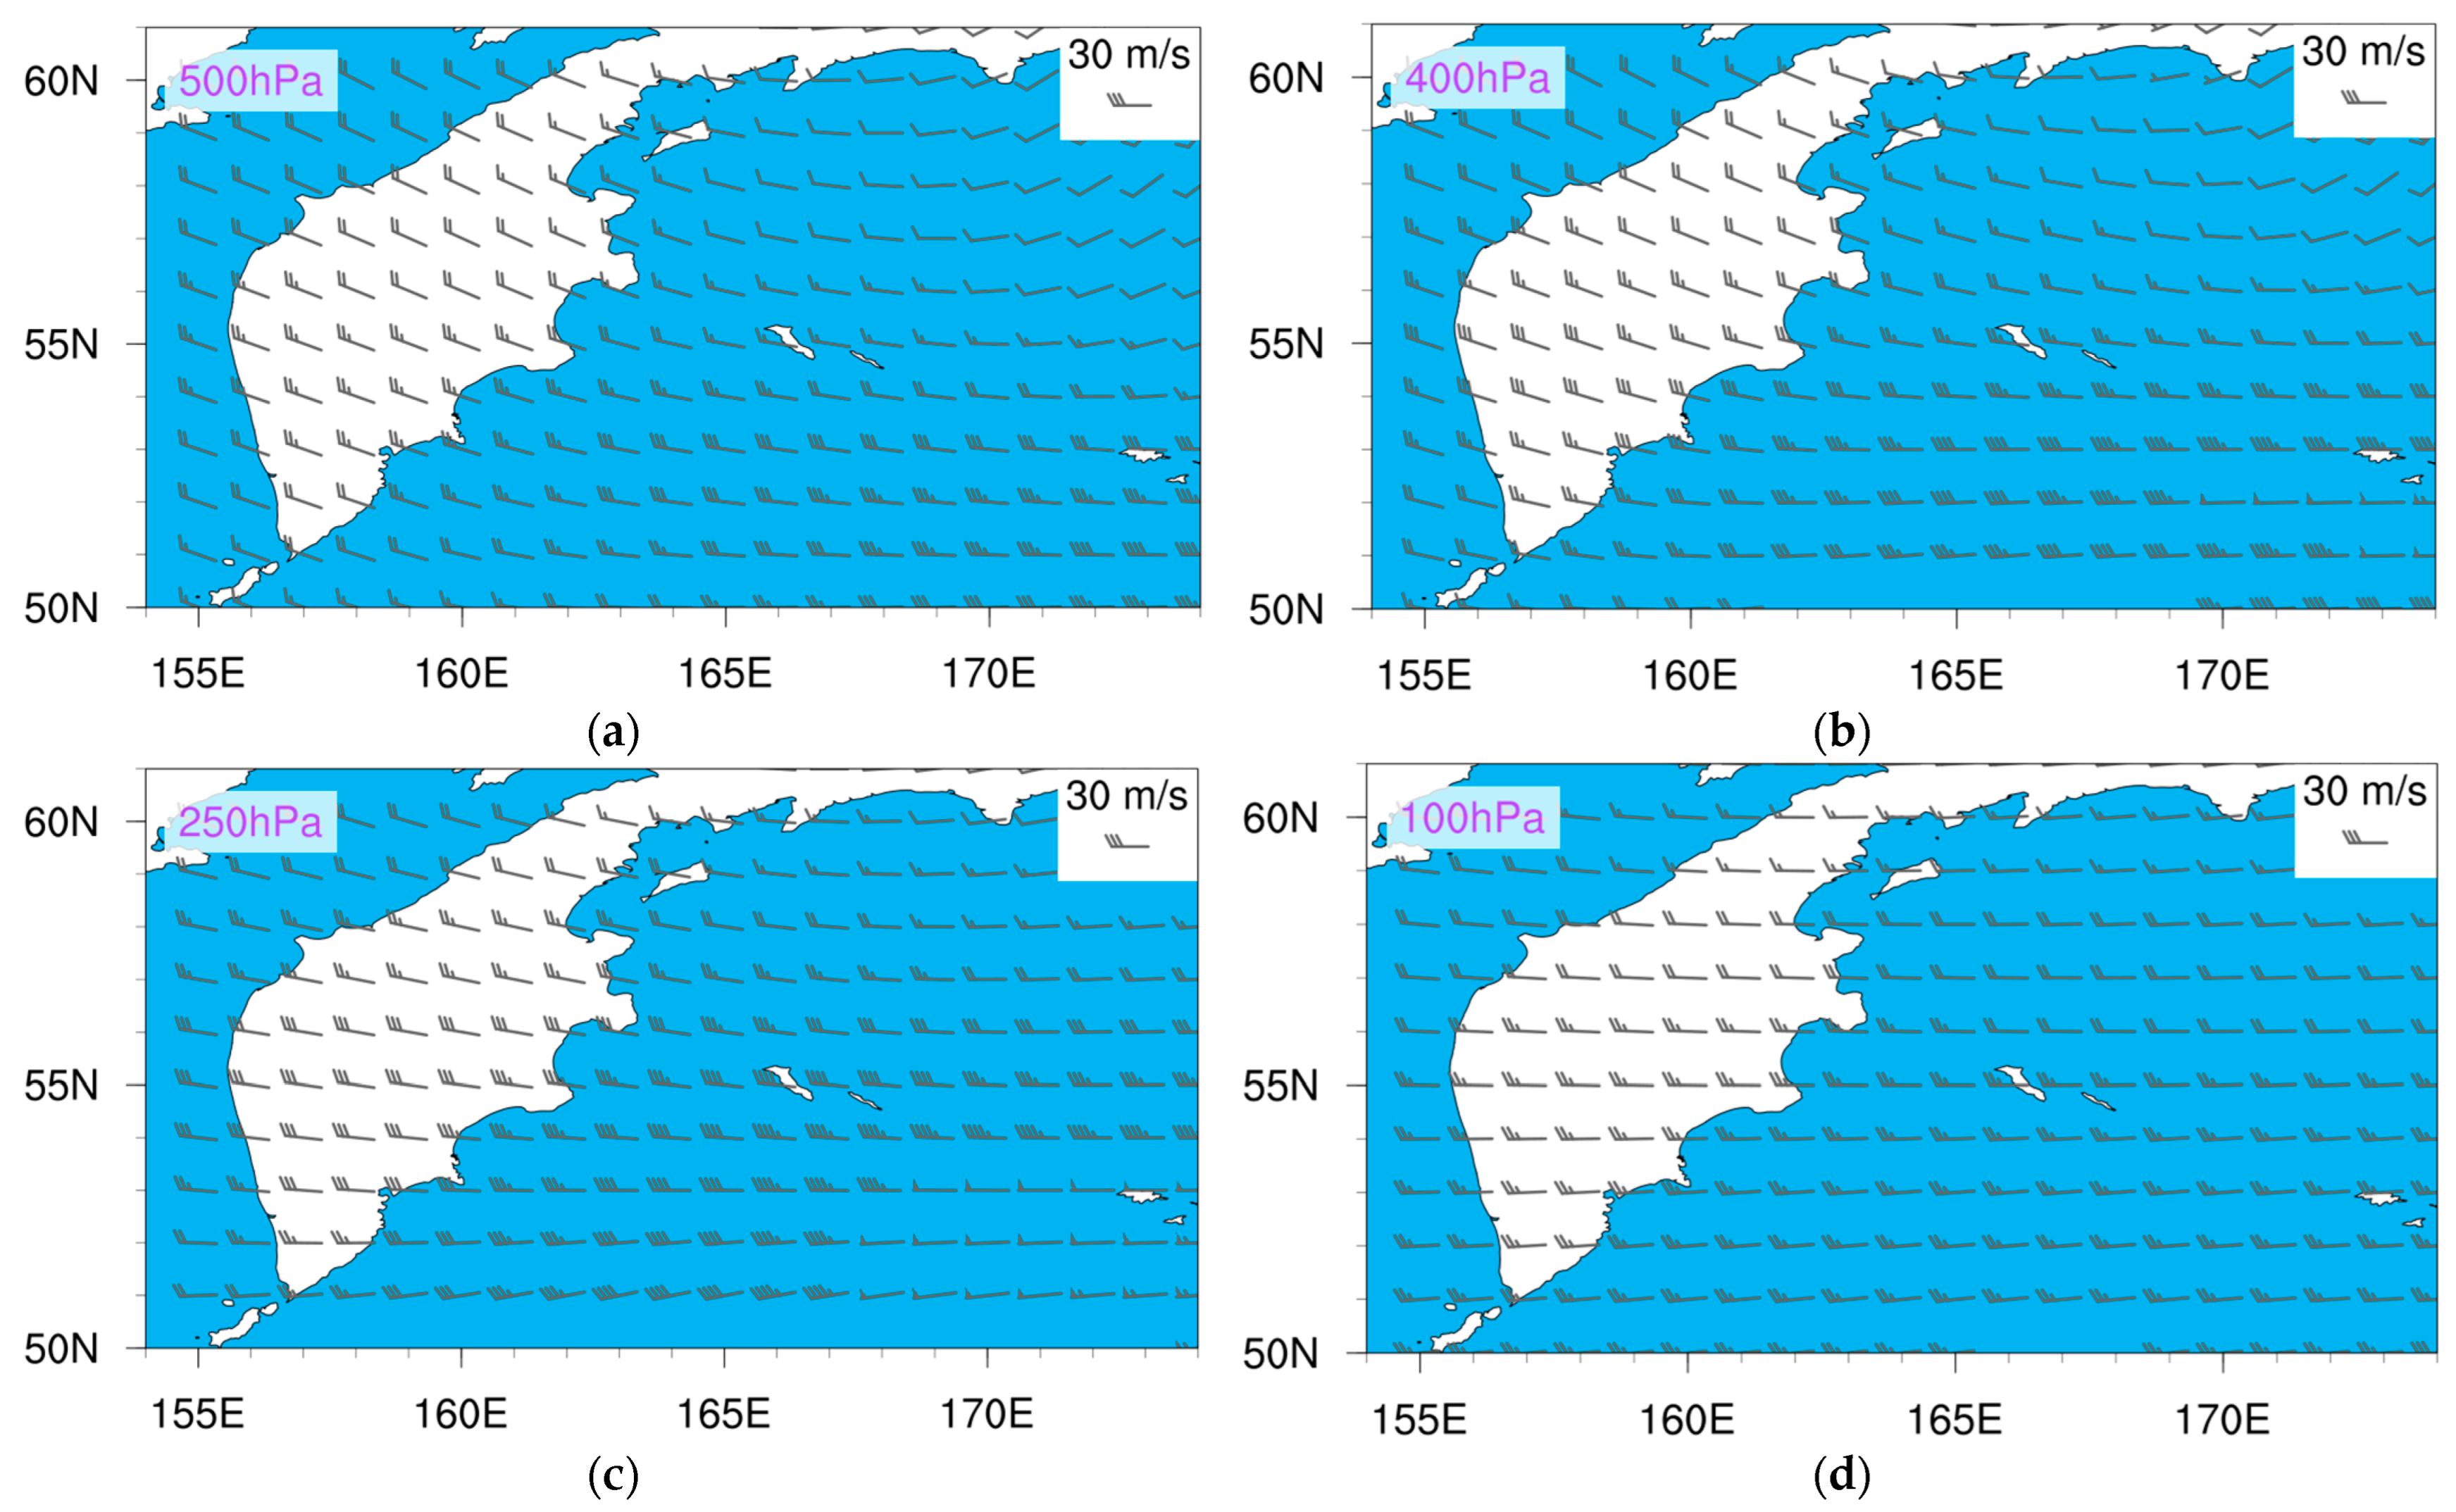
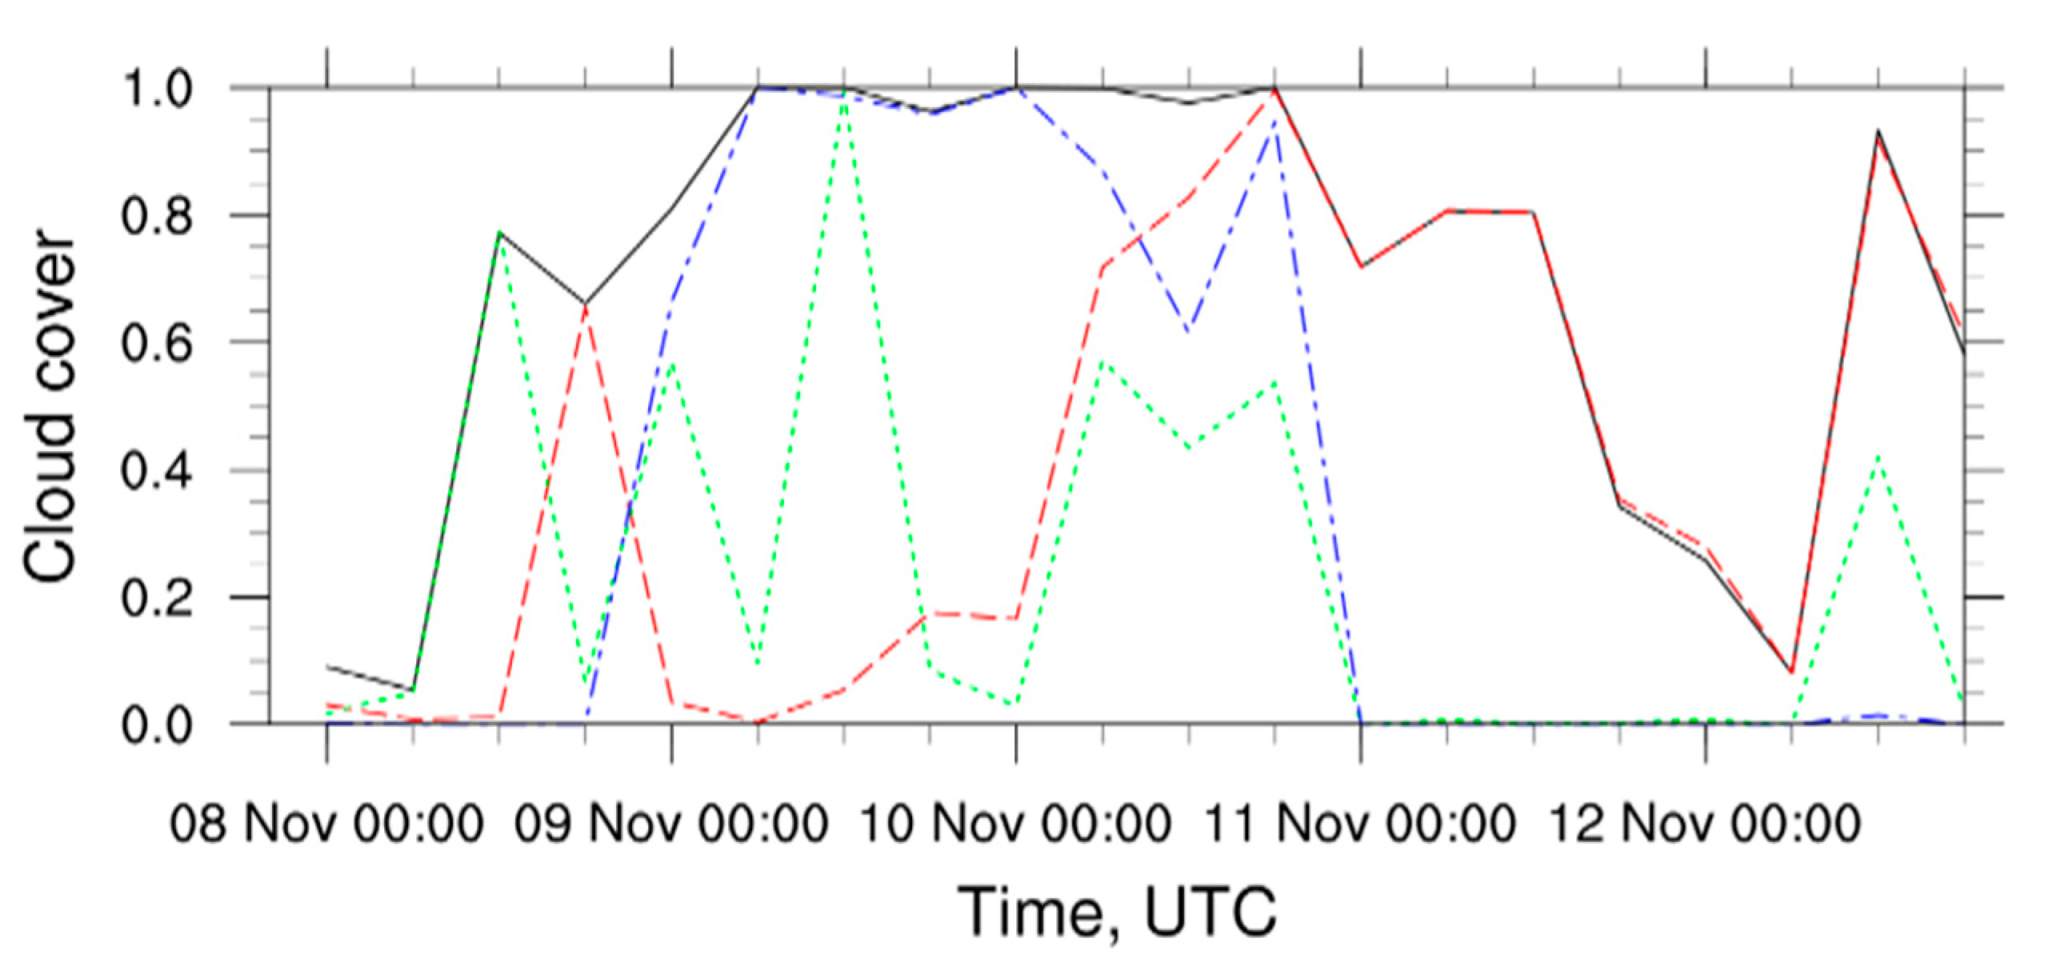
4.1. Weather Data

On the date of the Sheveluch eruption in 1964, there were three weather stations in operation in Kamchatka and in the Isle of Bering (Table 1). These used radiosondes for systematic monitoring of the atmosphere. Table 2 represents the wind direction and speeds during this eruption, recorded by the two weather stations near the volcano.
In this paper, we have used the data from the ERA-40 ECMWF project [19], containing meteorological fields series from September 1957 to August 2002. The available weather data cover the whole world and have a spatial resolution of 1.125° × 1.125°, as well as 23 pressure levels; the time step is 6 h. In our calculations, we use the meteorological fields for 00:00, 06:00, 12:00, and 18:00 UTC for 11–12 November 1964. The visualization of wind fields close to the time of the eruption (18:00 UTC, 11 November 1964) is shown in Figure 3.
Notably, the reanalysis data from ERA-40 ECMWF are well aligned with available atmospheric observations (Table 2). For example, during the eruption, there was only a small low cloudiness around Sheveluch (Figure 4), which allowed the eyewitnesses to watch the development and movement of the eruptive cloud [32,51]. In addition, reliable correlations with wind direction and speed data are evident (Figure 5 and Figure 6).

4.2. Mathematical and Algorithmic Support

We have used the FALL3D [22] and PUFF [57,58] models to simulate the eruptive cloud propagation of the Sheveluch explosive eruption on 11 November 1964.
The FALL3D models were used to restore the initial parameters of the explosive event, and to model the movement of the ash cloud during the first 17 h after the eruption began. This Eulerian model helps determine not only the ash particle concentration in the atmosphere, but also the ash deposit parameters (thickness, grain-size composition, and so on). Using FALL3D, we determined the total grain-size distribution of ash, and both the mass flow rate (MFR), and the nature of the ash distribution in the eruptive column.
During the calculations, we initialized the main parameters of FALL3D with the values shown in Table 3. We used a mesh with a resolution higher than that of the weather data, because we needed to reduce the impacts of numerical diffusion on the calculation results, which is typical for the Eulerian models. The particle aggregation and their wet deposition were not considered.
As the Eulerian model has significant numerical diffusion, we chose the Lagrangian PUFF model, which does not have this shortcoming, to study the atmospheric transfer of the fine ash component during the three days after the eruption. In addition, we selected this model because the PUFF modeling results of the ash cloud movement of the modern volcanic eruptions in Kamchatka and the Kuril Islands are regularly compared with satellite data in the VolSatView Information System [38,39]. As a rule, there are good matches between “model ash clouds” and the real ones recorded on satellite images, e.g., [61,62,63]. The parameters used in modeling are shown in Table 4. We calculated the vertical diffusion coefficient value based on the results obtained using FALL3D.

4.3. The Recovery of Explosive Eruption Parameters

The main unknown parameters of the 1964 explosive eruption that affect the accuracy of the ash cloud movement modeling are: the total grain-size distribution of the ash; the mass flow rate; and the vertical mass distribution in the eruptive column. To restore these, we varied the indicated parameters and compared the simulation results with the real geological data. The remaining parameters were assumed to be known and did not change from calculation to calculation. These included: eruption date, time, and duration; volcano height (2500 m); maximum ash cloud lift above the crater (12,500 m); rock density (2700 kg/m3), and particle sphericity (0.8–0.5).
It is known that the ash cloud was mushroom-like in shape. It was assumed that the vertical mass distribution inside the eruptive column followed the Suzuki distribution [64], i.e., the vertical mass distribution function has the following form [26]:
S ( z ) = [ ( 1 z H ) e A ( z H 1 ) ] λ
where z is the altitude in the eruption column, H is the maximum plume height. Distribution parameter A, which is responsible for the vertical position of the maximum concentration relative to the maximum height of the column, was set to 4 [26]. Distribution parameter λ—which describes how close the mass is concentrated to this maximum—was clarified in numerical experiments. Total grain-size distribution of the ash was a bi-lognormal; its parameters were calculated using the empirical formulae proposed in paper [24], which uses the viscosity of the magma. As the viscosity of the magma, erupted by Sheveluch in 1964, was undetermined, we assumed this parameter to be equal to those of other volcanoes. The average content of SiO2 in the Sheveluch ash of 1964 ranges from 58–60%, and that of rock-forming minerals amounts to 55–60% [54,55]. According to the petrographical and geochemical characteristics, the most nearly identical volcanics for the Sheveluch tephra of 1964 can be the eruptive products of the Komagatake volcano (Hokkaido) [65]. Therefore, we used the known viscosity of the Komagatake volcano rocks in our model (magma viscosity of 1.26 × 10⁴ Pa·s) [65]. The obtained distribution parameters required further clarification, as the coefficients used in the formulae were significantly uncertain.
We used the ash sampling point coordinates as the base points to assess the model eruptive cloud parameters, including Cherny Yar in the Kamchatka River valley (Kamchatka; 162.2911E, 56.2506N), Nizhnekamchatsk (Kamchatka; 162.0225E, 56.2444N), Ust-Kamchatsk (Kamchatka; 162.4828E, 56.2336N), and Nikolskoye (the Isle of Bering, Commander Islands; 166.0128E, 55.2067N). The following parameters were considered: in Cherny Yar and Nizhnekamchatsk, the grain-size composition of the ash samples (Table 5); in Ust-Kamchatsk, the ash grain-size composition and the ash amount in kg/m2, and in Nikolskoye, the ash amount in kg/m2.
As these volcanic ash samples did not include any particles with diameters >0.5 mm (<1 Φ-units), bi-lognormal distribution parameter p for the initial particle size content of the tephra determining the proportion of the large particle fraction (<2 Φ-units) was reduced to the minimum possible value of 0.24. After that, we used various modes (μ) and standard deviations (σ) for large and small particle fractions, as well as the mass flow rate. We then achieved correlations between the ash amount in kg/m2 in the base points and the observation results for distribution parameter λ of the Suzuki distribution, which equaled 0.5 (close to uniform distribution of ash along the height). Then we performed similar operations for all the values of the parameter in question that were below or equal to 2.5 at an increment of 0.25. This led to an increase in the ash concentration around the area located at 3/4 of the maximum column height (specified by parameter A). The further increase of parameter λ resulted in significant discrepancies between the modeling results and the actual data that could not be overcome by varying the remaining model parameters. Thus, values above 5 for parameter λ were rejected as contradicting the observations.
Our experiments showed that the mass fractions in the modeled and natural ashes with λ up to 1.5 were quite similar. When λ was increased further, model and actual data began to diverge. Thus, 1.5 is the most suitable value of λ. With this value, the mass of the largest ash particle fraction (0.25–0.5 mm) (2–1 Φ-units) present in the samples from Cherny Yar and Ust-Kamchatsk differs from the mass determined through modeling, by up to 8.5%. In the samples from Nizhnekamchatsk, this discrepancy reaches 32%, probably due to the varying locations of the ash sampling points relative to the eruptive cloud propagation axis.
Although Cherny Yar (75 km from Sheveluch, azimuth from the volcano—109°), Ust-Kamchatsk (85 km from Sheveluch, azimuth from the volcano—109°), and Nikolskoye (334 km from Sheveluch, azimuth from the volcano—107°) are almost located on the same line, over these areas, the ash cloud passed its axial part. Meanwhile, Nizhnekamchatsk (62 km from Sheveluch, azimuth from the volcano—120°) was in the side zone of the ash cloud; we conclude this because the mass of the coarsest fraction is greater here (Table 5). For the finest fractions, with particle sizes of <0.063 mm (>4 Φ-units), the discrepancy amounts to 1–2 orders.
As the content of ash particles in the upper part of the ash cloud increases—as the λ of the Suzuki distribution increases from 0.5 to 5—the MFR value required for the modeling results to comply with the observations also increases. Thus, if λ = 0.5, the MFR = 1.62 × 10⁸ kg/s; if λ = 5, the MFR = 4.92 × 10⁸ kg/s, and if λ = 1.5, the MFR = 1.7 × 10⁸ kg/s, and the overall volume of the tephra amounts to 0.26 km3. This value correlates well with the tephra volume provided in [32]. Notably, the existing empirical formulae allow for calculation of the MFR using the maximum lift of the ash cloud, reducing this value by 1–2 orders: MFR = 5.42 × 10⁶ kg/s [25]; MFR = 4.52 × 10⁷ kg/s [66], and MFR = 7.91 × 10⁶ kg/s [67].
Thus, we used numerical modeling to determine the following explosive eruption parameters, which best correlate with the observations:
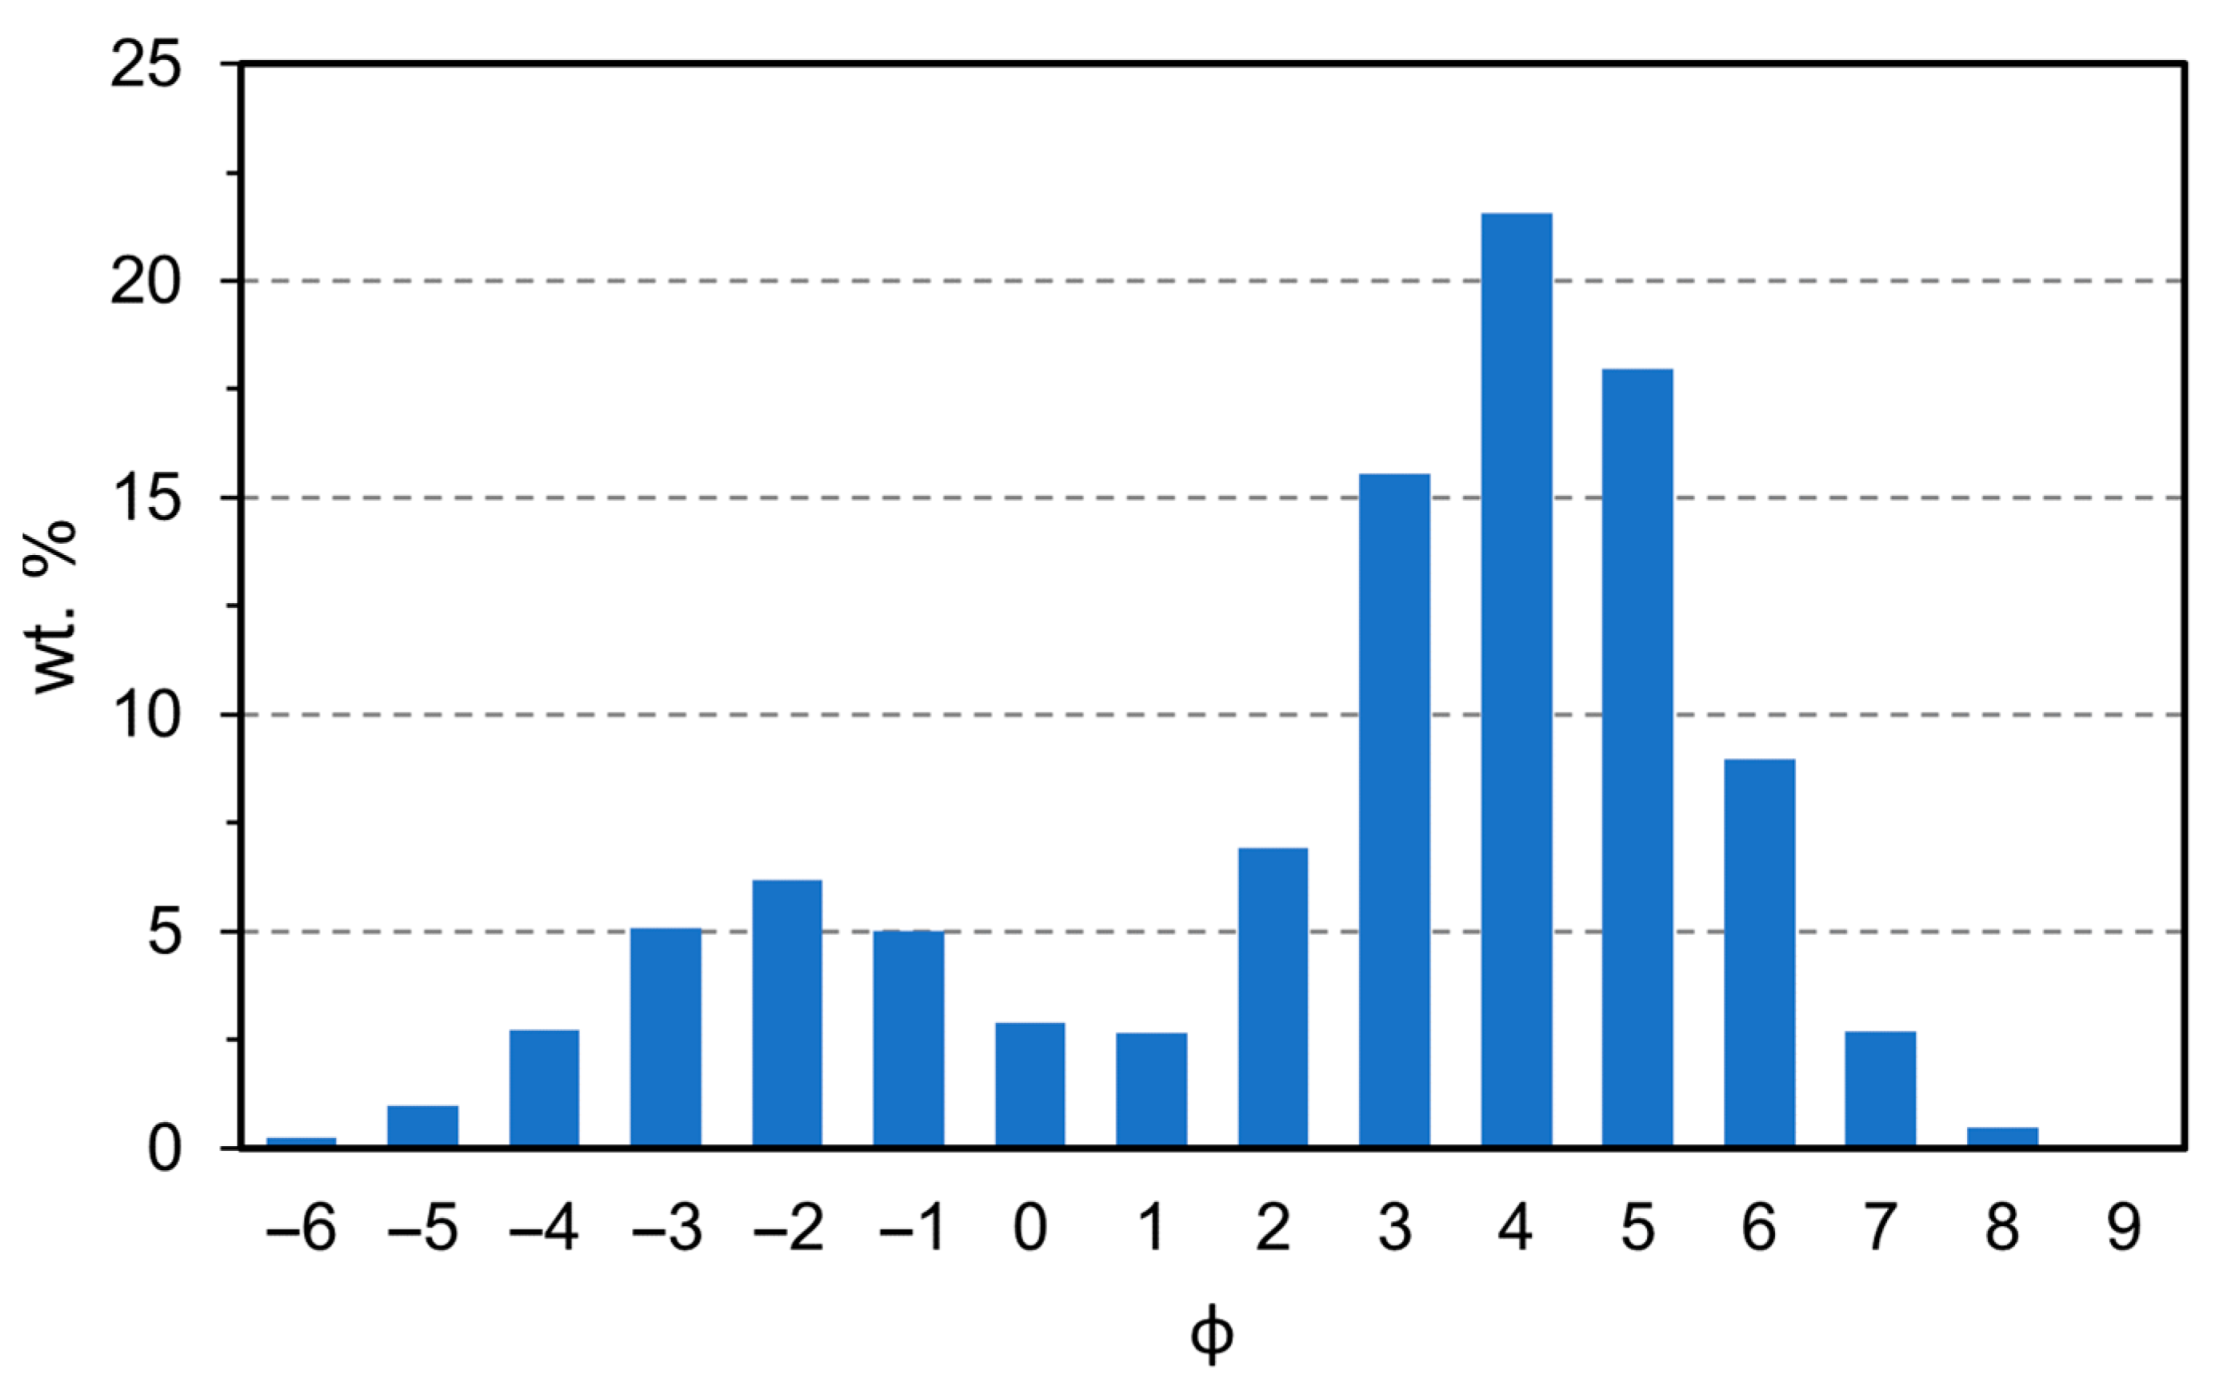
  • bi-lognormal distribution parameters for the total grain-size distribution of the ash (μ and σ in Φ-units): μ 1 = 2.025 ,   μ 2 = 4.143 ,   σ 1 = 1.545 ,   σ 2 = 1.4 ,   p = 0.24 (Figure 7);
  • Suzuki distribution parameters: A = 4, λ = 1.5;
  • the mass flow rate: 1.7 × 10⁸ kg/s.
The obtained Sheveluch explosive eruption parameters, together with the parameters of the FALL3D and PUFF models mentioned in the previous sections, were used in the calculations whose results are considered below.

5. Results

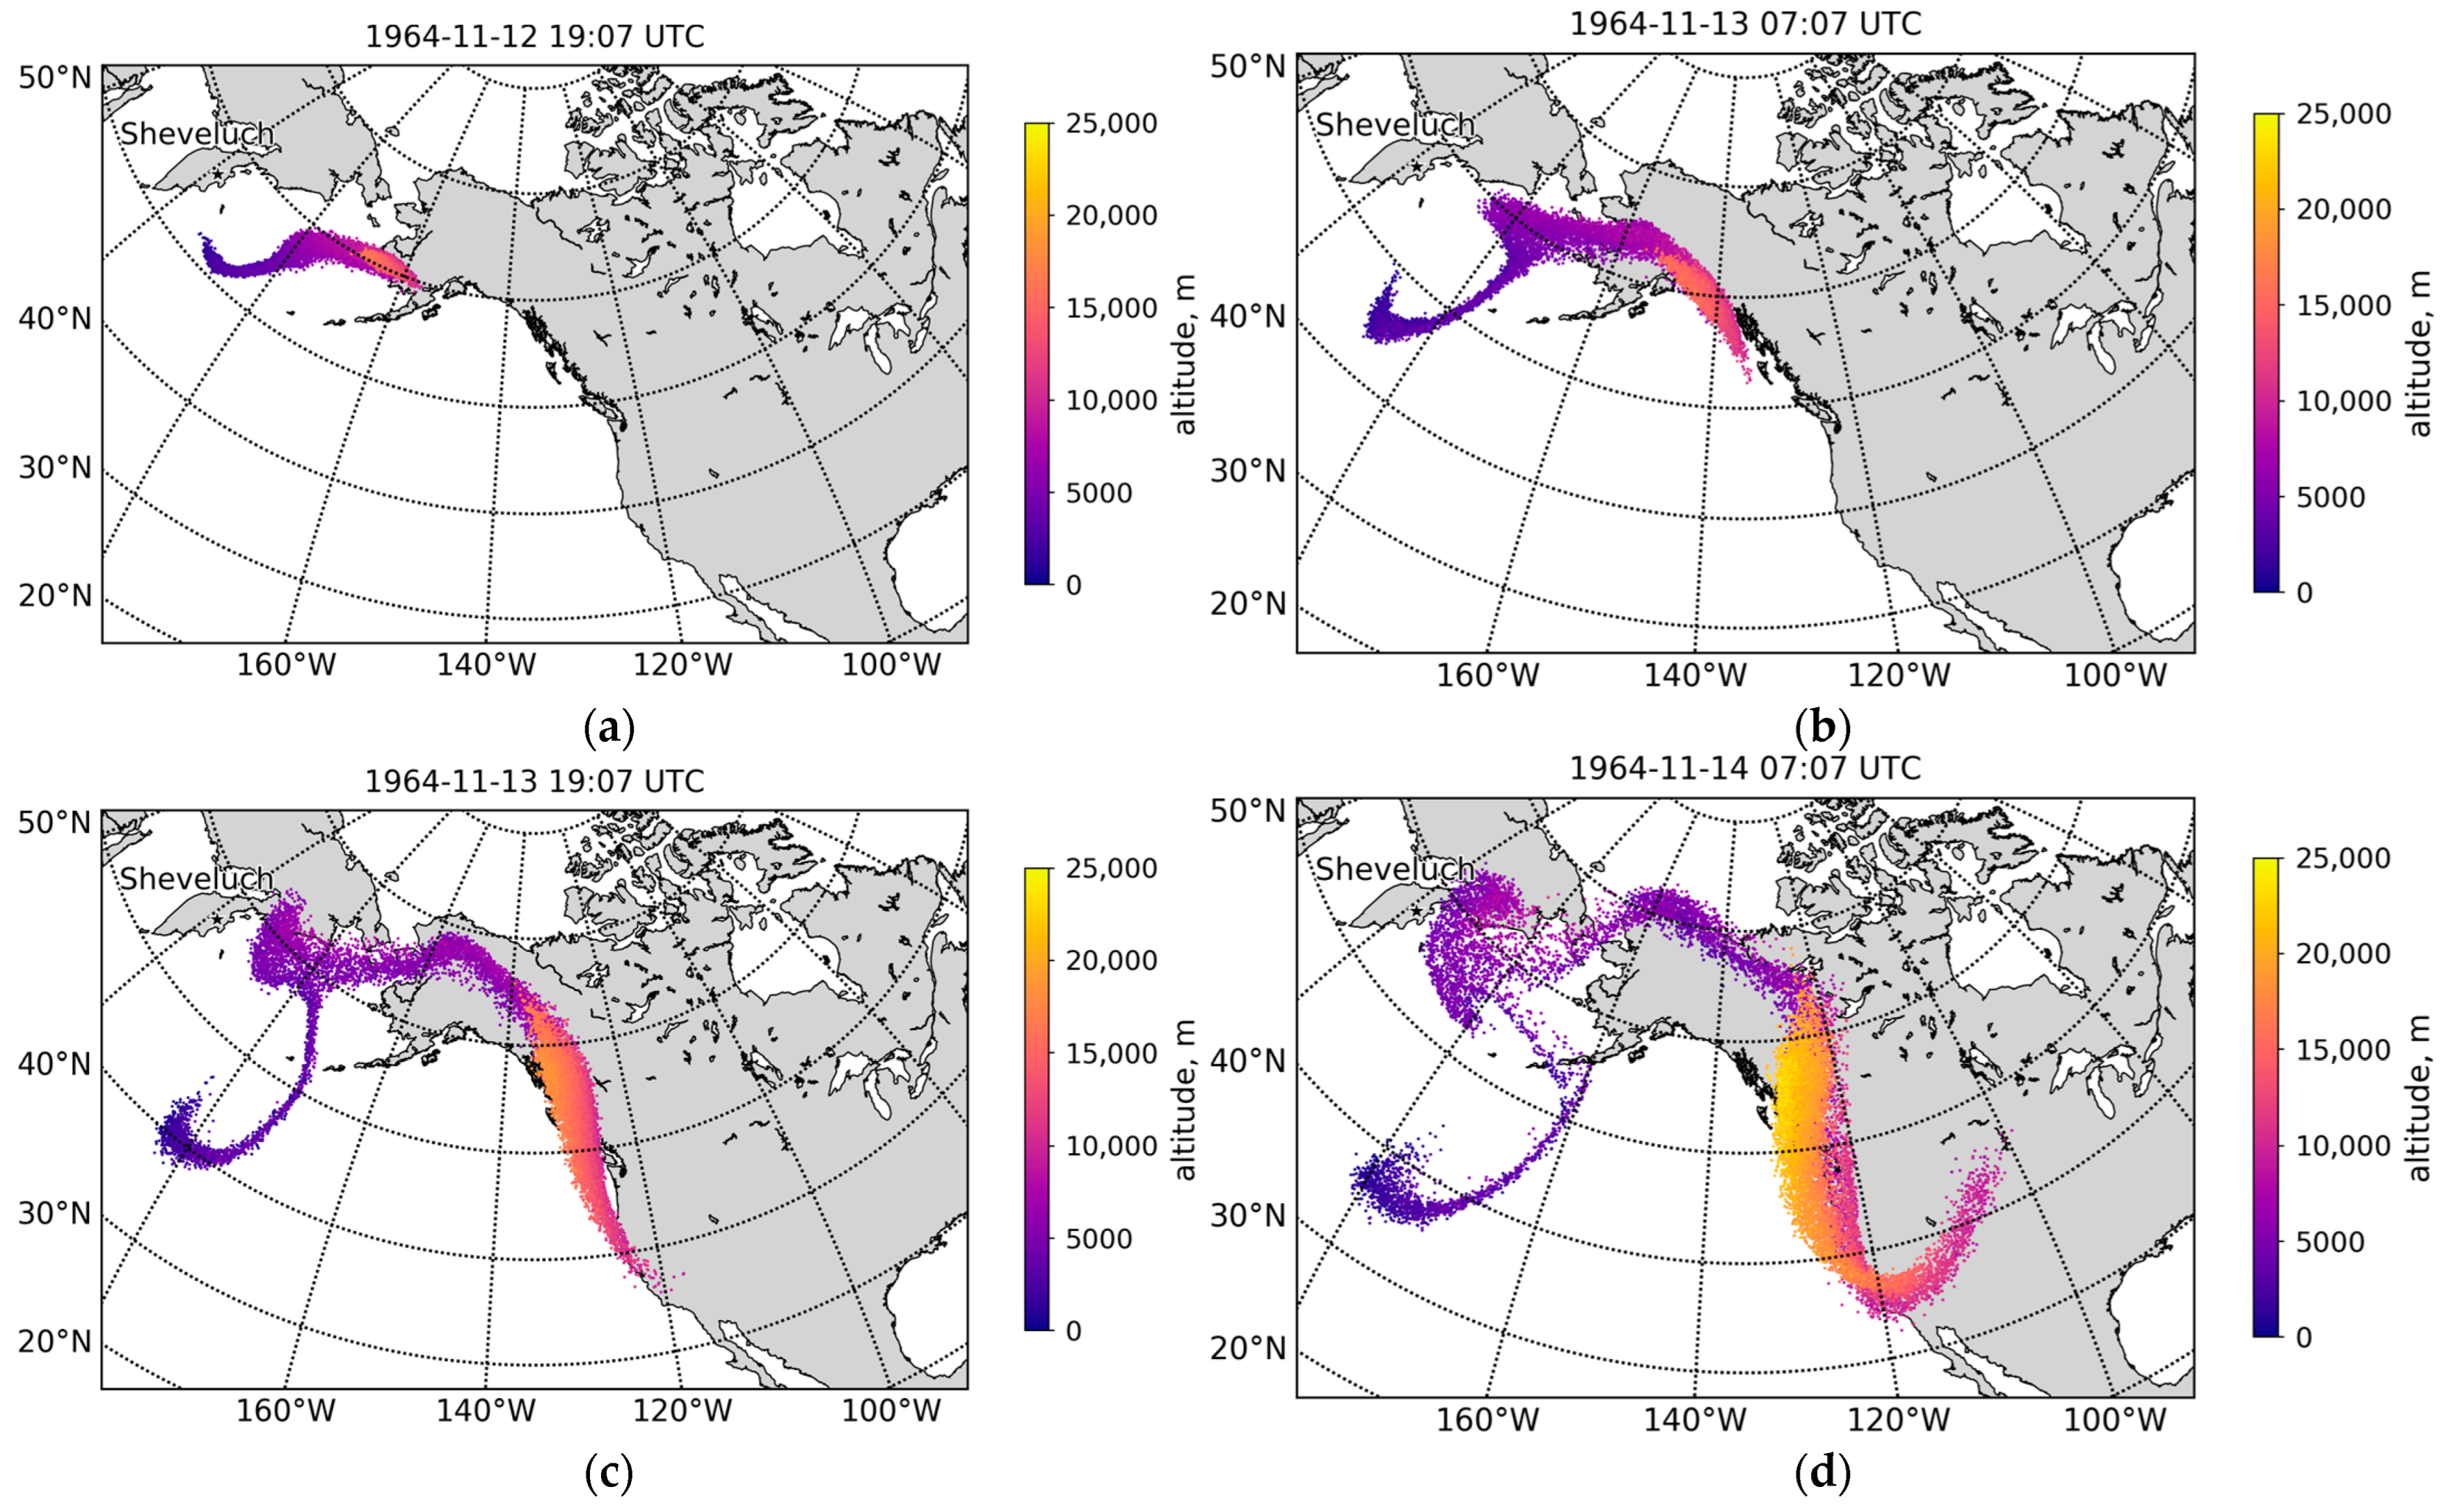
5.1. Ash Cloud Propagation

According to the modeling results, the mushroom-like ash cloud formed above Sheveluch on 11 November 1964, at a maximum height of 15,000 m a.s.l., 7–8 min after the eruption began. Due to the differing wind speed and direction at various altitudes (Figure 3), the cloud split into two uneven parts, upper and lower (Figure 8 and Figure 9).
The lower part of the cloud contained more large ash particles: these fell quickly from the cloud to the ground due to gravity. Moving southeast from the volcano, this ash cloud caused ashfalls in Ust-Kamchatsk and Nikolskoye. Moving above Ust-Kamchatsk, the upper edge of this cloud reached an altitude of 12,500 m a.s.l. (Figure 8b); when it passed Nikolskoye, it was 5500 m a.s.l. (Figure 9b). At the same time, the highest concentration of ash particles in the cloud above Ust-Kamchatsk was observed at an altitude of 4000–6000 m a.s.l., and at 2500–3000 m a.s.l. above Nikolskoye. The upper part of the eruptive cloud proper, depleted in large ash particles, moved east and east-northeast of the volcano (Figure 8 and Figure 9). Due to turbulent diffusion, the cloud’s head slowly rose through the atmosphere and reached 16,000 m a.s.l. by 21:37 UTC, 11 November (Figure 8c), and reached 16,500 m a.s.l. by 04:07 UTC, 12 November (Figure 9c).

5.2. Ashfall Deposits

The different parts of the eruptive cloud were sources of ash in Ust-Kamchatsk (Figure 2b). Figure 10 shows the mass percentages of ash deposited from the parts of the eruptive column that was 1000 m thick with the same mass at various altitudes above the volcano during the initial stage. The results indicate that the main sources of ash deposited in Ust-Kamchatsk included the two parts of the eruptive cloud that were located 0–4000 m and 5000–9000 m above the volcano. Mainly large ash particles (2–1 Φ-units) fell from a cloud located at altitudes of 5000–9000 m. The ash from the 0−4000 m layer mostly contained fine particles (>4 Φ-units), as larger ash particles had already left the ash cloud when it reached Ust-Kamchatsk. Due to the higher wind speed at greater altitudes (Figure 3), the upper part of the eruptive cloud moved faster than the lower, which explains the domination of large particles at the beginning of the ashfall in Ust-Kamchatsk.
Notably, the ashfall start and end time in Ust-Kamchatsk (20:20 and 23:22 UTC, 11 November) essentially corresponds to the ashfall start and end times (20:22 and 23:22 UTC, 11 November) determined by our calculations (Figure 11). The start of the ashfall in Nikolskoye (the Isle of Bering) recorded at 01:20 UTC, November 12 [51] is close to the time produced via modeling, 01:37 UTC. Moreover, the ashfall end times in Nikolskoye based on published and modeled data are quite different, 05:30 and 06:37 UTC respectively (Figure 12). Some discrepancy in ashfall end times can be explained by the numerical diffusion effect; this is typical for the model we used. However, we know from the experience that it is challenging to determine the exact ashfall end time precisely. The source of the ash deposited in Nikolskoye was the eruptive cloud that reached an altitude of 4000–7000 m above the volcano crater (Figure 10).

5.3. Aerosol Ash Clouds

According to the PUFF modeling results (Figure 13 and Figure 14), the upper part of the ash cloud, being at an altitude of about 16,800 m a.s.l., reached the Alaska Peninsula 24 h after the eruption began (Figure 13a). After that, the cloud began to stretch toward the east and from north to south. The eastern part of the ash cloud began moving to the southeast, the central part moved to the west, and the western part moved to the southwest (Figure 13b). By 19:07 UTC, 13 November, the eastern part of the cloud stretched along the west coast of North America, while its western part remained above Alaska and the Bering Sea (Figure 13c). During the 48 h after the eruption began, the ash cloud crossed the 40th parallel and reached California. The highest altitude the ash cloud reached during that time was 19,000 m a.s.l. (Figure 13c). By 07:07, 14 November, the ash cloud reached the northern coast of Alaska and inland into Canada, covered the west coast of the USA, and began shifting toward the central part of North America (Figure 13d). Three days after the eruption began, the ash cloud, now shaped like an enormous π and spanning 3000 km, covered the territories of Russia, Canada, USA, and Mexico, as well as the Bering Sea and the Pacific Ocean (Figure 14). By then, the maximum altitude of the ash cloud was up to 26,000–27,000 m a.s.l.

5.4. Aviation Hazard

The ash clouds pose a significant hazard to modern jet aviation. It is widely understood that flights are safe in these conditions if the concentration of ash particles in a cloud is less than 0.2 mg/m3 (normal zone); flights are allowed with precautionary measures, if this concentration is between 0.2–4 mg/m3, and flights are prohibited from a “no-fly zone” in areas with ash concentration above 4 mg/m3 [68]. To assess the potential hazard that the 1964 Sheveluch catastrophic eruption posed to flights in the Kamchatka region, we visualized the volcanic ash concentrations in eruptive clouds (Figure 15). An analysis of the obtained data shows that 9 h after the eruption began, an extensive “no-fly zone” formed at all flight levels in the east of Kamchatka. Simultaneously, the west wind continued to move this cloud into areas through which busy international air routes currently pass (Figure 15b).

6. Discussion

This experiment carried out the determination of the eruptive cloud movement dynamics of the 1964 Sheveluch catastrophic eruption using numerical simulation methods for the first time. According to the modeling results, the eruptive column rose into the stratosphere and transformed into a mushroom-like cloud. Due to the different wind speeds and directions at various altitudes, the cloud split into two uneven parts: upper and lower (Figure 9a). The modeling results helped explain the difference in the grain-size ash composition—a change of grain volcanic ash (2–1 Φ-units) to fine ash (>4 Φ-units))—during the ashfall in Ust-Kamchatsk (Section 3.3 and Section 5.2).
The modeling results and the geological data showed similar numerical parameters. For example, the ashfall start and end times in Ust-Kamchatsk (20:20 and 23:22 UTC, 11 November 1964) essentially correspond to the ashfall start and end times (20:22 and 23:22 UTC, 11 November) determined by the calculations (Figure 11). The ash amount that fell in Ust-Kamchatsk was 27–28 kg/m2 according to the geological data [32], and 27 kg/m2 according to the modeling data (Figure 11). The amount of deposited ash in Nikolskoye was 2 kg/m2 per both the geological data [32], and the calculated data (Figure 12). According to the modeling data, the total volume of the tephra was 0.26 km3, which correlates well with the tephra volume (0.3 km3) from [32].
Furthermore, the close similarity of the numerical parameters obtained via geological methods and modeling made it possible to simulate the probabilistic propagation of the aerosol cloud of the 1964 Sheveluch volcano eruption (Section 5.3). Just three days after the eruption began, the ash cloud stretched over a distance of 3000 km from the volcano (Figure 14).
It is widely understood that after strong explosive volcanic eruptions, atmospheric transparency for short-wave radiation decreases over large areas, e.g., [69,70]. A.J. Dyer and B.B. Hicks [71] studied data from several dozen actinometrical stations in the northern and southern hemispheres, and showed that after the March 1963 Agung volcano eruption, the aerosol clouds spread over the entire globe within several months. The weakening of solar radiation at most latitudes lasted for approximately two years. According to data from the 22 USSR actinometrical stations, located between 40 and 68 degrees north, the average monthly deviation of the direct solar radiation intensity had decreased sharply to −10% by December 1963 (Table 6). Moreover, the weakening of radiation was observed until the end of 1966 [72]. Based on our results, we believe that this long-term decrease in solar radiation intensity was caused by the aerosol clouds spreading in the northern latitudes, not only from the Agung volcano, but also of clouds formed during the Sheveluch volcano eruption in November 1964.
The modeling results for the 1964 Sheveluch catastrophic eruption eruptive cloud propagation helped us not only to assess the cloud movement dynamics, but also to confirm and clarify the scenario of this eruption, which had previously only been described based on the geological studies of its products, e.g., [29,32,37]. All the events of the 1964 eruption, which lasted for 1 h and 12 min, were so close in time that their sequence could only be recovered through the modeling we performed of the eruptive cloud movement. The most likely sequence of events during this eruption is:
  • At 19:07 UTC, 11 November, the high-temperature juvenile materials rushed to the earth’s surface, causing the destruction of extrusive domes in the northern part of the crater by powerful explosions directed to the southwest (directed blast eruption) [32].
  • The material of the destroyed extrusive domes then formed directed blast deposits, shaped like a wide fan, on the southern slope of Sheveluch [32].
  • The high-temperature juvenile substance (its content in the tephra deposits reaches 95% [29]) then began egress through the open conduit and formed an eruptive column reaching an altitude of 15,000 m a.s.l. This process was accompanied by volcanic tremor lasting from 19:20 to 20:22 UTC, 11 November [32].
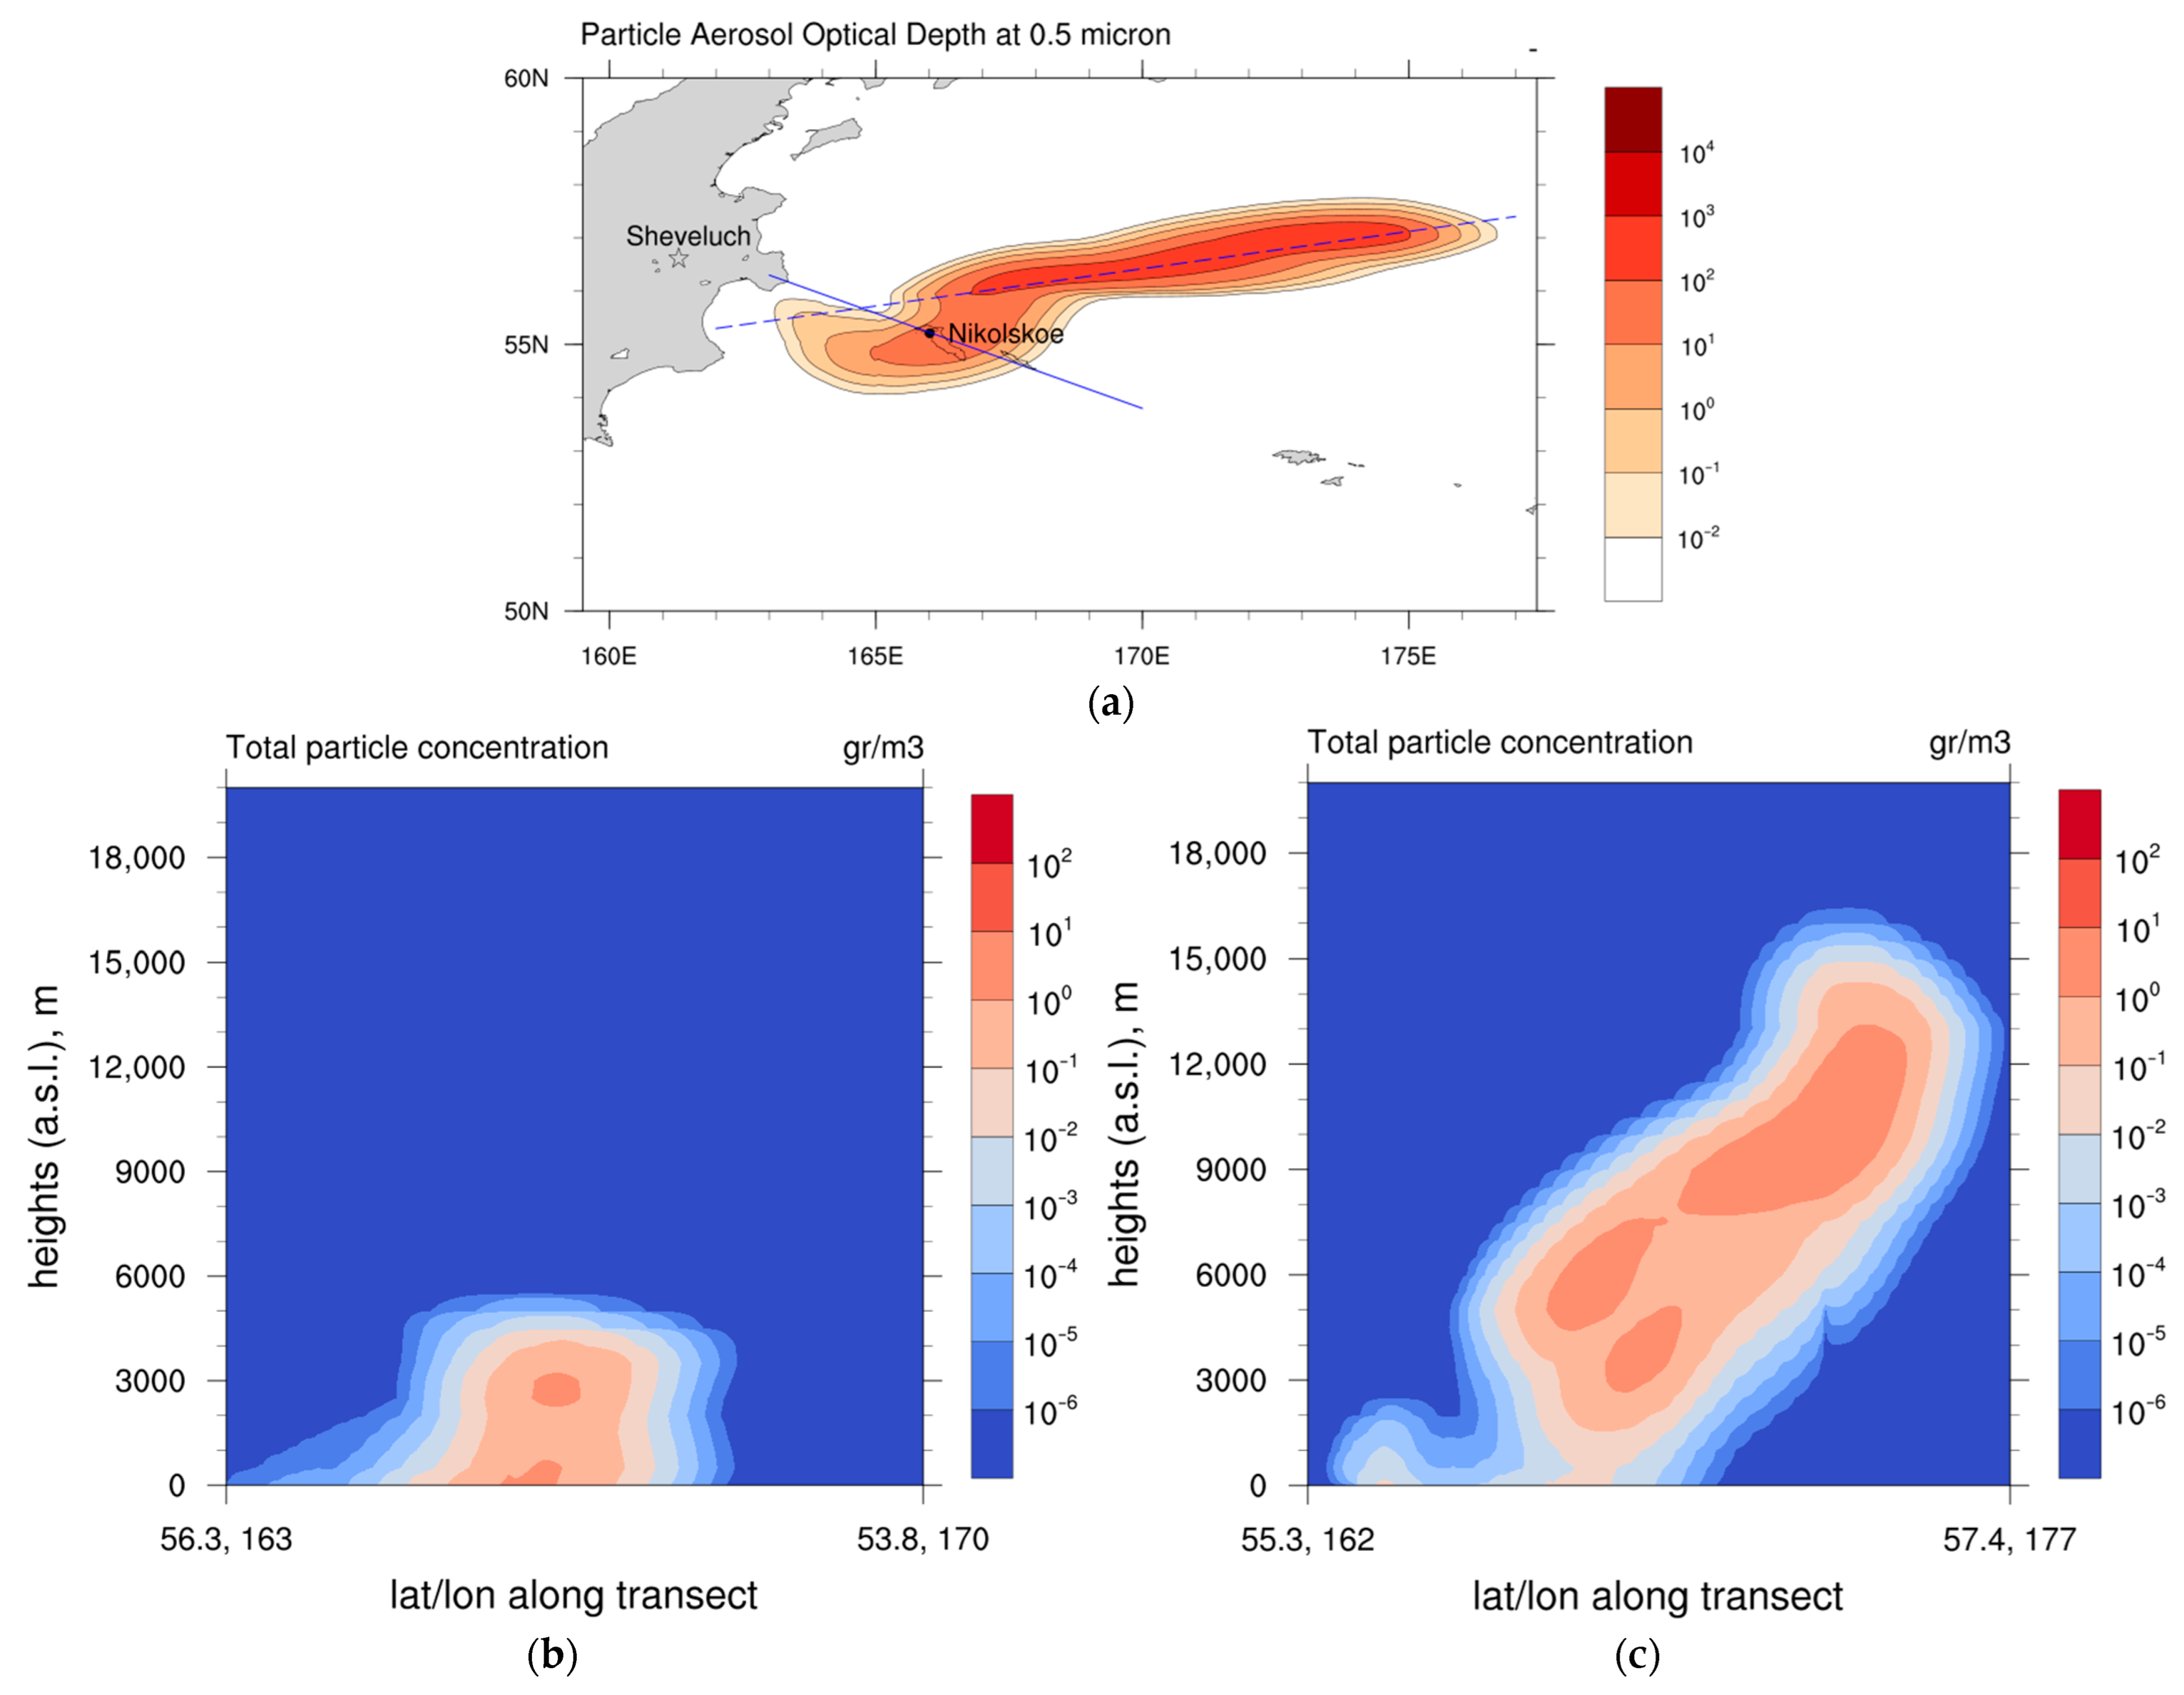
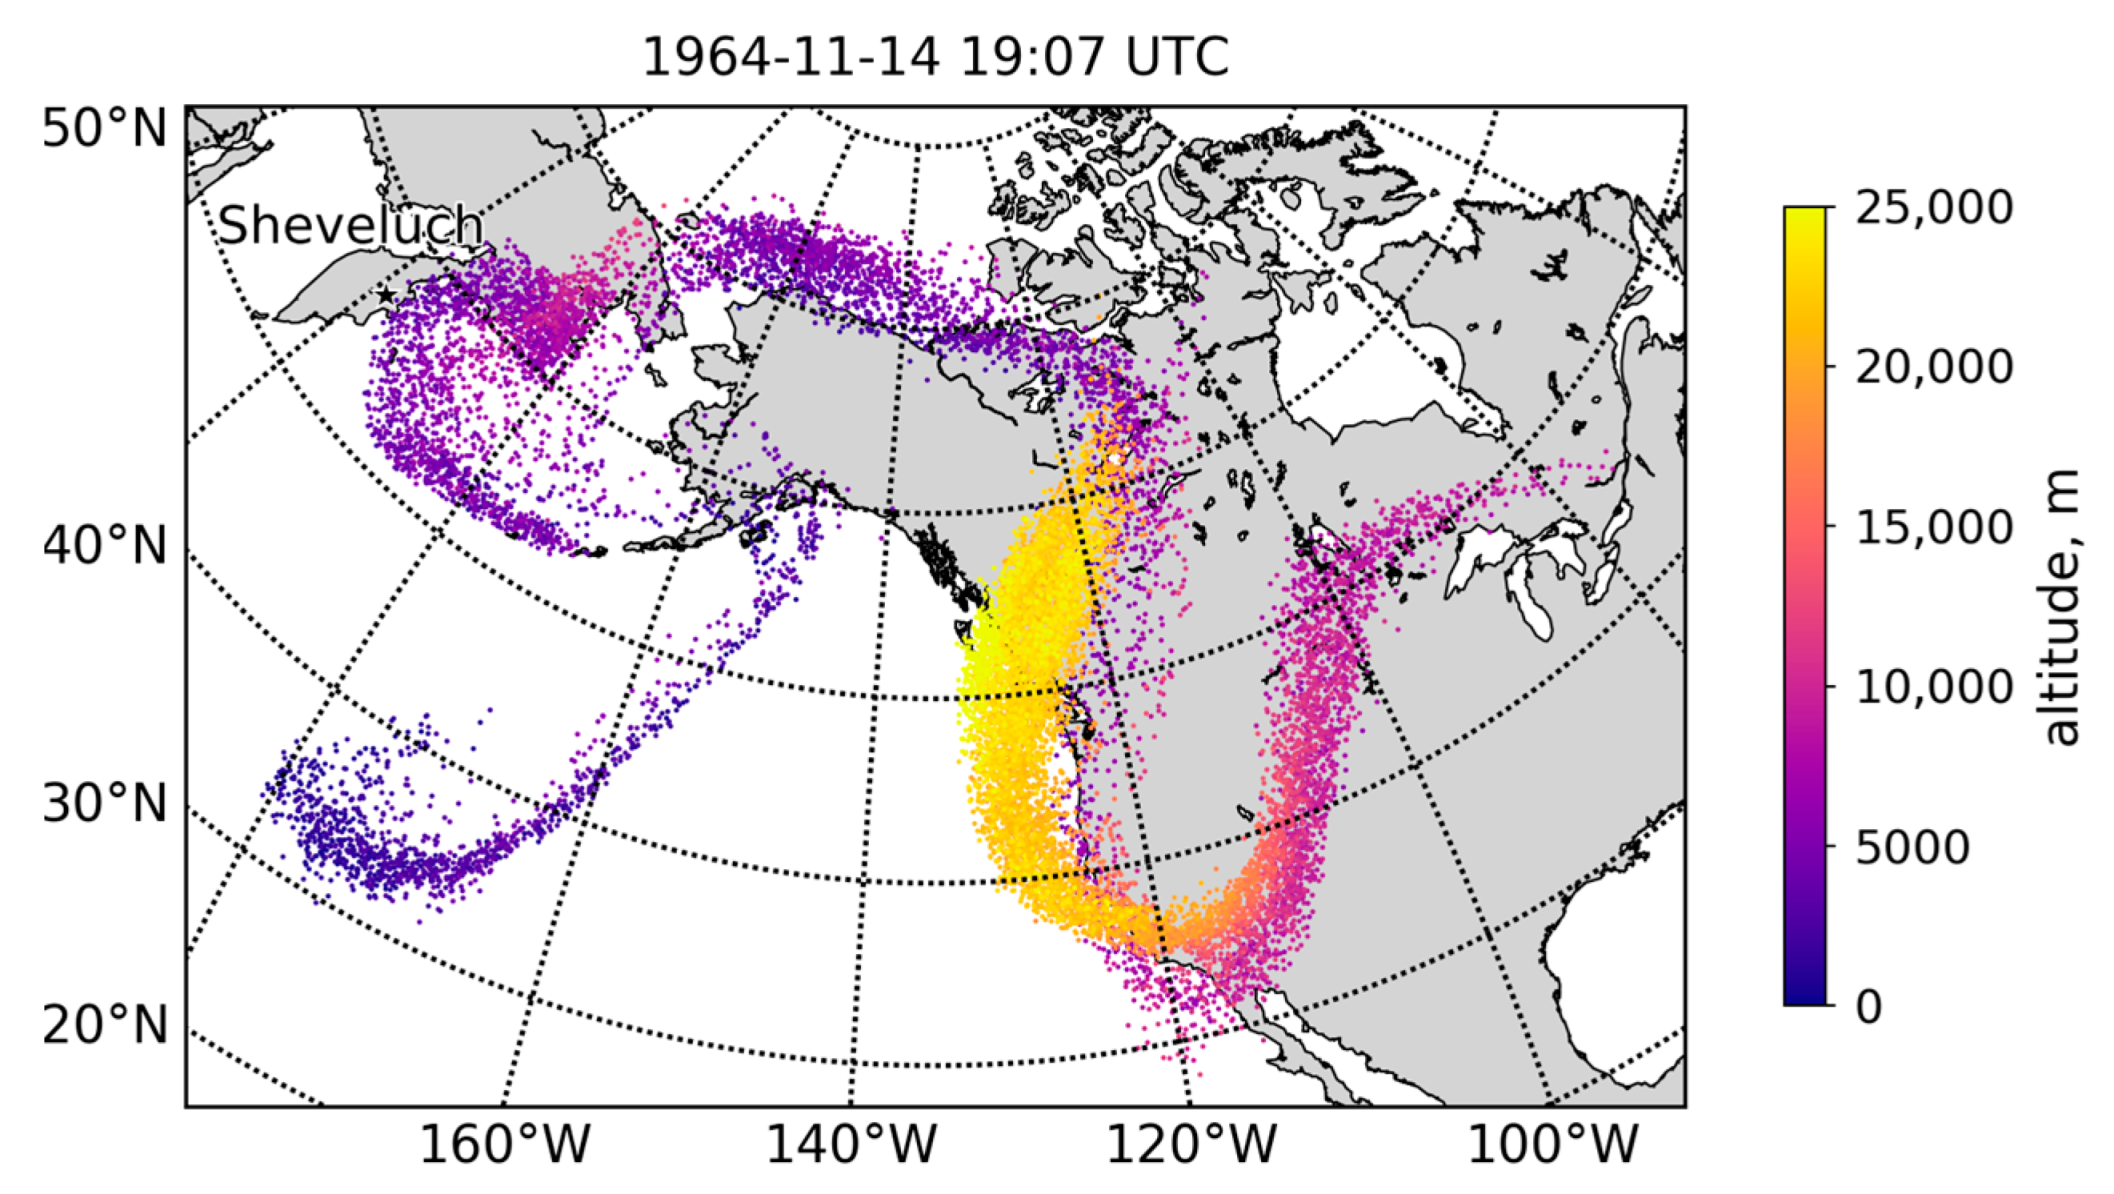
  • The tropopause altitude above Kamchatka typically varies from 8000–11,000 m a.s.l. throughout the year [6]. The eruptive column rose above the tropopause and transformed into a mushroom-like cloud that featured numerous lightning bolts. This cloud started to move east-southeast of the volcano.
  • Simultaneously, from the edge regions of the eruptive column, large volumes of pyroclastic material collapsed and moved in the form of pyroclastic flows along the central part of the southern volcanic slope (the pyroclastic flow deposits situated on the directed blast deposits) [32]).
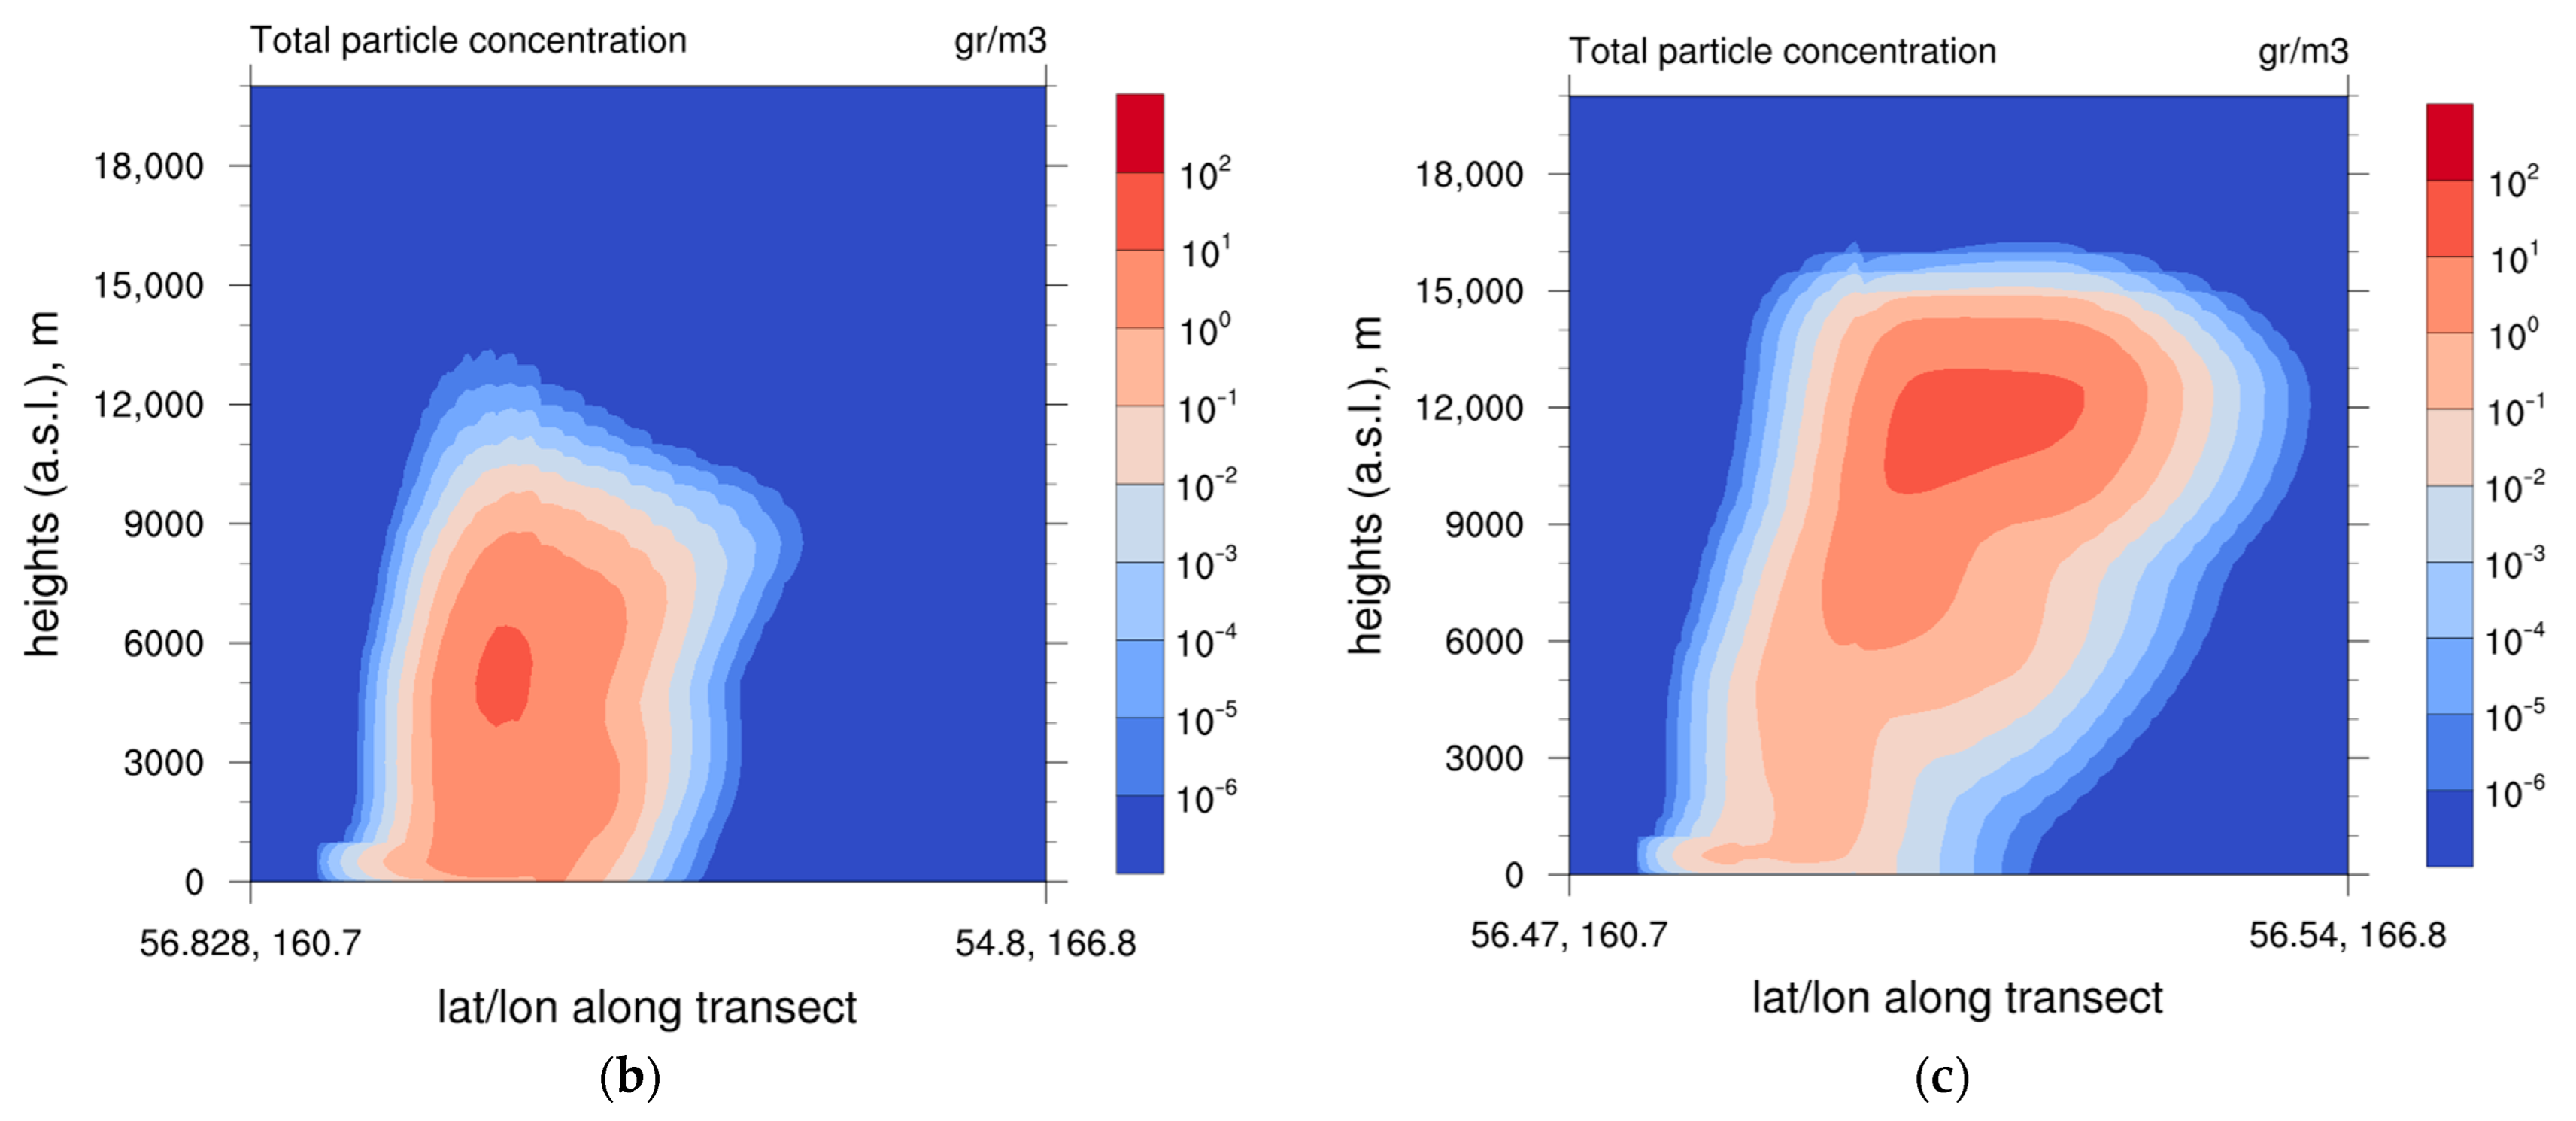
  • A co-ignimbrite cloud then formed above the moving pyroclastic flows, in which ash and sand particles, as well as small rock fragments, were curling and intermixing. This cloud was too heavy (“lead-colored” [51] (p. 30)) and only reached an altitude of 6000–12,000 m a.s.l. Due to a different wind direction in the lower layers of the atmosphere, the co-ignimbrite cloud moved south-southeast of the volcano, unlike the main eruptive cloud.
  • The ashfall in Ust-Kamchatsk featured two phases. From 20:20 to 22:00 UTC, 11 November, ash fell from the main eruptive cloud (large ash particles [51]) that moved at a higher speed; beginning at 22:00 UTC, the second phase comprised the ash from the co-ignimbrite cloud (volcanic dust [51]).
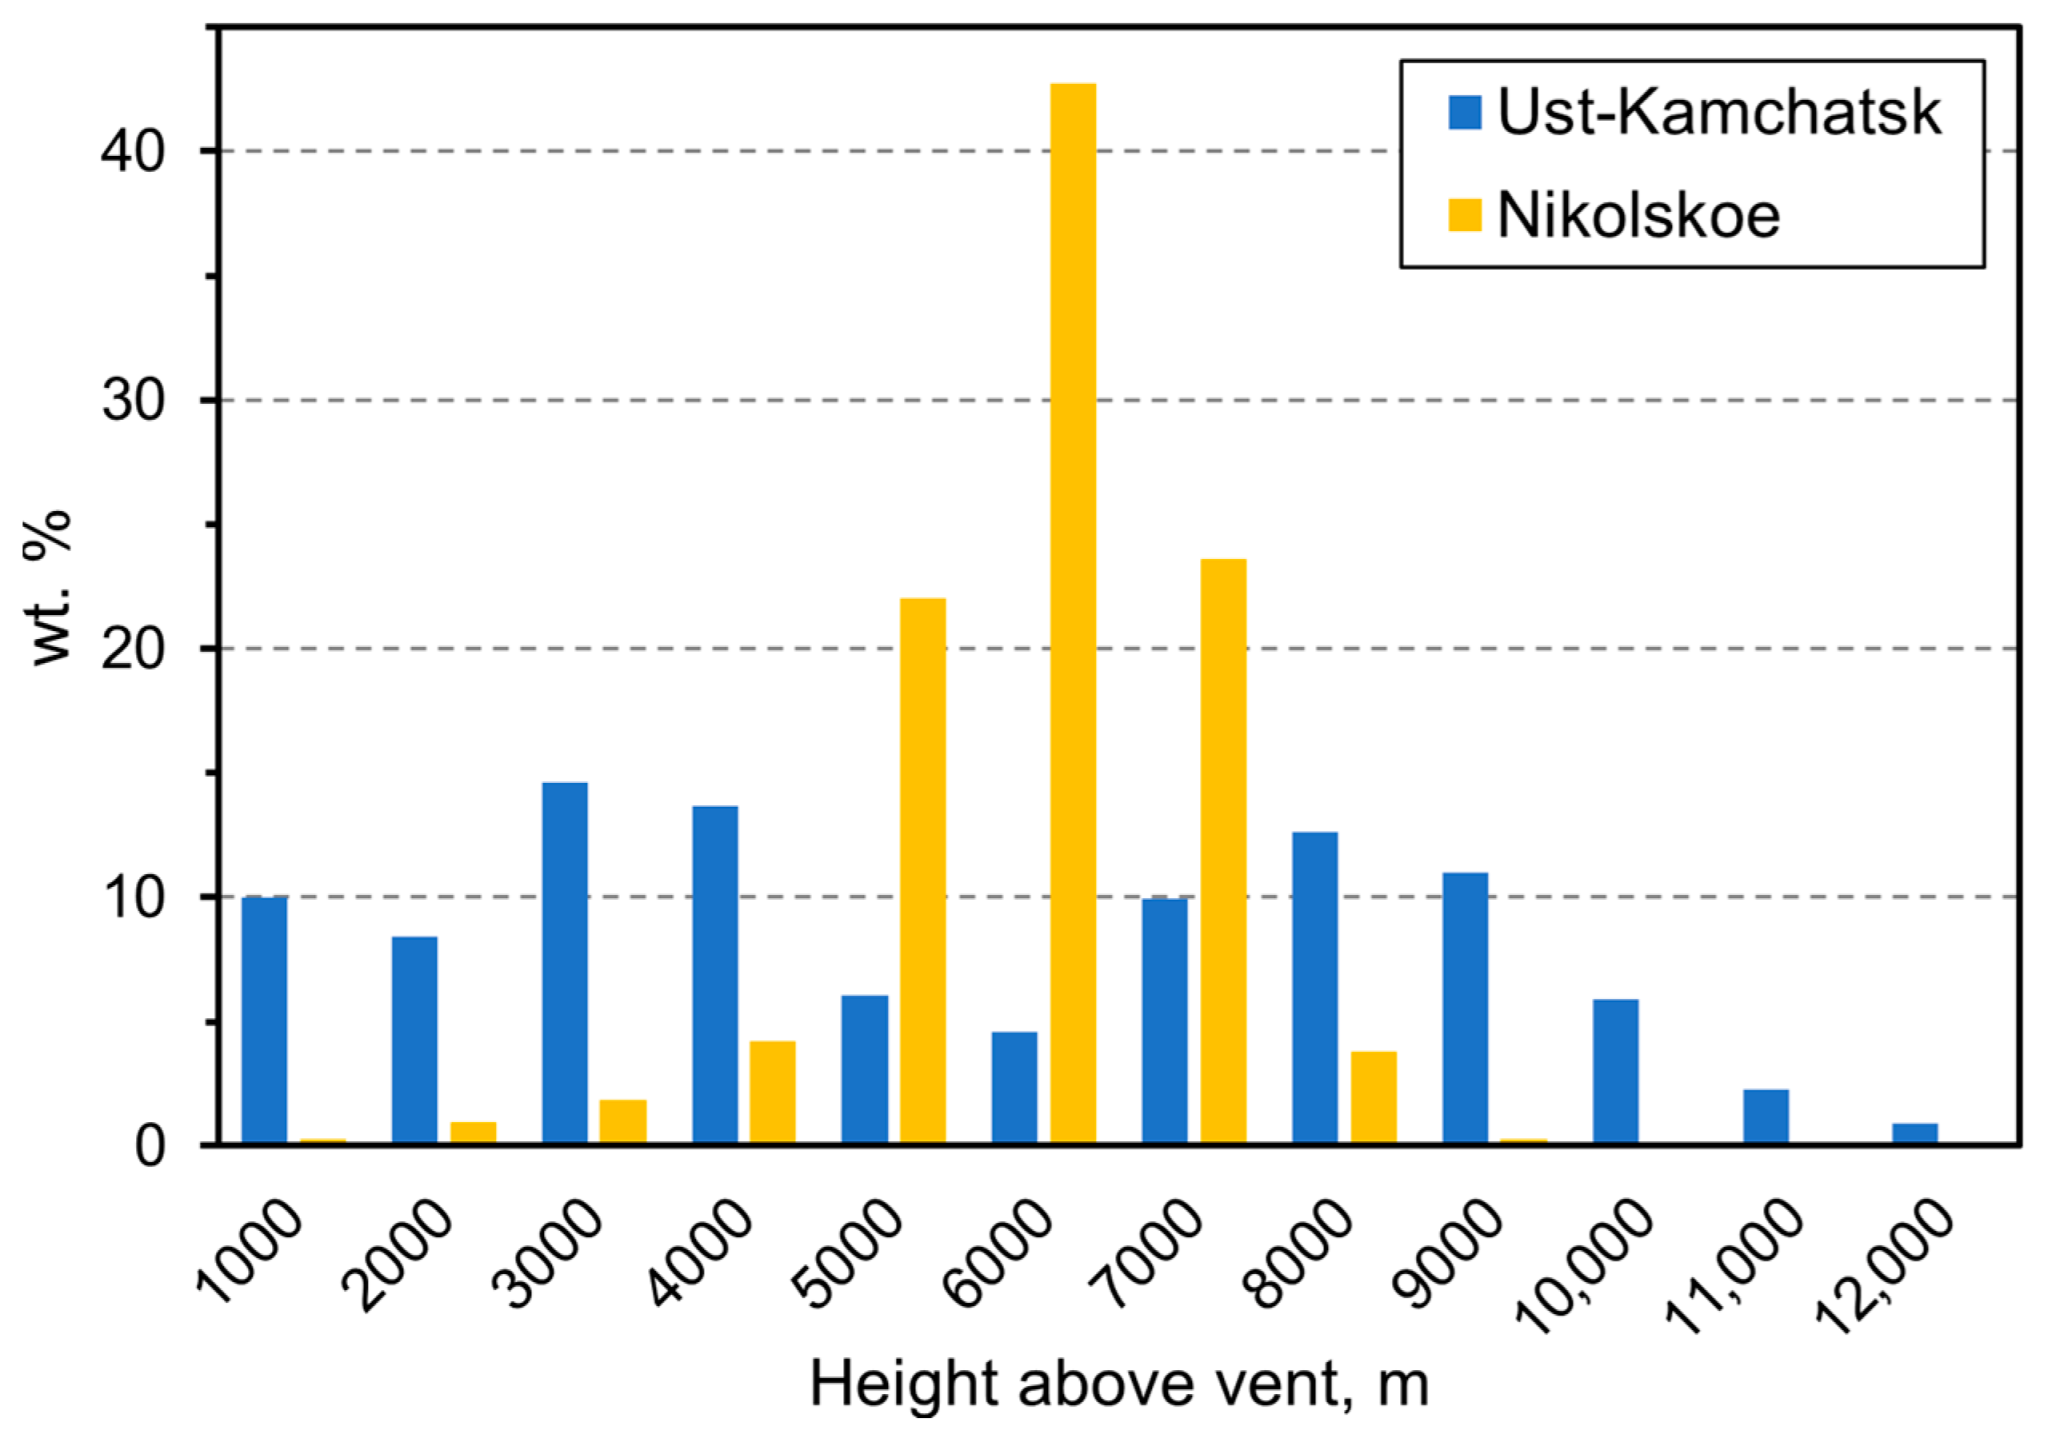
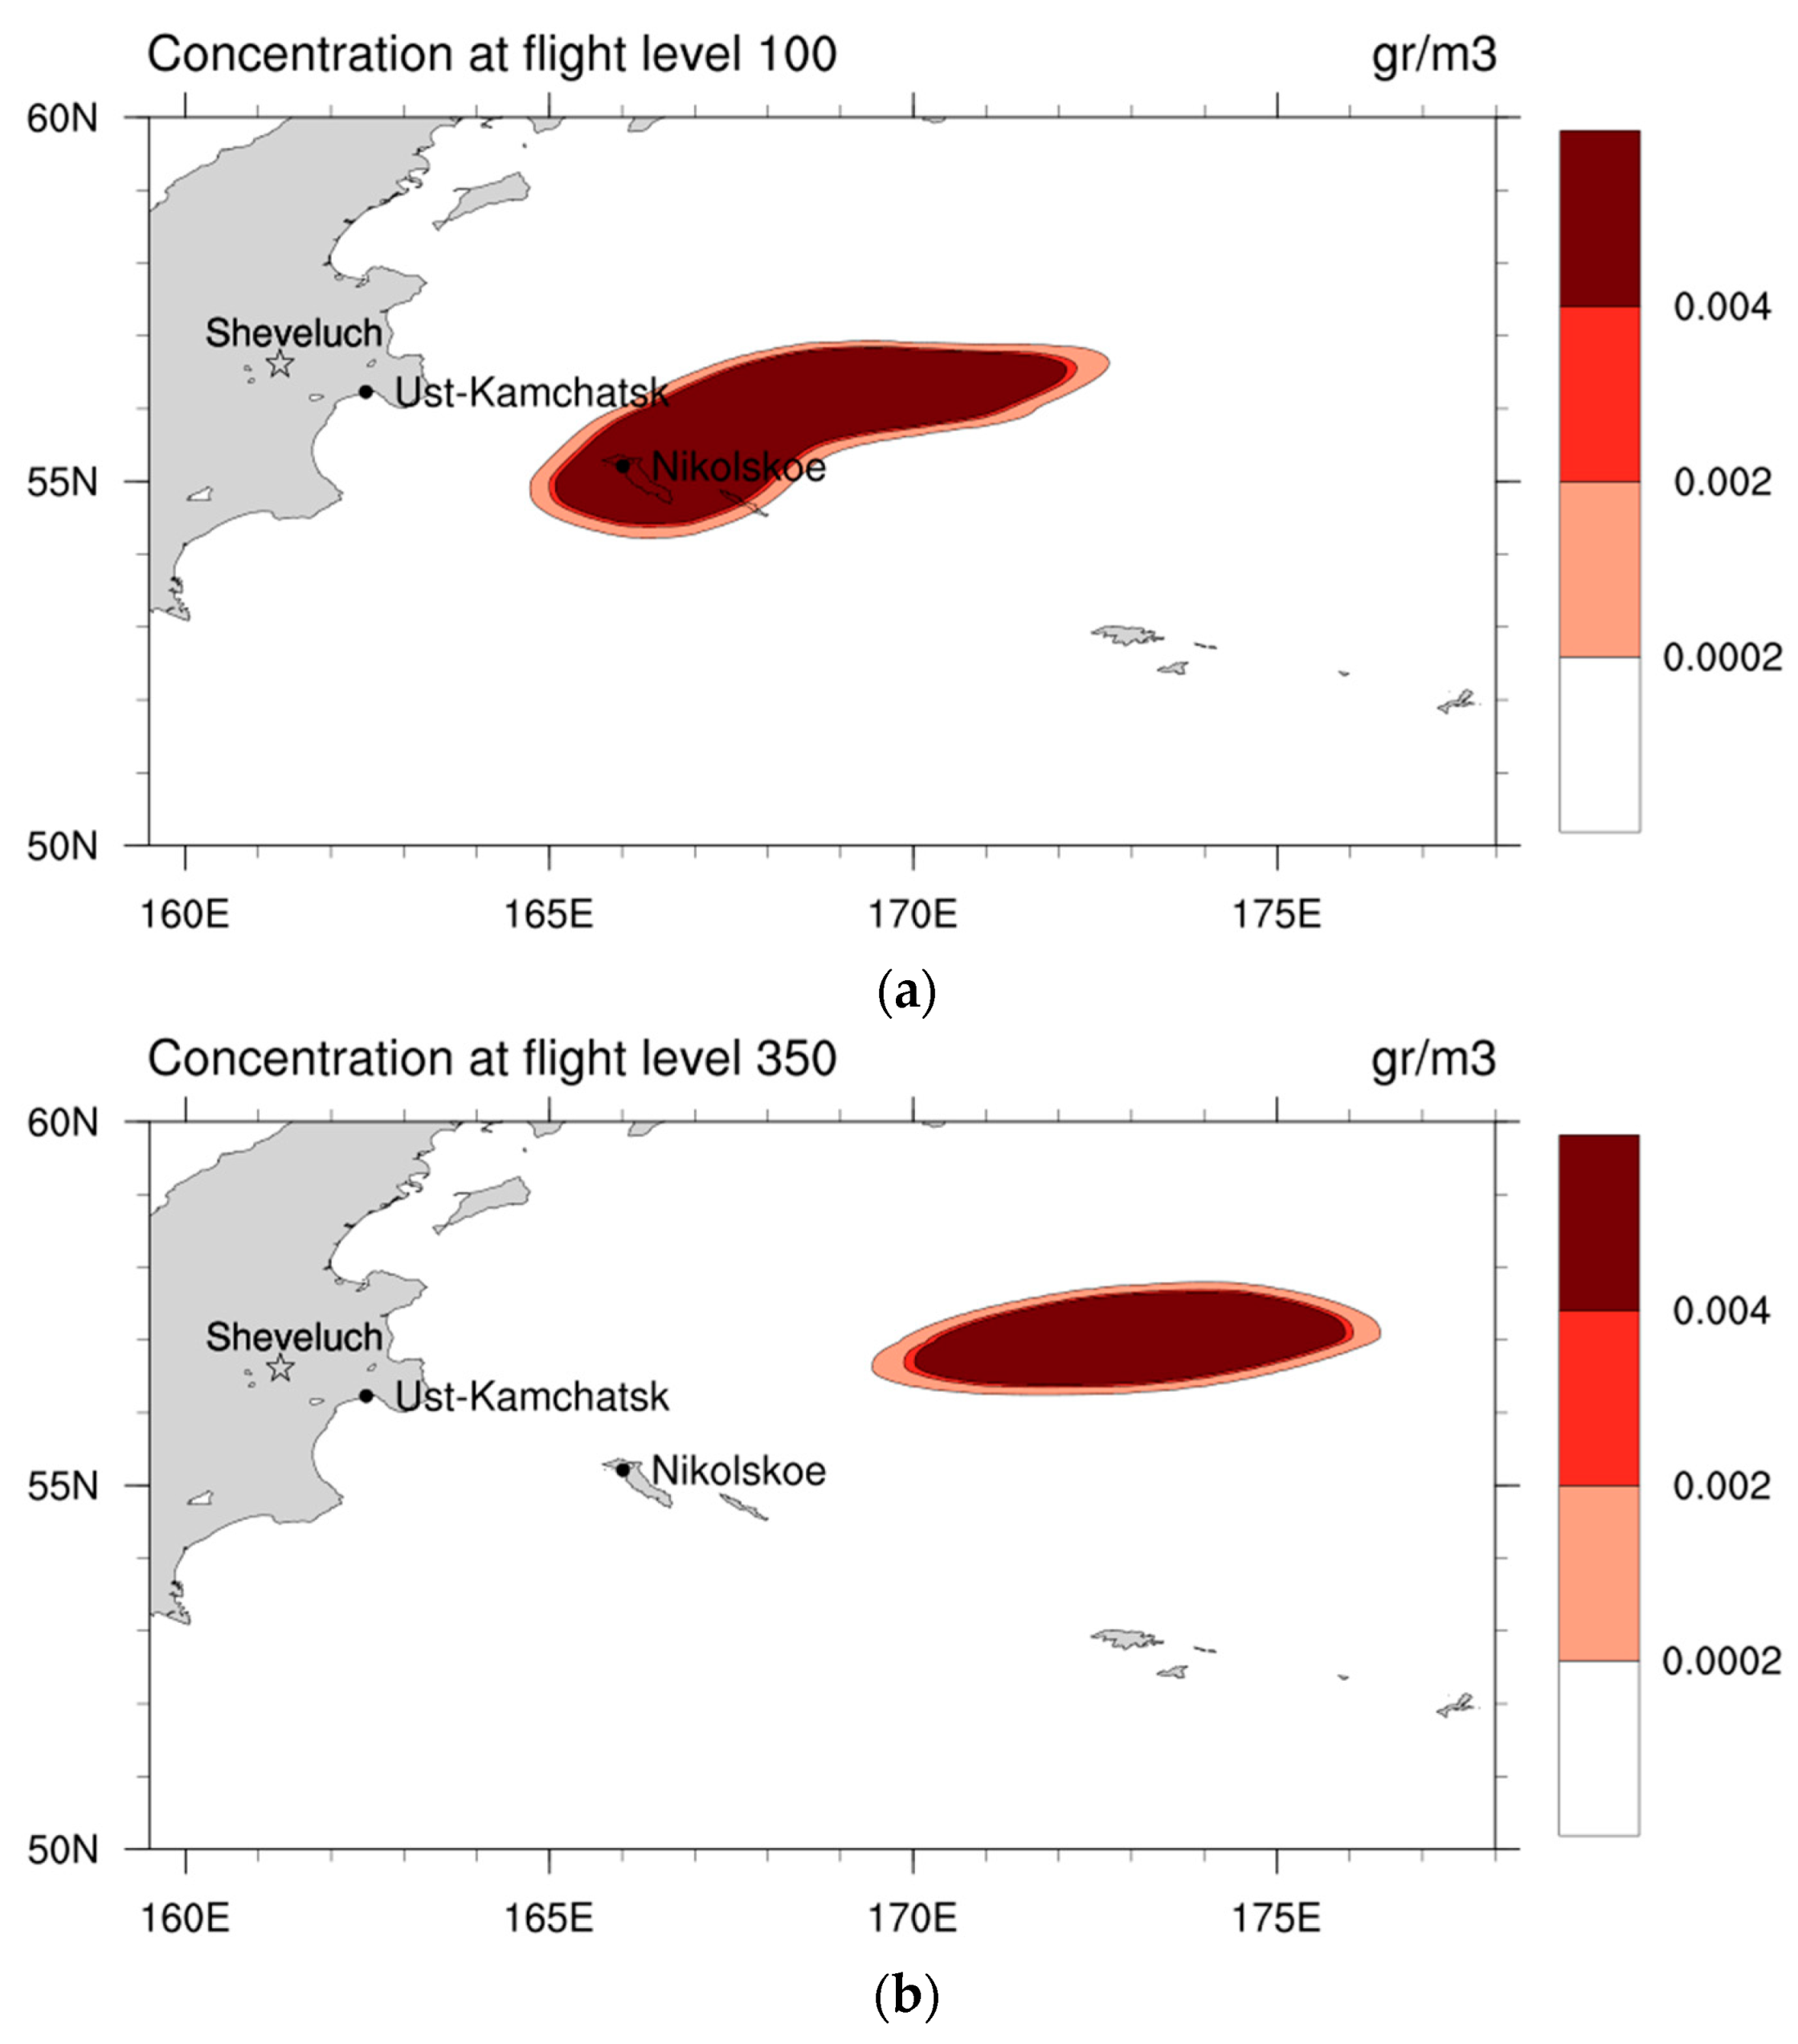
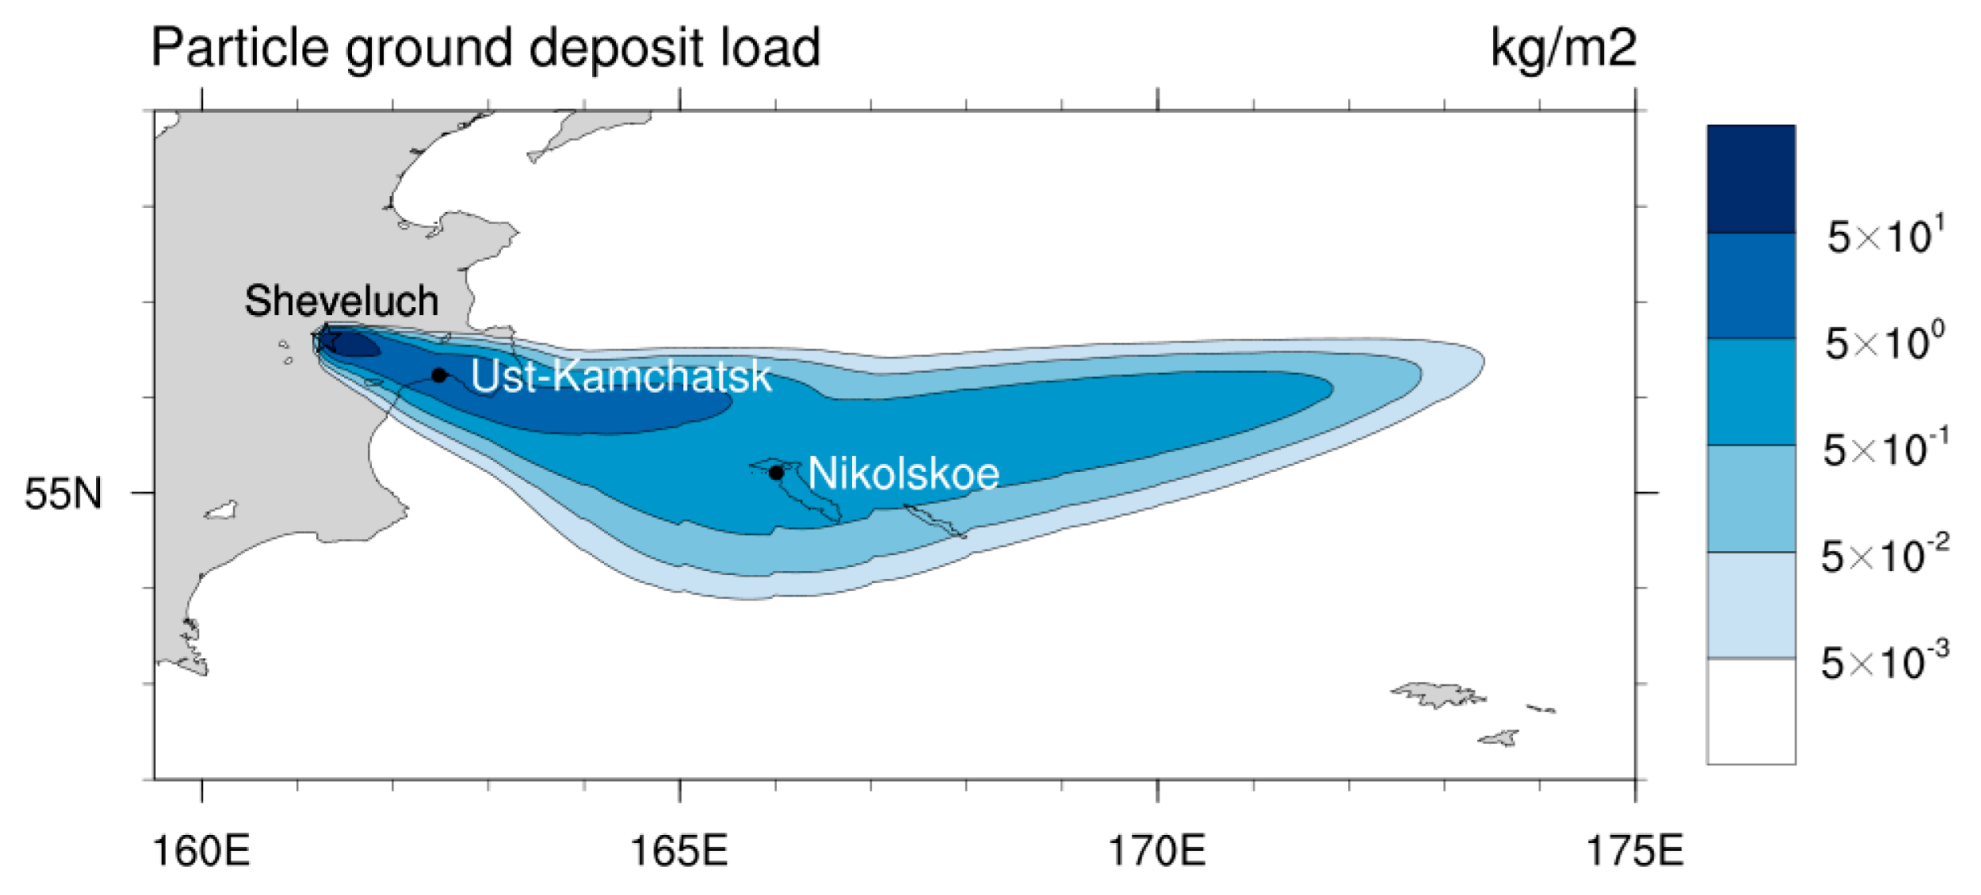
  • In Nikolskoye, ash fell only from the co-ignimbrite cloud. The trajectory of the main eruptive cloud was north of the Commander Islands (Figure 9a).
  • The overall area of both land and sea experiencing ashfalls between 19:07 UTC, November 11 and 07:07 UTC, 12 November, is estimated to have been 147,686 km2 (Figure 16), including 10,200 km2 on land (in Kamchatka, the Bering Island and the Medny Island). The use of the FALL3D model refined the data for the area of ashfalls we obtained earlier in the experiment [37].
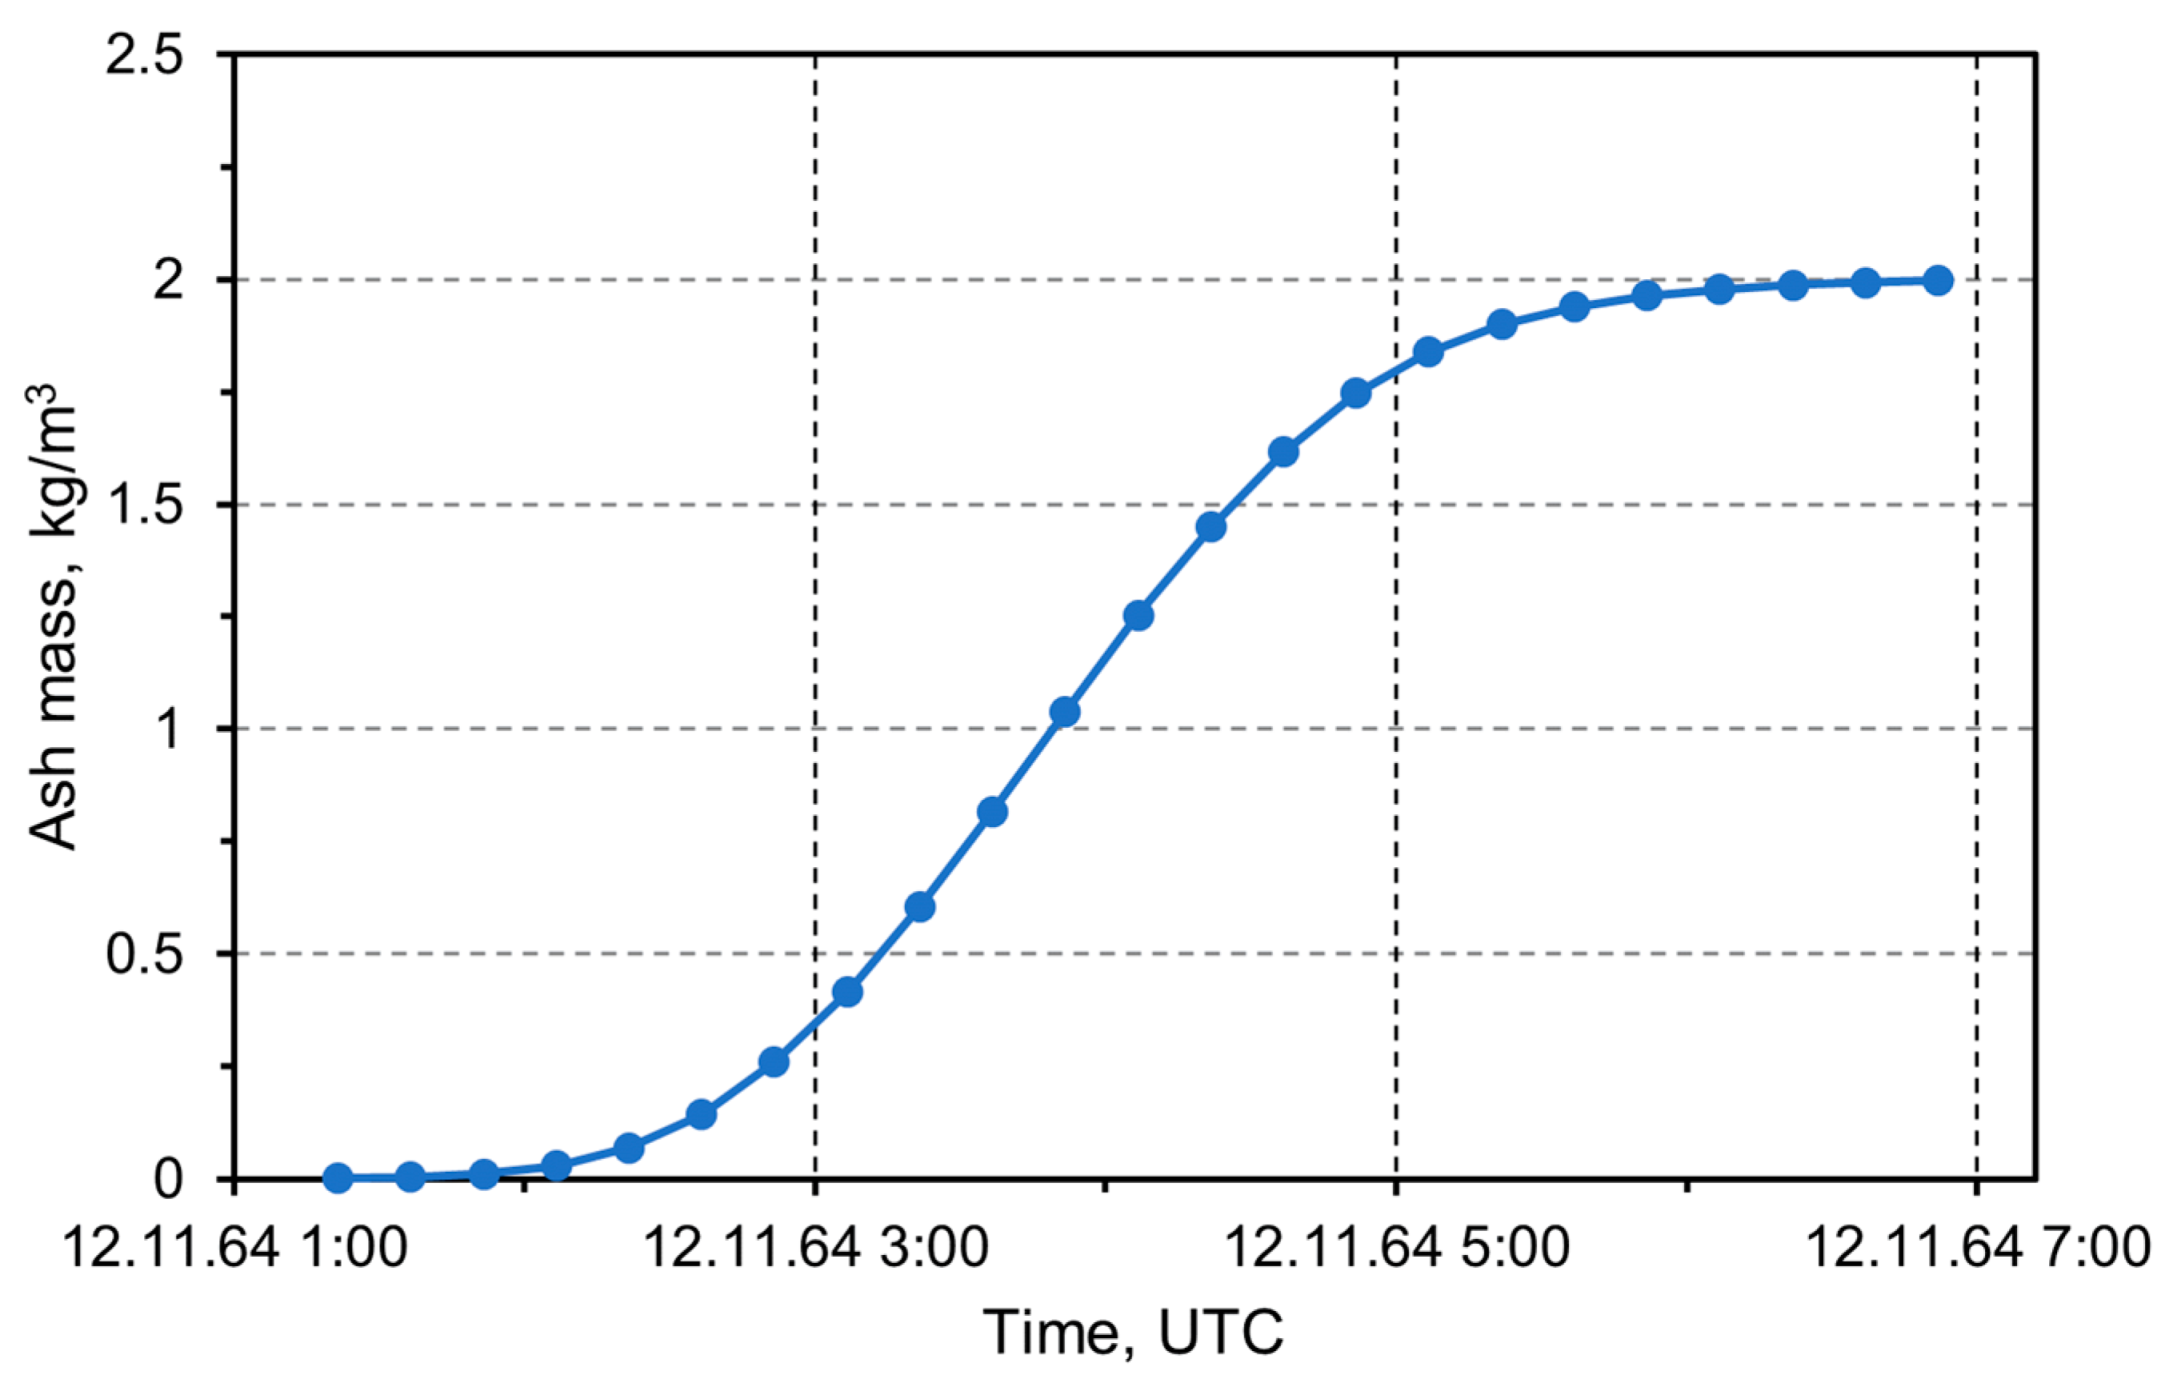
  • Due to the turbulent diffusion, the head of the main eruptive cloud lifted slowly through the atmosphere. By 21:37 UTC, November 11, it reached 16,000 m a.s.l., and by 04:07 UTC, 12 November, it reached 16,500 m a.s.l. Twenty-four hours after the eruption began, the eruptive cloud, at an altitude of up to 16,800 m a.s.l., reached Alaska. By three days after the eruption, the ash cloud stretched for 3000 km and covered the territories of Russia, Canada, USA, and Mexico, as well as the Bering Sea and the Pacific Ocean. It is possible that the ash clouds from the Sheveluch volcano posed a danger to aviation in these areas within 3–5 days after the end of the eruption.

7. Conclusions

For the first time, we managed to recover the movement dynamics of the eruptive cloud generated by the 1964 Sheveluch catastrophic eruption. This became possible due to the freely available release of atmospheric reanalysis data from ERA-40 ECMWF, and to the development of numerical modeling of the ash cloud distribution.
In this experiment, some characteristics of the eruption itself have been clarified. In particular, we obtained new assessments of the total grain-size composition, the MFR, and the distribution of ash in the eruptive column. In addition, we specified the area of ashfalls and traced the process of the ash fine fraction transfer, over the three days following the beginning of the eruption.
The eruptive clouds of the 1964 Sheveluch catastrophic eruption posed a significant hazard to aviation; within the 9 h after the eruption began, an extensive “no-fly zone” formed at all flight levels east of Kamchatka.
The modeling results for the 1964 Sheveluch catastrophic eruption eruptive cloud propagation helped us not only to assess the cloud movement dynamics but also to confirm and clarify the scenario of this geological event.
Our findings also suggest that the well-known long-term decrease in the solar radiation intensity in the northern latitudes from 1963–1966, which was established according to world remote sensing data, was associated with the spread of aerosol clouds not only from the Agung volcano, but also of clouds formed by the 1964 Sheveluch volcano catastrophic eruption.
We must note that the methods and technologies for ash cloud movement modeling used in this research cannot be deemed the standard solution to the problem of uncovering explosive event parameters. However, in cases of insufficient ground and satellite-based data, our model provides an additional tool for study of the historical explosive eruptions of volcanoes.

Author Contributions

Conceptualization, O.G.; methodology, O.G. and S.M.; software, S.M.; validation, O.G. and E.L.; formal analysis, O.G.; investigation, O.G.; resources, S.M. and E.L.; data curation, O.G. and S.M.; writing—original draft preparation, O.G., S.M., A.S. and S.K.; writing—review and editing, O.G., S.M., A.S., S.K. and E.L.; visualization, S.M.; supervision, A.S. All authors have read and agreed to the published version of the manuscript.

Funding

This research received no external funding.

Data Availability Statement

Not applicable.

Acknowledgments

The studies were carried out using the resources of the Center for Shared Use of Scientific Equipment “Center for Processing and Storage of Scientific Data of the Far Eastern Branch of the Russian Academy of Sciences” [73], which is supported by the Ministry of Science and Higher Education of the Russian Federation (project No. 075-15-2021-663). The authors are grateful to Leonid Dorofeev for the photo of the Sheveluch volcano catastrophic eruption in 1964, and to Nikolai Kraev for helping find this photo.

Conflicts of Interest

The authors declare no conflict of interest.

References

  1. Miller, T.P.; Casadevall, T.J. Volcanic ash hazards to aviation. In Encyclopedia of Volcanoes; Sigurdsson, H., Ed.; Academic Press: London, UK; San Diego, CA, USA, 2000; pp. 915–930. [Google Scholar]
  2. Prata, A.; Rose, W. Volcanic ash hazard to aviation. In Encyclopedia of Volcanoes, 2nd ed.; Sigurdsson, H., Houghton, B., McNutt, S., Rymer, H., Stix, J., Eds.; Academic Press: London, UK; San Diego, CA, USA; Waltham, MA, USA, 2015; pp. 911–934. [Google Scholar]
  3. Lechner, P.; Tupper, A.; Guffanti, M.; Loughlin, S.; Casadevall, T. Volcanic Ash and Aviation—The Challenges of Real-Time, Global Communication of a Natural Hazard. In Observing the Volcano World. Advances in Volcanology; Fearnley, C.J., Bird, D.K., Haynes, K., McGuire, W.J., Jolly, G., Eds.; Springer: Cham, Switzerland, 2017; pp. 51–64. [Google Scholar] [CrossRef] [Green Version]
  4. Igarashi, Y.; Girina, O.A.; Osiensky, J.; Moore, D. International Coordination in Managing Airborne Ash Hazards: Lessons from the Northern Pacific. In Observing the Volcano World. Advances in Volcanology; Fearnley, C.J., Bird, D.K., Haynes, K., McGuire, W.J., Jolly, G., Eds.; Springer: Cham, Switzerland, 2017; pp. 529–547. [Google Scholar] [CrossRef] [Green Version]
  5. Gordeev, E.I.; Girina, O.A. Volcanoes and Their Hazard to Aviation. Her. Russ. Acad. Sci. 2014, 84, 134–142. [Google Scholar] [CrossRef] [Green Version]
  6. Kirianov, V.Y. Assessment of Kamchatkan Ash Hazard to Airlines. Volcanol. Seismol. 1993, 14, 246–269. [Google Scholar]
  7. Kirianov, V.Y. Volcanic ash in Kamchatka as a Source of Potential Hazard to Air Traffic. In Volcanic Ash and Aviation Safety: Proc. First Int. Symp. Volcanic Ash and Aviation Safety; Casadevall, T.J., Ed.; United States Government Printing Office: Washington, WA, USA, 1994; pp. 57–64. [Google Scholar] [CrossRef]
  8. Guffanti, M.; Miller, T.P. A Volcanic Activity Alert-Level System for Aviation—Review of its Development and Application in Alaska. Nat. Hazards 2013, 69, 1519–1533. [Google Scholar] [CrossRef]
  9. Neal, C.A.; Girina, O.A.; Senyukov, S.L.; Rybin, A.V.; Osiensky, J.; Izbekov, P.; Ferguson, G. Russian Eruption Warning Systems for Aviation. Nat. Hazards 2009, 51, 245–262. [Google Scholar] [CrossRef] [Green Version]
  10. Braitseva, O.A.; Bazanova, L.I.; Melekestsev, I.V.; Sulerzhitsky, L.D. Largest Holocene eruptions of Avachinsky volcano, Kamchatka. Volcanol. Seismol. 1998, 20, 1–27. [Google Scholar]
  11. Girina, O.A.; Loupian, E.A.; Sorokin, A.A.; Melnikov, D.V.; Manevich, A.G.; Manevich, T.M. Satellite and Ground-Based Observations of Explosive Eruptions on Zhupanovsky Volcano, Kamchatka, Russia in 2013 and in 2014–2016. J. Volcanolog. Seismol. 2018, 12, 1–15. [Google Scholar] [CrossRef] [Green Version]
  12. Girina, O.A.; Melnikov, D.V.; Manevich, A.G.; Loupian, E.A.; Kramareva, L.S. The Characteristics of Bezymianny Volcano Explosive Eruption Events on March 15, 2019, Inferred from Satellite Data. Sovrem. Probl. Distantsionnogo Zondirovaniya Zemli Kosm. 2020, 17, 102–114. [Google Scholar] [CrossRef]
  13. Koyaguchi, T.; Ohno, M. Reconstruction of Eruption Column Dynamics on the Basis of Grain Size of Tephra Fall Deposits: 2. Application to the Pinatubo 1991 Eruption. J. Geoph. Res. 2001, 106, 6513–6534. [Google Scholar] [CrossRef]
  14. Myers, M.L.; Druitt, T.H.; Schiavi, F.; Gurioli, L.; Flaherty, T. Evolution of Magma Decompression and Discharge During a Plinian Event (Late Bronze-Age eruption, Santorini) from Multiple Eruption-Intensity Proxies. Bull. Volcanol. 2021, 83, 18. [Google Scholar] [CrossRef]
  15. Sigurdsson, H.; Carey, S. Plinian and Co-Ignimbrite Tephra Fall from the 1815 Eruption of Tambora Volcano. Bull. Volcanol. 1989, 51, 243–270. [Google Scholar] [CrossRef]
  16. Sigurdsson, H.; Cashdollar, S.; Sparks, R.S.J. The eruption of Vesuvius in A. D. 79: Reconstruction from Historical and Volcanological Evidence. Am. J. Archeol. 1982, 86, 39–51. [Google Scholar] [CrossRef] [Green Version]
  17. Simkin, T.; Fiske, R. Krakatau 1883: The Volcanic Eruption and Its Effects; Smithsonian Institute Press: Washington, WA, USA, 1983; 464p. [Google Scholar]
  18. Michon, L.; Di Muro, A.; Villeneuve, N.; Saint-Marc, C.; Fadda, P.; Manta, F. Explosive Activity of the Summit Cone of Piton de la Fournaise volcano (La Réunion island): A historical and geological review. J. Volcanol. Geotherm. Res. 2013, 263, 117–133. [Google Scholar] [CrossRef] [Green Version]
  19. Uppala, S.M.; KÅllberg, P.W.; Simmons, A.J.; Andrae, U.; Da Costa Bechtold, V.; Fiorino, M.; Gibson, J.K.; Haseler, J.; Hernandez, A.; Kelly, G.A.; et al. The Era-40 Re-analysis. Q. J. R. Meteor. Soc. 2005, 131, 2961–3012. [Google Scholar] [CrossRef]
  20. Kanamitsu, M.; Ebisuzaki, W.; Woollen, J.; Shi-Kend, Y.; Hnilo, J.J.; Fiorino, M.; Potter, G.L. NCEP-DOE AMIP-II Reanalysis (R-2). Bull. Amer. Meteorol. Soc. 2002, 83, 1631–1644. [Google Scholar] [CrossRef]
  21. Carey, S.N.; Sigurdsson, H. The 1982 Eruptions of El Chichón Volcano, Mexico (2): Observations and Numerical Modeling of Tephra-Fall Distribution. Bull. Volcanol. 1986, 48, 127–141. [Google Scholar] [CrossRef]
  22. Costa, A.; Macedonio, G.; Folch, A. A Three-Dimensional Eulerian Model for Transport and Deposition of Volcanic Ashes. Earth Planet. Sci. Lett. 2006, 241, 634–647. [Google Scholar] [CrossRef]
  23. Costa, A.; Folch, A.; Macedonio, G. Density-Driven Transport in the Umbrella Region of Volcanic Clouds: Implications for Tephra Dispersion Models. Geophys. Res. Lett. 2013, 40, 4823–4827. [Google Scholar] [CrossRef]
  24. Costa, A.; Pioli, L.; Bonadonna, C. Assessing Tephra Total Grain-Size Distribution: Insights from Field Data Analysis. Earth Planet. Sci. Lett. 2016, 443, 90–107. [Google Scholar] [CrossRef]
  25. Mastin, L.G.; Guffanti, M.; Servranckx, R.; Webley, P.; Barsotti, S.; Dean, K.; Durant, A.; Ewert, J.W.; Neri, A.; Rose, W.I.; et al. A Multidisciplinary Effort to Assign Realistic Source Parameters to Models of Volcanic Ash-Cloud Transport and dispersion During Eruptions. J. Volcanol. Geotherm. Res. 2009, 186, 10–21. [Google Scholar] [CrossRef]
  26. Pfeiffer, T.; Costa, A.; Macedonio, G. A Model for the Numerical Simulation of Tephra Fall Deposits. J. Volcanol. Geotherm. Res. 2005, 140, 273–294. [Google Scholar] [CrossRef]
  27. Webley, P.W.; Dean, K.; Dehn, J.; Bailey, J.E.; Peterson, R. Volcanic-ash Dispersion Modeling of the 2006 Eruption of Augustine Volcano using the Puff model. In The 2006 Eruption of Augustine Volcano, Alaska; Power, J.A., Coombs, M.L., Freymueller, J.T., Eds.; U.S. Geological Survey: Reston, VA, USA, 2010; pp. 507–526. [Google Scholar] [CrossRef]
  28. Belousov, A.B. The Shiveluch volcano eruption of 12 November 1964—Explosive eruption provoked by failure of the edifice. J. Volcanol. Geotherm. Res. 1995, 66, 357–365. [Google Scholar] [CrossRef] [Green Version]
  29. Bogoyavlenskaya, G.E.; Braitseva, O.A.; Melekestsev, I.V.; Kirianov, V.Y.; Miller, C.D. Catastrophic Eruptions of the Directed-blast Type at Mount St. Helens, Bezymianny and Shiveluch Volcanoes. J. Geodynam. 1985, 3, 189–218. [Google Scholar] [CrossRef]
  30. Gorshkov, G.S. Gigantic Eruption of the Volcano Bezymianny. Bull. Volcanol. 1959, 20, 77–109. [Google Scholar] [CrossRef]
  31. Gorshkov, G.S.; Bogoyavlenskaya, G.E. Bezymianny Volcano and Peculiarities of Its Last Eruptions in 1955–1963; Piip, B.I., Ed.; Nauka: Moscow, Russia, 1965; p. 172. (In Russian) [Google Scholar]
  32. Gorshkov, G.S.; Doubik, Y.M. A Directed Explosion at Sheveluch volcano. In Volcanoes and Eruptions; Gorshkov, G.S., Ed.; Nauka: Moscow, Russia, 1969; pp. 3–37. (In Russian) [Google Scholar]
  33. Melekestsev, I.V.; Dvigalo, V.N.; Kirsanova, T.P.; Ponomareva, V.V.; Pevzner, M.M. The 300 years of Kamchatka Volcanoes: The Young Sheveluch. An Analysis of the Dynamics and Impact of Eruptive Activity During the 17–20th Centuries. Part 1. 1650–1964. Vulkanol. Seismol. 2003, 5, 3–19. (In Russian) [Google Scholar]
  34. Tokarev, P.I. The great Sheveluch volcano eruption of 12 November 1964 and its precursors. Izv. AN SSSR Fiz. Zemli 1967, 9, 11–22. (In Russian) [Google Scholar]
  35. Felitsyn, S.B.; Kiryanov, V.Y. Areal Variability of Tephra Composition as Indicated by Bulk Silicate Analysis Data. Volcanol. Seismol. 1990, 9, 1–20. [Google Scholar]
  36. Girina, O.A. Pyroclastic Deposits from Recent Andesitic Volcano Eruptions in Kamchatka and Their Engineering–Geological Features; Melekestsev, I.V., Ed.; Dalnauka: Vladivostok, Russia, 1998; p. 174. (In Russian) [Google Scholar]
  37. Girina, O.A.; Malkovsky, S.I.; Sorokin, A.A.; Loupian, E.A. The Retrospective Analysis of the 1964 Sheveluch Volcano Eruption (Kamchatka) using the VolSatView Information System. In Information Technologies in Remote Sensing of the Earth (RORSE 2018); Space Research Institute RAS: Moscow, Russia, 2019; pp. 34–41. [Google Scholar] [CrossRef]
  38. Girina, O.A.; Loupian, E.A.; Melnikov, D.V.; Kashnitskii, A.V.; Uvarov, I.A.; Bril, A.A.; Konstantinova, A.M.; Burtsev, M.A.; Manevich, A.G.; Gordeev, E.I.; et al. Creation and Development of the Information System Remote Monitoring of Kamchatka and Kuril Islands Volcanic Activity. Sovrem. Probl. Distantsionnogo Zondirovaniya Zemli Kosm. 2019, 16, 249–265. [Google Scholar] [CrossRef]
  39. Gordeev, E.I.; Girina, O.A.; Loupian, E.A.; Sorokin, A.A.; Kramareva, L.S.; Efremov, V.Y.; Kashnitskii, A.V.; Uvarov, I.A.; Burtsev, M.A.; Romanova, I.M.; et al. The VolSatView Information System for Monitoring the Volcanic Activity in Kamchatka and on the Kuril Islands. J. Volcanolog. Seismol. 2016, 10, 382–394. [Google Scholar] [CrossRef]
  40. Girina, O.A.; Ozerov, A.Y.; Tsvetkov, V.A.; Demyanchuk, Y.V. Squeezing out Plastic Lava Blocks on Young Shiveluch Volcano (Kamchatka) in 2020–2021. Bull. Kamchatka Reg. Assoc. Educ. Sci. Cent. Earth Scien. 2021, 51, 77–83. [Google Scholar] [CrossRef]
  41. Melekestsev, I.V.; Volynets, O.N.; Ermakov, V.A.; Kirsanova, T.P.; Masurenkov, Y.P. Sheveluch Volcano. In Active Volcanoes of Kamchatka; Fedotov, S.A., Masurenkov, Y.P., Eds.; Nauka: Moscow, Russia, 1991; Volume 1, pp. 98–103. [Google Scholar]
  42. Gorbach, N.V.; Portnyagin, M.V. Geology and Petrology of the Lava Complex of Young Shiveluch Volcano, Kamchatka. Petrology 2011, 19, 134–166. [Google Scholar] [CrossRef]
  43. Menyailov, A.A. Sheveluch Volcano: Its Geological Structure, Composition, and Eruptions; AS USSR: Moscow, Russia, 1955; 264p. (In Russian) [Google Scholar]
  44. Girina, O.A.; Demyanchuk, Y.V.; Melnikov, D.V.; Ushakov, S.V.; Ovsyannikov, A.A.; Sokorenko, A.V. The Paroxysmal Phase of the 27 February 2005 Eruption on Young Sheveluch Volcano, Kamchatka. A Preliminary Report. Vulkanol. Seismol. 2006, 1, 16–23. (In Russian) [Google Scholar]
  45. Ozerov, A.Y.; Girina, O.A.; Zharinov, N.A.; Belousov, A.B.; Demyanchuk, Y.V. Eruptions in the Northern Group of Volcanoes, in Kamchatka, during the Early 21st Century. J. Volcanolog. Seismol. 2020, 14, 1–17. [Google Scholar] [CrossRef]
  46. Gorshkov, G.S.; Bylinkina, A.A. The Observations of Sheveluch Volcano Eruption in 1948–1950. Bull. Volcanol. Stn. 1954, 20, 8–31. (In Russian) [Google Scholar]
  47. Kirsanov, I.T.; Kirsanova, T.P. The Volcanoes of the Northern Kamchatka in 1965. Bull. Volcanol. Station. 1970, 46, 24–25. (In Russian) [Google Scholar]
  48. Tokarev, P.I. The Swarm of Earthquakes at Sheveluch Volcano in May 1964. Bull. Volcanol. Station. 1964, 38, 41–44. (In Russian) [Google Scholar]
  49. Tokarev, P.I. Volcanic Earthquakes of Kamchatka; Resanov, I.A., Ed.; Nauka: Moscow, Russia, 1981; 164p. (In Russian) [Google Scholar]
  50. Gorelchik, V.I.; Shirokov, V.A.; Firstov, P.P.; Chubarova, O.S. Shiveluch Volcano: Seismicity, deep Structure and Forecasting Eruptions (Kamchatka). J. Volcanol. Geotherm. Res. 1997, 78, 121–137. [Google Scholar] [CrossRef]
  51. Piip, B.I.; Markhinin, E.K. The Gigantic Sheveluch Volcano Eruption on 12 November 1964. Bull. Volcanol. Stn. 1965, 39, 3–28. (In Russian) [Google Scholar]
  52. Rulenko, O.P.; Tokarev, P.I.; Firstov, P.P. Electricity of Volcanoes. Bull. Volcanol. Station. 1976, 52, 11–17. (In Russian) [Google Scholar]
  53. Kirianov, V.Y.; Egorova, I.A.; Litasova, S.N. Volcanic ash on Bering Island (Commander Islands) and Kamchatkan Holocene Eruptions. Volcanol. Seismol. 1990, 8, 850–868. [Google Scholar]
  54. Braitseva, O.A.; Kiryanov, V.Y.; Sulerzhitskiy, L.D. Marker Intercalations of Holocene Tephra in the Eastern Volcanic Zone of Kamchatka. Volcanol. Seismol. 1989, 7, 785–814. [Google Scholar]
  55. Kirianov, V.Y.; Solovieva, H.A. Lateral Variations in ash Composition due to Eolian Differentiation. Volcanol. Seismol. 1991, 12, 431–442. [Google Scholar]
  56. Siebert, L.; Simkin, T.; Kimberly, P. Volcanoes of the World, 3rd ed.; Smithsonian Institution: Washington, WA, USA; University California Press: Berkeley, CA, USA; Los Angeles, LA, USA; London, UK, 2010; 568p. [Google Scholar]
  57. Peterson, R.A. Puff UAF User’s Manual. 2003. Available online: http://web.archive.org/web/20121119195411/http://puff.images.alaska.edu/doc.shtml (accessed on 23 March 2022).
  58. Searcy, C.; Dean, K.; Stringer, W. PUFF: A High-Resolution Volcanic ash Tracking Model. J. Volcanol. Geotherm. Res. 1998, 80, 1–16. [Google Scholar] [CrossRef]
  59. Ganser, G.H. A Rational Approach to Drag Prediction of Spherical and Nonspherical Particles. Powder Technol. 1993, 77, 143–152. [Google Scholar] [CrossRef]
  60. Byun, D.; Schere, K.L. Review of the Governing Equations, Computational Algorithms, and Other Components of the Models-3 Community Multiscale Air Quality (CMAQ) Modeling System. Appl. Mech. Rev. 2006, 59, 51–77. [Google Scholar] [CrossRef]
  61. Malkovsky, S.I.; Sorokin, A.A.; Girina, O.A. Development of an Information System for Numerical Modeling of the Propagation of Volcanic ash from Kamchatka and Kuril Volcanoes. Comput. Technol. 2019, 24, 79–89. (In Russian) [Google Scholar] [CrossRef]
  62. Sorokin, A.A.; Girina, O.A.; Loupian, E.A.; Malkovskii, S.I.; Balashov, I.V.; Efremov, V.Y.; Kramareva, L.S.; Korolev, S.P.; Romanova, I.M.; Simonenko, E.V. Satellite Observations and Numerical Simulation Results for the Comprehensive Analysis of Ash Clouds Transport During the Explosive Eruptions of Kamchatka Volcanoes. Rus. Meteor. Hydrol. 2017, 42, 759–765. [Google Scholar] [CrossRef]
  63. Girina, O.A.; Melnikov, D.V.; Manevich, A.G. Satellite Monitoring of Kamchatkan and Northern Kuriles Volcanoes. Sovrem. Probl. Distantsionnogo Zondirovaniya Zemli Kosm. 2017, 14, 194–209. (In Russian) [Google Scholar] [CrossRef]
  64. Suzuki, T. A Theoretical Model for Dispersion of Tephra. In Arc Volcanism: Physics and Tectonics; Shimozuru, D., Yokoyama, I., Eds.; Terra Scientific Publishing Company (TERRAPUB): Tokyo, Japan, 1983; pp. 95–113. [Google Scholar]
  65. Takeuchi, S. Preeruptive Magma Viscosity: An Important Measure of Magma Eruptibility. J. Geoph. Res. 2011, 116, B10201. [Google Scholar] [CrossRef]
  66. Degruyter, W.; Bonadonna, C. Improving on Mass Flow Rate Estimates of Volcanic Eruptions. Geoph. Res. Lett. 2012, 39, L16308. [Google Scholar] [CrossRef] [Green Version]
  67. Woodhouse, M.J.; Hogg, A.J.; Phillips, J.C.; Sparks, R.S.J. Interaction Between Volcanic Plumes and Wind During the 2010 Eyjafjallajökull Eruption, Iceland. J. Geoph. Res. 2013, 118, 92–109. [Google Scholar] [CrossRef] [Green Version]
  68. Stohl, A.; Prata, A.J.; Eckhardt, S.; Clarisse, L.; Durant, A.; Henne, S.; Kristiansen, N.I.; Minikin, A.; Schumann, U.; Seibert, P.; et al. Determination of time—And Height-Resolved Volcanic Ash Emissions and Their Use for Quantitative Ash Dispersion Modeling: The 2010 Eyjafjallajökull Eruption. Atmos. Chem. Phys. 2011, 11, 4333–4351. [Google Scholar] [CrossRef] [Green Version]
  69. Savinov, S.I. The Highest Values of Solar Radiation Voltage According to Observations in Pavlovsk Since 1892. Izves. AS USSR. 1913, 7, 707–720. [Google Scholar]
  70. Kimball, H.H. Volcanic Eruption and Solar Radiation Intensity. Mon. Wea. Rev. 1918, 16, 355–356. [Google Scholar] [CrossRef]
  71. Dyer, A.J.; Hicks, B.B. Global Spread of Volcanic Dust from the Ball Eruption of 1963. Quar J. Roy Meteorol. Soc. 1968, 94, 545–554. [Google Scholar] [CrossRef]
  72. Asaturov, M.L.; Budyko, M.I.; Vinnikov, K.Y.; Groisman, P.Y.; Kabanov, A.S.; Karol, I.L.; Kolomeev, M.P.; Pivovarova, Z.I.; Rozanov, E.V.; Khmelevtsov, S.S. Volcanoes, Stratospheric Aerosol and Climate of the Earth; Gidrometeoizdat: Leningrad, Russia, 1986; p. 256. (In Russian) [Google Scholar]
  73. Sorokin, A.A.; Makogonov, S.I.; Korolev, S.P. The Information Infrastructure for Collective Scientific Work in the Far East of Russia. Sci. Tech. Inf. Process. 2017, 44, 302–304. [Google Scholar] [CrossRef]
Figure 1. The Sheveluch volcano (Old and Young) at Kamchatka, Russia [40].
Remotesensing 14 03449 g001
Figure 2. Visual data for the Sheveluch eruption on 11 November 1964: (a) Lightning bolts in the eruptive cloud above Sheveluch. Photo by L. Dorofeev from Klyuchi; (b) Double-layer eruptive cloud above Ust-Kamchatsk. Photographer unknown (http://www.kscnet.ru/ivs/history/dates/images/Shvl64_1.jpg (accessed on 1 July 2022)).
Remotesensing 14 03449 g002
Figure 3. Wind direction and speed at different altitudes at 18:00 UTC, on 11 November 1964: (a) 5600 m; (b) 7200 m; (c) 10,400 m; (d) 15,800 m.
Remotesensing 14 03449 g003
Figure 4. Cloudiness at the Sheveluch volcano during the 1964 eruption according to the ERA-40 reanalysis data: black solid line—total cloud cover; red dashed line—low cloud cover; green dotted line—medium cloud cover; blue dash-dotted line—high cloud cover.
Remotesensing 14 03449 g004
Figure 5. Wind characteristics according to the RSM00032389 station measurements (at 17:30 UTC on 12 November 1964) and to the ECMWF ERA-40 reanalysis data (at 18:00 UTC on 12 November 1964): (a) Direction; (b) Speed.
Remotesensing 14 03449 g005
Figure 6. Wind characteristics according to the RSM00032618 station measurements (at 05:30 UTC on 12 November 1964) and to the ECMWF ERA-40 reanalysis results (at 06:00 UTC on 12 November 1964): (a) Direction; (b) Speed.
Remotesensing 14 03449 g006
Figure 7. The total grain-size distribution of Sheveluch tephra during the 1964 eruption, determined using the FALL3D model.
Remotesensing 14 03449 g007
Figure 8. The visualization of the modeling results for the Sheveluch eruptive cloud as of 21:37 UTC, 11 November 1964: (a) The optical density of the aerosol; (b) Ash concentration: cross-section along the solid line in (a); (c) Ash concentration: cross-section along the dashed line in (a).
Remotesensing 14 03449 g008aRemotesensing 14 03449 g008b
Figure 9. The visualization of the modeling results for the Sheveluch eruptive cloud as of 04:07 UTC, 12 November 1964: (a) The optical density of the aerosol; (b) Ash concentration: cross-section along the solid line in (a); (c) Ash concentration: cross-section along the dashed line in (a).
Remotesensing 14 03449 g009
Figure 10. The percentage ration of the ash mass fallen from the different parts of the eruptive column.
Remotesensing 14 03449 g010
Figure 11. The distribution of the fallen ash mass over the time in Ust-Kamchatsk calculated through modeling.
Remotesensing 14 03449 g011
Figure 12. The distribution of the fallen ash mass over the time in Nikolskoye calculated through modeling.
Remotesensing 14 03449 g012
Figure 13. The visualization of the modeling results for the Sheveluch eruptive cloud as of: (a) 19:07 UTC, 12 November; (b) 07:07 UTC, 13 November; (c) 19:07, 13 November; (d) 07:07, 14 November.
Remotesensing 14 03449 g013
Figure 14. The visualization of the modeling results for the Sheveluch eruptive cloud as of 19:07 UTC, 14 November 1964.
Remotesensing 14 03449 g014
Figure 15. Visualization of the Sheveluch volcano eruptive clouds hazardous to aviation on the flight levels 100 (a) and 350 (b) as of 04:22 UTC, 12 November 1964.
Remotesensing 14 03449 g015
Figure 16. The overall weight of the Sheveluch ash as of 07:07 UTC, 12 November 1964.
Remotesensing 14 03449 g016
Table 1. Weather stations of Kamchatka and Bering Island in 1964.
Station IDLocalityCoordinates
RSM00032389Klyuchi56.3167N, 160.8333E
RSM00032618Nikolskoe55.2000N, 165.9833E
RSM00032540Petropavlovsk-Kamchatsky53.0833N, 158.5833E
Table 2. Wind speed and direction during Sheveluch volcano eruption in 1964 according to [6].
Height, m 12.11.1964 17:30 UTC12.11.1964 5:30 UTC
Klyuchi, RSM00032389Nikolskoe, RSM00032618
Direction, Deg.Speed, m/sDirection, Deg.Speed, m/s
30027013387
50031373408
1000318103317
2000279153099
30002991329810
40003051429819
50003101828517
6000303182834
70002972128126
80002942227129
90002872726633
10,0002863425528
11,0002732426943
12,0002651926435
13,0002882926840
14,0002723626942
15,0002492625139
Table 3. FALL3D model parameters.
ParameterValue
Domain size (deg)7 (lat) × 17 (lon)
Horizontal resolution (deg)0.056 (lat), 0.068 (lon)
Vertical resolution (m)500
Bottom left corner of the calculation domain (lat; lon)(52; 160)
Vent coordinates (lat; lon)(56.633; 161.3)
Particle diameter (Φ-units)−2–12
Terminal settling velocity modelGANSER [59]
Model for vertical diffusionSIMILARITY [22]
Model for horizontal diffusionCMAQ [60]
Table 4. PUFF model parameters.
ParameterValue
Vent coordinates (lat; lon)(56.633; 161.3)
Minimum cloud height (m)2500
Maximum cloud height (m)15,000
Vertical distribution of particleslinear
Particle size distributionlognormal
Distribution parameters (Φ-units)μ = 4.143; σ = 1.4
Number of particles15,000
Model for horizontal diffusionturbulent
Vertical diffusion coefficient (m2/s)3.95
Sedimentation physicsReynolds
Table 5. Grain-size composition of ash from the Sheveluch volcano eruption in 1964. Data is partially taken from [35] and extended.
Particle Diameter (Φ-Units)Particle Diameter (mm)Mass Fraction (%)
NizhnekamchatskYar ChernyUst-Kamchatsk
>4<0.06333.40.4
4–30.063–0.1252.831.1
3–20.125–0.2510.619.725.5
2–10.25–0.583.673.973
1–00.5–1.0---
Table 6. Deviation (%) of direct radiation intensity from the long-term average over USSR territory. Data is taken from [72].
Year\MonthIIIIIIIVVVIVIIVIIIIXXXIXII
1963−13−2222210−1−2−10
1964−10−3−6−7−2−1−3−2−3−6−8−16
1965−15−7−11−5−2−3−3−2−5−2−9−12
1966−10−9−7−4−2−110−2−4−7−7
Publisher’s Note: MDPI stays neutral with regard to jurisdictional claims in published maps and institutional affiliations.

