Article

Assessment of Tuff Sea Cliff Stability Integrating Geological Surveys and Remote Sensing. Case History from Ventotene Island (Southern Italy)

1
Department of Engineering–Campania University “L. Vanvitelli”, Via Roma, 29, 81031 Aversa (CE), Italy
2
Department of Civil, Building and Enviromental Engineering—University of Naples “Federico II”, 80125 Napoli, Italy
3
Geologist, Via Forno Vecchio, 38 Marigliano NA, Italy
4
Ventotene Municipality Library, 04031 Latina, Italy
*
Author to whom correspondence should be addressed.
Remote Sens. 2020, 12(12), 2006; https://doi.org/10.3390/rs12122006
Submission received: 30 May 2020 / Revised: 18 June 2020 / Accepted: 19 June 2020 / Published: 22 June 2020

Abstract

:
This study provides a detailed integrated analysis of the erosional processes affecting the volcanoclastic headlands of a pocket beach, of a typical Tyrrhenian volcanic island (Ventotene, south Italy). It compares the survey carried out in 2012 and the recent landslides that occurred in 2018–2020. The studied tuff cliff is characterised by steep, up to overhanging walls affected by a fracture network, which locally isolates blocks in precarious equilibrium. The stability conditions of the southern Cala Nave Bay sea cliff were evaluated by integrating a geological field survey, structural analysis of discontinuities, and a detailed topographic survey consisting of a terrestrial laser scanner (TLS) and photogrammetry data acquisition and processing, providing a three-dimensional (3D) model of the sea cliff. The 3D model of the area affected by the recent landslides was created using proximity photogrammetry, the Structure for Motion (SfM) methodology. The fracture network was represented by using high-resolution digital models and projected to realize geostructural vertical mapping of the cliff. The data acquired in 2012 were more recently compared with further surveys carried out, following rock failures that occurred in winter 2019–2020. The detachment planes and failure modalities coincide perfectly with the ones previously assessed. The applied techniques and the comparison with the recent rock failures have proven to be important in defining these conditions to address risk mitigation interventions.

1. Introduction

Embayed pocket beaches in rocky coasts are highly attractive segments of coasts, and are tourism sites to drive the economy, especially on small islands [1]. These beaches are frequently backed by rocky headlands [2,3,4,5,6], which are characterised by rapid geomorphological evolution due to waves and weathering action, which result in failure processes and irreversible loss of land [7].
Rocky coasts may reach steep slopes; their response to wave action is further affected by the discontinuity (fracture and fault) network [8]. Coastal cliff retreat is a discontinuous process in space and time that is dominated by diffuse erosion processes and mass movements, such as failures, including rock fall, rock topples, and rock slides [9,10], which are often the triggers of major natural hazards [11]. The recession of cliffed coasts is usually associated with the creation of shore platforms, which increasingly act to dissipate wave energy [7,12]. The nature, size, and amount of sediment released by cliff erosion may influence the erosional process itself by inhibiting the wave impact, especially in the presence of coarse and blocky sized deposits. Moreover, where the bathymetric setting is favourable, sandy beaches develop and protect cliffs from further marine erosion [13].
It is clear that for safe use of these coastal settings, it is necessary to carefully assess the morphostructural conditions of the sea cliff that embraces the embayment.
In recent years, Terrestrial Laser Scanning (TLS) techniques have been successfully applied to obtain extremely accurate Digital Elevation Models (DEM) of sea cliffs, monitor landslide phenomena, and characterise the spatial discontinuity network [14,15,16,17,18]. The adoption of the TLS tool has become of paramount importance in the reconstruction of sub-vertical sea cliff surfaces overlooking the sea; the detailed three-dimensional (3D) models support the application of geomechanical models to assess cliff stability [19].
These techniques need to be complemented by the structural analysis of a rock slope as a necessary step toward the hazard assessment of a cliffed coastal area [20,21]. Commonly, these data can be conveniently reported as a series of geothematic maps illustrating lithological, geomorphological, and structural features that characterise the study area.
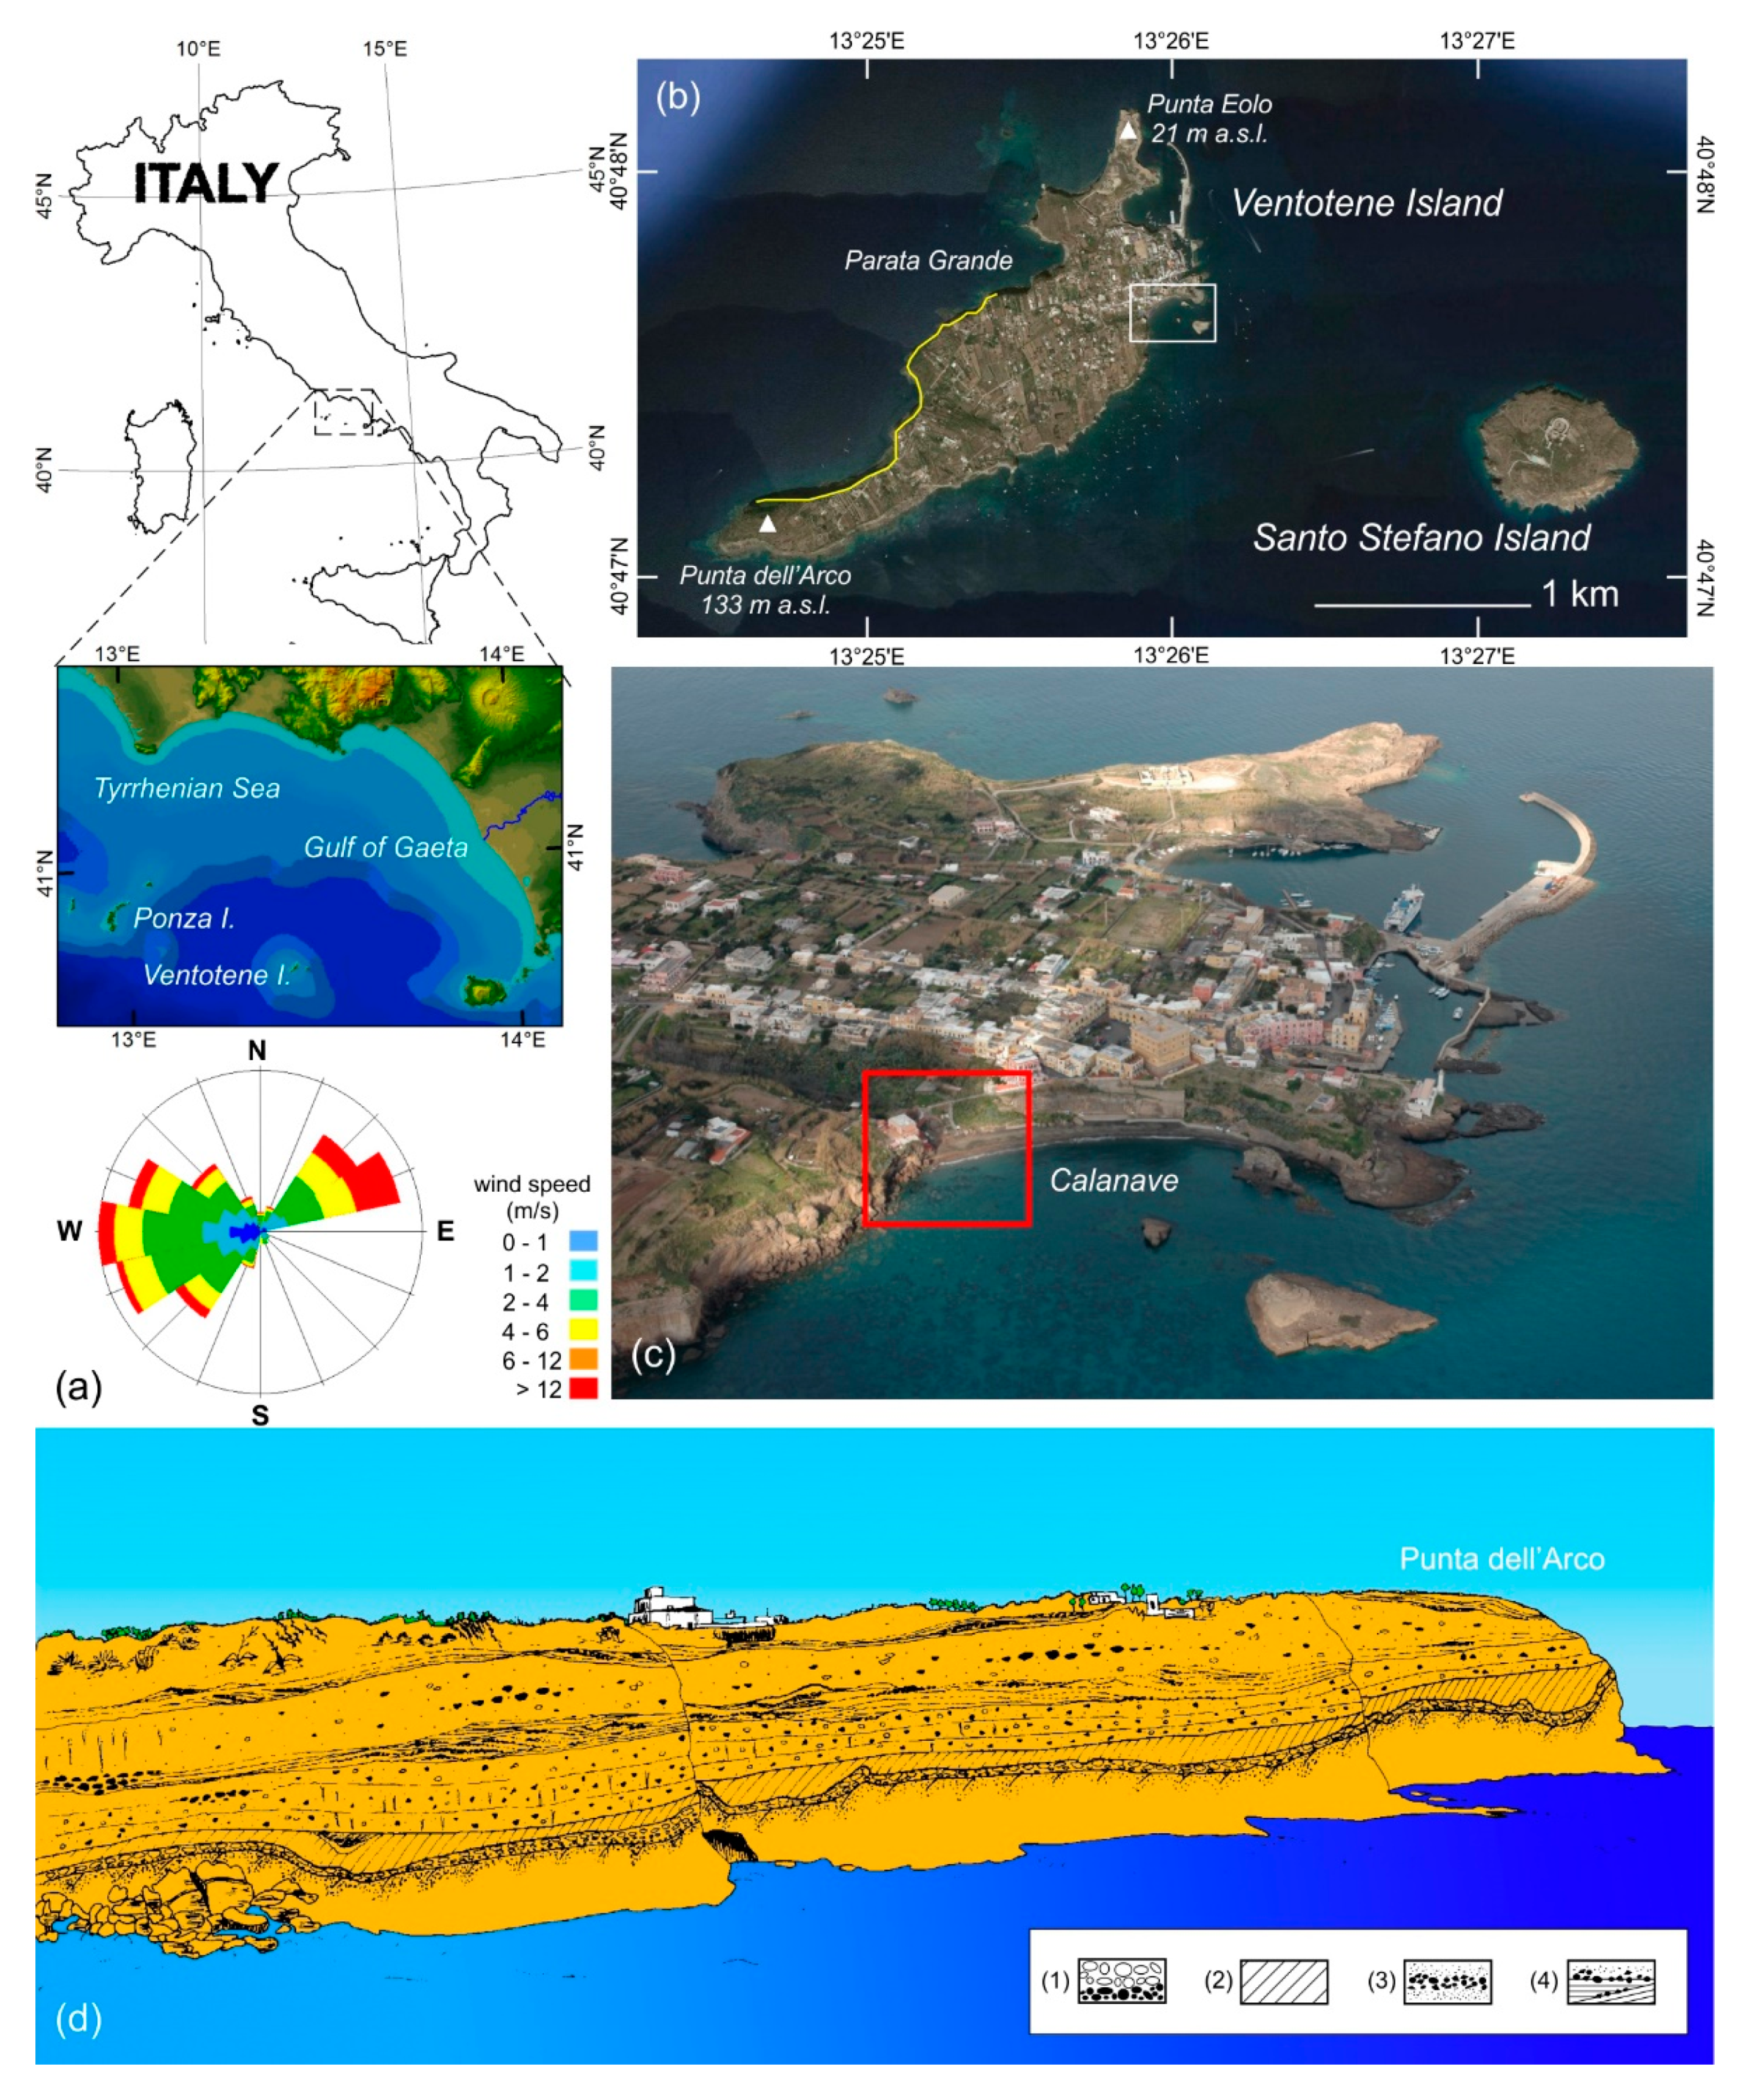
This research presents the results of a detailed investigation carried out on a coastal tuff cliff in order to assess a qualitative risk exposition. The sea cliff is located on the southern end of a pocket beach in Ventotene Island (Tyrrhenian Sea, Italy; Figure 1a), a site of touristic attraction and interest in past years, by interventions aimed at mitigating erosion effects. Intervention of cementation of the main sea cliff, and the burial of the only canal supplying sediment to the beach have led, in recent years, to a sensitive retreat of the beach, with a consequent decrease in tourist receptivity. The southern end of the bay, also characterised in the past by failure phenomena, is the only part in which no safety measures have yet been carried out. Nevertheless, the increased coastal retreat has forced the erosion at the base of this cliff, posing serious problems of stability for a building built on it, and for the stretch of beach facing to the cliff. With the aim of providing a hypothesis of risk reduction and of safeguarding the rocky context for the sedimentary supply, the main goal was to provide a comprehensive and affordable characterization of a sea cliff integrating traditional geological/geomechanical surveys and remote geostructural investigations via TLS and SfM techniques. In 2012, we performed a first complete study through TLS, SfM, detailed geological survey, with direct observation on rock wall by climbing, and an accurate photographic reportage. At the beginning of 2020, further surveys were performed following some events of rock falls that occurred between 2019 and 2020, since no interventions were made to improve sea cliff stability. The surveys were carried out in a short time and have interested the areas affected by the failures, through a photogrammetric proximity survey (SfM) of the scarp area. The results were compared to the geostructural and geomechanical survey previously performed in order to demonstrate the reliability of the methodological approach and the need for rapid risk reduction actions.

2. Study Area

The study area is located in the Northeastern sector of Ventotene Island (central Italy). Ventotene, along with the islet of Santo Stefano, develops on a sub-conic volcanic structure of about 800 m in the centre of the Gulf of Gaeta (Figure 1a).
These islands represent portions of a large composite volcano, with a basal diameter of about 15–20 km. The volcano eruptive centre is located to the west of the island of Ventotene, as evidenced by the North-East dip of the volcanic products; all volcanic rocks cropping out on Ventotene and Santo Stefano correlate both in age and composition with the potassic association of the Roman Comagmatic Province (<1 Ma [22,23]).
Perrotta et al. [23] provided a detailed stratigraphic reconstruction of the eruptive products well exposed along the western sea cliff of the island. The products of 27 eruptions were recognised, consisting in pyroclastic deposits and only three effusive episodes, representing the results of more than 0.5 Ma of volcanic evolution. The eruptive phases were separated by periods of quiescent testified by the formation of paleosols that form bright reddish layers. Ten explosive eruptions generated deposits of pyroclastic fall, which witnessed the events of the type of Plinian, sub-Plinian or Strombolian, while at least nine generated pyroclastic flows and surges that propagated on a small area. Five more, however, are recognised in a succession of pyroclastic fall products, followed by pyroclastic flow deposits. Three stages of effusive activity have formed castings and lava flutes. The products of the first eruptions are present only on Santo Stefano, while the most recent ones are found on both islands. The last eruptive event in Ventotene was explosive; pyroclastic eruptions formed a deposit of a total thickness of more than 30 m, called Parata Grande Tuff, from the name of the place where the best stratigraphic section is visible. This explosion probably destroyed part of the volcanic structure, favouring its subsequent erosion.
Due to its structural and textural characteristics, the succession of the Parata Grande Tuff has been divided into four different sedimentary facies [23], repeated several times within the sequence, identifying sequences from pyroclastic fall, flows, and surges (Figure 1d):
(a)
coarse facies characterised by normal grading (fall deposits);
(b)
massive facies (welded deposits);
(c)
facies characterised by reverse grading (lithic-rich flow deposits formed by the deposition of a traction carpet);
(d)
facies characterised by wavy stratification (low-concentration flow).
The morphology of the island is conditioned by the lithotypes cropping out and their bedding. The west coast, from Punta dell’Arco to Punta Eolo, is made up of tuff cliffs reaching a height of up to about 100 m; the eastern coast, which also includes the study area Cala Nave, is characterised by less steep slopes, partly terraced in Roman times, due to the NE dipping of the pyroclastic deposits.
Along the perimeter of the island, small pocket beaches occur bordered by promontories. The largest of these is Cala Nave. These beaches are typical of high coasts; their length and width depend on the topography of the pre-existing bedrock that was submerged during the last transgression of the sea and partly covered by sediment.
Along all the sea-cliffs, phenomena of instability repeatedly occur (detachment of blocks, rock fall) determining a risk condition on the entire perimeter of the island, with severe restriction of seaside tourism.
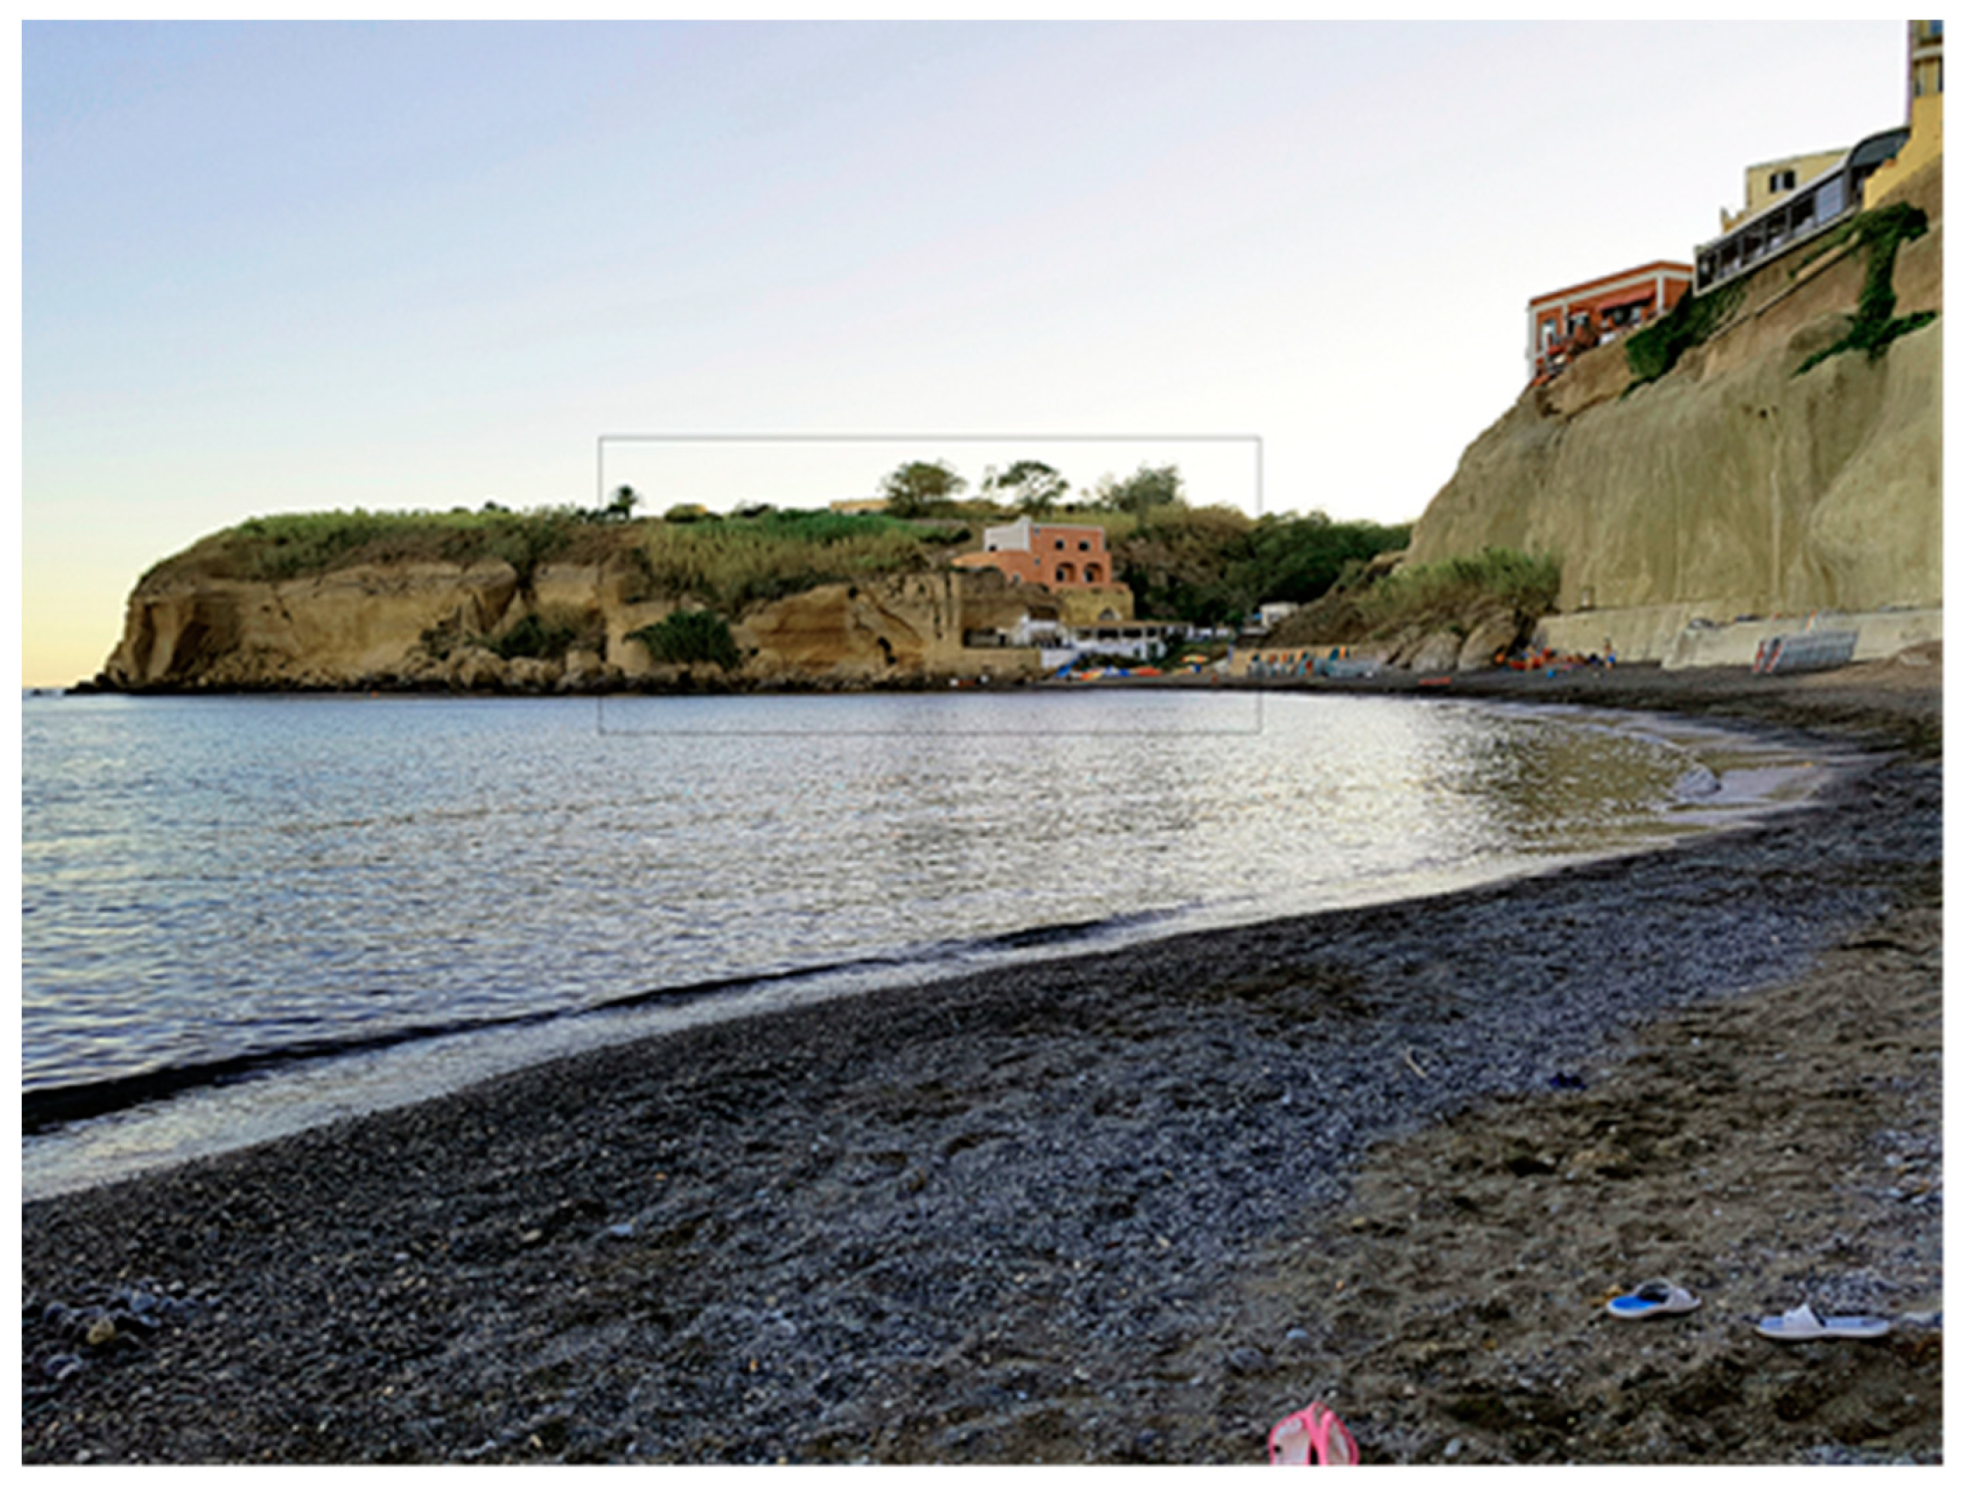
The Cala Nave bay (Figure 1c; Figure 2), object of the present study, has been the subject of numerous safety measures in the past. Most of them consisted in cementing the sea cliff in the central part of the beach and building a protective concrete wall at the base. On the other hand, the cliff that delineates the southern side of Cala Nave has numerous tuff blocks at the base and fractures that isolate considerable volumes of tuff, especially close to the house standing on top of the cliff (Figure 2). This house was almost entirely built on an artificial cavity with reinforced concrete support (column cage). The wall is also distinguished by the presence of caves, shelves, and erosion slopes, as well as the presence of metric blocks in precarious equilibrium, isolated from fracture networks, especially at the upper portion of the edge. These lithological and geomorphological characteristics of the tuff deposit cause the formation of weakness areas in the rocky formation, potentially the site of the rolling up of landslides.
In the study site, the prevailing winds come from the West–SouthWest–NorthWest and NE, with winds from the western sector being the most frequent and intense (Figure 1a). The northerly winds are particularly intense in winter and spring (Source: Rete Mareografica Nazionale, ISPRA (Istituto per la Protezione dell’Ambiente), http://www.mareografico.it).

3. Materials and Methods

To characterise the southern part of the bay, where rock falls and an intensive discontinuity network is recognizable in the sea cliff, a geological and structural survey was also performed through climbing. The geological–volcanological characteristics of the various layers were described and the fracture network was detected. To characterise the morphostructural setting, the TLS methodology was used with the aim to reconstruct a three-dimensional model of the coastal stretch, including the cavities present therein.
The laser scanner model Leica® C10 was used for data acquisition. During the survey, each fixed station was connected to a polygonal traverse in order to create a point cloud. The resulting very accurate dense point cloud allowed the realization of a polygonal mesh and a vertical projection DEM.
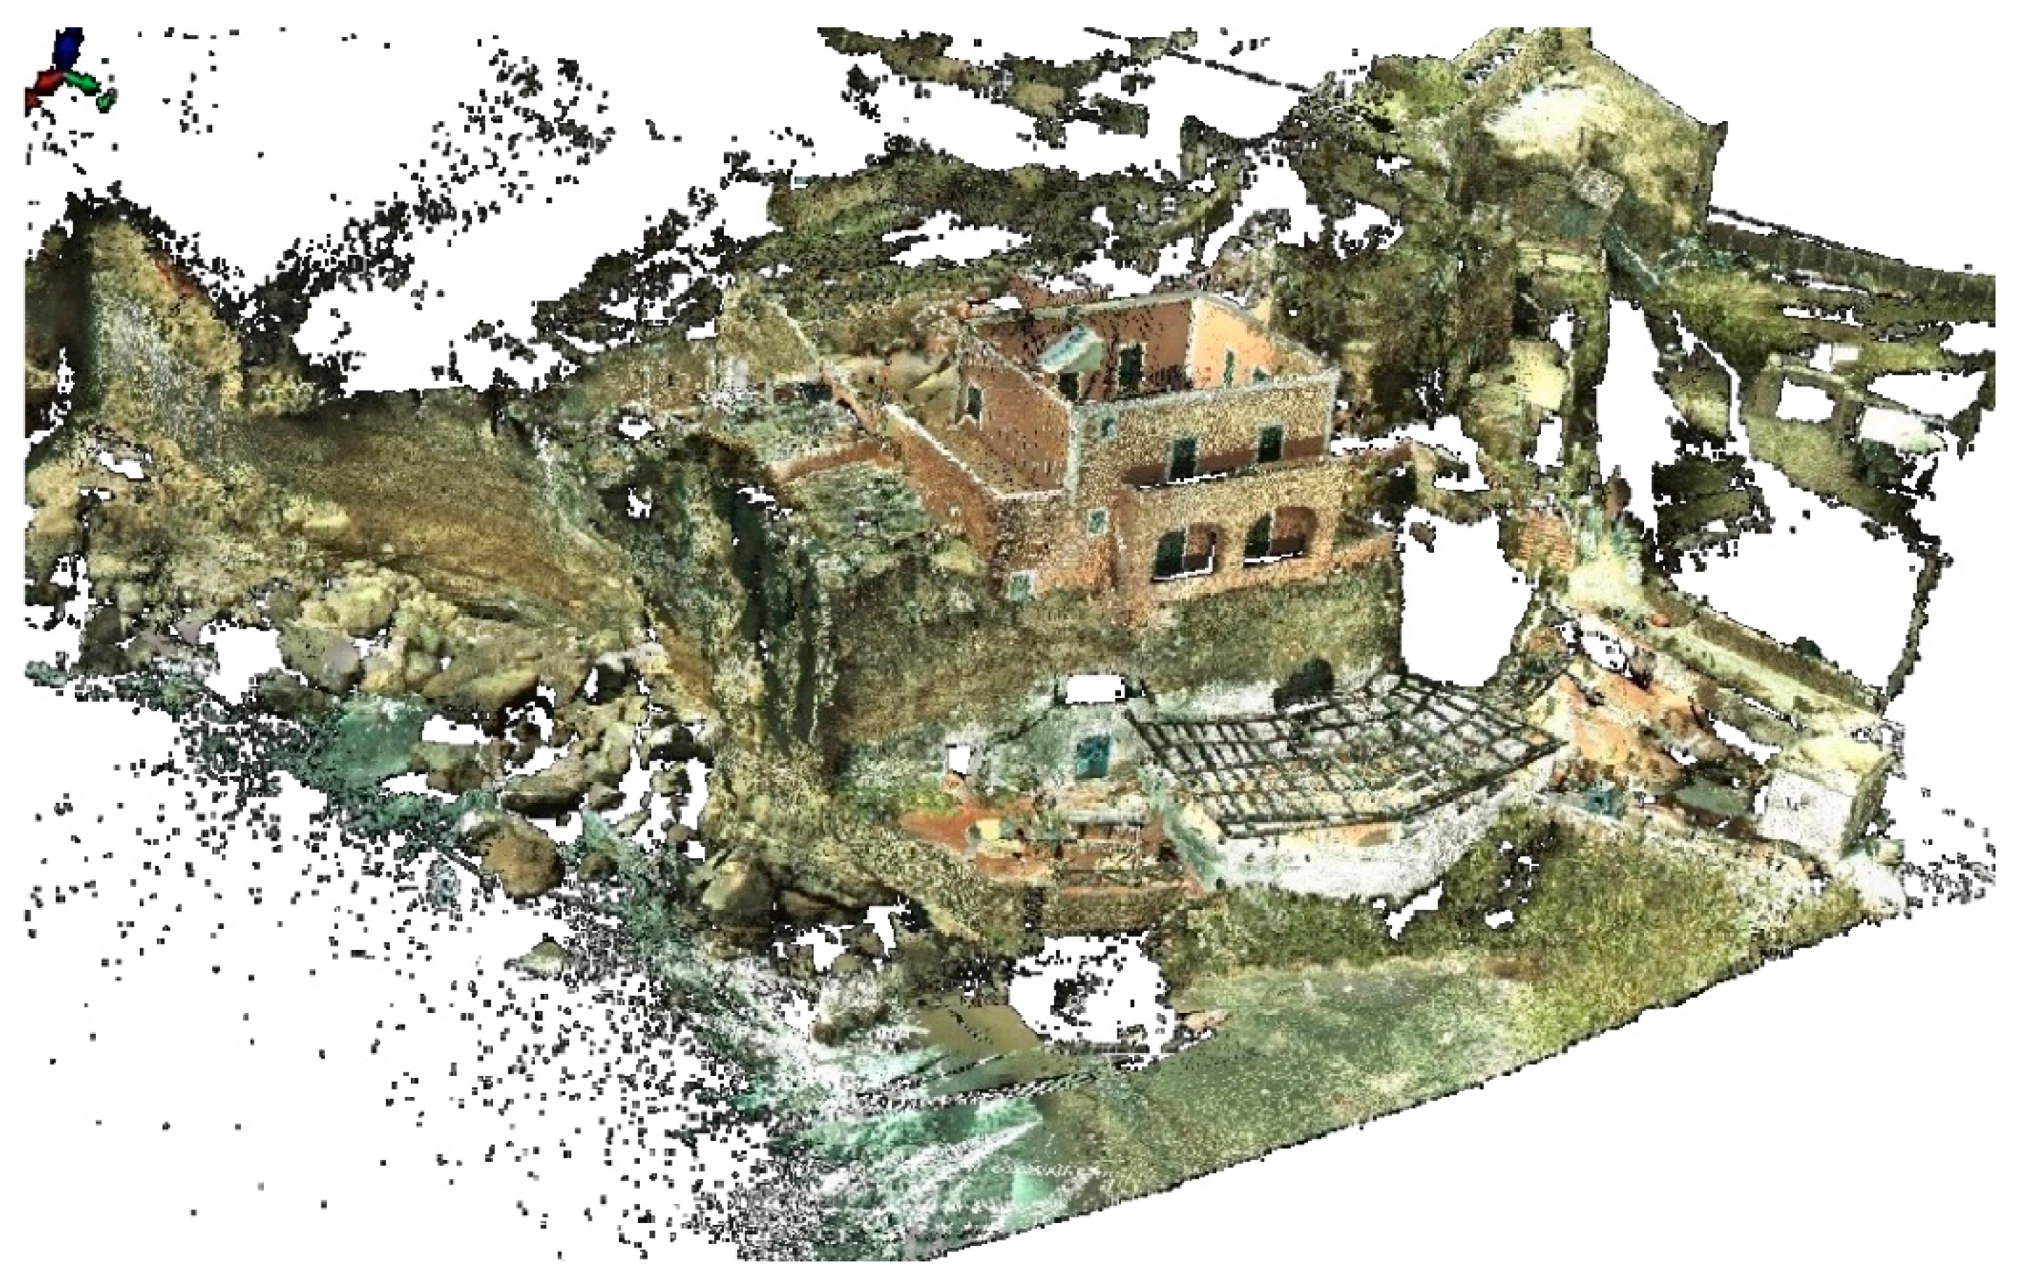
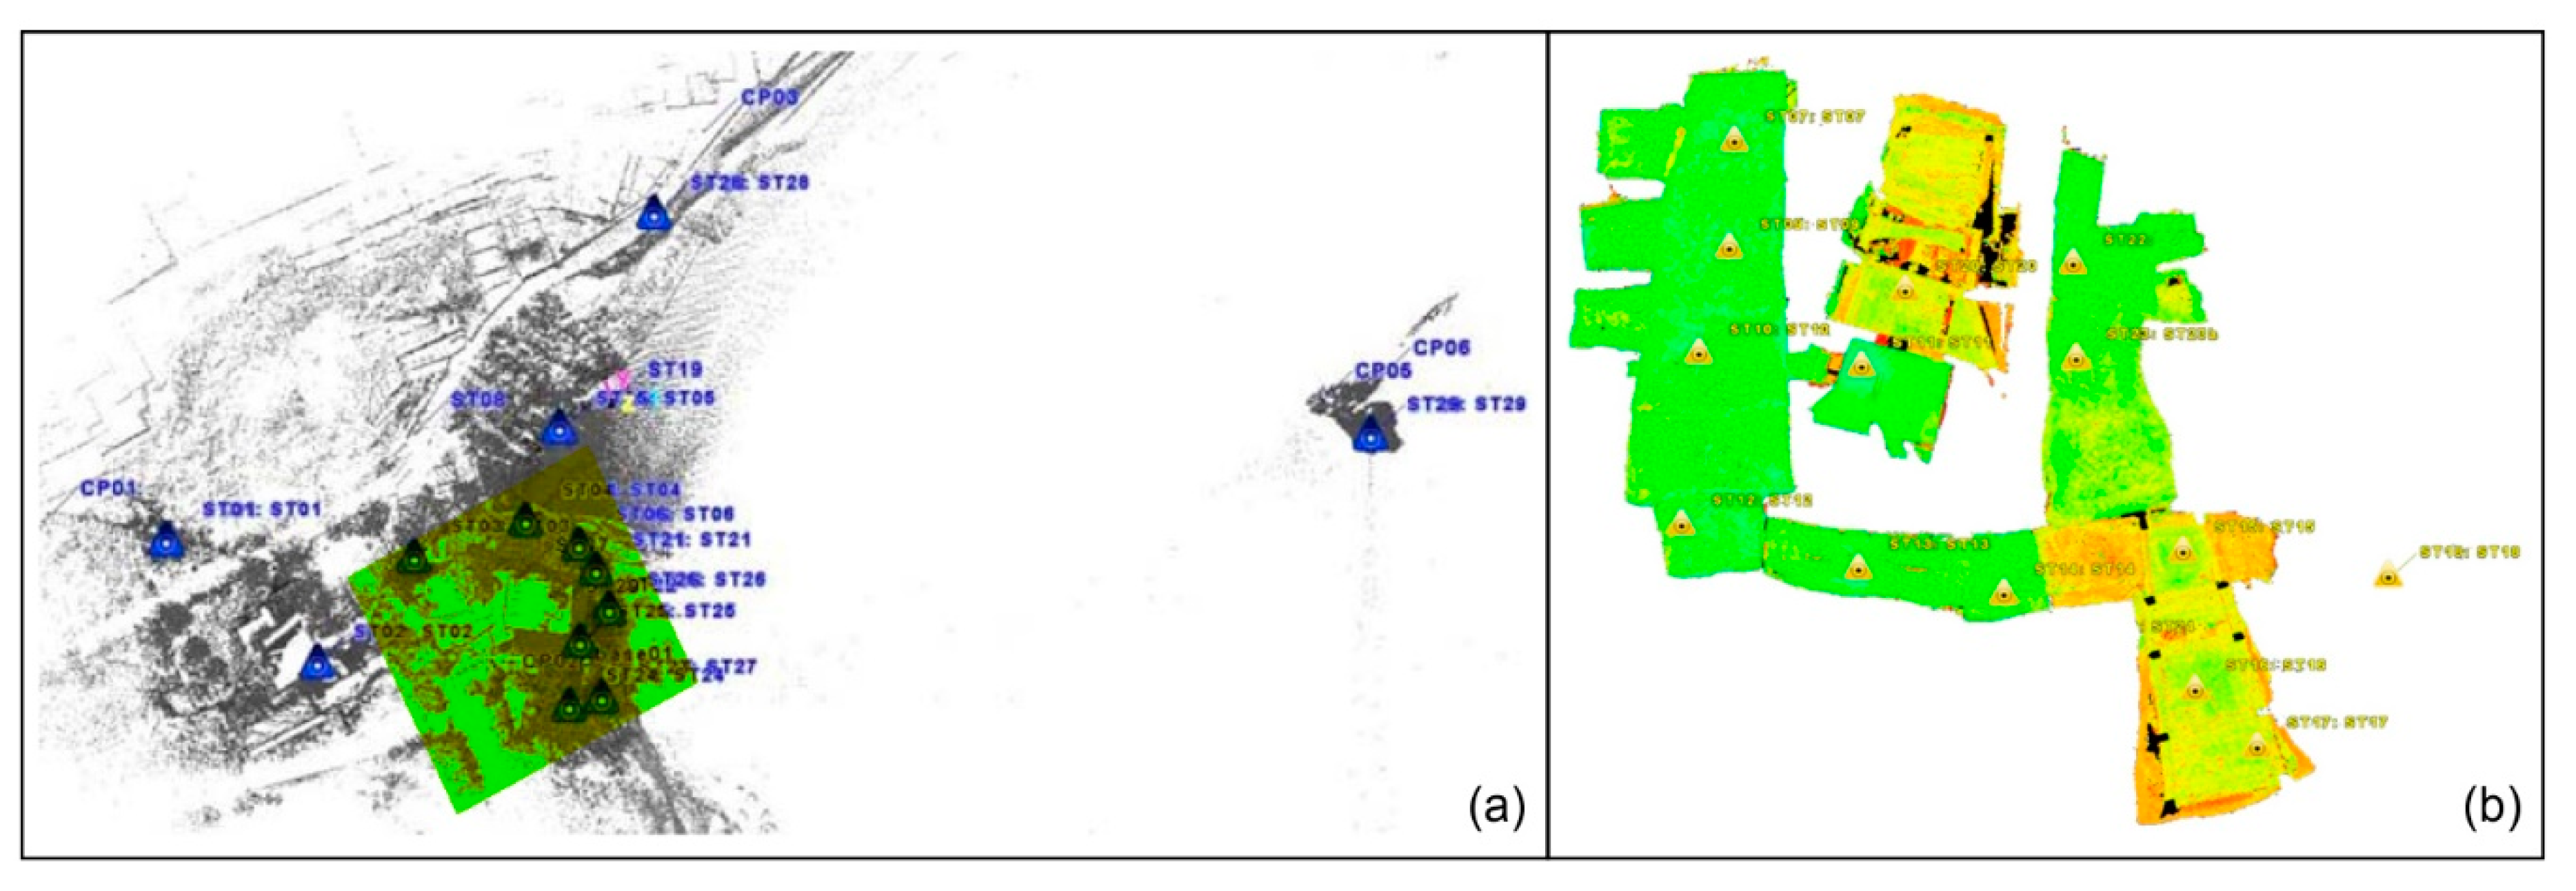
To ensure full coverage of the whole cliff, even in the most engraved portions, including the cavities present behind the sea cliff and below the surface, 29 optimal locations were selected from, in which detailed scans were performed (ST01-to-ST29; Figure 3) to obtain a project with all scans aligned; the resulting point cloud is shown in Figure 4. The laser scanning survey was integrated by photogrammetric strips, acquired by boat, in order to develop digital orthophotos of the cliff vertical projection. The photographic strips were also acquired after the rock fall occurred during the winter 2020 to generate a 3D mesh aiming at understanding the process and performing kinematic analyses. The photographs were taken from different angles, with high resolution digital calibrated cameras (Canon 5D mark II, 21.0 MP and Canon 50D 15.1 Mp), with interchangeable distance-based lens.
Basic data were processed by Leica Cyclon and ArcGIS software to extract the contour map, both in planimetric and vertical projection from their interpolated TIN (Triangulated Irregular Network). The cartographic results were plano-altimetric, and prospect contour maps with topographic profiles at a scale of 1:200, including all the anthropic structures built on the considered area.
Through specific applications, which offer automatic procedures both for the orientation of the images [24] and for the three-dimensional reconstruction of the objects [25,
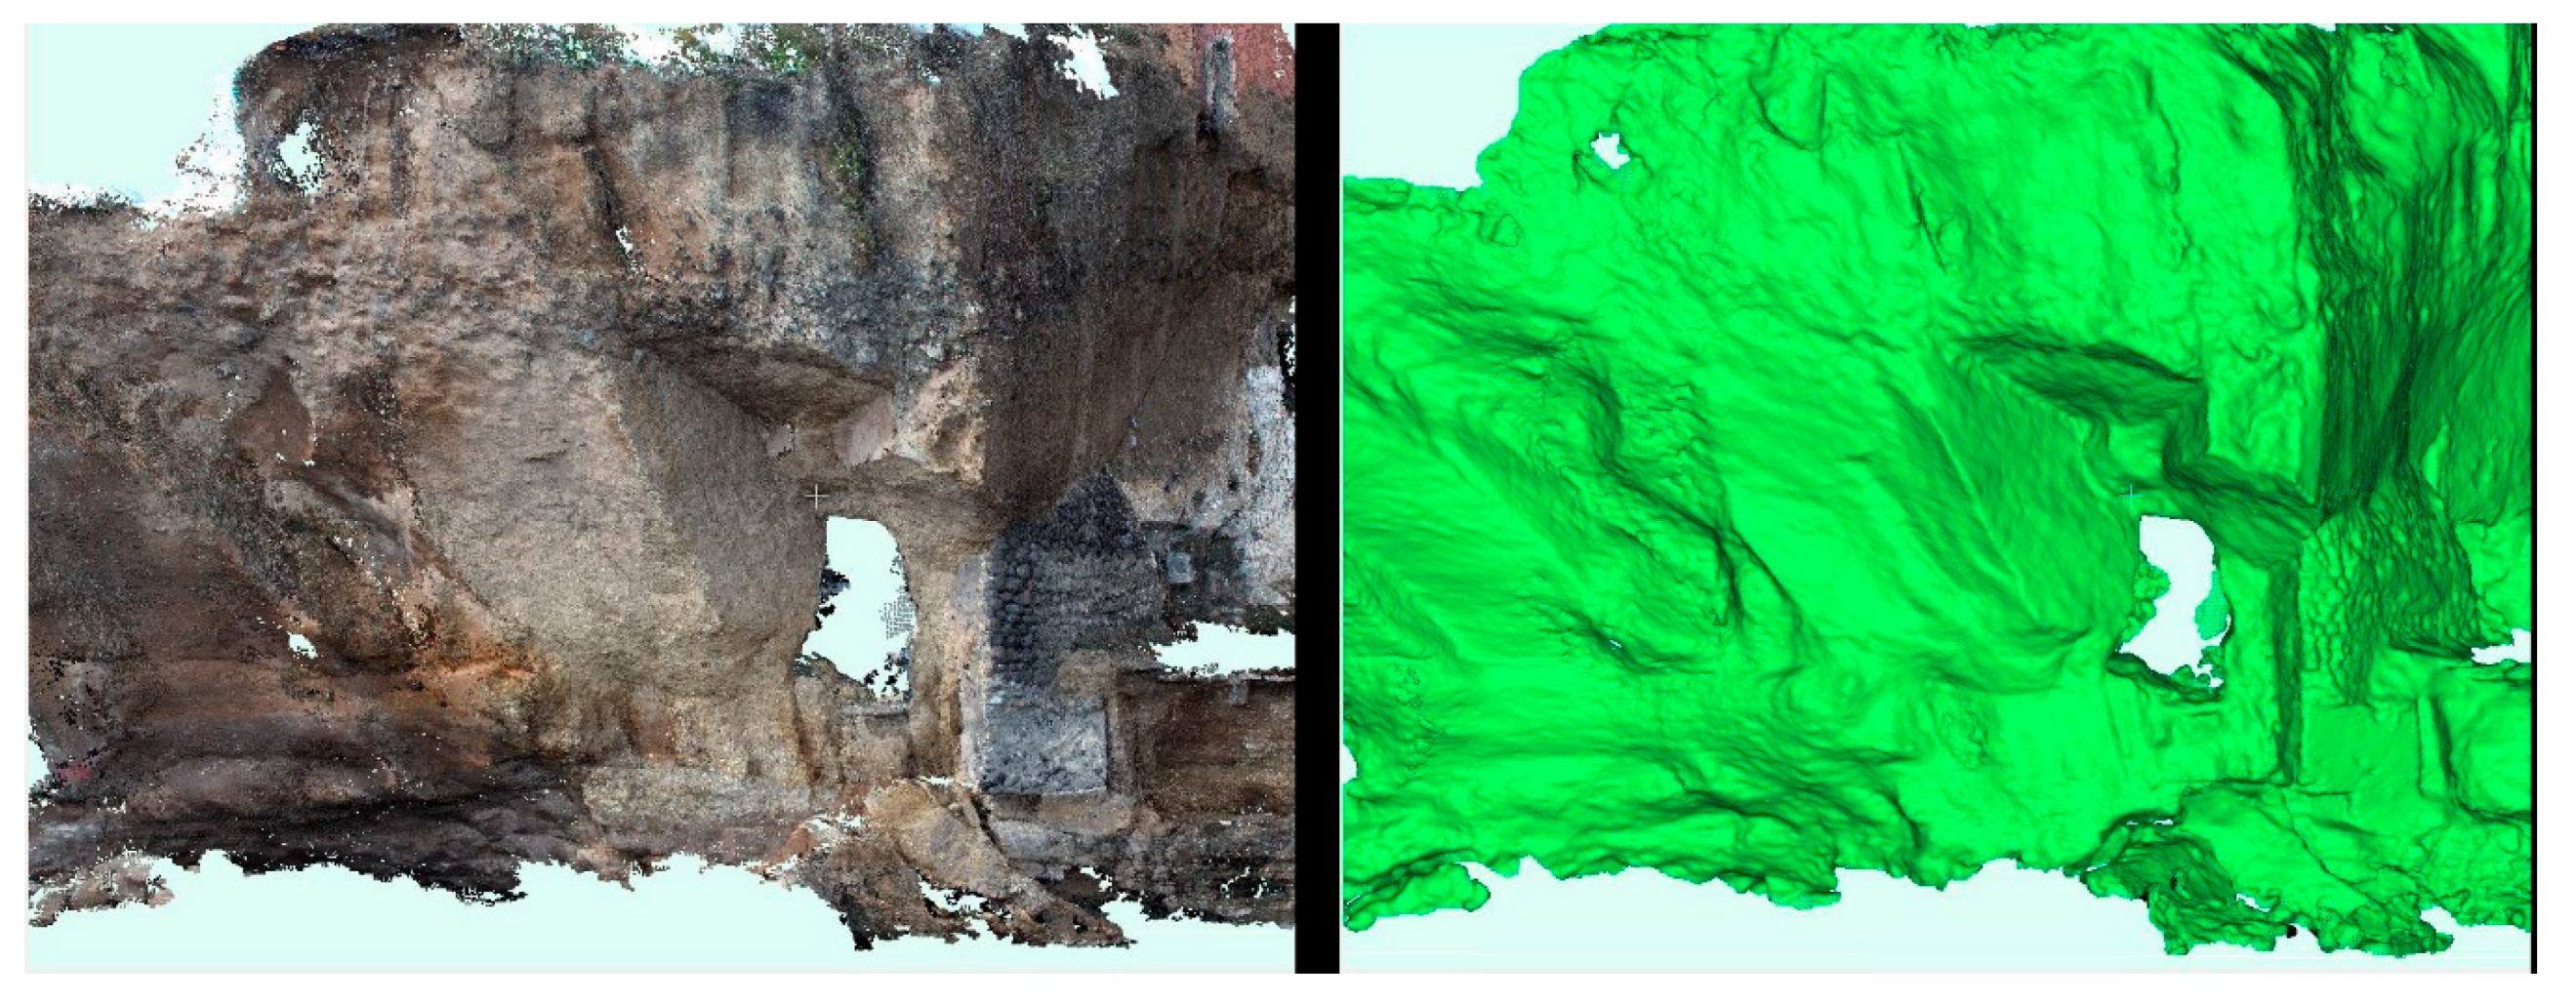
26] at a different scale of representation, a 3D model (dense point cloud) of the cliff slope was reconstructed using a sequence of a significant number of images taken by different cameras, with very satisfactory results in terms of accuracy.
The SfM technique is a quite novel, low cost, photogrammetric methodology, useful for high resolution topographic reconstructions especially in poorly accessible areas [27]. This methodology is based on fundamental principles of stereoscopic photogrammetry, as the 3D structure is reconstructed through a series of superimposed images. Instead, it differs from traditional photogrammetry by being able to reconstruct automatically the geometry, the position of the acquisition camera, and the orientation of the images, through an algorithm that identify common elements in the analysed images; thus, not requiring georeferenced targets pre-positioned [27]. These common elements are identified in each image, allowing an initial estimate of the coordinates of the object, which are subsequently refined through a non-linear iterative minimization based on the least squares method [27]. The SfM methodology provides a point cloud very similar to the TLS survey. In this study, the commercial software Agisoft Photoscan (St. Petersburg, Russia) was used.
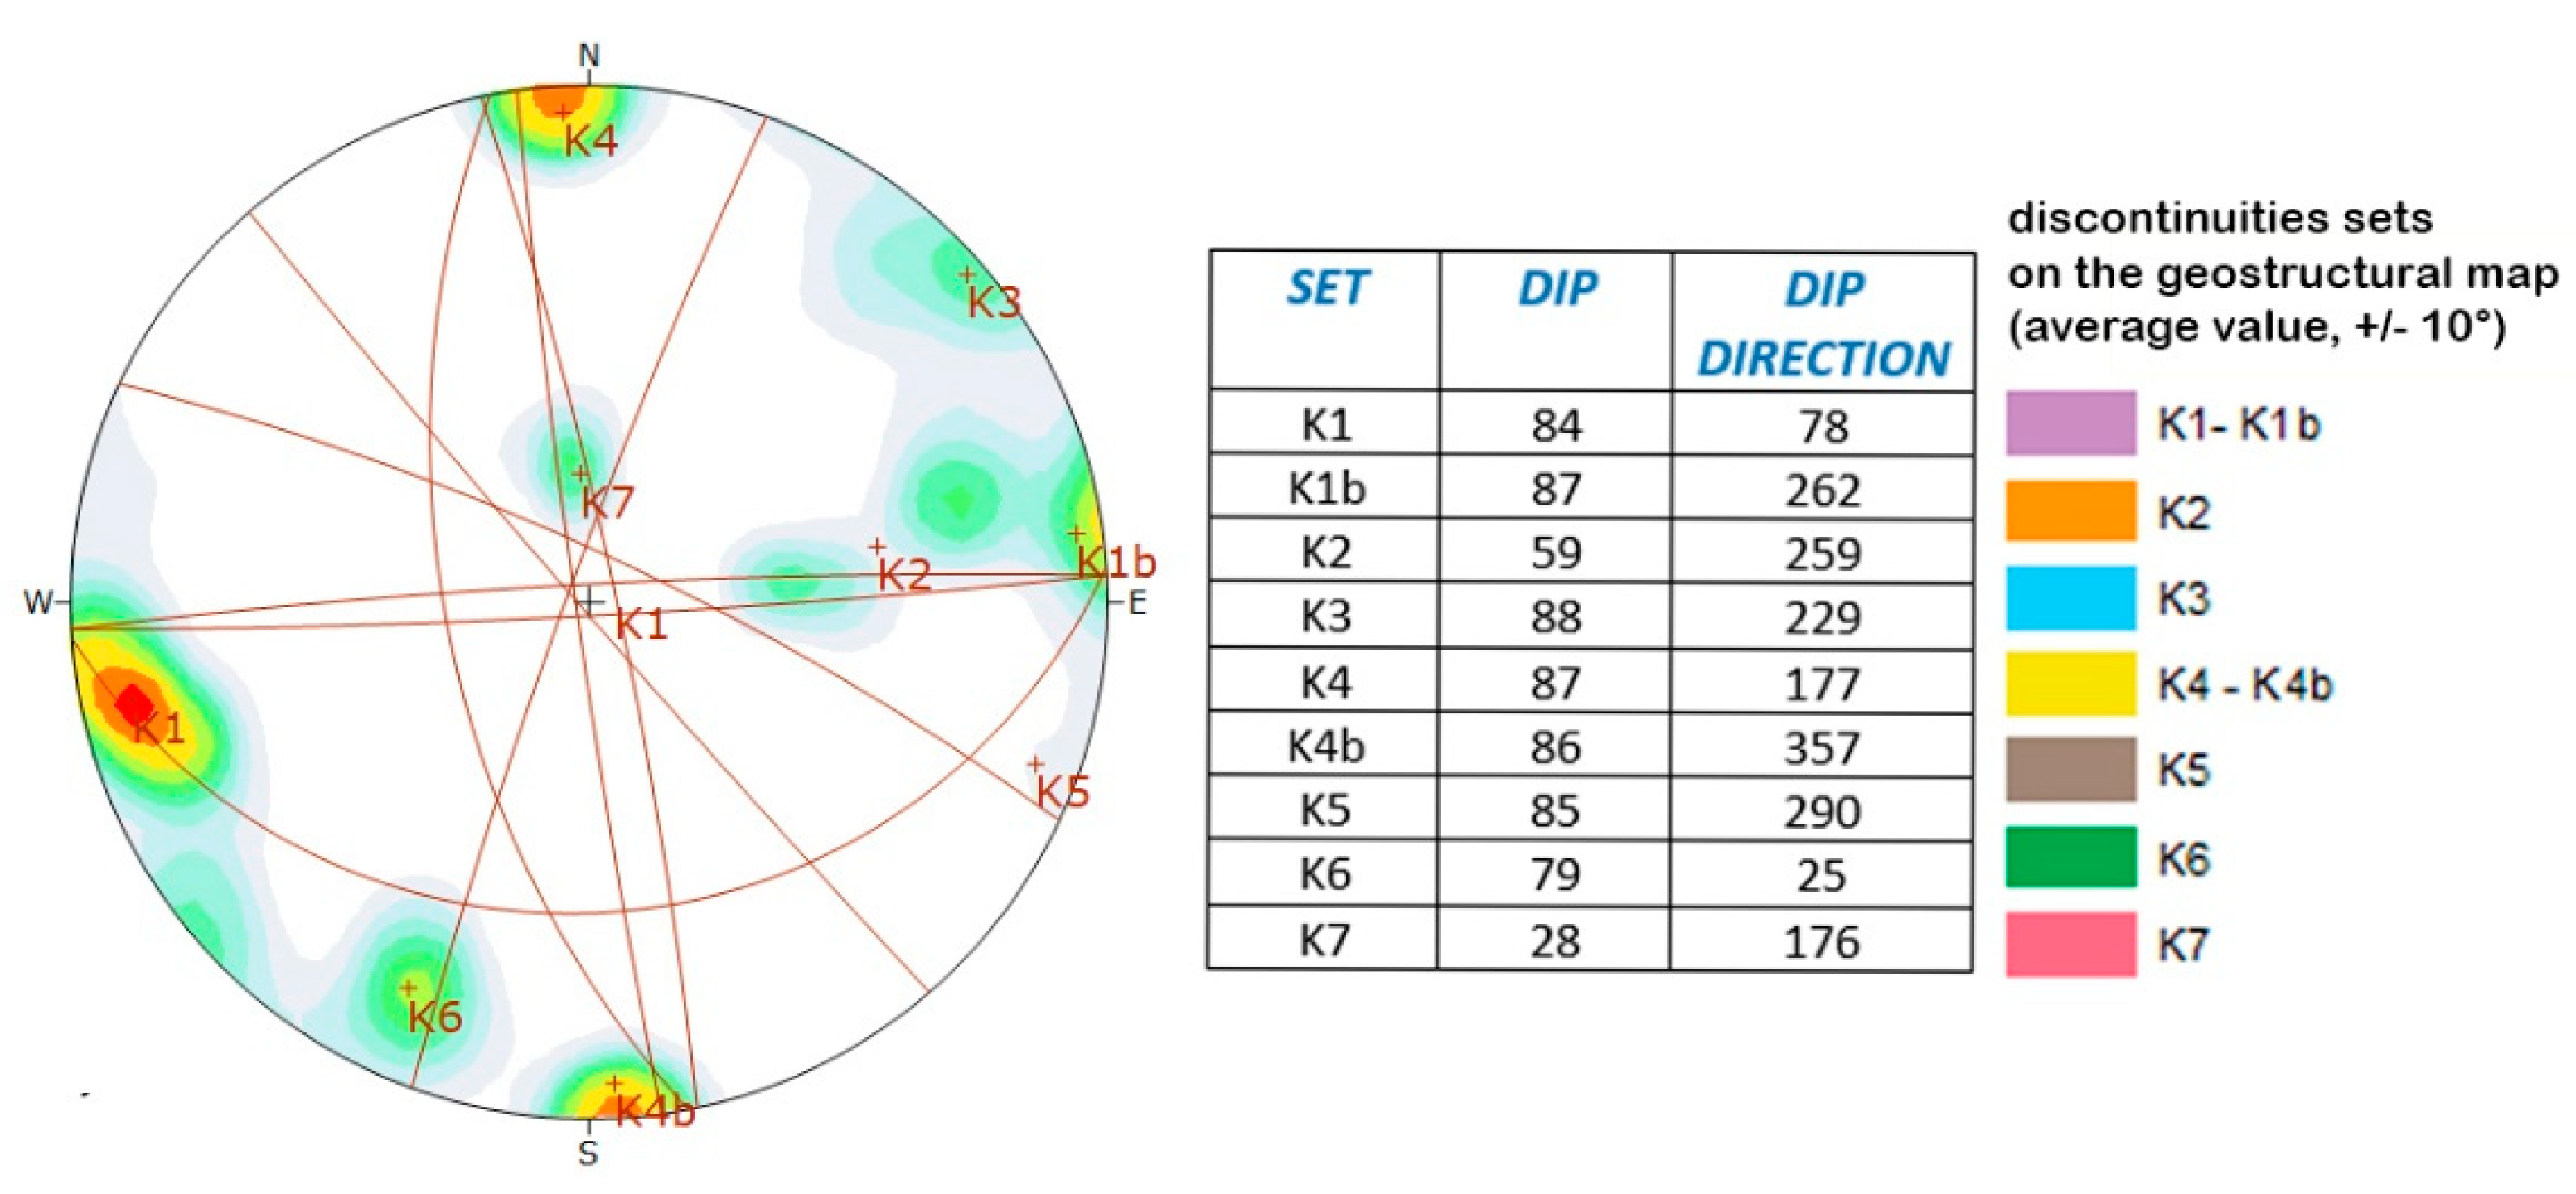
In addition, to produce 2.5-dimensional (2.5D) (i.e., DEM) and two-dimensional (2D) cartography, the fracture network was extrapolated from the point clouds obtained from the TLS and SfM surveys through methods aimed at defining remotely the structural characteristics of the rock masses. The orientations of the exposed planes representing discontinuity sets can be extracted with manual methods [28], or in a semi-automatic or automatic way [29,30,31,32]. In this study, a Geographic Information System (GIS) platform was used to extract geostructural orientation of exposed planes representing discontinuity sets, starting from the georeferenced polygonal 3D mesh, and importing it in ArcGIS as a multi-polygon file, where each triangular polygon corresponded to a facet of the mesh. The dip and the dip-direction of each polygon was then calculated through a GIS processing (i.e., spatial analysis tool), following Matano et al. [18]. Subsequently, the main discontinuity sets were classified by using queries, plotting them through stereographic projections. The resulting discontinuity network was finally validated by field observation through climbing.
Lastly, a roto-translation was carried out to obtain a vertical orthometric projection of polygon, parallel to the cliff, and extract vectorial and raster 2.5D maps.
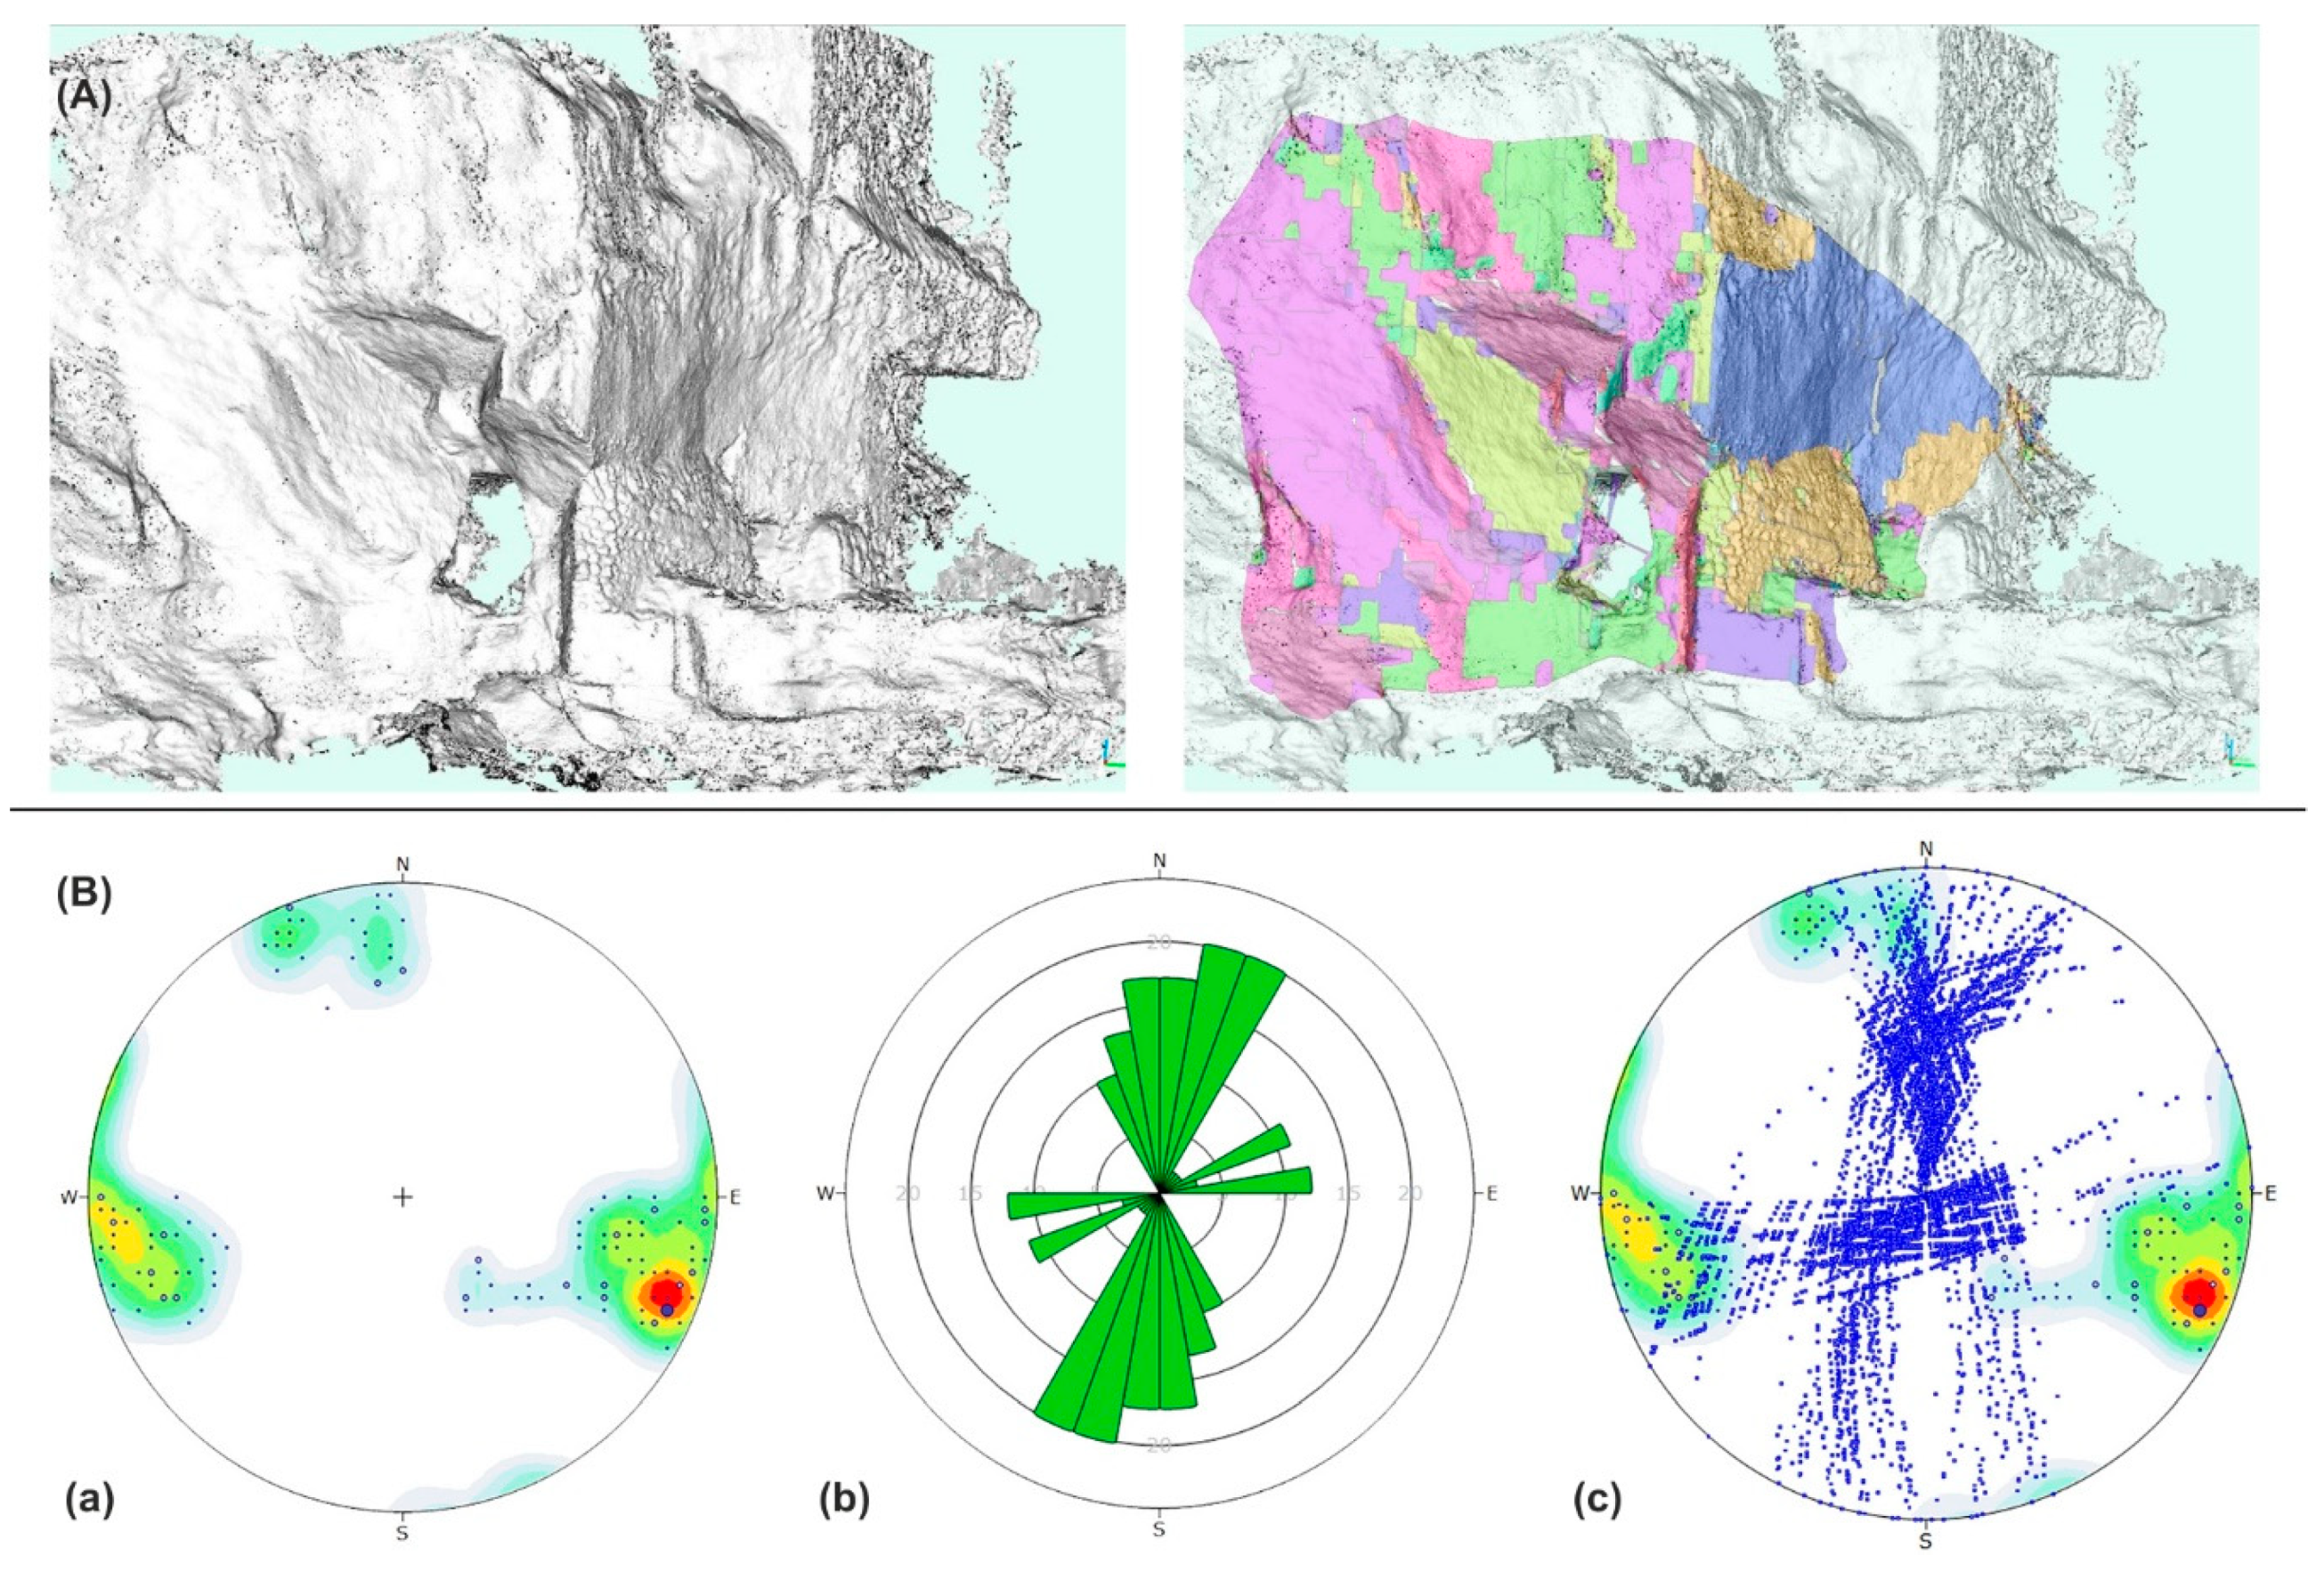
Recently, with the aim to analyse the new morphostructural setting following the failures that occurred in the winter 2020, and to assess the related kinematics, a semi-automatic approach was used [32], which allowed the extraction of polygons (facets) from a point cloud, calculating their dip and dip direction values. Each polygon was identified and generated by dividing the cloud into a grouping of adjacent points that identify a plane, based on dimensional parameters entered by the user. In order to minimize the errors in the recognition of the planes, a preliminary analysis carried out by the user is necessary, identifying the exposed planes representative of discontinuity surfaces, then defining the dimensional characteristics (geometric extension) necessary to enter the right parameters and be able to launch the algorithm. This type of approach is very useful for measuring the orientations of the discontinuities emerging from a rocky wall. In order to carry out the analysis, an algorithm implemented in the open source software CloudCompare, version 2.10.2, called FACETS [32] was used. The result of the analysis is, therefore, a set of planar polygons obtained from the original 3D point cloud. Moreover, the software interface allows to subdivide into classes, through the dip direction/dip values, with the respective variation range, directly on a stereogram which shows the poles of all recognised polygons, and can be viewed directly on the 3D cloud at colours (RGB point cloud). Moreover, in this case, the main families were then defined by exporting the data in Dips® (RocScience; University of Toronto, Toronto, Canada). This software was then used to make a comparison and a correlation between the analyses carried out using the two different methods, i.e. [18] and [32].

4. Results

4.1. Stratigraphic Reconstruction

The cliff that delineates the southern edge of the Cala Nave beach consists of a pyroclastic flow deposit attributable to Parata Grande Tuff—Unit Z of Perrotta et al. [23]. Here, the thickness of this formation is about 10 m. The base of the cliff is covered by slope breccia and gravelly beach deposits together with meter scale tuff blocks originated by rockfall. Based on the field survey conducted, and the literature data, it was possible to reconstruct the volcanic series, described in Figure 5. The geological features were then draped on the vertical contour map obtained with the TSL survey to highlight the main lithological setting of the site. The pyroclastic sequence is characterised by six main lithofacies originated by pyroclastic flow and surge processes (according to Perrotta et al. [23]). Along the cliff, very coarse grained matrix-supported breccia layers alternate with thin-laminated lapilli and pumice beds and laminated fine ash deposits. The weathering processes resulted in differential erosion markedly controlled by the bedding and grain-size variation of pyroclastic deposits.

4.2. Geomorphological and Geostructural Characterization

The TSL surveys have allowed to precisely reconstruct the topography and the location of the cavities quarried inside the promontory (Figure 6). The presence of cavities is quite common across the island. They have represented ancient quarries for the extraction of tuff for building since the Roman times. The cavities found behind the studied sea cliff are largely reinforced by concrete structures and partly used for recreational purposes.
On the sea side, mechanisms of morphoselection are responsible for the differential erosion of the volcaniclastic sediments; moreover, rock falls locally occur. At the base of the cliff, along the stretch of the beach that develops to the foot, a deep erosion groove is recognised (Figure 6, profile A–A’), due to the erosive activity of the sea, and responsible for the destabilisation of the rocky wall. Moreover, most of the cliff is characterised by subvertical walls (see Figure 8). The topographic profiles of Figure 6 show vertical walls close to the beach side of the cliff; a deep notch develops at the base of wall, which evolves as overhanging wall to the seaside.
The fracture framework along the cliff surface, as well as inside the cavities, carefully examined, shows discontinuities that are mostly independent of each other, without continuity and, therefore, do not seem to isolate blocks. Within the cavities, there was no evidence of the presence of eroded sediments, nor the presence of dripping and/or stagnation of water, which could suggest a connection of the fracture network with the surface. Many fractures are syndepositional, linked to the processes of tuff formation, with generally smooth and concave surfaces that do not isolate tufaceous blocks. However, along the seaside part of the cliff, fractures were recognised, intersecting such as to isolate large rock surfaces.
Semi-automatic geostructural analyses performed on the entire tuff cliff show a high dispersion of data (Figure 7) caused by the peculiar morphology, resulting from intense wind and marine erosive action. For this reason, we selected only the discontinuities characterised by parameters considered significant for stability assessment, such as extension in space and length. Six main discontinuity sets were selected, two of which were characterised by opposite inclinations being close to verticality; for these latter, given the importance of the dip direction for the stability of the rock wall, they were differentiated (K1 and K1b) and considered as different families. Figure 7 shows the main sets by stereographic projections and a summary table that also represents the legend of the geostructural map of Figure 8b. In the latter, a vertical contour map is represented with the overlay of the exposed planes and the discontinuity lines that are more relevant to the stability of the tuff cliff, and through a red striped pattern, the rock masses considered to be in precarious stability.
Following the rockfall that occurred in winter 2020, we performed an accurate photographic reportage to obtain a 3D reconstruction through SfM analysis. In Figure 9 is a detail of the model extracted, used for geostructural and geomechanical analysis.
In this case, we used the FACETS plugin implemented in the CloudCompare software to perform the planar facet extraction and calculate their dip and dip direction [32].
An insightful study was performed on detachment planes related to the main scarp and the crown. Figure 10 shows the result of semi-automatic analysis and related stereographic projections.
Finally, we compared the morphological changes across almost 60 years. In Figure 11, the overall loss of tuff blocks at the foot of the cliff (yellow circle in Figure 11a) is evident; whereas, the cliff side facing the beach underwent only anthropic modification (e.g. the small terrace behind the first cavity on the seaside; arrow in Figure 11b). The erosion at the base of the cliff resulted in the formation of a deep groove that caused the fall of the terrace during the winter of 2017 (yellow arrow in Figure 11c). Further detachments involved the cliff facing the sea during the winter 2019–2020 (Figure 11d).

5. Discussion

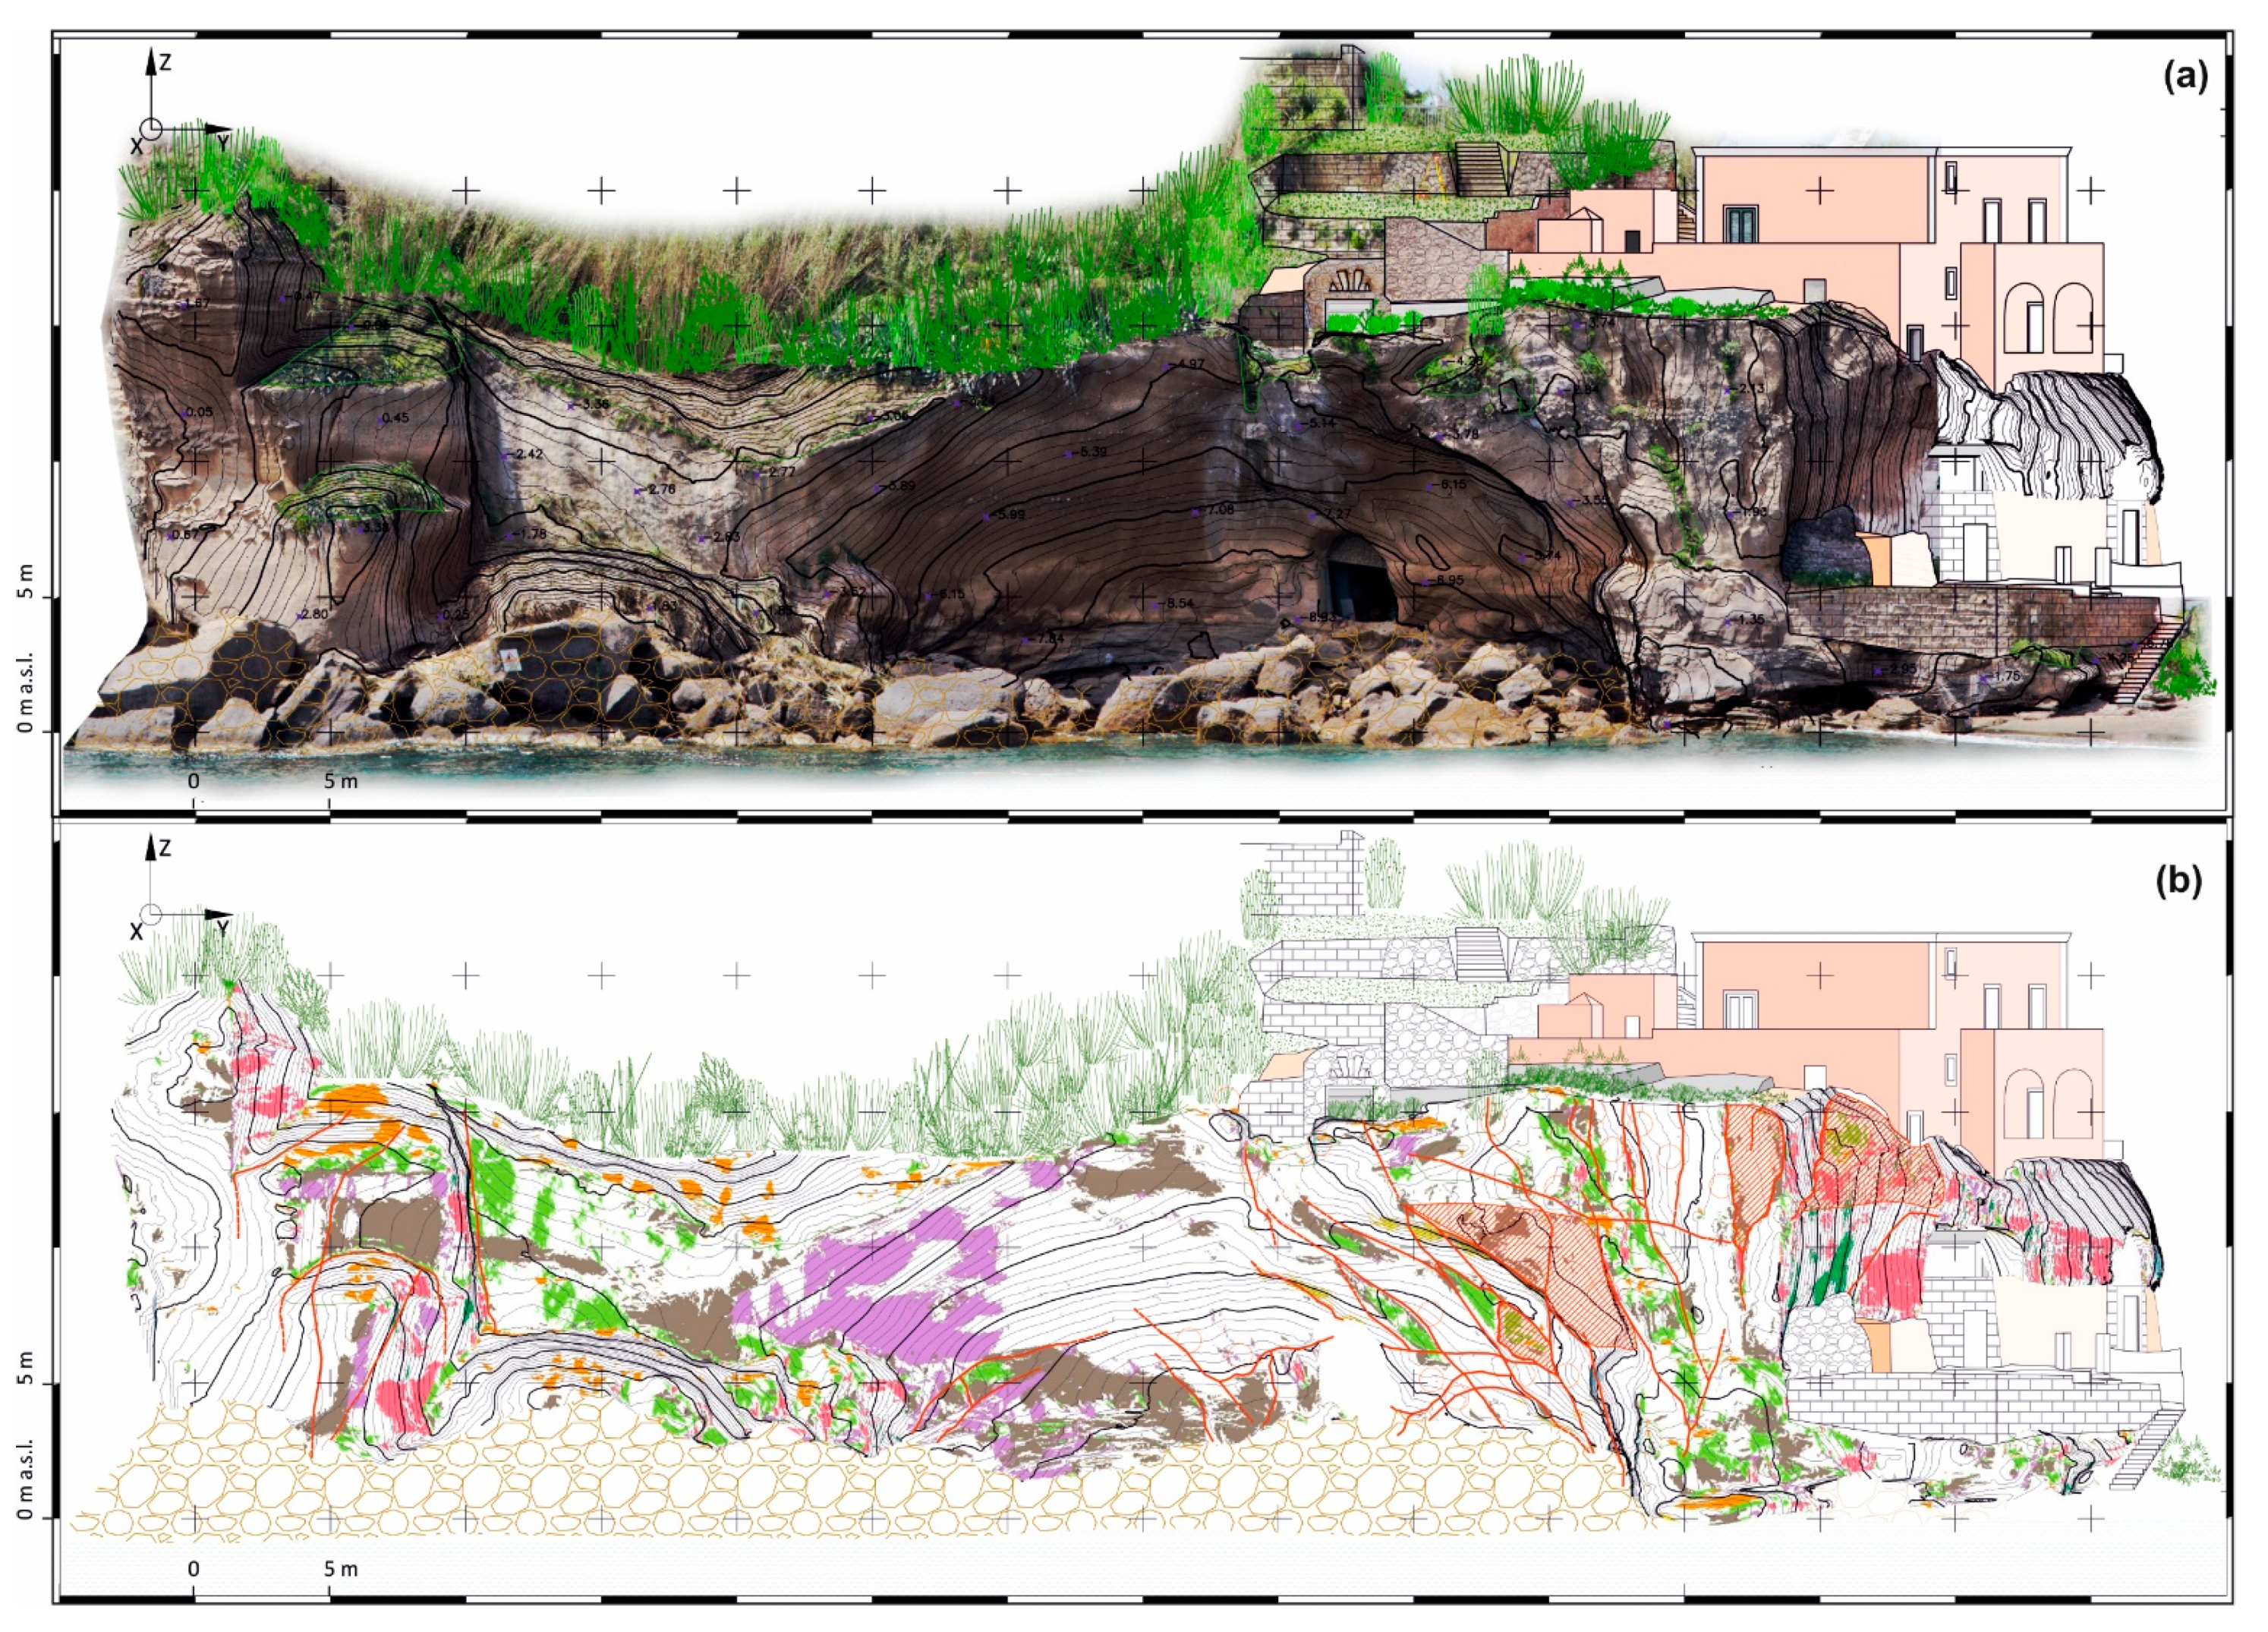
The methodology and related results described in the previous sections show that the integration of traditional geological/geomechanical surveys and remote geostructural investigations via TLS and SfM provide an accurate characterization of the coastal rocky cliff.
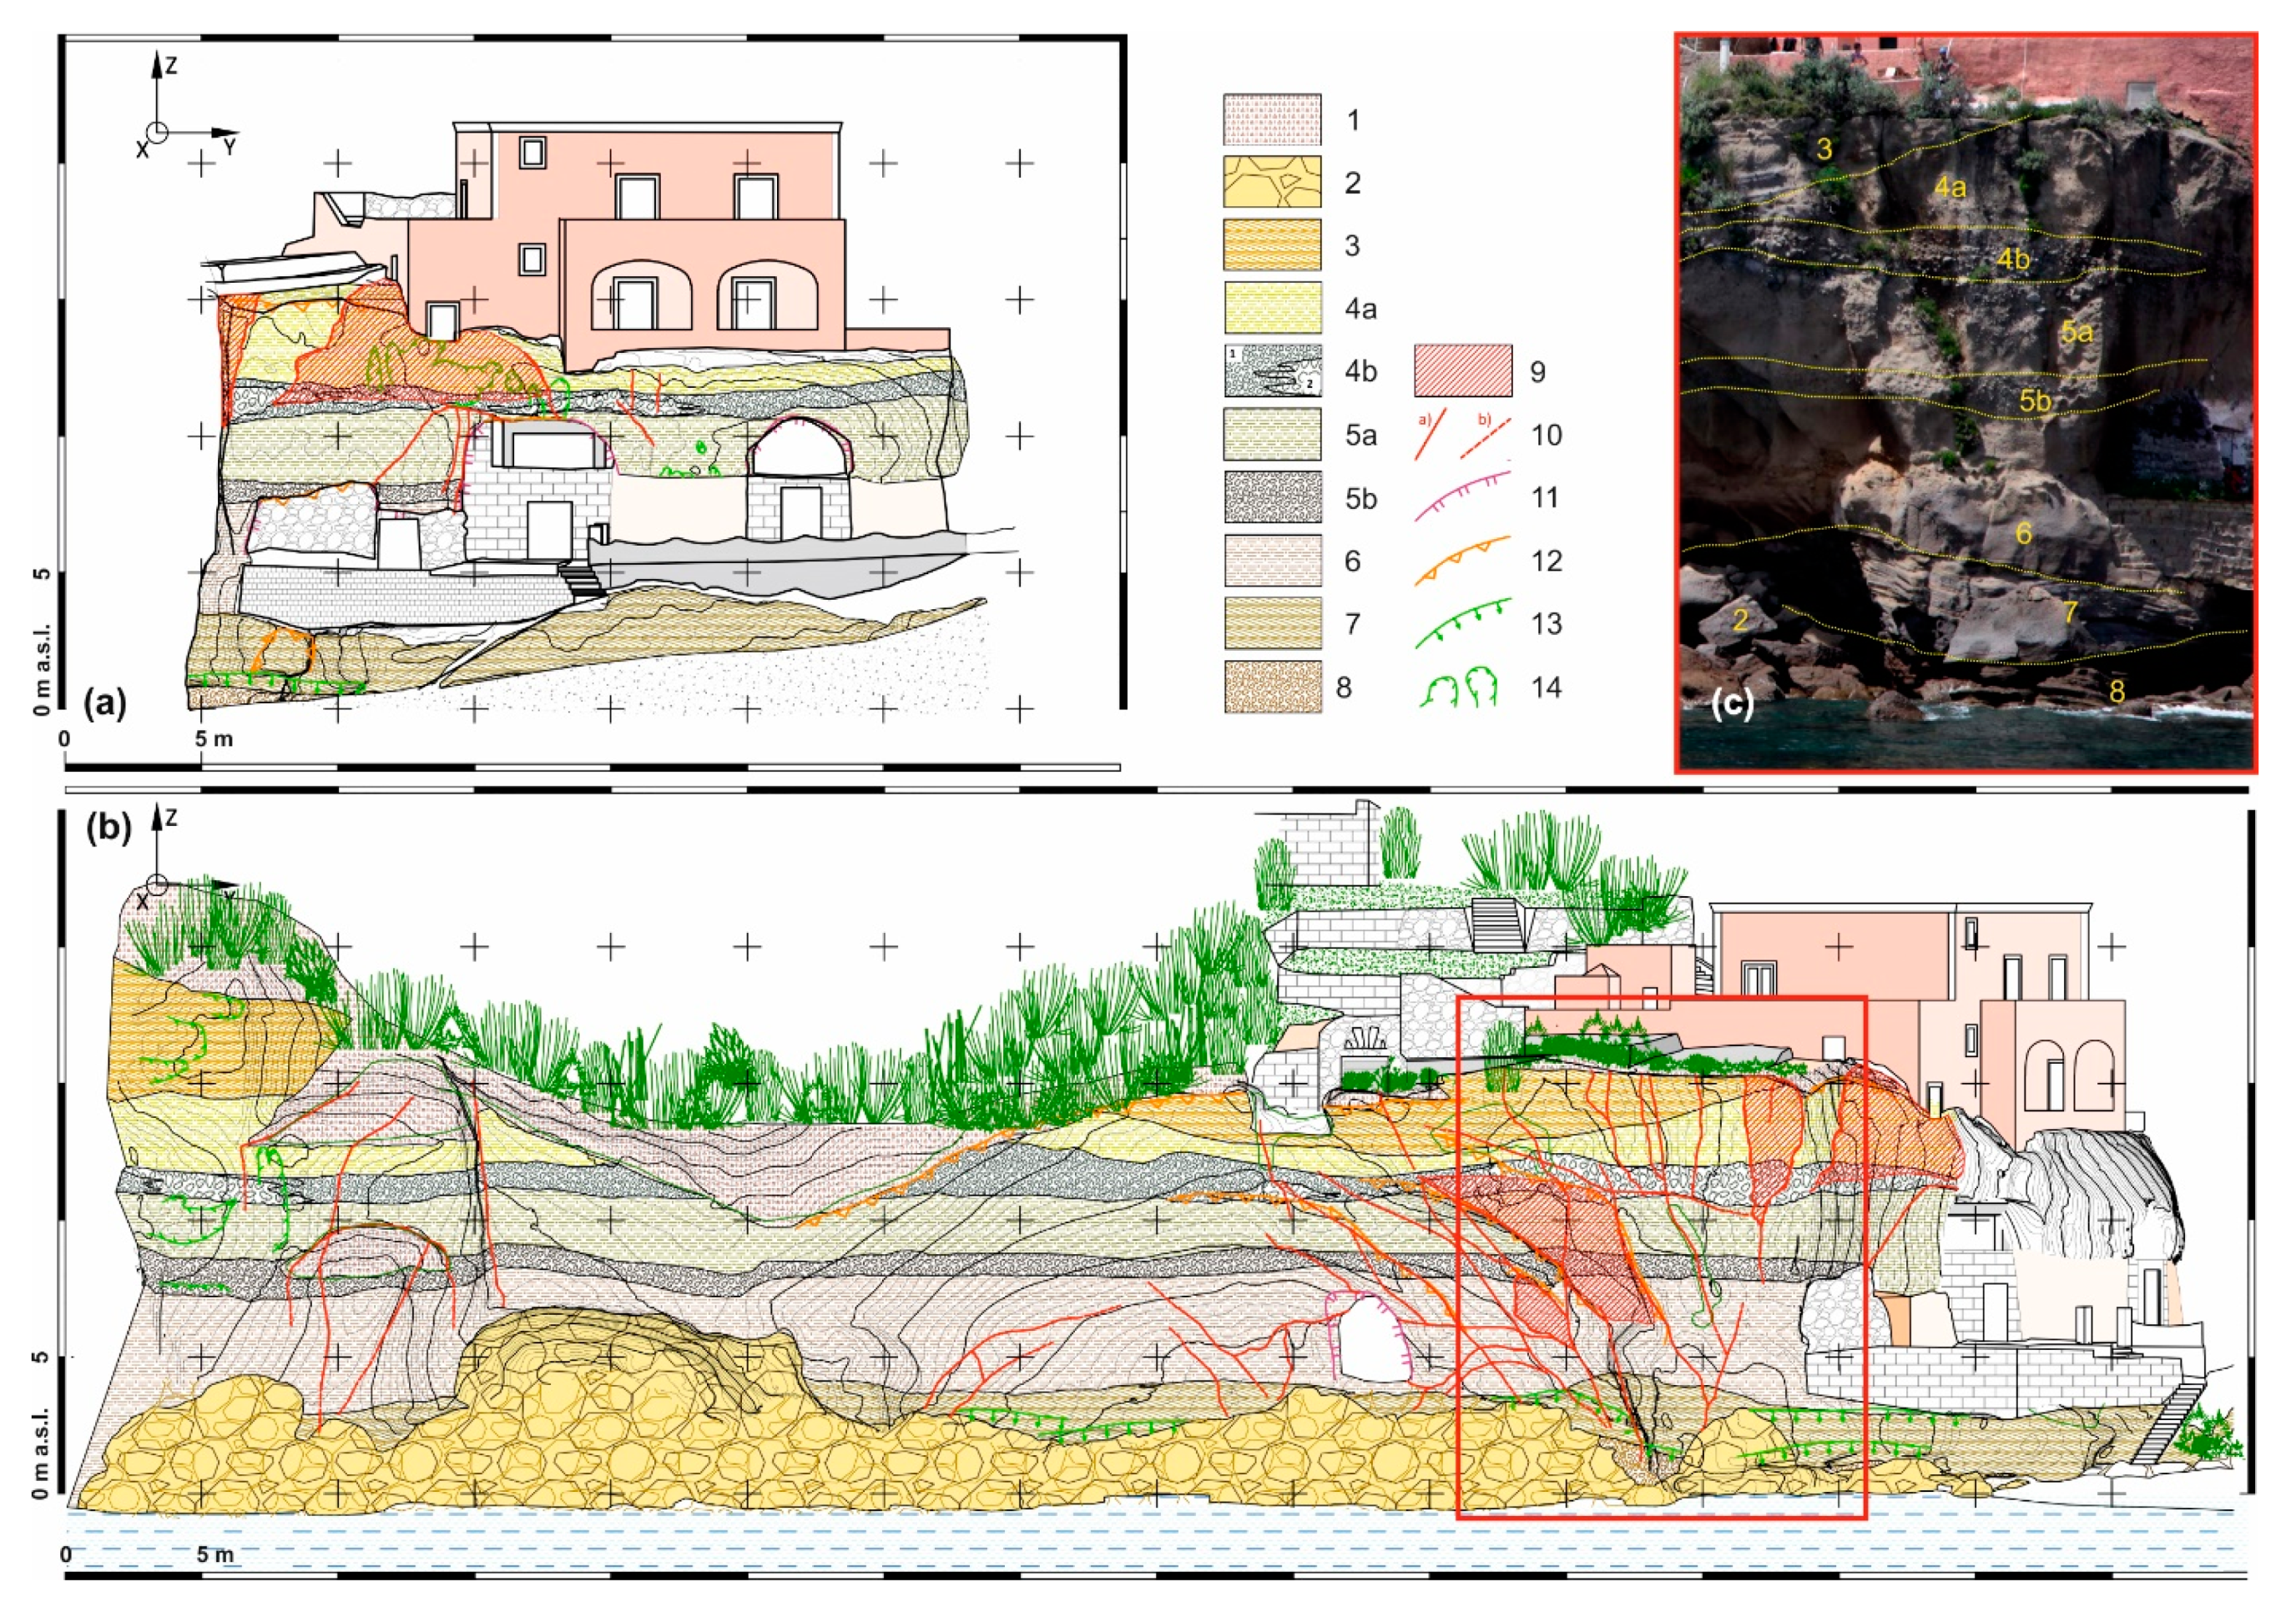
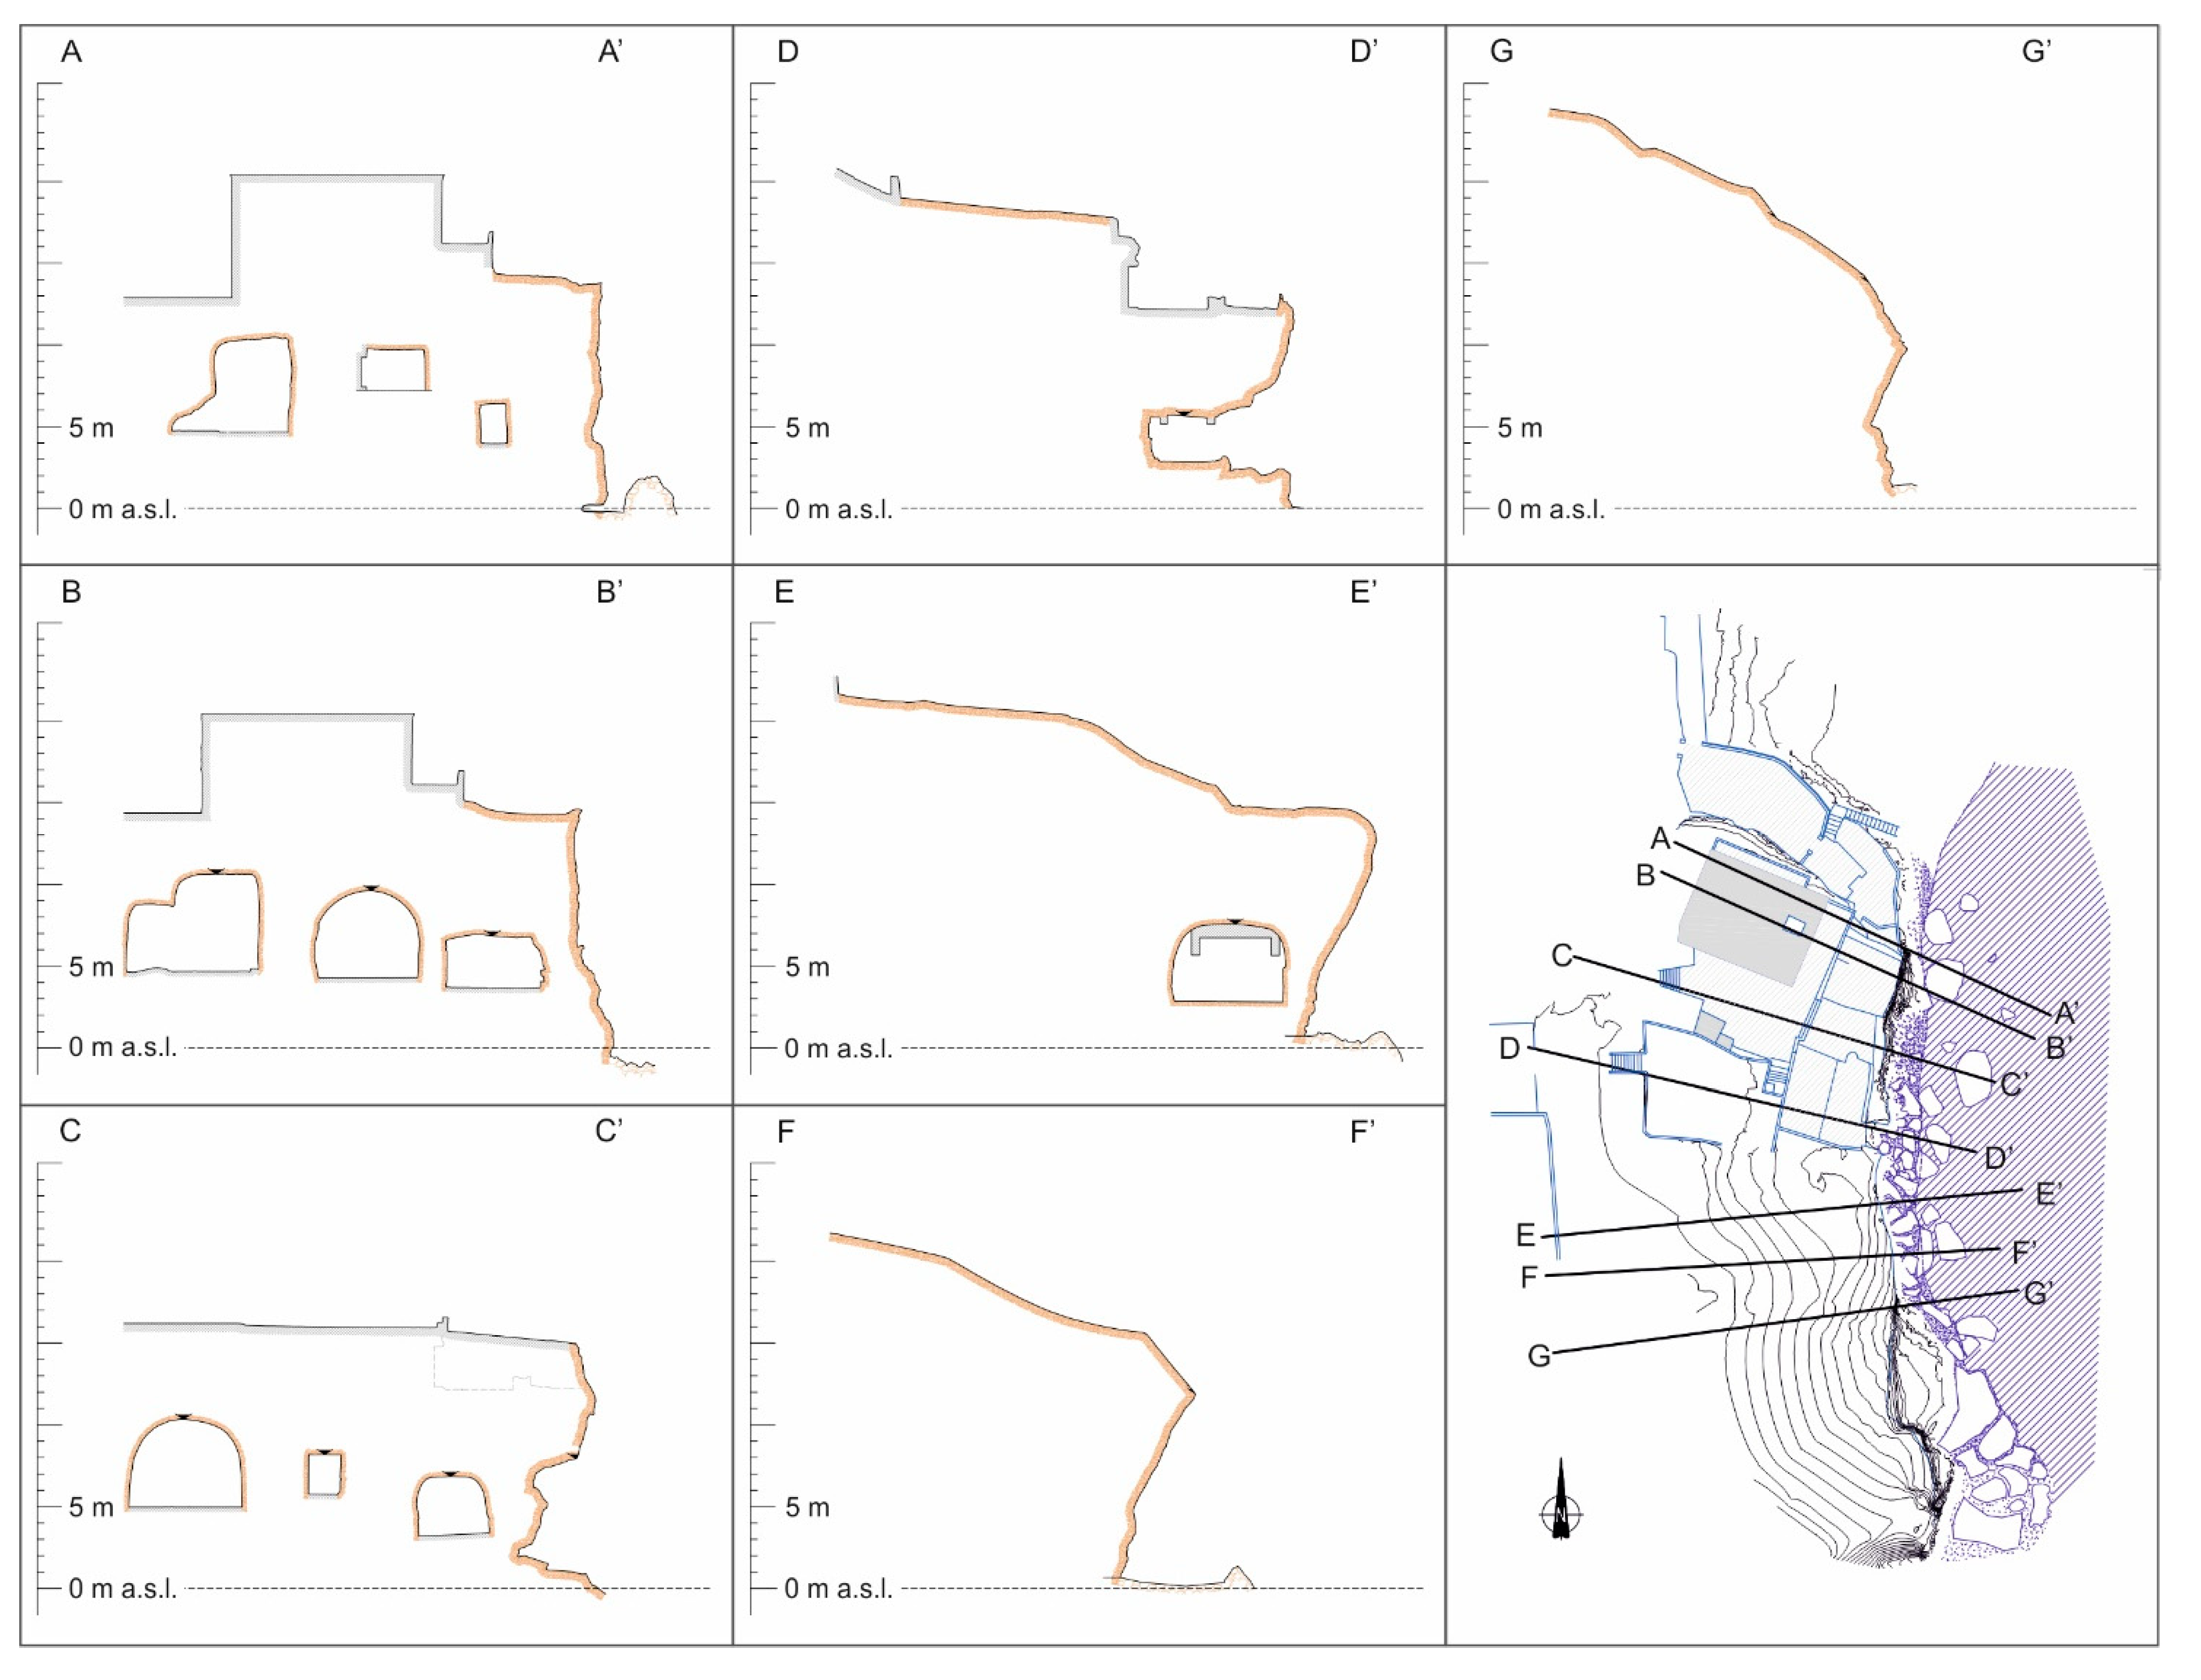
The 3D model developed on 2012 survey allowed the analysis of a large cliff portion to explore the overall stability and highlight sites potentially critical, correlating the geological/geomechanical framework, and the anthropic structures present immediately behind and above the sea cliff (Figure 8).
The in situ detection of structural discontinuities of the rocky wall plays an important role for the assessment of the failure mechanism and its susceptibility. This is even more important where the weathering and sea actions are the main erosion processes affecting soft rock cliffs formed by pyroclastic rocks (e.g., tuff) [33].
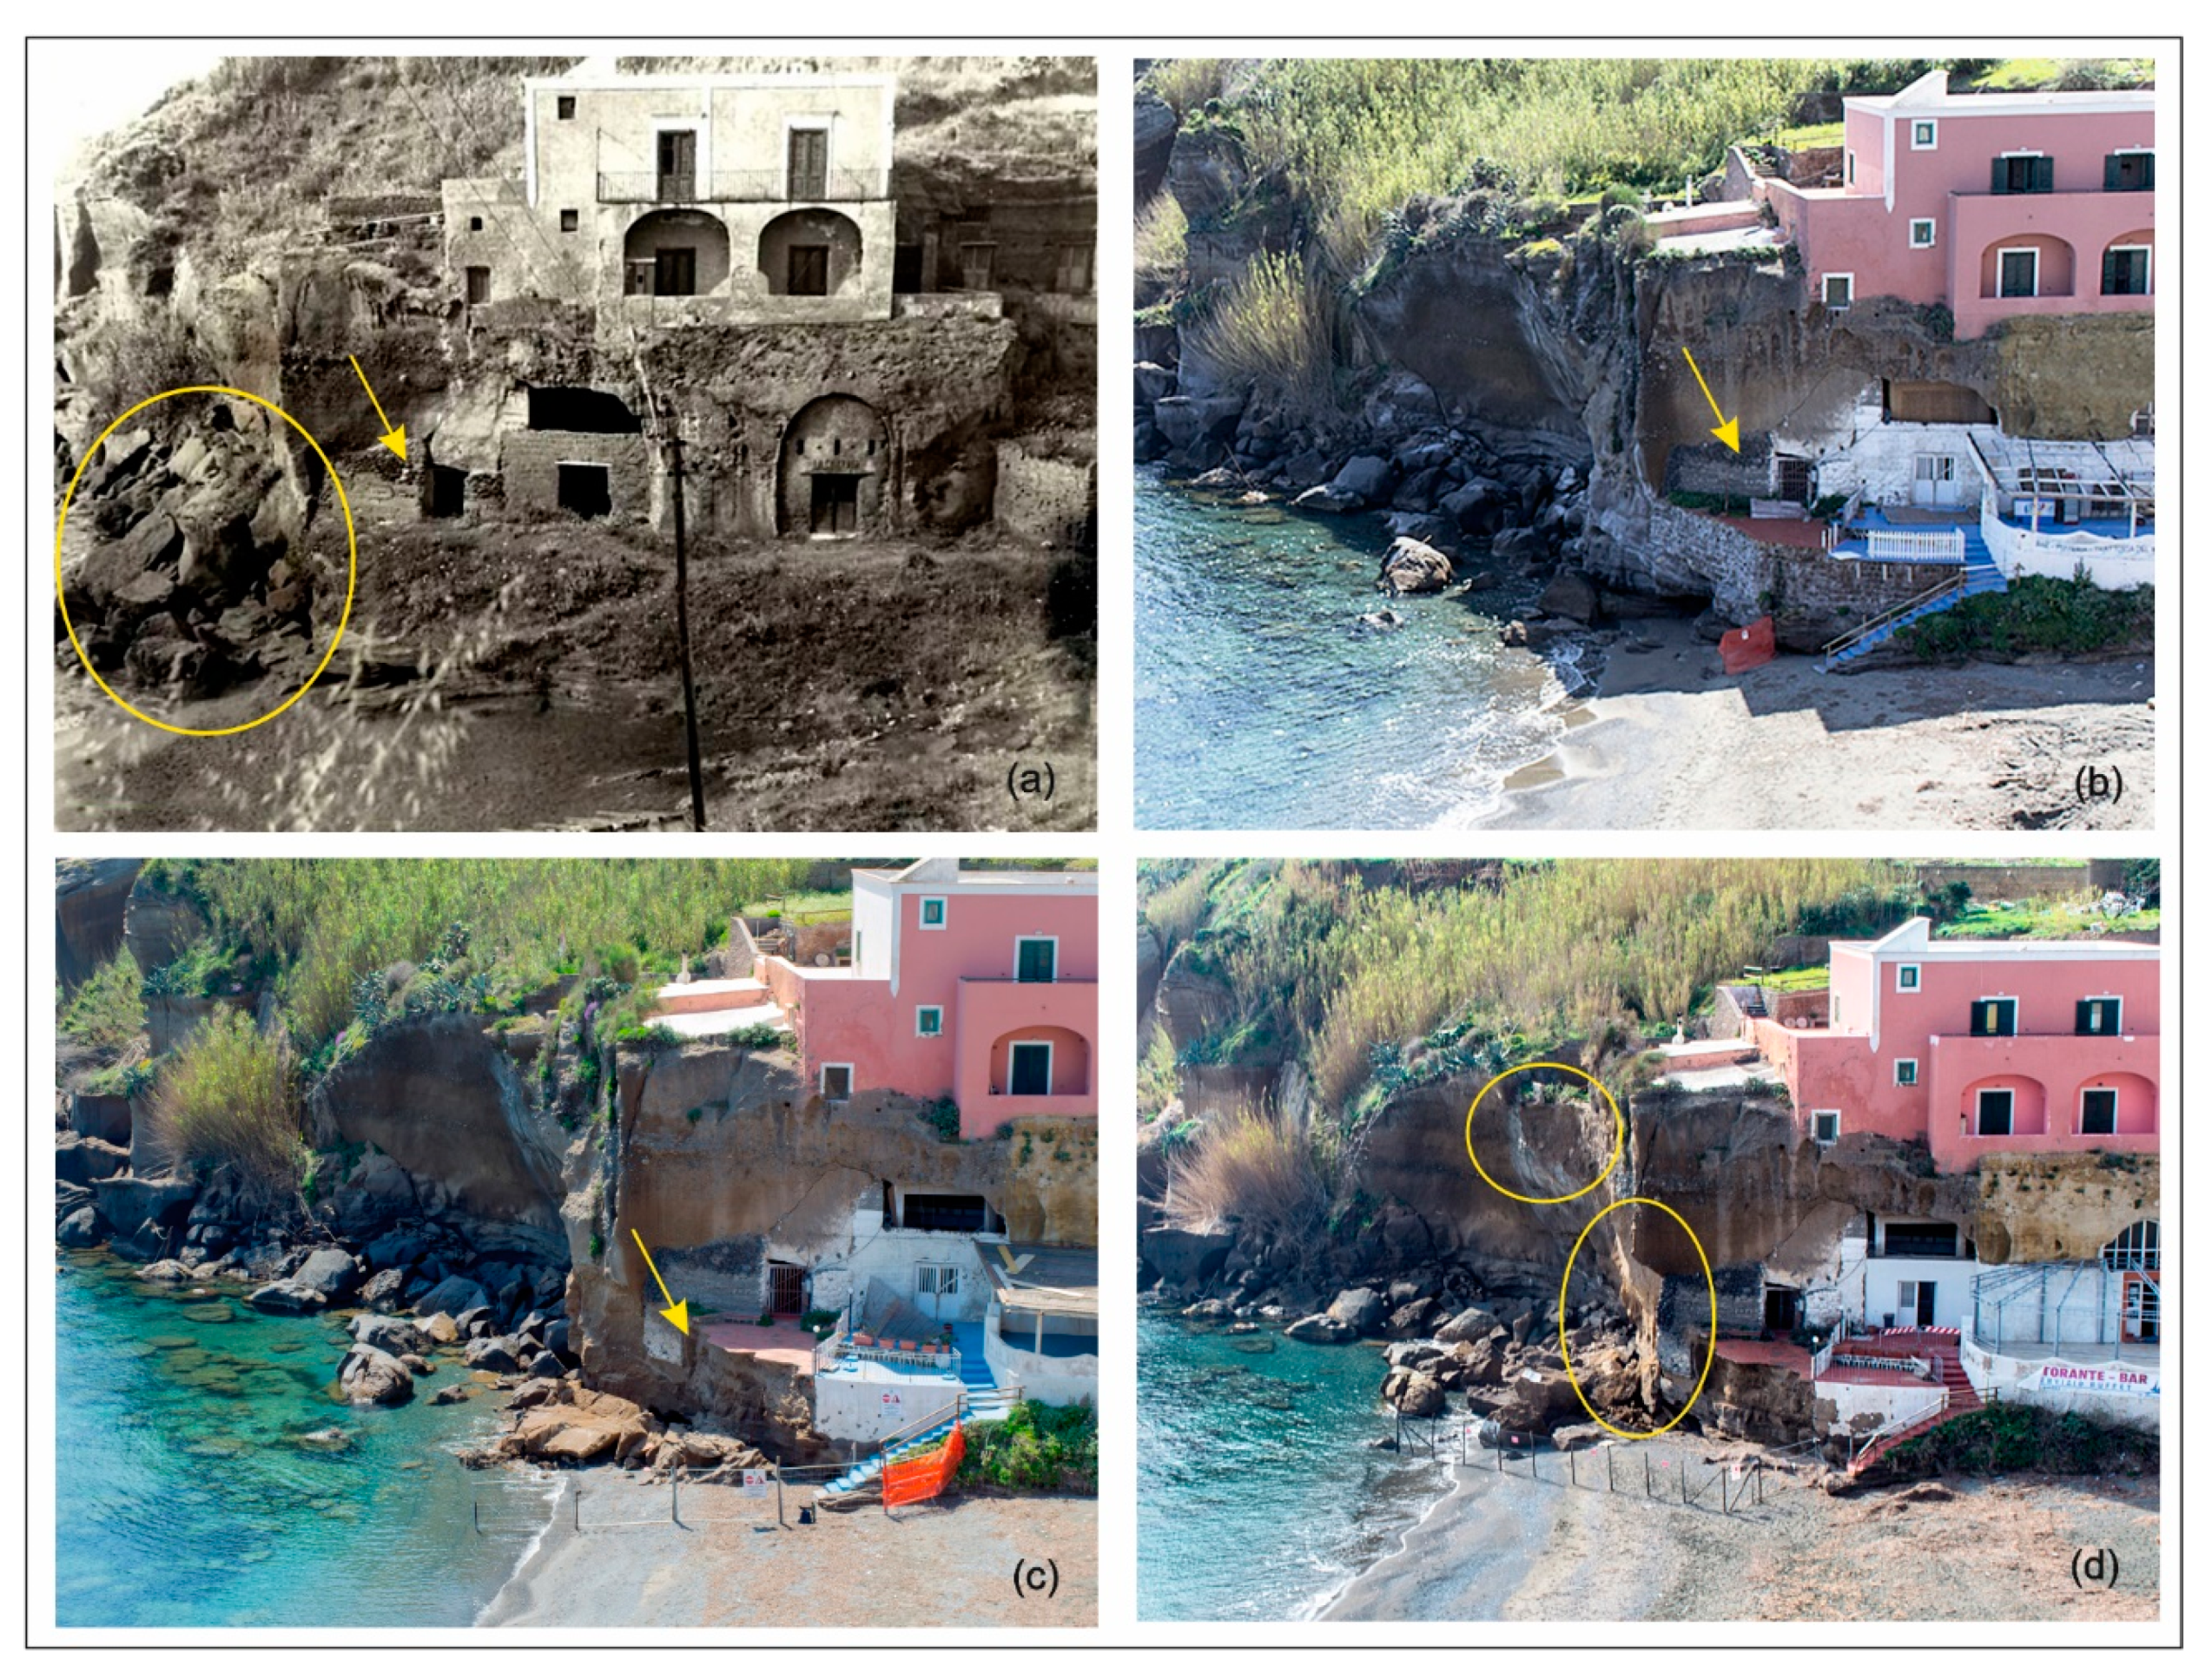
Indeed, discontinuity conditions, such as joints, provide pathways for water to infiltrate the pyroclastic masses. Presence of notches and joints are the dominant controlling factors for cliff recession in the study site and affect the mechanical behaviour of tufaceous rocks. Fall and topples characterise the coastal cliff. In the presence of deep notches, block fall occurred, followed by free fall debris. Overhanging walls resulted due to wave undercutting (Figure 6); falls occur where tension cracks, parallel to the coastline and controlled by stress release, are inclined inland [34]. Similar tension features are frequent all around the isle sea-cliff. Weathering effects are evident and irregularly distributed along the tuff cliff, characterised by the removal of the fine grained ashy matrix leaving scoriae and lava blocks even more isolated and susceptible to be detached.
In the last 60 years, cliff recession has been episodic and localised, mostly following major winter storms. Hydraulic quarrying and abrasion by wave action resulted in dislodging joint blocks and other rock fragments through the impact of waves, surf, and swash on rock surfaces, shock pressures by breaking waves, and air compression in rock cavities [35]. It is reasonable to assume that this was also the case in the past.
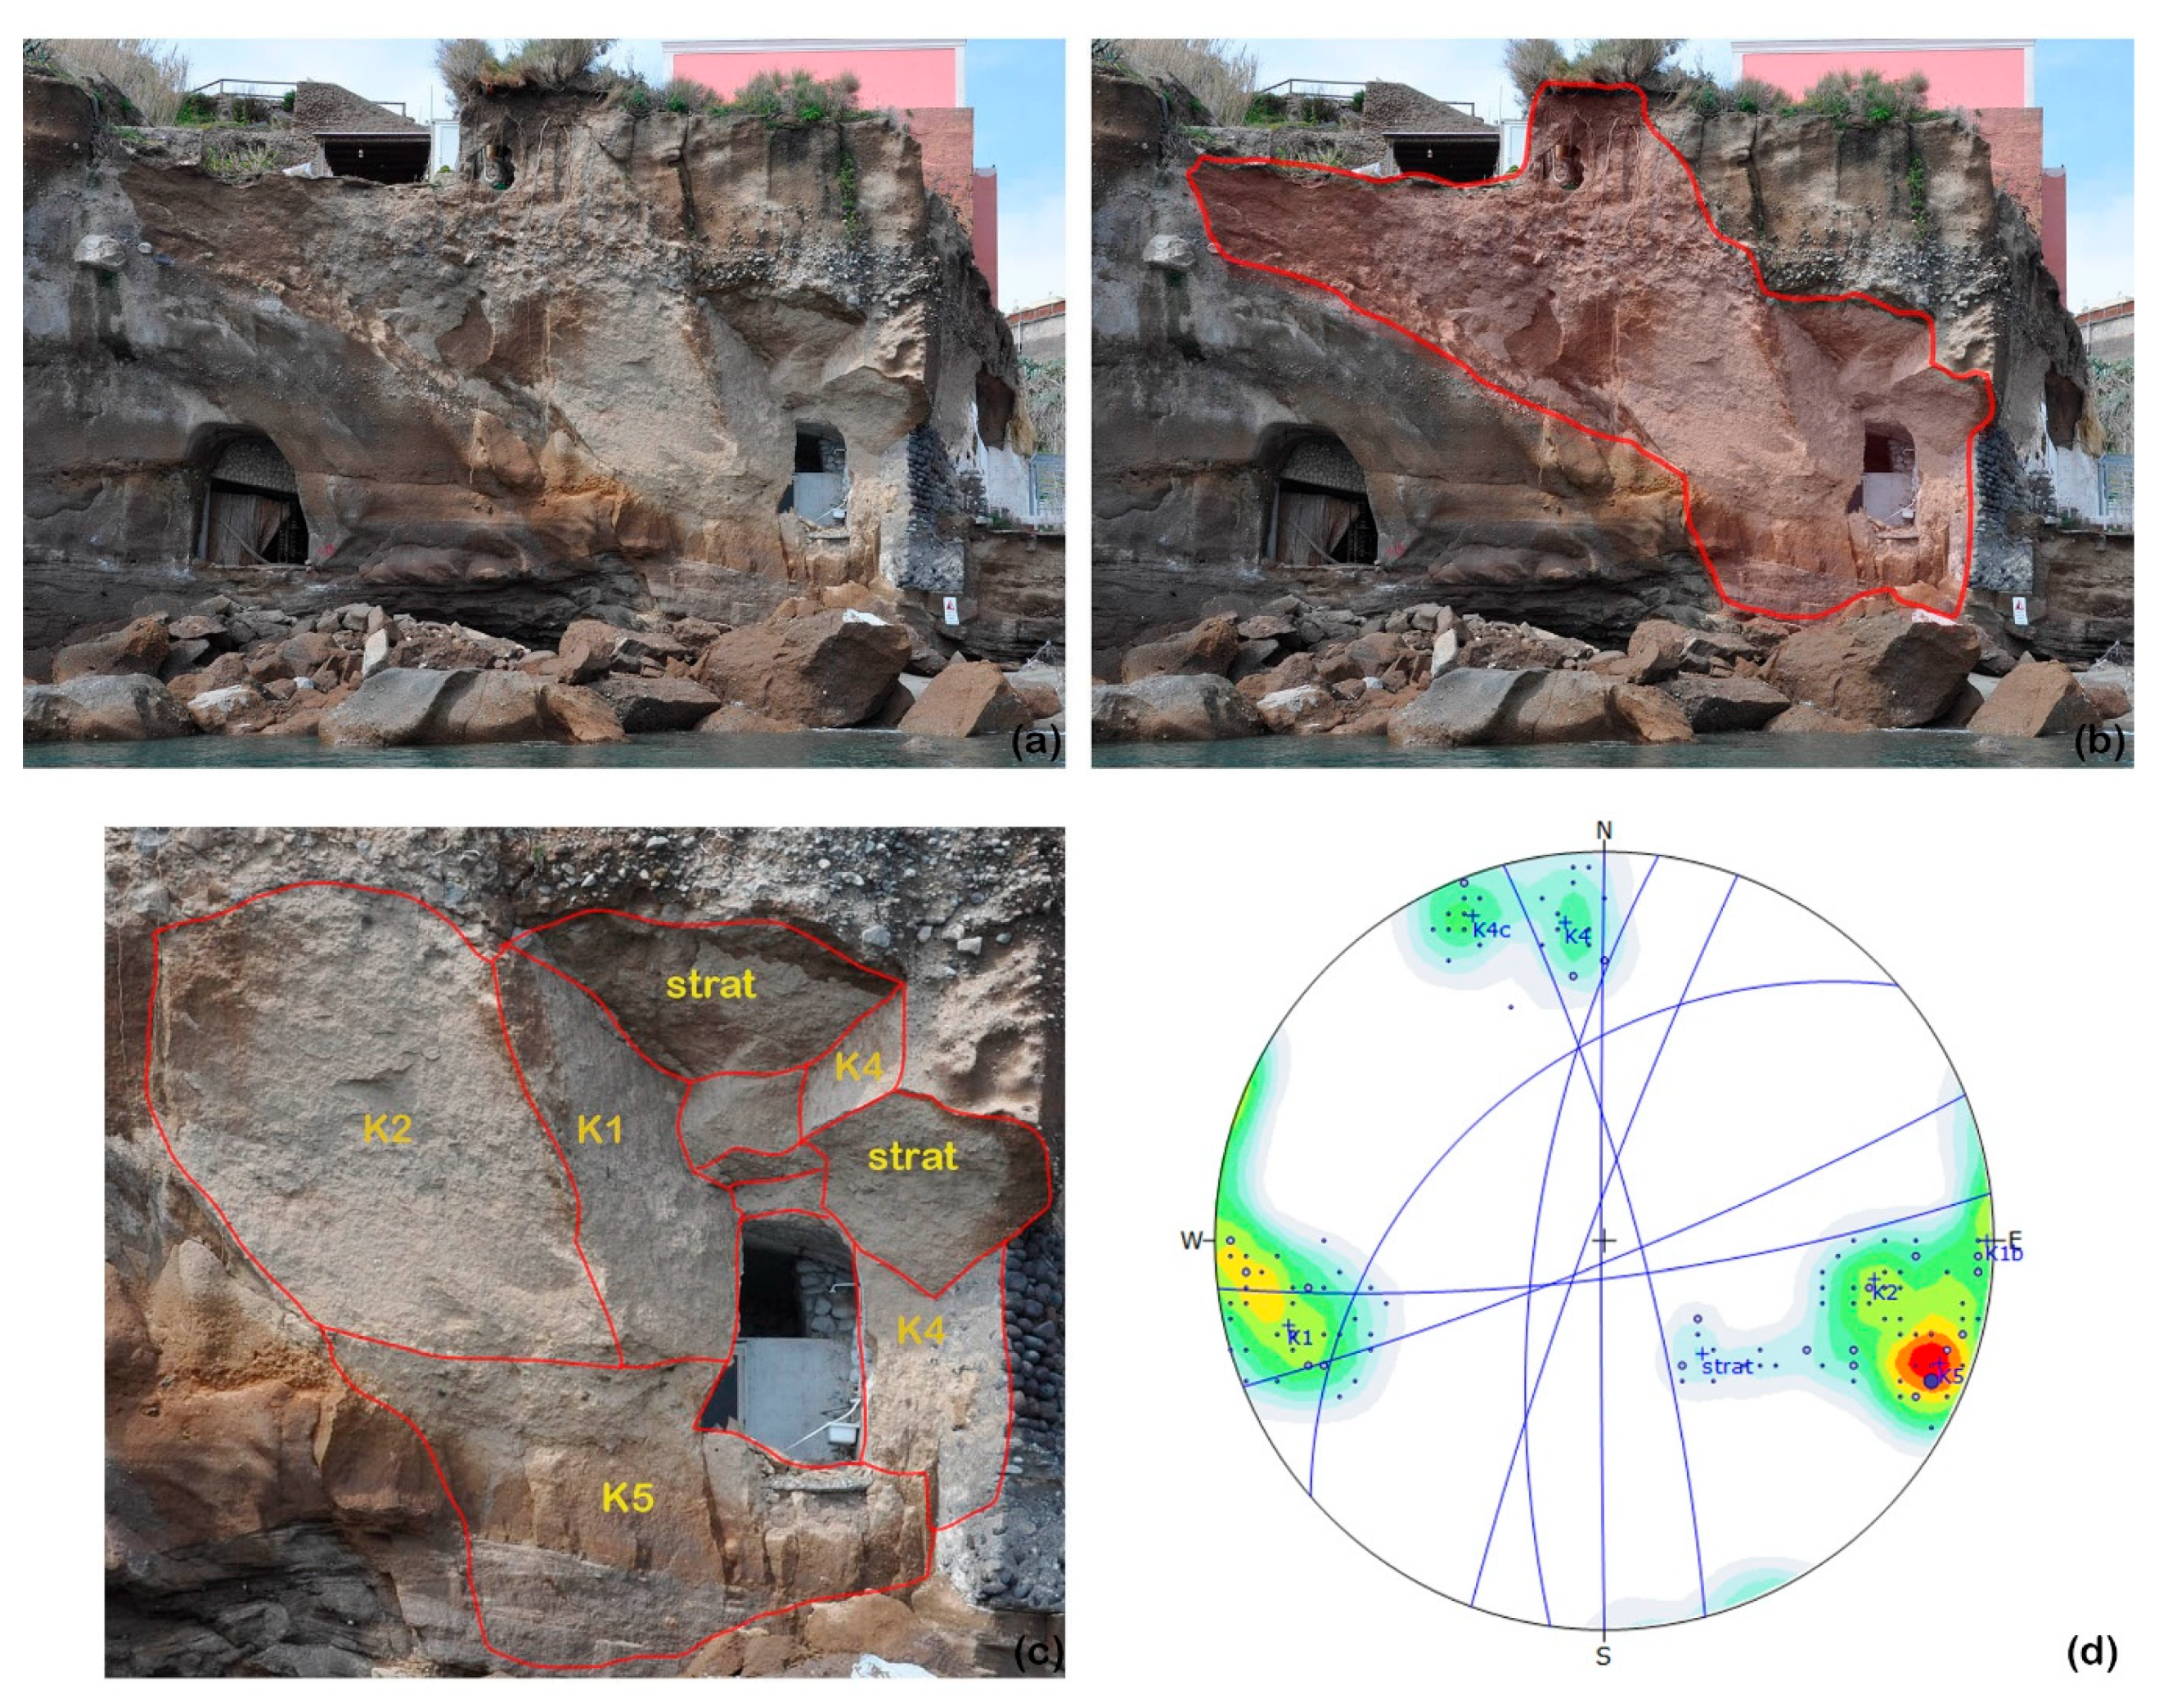
The rock fall occurred in the winter 2020 allowed to verify the reliability of the surveys carried out in 2012 and to reconstruct the fall kinematics.
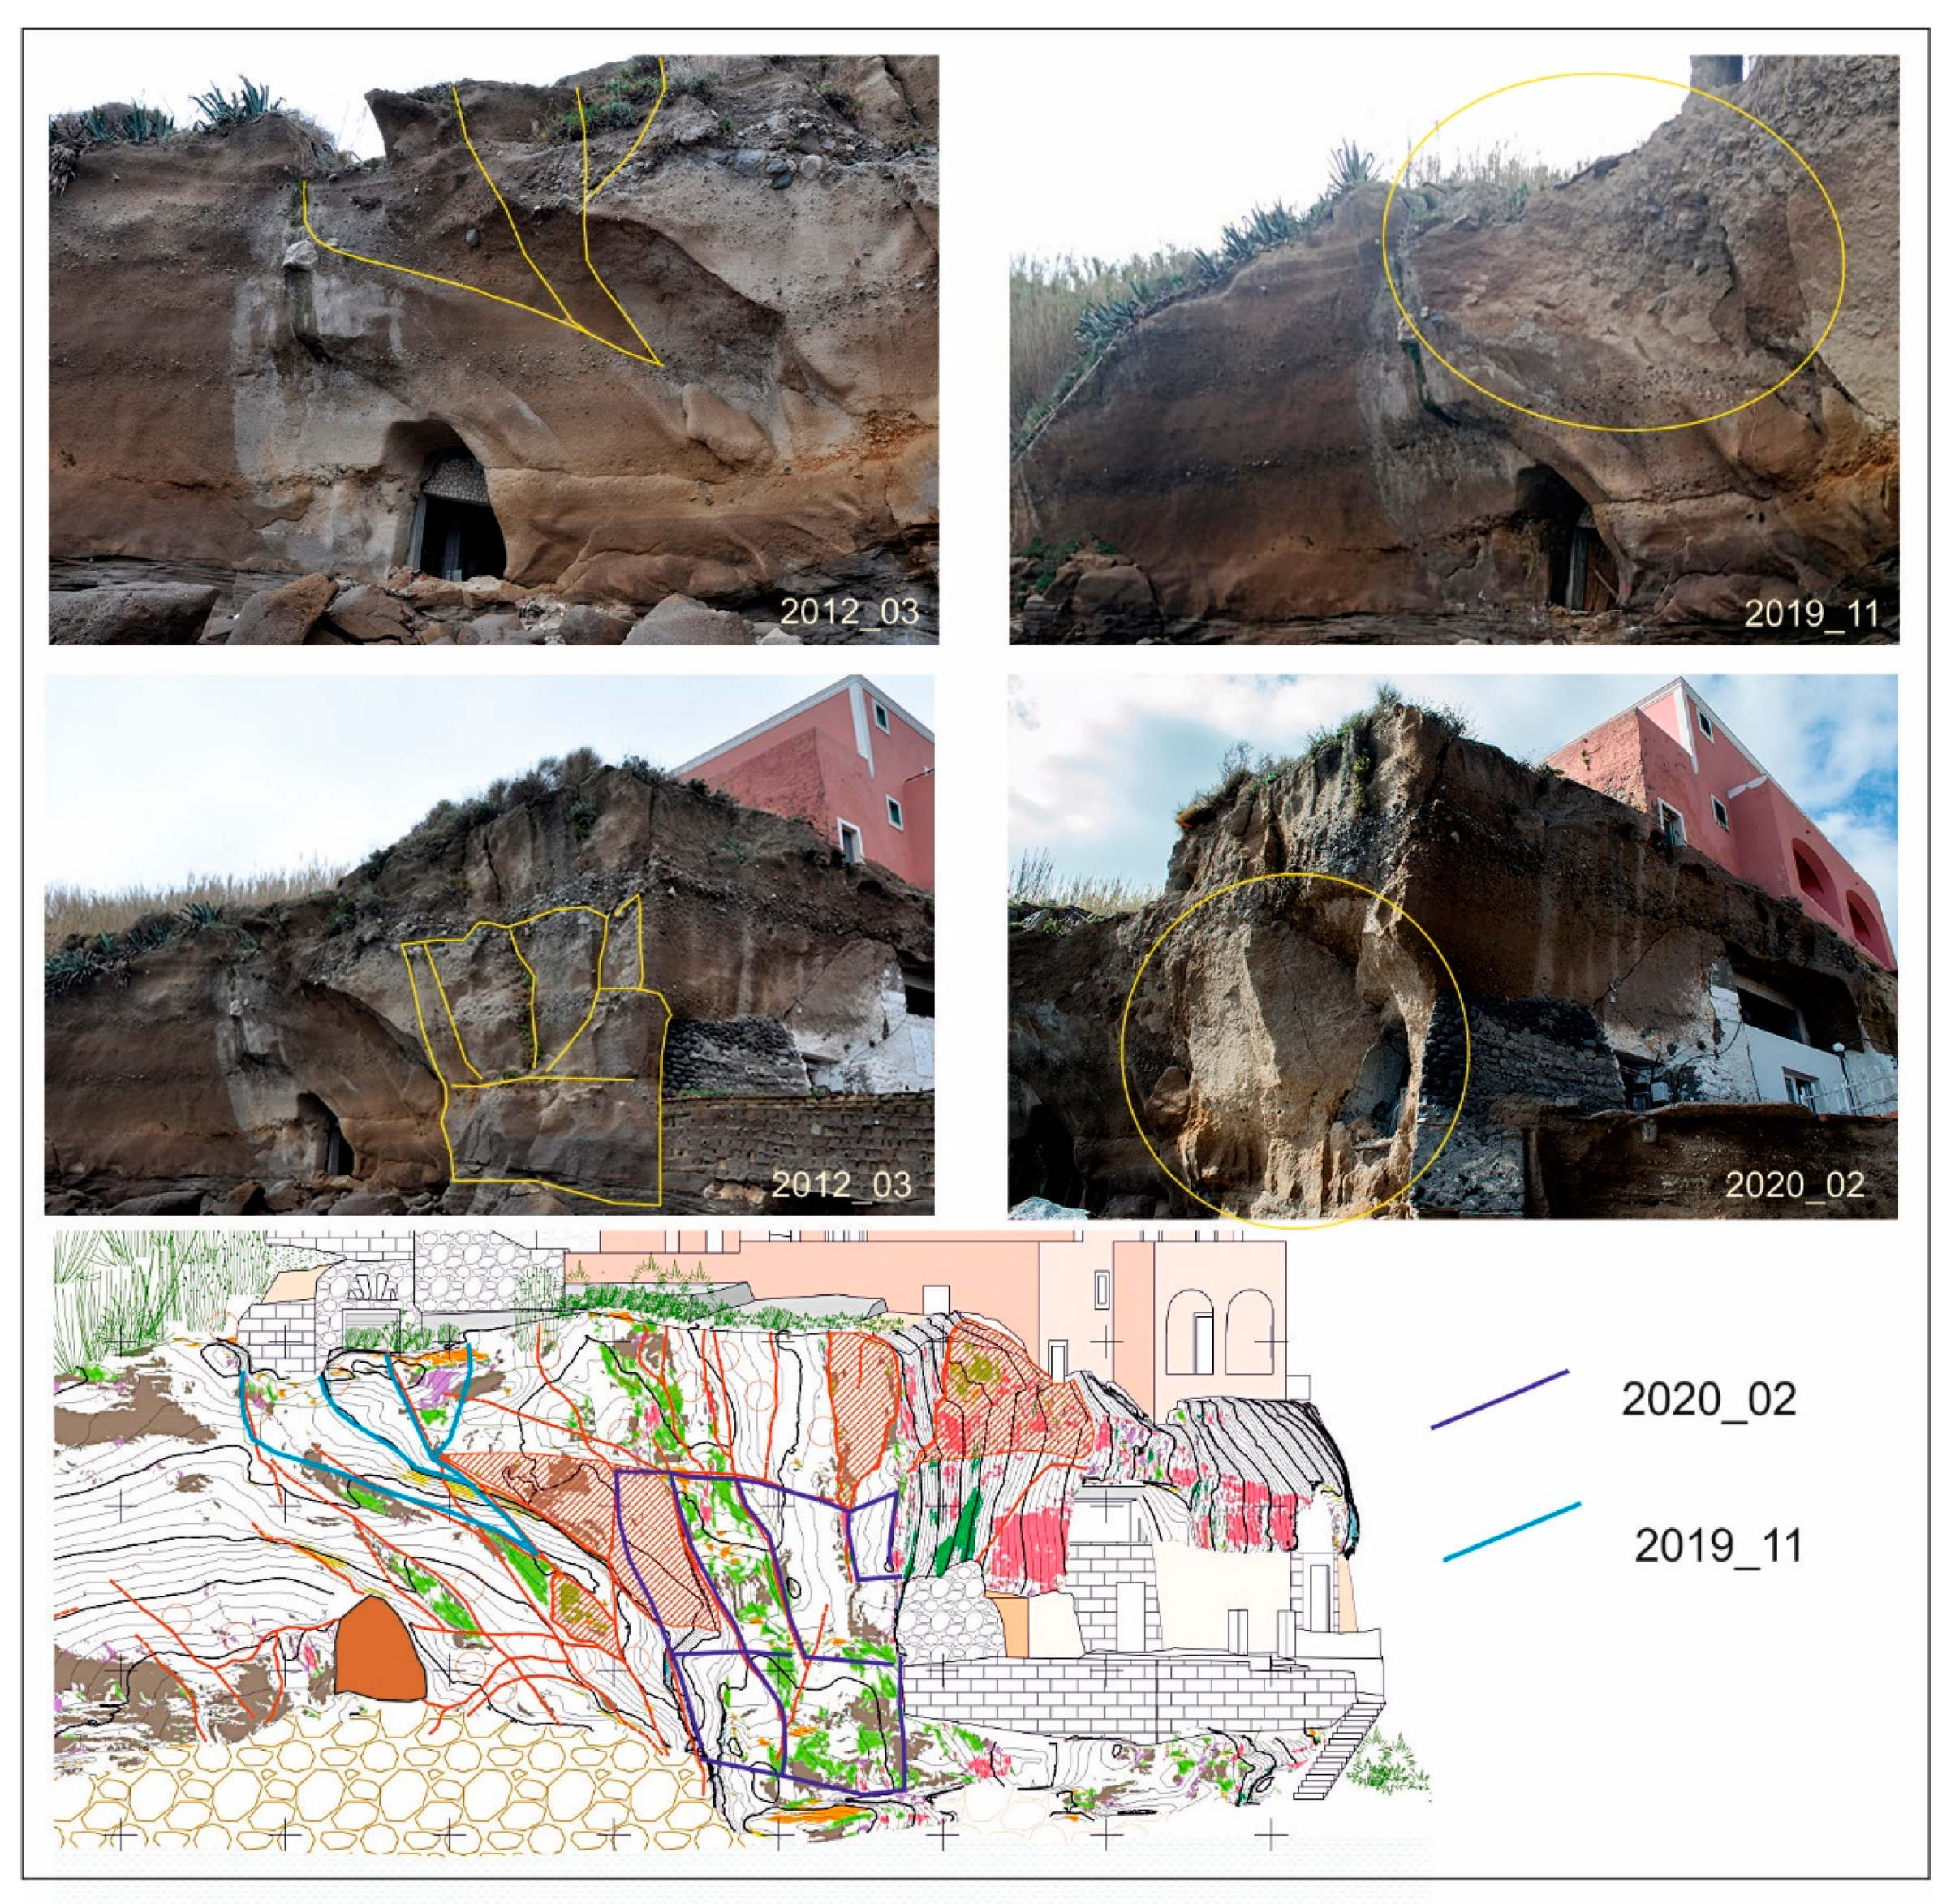
Taking into account the recent failure that occurred along the cliff overlooking the sea, we can compare the detachments with the geostructural maps previously made (Figure 12). It should be noted that the detachments involved rock surfaces parallel to the coast and dislodged by oblique fractures intersecting each other on sub-horizontal planes. The areas affected by the instability are those indicated by red striped patterns in Figure 12 and, therefore, already marked as potentially unstable in 2012.
Detail of the whole surface interested by the landslide is highlighted in Figure 13 with a red contour. The five main sets of discontinuity extracted with FACETS tool provide a clear picture of the planes that determined the detachment, as shown on the stereoplot. These planes full overlay those recognised in 2012.
The K2 and K5 sets are nearly parallel to the cliff slope and intersect the subvertical K1 and K4 sets with opposite angles. All these planes are cut by a low-angle discontinuity (K3 in Figure 13), which coincides with a sharp lithological change (bed 4b in Figure 5).
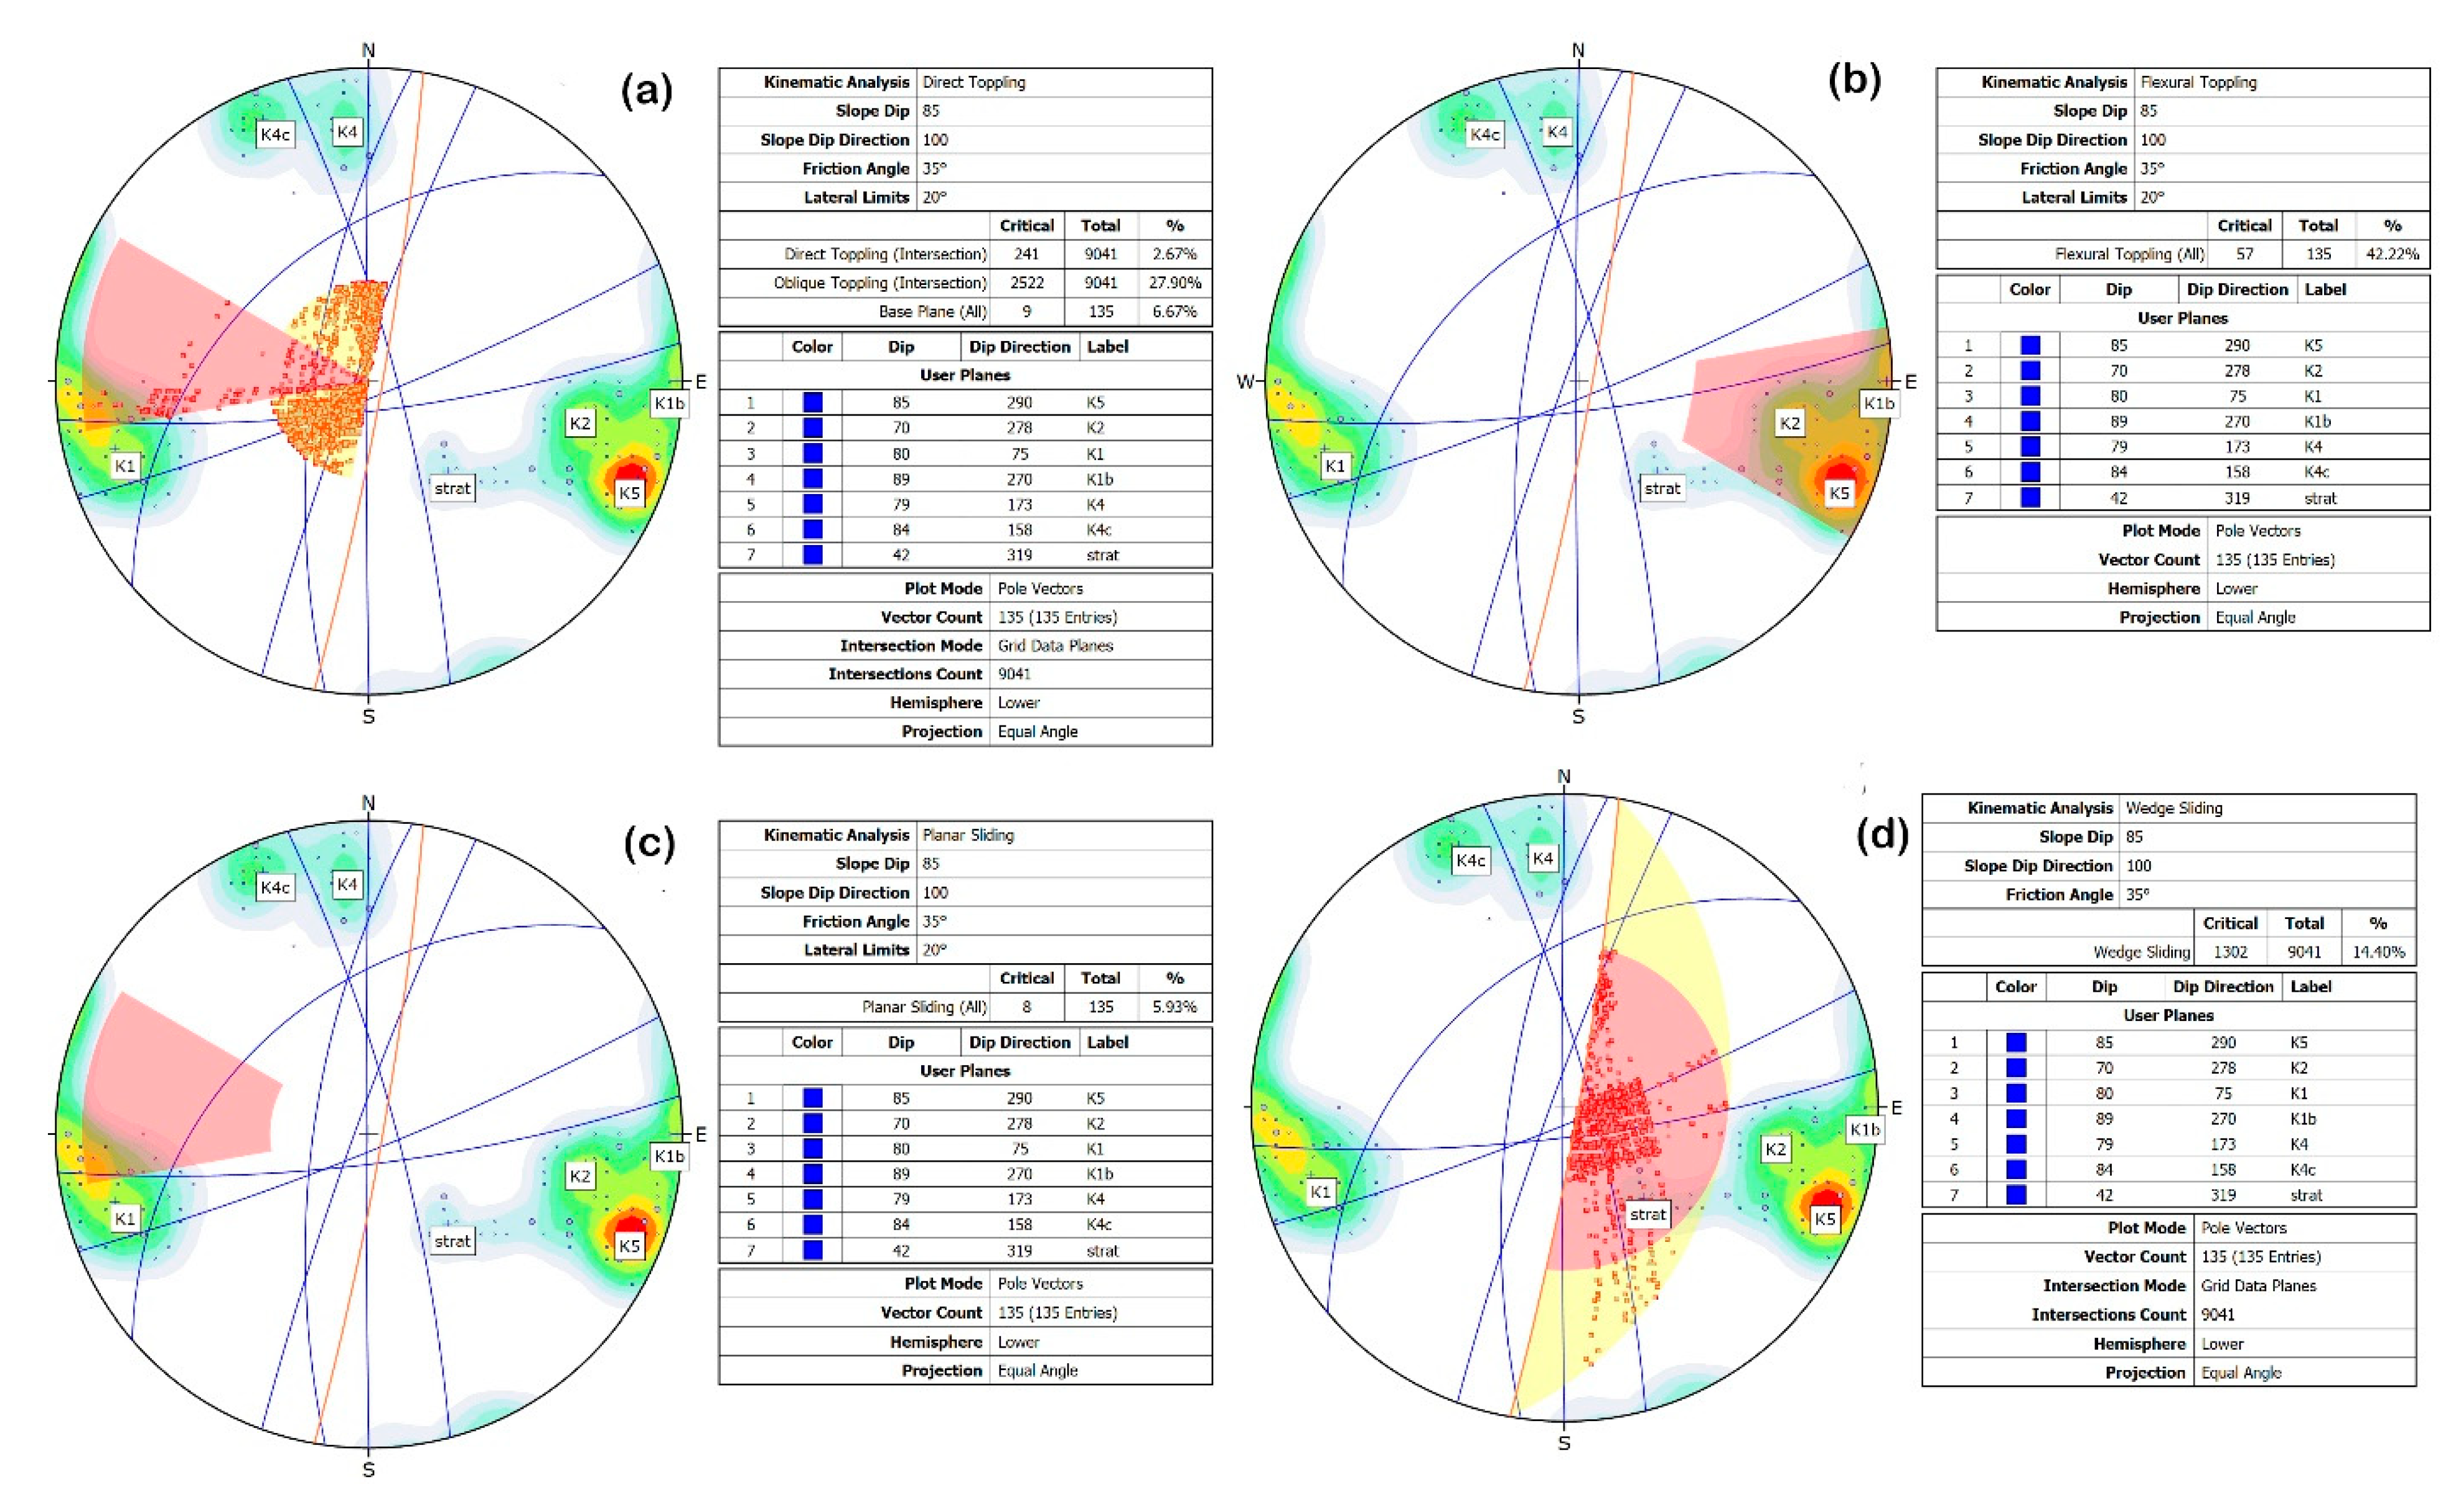
From the field observations, it is evident that the collapses occurred through the combination of two failure modes: firstly, a wedge sliding, caused by the erosion at the base of the cliff, which then evolved in oblique toppling. The analysis of kinematic stability, performed with Rocscience Dips 7.018 (Figure 14), confirms the above observations and highlights the main failure modes that could affect the cliff, taking into account the intersection of the discontinuity sets recognised.
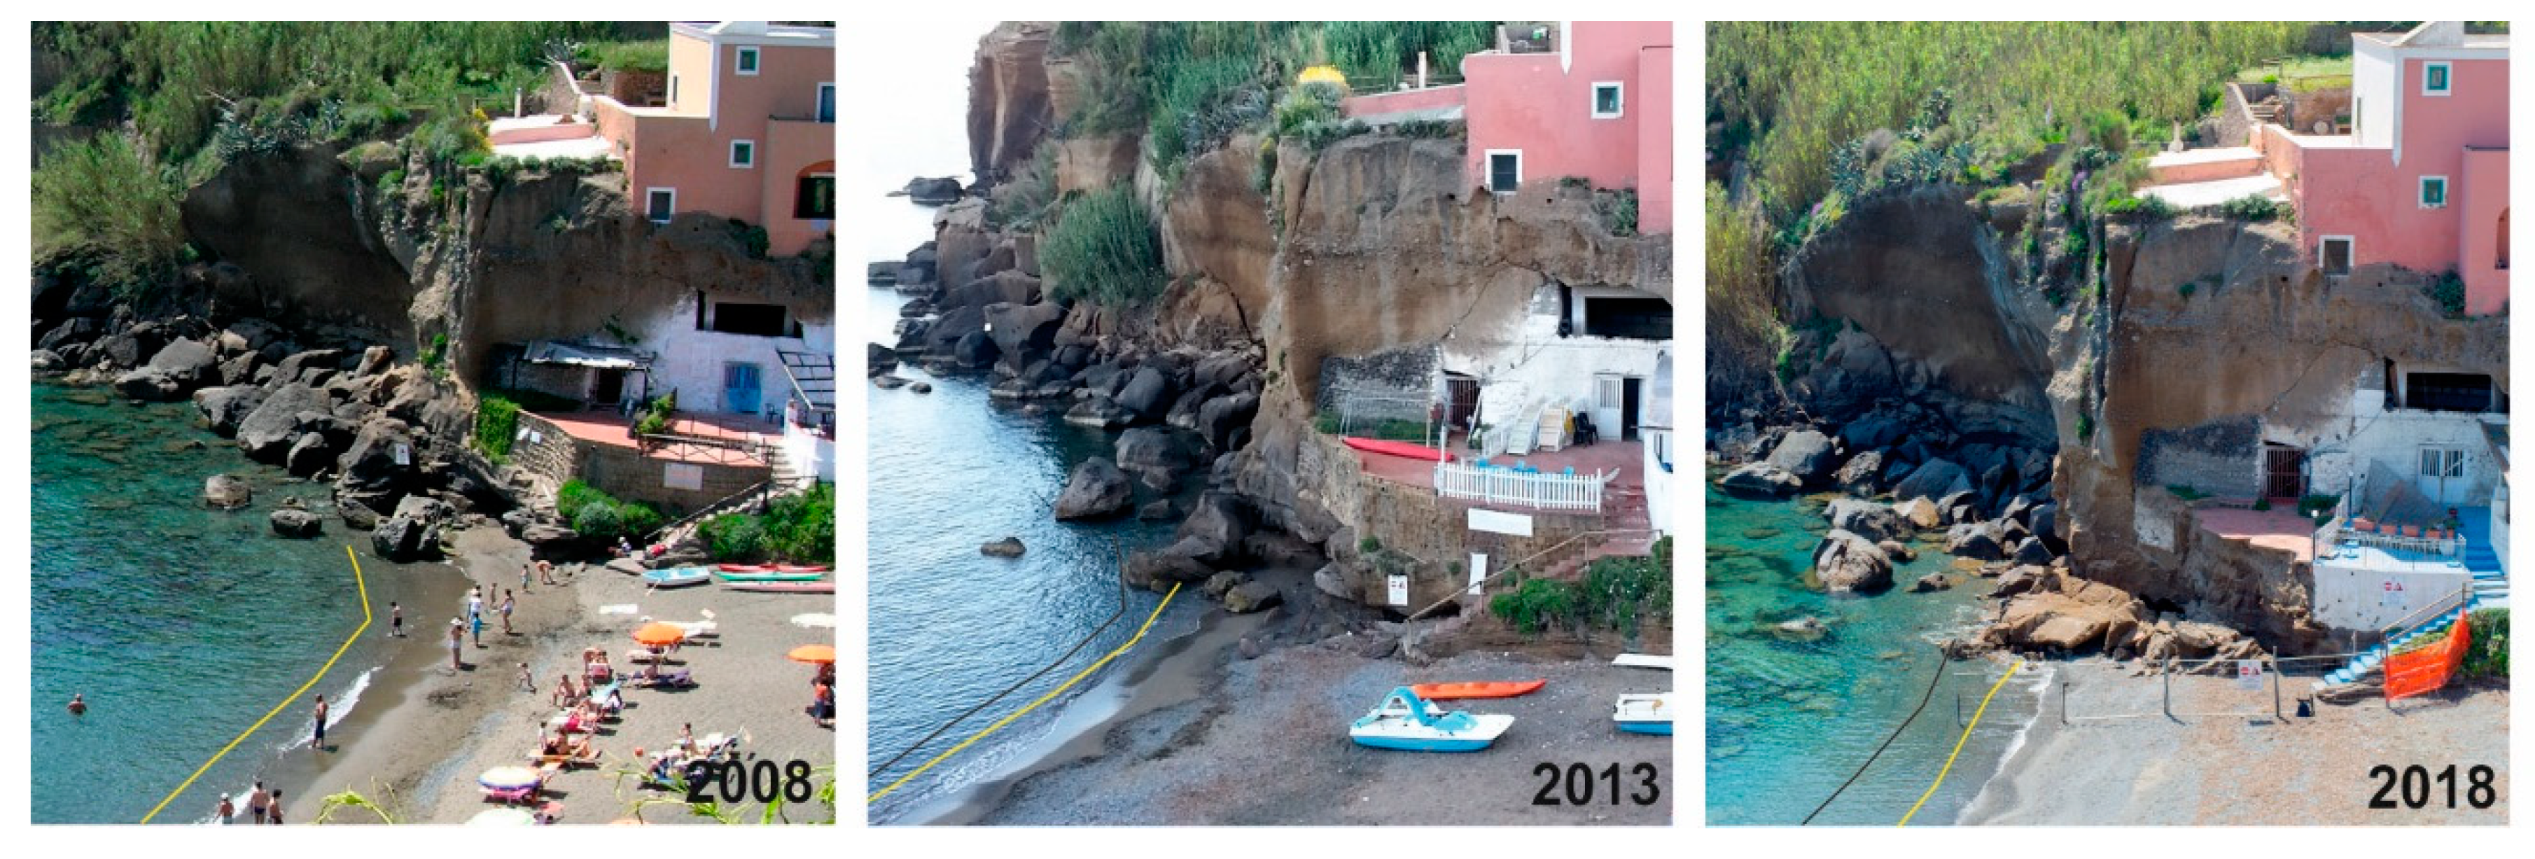
Lastly, as a further triggering mechanism of morphoselection, it must be taken into account the progressive erosion at the base of the cliff that greatly increased in the last 10 years, as a consequence of a rapid shoreline retreat caused by the interventions made along the beach that have certainly determined a sedimentary deficit (Figure 15). As previously said, the sediment supply was strongly reduced in the last 10 years following the anthropic interventions made along the sea cliff of the whole beach and the canal, which from the west reaches the beach. The loss of tuff boulder at the base of the studied cliff can be inferred, considering that they do not lie on the tuff abrasion platform; the morphology of the submerged beach was reconstructed through marine seismic data [36] that highlighted a terrace at 10–15 m below sea level (b.s.l.) made by a massive pyroclastic unit, which is overlain by coarse blocks and sandy deposits. A lower terrace was recognised at 40–45 m b.s.l., both likely formed during the stepwise lowering of sea level during the last glacial maximum [35]. It is reasonable to hypothesize that the material that fell from the walls was buried or moved away towards the open sea.
It is clear that the cliff erosion and retreat should be limited. To prevent future erosion and rock collapse, it seems reasonable to hamper the wave cut at the base of the cliff by placing a rocky barrier, high and thick enough to be resistant to winter storms and wave action, providing, also, a slight sedimentary input to the beach by means of wave erosion. The recent block detachments described in Figure 12 and Figure 13 seem to support the previous consideration. Moreover, the overhanging walls should be reprofiled, and isolated blocks should be removed.

6. Conclusions

This study provided a detailed integrated analysis of the erosional processes affecting the evolution of coastal morphology in a typical Tyrrhenian volcanic island (Ventotene, south Italy).
The stability conditions of the southern Cala Nave bay sea cliff were evaluated integrating geological field survey, structural analysis of discontinuities, laser scanner and SfM data acquisition, and processing. A 3D model of the sea cliff was developed, taking into account the artificial cavities quarried in the tuff cliff structure.
The studied tuff cliff was characterised by steep, up to overhanging walls affected by a fracture network, which locally isolate blocks in precarious equilibrium. In addition, the pyroclastic deposits that make up the cliff display coarse grained horizons containing blocks of considerable size, which, due to the effect of differential erosion, tend to be isolated and are likely to collapse. These beds also result in main sub-horizontal discontinuities that intersect the other fracture planes, often isolating metre scale blocks. A house was present on the edge of the cliff, connected to a cavity network partially used as a restaurant; thus, contributing to the overall hazard scenario.
The data acquired in 2012 were more recently compared with further surveys carried out following rock failures that occurred in winter 2019–2020. The detachment planes and failure modalities coincide perfectly with the ones previously assessed. The applied techniques have proven to be important in defining these conditions to address risk mitigation interventions that also take into account the ecological vocation of these coasts.
The study underlines the importance of careful qualitative and quantitative assessment of cliff stability in order to better address coastal planning and shoreline defence strategies for a sustainable use of coastal areas.

Author Contributions

R.D. was the coordinator of the research group, worked on the conceptualization of the paper, and prepared the original draft; R.D., M.E., and P.A. performed field surveys and data acquisition; V.M. assisted in results’ compiling and writing the manuscript; R.P. assisted in field logistics and provided historical and technical data; M.E. and P.A. performed the processing and analysis of the remote sensing data. All authors have read and agreed to the published version of the manuscript.

Funding

This research received no external funding.

Acknowledgments

The authors would like to thank the municipality of Ventotene for technical assistance during the whole study, and in particular L. Cirillo, who also performed photographic surveys through time; F. Verde is warmly acknowledged for his continuous logistical support and for the insightful information on the historical background of the study site.

Conflicts of Interest

The authors declare no conflict of interest.

References

  1. Short, A.D.; Masselink, G. Embayed and structurally controlled beaches. In Handbook of Beach and Shoreface Morphodynamics; Short, A.D., Ed.; Wiley: Hoboken, NJ, USA, 1999; pp. 230–250. [Google Scholar]
  2. Klein, A.H.F.; Filho, L.B.; Schumacher, D.H. Short term beach rotation processes in distinct headland bay beach systems. J. Coast. Res. 2002, 18, 442–458. [Google Scholar]
  3. Pranzini, E.; Rosas, V. Pocket beach response to high magnitude—low frequency floods (Elba Island, Italy). Special Issue No.50 Proceedings of the 9th International Coastal Symposium, Gold Coast, Australia. J. Coast. Res. 2007, 969–977. [Google Scholar]
  4. Bini, M.; Mascioli, F.; Pranzini, E. Geomorphological hazard and tourist use of rocky coasts in Tuscany (NW Italy). In Proceedings of the 12th European Geoparks Conference, Pisa coastal plain, NW Tuscany, Italy, 4–6 September 2013; pp. 34–39. [Google Scholar]
  5. Pranzini, E.; Rosas, V.; Jackson, N.L.; Nordstrom, K.F. Beach changes from sediment delivered by streams to pocket beaches during a major flood. Geomorphology 2013, 199, 36–47. [Google Scholar] [CrossRef]
  6. Sammut, S.; Gauci, R.; Drago, A.; Gaucib, A.; Azzopardi, J. Pocket beach sediment: A field investigation of the geodynamic processes of coarse-clastic beaches on the Maltese Islands (Central Mediterranean). Mar. Geol. 2017, 387, 58–73. [Google Scholar] [CrossRef]
  7. Violante, C. Rocky coast: Geological constraints for hazard assessment. Geol. Soc. Lond. Spec. Publ. 2009, 322, 1–31. [Google Scholar] [CrossRef]
  8. Bieniawski, Z.T. Classification of rock masses for engineering: The RMR system and future trends. In Comprehensive Rock Engineering; Hudson, J.A., Ed.; Pergamon Press: Oxford, UK, 1993; Volume 3, pp. 553–573. [Google Scholar]
  9. Carter, R.W.G. Coastal Environments; Academic Press: London, UK, 1988. [Google Scholar]
  10. Cruden, D.M.; Varnes, D.J. Landslides types and processes. In Landslides: Investigation and Mitigation; Transportation Research Board Representative 247; Turner, A.K., Schuster, R.L., Eds.; National Research Council: Washington, DC, USA, 1996; pp. 36–75. [Google Scholar]
  11. Redweik, P.; Matildes, R.; Marque, F.; Santos, L. Photogrammetric methods for monitoring cliffs with low retreat rate. Special Issue No.56 Proceedings of the 10th International Coastal Symposium, Lisbon, Portugal. J. Coast. Res. 2009, 2, 1577–1581. [Google Scholar]
  12. Trenhaile, A.S. Modelling the accumulation and dynamics of beach onshore platforms. Mar. Geol. 2004, 206, 55–72. [Google Scholar] [CrossRef]
  13. Bowman, D.; Guillén, J.; Lòpez, L.; Pellegrino, V. Planview geometry and morphological characteristics of pocket beaches on the Catalan coast (Spain). Geomoprhology 2009, 108, 191–199. [Google Scholar] [CrossRef]
  14. Slatton, K.C.; Carter, W.E.; Shrestha, R.L.; Dietrich, W. Airborne laser swath mapping: Achieving the resolution and accuracy required for geosurficial research. Geophys. Res. Lett. 2007, 34. [Google Scholar] [CrossRef]
  15. Heritage, G.; Large, A. (Eds.) Laser Scanning for the Environmental Sciences; John Wiley & Sons: Hoboken, NJ, USA, 2009. [Google Scholar]
  16. Abellán, A.; Oppikofer, T.; Jaboyedoff, M.; Rosser, N.J.; Lim, M.; Lato, M.J. Terrestrial laser scanning of rock slope instabilities. Earth Surf. Process. Landf. 2014, 39, 80–97. [Google Scholar] [CrossRef]
  17. Martino, S.; Mazzanti, P. Analysis of sea cliff slope stability integrating traditional geomechanical surveys and remote sensing. Nat. Hazards Earth Syst. Sci. Discuss. 2013, 1, 3689–3734. [Google Scholar] [CrossRef]
  18. Matano, F.; Iuliano, S.; Somma, R.; Marino, E.; del Vecchio, U.; Esposito, G.; Molisso, F.; Scepi, G.; Grimaldi, G.M.; Pignalosa, A.; et al. Geostructure of Coroglio tuff cliff, Naples (Italy) derived from terrestrial laser scanner data. J. Maps 2016, 12, 407–421. [Google Scholar] [CrossRef] [Green Version]
  19. Mancini, F.; Castagnetti, C.; Rossi, P.; Dubbini, M.; Fazio, N.L.; Perrotti, M.; Lollino, P. An integrated procedure to assess the stability of coastal rocky cliffs: From UAV close-range photogrammetry to geomechanical finite element modeling. Remote Sens. 2017, 9, 1235. [Google Scholar] [CrossRef] [Green Version]
  20. Sacchi, M.; Caputo, T.; Esposito, G.; Somma, R.; Matano, F.; Caccavale, M.; del Vecchio, U.; Fortelli, A.; Grimaldi, G.M.; Iuliano, S.; et al. Sistema integrato di monitoraggio (TCM—Tuff Cliff Monitoring) dei fenomeni di dissesto lungo il costone tufaceo di Coroglio (Napoli). Rapp. Tec. INGV 2015, 309, 2039–7941. [Google Scholar]
  21. Caputo, T.; Marino, E.; Matano, F.; Somma, R.; Troise, C.; De Natale, G. Terrestrial Laser Scanning (TLS) data for the analysis of coastal tuff cliff retreat: Application to Coroglio cliff, Naples, Italy. Ann. Geophys. 2018, 61, 110. [Google Scholar] [CrossRef]
  22. Barberi, F.; Borsi, S.; Ferrara, G.; Innocenti, F. Contributo alla conoscenza vulcanologica e magmatologica delle isole dell’arcipelago Pontino. Mem. Soc. Geol. It. 1967, 6, 581–606. [Google Scholar]
  23. Perrotta, A.; Scarpati, C.; Giacomelli, L.; Capozzi, A.R. Proximal facies of a caldera forming eruption. The Parata Grande Tuff at Ventotene Island (Italy). J. Volcanol. Geotherm. Res. 1996, 71, 207–228. [Google Scholar] [CrossRef]
  24. Remondino, F.; Del Pizzo, S.; Kersten, T.P.; Troisi, S. Low-Cost and Open-Source Solutions for Automated Image Orientation—A Critical Overview. In Progress in Cultural Heritage Preservation; Euro Med. Lecture Notes in Computer Science; Springer: Berlin/Heidelberg, Germany, 2012; pp. 45–54. [Google Scholar]
  25. Lafarge, F.; Mallet, C. Creating Large-Scale City Models from 3D-Point Clouds: A Robust Approach with Hybrid Representation. Int. J. Comput. Vis. 2012, 99, 69–85. [Google Scholar] [CrossRef]
  26. Haala, N. The Landscape of Dense Image Matching Algorithms. In Photogrammetric Week’13 2013; Fritsch, D., Ed.; Wichmann/VDE Verlag: Berlin/Offenbach, Germany, 2013; pp. 271–284. [Google Scholar]
  27. Westoby, M.J.; Brasington, J.; lasser, N.F.; Hambrey, M.J.; Reynolds, J.M. ‘Structure-from-Motion’ photogrammetry: A low-cost, effective tool for geoscience applications. Geomorphology 2012, 179, 300–314. [Google Scholar] [CrossRef] [Green Version]
  28. Fernández, O. Obtaining a best fitting plane through 3D georeferenced data. J. Struct. Geol. 2005, 27, 855–858. [Google Scholar] [CrossRef]
  29. Slob, S.; Van Knapen, B.; Hack, R.; Turner, K.; Kemeny, J. Method for automated discontinuity analysis of rock slopes with three-dimensional laser scanning. Transp. Res. Rec. J. Transp. Res. Board 2005, 1913, 187–194. [Google Scholar] [CrossRef]
  30. Kemeny, J.; Turner, K. Ground-Based LiDAR: Rock Slope Mapping and Assessment; FHWA-CFL/TD-08-006.2008; Federal Highway Administration: Washington, DC, USA, 2008.
  31. Jaboyedoff, M.; Philippossian, F.; Mamin, M.; Marro, C.; Rouiller, J.D. Distribution Spatiale des Discontinuités Dans Une Alaise; Approche Statistique et Probabiliste, Rapport de Travail, PNR31; Hochschulverlag AG an der ETH Zürich: Zürich, Switzerland, 1996. [Google Scholar]
  32. Dewez, T.J.B.; Girardeau-Montaut, D.; Allanic, C.; Rohmer, J. Facets: A Cloudcompare Plugin to Extract Geological Planes from Unstructured 3D Point Clouds. Int. Arch. Photogramm. Remote Sens. Spat. Inf. Sci. XLI-B5 2016. [Google Scholar] [CrossRef]
  33. Yokota, S.; Iwamatsu, A. Weathering distribution in a steep slope of soft pyroclastic rocks as an indicator of slope instability. Eng. Geol. 1999, 55, 57–68. [Google Scholar] [CrossRef]
  34. Andriani, G.F.; Walsh, N. Rocky coast geomorphology and erosional processes: A case study along the Murgia coastline South of Bari, Apulia-SE Italy. Geomorphology 2007, 87, 224–238. [Google Scholar] [CrossRef]
  35. Trenhaile, A.S. Hard-rock coastal modelling: Past practice and future prospects in a changing World. J. Mar. Sci. Eng. 2019, 7, 34. [Google Scholar] [CrossRef] [Green Version]
  36. Di Fiore, V.; Cavuoto, G.; Punzo, M.; Tarallo, D.; Pelosi, N.; Giordano, L.; Alberico, I.; Marsella, E.; Mazzola, S. Joining up land and marine seismic data: Case study from procida and ventotene islands (Tyrrhenian Sea, Italy). Geophysics 2015, 80, 153–166. [Google Scholar] [CrossRef]
Figure 1. (a) Location of study area and wind roses showing the mean annual direction of winds, in 16 directions, and their intensities, at the Ponza stations for the period 2001–2020; (b) aerial view of Ventotene Island and Santo Stefano Island: white box the close up view in (c); yellow line, cliff section shown in (d); (c) aerial photo of Cala Nave bay; red box shows study site; (d) sketch of the Parata Grande Tuff succession (from Perrotta et al. [23] slightly modified): (1) fall beds, (2) welded deposits, (3) lithic-rich flow deposits, (4) cross stratified and massive deposits.
Remotesensing 12 02006 g001
Figure 2. Cala Nave beach. In the foreground the sea cliff object of the present study (black square).
Remotesensing 12 02006 g002
Figure 3. Location of the 29 scan stations for the Laser Scanning data acquisition. The area in (a) corresponds to the red square in Figure 1c. (b) Scan stations within the cavities behind the sea cliff (green square in (a)).
Remotesensing 12 02006 g003
Figure 4. Overview of the complete point cloud, with RGB colour.
Remotesensing 12 02006 g004
Figure 5. Synthetic stratigraphic/geological sketch of the tuff cliff in the southern Cala Nave bay along the beach side (a) and the sea-side cliff (b). In the red box the detail in (c). Key: (1) eluvial/colluvial sandy deposits; (2) tuff blocks accumulated at the base of the sea cliff due to rock fall processes; (3) surge, laminated, medium-fine grained ash with small lapilli, locally showing cross-lamination; (4a) flow deposit constituted by compacted, poorly sorted, graded, ash with small lapilli stone, white pumice and minor lithic fragments; (4b) massive ash flow deposit representing the basal layer of 4a, characterised by (1) fine grained ash containing mm-size lapilli and small pumice passing laterally to (2) coarse decimeter-scale bomb and blocks; (5a) reverse-graded, flow deposit characterised by ashy matrix containing cm-scale lapilli and small lava fragments; (5b) massive ash flow with cm-scale lapilli and lithic small clasts, representing the basal layer of 5a; (6) massive ash flow formed by many laminae with sparse lapilli, pumice and lithic clasts; (7) stratified ash-surge deposit with lapilli and small scoriae, characterised by cross-lamination and locally parallel lamination; (8) massive, poorly-sorted, ash flow deposit with coarse lapilli and pumice and minor lava scoriae; (9) rock masses in precarious stability; (10) discontinuity fractures (a) recognised or (b) inferred; (11) anthropic excavation front; (12) recent detachment main scarp; (13) shoreline notch; (14) wind erosion tafoni.
Remotesensing 12 02006 g005
Figure 6. Topographic profiles across the cliff showing the relationship between the tuff morphology and the anthropic structures, along with the caves below the building.
Remotesensing 12 02006 g006
Figure 7. Main discontinuity sets of the tuff cliff in stereographic equal angle projections.
Remotesensing 12 02006 g007
Figure 8. Prospective map of cliff obtained by the 2012 Terrestrial Laser Scanning—TLS survey. (a) Orthophotos with contour lines; (b) map of exposed surfaces relative to distinct sets of discontinuities. Red lines correspond to discontinuities that are more relevant to the stability of the tuff cliff; red striped pattern highlights rock masses in precarious stability. Colours refer to the discontinuity sets described in Figure 7.
Remotesensing 12 02006 g008
Figure 9. A 3D model extracted by Structure for Motion—SfM. On the left the RGB point cloud; on the right the mesh.
Remotesensing 12 02006 g009
Figure 10. (A) Discontinuity sets extracted with facet analysis. (B) Stereographic projection of the sets, (a) with density, (b) with rose diagram, (c) with intersection between discontinuities.
Remotesensing 12 02006 g010
Figure 11. Overview of the morphological changes occurred across almost 60 years: (a) early XX century; (b) 2012; (c) 2017; (d) 2019–2020 (for details refer to Figure 10). For explanation see text.
Remotesensing 12 02006 g011
Figure 12. Reconstruction of the detachments occurred in winter 2019–2020 (on the left in the pictures). The main fractures responsible for the landslides are drawn on the photographs taken in 2012 (on the right pictures) and evidenced on the structural map below.
Remotesensing 12 02006 g012
Figure 13. Picture of the whole surface involved in the landslides during the winter 2020 (a), underlined by the red contour (b). In (c) a detail of the main sets of discontinuity is drawn on a close-up of the younger fall surface, reported also in a stereographic plot (d).
Remotesensing 12 02006 g013
Figure 14. Stereographic plot with the critical zone for failure mode. (a) Direct toppling; (b) flexural (oblique) toppling; (c) planar sliding; (d) wedge sliding.
Remotesensing 12 02006 g014
Figure 15. Shoreline retreat in three different time spans. The grey line in 2013 and 2018 pictures document the previous shoreline position.
Remotesensing 12 02006 g015

