Article

The Use of Unmanned Aerial Vehicles to Estimate Direct Tangible Losses to Residential Properties from Flood Events: A Case Study of Cockermouth Following the Desmond Storm

1
School of Water, Energy and Environment, Cranfield University, College Road, Cranfield MK430AL, UK
2
Oasis Hub, 3rd Floor 40 Bermindsey Street, London SE13UD, UK
3
School of Geography, Geology and the Environment, University Road, University of Leicester, Leicester LE17RH, UK
4
Dipartimento di Scienze della Vita e dell’Ambiente (DISVA), via Brecce Bianche, Monte Dago, 60130 Ancona, Italy
*
Author to whom correspondence should be addressed.
Remote Sens. 2018, 10(10), 1548; https://doi.org/10.3390/rs10101548
Submission received: 29 August 2018 / Revised: 22 September 2018 / Accepted: 24 September 2018 / Published: 26 September 2018
(This article belongs to the Special Issue Remote Sensing of Hydrological Extremes)

Abstract

:
Damage caused by flood events is expected to increase in the coming decades driven by increased land use pressures and climate change impacts. The insurance sector needs accurate and efficient loss adjustment methodologies for flood events. These can include remote sensing approaches that enable the rapid estimation of (i) damage caused to property as well as (ii) the number of affected properties. Approaches based on traditional remote sensing methods have limitations associated with low-cloud cover presence, oblique viewing angles, and the resolution of the geomatic products obtained. Unmanned aerial vehicles (UAVs) are emerging as a potential tool for post-event assessment and provide a means of overcoming the limitations listed above. This paper presents a UAV-based loss-adjustment framework for the estimation of direct tangible losses to residential properties affected by flooding. For that purpose, features indicating damage to property were mapped from UAV imagery collected after the Desmond storm (5 and 6 December 2015) over Cockermouth (Cumbria, UK). Results showed that the proposed framework provided an accuracy of 84% in the detection of direct tangible losses compared with on-the-ground household-by-household assessment approaches. Results also demonstrated the importance of pluvial and, from eye witness reports, lateral flow flooding, with a total of 168 properties identified as flooded falling outside the fluvial flood extent. The direct tangible losses associated with these additional properties amounted to as high as £3.6 million. The damage-reducing benefits of resistance measures were also calculated and amounted to around £4 million. Differences in direct tangible losses estimated using the proposed UAV approach and the more classic loss-adjustment methods relying on the fluvial flood extent was around £1 million—the UAV approach providing the higher estimate. Overall, the study showed that the proposed UAV approach could make a significant contribution to improving the estimation of the costs associated with urban flooding, and responses to flooding events, at national and international levels.

Graphical Abstract

1. Introduction

With one in six properties (5.2 million) in England at risk of flooding [1], the average annual flood damage to residential and non-residential properties is estimated to be more than £1 billion (2008 values). The cost of repairing a house after a flood is typically in the range of £10,000 to £50,000 depending on flood depth [1]. Effective mitigation and management of flood risk is a priority for the government. Various management strategies can be adopted to reduce the likelihood and the effect of flooding including (i) the adoption of resilience and resistance measures in buildings and (ii) the development of effective and reliable insurance products that spread the risk and ensure coverage to as many properties as possible [1]. Flood resistance and resilience measures (e.g., flood guards, hard floor surfaces and waterproof plaster) can reduce the amount of water that enters a property and the damage caused. The costs of such measures typically can be in the range of £3000 to £10,000 but can significantly reduce the impact of flooding [1]. Effective and reliable insurance products depend on the best possible understanding of the likelihood, the magnitude and impact of the peril, the appropriate setting of premium and excess rates, and timely loss adjustment activities. Current flood damage assessment by the insurance industry following an event relies on a combination of door-to-door inspections and remote sensing techniques. Inspections are time-consuming and costly, and may delay the path to recovery. Residential and commercial property owners are advised not to undertake any clearing up activity until the damage has been assessed by the insurance company. There will also be substantial costs if dwellings become un-inhabitable and residents have to make alternative accommodation provisions.
Remote sensing-based approaches have enabled a faster response to flood damage assessment. In [2], the potential of remote sensing methods to interpret flood levels and inundated areas was already highlighted. Insurance technical support companies such as Guy Carpenter have recently (2014) launched a satellite-based catastrophe evaluation service (GC CAT-VIEW) to provide clients affected by UK floods with rapid initial insured loss estimates. Satellite data is coupled with additional data sets to determine the flood extent and identify the properties insured by particular insurance companies that have been affected [3]. The information derived from the satellite imagery helps determine the number and location of claims insurers will receive and minimizes the time loss that adjusters require to assess the overall zone of flood impact via door-to-door assessments [4]. Many Canadian insurers use satellite imagery pre- and post-event to assess risk exposure, estimate the number of claims in an area and assess the need for loss adjusters [4]. Similarly, Swiss Re relies on CatNet, a software system that overlays satellite images onto Google maps enabling an assessment of the extent of the flooded area to be made and to determine where claims will arise [4].
A number of factors can curtail the effectiveness of remote sensing methods: (i) spatio-temporal coverage may not be available for the required zone and period, (ii) optical imagery cannot provide information if there is low cloud cover [5,6,7], and (iii) satellite (SAR) data, which can penetrate cloud cover, has an oblique viewing angle which makes it difficult to discriminate the water signature from other urban features [8]. Current remote sensing approaches fail to provide sufficient detail to assess the effects of micro-topography and the presence of property flood resistance measures. Unmanned aerial vehicles (UAVs) are emerging as an important means of environmental and asset monitoring and assessment. Within the context of flood damage estimation, UAV aerial imagery offers both timely (on-demand) and increasingly detailed (higher resolution) information than comparable satellite or aircraft imagery [9]. UAVs can also be deployed to assist in the response to flooding in conditions and areas that are not accessible by manned aircraft or helicopters. In the last five years, the use of UAV technology has increased exponentially with a varied range of commercial platforms (i.e., rotary blade, fixed wing, and nano and hybrid drones) and sensors. For example, for flood event situation reporting and damage assessment an estimated 600 UAVs were used globally in 2015 by police, firefighters, humanitarian relief, and disaster management, with the number of units doubling on a yearly basis [10].
Across the world, there has also been a focus on improving specific aspects of UAV capabilities for the estimation of flood extent and the assessment of derived impacts. In [11], the authors looked at generating more reliable input data for pre-event flood forecasting purposes through the integration of commercially available 30 cm resolution UAV imagery, a 1 m resolution LIDAR digital elevation model (DEM), and the 12 m resolution TanDEM-X DEM. In [12], a fixed wing platform was used to improve the identification of locations that are prone to flood in the city of Tanjun Selor (Indonesia) using 3D geomatic products obtained from high-resolution imagery. The potential of UAVs to provide information on reliable communication routes post-flooding was explored in [13] in Revinge (Sweden), whilst the optimization of UAV flight paths for flood applications (e.g., flood extent mapping) was investigated in [14] and more generally for post-event impact surveying in [15]. Other authors have focused on the development of algorithms for the identification of flooded locations from UAV high-resolution imagery. In [16], algorithms for the isolation of flooded areas from the overall background scenery were developed and tested on 10 aerial images captured post-event with a MUROS UAV (Autonomous Systems, Bucharest, Romania) as part of a pre-designed operational framework, and in [17] these algorithms were tested on a set of 24 post-event imagery collected from a HIRRUS (Autonomous Flight Technologies AFT, Bucharest, Romania) fixed wing platform. Further work has looked at integrating and embedding sensors into commercial UAV platforms. For example, in [18], UAVs and unmanned surface vehicles (i.e., floating platforms) were integrated to facilitate rescue operations during flood events. Srikudkao and Khundate [19] integrated ultrasonic sensors with a standard A Parrot AR (Parrot Drones SAS, Paris, France) UAV to measure water levels. However, the use of UAVs to quantify flood impacts as part of loss adjustment assessment is rarely referred to within the scientific literature. To date, only a handful of studies have looked at real (on-site) post-event applications of UAV technology for flood event assessment and management. To the authors’ knowledge, the most relevant studies are those reported in [20,21]. In [20], a LX UAV I hexacopter (Spatial Research Institute KCSC make, location), a prototype UAV for cadastral operations equipped with six rotors and blades, was used to map a 200 × 150 m area in an urban setting of Busan (South Korea) affected by the floods associated with Typhoon Sanba (14–17 September 2012). The authors focused on the effectiveness of the methodology although no flood metrics were derived from the acquired imagery. In [21], a fixed wing platform was used to gather imagery at 20 cm resolution and automatically extract inundated areas within a 10 km2 area in Yuyao city (China) after Typhoon Fitow (7 October 2013).
With global exposure to floods expected to increase by a factor of three by 2050 due to the continuous increase in population and assets in flood prone areas [2,22,23], the uptake of UAV-based imaging technologies that can provide timely estimates of impacts could deliver an important service to emergency responders, the insurance sector, and governments.
The aim of our work is to develop a UAV remote-sensing-based approach for the estimation of flood impacts on residential properties. This will be achieved by addressing the following objectives:
(1)
to develop a UAV framework for the estimation of direct tangible losses to residential properties;
(2)
to estimate the added benefit of the UAV framework with respect to more conventional methods based on flood extent delineation and on-the-ground surveying approaches;
(3)
to demonstrate the usefulness of the UAV framework in estimating the benefits provided by property resistance measures in reducing the impacts of flooding.

2. Materials and Methods

2.1. Study Site and Storm Event

The study site is located in the town of Cockermouth, Cumbria, UK (Figure 1), at the confluence of the rivers Cocker and Derwent. The town has a population of around 8800 and 4000 households (2011) [24]. The area is prone to severe flooding with the most recent instances occurring in 2015 during storms Desmond (5–6 December 2015), Eva (24 December 2015), and Frank (29–30 December 2015) [25]. As a result of Desmond, a total of 466 properties were flooded due to flood risk management structures being overtopped and outflanked [26]. Cockermouth was one of the worst affected urban areas during these storms. Other towns and cities affected included Carlisle, Kendal, Keswick, Appleby-in-Westmoreland, Morecombe, and Lancaster [26,27]. The event was a consequence of heavy rainfall over an extended period with more than 300 mm of rain falling over a 24 h period [26], which translated into flows in the Derwent River of 395 m3 s−1 at the Ouse Bridge gauging station and 170 m3 s−1 at the Cocker Southwaite River gauging station. The estimated annual exceedance probability for the observed event was less than 1% for both rainfall and river flows.

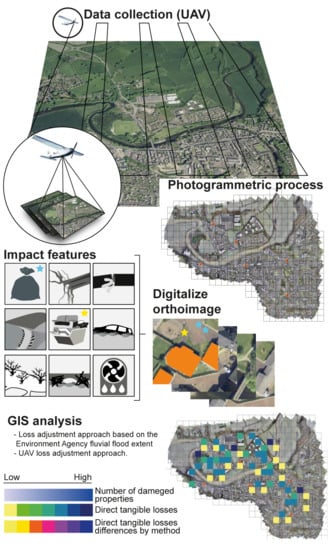
2.2. UAV Data Collection

High-resolution aerial imagery in the visible spectrum was collected over a total of 142 ha of the affected area. A Sirius-Pro (Topcon Positioning System Inc., Livermore, CA, USA) fixed wing platform was selected for the survey to maximize area coverage under rainy and gusty conditions (up to 65 km h−1). The Sirius-Pro platform had a 163 cm wingspan and a length of 120 cm. It was powered by a 5300 mAh Lippo battery (30 C, 18.5 V) with a flight endurance of 50 min under ideal operational conditions. The platform was equipped with a GNSS-RTK—L1/L2 GPS and GLONASS with RTK with a position accuracy of 0.01 m in planimetry and 0.015 m in altimetry. The platform also incorporated a 9DOF IMU. The total take-off payload was 2.7 kg, including the 16 megapixel Panasonic GX-1 on-board camera (0.030 m pixel size, 14 mm focal length, Micro 4/3 sensor type). The flight plan was designed to cover the area of interest by means of multi-passes. The images were collected using pre-determined waypoints ensuring an imagery overlap of 85% along and 65% across the track. The flying speed during data collection was 65 km h−1, with a constant flight height of 112 m. The resulting ground sampling distance was 0.026 m.
A total of six ground control points (GCPs) were randomly deployed within the surveyed area at locations where the emergency services (i.e., police and fire services) had granted access. The location of each GCP centroid was measured with a Topcon HiPer V GPS (Topcon Positioning System Inc., Livermore, CA, USA). The UAV platform was operated by a fully qualified Remote Pilot Qualification-small (RPQs) pilot following Civil Aviation Authority (CAA) regulation CAP 722 [29] and CAP 393 [30] at all times and with a special CAA permission for emergency response that enabled flights over congested areas beyond the visual line of sight up to 1000 m. Data collection, including UAV set up and deployment, GCP placement, and RTK GPS measurements, was undertaken in two consecutive flights and under 4 h. The weather conditions during the UAV flight, based on the Spadeadam meteorological aerodrome report (METAR), were surface wind speeds between 2.6 and 3.6 m s−1 and directions varying from 50 to 250°, with prevailing visibility obscure and weather conditions ranging from fog to light rain/drizzle. Data were collected on the 13 December 2015 after the floods caused by Desmond (5–6 December 2015) had receded but damage to property was untouched. Weather conditions did not allow for an earlier UAV deployment.

2.3. Photogrammetric Process

Individual frames that met the quality control criteria (i.e., image quality and spatial coverage) were included in the photogrammetric process for the generation of the geomatic products (i.e., digital terrain model (DTM), point cloud, and orthoimage) using Photoscan Pro version 1.1.6 (Agisoft LLC, St. Petersburg, Russia) (Figure 2). Imagery not complying with the set standards (distorted and blurred) was excluded from further analysis. Each individual frame was georeferenced (i.e., located, translated, and rotated) into a target Geodetic System (the World Geodetic System WGS84) using the GCPs coordinates to minimize distortion. This required the centroids of the GCPs to be manually identified in all frames and assigned the field RTK GPS GCP coordinates. The coregistration error was automatically derived from Photoscan Agisoft for x, y, and z as follows:
R M S E = j = 1 N [ ( x j ^ x j ) 2 + ( y j ^ y j ) 2 + ( z j ^ z j ) 2 ] N
where RMSE is the root mean square error; x ^ , y ^ , and z ^ are the image-derived coordinates at location j; x, y, and z are the associated RTK GPS positions of the GCPs; and N is the total number of GCPs.

2.4. Flood Impact Estimation

The high-resolution orthoimage was used to identify the flood impact and extent visually within a Geographical Information System Environment (ArcGIS 10.3, ESRI, Redlands, CA, USA). For that purpose, the orthoimage was divided into 10 × 10 m squares within which the impact features of interest (Table 1) were digitized (Figure 2). These features were selected as best proxy indicators of plausible damage to residential properties. To ensure consistency and independency in feature identification, squares were randomly selected for individual scanning. This ensured that the surveyor did not identify features based on the location of the cell through spatial association. Each digitized point was assigned a confidence level (i.e., high, medium, or low) describing the uncertainty associated with its impact classification and the potential for the impact to have been generated from any other source rather than flood. The raw UAV high-resolution imagery was used to reduce the level of uncertainty when possible. The resulting flood impact point database was used to identify residential property that could have been flooded during Desmond. For that purpose, the OS MasterMap (Ordnance Survey, Southampton, UK) was used to identify residential properties that were in close proximity to the digitized flood impact features.
The direct tangible losses (i.e., domestic clean-up, household inventory damage, and building fabric damage) for the affected properties were calculated using the UK specific methodology developed by Penning-Rowsell et al. [31,32], which is based on stage-damage curves (SDC) [33,34,35,36] or tables [31,32]. The losses (without VAT or other indirect taxes) for a residential property of a given type and age (e.g., pre-1919 detached, 1975–1985 semi-detached, and 1919–1944 flat) are tabulated in GBP at 2016/17 prices based on the flood water depth within the property. The type and age of each affected residential property were estimated via direct on-site observations (Figure 2). Residential properties with directly observable resistance measures (i.e., flood aperture guards for doors and windows, flood resistant airbricks, and raised doors or steps leading to a property) were also identified. Information on the type of flooding (i.e., overbank topping, pluvial run-off, and groundwater) affecting the property was also collected based on the topography of the site. In the specific case of flats, the number of properties on the ground and first floor were identified to enable a more accurate identification of flooded households. On-site observations were logged in a GIS environment via a Samsung SM T560 8GB tablet (Samsung Electronics Co. Ltd., Seoul, Korea) and the ESRI Collector Application (ESRI, Redlands, CA, USA) for Android. This will be referred to in this paper as the ‘UAV approach’.
For comparison purposes with current loss adjustment practice, expected direct tangible losses were also estimated for all the residential properties within the Environment Agency fluvial flood extent. For this calculation, all of the properties within the fluvial flood extent were assumed to be impacted. Properties outside the flood risk map flood zone were not considered to be affected. This will be referred to in this paper as the ‘classic approach’.
Flood depth was estimated based on a total of 50 wrack marks provided by the Environment Agency and collected post-event within the fluvial flood extent. Inverse distance weighting interpolation was used to obtain a coarse estimate of flood depth at household level. The flood depth for all affected properties falling outside the fluvial flood extent was assumed to be 25 cm. The damage-reducing effects of resistance measures at a household level were estimated by assuming that the efficiency of these measures was 100% for all properties where the height of the resistance measures was greater than the estimated flood depth and 0% for all other properties. All calculations were carried out with the values associated with a short-duration ‘major flood including sewage’ (Institute of Inspection, Cleaning and Restoration Certification category 3) [31,32,37].
The accuracy of the UAV approach in identifying flooded residential properties was assessed using an ancillary data set with the known location of 341 confirmed flooded residential properties within the fluvial flood extent. A GIS layer with the exact location of each of the 341 properties was generated and overlaid onto the properties identified as flooded by the UAV approach. Matching properties were considered to be identified accurately. The overall accuracy of the UAV approach was estimated as the ratio between the number of properties correctly identified as flooded and the 341 properties available for validation. The accuracy of the classic approach was 100%, as by definition all the properties within the fluvial flood extent, including the 341 properties available for validation, would have been considered as flooded.
Differences in the number of properties identified as flooded when using the UAV and the classic approaches were mapped and reported via descriptive statistics. The associated differences in direct tangible losses were also quantified for each of the approaches tested and interpreted based on property type and age. The damage-reducing effects of resistance measures were mapped and results used to identify the most flood vulnerable area within the study site. All spatial results were represented via 100 × 100 m pixels for compliance with the UK Data Protection Act 1998 [38].

3. Results

3.1. Photogrammetric Process

A total of 1879 frames were included in the photogrammetric process which required 36 h of analysis on a computer with an Intel Core i7-5960k 3.30 GHz processor, 64 GB RAM, and a Geforce Titan X Graphics card. The co-registration error was less than 0.12 m in all directions (Table 2) and the ground sampling distance of the processed orthoimage was 0.026 m.

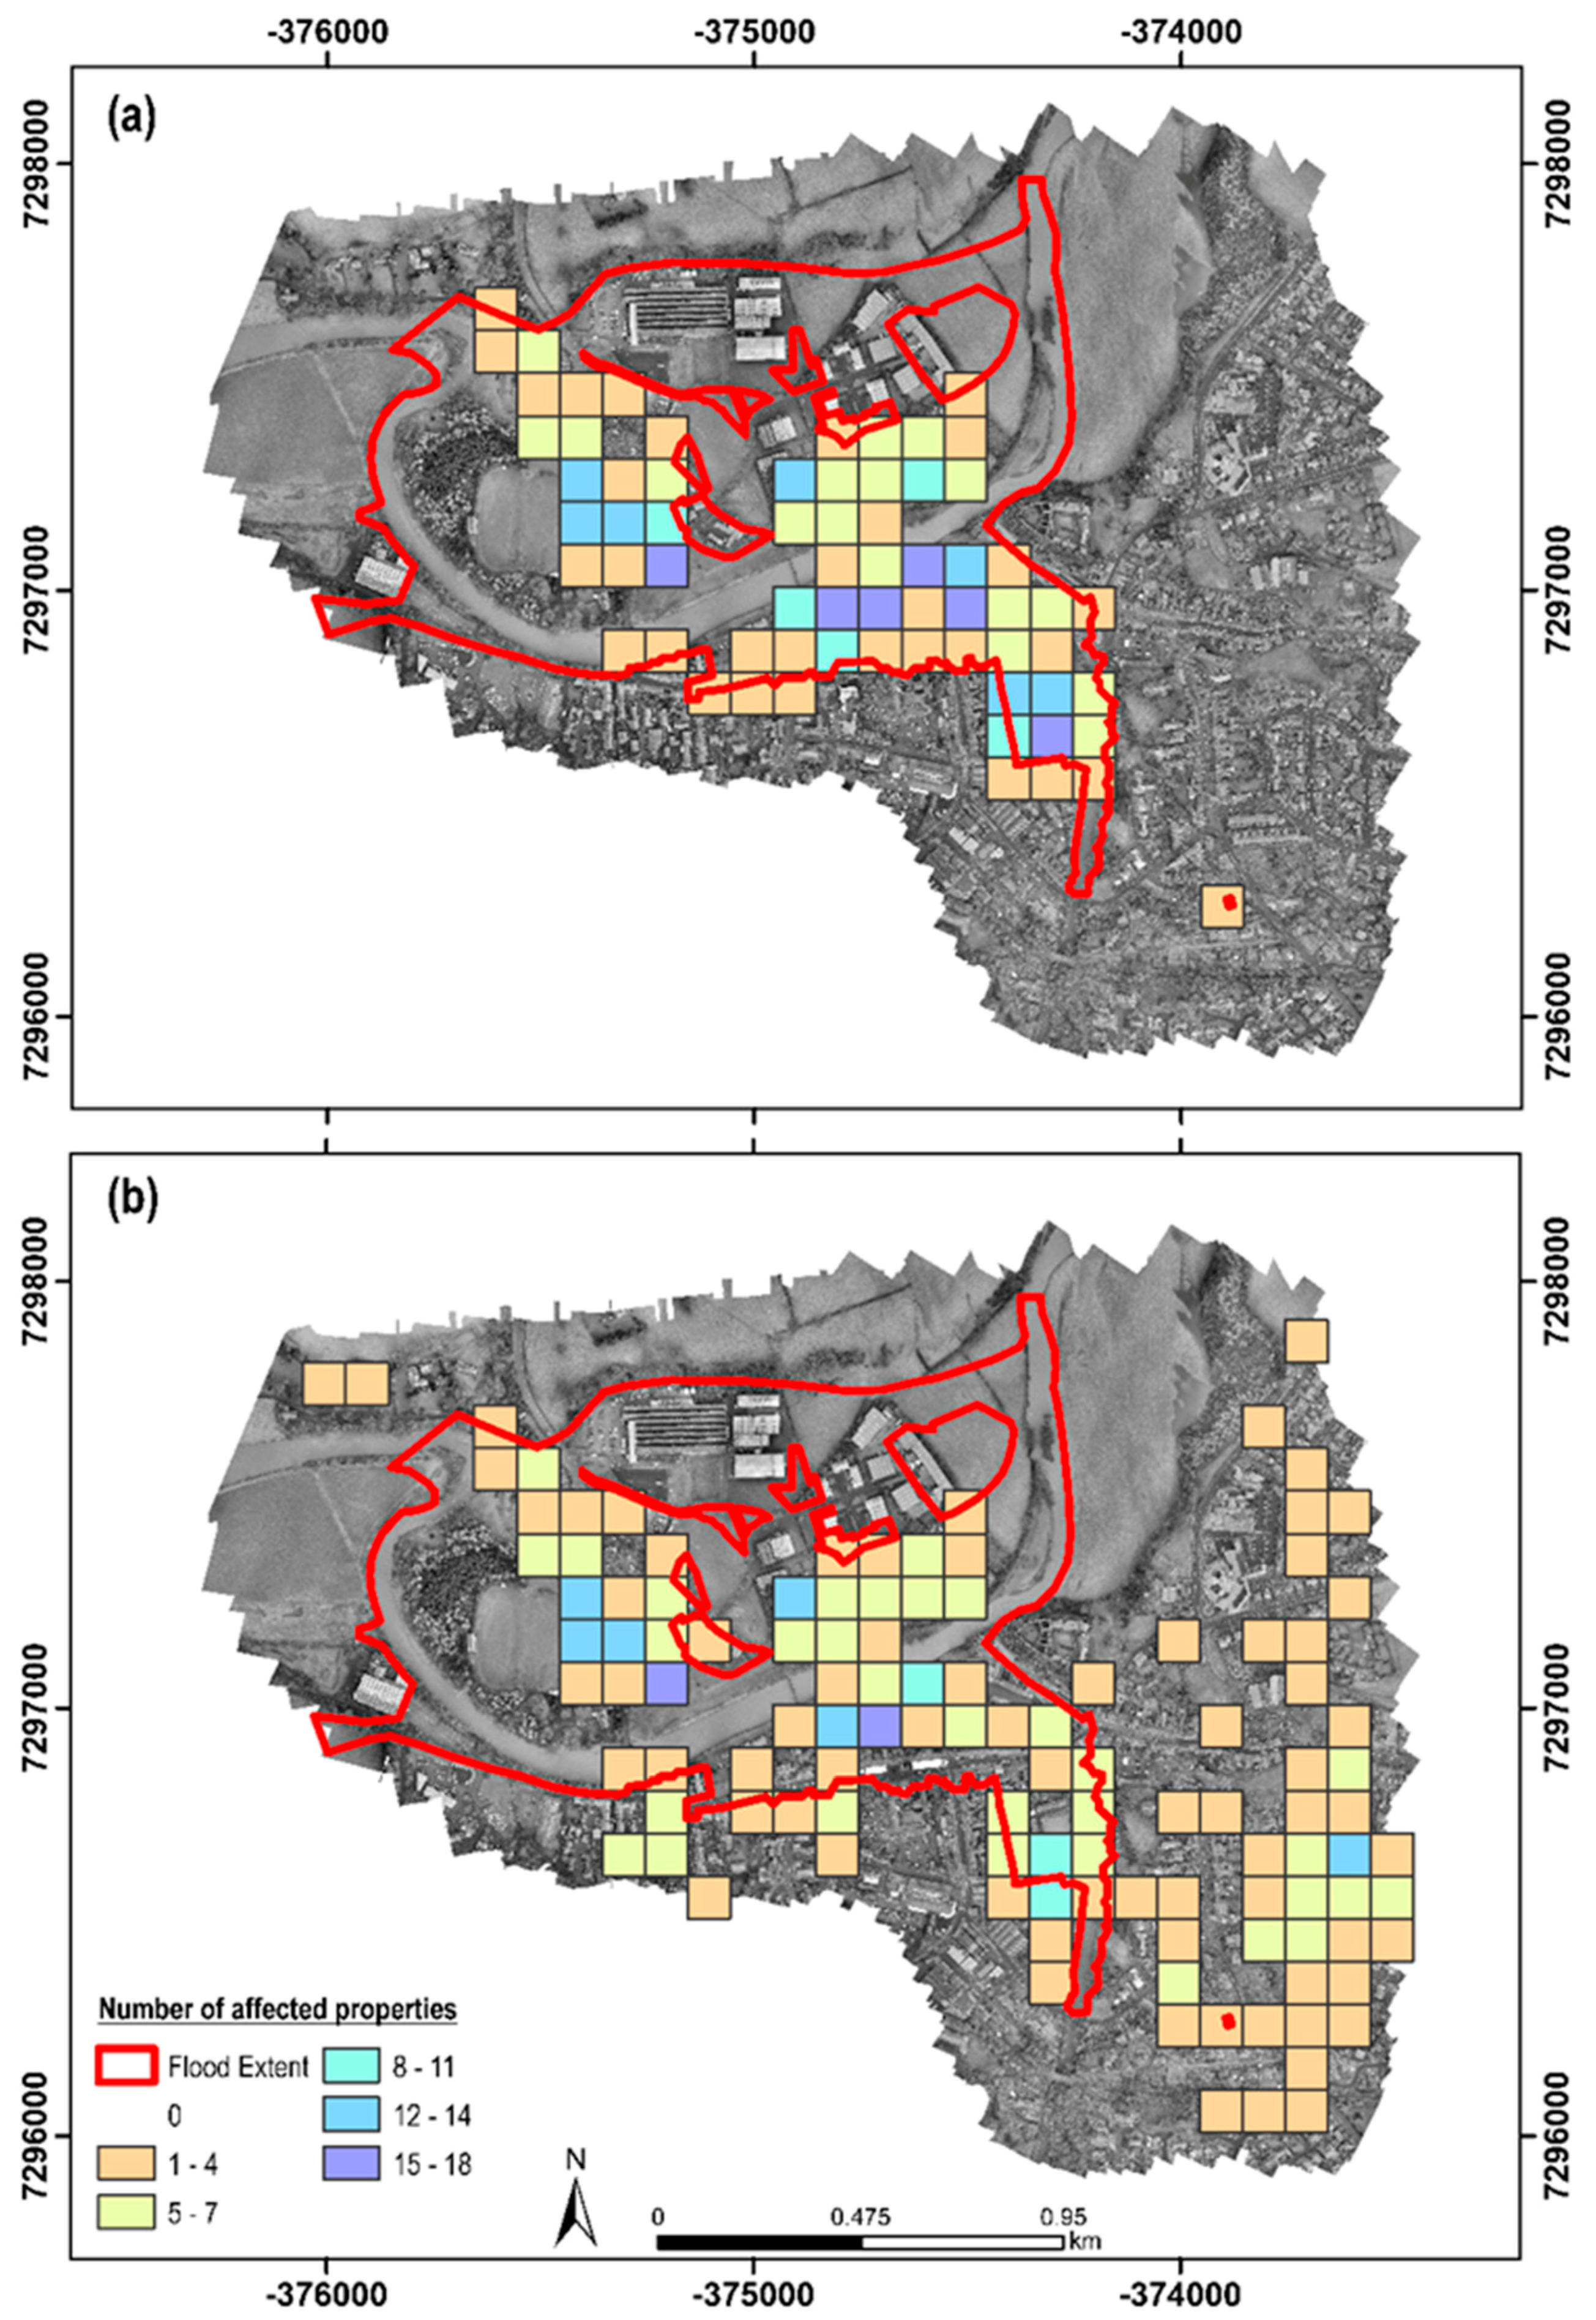
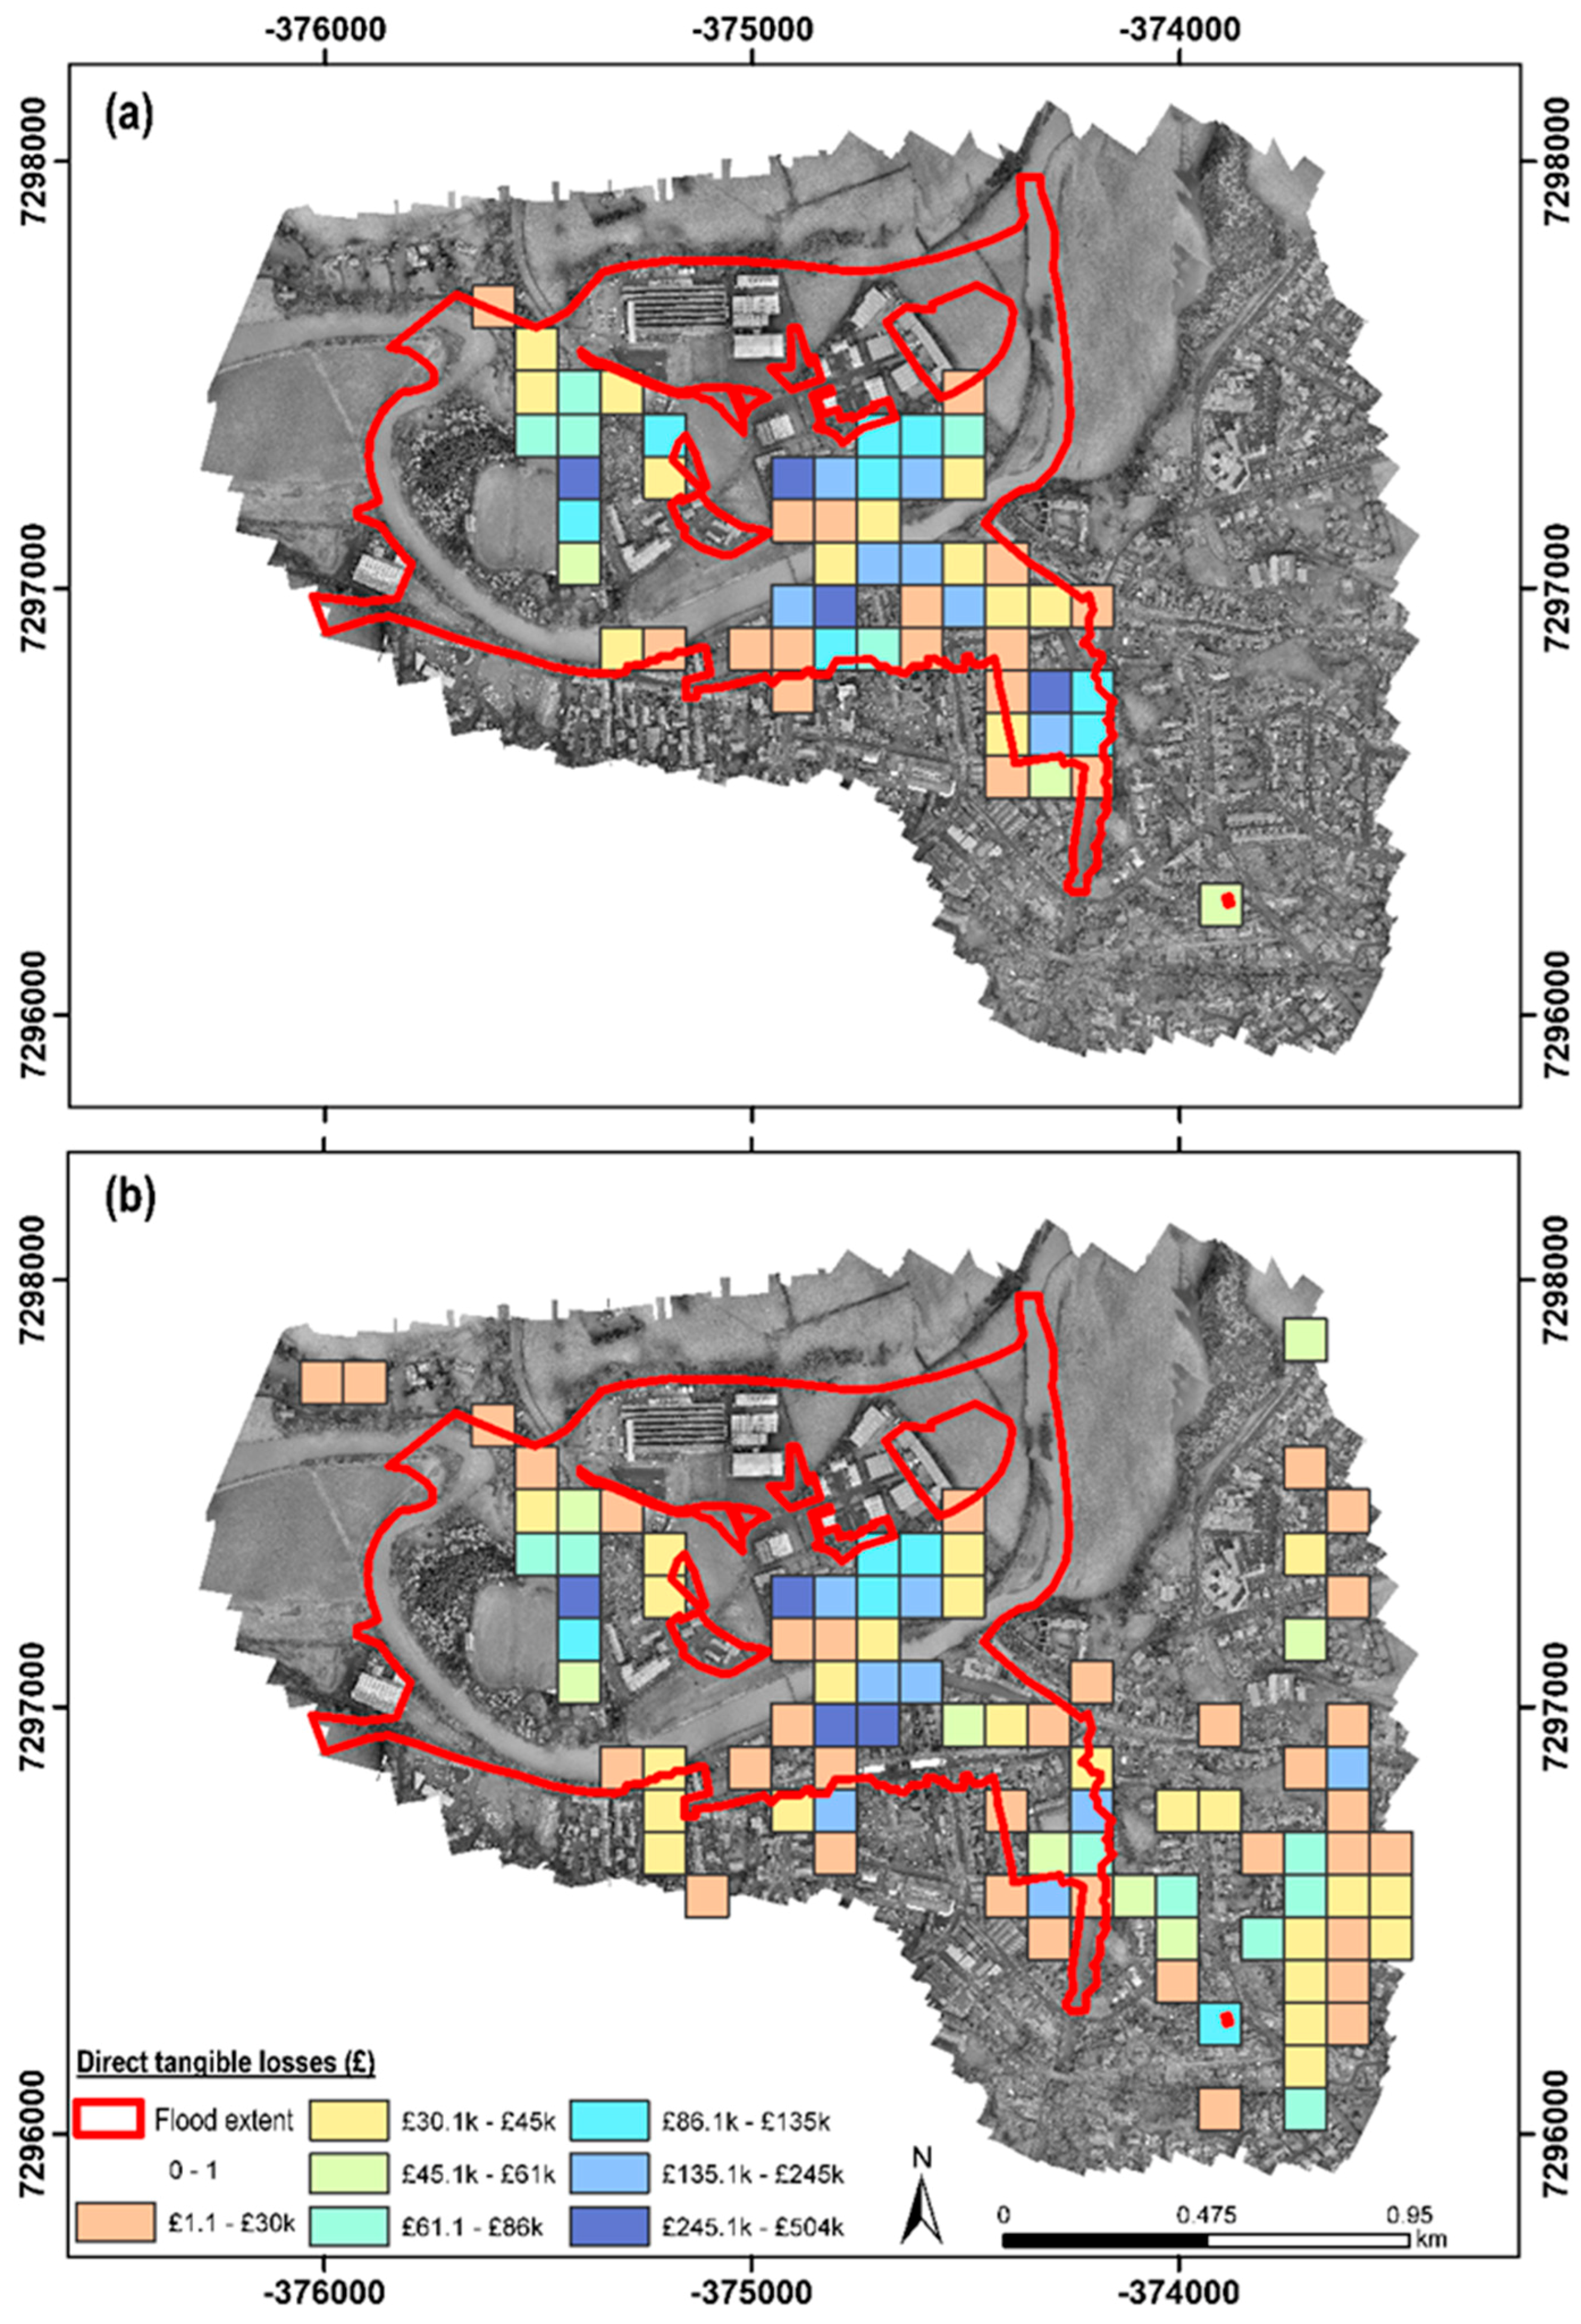
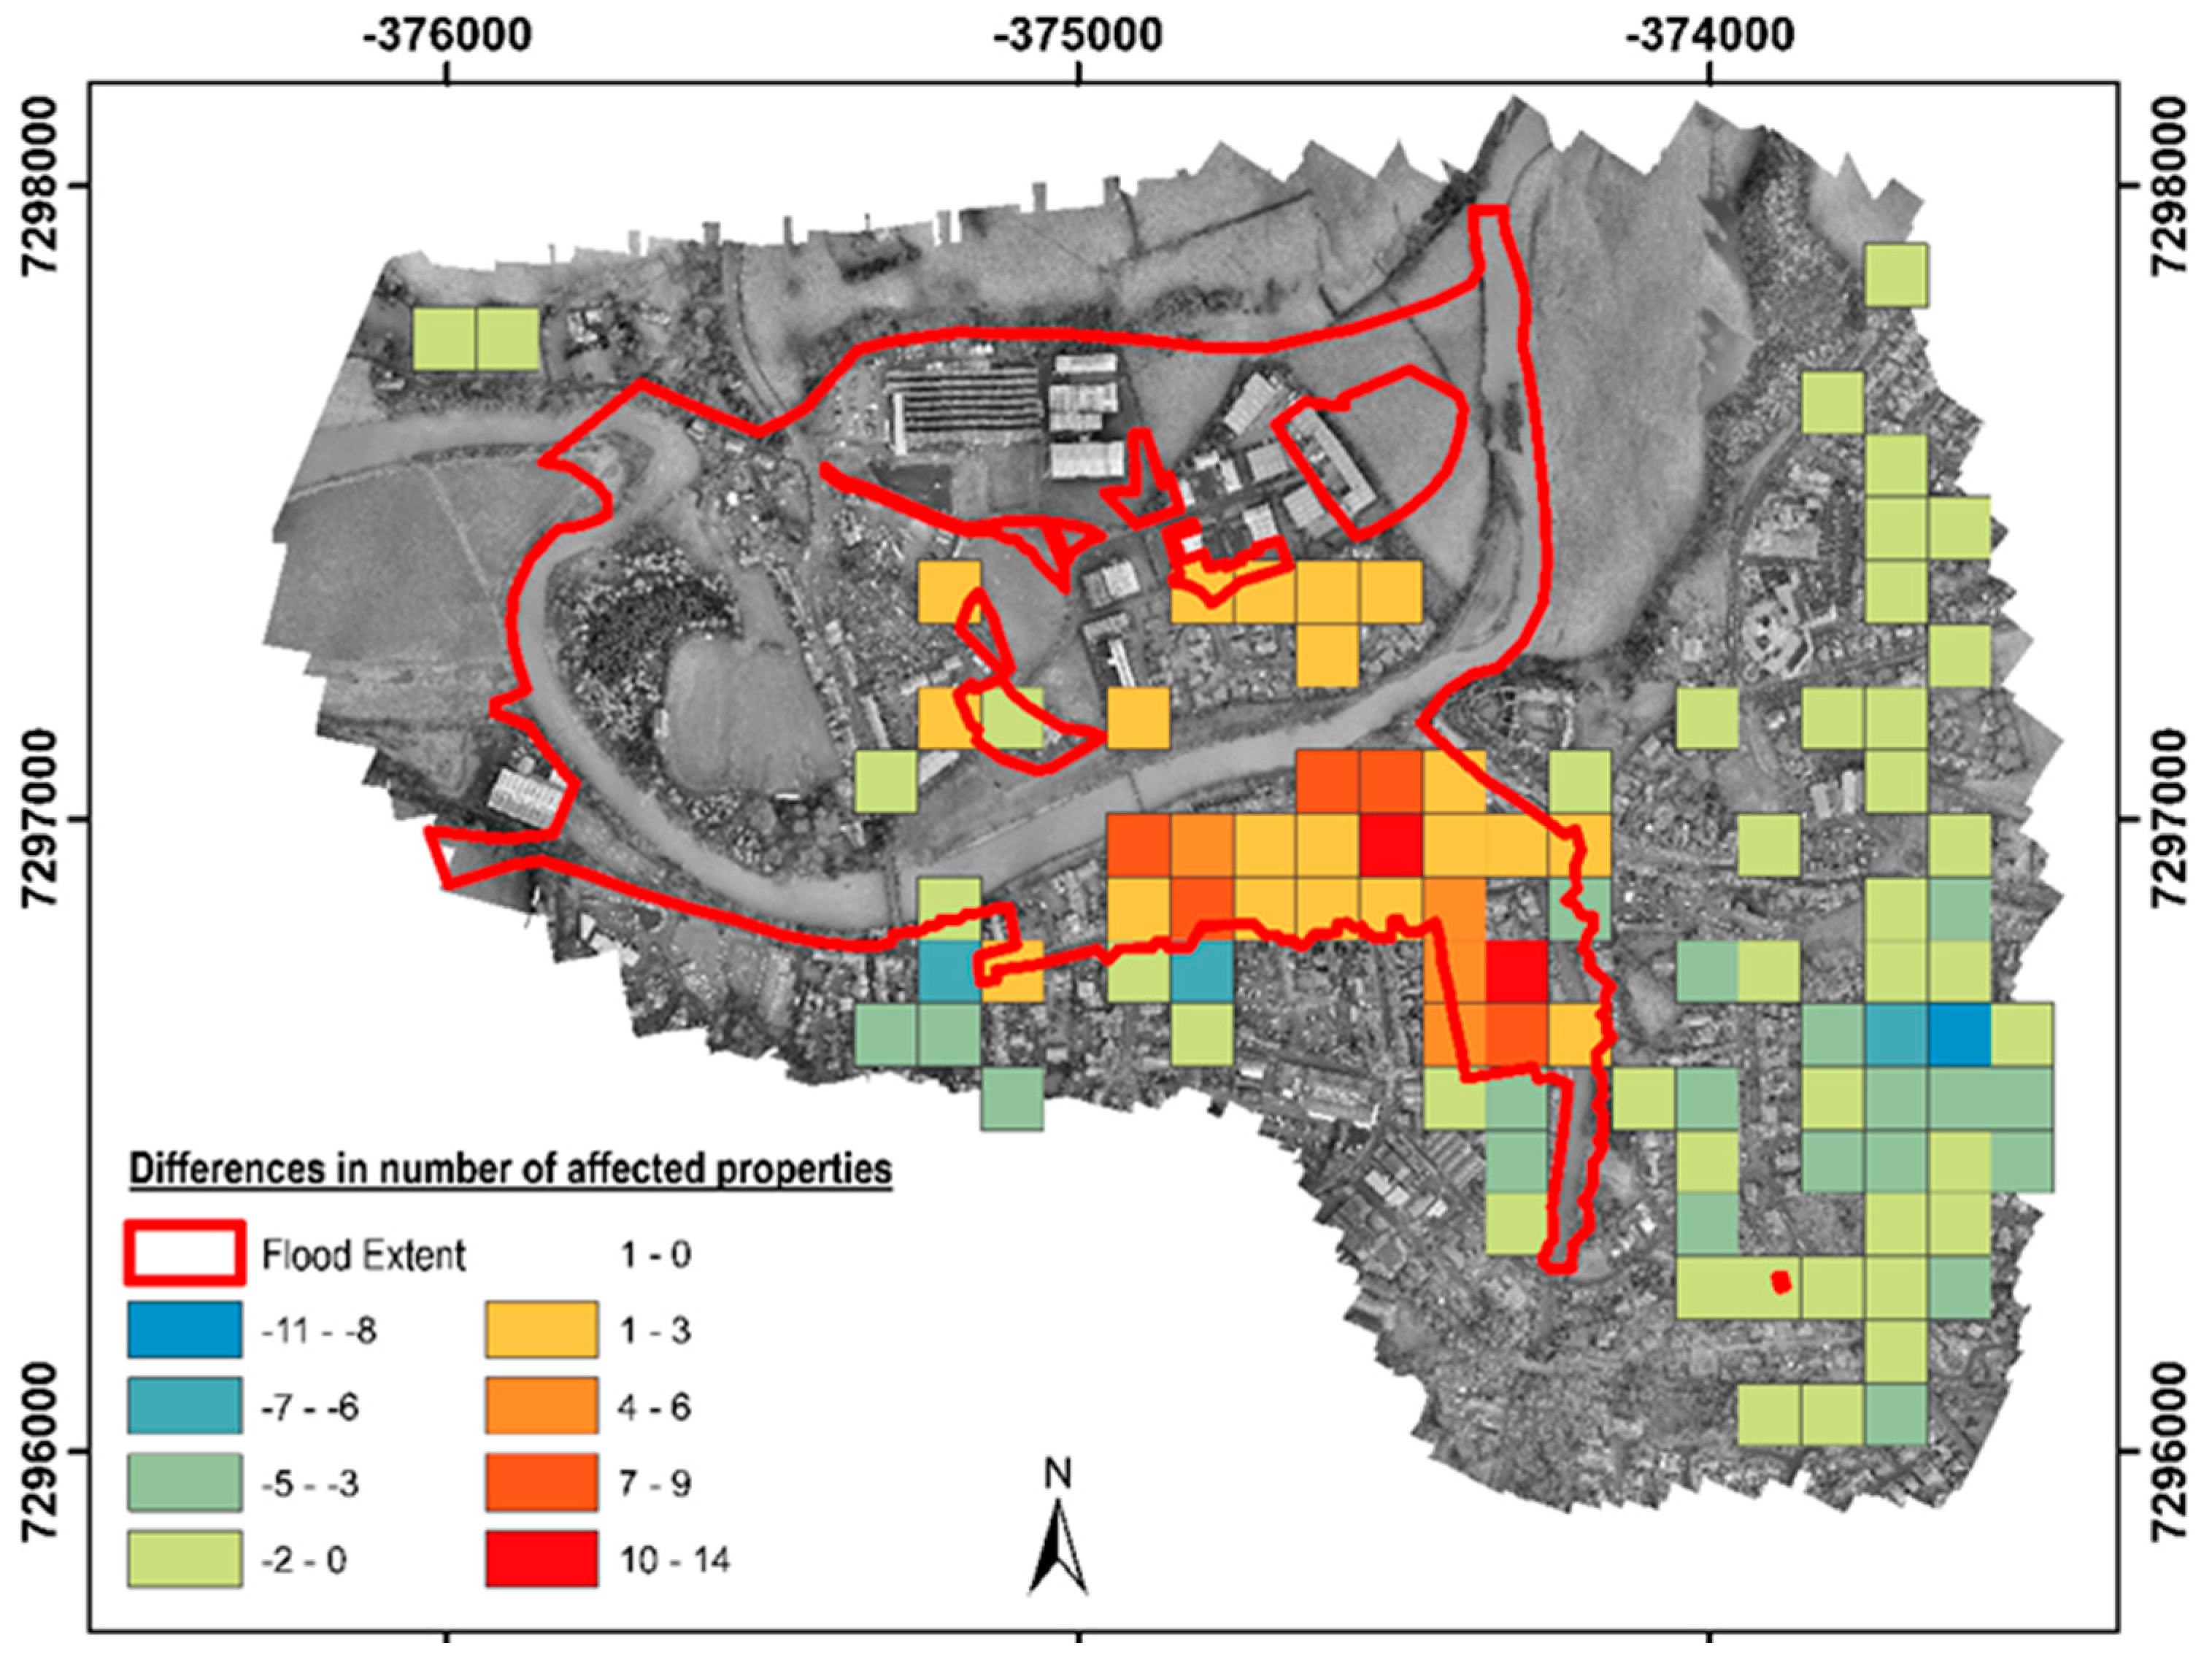
3.2. Flood Impact Estimation

3.2.1. Classic Approach

Using the classic approach a total of 372 residential properties (i.e., all residential properties within the flood extent) were assumed to be affected by flooding (Figure 3). Of these, the predominant types of households affected were 105 pre-1919 terraces, 64 pre-1919 semi-detached, and 33 post-1985 flats (Table 3). Of the 372 households identified as flooded with the classic approach, 254 had resistance measures in place, with an average protection of 74 cm. From the 254 properties with resistance measures, 35% had a flood depth protection <25 cm, and 44% above 100 cm. The majority of resistance measures in place were identified in pre-1919 terraces (85). The direct tangible losses amount to £9 million without resistance measures (Figure 4 and Table 4) and £5.3 million with these measures in place (Table 5 and Figure 5). The damage-reducing economic effects of the resistance measures were therefore £3.7 million.

3.2.2. UAV Approach

A total of 8539 points identifying flood impact features were digitized (Table 1) from the generated orthoimage. The majority of these points represented water-damaged items (4949), scour (2137), and natural debris (1095). Of the 8539 points, there was high confidence in their link to flood impact for 6326 (74.1%), whereas the confidence was medium for 1401 (16.4%) and low for 812 (9.5%).
The digitized features identified a total of 419 residential properties that could have been impacted by flooding (Figure 3 and Table 3). The majority of these properties were pre-1919 terraces (103 properties) and pre-1919 semi-detached houses (66 properties) (Table 3). Of the 419 properties, 251 were within the EA fluvial flood extent and the other 168 outside (Figure 3). Figure 6 shows the differences in number of affected properties between the UAV and the classic approach. The UAV approach identified a larger number of properties affected outside the fluvial flood extent, whereas the classic approach identifies a larger number of properties within the fluvial extent. Of the 168 affected properties outside the fluvial flood extent, 37 were pre-1919 terraces, 32 were 1945–1964 semi-detached properties, and 28 were pre-1919 properties. The UAV approach successfully identified 285 of the 341 residential properties confirmed to be flooded. Based on these results, the accuracy of the UAV approach for the identification of flooded properties was 84%.
Of the 419 properties identified as being impacted by the flooding using the UAV approach, 284 were identified as having resistance measures. The average protection depth provided by the resistance measures was 59 cm. From the 284 properties with resistance measures, 39% had a flood depth protection <25 cm, whereas 30% had a flood depth protection of >100 cm. The direct tangible losses (Figure 4) for all the properties identified as flooded added up to £10 million, assuming no resistance measures were in place, and £6 million when accounting for the existence of these measures (Table 4 and Table 5). The damage-reducing economic effects of the resistance measures were equal to £4 million. The largest direct tangible losses were associated with pre-1919 terraces and semi-detached properties (Table 4 and Table 5). For the residential properties outside the EA designated fluvial flood extent, the direct tangible losses were £3.6 million and reduced by £1.5 to 2.1 million when the resistance measures were considered operational.
The damage-reducing effects of resistance measures can be derived from Figure 5 and Figure 7, which depict the spatial variation in the uptake of resistance measure across Cockermouth and the associated reduction in direct tangible losses. The effect outside the fluvial flood extent is less prominent (which is to be expected as there would be less expectation of flooding having an impact on these properties), with the majority of households adopting resistance measures providing a depth protection of >100 cm being located within the historic town center.
Figure 8 shows the differences in direct tangible losses between the UAV and the classic approaches with and without resistance measures in place. The pattern observed in both cases is consistent; direct tangible losses outside the fluvial flood extent are larger for the UAV approach than for the classic approach, whereas these losses are larger for the classic loss adjustment approach within the fluvial flood extent. Within the fluvial flood extent, the differences in direct tangible losses between approaches range between £1.4 million (with resistance measures) and £2.6 million (no resistance). The differences between methodologies outside the fluvial flood extent match the values reported above for the direct tangible losses identified outside the fluvial extent for the UAV approach. When considering all properties affected within the area, the differences between both methodologies amount to £0.7 million when resistance measures are considered operational and £1 million otherwise.

4. Discussion

4.1. On the Use of UAV-Based Loss-Adjustment Frameworks

The UAV approach performed well (with an 84% accuracy rating) when identifying flooded properties compared with on-the-ground household-by-household assessment approaches. Eye witness accounts highlighted that many of the areas outside the fluvial flood extent identified as flooded by the UAV approach had been affected by a combination of fluvial and pluvial flooding, and there were also reports of water coming up through the floor of properties which could indicate a lateral flow of water. Assuming an 84% identification rate (as per validated results), a minimum of 138 residential properties would have been flooded outside the fluvial flood extent. The direct tangible losses for these properties would have been £4.8 million assuming an average damage per household without resistance measures of £35,000 as per values suggested in previous reports [25]. These results indicate that the contribution of pluvial flooding and possibly the lateral flow of water were systematically underestimated within the study site, with the UAV approach providing sufficient detail to address this limitation.
The UAV imagery and the digitized features also provided sufficiently detailed information to identify those residential properties where flood impact had been lessened due to the presence of flood resistance measures. Within the fluvial flood extent many of the properties were identified as not being flooded by the UAV approach, as no impact features were observed outside the properties. It may be possible that the UAV approach failed to identify flooded properties as data were collected a few days after the event. This could explain any discrepancies encountered between the UAV approach and eyewitness reports. However, the field survey highlighted that, in fact, many of these properties had resistance measures. The assumption that all residential properties within the fluvial flood extent had been affected was therefore not correct.
The difference in estimated direct tangible losses between the UAV and classic approaches was more than £1 million (around £10 million for the UAV approach and £9 million for the classic approach) with no resistance measures being taken into account. This difference highlights the impact that the selected approach has on the overall estimation of direct tangible losses. The difference between the two approaches could be even larger. At present there is insufficient reliable information to validate both approaches. For example, the classic approach identified as flooded many houses within the fluvial flood extent that did not result in any claims (e.g., owner not reporting the damage, properties not being affected or properties being abandoned). In addition, the classic approach failed to identify properties that were flooded outside of the fluvial flood extent. With the UAV approach, some of the affected properties were not identified as being flooded where the occupiers had cleared away all evidence of damage. Some of the impact features (e.g., skips) could relate to more than one property, yet the UAV approach would have allocated damage to a single household. In addition, the high-resolution imagery would have highlighted as potential flood impact features any pre-event activities such as garden and building works already underway.

4.2. On the Benefits of Resistance Measures

The estimated economic benefits of resistance measures were £4 million using the UAV approach and £3.7 million using the classic approach. As might be expected, there was greater uptake of resistance measures in the center of the town located within the fluvial flood extent, resulting in the largest benefits. It would also appear, as might be expected, that a lower proportion of householders in areas that flooded but were not within the fluvial flood extent had not installed resistance measures.
It should be noted that the estimation of the benefits of resistance measures was based on the assumptions that all resistance measures were 100% effective. Evidence suggests that homeowners can forget to install or activate resistance measures on time and the effectiveness of the measures is variable depending upon the type of measures in place [39]. This needs to be taken into account when interpreting the results presented here. The approach promoted in the multi-coloured manual [31,32] is to assume protection against a flood depth of 0.6 m with the protection being effective in 75% of relevant properties. However, in practice, the level of damage experienced varies with the type of property. Insurance companies are considering whether and how to take account of resistance measures within their premiums and excesses. A strong case can be made for requiring all new properties to be resilient to fluvial, pluvial, sea, and groundwater flooding as appropriate even where flood risk management schemes may be in place.
The floods in 2015/2016 triggered a set of actions by government to promote the uptake of resistance measures [25]. In Cockermouth, the government established a grant scheme in which £5000 was available to all affected homeowners to install resistance measures. As a result, many properties now have an increased level of resilience to flooding. However, there was not universal uptake by all potentially affected householders. Some properties that have flooded in the past have not installed resistance measures. There are weaknesses in how some measures have been implemented. For example, a property may have flood protection on their door, but windows that go down to the ground have no protection. The UAV approach could inform decisions on the prioritization of the installation of resistance measures in the areas of higher risk from all sources of flooding.

4.3. Further Research

Further research should focus on automating the UAV approach so it can be implemented in near-real time. This will require the automation of the detection of flood impact features and the estimation of direct tangible losses. In its present format, the framework requires a total of 36 h of photogrammetric processing, 72 h for the digitization of impact features, and 24 h for the estimation of direct tangible losses.
In this paper we focused on the estimation of direct tangible loses to residential properties, but the framework could be expanded to estimate other economic losses, for example, to commercial property and infrastructure or for indirect losses. Further work should focus on accurately estimating the depth at which each property has been flooded. The DEM obtained as a geomatic product from the UAV imagery could be used for that purpose. This will require the estimation of the uncertainty associated with the generation of such a DEM via multiple GCPs and a reliable ground truth data set (e.g., collected with a laser scanner).
The study assumed that all properties’ characteristics (e.g., type and age) and resistance measures were correctly identified. Mapping errors are expected due to, for example, house extensions and attachments, making the overall classification unclear or some resistance measures not being easily identifiable (e.g., installed indoors).

4.4. Enhancing Flood Risk Management

Many of the limitations and awareness points highlighted here could be addressed through comprehensive databases. For example, the provision of combined fluvial, pluvial, coastal, and groundwater maps would be of great use to insurance companies and the public sector to identify the likelihood of specific households flooding. This will help to set more accurate insurance premiums and enable more informed flood management decisions than at present. It will identify which areas are most at risk of flooding and the potential; benefits of be-spoke (i.e., groundwater, fluvial, or pluvial) resistance measures in all affected areas. Similarly, a database identifying which properties have operational resistance measures will be useful for the generation of be-spoke insurance premiums that take into account the individual and combined effect of such measures.
The detection of flooded properties outside the fluvial flood extent highlights the potential of the proposed UAV framework to increase the accuracy of the identification of affected properties, not only for the insurance sector but also for first response and evacuation planning. Some of the features identified are also common to other catastrophe events (e.g., wind storms). There are therefore multiple applications of this technology that have yet to be explored for a range of scenarios (e.g., fire, landslide, floods, earthquakes, volcanoes, and industrial accidents) and a range of sectors (civil resilience and energy). However, the uptake of the technology and methodology can be limited by concerns raised about usability, cost, the data that will be collected and services available [40]. Further limitations attain the existence of country-specific legislation that regulates the use of drones in congested areas (e.g., in UK CAP 722 [29] and CAP 393 [30] apply) with a requirement to obtain extended permission to fly over houses and beyond the visual line of sight. The deployment of UAVs during and immediately post-flood event may be restricted due to extreme rainy and gusty conditions. The framework presented here looked at developing a valid approach based on post-event UAV data collected under suitable weather conditions. The results obtained prove that data collection post-event provides highly relevant information for rapid insurance loss estimation. Given the likely increase in flood risk across the UK, driven by both climatic factors and increased urbanization, the proposed UAV approach outlined here could make a significant contribution to improving the estimation of the costs associated with urban flooding, and responses to flooding events, at national and international levels.

5. Conclusions

The work presented here highlights the potential of UAVs in the development of remote-sensing-based loss-adjustment frameworks. The framework provided an accuracy in the detection of flooded properties of 84%, with these results encouraging the validation of the approach for other loss types (e.g., indirect losses). The results also highlighted the importance of considering all sources of flooding even when an event is largely thought to be fluvial in nature. There were significant levels of pluvial and lateral flow flooding, with a total of £3.6 million in direct tangible losses assigned to 168 properties outside the fluvial flood extent. This comprises 36% of the total direct tangible losses (assuming no resistance measures are in place) associated with all sources of flooding in Cockermouth during this event. These properties were not initially identified as being flooded as the initial responses focused on the fluvial flood extent. Resistance measures present within the area resulted in a considerable reduction in direct tangible losses (£4 million). The work presented here also highlighted the importance in selecting accurate remote sensing loss-adjustment approaches, with a discrepancy in direct tangible losses between the two approaches tested of ≈£1 million.
Key to the adoption of the proposed framework by loss-adjusters and flood managers is the generation of outputs in near-real time. The next steps will focus on the development of bespoke algorithms that enable the automated implementation of the framework presented here.
The UAV approach with further development will facilitate a better and faster estimation of the extent and impact of a flooding event. As has been demonstrated at Cockermouth, it is important in the initial evaluation of an event to consider flooding from all sources not just from the overtopping of flood risk management structures. The UAV approach will also enable a more rapid evaluation of the affected area and the associated damage costs. It will enable loss adjusters to prioritize their individual household impact assessments.

Author Contributions

All authors contributed equally.

Funding

This research was funded by the Natural Environment Research Council, grant numbers NE/N020316/1 and NE/P018890/1, and the Engineering and Physical Sciences Research Council, grant “Impact Acceleration Award”. The APC was funded by the UK Research and Innovation block grant through Cranfield University.

Acknowledgments

We would like to thank NERC and EPSRC for funding this research under research grants NERC Drone Watch NE/N020316/1, NERC Pathfinder NE/P018890/1, and EPSRC Impact Acceleration Award. We would also like to thank the Environment Agency, Caintech Ltd. Cockermouth Library, and eye witnesses for providing support at specific stages of the project. We also thank the reviewers for their positive and constructive comments. The underlying data is confidential and cannot be shared.

Conflicts of Interest

The authors declare no conflict of interest.

References

  1. Environment Agency. Flooding in England: A National Assessment of Flood Risk; Environment Agency: Rotherham, UK, 2009.
  2. Kundzewicz, Z.W.; Kanae, S.; Seneviratne, S.I.; Handmer, J.; Nicholls, N.; Peduzzi, P.; Mechler, R.; Bouwer, L.M.; Arnell, N.; Mach, K.; et al. Flood risk and climate change: Global and regional perspectives. Hydrol. Sci. J. 2014, 59, 1–28. [Google Scholar] [CrossRef]
  3. DeAngelis, M.; Ainslie, J.; Hirst, S. Guy Carpenter launches satellite-based catastrophe evaluation service GC CAT-VIEWSM helps insurers assess losses from UK floods. Guy Carpenter, 24 February 2014. [Google Scholar]
  4. How Satellite Imagery Helps Insurers Prepare for Disasters—The Globe and Mail. Available online: https://www.theglobeandmail.com/technology/business-technology/insurers-rely-on-eyes-in-the-sky/article13171104/ (accessed on 13 July 2018).
  5. Ogunbadewa, E.Y. Investigating availability of cloud free images with cloud masks in relation to satellite revisit frequency in the Northwest of England. Contrib. Geophys. Geod. 2012, 42, 63–100. [Google Scholar]
  6. Cihlar, J.; Ly, H.; Li, Z.; Chen, J.; Pokrant, H.; Huang, F. Multitemporal, multichannel AVHRR data sets for land biosphere studies—Artifacts and corrections. Remote Sens. Environ. 1997, 60, 35–57. [Google Scholar] [CrossRef]
  7. Vant-Hull, B.; Marshak, A.; Remer, L.A.; Li, Z. The effects of scattering angle and cumulus cloud geometry on satellite retrievals of cloud droplet effective radius. IEEE Trans. Geosci. Remote Sens. 2007, 45, 1039–1045. [Google Scholar] [CrossRef]
  8. Ouled Sghaier, M.; Hammami, I.; Foucher, S.; Lepage, R. Flood extent mapping from time-series SAR images based on texture analysis and data fusion. Remote Sens. 2018, 10, 237. [Google Scholar] [CrossRef]
  9. Wang, Y. Advances in remote sensing of flooding. Water 2015, 7, 6404–6410. [Google Scholar] [CrossRef]
  10. Euroconsult Prospects for Remotely Piloted Aircraft Systems. A Vertical Market Analysis of Major Drivers, Strategic Issues and Demand Take-Up for RPAS. Available online: http://www.euroconsult-ec.com/shop/earth-observation-rpas/81-prospects-for-rpas.html (accessed on 9 October 2017).
  11. Heimhuber, V.; Hannemann, J.C.; Rieger, W. Flood risk management in remote and impoverished areas—A case study of Onaville, Haiti. Water 2015, 7, 3832–3860. [Google Scholar] [CrossRef]
  12. Mardiatno, D.; Khakim, N.; Priyambodo, T.K. Identification of flood-prone area using remotely sensed data—Case in Tanjung Selor City, North Kalimantan. In Proceedings of the 2015 IEEE International Conference on Aerospace Electronics and Remote Sensing Technology (ICARES), Bali, Indonesia, 3–5 December 2015; pp. 1–4. [Google Scholar]
  13. Tuna, G.; Nefzi, B.; Conte, G. Unmanned aerial vehicle-aided communications system for disaster recovery. J. Netw. Comput. Appl. 2014, 41, 27–36. [Google Scholar] [CrossRef]
  14. Abdelkader, M.; Shaqura, M.; Ghommem, M.; Collier, N.; Calo, V.; Claudel, C. Optimal multi-agent path planning for fast inverse modeling in UAV-based flood sensing applications. In Proceedings of the 2014 International Conference on Unmanned Aircraft Systems (ICUAS), Orlando, FL, USA, 27–30 May 2014; pp. 64–71. [Google Scholar]
  15. Li, G.Q.; Zhou, X.G.; Yin, J.; Xiao, Q.Y. An UAV scheduling and planning method for post-disaster survey. Int. Arch. Photogramm. Remote Sens. Spat. Inf. Sci. 2014, XL, 169–172. [Google Scholar] [CrossRef]
  16. Popescu, D.; Ichim, L.; Caramihale, T. Flood areas detection based on UAV surveillance system. In Proceedings of the 19th International Conference on System Theory, Control and Computing (ICSTCC), Cheile Gradistei, Romania, 14–16 October 2015; pp. 753–758. [Google Scholar]
  17. Sumalan, A.L.; Popescu, D.; Ichim, L. Flooded Areas Detection Based on LBP from UAV Images. In Recent Advances on Systems, Signals, Control, Communications and Computers; WSEAS Press: Budapest, Hungary, 2015; pp. 186–191. [Google Scholar]
  18. Zhang, J.; Xiong, J.; Zhang, G.; Gu, F.; He, Y. Flooding disaster oriented USV & UAV system development & demonstration. In Proceedings of the OCEANS 2016, Shanghai, China, 10–13 April 2016. [Google Scholar]
  19. Srikudkao, B.; Khundate, T.; So-In, C.; Horkaew, P.; Phaudphut, C.; Rujirakul, K. Flood warning and management schemes with drone emulator using ultrasonic and image processing. In Recent Advances in Information and Communication Technology 2015; Springer: Cham, Switzerland, 2015; Volume 361, pp. 107–116. [Google Scholar]
  20. Lee, I.; Kang, J.; Seo, G. Applicability analysis of ultra-light UAV for flooding site survey in South Korea. Int. Soc. Photogramm. Remote Sens. 2013, 40, 185–189. [Google Scholar] [CrossRef]
  21. Feng, Q.; Liu, J.; Gong, J. Urban Flood Mapping Based on Unmanned Aerial Vehicle Remote Sensing and Random Forest Classifier—A Case of Yuyao, China. Water 2015, 7, 1437–1455. [Google Scholar] [CrossRef] [Green Version]
  22. Aerts, J.C.J.H.; Botzen, W.J.; Clarke, K.C.; Cutter, S.L.; Hall, J.W.; Merz, B.; Michel-Kerjan, E.; Mysiak, J.; Surminski, S.; Kunreuther, H. Integrating human behaviour dynamics into flood disaster risk assessment. Nat. Clim. Chang. 2018, 8, 193–199. [Google Scholar] [CrossRef] [Green Version]
  23. IPCC. Managing the Risks of Extreme Events and Disasters to Advance Climate Change Adaptation; Field, C.B., Barros, V., Stocker, T.F., Qin, D., Dokken, D.J., Ebi, K.L., Mastrandrea, M.D., Mach, K.J., Plattner, G.-K., Allen, S.K., et al., Eds.; Cambridge University Press: Cambridge, UK; New York, NY, USA, 2012. [Google Scholar]
  24. Local Statistics—Office for National Statistics. Available online: https://www.ons.gov.uk/help/localstatistics (accessed on 19 October 2017).
  25. Environment Agency. Estimating the Economic Costs of the 2015 to 2016 Winter Floods; Environment Agency: Bristol, UK, 2018.
  26. McCall, I.; Evans, C. Cockermouth. S. 19 Flood Investigation Report; Environment Agency, Cumbria County Council: Penrith, UK, 2016.
  27. Cumbria County Council. Flooding in Cumbria, December 2015. Impact Assessment; Cumbria County Council: London, UK, 2018.
  28. Open Government Licence. Available online: https://www.nationalarchives.gov.uk/doc/open-government-licence/version/3/ (accessed on 28 August 2018).
  29. Civil Aviation Authority. Unmanned Aircraft System Operations in UK Airspace—Guidance. CAP 393; Civil Aviation Authority: London, UK, 2003.
  30. Civil Aviation Authority. The Office of the General Counsel Air Navigation: The Order and Regulations. CAP 722; Civil Aviation Authority: London, UK, 2012.
  31. Penning-Rowsell, E.; Priest, S.; Parker, D.; Morris, J.; Tunstall, S.; Viavattene, C.; Chatterton, J.; Owen, D. MCM-Online | The Handbook; Routledge: Abingdon, UK, 2016. [Google Scholar]
  32. Penning-Rowsell, E.; Priest, S.; Parker, D.; Morris, J.; Tunstall, S.; Viavattene, C.; Chatterton, J.; Owen, D. MCM-Online | The Manual; Routledge: Abingdon, UK, 2013. [Google Scholar]
  33. Amadio, M.; Mysiak, J.; Carrera, L.; Koks, E. Improving flood damage assessment models in Italy. Nat. Hazards 2016, 82, 2075–2088. [Google Scholar] [CrossRef] [Green Version]
  34. Luino, F.; Cirio, C.G.; Biddoccu, M.; Agangi, A.; Giulietto, W.; Godone, F.; Nigrelli, G. Application of a model to the evaluation of flood damage. Geoinformatica 2009, 13, 339–353. [Google Scholar] [CrossRef]
  35. Luino, F.; Chiarle, M.; Nigrelli, G.; Agangi, A.; Biddoccu, M.; Cirio, C.G.; Giulietto, W. A model for estimating flood damage in Italy: Preliminary results. In Environmental Economics and Investment Assessment; WIT Transactions on Ecology and the Environment; WIT Press: Southampton, UK, 2006; Volume 98, pp. 65–74. [Google Scholar]
  36. Merz, B.; Kreibich, H.; Thieken, R. Assessment of economic flood damage. Nat. Hazards Earth Syst. Sci. 2010, 10, 1697–1724. [Google Scholar] [CrossRef]
  37. ANSI/IICRC S500 Water Damage Restoration—IICRC. Available online: http://www.iicrc.org/standards/iicrc-s500/ (accessed on 19 October 2017).
  38. Information Commisioner’s Office. Guide to the General Data Protection Regulation (GDPR); Information Commisioner’s Office: Wilmslow, UK, 2018.
  39. Lamond, J.; Rose, C.; Bhattacharya-Mis, N.; Joseph, R.; Balmforth, D.; Fciwem, F.; Mores, A.; Cwem, F.; Csci, C.; Garvin, S.; et al. Evidence Review for Property Flood Resilience Phase 2 Report; Flood Re: London, UK, 2018. [Google Scholar]
  40. Jarman, M.; Vessey, J.; Febvre, P. UAVs for UK Agriculture. White Paper; Satellite Applications Catapult: Didcot, UK, 2016. [Google Scholar]
Figure 1. Diagram showing the location of the case study area (Cockermouth) in UK. GCP stands for ground control point. Elevation values are in meters above sea level. Contains public sector information licensed under the Open Government Licence v3.0 [28].
Remotesensing 10 01548 g001
Figure 2. Workflow describing the key steps followed from data collection to loss adjustment estimates.
Remotesensing 10 01548 g002
Figure 3. Number of residential properties in Cockermouth affected by flooding after Desmond (5–6 December 2015) based on (a) the classic loss adjustment approach that relies on the Environment Agency fluvial flood extent and (b) the UAV loss adjustment approach.
Remotesensing 10 01548 g003
Figure 4. Estimated direct tangible losses (£) across Cockermouth following Desmond (5–6 December 2015) based on (a) the classic loss adjustment approach that relies on the Environment Agency fluvial flood extent and (b) the UAV loss adjustment approach. The methodology used for the estimation of the direct tangible losses was based on [31,32]. The losses (without VAT or other indirect taxes) are in GBP at 2016/17 prices. Calculations assume no resilient/resistance measures were in place.
Remotesensing 10 01548 g004
Figure 5. Estimated direct tangible losses (£) across Cockermouth following Desmond (5–6 December 2015) based on (a) the classic loss adjustment approach that relies on the Environment Agency fluvial flood extent and (b) the UAV loss adjustment approach. The methodology used for the estimation of the direct tangible losses was based on [31,32]. The losses (without VAT or other indirect taxes) are in GBP at 2016/17 prices. Calculations assume resilient/resistance measures were in place.
Remotesensing 10 01548 g005
Figure 6. Differences between the classic and the UAV loss adjustment approaches in the number of residential properties in Cockermouth affected by flooding after Desmond (5–6 December 2015). Negative values indicate a larger number of properties identified as affected by the UAV approach.
Remotesensing 10 01548 g006
Figure 7. Difference in direct tangible losses (£) when considering damage to property for affected households with and without resistance measures in place after Desmond floods (5–6 December 2015) for Cockermouth (Cumbria, UK) based on (a) the classic loss adjustment approach that relies on the Environment Agency fluvial flood extent and (b) the UAV loss adjustment approach. The methodology used for the estimation of the direct tangible losses was based on [31,32]. The losses (without VAT or other indirect taxes) are in GBP at 2016/17 prices.
Remotesensing 10 01548 g007
Figure 8. Difference between the UAV and the classic loss adjustment approaches in direct tangible losses (£) when considering damage to property for affected households after the Desmond floods (5–6 December 2015) for Cockermouth (Cumbria, UK) (a) with no resistance measures in place and (b) with resistance measures being operational. The methodology used for the estimation of the direct tangible losses was based on [31,32]. The losses (without VAT or other indirect taxes) are in GBP at 2016/17 prices. Negative values indicate larger losses associated with the UAV approach.
Remotesensing 10 01548 g008
Table 1. Flood impact features identified in the high-resolution aerial imagery collected with the Sirius-Pro (Topcon Positioning System Inc., Livermore, CA, USA) unmanned aerial vehicle (UAV) in Cockermouth, Cumbria, UK (13 December 2015) after the Desmond storm. A total of 8539 impact points were identified. N stands for the number of times a specific feature was observed.
FeatureDescriptionN
Bin bagLarge bin bags placed at the door step of affected households and containing water-damaged items resulting from the flood event.33
Natural debrisSediment deposits, trees, branches, and other organic matter deposited across the affected area as a result of (i) water levels receding after the flood event or (ii) anthropogenic barriers (e.g., garden fences, and lamp posts) trapping material during the event.1095
Exposed mainsPipes exposed due to flood erosion and scour.16
ScourDiscrete areas of erosion resulting from the energy of fast flowing water.2137
SkipSkips distributed across the affected area to dispose of water-damaged items (mainly indoor and outdoor household furniture).27
Water-damaged goods and other itemsMultiple types of goods and other items damaged by the flood waters including fences, garden furniture, cars, and fallen walls.4949
WaterDiscrete pools of water remaining across the affected area in fields, roads, and playing grounds.277
Bridge accessImpact identified along a bridge including barriers to access and structural damage.1
DehumidifierLarge (industrial) and small scale dehumidifiers distributed across the affected area to help dry out the buildings.4
Table 2. Image co-registration model errors obtained for the GCPs used in the collection and processing of the imagery collected over Cockermouth, Cumbria, UK (13 December 2015), after Desmond (5–6 December 2015). RMSE stands for root mean squared error. All values were automatically derived from Photoscan Agisoft Pro version 1.1.6 (Agisoft LLC, St. Petersburg, Russia). GSD stands for ground sampling distance.
ParameterValue
Total GCP error in X (m)0.038
Total GCP error in Y (m)0.121
Total GCP error in Z (m)0.120
Coverage (km2)1.42
GSD (m pixel−1)0.026
Flying altitude (m)112
Table 3. Number of households with and without resistance measures identified as flooded in Cockermouth, Cumbria, UK, after Desmond (5–6 December 2015) based on the classic loss adjustment approach that relies on the Environment Agency fluvial flood extent and the unmanned aerial vehicle (UAV) loss adjustment approach. A total of 372 (classic) and 419 (UAV) residential properties were identified as flooded. The number of flats refers to those on the ground floor potentially affected by flooding.
Property Type
AgeResistanceBungalowSemi-DetachedDetachedFlatTerrace
Classic ApproachPre-1919Yes-5171385
No-1371520
1919–1944Yes-6-115
No-1-11
1945–1964Yes16-145
No---1-
1965–1974Yes-----
No-----
1975–1985Yes1----
No---10-
Post–1985Yes1479613
No938272
UAV ApproachPre-1919Yes-4612779
No-2071224
1919–1944Yes-5171
No-2411
1945–1964Yes135-13
No-2-14-
1965–1974Yes3161--
No1-241
1975–1985Yes1----
No-1---
Post–1985Yes131814614
No739182
Table 4. Direct tangible loses (£) for residential properties identified as flooded in Cockermouth after Desmond (5–6 December 2015) based on the two loss adjustment approaches considered. The losses (without VAT or other indirect taxes) are in GBP at 2016/17 prices. Calculations assume no resilient/resistance measures were in place. Values reported are in thousands of pounds.
Property Type
AgeBungalowSemi-DetachedDetachedFlatTerrace
Classic ApproachPre-1919-14727015012458
1919–1944-149-253168
1945–196415162-35548
1965–1974-----
1975–198541--201-
Post–1985879208629490348
UAV ApproachPre-1919-13916664552402
1919–1944-143-26166
1945–1964158415435531
1965–19741313066996-
1975–19854519--25
Post-1985767456774345353
Table 5. Direct tangible loses (£) for residential properties identified as flooded in Cockermouth after Desmond (5–6 December 2015) based on the two loss adjustment approaches considered. The losses (without VAT or other indirect taxes) are in GBP at 2016/17 prices. Calculations assume resilient/resistance measures were in place. Values reported are in thousands of pounds.
Property Type
AgeBungalowSemi-DetachedDetachedFlatTerrace
Classic ApproachPre-1919-9624073531447
1919–1944-83-253142
1945–1964-123-283-
1965–1974-----
1975–198541--200-
Post-19854957231914551
UAV ApproachPre-1919-8834084061578
1919–1944-984426166
1945–1964-425-283-
1965–197465115509625
1975–19854519---
Post-1985439223418-51

