Article

Evaluation and Intercomparison of High-Resolution Satellite Precipitation Estimates—GPM, TRMM, and CMORPH in the Tianshan Mountain Area

1
Shandong Provincial Key Laboratory of Water and Soil Conservation and Environmental Protection, College of Resources and Environment, Linyi University, Linyi 276000, China
2
State Key Laboratory of Desert and Oasis Ecology, Xinjiang Institute of Ecology and Geography, Chinese Academy of Sciences, Urumqi 830011, China
3
College of Life Science, Shihezi University, Shihezi 832000, China
4
Jiangsu Provincial Key Laboratory of Geographic Information Science and Technology, Nanjing University, Nanjing 210093, China
*
Author to whom correspondence should be addressed.
Remote Sens. 2018, 10(10), 1543; https://doi.org/10.3390/rs10101543
Submission received: 10 September 2018 / Revised: 22 September 2018 / Accepted: 22 September 2018 / Published: 25 September 2018
(This article belongs to the Special Issue Remote Sensing of Precipitation)

Abstract

:
With high resolution and wide coverage, satellite precipitation products like Global Precipitation Measurement (GPM) could support hydrological/ecological research in the Tianshan Mountains, where the spatial heterogeneity of precipitation is high, but where rain gauges are sparse and unevenly distributed. Based on observations from 46 stations from 2014–2015, we evaluated the accuracies of three satellite precipitation products: GPM, Tropical Rainfall Measurement Mission (TRMM) 3B42, and the Climate Prediction Center morphing technique (CMORPH), in the Tianshan Mountains. The satellite estimates significantly correlated with the observations. They showed a northwest–southeast precipitation gradient that reflected the effects of large-scale circulations and a characteristic seasonal precipitation gradient that matched the observed regional precipitation pattern. With the highest correlation (R = 0.51), the lowest error (RMSE = 0.85 mm/day), and the smallest bias (1.27%), GPM outperformed TRMM and CMORPH in estimating daily precipitation. It performed the best at both regional and sub-regional scales and in low and mid-elevations. GPM had relatively balanced performances across all seasons, while CMORPH had significant biases in summer (46.43%) and winter (−22.93%), and TRMM performed extremely poorly in spring (R = 0.31; RMSE = 1.15 mm/day; bias = −20.29%). GPM also performed the best in detecting precipitation events, especially light and moderate precipitation, possibly due to the newly added Ka-band and high-frequency microwave channels. It successfully detected 62.09% of the precipitation events that exceeded 0.5 mm/day. However, its ability to estimate severe rainfall has not been improved as expected. Like other satellite products, GPM had the highest RMSE and bias in summer, suggesting limitations in its way of representing small-scale precipitation systems and isolated deep convection. It also underestimated the precipitation in high-elevation regions by 16%, suggesting the difficulties of capturing the orographic enhancement of rainfall associated with cap clouds and feeder–seeder cloud interactions over ridges. These findings suggest that GPM may outperform its predecessors in the mid-/high-latitude dryland, but not the tropical mountainous areas. With the advantage of high resolution and improved accuracy, the GPM creates new opportunities for understanding the precipitation pattern across the complex terrains of the Tianshan Mountains, and it could improve hydrological/ecological research in the area.

Graphical Abstract

1. Introduction

Precipitation is a key meteorological variable and a major climate change indicator, directly affecting the energy and water exchanges between the biosphere and atmosphere. Traditional climate studies relied heavily on field observations [1], however, it is difficult to develop high-resolution spatial dataset of precipitation based on field observations [2]. Compared to air temperature, precipitation has more complex spatiotemporal patterns, which can only be accounted for with a dense network of rain gauge stations that are usually unavailable in a study area, particularly in the remote mountains in developing countries [3,4]. Such data issues have seriously hindered ecological and hydrological studies in the Tianshan Mountains area, which is known as “the water tower” of Central Asia [5], the largest dryland and one of the most climate sensitive ecosystems in the world [6]. The Tianshan Mountains are characterized by a large contrast in elevation, from 154 m below sea level to 7439 m above sea level (asl), which creates highly heterogeneous precipitation that varies from <100 mm/yr in the low mountain deserts to >900 mm/yr in the windward slopes of the high mountain ranges [7,8]. However, there is only a sparse and unevenly distributed network of meteorological stations across this complex geography [9]. Many of the stations stopped functioning with the collapse of the former Soviet Union in the early 1990s [10], and they further worsened the data availability [11]. As the result, widely used spatially interpolated precipitation datasets like the Climate Research Unit (CRU) are not reliable for hydrological/ecological research in both the Tianshan Mountains and the Central Asia dryland [9,12].
The development of satellite remotely sensed datasets has provided an opportunity to retrieve the spatiotemporal pattern of precipitation with high resolution in remote areas that have had few field observations [13]. These precipitation products are generated by combining thermal infrared reflection (IR), passive microwave (PM), and precipitation radar (PR) data from various satellite sensors. Over the four decades, multiple generations of satellite precipitation projects have been launched, e.g., the Precipitation Estimation from Remotely Sensed Information using Artificial Neural Network (PERSIANN) [14], the Naval Research Laboratory Global Blended-Statistical Precipitation Analysis (NRLgeo) [15], the Climate Prediction Center Morphing Technology (CMORPH) [16], the Tropical Rainfall Measurement Mission (TRMM) Multi-sensor Precipitation Analysis (TMPA) [17], and the Global Precipitation Measurement (GPM) project [18]. With a high spatial resolution of 0.25° and a long temporal period (1998–2015), the TMPA has been widely applied in ecological/hydrological researches [17,19,20]. With the highest spatial resolution of ~0.1° among the satellite precipitation datasets, the CMORPH and GPM products also have a huge potential for research in mountainous areas [16,18]. In particular, the Integrated Multi-Satellite Retrievals for GPM (IMERG) products have inherited the strengths of previous satellite precipitation projections. In addition, the GPM Core Observatory is equipped with a multi-channel GPM Microwave Imager (GMI), an expanded Ku/Ka-band at 13.6 GHz/35.5 GHz, and an upgraded dual-frequency precipitation radar (DPR). These on-board sensors are more sensitive to light rainfall and snowfall than their predecessors [18].
Satellite precipitation estimates, however, are subject to large uncertainties due to their indirect nature [21,22,23]. As uncertainties can emanate from various elements, including the retrieval algorithm, thermal radiance, and cloud noise in these satellite precipitation products, strict and comprehensive evaluations are necessary [21,24]. Launched in 2014, the GPM mission is still in the early stages of the development and evaluation cycle. Duan et al. [25] and Huffman et al. [26,27] provided preliminary comparisons between the IMERG and TMPA monthly precipitation products. Their studies showed the two products are similar over land. Liu (2016) [28] made further comparisons on a global scale and found that IMERG performed better over land with high precipitation. Studies in India also indicated a notable advantage of IMERG over TMPA in terms of heavy monsoon rainfall detection [29]. The improvement was attributed to the newly added DPR [30]. However, another study in tropical Asia showed that IMERG performed worse than TMPA in heavy rain detection, according to 75% of the gauge stations [31]. The evaluation study in the US mid-Atlantic region also indicated that IMERG tended to underestimate heavy rain with considerable random errors [32]. Albeit at low frequency, heavy precipitating events have a significant hydrological impact, leading to extreme floods and landslides in mountainous areas [25] and would be considerable affection on the global climate models [30]. Therefore, it is important to evaluate and improve the capacities of satellite instruments in detecting and estimating heavy rainfall.
After 2016, there were more studies evaluating the performances of IMERG in comparison with other satellite precipitation products in Xinjiang, China [33,34], where the major part of Tianshan is located, and in the Tibetan Plateau, a region adjacent to Tianshan [35,36,37]. Both Chen and Li (2016) [33] and Lu et al. (2018) [34] found that in comparison with TMPA, IMERG significantly improved the estimation accuracy of precipitation over the Xinjiang region. They attributed the improvement to the upgraded DPR and PM sensors, which were supposed to increase GPM’s sensitivity to light precipitation [33]. However, the study by Wei et al. (2018) [37] showed that IMERG performed worse than TRMM 3B42 in typical arid/semi-arid regions of China, indicating that its sensitivity to light precipitation might not have been as improved as expected. In addition, the precipitation in the Tianshan Mountains is highly influenced by topography and convective systems, and satellite precipitation products have been found to perform relatively poorly in regions with strong orographic effects and complex convective systems [33,38,39]. Although previous studies have confirmed the suitability of satellite precipitation products over complex mountain terrains in Asia [40,41], their performance in the Tianshan Mountains are still unclear. In general, previous studies have shown that the IMERG as well as other satellite-retrieved precipitation products have not been very reliable in the Xinjiang region [33]. A comprehensive evaluation of the performances of satellite precipitation products in the Tianshan Mountains could provide valuable feedback for developers to improve the related retrieval algorithm, and for data users to assess their usefulness in ecological/hydrological research in Central Asia.
In this study, the accuracies of the estimated precipitation in the Tianshan Mountains from three satellite products: IMERG, TRMM 3B42, and CMORPH were evaluated through comparisons with observations from 46 stations. The study period was set to April 2014–March 2015, which was the overlapping time period of the three satellite missions (see Section 2.2.1.). While this short time period limits the representativeness of the temporal pattern in weather, it is still possible to evaluate whether the satellite products can reflect the spatial pattern and seasonal variation of precipitation. This study aims to improve our understanding of the suitability and uncertainty of satellite precipitation products in the Tianshan Mountains, and evaluates whether the upgrades in GPM actually helped to enhance its capacity in capturing light precipitation and solid precipitation in the Tianshan Mountains of the Central Asia dryland.

2. Materials and Methods
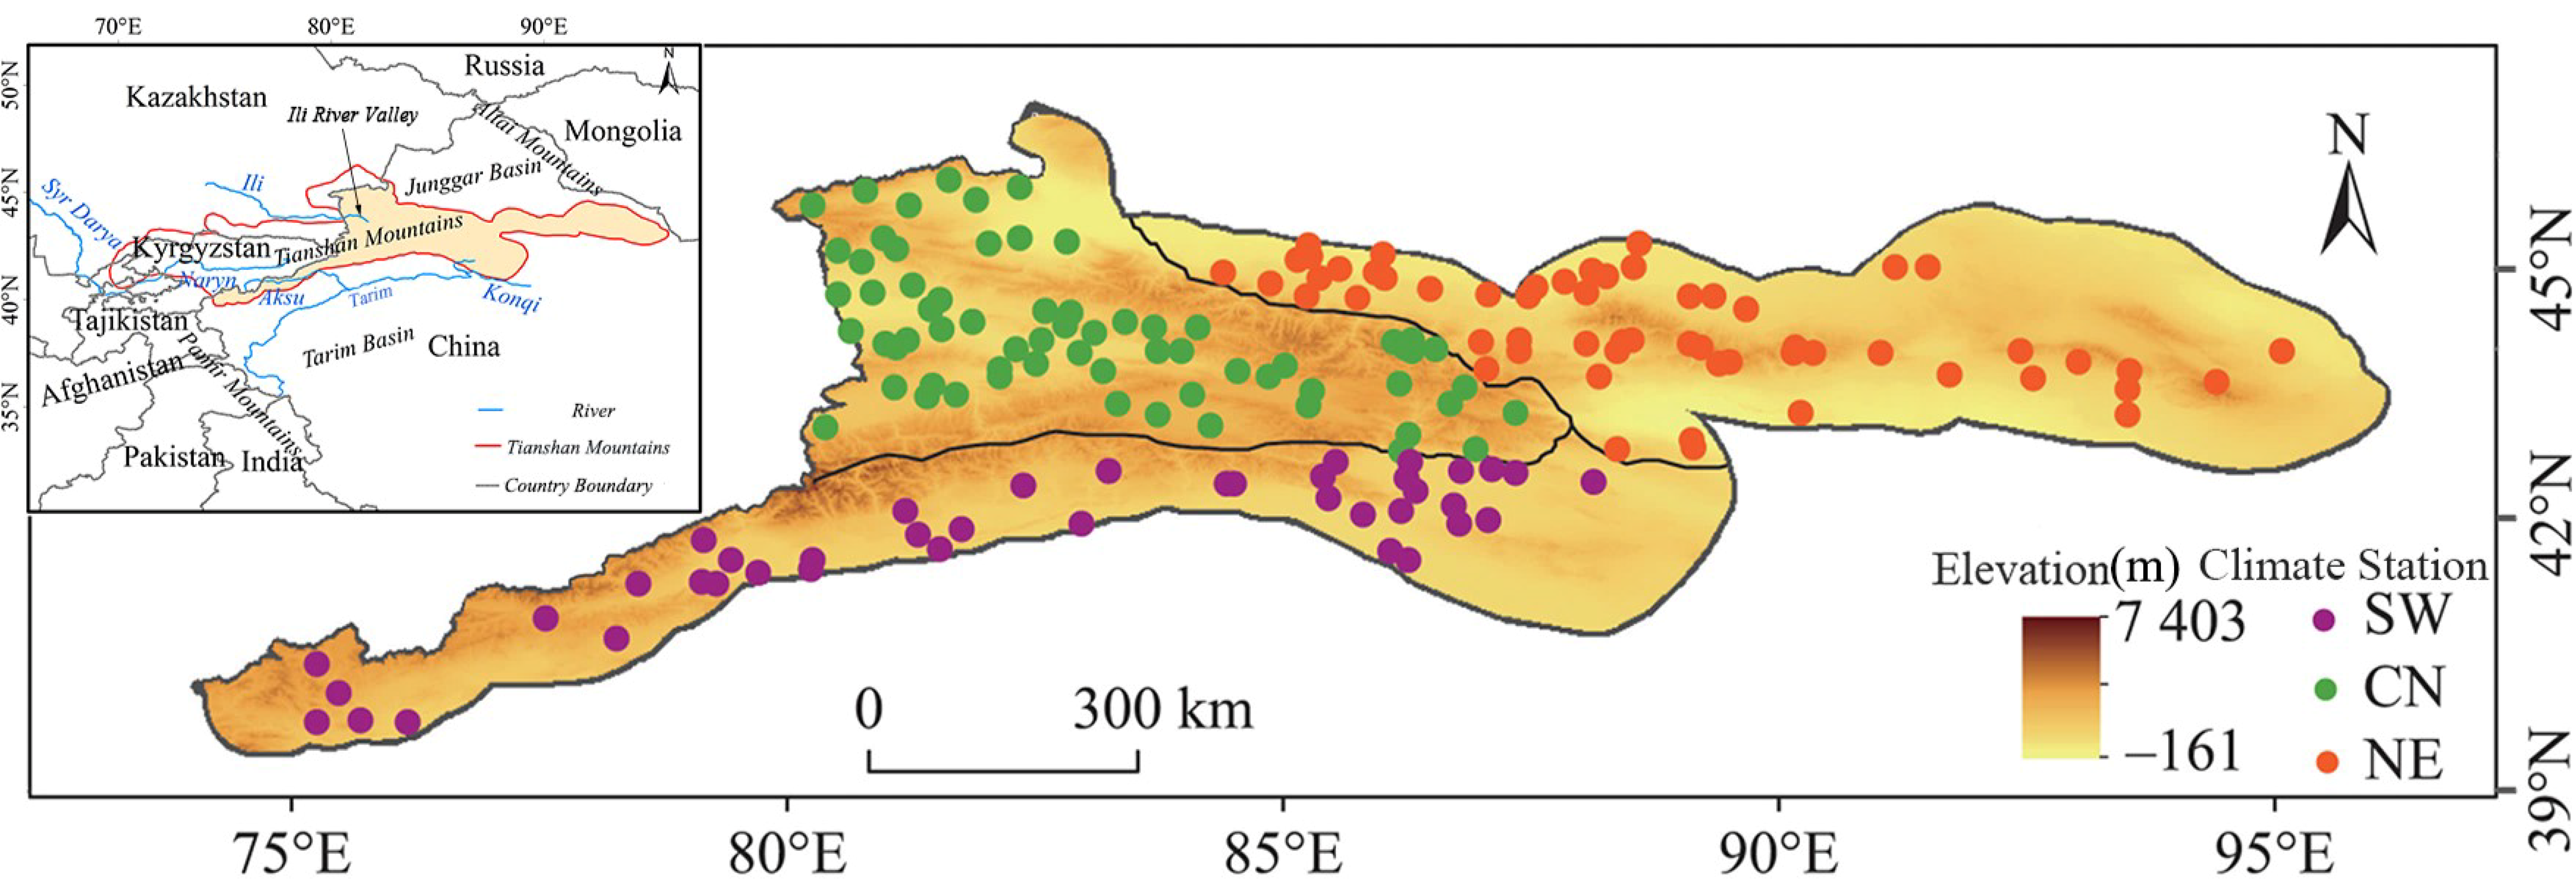
2.1. Study Region

Straddling the border between China and Kyrgyzstan, the Tianshan Mountains (39°30′–45°45′N, 74°10′–96°15′E) are the largest mountain system in Central Asia [42]. Due to the issue of rain-gauge data availability, only the part of the Tianshan Mountains that are located in China was investigated in this study (Figure 1). Stretching about 1700 km from west–southwest to east–northeast and with a central width of about 350 km, the study area (3.5 × 10⁵ km2) accounts for two thirds of the whole Tianshan Mountain area. The mountains have a rough terrain, with elevation ranging from −154 m to 7439 m. The tallest peaks in the Tianshan area are a central cluster of mountains forming a knot, from which ridges extend along the boundaries between China, Kyrgyzstan, and Kazakhstan.
Sitting in the center of Central Asia, the Tianshan Mountains are the source of major rivers and lakes in the dryland including the Tarim River, the Syr Darya, and the Ili River (Figure 1). The region’s atmospheric circulation is controlled by moist westerly Atlantic air masses and cold northerly/northwesterly inflows. The seasonal pattern of precipitation is controlled by the seasonal dynamic of the northern jet stream and the southwesterly cyclones from the Arabian Sea, which results in strong precipitation in spring [10]. Topography also plays a vital role in the formation of distinct local climates that vary from <100 mm/yr in the low-mountain deserts in the eastern Tianshan Mountains to >900 mm/yr in the windward slopes of high ranges in the western Tianshan Mountains. Following the climate gradient, the mountain vegetation/land cover changes from low-mountain deserts/dry grasslands, to mid-mountain forests, to alpine meadow/dwarf shrubs, before rising into glaciers in higher elevations.
Based on the monthly mean precipitation data from 163 ground stations, the study area was further divided into sub-regions with similar climates using the K-nearest neighbor (KNN) method [43]. To find the optimal spatial constraint parameters, we tried a series of K values ranging between 2 and 10. The number of clusters was automatically decided by the clustering analysis tool. This was done in the analysis by finding the most effective number of clusters. The effectiveness was quantified by the Calinski–Harabasz pseudo F-statistic that reflects the similarity and difference between the group, and a larger F means a better clustering result:
F = R 2 n C 1 1 R 2 n n c
where R 2 = B G D W G S B G D ; WGS is a reflection of within-cluster similarity, and BGD reflects the between-cluster difference:
BGD = i = 1 n c j = 1 n i k = 1 n v ( v i j k v j k ) 2
WGS = i = 1 n c j = 1 n i k = 1 n v ( v i j k v i k ) 2
In the above equations,
n = the number of the objects to be regionalized.
n i = the number of the objects in cluster i.
n c = the number of the cluster.
n v = the number of the variables used to cluster objects.
v i j k   = the value of the kth variable of the jth object in the ith cluster.
v i k = the mean value of the kth variable.
v j k = the mean value of the kth variable in cluster i.
The highest coefficient of determination R2 = 0.79 and the largest F = 81.18 were reached when K = 8 and the category is set to 3. Therefore, a value of K = 8 was used for the spatial constraint condition of KNN, and the clustering analysis yielded three climate sub-regions in the Tianshan Mountain area, each of which was coherent in precipitation variation and seasonal circulation pattern: the southern and western Tianshan Mountains (SW TS) that are bounded to the south by the Tarim Basin and links up with the Pamir Mountains in the southwest; the northern and eastern Tianshan Mountains (NE TS), which are bounded to the north by the Junggar Basin and meets the Altai Mountains in the east, and the central Tianshan Mountains (CN TS) that includes the Ili River Valley and the central mountain clusters [41] (Figure 1). The sub-regions identified in this study agreed well with the three main climatic sub-regions identified by Sorg et al. (2012) [44]: (1) a moist sub-region bounded by the outer ranges of Tianshan from the northwest and the inner ranges of Tianshan from the southwest, corresponding to CN TS, (2) the inner ranges of Tianshan and its arid southern slope, corresponding to SW TS, and (3) the eastern ranges of Tianshan that accounted for >70% of the NE TS area in this study.

2.2. Data

2.2.1. Satellite Precipitation Products

The satellite precipitation products used in this study include the GPM IMERG, TRMM 3B42, and CMORPH (Table 1). CMORPH was developed by the National Oceanic and Atmospheric Administration Climate Prediction Center (NOAA-CPC). It estimates precipitation from low orbiter satellite passive microwave observations, compensated by high-resolution IR imagery [16]. The dataset had 30-min temporal and 0.07° spatial resolutions. Despite its high resolutions, the CMORPH may not perform as well as the TRMM precipitation product in Central Asia and the nearby Tibetan Plateau [45,46]. This study used the version 7 TRMM data (3B42V7), which had 3 h temporal and 0.25° spatial resolution. The TRMM product combined multiple satellite observations, including (the first) space-based precipitation radar, IR and PM sensor data, and precipitation observations from the Global Precipitation Climatology Centre (GPCC) [47]. The TRMM project was discontinued in April 2015, and it was succeeded by the GPM mission, an international constellation of satellites that consisted of a GPM core observatory satellite and 10 partner satellites. There were several major improvements, including a Ka-band (35.5 GHz) to the DPR and newly added high-frequency channels (165.6 and 183.3 GHz) to the GMI [30]. IMERG was the level-3 product of the GPM mission [26]. With 30-min temporal and 0.1° spatial resolutions, it inherited the strengths of previous satellite precipitation projections, including CMORPH, TRMM, and PERSIANN [27]. Considering that the level-3 GPM IMERG final-run products started in March 2014 while the TRMM was discontinued by April 2015, the study period was confined to the 12 months between April 2014 and March 2015.

2.2.2. Rain Gauge Data

Hourly and daily precipitation data were obtained from the Xinjiang Meteorological Network (XMN, [51], last visited on 15 August 2018), which is part of China’s National Meteorological Network [35,52]. The XMN included 1934 meteorological stations, the majority of which commenced after 2012. Only 163 of the 1934 stations fell within the study area and were used in this study. The monthly mean precipitation data from these stations were used to divide the study area into sub-regions (see Section 2.1). Among the 163 stations, 64 were distributed in CN TS, 58 in the NE TS, and 41 in the SW TS (Figure 1). This dataset underwent strict quality controls, including a spatial consistency check, an internal consistency check, and an extreme value check [53]. In particular, stations with 20% of missing observations in any 30-day period or with missing observations for more than five consecutive days were excluded. Otherwise, the missing values in the precipitation records were filled by linear interpolation. If an interpolated daily precipitation fell below the observed minimum daily precipitation within the nearest 90 days, it was assumed that there was no precipitation on that day and the daily precipitation was set to zero. Only the 46 stations that had daily precipitation records throughout the study period (i.e., April 2014–March 2015) were used in the evaluation study of the three satellite precipitation products. We found that less than 5% of the stations could be used in the GPCC [54] for adjustments of the TRMM/GPM products in the study area. In addition, both the TRMM- and GPM-integrated GPCC data at a monthly scale, while this study used daily data [27]. Therefore, the dependence between the gauge- and satellite-based data should not be a big issue. To our knowledge, this is the best observational dataset of precipitation in the Tianshan Mountain area.

2.3. Methodology

2.3.1. Spatial Downscaling Method

Mountain precipitation is under the influence of orographic effects, and it has high spatial variation. To warrant an accurate evaluation, it is necessary to downscale the grid-level satellite precipitation estimates to the site level at each gauge station [9]. The traditional bilinear interpolation or direct data extraction approach [55,56], however, ignores the orographic effect, and this could lead to unwanted effects from spreading convective precipitation during summer [57]. To avoid these problems, this study adopted the precipitation–topography partial least squares (PTPLS) downscaling method, which uses the partial least squares method to estimate local topographical influences on precipitation [9]. Motivated by previous studies, we used elevation, slope, and aspect ratio, as well as latitude and longitude to estimate the effects of orography and geography on precipitation in the Tianshan Mountains [58,59]. The following procedures were conducted to downscale the gridded satellite precipitation estimates to match the site-level observations from the gauge stations:
(1) For a gauge station (S), we identified the grid cell in which that station fell in the spatial dataset of a satellite precipitation product. This grid cell was noted as A, and the precipitation at station S and at the grid representing A were noted as PS and PA, respectively;
(2) We identified 25 adjacent grid cells centered around station S in the spatial dataset satellite of precipitation, and extracted their terrain and geographic information, i.e., elevation (X1), aspect ratio (X2), slope (X3), latitude (X4), and longitude (X5) from the digital elevation model of the study region (GTOPO30) [60].
(3) Based on the information, the local terrain effects on precipitation were estimated at site S. Let X be the matrix of five terrain and geographic factors at each of the 25 grid cells:
X = ( x 1 , 1 x 1 , 5 x 25 , 1 x 25 , 5 ) = ( X 1 X 5 ) .
where Xi (i = 1, 2, …, 5) are column vectors; and let P be the matrix of precipitation of these 25 grid cells:
P T = ( p 1 p 25 ) ,
where PT was the transpose of P. Both X and P were normalized. To estimate the effects of Xi on local precipitation, matrix W(1) was constructed as:
W ( 1 ) = 1 i = 1 5 C o v 2 ( P T , X ) ( C o v ( P T , X 1 ) C o v ( P T , X 5 ) ) ,
where Cov(PT,X) is the covariance of the time series PT and X. Applying W(1), we obtained the first order estimate of the terrain/geographic effects on local precipitation T(1) = X*W(1), and the precipitation was estimated by P = r1 T(1) + P(1), where r1 = P T ( 1 ) T ( 1 ) and P(1) was the residual vector of P.
Repeating this process by treating P(1) as P, we obtained the second order estimate of the local terrain/geographic effect, with P(1) = r2 T(2) + P(2) with r2 = P T ( 2 ) T ( 2 ) and P(2) being the residual vector of P(1). Repeating this process n times, we obtained the number of estimates {P(1), P(2), …, P(n)}, taking into account the portions of the terrain/geographic influences on local precipitation. Among the estimates, we used the least square method to obtain the precipitation for grid cell A, PA, from the most relevant P(i) (1 ≤ in).
PA was the downscaled satellite estimates of precipitation at station S. The value was then compared to the observations at station S.

2.3.2. Evaluation Metrics

The evaluations were conducted based on daily precipitation datasets, which were aggregated from the sub-daily data. Following Ma et al. (2016) [35], three quantitative statistical metrics were used to quantify the accuracy or discrepancy between the rain gauge observations (OBS) and satellite precipitation estimates: (1) the Pearson linear correlation coefficient (R) that measured the strength and direction of the linear association between OBS and satellite estimates; (2) the root-mean-square error (RMSE) that measured the averaged magnitude of the deviation that a satellite product will have from the OBS; and (3) the relative bias (PB) that measured any persistent bias in satellite estimates to either underestimate or overestimate OBS:
PB = i = 1 n ( P e P o ) i = 1 n P o × 100 %
R = C o v ( P e P o ) δ e δ o
RMSE = i = 1 n ( P e P o ) 2 n
where Po and Pe are the OBS and satellite estimated precipitations, respectively; n is the sample size; δ is standard deviation; and cov() is covariance. The significance of R at the 95% level is tested.
In addition, to better check the appearance possibility of rainfall events from satellite products, the false alarm ratio (FAR), probability of detection (POD), frequency bias index (FBI), and equitable threat score (ETS) were calculated [61]. An estimate has a high accuracy when POD, ETS, and FBI approach 1, and FAR approaches 0. POD measures the ability of the satellite product to correctly detect rainfall, where the best score is ‘1’ and the worst score is ‘0’. FBI of less (or greater) than 1 measures under (or over) forecast frequency. FAR measures how often a satellite product incorrectly reports rainfall events when no rain has occurred, and the score value can range from ‘0’ to ‘1’, where ‘1’ is the worst score and ‘0’ is the best score. ETS penalizes false alarms and misses equally, and it was designed to account for hits that would occur purely randomly. The parameter has a value of 0 for no skill and 1 for perfect correspondence. The detailed information of the evaluation indices can be found in Tian et al. (2009) [61] and Kenawy et al. (2015) [62].
F B I = H + F H + M
P O D = H H + M
F A R = F H + F
ETS = H H s H + M + F H s ;   where   H s = ( H + M ) ( H + F ) T o t a l
where M represents the observed precipitation events that are missed by the satellite products, while H is the correctly detected precipitation events, and F represents the precipitation events that are falsely reported by the satellite but not observed by the rain gauge. Hs indicates random hits. These parameters were calculated according to a precipitation threshold and a contingency table between the satellite estimates and OBS (Table 2). To measure the performances of the satellite estimates for different ranges of precipitation intensity, multiple evaluations were conducted with eight levels of threshold values: 0.5 mm/day, 1 mm/day, 2 mm/day, 4 mm/day, 8 mm/day, 10 mm/day, 15 mm/day, and 20 mm/day.

3. Results

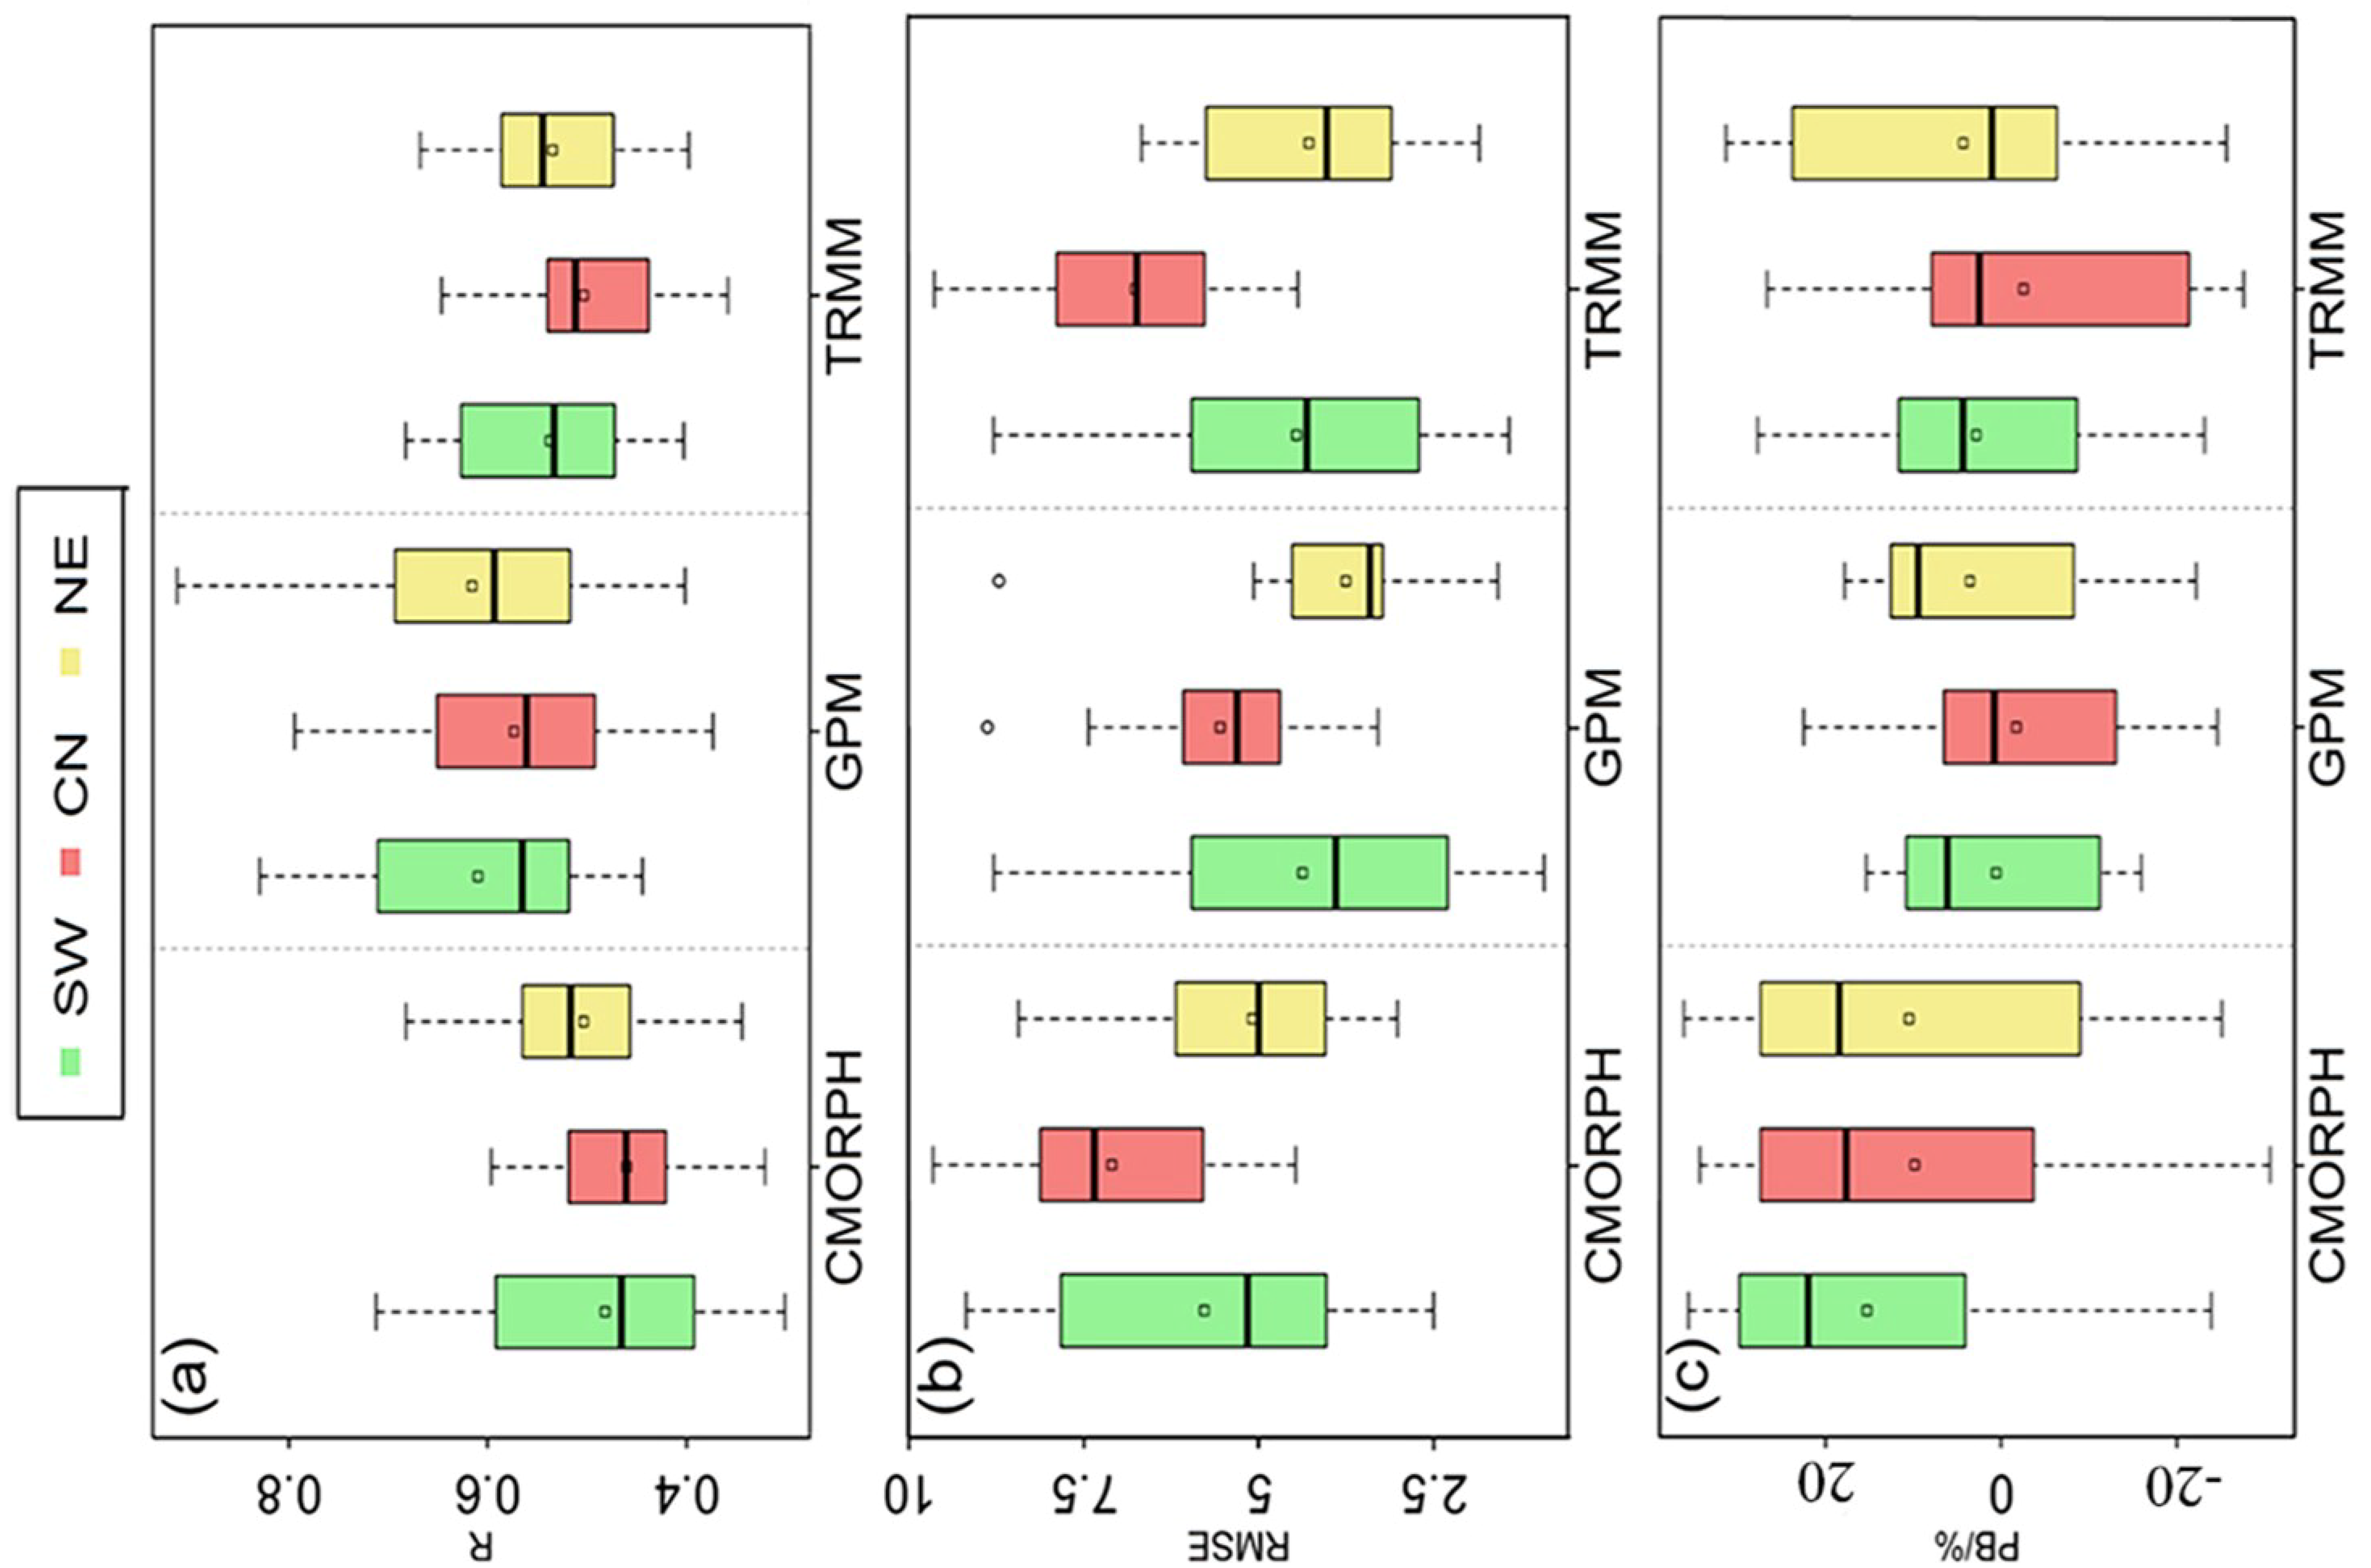
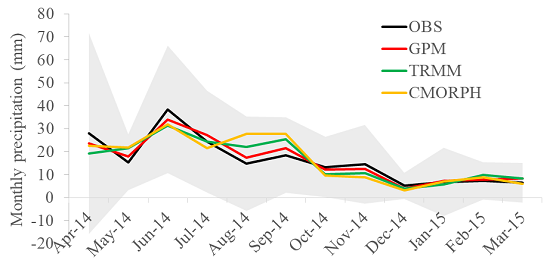
3.1. Accuracy in Describing Regional Precipitation

The observed precipitation ranged from 4.8 ± 5.7 mm in December to 31.3 ± 27.8 mm in June, with an annual total of 176.7 ± 113.6 mm during the study period. The highest sub-regional precipitation (297.9 ± 79.0 mm/yr) was observed in CN TS, while the lowest (129.6 ± 85.1 mm/yr) was found in SW TS. Our evaluations showed that the daily precipitation estimates from three satellite products were significantly correlated with the OBS (p < 0.05). The GPM product had the highest correlation of 0.53 ± 0.25, about 17% higher than the correlations of the other two satellite products (Figure 2a). The GPM also had the lowest RMSE (0.85 ± 0.54 mm/day) and the smallest bias (PB = 1.27 ± 30.41%) among the three satellite products, according to the observed precipitation, and the CMORPH data had the highest RMSE (1.15 ± 0.69 mm/day) and the highest bias (PB = 8.34 ± 42.21%) (Figure 2b,c). While the CMORPH overestimated precipitation, the TRMM underestimated precipitation by 5.00 ± 34.43% (Figure 2c). Overall, the GPM performed the best while the CMORPH performed the worst in estimating precipitation in the Tianshan Mountain area.
All satellite products correctly reflected the general pattern of the observed intra-annual variations in precipitation at the gauge stations during the study period, which peaked in June 2014 and gradually declined until reaching its lowest point in December 2014 (Figure 3). In particular, the GPM product closely followed the fluctuations of observed precipitation from month to month throughout the year, while the CMORPH product showed a false renunciation of precipitation in August and the TRMM product failed to show the decline of precipitation from April to May. Of the four seasons, the satellite estimates had the highest correlations with the OBS in autumn (SON), with the highest R value (0.63 ± 0.25) found in the GPM (Figure 2a). In the winter season (DJF), the satellite estimates had the lowest correlation with OBS, but also the smallest error (RMSE) (Figure 2a,b). Again, the GPM had the smallest RMSE (0.53 ± 0.31 mm/day) among the satellite products in winter (Figure 2b). The satellite estimates had relatively high RMSE in summer (JJA). Moreover, the CMORPH overestimated the summer precipitation significantly (PB = 46.43 ± 35.33%). In addition, the CMORPH significantly underestimated the winter precipitation (PB = −22.93 ± 21.20%). The TRMM also seriously underestimated the precipitation (PB = −20.29 ± 39.10%) in spring (MAM). In fact, the TRMM performed the poorest in spring of all of the satellite products, by all the quantitative metrics. Overall, the GPM performed better than the other two satellite products in describing seasonal precipitations, especially in the autumn. Although it overestimated summer precipitation by 12.17 ± 34.71% and underestimated winter precipitation by 11.82 ± 27.69%, the magnitudes of the biases were much lower than that of the CMORPH. Compared to the CMORPH estimates, which showed significant biases in summer and winter, and the TRMM, which performed extremely poorly in spring, the GPM had relatively balanced performances across all seasons. It should be noted that Figure 3 only reflects the average precipitation of the rain gauge stations and it does not represent the pattern of intra-annual variations of precipitation across the Tianshan Mountain area. Actually, the seasonality of precipitation varied among the sub-regions (as shown in the following section).

3.2. Accuracy in Describing Spatial Distribution of Precipitation

The satellite products correctly reflected the spatial pattern of the precipitation in the Tianshan Mountain area, where the precipitation decreased from the north to the south and from the west to the east (Figure 4). Although the overall pattern of precipitation was stable throughout the year, the precipitation gradient was stronger in spring and autumn than in the summer season. Our analysis showed a gradient in seasonality of precipitation across the study area, with precipitation peaking in late spring/early summer in the northwest (the CN TS and the northern slope of the Tianshan Mountains), and summer/early autumn in the southern (SW TS) and the eastern ranges of the Tianshan Mountains. Compared with the gauge observations, the satellite products tended to underestimate the spatial gradient in annual precipitation. The precipitation in northeastern Tianshan was overestimated, especially by the COMORPH product (Figure 4b,k,n), while the precipitation in the Ili River Valley was underestimated by the TRMM product (Figure 4a,d,m).
Among the three sub-regions, the satellite products performed relatively poorly in the CN TS, where the smallest R values and the largest RMSEs were found. The CMORPH tended to overestimate precipitation in the SW TS (Figure 5c), especially in the upper reaches of the Tarim River and Konqi River (Figure 1 and Figure 4b,h,k). The GPM IMERG performed better than the other two satellite products in all sub-regions by all quantitative metrics (Figure 5a–c). Among the three sub-regions, the GPM had the highest R value (0.62 ± 0.14) and lowest RMSE (3.77 ± 1.63 mm/day) in the NE TS; however, it overestimated the precipitation in the NE TS by 8.96 ± 32.67% and underestimated precipitation in the CN TS by −4.25 ± 37.95%.

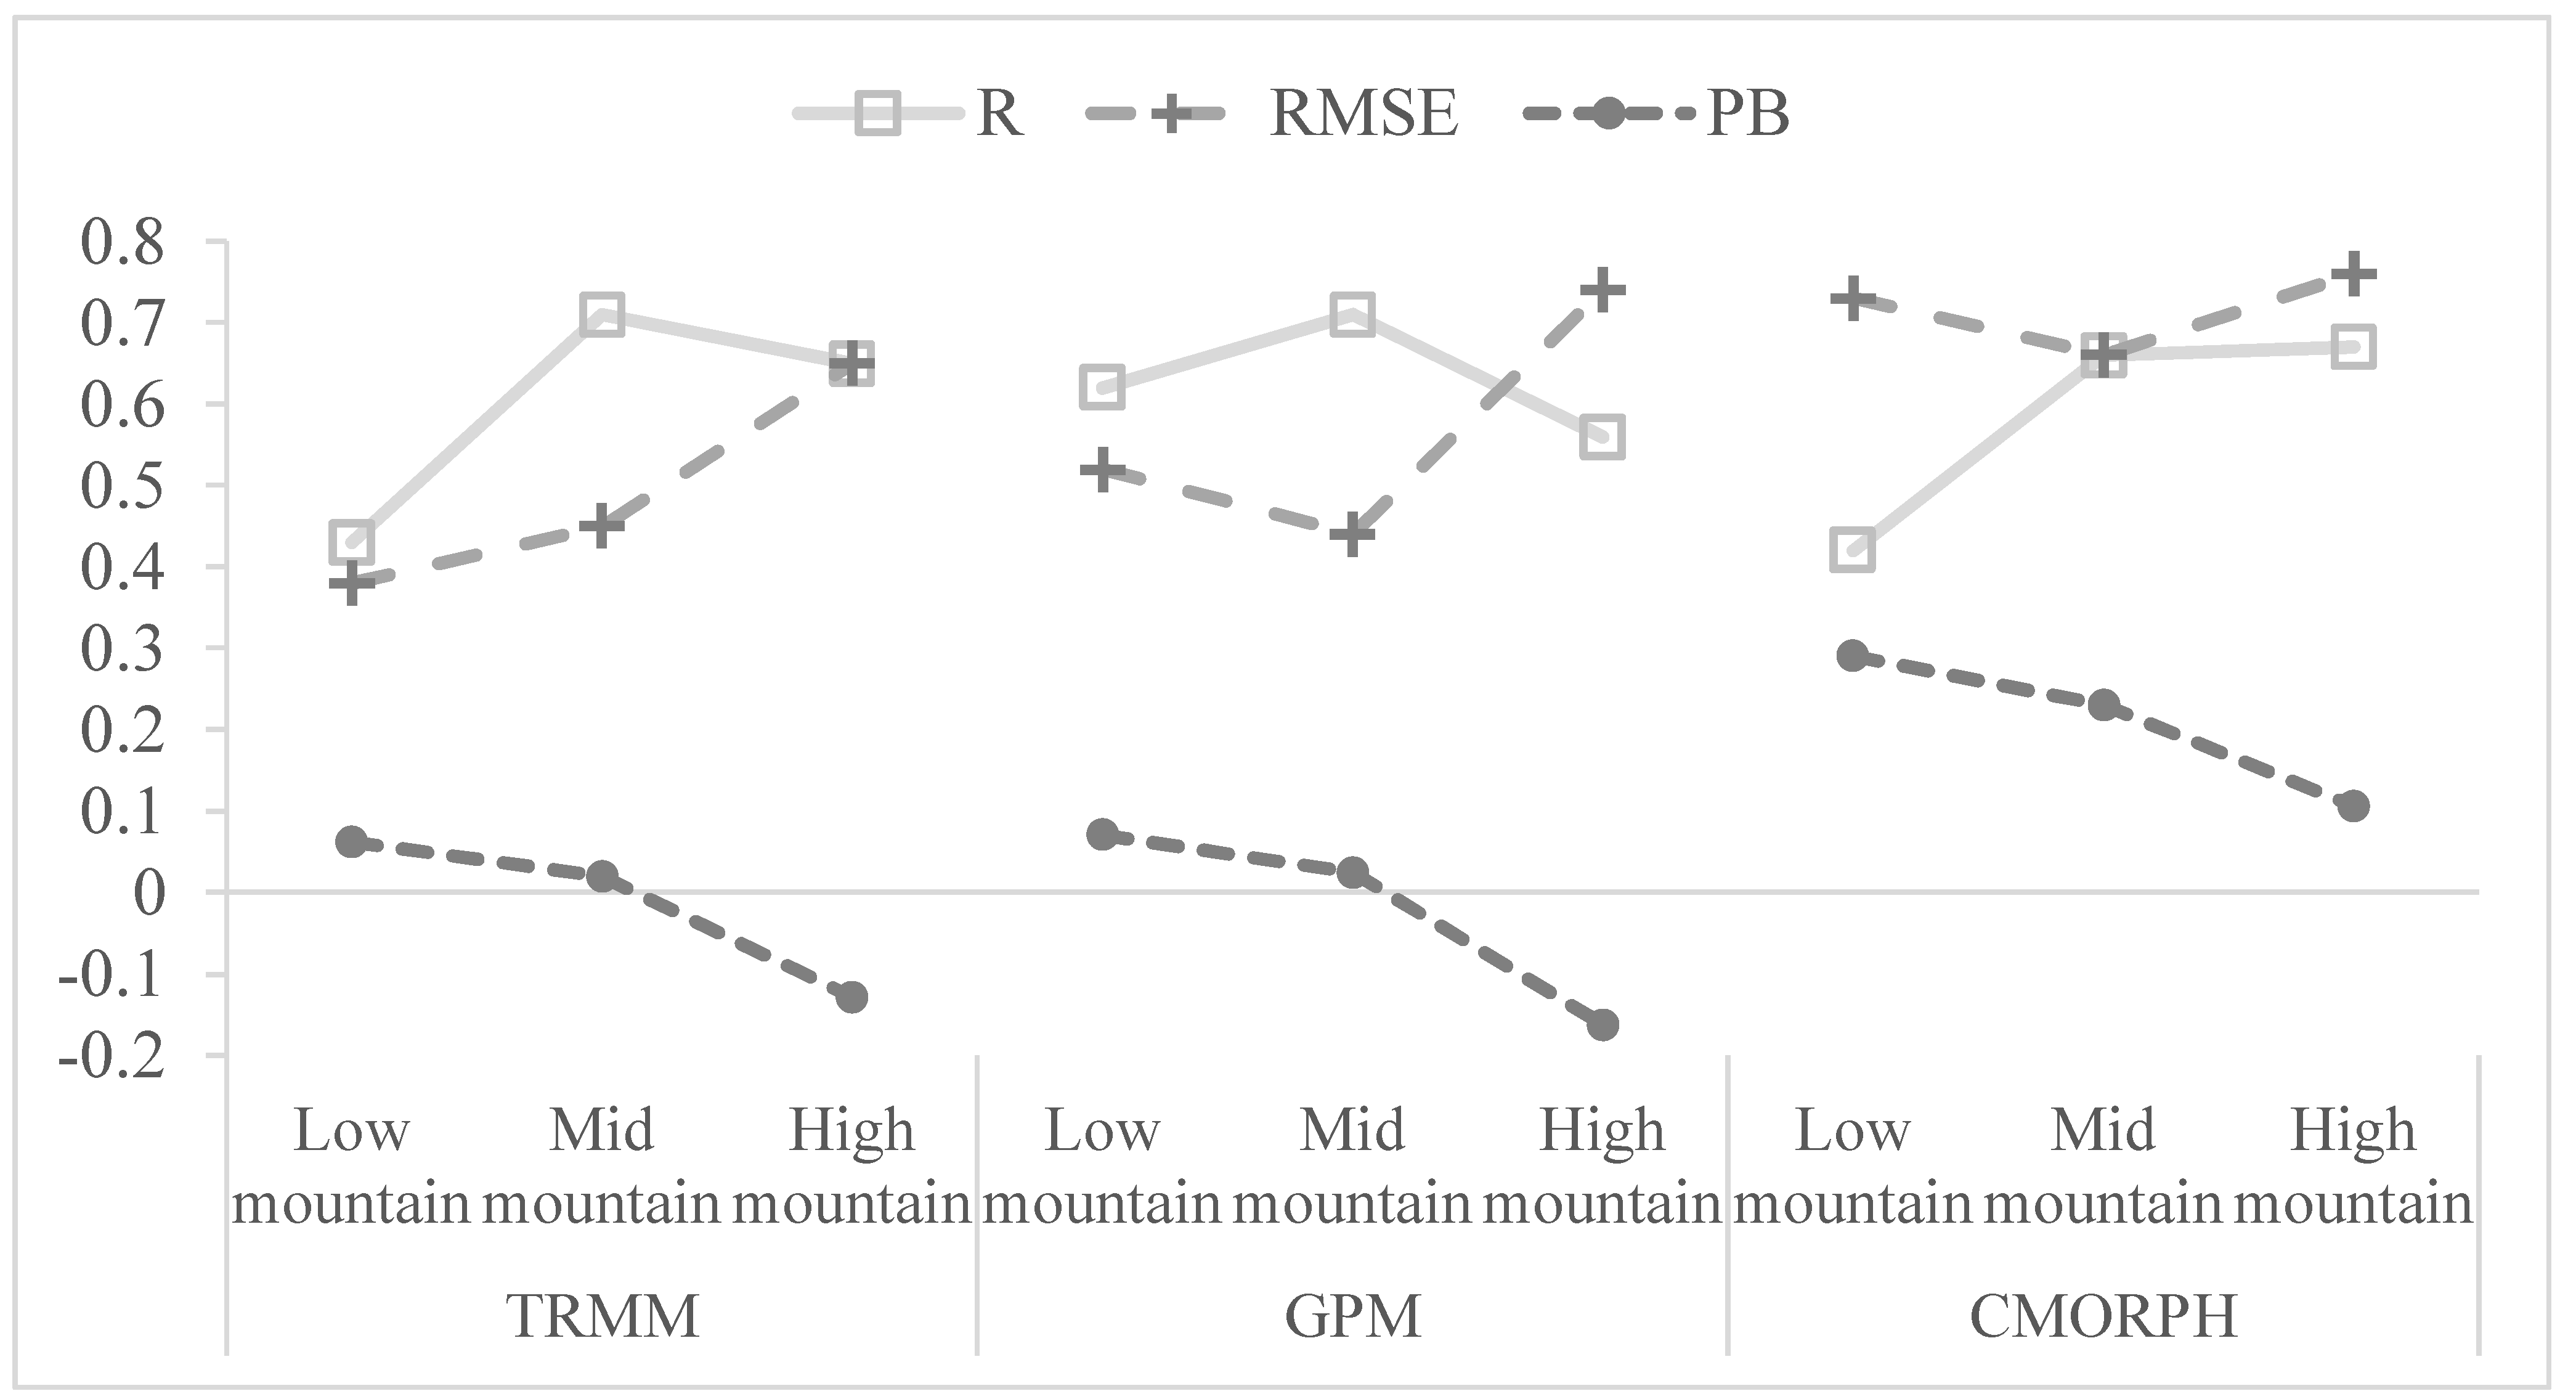
3.3. Elevation Impact Analyses

The elevation impacts were further analyzed by comparing the variations of the accuracies among the low-mountain (<1250 m asl.), mid-mountain (1250–2800 m asl.) and high-mountain (>2800 m asl.) ranges that were defined according to Jenks Natural Breaks [63]. All satellite products had the highest correlation with OBS in the mid-mountain areas, with the highest R value (≈0.71) found in the GPM (Figure 6). In addition, both the GPM and CMORPH had low RMSE in the mid-mountain areas, and both the GPM and TRMM had a small bias (PB ≈ 2%) in the mid-mountain areas. Although the GPM performed much better than the other two satellite products in the low-mountain areas, its correlation with the OBS in the high-mountain areas was relatively low. Notably, the CMORPH product consistently overestimated the precipitation, particularly in the low-mountain areas (PB = 29.05%). In comparison, the GPM and TRMM underestimated precipitation by 13–16% in the high-mountain areas.

3.4. Contingency Statistics

To measure the algorithm performance for different precipitation rates, it is useful to plot the categorical scores as a function of an increasing precipitation threshold, as shown in Figure 7. According to the scores of FAR, ETS, and FBI, the GPM performed better than the other two satellite products, especially for precipitation exceeding 1–10 mm/day (Figure 7a,b,d). It also had the best performance in detecting light precipitation. It successfully detected 62.09% of the precipitation events that exceeded 0.5 mm/day (Figure 7c). The performance of the TRMM was consistently poorer than the other two satellite products, according to the scores of ETS and POD, especially for precipitation exceeding 8–15 mm/day, indicating its relatively low skill in detecting precipitation, and its tendency to miss precipitation events. The CMORPH strongly overestimated the frequency of precipitation, except for extremely heavy rains (>20 mm/day) (Figure 7a). Its FBI was as high as 3.10 for precipitation exceeding 2 mm/day. According to the scores of ETS, POD, and FAR, the performances of the satellite estimates generally declined as the thresholds of precipitation events narrowed to heavier precipitations (Figure 7b–d). Notably, all satellite estimates had high false alarm ratios (FAR > 50%).
The GPM overestimated the frequency of light precipitation (FBI > 1.5 when thresholds ∈ {0.5, 1, 2}) and underestimated the frequency of heavy precipitation (FBI < 0.5 when thresholds ∈ {15, 20}). Nevertheless, it performed well in capturing light precipitation, achieving the maximum detection skill for precipitation exceeding 0.5–2 mm/day (the ETS ranged from 0.23 to 0.24) (Figure 7b), and the lowest false alarm ratios for precipitation exceeding 1 mm/day to 4 mm/day (Figure 7d).

4. Discussion

Previous studies have suggested that satellite precipitation products like the GPM IMERG and TRMM TEMPA are unreliable in the Xinjiang Province of China [33], particularly under the influence of complex terrain [35]. Our evaluations, however, showed that the daily precipitation estimates from the three satellite products were significantly correlated with the OBS (p < 0.05) in the Tianshan Mountains, Xinjiang, China. The spatial patterns of the satellite precipitation products also agreed well with the observed precipitation gradient, which decreased from the north to the south, and from the west to the east (Figure 4). This pattern reflects the fact that the Tianshan Mountains as well, as Central Asia receives its moisture primarily from the westerly flow of the atmosphere. The large-scale circulation and the mountain barrier effect create a distinct continentality gradient with decreasing precipitation rates from northwest to southeast [64]. The north–south precipitation gradient, however, was weakened in the summer (Figure 4j,k,l) when monsoonal circulations from the Pacific and Indian Oceans also brought in southerly moisture fluxes [44,65,66]. In fact, the Tianshan Mountains themselves play an important role in enhancing the East Asian summer monsoon [44,65]. In addition, model simulations suggested that the Tianshan Mountains could enhance the precipitation seasonality gradient across the Central Asia dryland by blocking western winter precipitation and increasing eastern summer precipitation [66]. As a result, in Central Asia’s western deserts (Kyzyl Kum and Kara-Kum), precipitation peaks in the winter and spring, while in the deserts to the east of the Tianshan Mountains (Taklimakan and Gobi Deserts), precipitation peaks in the summer [67]. This pattern was confirmed by our satellite precipitation datasets, which showed that precipitation peaked in late spring/early summer in the northwestern Tianshan Mountains and summer/early autumn in the southern and eastern Tianshan Mountains (Figure 4). Our analysis showed that the satellite precipitation products not only correctly reflected the effects of large-scale circulations on the spatial and seasonal patterns of precipitation in the study area, but could also provide additional evidence for the orographic effects of the Tianshan Mountains on the observed precipitation seasonality gradient across the Central Asia dryland.
According to our evaluation in the Tianshan Mountain area, the GPM IMERG outperformed the TRMM 3B42V7 and CMORPH products in estimating accumulated precipitation at all spatial scales and all elevation ranges, except for the alpine region. Although previous evaluations in China indicated that the GPM products might perform worse than the TRMM products in the winter season [68,69], our study showed that the IMERG outperformed the other two satellite products in all seasons and had more balanced seasonal performances. The GPM product also had the best performance in detecting precipitation in the Tianshan Mountains, particularly in capturing light and moderate precipitation (i.e., <15 mm/day). Similarly, studies in the adjacent Tibetan Plateau showed that the GPM IMERG had appreciably better correlations, lower errors, and smaller FAR than its predecessor the TRMM 3B42V7 [35,36]. Like our study, these studies also found an improved detecting ability for light rainfall events by GPM. This improvement is particularly helpful in retrieving precipitation in the low-mountain drylands of Central Asia. The improvements could be attributed to the GPM’s newly added Ka-band (35.5 GHz), which enhanced its ability to capture light precipitation [30].
It should be noted that the findings in this study do not indicate that the GPM products will outperform their predecessors in all mountainous areas. A study in a tropical mountainous watershed found no significant improvements from the IMERG in comparison with the TRMM 3B42V7 [31]. In fact, the GPM product performed worse than the TRMM 3B42V7 in heavy rain detection according to 75% of the gauge stations according to the study by Yuan et al. (2017) [31]. Although studies in India indicated a notable advantage of the IMERG over the TMPA in terms of heavy monsoon rainfall detection [70], our study did not find any obvious improvement in the GPM’s ability to detect severe rainfall in the Tianshan Mountains (Figure 7) [30]. Previous studies showed that the PR attenuation correction (i.e., surface reference technique and the Hitschfeld and Bordan method applied to correct for atmospheric attenuation) for the GPM tended to underestimate convective rain, particularly for heavy rain accumulations [25,71]. Such weakness limits the GPM’s usefulness in tropical mountainous areas as heavy precipitating events have significant hydrologic impacts on extreme floods and landslides in these regions. However, our study and several other studies [33,40,41] indicated that the GPM could significantly improve the estimation accuracy of precipitation over the mountainous areas in high- and mid-latitude regions, possibly because the high-frequency channels (165.6 and 183.3 GHz) added to the GMI improved the GPM’s ability to detect solid precipitation and gave it the capability to provide the probability of the liquid phase for all grid boxes in the IMERG data.
The GPM, like the TRMM, underestimated precipitation by 13–16% at high-elevation regions in the Tianshan Mountains (Figure 2 and Figure 6). Recent studies in the adjacent Tibetan Plateau also found that the GPM and TRMM underestimated precipitation at high-elevation regions [35,36]. Studies in the Great Smoky Mountains, USA indicated that the precipitation radar in the TRMM and GPM tended to underestimate low level orographic enhancement of rainfall associated with fog, cap clouds, and cloud to cloud feeder–seeder interactions over ridges [25]. Previous studies indicated that mountain precipitation associated with small-scale systems and isolated deep convection tended to be underestimated by the GPM and TRMM, which could be attributed to non-uniform beam-filling effects, due to the spatial averaging of reflectivity at their PR resolution [25,72]. In addition, the passive microwave algorithms depend primarily on scattering by ice, but the orographic rains might not produce much ice aloft, thus resulting in the underestimation of precipitation at high altitudes [73]. These uncertainties in satellite products and a shortage of high-elevation gauge stations limit our ability to assess the spatiotemporal pattern of precipitation in the alpine Tianshan Mountains, where prominent climate change is threatening the sustainability of the major glaciers in Central Asia [44,74].
Despite the uncertainties, satellite precipitation estimates are very valuable for Tianshan Mountain studies, where meteorological stations are sparse and mainly distributed in the low mountain dryland, causing biased estimation of precipitation by spatial interpolation of rain gauge data [11,13]. For example, the widely used CRU data underestimated the precipitation of Tianshan Mountain by about 34% [75]. For this reason, ecological and hydrological studies in Central Asia, including Tianshan Mountains, had to rely on climate reanalysis products (CRP; e.g., the NCEP-CFSR data [76]) as precipitation inputs [77]. Our study showed that the GPM product not only has much higher spatial resolution (5 km vs. >40 km in CRP) but also higher accuracy in estimating mountain precipitation in Central Asia than the CRP data (e.g., RGPM = 0.65 vs. RCRP ≤ 0.42; RMSEGPM = 0.85 mm/day vs. RMSECRP ≥ 1.03 mm/day; PBGPM = 1.27% vs. PBCRP ≥ 36%, where GPM and CRP denote the GPM and climate reanalysis products respectively) [9]. It is noteworthy that the GPM product performed especially well in the mid-mountain area (Figure 6), where the highest ecosystem biomass/productivity in Central Asia were found [77]. In addition, the major rivers/lakes in the Central Asia dryland mainly relied on the water yields from the mid-mountain area of Tianshan [42]. Therefore, the ecological and hydrological studies in the Tianshan Mountain and Central Asia areas can be significantly benefit by using the new generation of satellite precipitation products—the GPM IMERG.

5. Conclusions

Estimates by the satellite precipitation products significantly correlated with gauge observations. They showed a northwest–southeast precipitation gradient that reflected the effects of large-scale circulations and showed characteristic seasonal precipitation patterns among different sub-regions that matched the observed precipitation seasonality gradient in the study region. Among the high-resolution satellite products evaluated in this study, the GPM IMERG outperformed the TRMM and CMORPH in estimating the accumulated precipitation at all temporal (daily and seasonal) and spatial (regional and sub-regional) scales, and in low and mid-elevation regions. The GPM had relatively balanced performances across all seasons, while the CMORPH had significant biases in summer and winter, and the TRMM performed extremely poorly in spring. In addition, the GPM had the best performance in detecting precipitation events, especially for light and moderate precipitation, possibly due to the newly added Ka-band and high-frequency microwave channels. However, the dual-frequency precipitation radar did not significantly improve the GPM’s ability to estimate severe rainfall, as expected. The satellite product had the highest RMSE and bias in summer when small-scale convective rain was common in Tianshan Mountains. These findings suggest that GPM may outperform its predecessors in the mid- or high-latitude dryland areas, but not in the tropical mountainous areas. While this short time period in this study limits the representativeness of the temporal pattern in weather, previous studies with longer time periods generally support these findings.
The improved accuracy in satellite precipitation data creates new opportunities for understanding the spatial variation of precipitation across complex terrains, and it provides alternatives for estimating rainfall in areas where field observations are inadequate or unreliable. The GPM IMERG has relatively high accuracy and shows more spatially detailed information when compared with its predecessors, which will extend the application of satellite precipitation data from a global or national scale to a regional scale, especially in the mountainous areas in mid or high-latitudes. Previous evaluation studies based on hourly data suggested that the GPM IMERG showed appreciably better correlations and lower errors than the TRMM 3B42V7 for all assessment indicators [35]. Moreover, the higher temporal resolution (30 min) of the GPM IMERG in comparison with the TRMM products (3 h) can help to eliminate the anomalous values in the TRMM-estimated precipitation and could improve the accuracy of hydrological modeling [33].

Author Contributions

Conceptualization, C.Z. and X.C.; Data curation, C.C. and Q.D.; Formal analysis, C.Z. and H.D.; Funding acquisition, C.Z. and X.C.; Investigation, C.Z. and T.L.; Methodology, H.S. and T.L.; Resources, S.C. and Q.D.; Software, S.C. and C.C.; Supervision, C.Z.; Validation, H.S. and H.D.; Visualization, H.D.; Writing—original draft, C.Z. and H.D.; Writing—review & editing, C.Z. and H.D.

Funding

This project was funded by the Strategic Priority Research Program of Chinese Academy of Sciences, Grant No. XDA2006030201 and Chi Zhang is supported by the Taishan Scholars Program of Shandong, China, Grant No. ts201712071.

Conflicts of Interest

The authors declare no conflict of interest. The funders had no role in the design of the study; in the collection, analyses, or interpretation of data; in the writing of the manuscript, and in the decision to publish the results.

References

  1. Wheater, H.S.; Isham, V.S.; Cox, D.R.; Chandler, R.E.; Kakou, A.; Northrop, P.J.; Oh, L.; Onof, C.; Rodriguez-Iturbe, I. Spatial-temporal rainfall fields: Modelling and statistical aspects. Hydrol. Earth Syst. Sci. 2000, 4, 581–601. [Google Scholar] [CrossRef]
  2. Wilheit, T.T. Some comments on passive microwave measurement of rain. Bull. Am. Meteorol. Soc. 1986, 67, 1226–1232. [Google Scholar] [CrossRef]
  3. Boe, J.; Terray, L.; Cassou, C.; Najac, J. Uncertainties in european summer precipitation changes: Role of large scale circulation. Clim. Dyn. 2009, 33, 265–276. [Google Scholar] [CrossRef]
  4. Chung, C.T.; Power, S.B.; Arblaster, J.M.; Rashid, H.A.; Roff, G.L. Nonlinear precipitation response to el niño and global warming in the indo-pacific. Clim. Dyn. 2014, 42, 1837–1856. [Google Scholar] [CrossRef]
  5. Siegfried, T.; Bernauer, T.; Guiennet, R.; Sellars, S.; Robertson, A.W.; Mankin, J.; Bauer-Gottwein, P.; Yakovlev, A. Will climate change exacerbate water stress in Central Asia? Clim. Chang. 2012, 112, 881–899. [Google Scholar] [CrossRef]
  6. Seddon, A.W.R.; Macias-Fauria, M.; Long, P.R.; Benz, D.; Willis, K.J. Sensitivity of global terrestrial ecosystems to climate variability. Nature 2016, 531, 229–232. [Google Scholar] [CrossRef] [PubMed] [Green Version]
  7. Bohner, J. General climatic controls and topoclimatic variations in central and high Asia. Boreas 2006, 35, 279–295. [Google Scholar] [CrossRef]
  8. Domrös, M.; Peng, G. The Climate of China; Springer Science & Business Media: Berlin/Heidelberg, Germany, 2012. [Google Scholar]
  9. Hu, Z.Y.; Hu, Q.; Zhang, C.; Chen, X.; Li, Q.X. Evaluation of reanalysis, spatially interpolated and satellite remotely sensed precipitation data sets in Central Asia. J. Geophys. Res. Atmos. 2016, 121, 5648–5663. [Google Scholar] [CrossRef]
  10. Schiemann, R.; Luthi, D.; Vidale, P.L.; Schar, C. The precipitation climate of Central Asia—Intercomparison of observational and numerical data sources in a remote semiarid region. Int. J. Climatol. 2008, 28, 295–314. [Google Scholar] [CrossRef]
  11. Lioubimtseva, E.; Cole, R. Uncertainties of climate change in arid environments of Central Asia. Rev. Fish. Sci. 2006, 14, 29–49. [Google Scholar] [CrossRef]
  12. Mitchell, T.D.; Jones, P.D. An improved method of constructing a database of monthly climate observations and associated high-resolution grids. Int. J. Climatol. 2005, 25, 693–712. [Google Scholar] [CrossRef] [Green Version]
  13. Michaelides, S.; Levizzani, V.; Anagnostou, E.; Bauer, P.; Kasparis, T.; Lane, J. Precipitation: Measurement, remote sensing, climatology and modeling. Atmos. Res. 2009, 94, 512–533. [Google Scholar] [CrossRef]
  14. Hsu, K.-L.; Gao, X.; Sorooshian, S.; Gupta, H.V. Precipitation estimation from remotely sensed information using artificial neural networks. J. Appl. Meteorol. 1997, 36, 1176–1190. [Google Scholar] [CrossRef]
  15. Turk, F.J.; Miller, S.D. Toward improved characterization of remotely sensed precipitation regimes with modis/amsr-e blended data techniques. IEEE Trans. Geosci. Remote Sens. 2005, 43, 1059–1069. [Google Scholar] [CrossRef]
  16. Joyce, R.J.; Janowiak, J.E.; Arkin, P.A.; Xie, P.P. CMORPH: A method that produces global precipitation estimates from passive microwave and infrared data at high spatial and temporal resolution. J. Hydrometeorol. 2004, 5, 487–503. [Google Scholar] [CrossRef]
  17. Kummerow, C.; Barnes, W.; Kozu, T.; Shiue, J.; Simpson, J. The tropical rainfall measuring mission (TRMM) sensor package. J. Atmos. Ocean. Technol. 1998, 15, 809–817. [Google Scholar] [CrossRef]
  18. Hou, A.Y.; Kakar, R.K.; Neeck, S.; Azarbarzin, A.A.; Kummerow, C.D.; Kojima, M.; Oki, R.; Nakamura, K.; Iguchi, T. The global precipitation measurement mission. Bull. Am. Meteorol. Soc. 2014, 95, 701–722. [Google Scholar] [CrossRef]
  19. Su, F.G.; Gao, H.L.; Huffman, G.J.; Lettenmaier, D.P. Potential utility of the real-time TMPA-rt precipitation estimates in streamflow prediction. J. Hydrometeorol. 2011, 12, 444–455. [Google Scholar] [CrossRef]
  20. Xue, X.W.; Hong, Y.; Limaye, A.S.; Gourley, J.J.; Huffman, G.J.; Khan, S.I.; Dorji, C.; Chen, S. Statistical and hydrological evaluation of TRMM-based multi-satellite precipitation analysis over the wangchu basin of bhutan: Are the latest satellite precipitation products 3B42V7 ready for use in ungauged basins? J. Hydrol. 2013, 499, 91–99. [Google Scholar] [CrossRef]
  21. Yang, Y.F.; Luo, Y. Evaluating the performance of remote sensing precipitation products CMORPH, persiann, and TMPA, in the arid region of northwest China. Theor. Appl. Climatol. 2014, 118, 429–445. [Google Scholar] [CrossRef]
  22. Bellerby, T.J. Satellite rainfall uncertainty estimation using an artificial neural network. J. Hydrometeorol. 2007, 8, 1397–1412. [Google Scholar] [CrossRef]
  23. AghaKouchak, A.; Nasrollahi, N.; Habib, E. Accounting for uncertainties of the TRMM satellite estimates. Remote Sens. 2009, 1, 606–619. [Google Scholar] [CrossRef]
  24. Hossain, F.; Anagnostou, E.N.; Bagtzoglou, A.C. On latin hypercube sampling for efficient uncertainty estimation of satellite rainfall observations in flood prediction. Comput. Geosci. 2006, 32, 776–792. [Google Scholar] [CrossRef]
  25. Duan, Y.; Wilson, A.M.; Barros, A.P. Scoping a field experiment: Error diagnostics of TRMM precipitation radar estimates in complex terrain as a basis for iphex2014. Hydrol. Earth Syst. Sci. 2015, 19, 1501–1520. [Google Scholar] [CrossRef]
  26. Huffman, G.J.; Bolvin, D.T.; Nelkin, E.J. Integrated multi-satellite retrievals for GPM (IMERG) technical documentation. NASA/GSFC Code 2015, 612, 47. [Google Scholar]
  27. Huffman, G.J.; Bolvin, D.T.; Braithwaite, D.; Hsu, K.; Joyce, R.; Xie, P.; Yoo, S.-H. Nasa global precipitation measurement (GPM) integrated multi-satellite retrievals for GPM (IMERG). Algorithm Theor. Basis Doc. Version 2015, 4, 30. [Google Scholar]
  28. Liu, Z. Comparison of integrated multisatellite retrievals for GPM (IMERG) and TRMM multisatellite precipitation analysis (TMPA) monthly precipitation products: Initial results. J. Hydrometeorol. 2016, 17, 777–790. [Google Scholar] [CrossRef]
  29. Prakash, S.; Mitra, A.K.; AghaKouchak, A.; Liu, Z.; Norouzi, H.; Pai, D.S. A preliminary assessment of GPM-based multi-satellite precipitation estimates over a monsoon dominated region. J. Hydrol. 2018, 556, 865–876. [Google Scholar] [CrossRef]
  30. Liu, C.T.; Zipser, E.J. The global distribution of largest, deepest, and most intense precipitation systems. Geophys. Res. Lett. 2015, 42, 3591–3595. [Google Scholar] [CrossRef] [Green Version]
  31. Yuan, F.; Zhang, L.; Win, K.W.W.; Ren, L.; Zhao, C.; Zhu, Y.; Jiang, S.; Liu, Y. Assessment of GPM and TRMM multi-satellite precipitation products in streamflow simulations in a data-sparse mountainous watershed in myanmar. Remote Sens. 2017, 9, 302. [Google Scholar] [CrossRef]
  32. Tan, J.; Petersen, W.A.; Tokay, A. A novel approach to identify sources of errors in IMERG for GPM ground validation. J. Hydrometeorol. 2016, 17, 2477–2491. [Google Scholar] [CrossRef]
  33. Chen, F.R.; Li, X. Evaluation of IMERG and TRMM 3B43 monthly precipitation products over mainland China. Remote Sens. 2016, 8, 18. [Google Scholar] [CrossRef]
  34. Lu, X.; Wei, M.; Tang, G.; Zhang, Y. Evaluation and correction of the TRMM 3B43v7 and GPM 3IMERGM satellite precipitation products by use of ground-based data over Xinjiang, China. Environ. Earth Sci. 2018, 77, 209. [Google Scholar] [CrossRef]
  35. Ma, Y.Z.; Tang, G.Q.; Long, D.; Yong, B.; Zhong, L.Z.; Wan, W.; Hong, Y. Similarity and error intercomparison of the GPM and its predecessor-TRMM multisatellite precipitation analysis using the best available hourly gauge network over the Tibetan Plateau. Remote Sens. 2016, 8, 17. [Google Scholar] [CrossRef]
  36. Xu, R.; Tian, F.Q.; Yang, L.; Hu, H.C.; Lu, H.; Hou, A.Z. Ground validation of GPM IMERG and TRMM 3B42V7 rainfall products over southern Tibetan Plateau based on a high-density rain gauge network. J. Geophys. Res. Atmos. 2017, 122, 910–924. [Google Scholar] [CrossRef]
  37. Wei, G.; Lü, H.; Crow, W.T.; Zhu, Y.; Wang, J.; Su, J. Evaluation of satellite-based precipitation products from IMERG V04A and V03D, CMORPH and TMPA with gauged rainfall in three climatologic zones in China. Remote Sens. 2017, 10, 30. [Google Scholar] [CrossRef]
  38. Qin, Y.; Chen, Z.; Shen, Y.; Zhang, S.; Shi, R. Evaluation of satellite rainfall estimates over the Chinese mainland. Remote Sens. 2014, 6, 11649–11672. [Google Scholar] [CrossRef]
  39. Zhao, T.; Yatagai, A. Evaluation of TRMM 3B42 product using a new gauge-based analysis of daily precipitation over China. Int. J. Climatol. 2014, 34, 2749–2762. [Google Scholar] [CrossRef]
  40. Kim, J.H.; Ou, M.L.; Park, J.D.; Morris, K.R.; Schwaller, M.R.; Wolff, D.B. Global precipitation measurement (GPM) ground validation (GV) prototype in the korean peninsula. J. Atmos. Ocean. Technol. 2014, 31, 1902–1921. [Google Scholar] [CrossRef]
  41. Golian, S.; Moazami, S.; Kirstetter, P.E.; Hong, Y. Evaluating the performance of merged multi-satellite precipitation products over a complex terrain. Water Resour. Manag. 2015, 29, 4885–4901. [Google Scholar] [CrossRef]
  42. Chen, X. Retrieval and Analysis of Evapotranspiration in Central Areas of Asia; China Meteorological News Pres: Beijing, China, 2012; p. 8. [Google Scholar]
  43. Duque, J.C.; Ramos, R.; Suriñach, J. Supervised regionalization methods: A survey. Int. Reg. Sci. Rev. 2007, 30, 195–220. [Google Scholar] [CrossRef] [Green Version]
  44. Sorg, A.; Bolch, T.; Stoffel, M.; Solomina, O.; Beniston, M. Climate change impacts on glaciers and runoff in Tien Shan (Central Asia). Nat. Clim. Chang. 2012, 2, 725–731. [Google Scholar] [CrossRef]
  45. Tong, K.; Su, F.G.; Yang, D.Q.; Hao, Z.C. Evaluation of satellite precipitation retrievals and their potential utilities in hydrologic modeling over the Tibetan Plateau. J. Hydrol. 2014, 519, 423–437. [Google Scholar] [CrossRef]
  46. Guo, H.; Chen, S.; Bao, A.M.; Hu, J.J.; Gebregiorgis, A.S.; Xue, X.W.; Zhang, X.H. Inter-comparison of high-resolution satellite precipitation products over Central Asia. Remote Sens. 2015, 7, 7181–7211. [Google Scholar] [CrossRef]
  47. Huffman, G.; Adler, R.; Bolvin, D.; Nelkin, E. The TRMM Multi-Satellite Precipitation Analysis (TMPA). Chapter in Satellite Applications for Surface Hydrology; Hossain, F., Gebremichael, M., Eds.; Springer Verlag: Berlin/Heidelberg, Germany, 2009. Available online: ftp://meso.gsfc.nasa.gov/agnes/huffman/papers/TMPA_hydro_rev.pdf (accessed on 12 January 2017).
  48. GPM IMERG. Available online: https://pmm.nasa.gov/data-access/downloads/GPM (accessed on 12 January 2017).
  49. TRMM 3B42V7. Available online: https://pmm.nasa.gov/data-access/downloads/TRMM (accessed on 15 January 2017).
  50. CMORPH. Available online: https://rda.ucar.edu/datasets/ds502.0/ (accessed on 15 January 2017).
  51. Daily Precipitation Data. Available online: http://222.82.235.66/RadarDoc/WeatherService.aspx (accessed on 15 January 2017).
  52. Shen, Y.; Xiong, A.Y.; Wang, Y.; Xie, P.P. Performance of high-resolution satellite precipitation products over China. J. Geophys. Res. Atmos. 2010, 115, 1–17. [Google Scholar] [CrossRef]
  53. Ren, Z.; Zhao, P.; Zhang, Q.; Zhang, Z.; Cao, L.; Yang, Y.; Zou, F.; Zhao, Y.; Zhao, H.; Chen, Z. Quality control procedures for hourly precipitation data from automatic weather stations in China. Meteorol. Mon. 2010, 36, 123–132. [Google Scholar]
  54. GPCC. Available online: https://kunden.dwd.de/GPCC/Visualizer (accessed on 17 January 2017).
  55. Blacutt, L.A.; Herdies, D.L.; de Goncalves, L.G.G.; Vila, D.A.; Andrade, M. Precipitation comparison for the CFSR, MERRA, TRMM3B42 and combined scheme datasets in Bolivia. Atmos. Res. 2015, 163, 117–131. [Google Scholar] [CrossRef]
  56. Gao, Y.C.; Liu, M.F. Evaluation of high-resolution satellite precipitation products using rain gauge observations over the Tibetan Plateau. Hydrol. Earth Syst. Sci. 2013, 17, 837–849. [Google Scholar] [CrossRef] [Green Version]
  57. Accadia, C.; Mariani, S.; Casaioli, M.; Lavagnini, A.; Speranza, A. Sensitivity of precipitation forecast skill scores to bilinear interpolation and a simple nearest-neighbor average method on high-resolution verification grids. Weather Forecast. 2003, 18, 918–932. [Google Scholar] [CrossRef]
  58. Daly, C.; Neilson, R.P.; Phillips, D.L. A statistical topographic model for mapping climatological precipitation over mountainous terrain. J. Appl. Meteorol. 1994, 33, 140–158. [Google Scholar] [CrossRef]
  59. Basist, A.; Bell, G.D.; Meentemeyer, V. Statistical relationships between topography and precipitation patterns. J. Clim. 1994, 7, 1305–1315. [Google Scholar] [CrossRef]
  60. GTOPO30. Available online: http://eros.usgs.gov (accessed on 17 January 2017).
  61. Tian, Y.D.; Peters-Lidard, C.D.; Eylander, J.B.; Joyce, R.J.; Huffman, G.J.; Adler, R.F.; Hsu, K.L.; Turk, F.J.; Garcia, M.; Zeng, J. Component analysis of errors in satellite-based precipitation estimates. J. Geophys. Res. Atmos. 2009, 114, 1–15. [Google Scholar] [CrossRef]
  62. El Kenawy, A.M.; Lopez-Moreno, J.I.; McCabe, M.F.; Vicente-Serrano, S.M. Evaluation of the TMPA-3B42 precipitation product using a high-density rain gauge network over complex terrain in northeastern Iberia. Glob. Planet. Chang. 2015, 133, 188–200. [Google Scholar] [CrossRef] [Green Version]
  63. Jenks, G.F.; Caspall, F.C. Error on choroplethic maps: Definition, measurement, reduction. Ann. Assoc. Am. Geogr. 1971, 61, 217–244. [Google Scholar] [CrossRef]
  64. Aizen, V.B.; Aizen, E.M.; Melack, J.M.; Dozier, J. Climatic and hydrologic changes in the Tien Shan, Central Asia. J. Clim. 1997, 10, 1393–1404. [Google Scholar] [CrossRef]
  65. Tang, H.; Micheels, A.; Eronen, J.T.; Ahrens, B.; Fortelius, M. Asynchronous responses of east Asian and indian summer monsoons to mountain uplift shown by regional climate modelling experiments. Clim. Dyn. 2013, 40, 1531–1549. [Google Scholar] [CrossRef]
  66. Baldwin, J.; Vecchi, G. Influence of the tian shan on arid extratropical Asia. J. Clim. 2016, 29, 5741–5762. [Google Scholar] [CrossRef]
  67. Bothe, O.; Fraedrich, K.; Zhu, X. Precipitation climate of Central Asia and the large-scale atmospheric circulation. Theor. Appl. Climatol. 2012, 108, 345–354. [Google Scholar] [CrossRef]
  68. Guo, H.; Chen, S.; Bao, A.; Behrangi, A.; Hong, Y.; Ndayisaba, F.; Hu, J.; Stepanian, P.M. Early assessment of integrated multi-satellite retrievals for global precipitation measurement over China. Atmos. Res. 2016, 176, 121–133. [Google Scholar] [CrossRef]
  69. Tang, G.; Ma, Y.; Long, D.; Zhong, L.; Hong, Y. Evaluation of GPM day-1 IMERG and TMPA version-7 legacy products over mainland China at multiple spatiotemporal scales. J. Hydrol. 2016, 533, 152–167. [Google Scholar] [CrossRef]
  70. Prakash, S.; Mitra, A.K.; Pai, D.; AghaKouchak, A. From TRMM to GPM: How well can heavy rainfall be detected from space? Adv. Water Resour. 2016, 88, 1–7. [Google Scholar] [CrossRef]
  71. Liao, L.; Meneghini, R. Validation of TRMM precipitation radar through comparison of its multiyear measurements with ground-based radar. J. Appl. Meteorol. Climatol. 2009, 48, 804–817. [Google Scholar] [CrossRef]
  72. Durden, S.L.; Haddad, Z.S.; Kitiyakara, A.; Li, F.K. Effects of nonuniform beam filling on rainfall retrieval for the TRMM precipitation radar. J. Atmos. Ocean. Technol. 1998, 15, 635–646. [Google Scholar] [CrossRef]
  73. Dinku, T.; Chidzambwa, S.; Ceccato, P.; Connor, S.J.; Ropelewski, C.F. Validation of high-resolution satellite rainfall products over complex terrain. Int. J. Remote Sens. 2008, 29, 4097–4110. [Google Scholar] [CrossRef]
  74. Sorg, A.; Huss, M.; Rohrer, M.; Stoffel, M. The days of plenty might soon be over in glacierized Central Asian catchments. Environ. Res. Lett. 2014, 9, 104018. [Google Scholar] [CrossRef] [Green Version]
  75. Yin, G.; Chen, X.; Tiyip, T.; Shao, H.; Bai, L.; Hu, Z.; Zhang, C.; Xu, T. A comparison study between site-extrapolation-based and regional climate model-simulated climate datasets. Geogr. Res. 2015, 34, 631–643. [Google Scholar]
  76. Saha, S.; Moorthi, S.; Pan, H.-L.; Wu, X.; Wang, J.; Nadiga, S.; Tripp, P.; Kistler, R.; Woollen, J.; Behringer, D. The NCEP climate forecast system reanalysis. Bull. Am. Meteorol. Soc. 2010, 91, 1015–1058. [Google Scholar] [CrossRef]
  77. Zhang, C.; Ren, W. Complex climatic and CO2 controls on net primary productivity of temperate dryland ecosystems over Central Asia during 1980–2014. J. Geophys. Res. Biogeosci. 2017, 122, 2356–2374. [Google Scholar] [CrossRef]
Figure 1. The study area and distribution of precipitation monitoring stations.
Remotesensing 10 01543 g001
Figure 2. Results of different accuracy estimators for each satellite-based product in different seasons. The statistical metrics are (a) Pearson linear correlation coefficient, (b) root-mean-square error, and (c) relative bias. The solid black line represents the median value, the square represents the average value; from top to bottom, the four horizontal lines are the upper edge line, the upper quartile, the lower quartile, and the lower edge, respectively, and the empty black dots represent outliers.
Remotesensing 10 01543 g002
Figure 3. Comparison of the monthly precipitation patterns from the Global Precipitation Measurement (GPM), Tropical Rainfall Measurement Mission (TRMM), and Climate Prediction Center morphing technique (CMORPH) products against the OBS from April 2014 to March 2015, averaged for the 46 stations. Shaded area shows 1 standard errors (SE) of the observations. The monthly precipitation values (averaged for the 46 stations) from all satellite products fell within 1 SE of the OBS.
Remotesensing 10 01543 g003
Figure 4. Spatial patterns of the observed precipitation (mm) by the gauge stations (circles) and the satellite estimated precipitations estimated by the TRMM (a,d,g,j,m), CMORPH (b,e,h,k,n), and GPM (c,f,i,l,o) at annual and seasonal scales. ANN: annual (ac), DJF: winter (df), MAM: spring (gi), JJA: summer (jl), SON: autumn (mo). CN: Central Tianshan area, NE: northeastern Tianshan area, SW: southwestern Tianshan.
Remotesensing 10 01543 g004
Figure 5. Results of the different accuracy estimators for each satellite-based product in different sub-regions. The statistical metrics are (a) Pearson linear correlation coefficient, (b) root-mean-square error, and (c) relative bias. In the box plot, the solid black line represents the median value, the square represents the average value, and the four horizontal lines from top to bottom are the upper edge line, upper quartile, lower quartile, and lower edge, respectively, and the hollow black point represents the outliers.
Remotesensing 10 01543 g005
Figure 6. Comparison of the precisions of three satellite-based products at different elevation zones.
Remotesensing 10 01543 g006
Figure 7. (a) frequency bias index (FBI), (b) equitable threat score (ETS), (c) probability of detection (POD), and (d) false alarm ratio (FAR) values for the different satellite-based products.
Remotesensing 10 01543 g007
Table 1. The satellite precipitation products used in this study.
Spatial/Temporal ResolutionsTemporal ExtentCoverageData Sources
GPM IMERG0.1°/0.5 h2014–present60°N–60°N[48]
TRMM 3B42V70.25°/3 h1998–201550°N–50°N[49]
CMORPH0.07°/0.5 h2002–present60°N–60°N[50]
Table 2. Contingency table between the rain gauge observations and satellite estimates.
Observations ≥ ThresholdObservations < ThresholdTotal
Estimates ≥ ThresholdHFEstimated yes
Estimates < ThresholdMZ #Estimated no
TotalObserved yesObserved nototal
# Z stands for correct estimation of no precipitation.

