Article

Monitoring the Vulnerability of the Dam and Dikes in Germano Iron Mining Area after the Collapse of the Tailings Dam of Fundão (Mariana-MG, Brazil) Using DInSAR Techniques with TerraSAR-X Data

1
National Institute for Space Research (INPE), São José dos Campos 12227-010, São Paulo, Brazil
2
SAMARCO Mineração S.A., Mariana 35420-000, Minas Gerais, Brazil
3
VISIONA Tecnologia Espacial, São José dos Campos 12247-016, São Paulo, Brazil
*
Author to whom correspondence should be addressed.
Remote Sens. 2018, 10(10), 1507; https://doi.org/10.3390/rs10101507
Submission received: 23 August 2018 / Revised: 13 September 2018 / Accepted: 15 September 2018 / Published: 20 September 2018
(This article belongs to the Special Issue Radar Interferometry for Geohazards)

Abstract

:
The Fundão tailings dam in the Germano iron mining complex (Mariana, Brazil) collapsed on the afternoon of 5 November 2015, and around 32.6 million cubic meters of mining waste spilled from the dam, causing polluion with mining waste along a trajectory of 668 km, extending to the Atlantic Ocean. The Sela & Tulipa and Selinha dikes, and the main Germano tailings dam, were directly or indirectly affected by the accident. This work presents an investigation using Advanced-Differential Interferometric Synthetic Aperture Radar (A-DInSAR) techniques for risk assessment in these critical structures during 18 months after the catastrophic event. The approach was based on the integration of SBAS (Small Baseline Subset) and PSI (Persistent Scatterer Interferometry) techniques, aiming at detecting linear and nonlinear ground displacements in these mining structures. It used a set of 48 TerraSAR-X images acquired on ascending mode from 11 November 2015 to 15 May 2017. The results provided by the A-DInSAR analysis indicated an overall stability in the dikes and in the main wall of Germano tailings dam, which is in agreement with in situ topographic monitoring. In addition, it was possible to detect areas within the reservoir showing accumulated values of up to −125 mm of subsidence, probably caused by settlements of the waste dry material due to the interruption of the mining waste deposition, and values up to −80 mm on auxiliary dikes, probably caused by continuous traffic of heavy equipment. The spatiotemporal information of surface displacement of this large mining structure can be used for future operational planning and risk control.

Graphical Abstract

1. Introduction

SAMARCO Mineração S.A., a 50-50 joint venture between the Brazilian Vale S.A. (the world´s largest iron producer) and the Australian-British BHP Billiton Brazil Ltd. (Melbourne, Australia), owns and operates the Germano iron mining complex, with an installed production of iron pellets of 30.5 million of metric tons, and iron waste of 20.7 million of metric tons in 2017 [1]. The complex is located in the municipality of Mariana, Minas Gerais State, which accounted for 72.5% of the Brazilian iron reserves (19.4 billion of tons) and 68.8% of national production in 2013 [
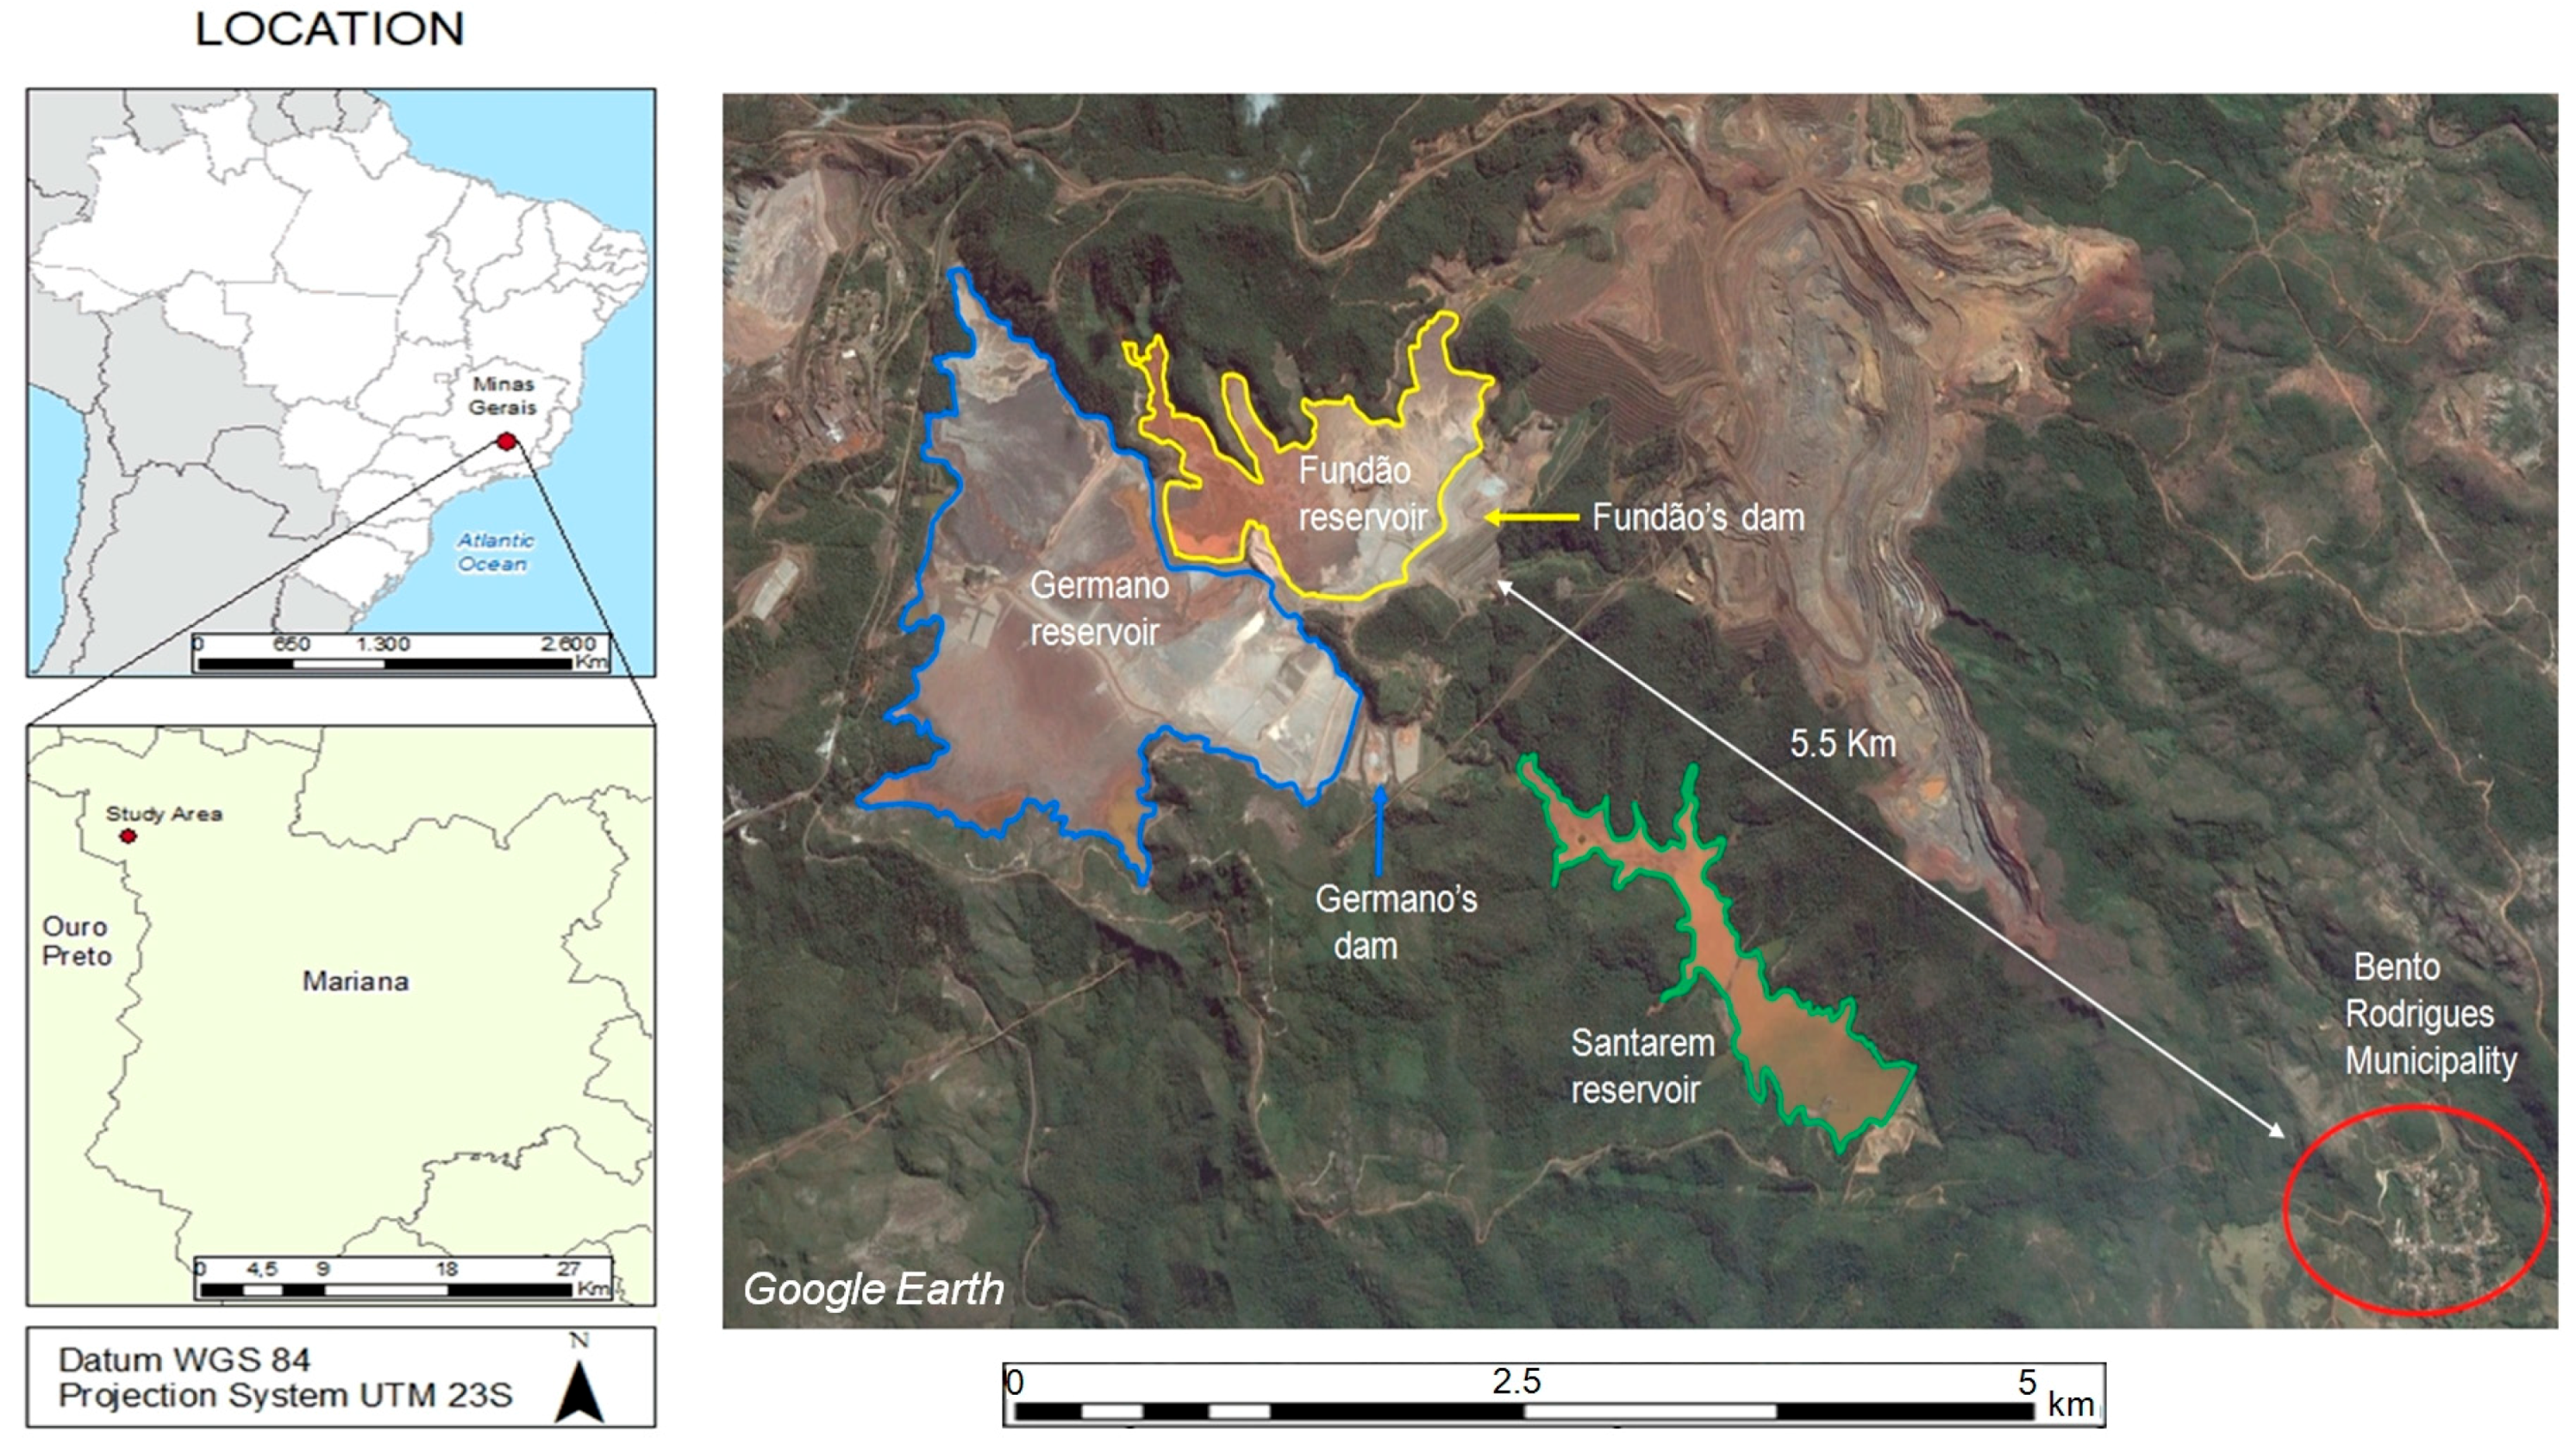
2]. The Germano complex includes open pit mines, waste piles, industrial plants, pipelines, and a system of three dams, the Germano and Fundão tailings dams and the Santarem dam, a reservoir where water is stored for industrial reuse (Figure 1).
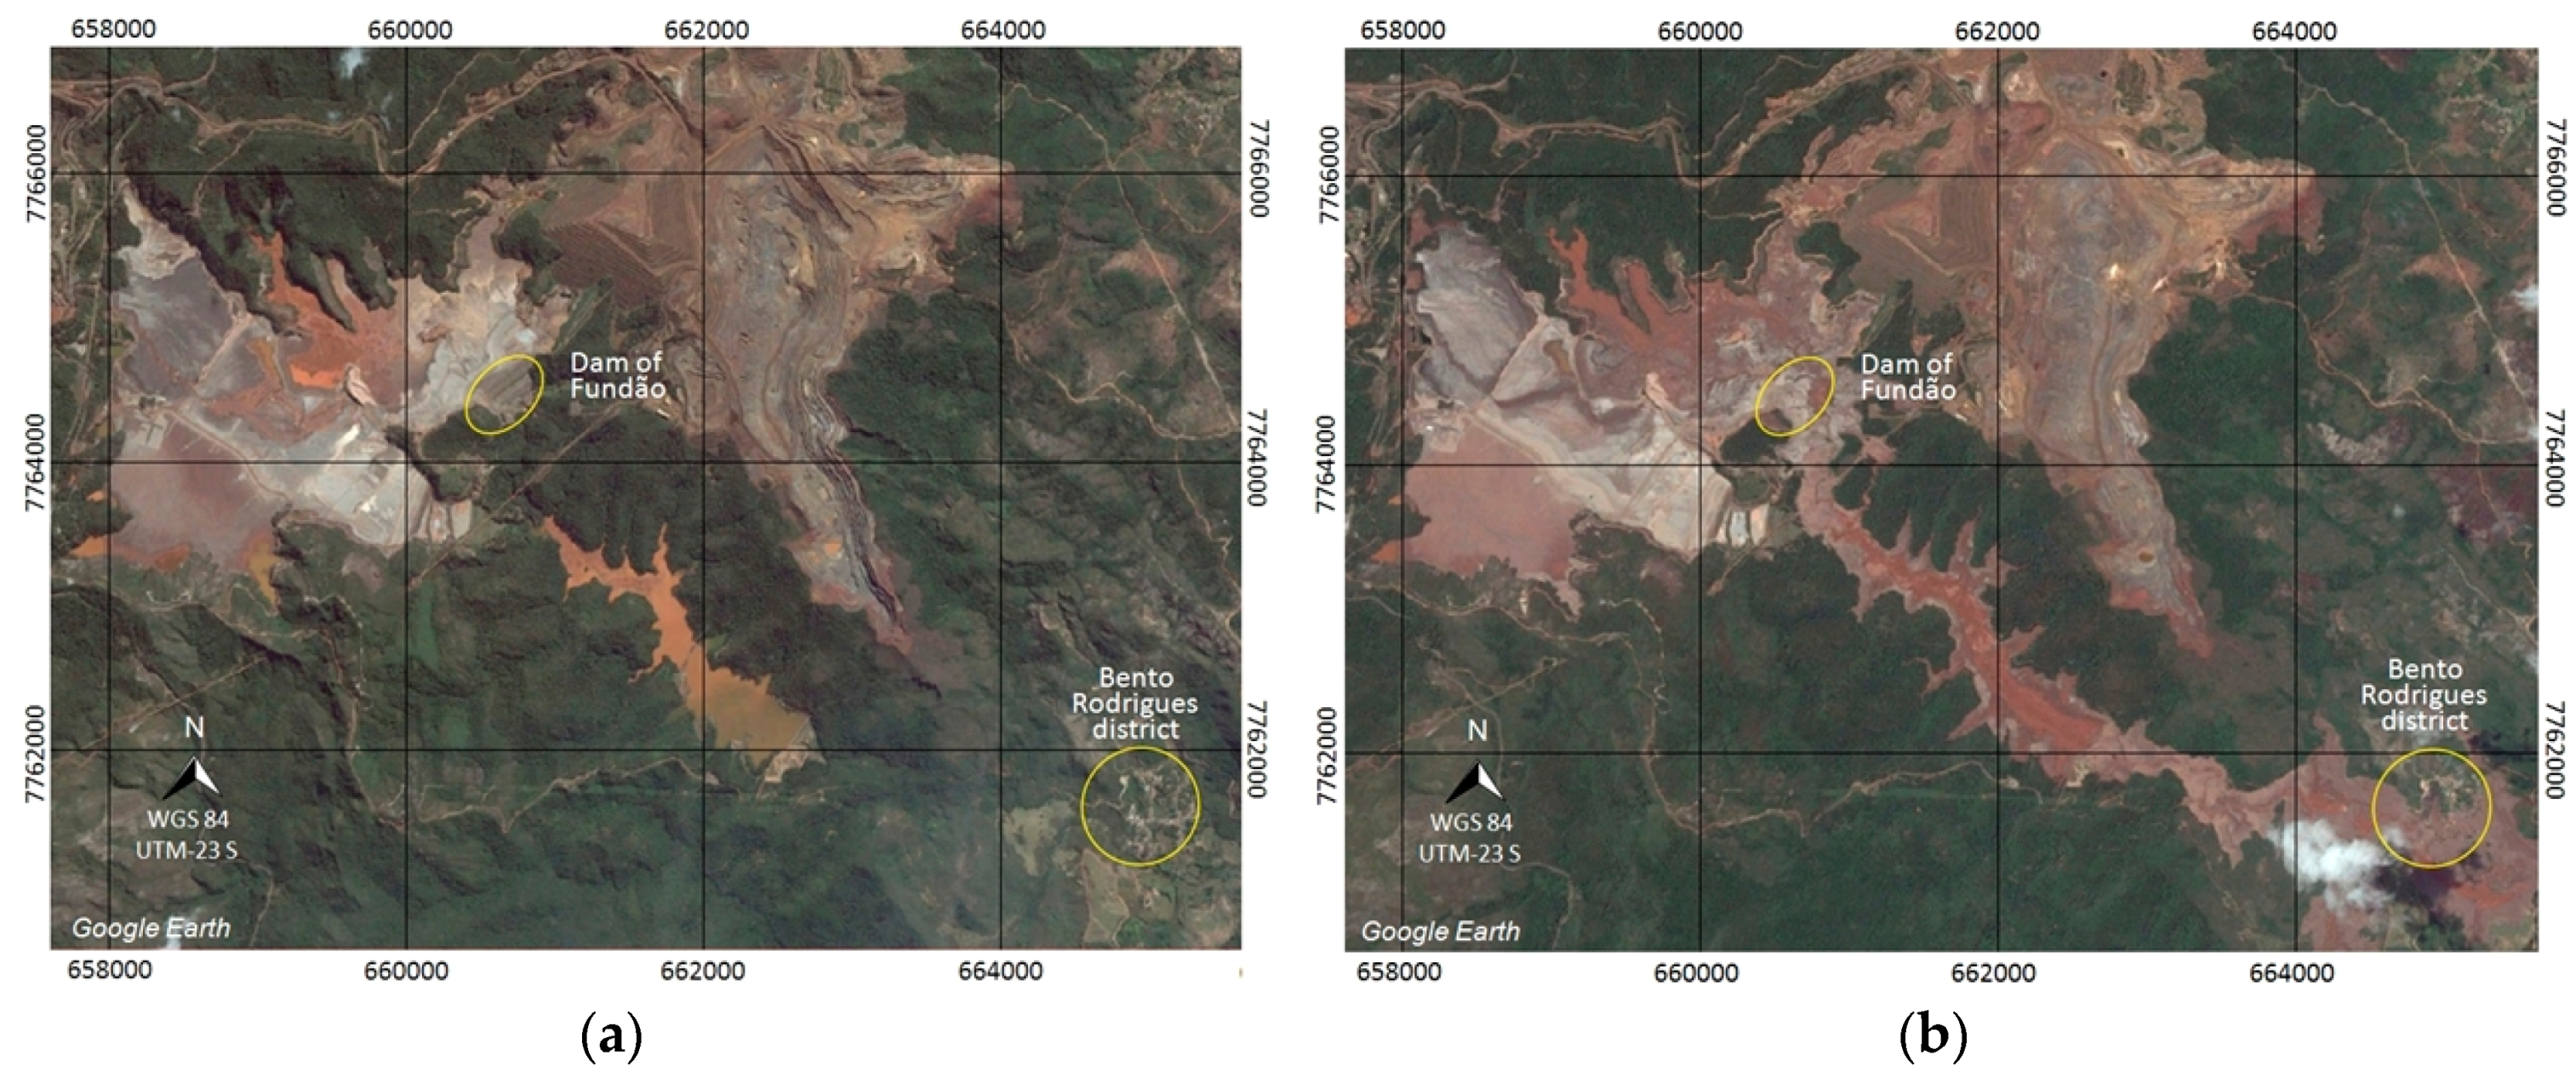
The Fundão dam was one of the megastructures of the Germano complex, with dimensions of ~500 m length and main walls 110 m high. The structure was installed in 2008, with storage of 55 million cubic meters of tailings materials (November 2015). On the afternoon of 5 November 2015, the Fundão dam collapsed, and about 32.6 million of cubic meters of mining waste spilled from the dam, about 60% of its overall capacity at the time. The event produced mud waves 10 m high, destroying buildings and infrastructure in the rural districts of Bento Rodrigues, Paracatu de Baixo and Gesteira, killing 19 people, polluting 668 km of watercourses from the Doce River basin to the Atlantic Ocean, and involving the Brazilian Atlantic Forest (considered one of the world´s biodiversity hotspots), estuarine, coastal and marine environments [
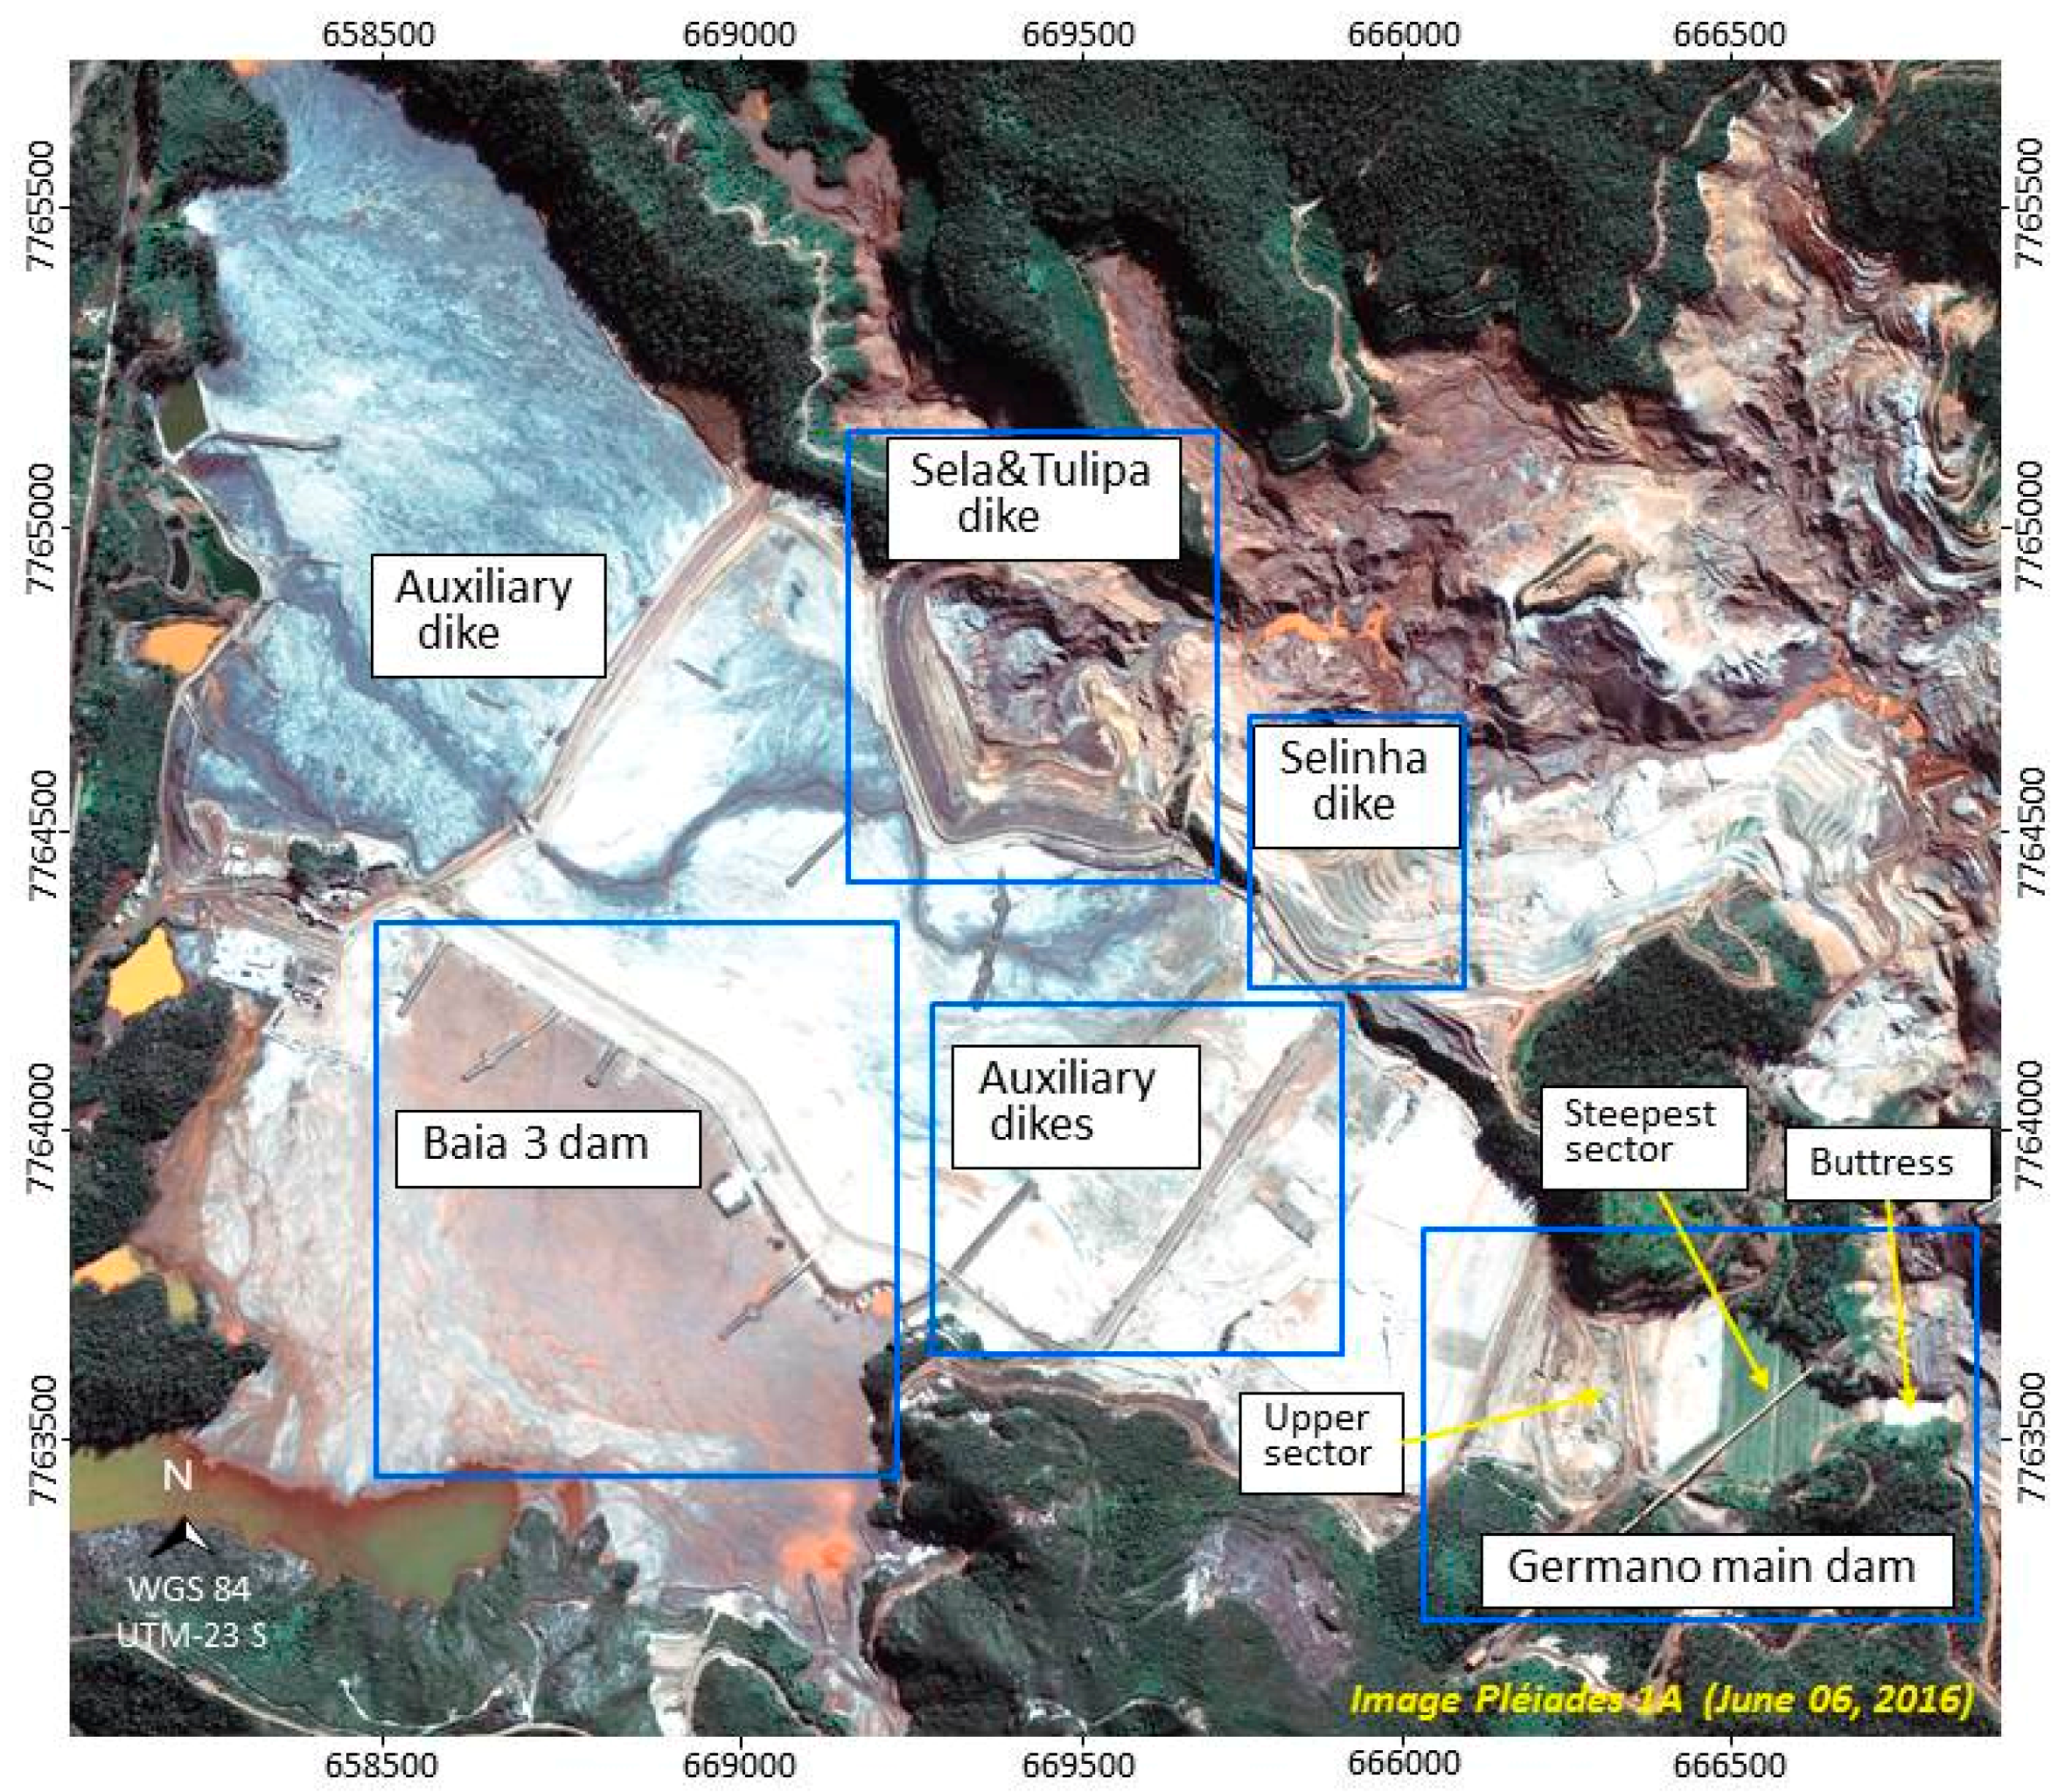
3]. Some of the waste tailings released by the failure of the Fundão dam flowed over the Santarém dam, causing a partial erosion of the main body of the dam, and concomitant damage to the supporting structures of the Selinha and Sela & Tulipa dikes on the side walls of the Germano dam.
A technical final report of the disaster concluded that the collapse was due to liquefaction, i.e., when solid materials (sandy tailings) lose their mechanical resistance and present fluid behavior [4]. A related aspect of the failure was the series of three small seismic shocks that occurred earlier. Three events were detected ~1.5 h prior to the dam collapse, presenting regional Richter magnitudes (mR) of between 1.4 and 2.6. Another small event was detected around the time of the accident; four more with mRs ranging between 1.3 and 1.9 occurred over the following days [5]. The events are consistent with seismic intensities IV–V in the Modified Mercalli intensity scale (MM), suggesting occurences at very shallow depths (<5 km). Computer modeling showed that the earthquake events caused an additional increment of horizontal movement in the slimes that correspondingly affected the overlying sands. Although the movements were quite small and the associated uncertainties large, this additional movement is likely to have accelerated the failure process that was already well advanced [4]. 
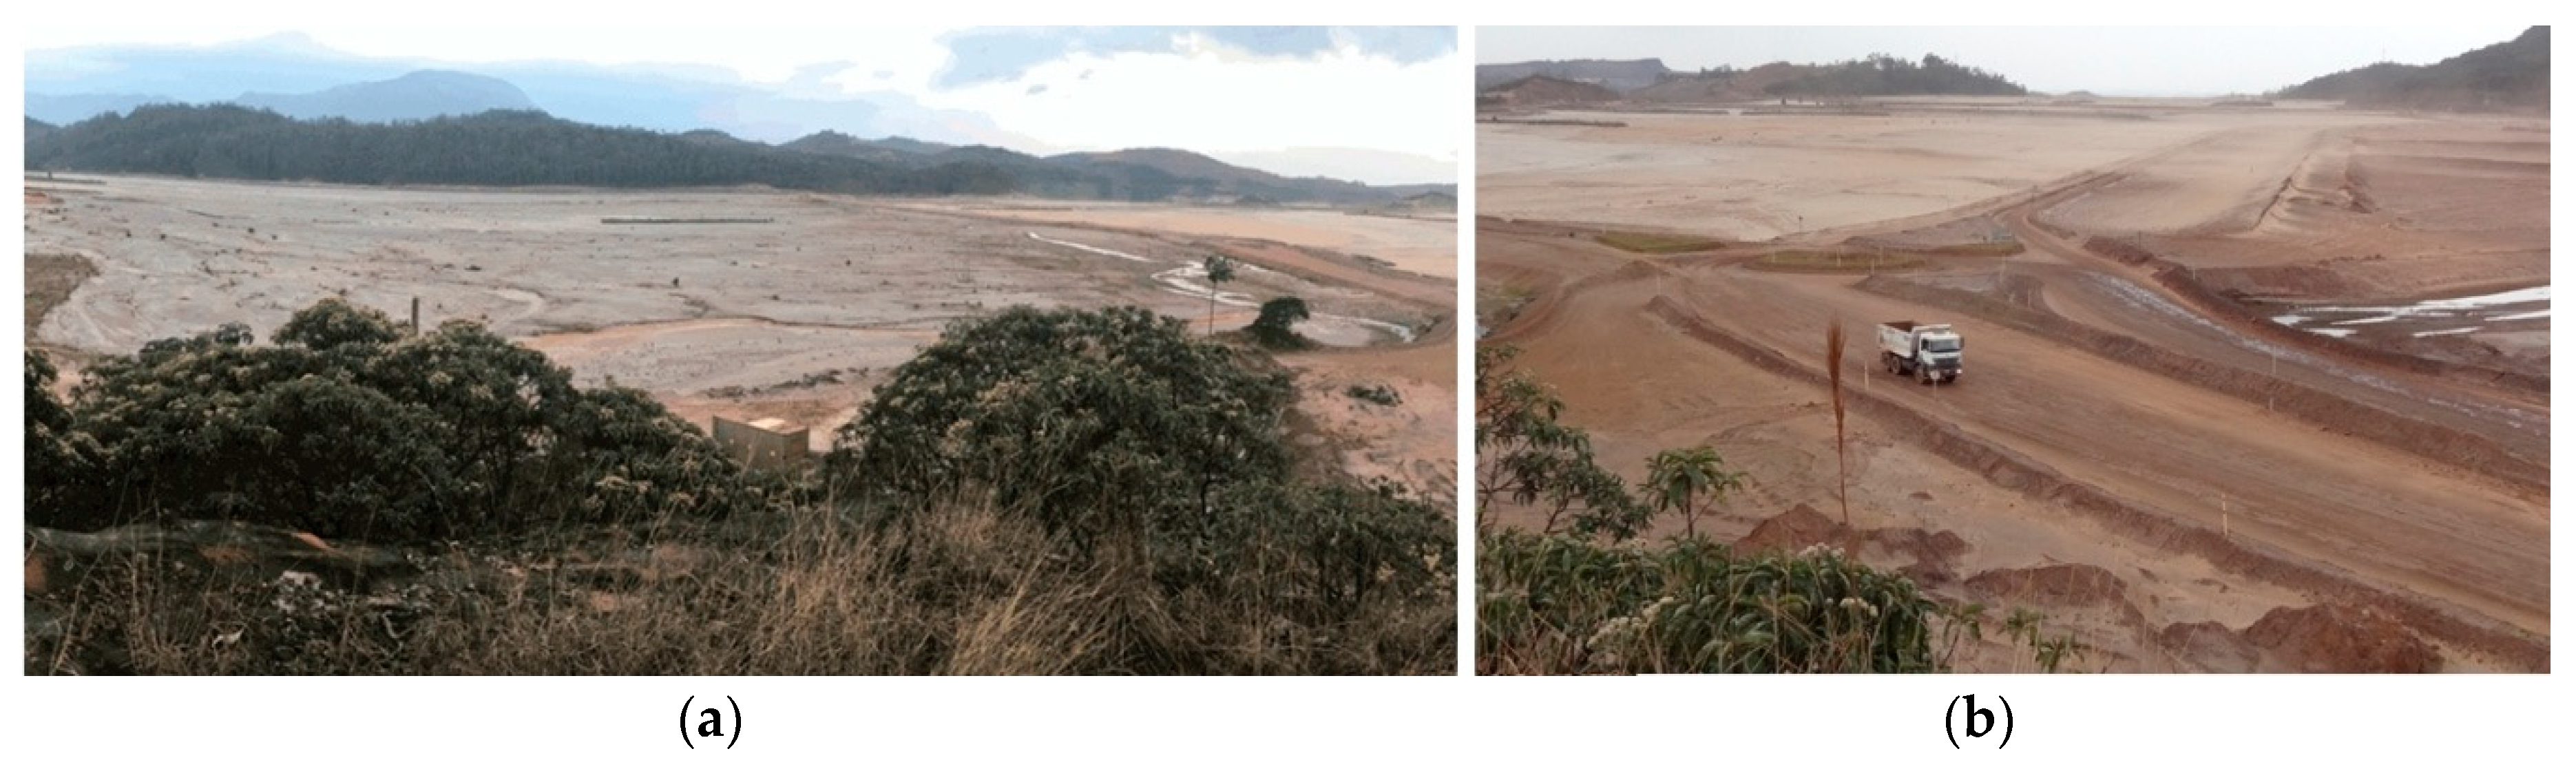
Figure 2 shows optical images acquired before and after the Fundão rupture.
Different procedures have been applied for stability monitoring of dams, namely geodetic methods (total station/prisms, levelling, photogrammetry, Global Navigation Satellite Systems) and non-geodetic methods (optical fibre sensors, piezometers, inclinometers, ground-based radar). Despite the reliability and accuracy of these methods, they can provide measurements only for specific points or sectors of the dam, where instrumentation has been placed; furthermore, monitoring can be time consuming, and requires fieldwork. Multi-temporal satellite SAR acquisitions have improved the capability of detecting temporal changes of deformation phenomena. Two classes of A-DInSAR (Advanced-Differential Interferometric Synthetic Aperture Radar) Time-Series analysis have been addressed to obtain ground-displacement information. A class based on a stack of multi-referenced differential interferograms, sensitive to stable and distributed scatterers, has been successfully used [6,7,8,9,10]; this is known as the SBAS (Small Baseline Subset) technique. The second, based on a stack of master-referenced differential interferograms, relies on identifying pixels whose scattering properties do not vary much with time, also called persistent scatterer (PS) [11,12,13], allowing a temporal analysis of the interferometric phase of individual point targets, as well as providing accurate information related to surface target displacements, called PSI (Persistent Scatterer Interferometry) technique.
A-DInSAR analysis has been used to measure ground displacement in underground mines [14,15,16,17,18] and in open pit mines and related infrastructures [19,20,21,22,23,24,25], due to its capabilities (i.e., synoptic coverage, reliable measurements of ground displacement, point-to-point accuracy at the mm scale, and dense grid sampling) and its ability to monitor large areas without the installation of equipment and field campaigns. The utilization of A-DInSAR for monitoring dam stability conditions is a recent trend, but it is not yet used on a regular basis, with few papers related to dam reservoirs [26,27] and tailings dams [28]. Since the Germano dam encompasses a significant mining infrastructure with lateral supporting walls affected by the Fundão collapse, the use of A-DInSAR is justified, due to a critical demand of information regarding risk after the aforementioned tragic event. In this paper, we present a clear example of the potential of A-DInSAR for risk assessment of a tailings dam after one of the mining industry’s largest environmental disasters.
The investigation was based on a combination of A-DInSAR analysis using SBAS [7] and PSI techniques [11] with GAMMA’s Interferometric Point Target Analysis (IPTA) concept [12], applied on a set of 48 TerraSAR-X (TSX-1) images, acquired in the period of 11 November 2015 and 15 May 2017, aiming at obtaining complementary information between coverage (SBAS) and resolution (PSI) of the ground displacements in the Germano tailings dam and associated structures. The results were compared with available in situ monitoring data, based on total station and mini reflective prisms. Section 2 presents the study area, Section 3 the materials and methods, Section 4 the data processing, Section 5 the results, Section 6 the discussion and Section 7 the conclusions.

2. Study Area

Geologically, the bedrocks of the site consist of ironstones known as itabirites from the Paleoproterozoic age (2.1-2.0 Ga) associated with a platformal sequence of the Minas Supergroup. Massive and soft iron ores were formed due to supergene process acting during the Neogene over products associated with hydrothermal enrichments [2]. The Germano tailings dam is the biggest of the Germano complex, with an estimated capacity of 116 million of cubic meters (more than twice the reservoir volume of the collapsed Fundão dam). The Germano dam was raised according to the upstream method, and a method was devised to benefit from the different characteristics of the two types of tailings. The sands were deposited to form a stack that retained the slimes discharged separately behind it. The sands, in turn, were retained by a rockfill starter dam at the downstream toe of the stack. The dam was constructed in 1976; one year later it commenced operation with the implantation of a 70 m-high start dike, and a crest in the elevation of 849.5 m. Over time, the dam crest moved progressively upstream over previously-deposited tailings; until the crest reached an elevation of 899 m.
Up to 1995, the Germano dam only received sandy waste. Since 1977, slime materials were also deposited, mainly in the central, north, and northwest sectors of the reservoir, and by 2005, the existing tailings facilities at Germano dam were nearing capacity. For the purposes of the investigation, the main structures of the dam to be considered are: (a) the Buttress, a rockfill starter dam at the downstream toe of the reservoir, (b) the Main dike (main wall), a structure made with embankments to contain the tailings, (c) the Sela & Tulipa dike, Selinha dike and Baía 3 dam, supporting structures which serve to delimit the areas for tailings impoundment and allow proper handling, and (d) the Auxiliary dike, which delimits the area of sandy to slime waste (Figure 3). After the Fundão collapse, SAMARCO adopted measures and started construction of the sectors of the dam to ensure the safety of the remaining structures and contain the tailings flow. Structural reinforcement works were carried out in 2016 and 2017 in the Sela & Tulipa and Selinha dikes, and on the main dam foot. To monitor the dam stability, SAMARCO has deployed different forms of in situ monitoring, with the use of motion measuring devices placed at discrete points with total station/prisms and ground-based radar. Total station/prisms are used for primary monitoring, since they are a low cost option as compared to ground-based radars. Although they provide high accuracy, they present limitations, such as: (i) visibility is needed among stations and measured points, which is complicated during precipitation, and (ii) field campaigns are necessary, with a high cost of undertaking frequent surveys. Once instability has been detected, ground-based radar is the best solution, providing real time information. However, the use of ground-based radar is restricted to sectors of the dam area.

3. Materials and Methods

3.1. Satellite Data

A set of 48 TSX-1 scenes in SLC format was used to monitor displacements along the LoS (Line-of-Sight) of the satellite. The SAR sensor operates on the X-HH band, and the StripMap mode scenes were acquired from 11 November 2015 to 15 May 2017, with 11-day revisit time, pixel spacing of 1.91 m × 0.91 m (azimuth and range), ascending orbit, 35° of average incidence, and covering 30 × 60 km2. Precise Digital Elevation Model (DEM), with 1.0 m of spatial resolution, was generated from a Pléiades 1-A tri stereo images of spatial resolution of 0.5 m, acquired on 19 June 2016. The DEM was generated using the Rational Polynomial Coefficients (RPC) model available on the PCI Geomatica OrthoEngine software, making full use of the auxiliary parameters of the Pléiades images. A complete description of this modeling is presented in [29].

3.2. Methodological Approach

The analysis of multiple SAR images of the same area, acquired at different time intervals and with small differences in geometry, allows the generation of the differential interferograms providing the capability for detecting the temporal change of the ground displacement in LoS direction. The phase components presented in each pixel of the interferogram came from the topography, deformation, atmosphere, orbit error, and noise. The topographic phase can be removed from a known digital elevation model. The remaining phase components can be represented by:
t ( x , r ) = d r ( x , r ) + h ( x , r ) + a t m ( x , r ) + β ( x , r ) + n ( x , r ) ,
where x and r are the azimuth and slant range coordinates, d r is the phase shift due to the displacement of the pixel in LoS direction, h is the topographic phase error, a t m is the atmospheric phase delay, β is the residual phase due to orbit errors, and n is the phase noise.
In this methodology, the determination of ground displacement was based on a combination of SBAS and PSI techniques, exploring the different characteristics of the scatterers within the resolution cell. PSI extracts the phase change by analyzing stable and dominant scatterers (persistent), while the SBAS technique is sensitive to stable, but distributed scatterers [30]. The first solution was based on the SBAS technique, which works with multi-look interferograms, and provides a better spatial coverage. The temporal phase displacement and the topographic phase error obtained can be subtracted (modulo-2π) from the PS phase, improving the performance of the PSI analysis by increasing its capability for detecting nonlinear displacement in full resolution, and in some cases, expanding the density of PS. The final data for the ground displacement are obtained by the addition of the PSI result to the phase displacement from the SBAS analysis, as described in [23].
The SBAS technique is based on set of multi-referenced differential interferograms, generated according to the small baseline constraint, spatially filtered (multi-look) to improve the phase quality to make easier the process of phase unwrapping. This set of unwrapped interferograms (observed data) is organized into a system of equations in order to estimate the displacement in LoS. The solution of this system can be obtained in the Least Squares (LS) sense [6]. According to [7], a physically-sound solution can be found in terms of mean phase velocity among time-adjacent acquisitions using the SVD decomposition. Finally, integration can be used to obtain the ground displacement result. Topographic phase errors can be estimated through the linear regression that relates the topographic phase with perpendicular baselines values, derived from the multi-referenced differential interferograms.
The PSI technique involves simultaneous analysis of a stack of master-referenced interferograms utilizing the pixels within the resolution cell which exhibit stable amplitude backscattering (persistent scatterers) and coherent phase [11]. Persistent scatteres (PS) are not affected by baseline decorrelation, and a single master stack of interferograms can be formed even if the baselines are longer than the critical baseline. The PS candidates are estimated based on the amplitude dispersion index [11] and low spectral diversity [12] at each pixel of the stack of the co-registrated images. As the time dependence of the PS deformation is not usually known a priori, it is normally assumed to be approximately constant in rate (linear model). Deviations from this model (residuals phase) are assumed to be due to atmospheric phase, nonlinear phase displacement, and phase noise. The topographic phase error is practically a linear function of the perpendicular baseline. The atmospheric phase estimation is accomplished by filtering the residual phase after estimation of the modeled parameter, i.e., topographic error and the displacement rate, taking advantage of the spatial correlation and temporal decorrelation of the atmospheric phase [31].

4. Data Processing

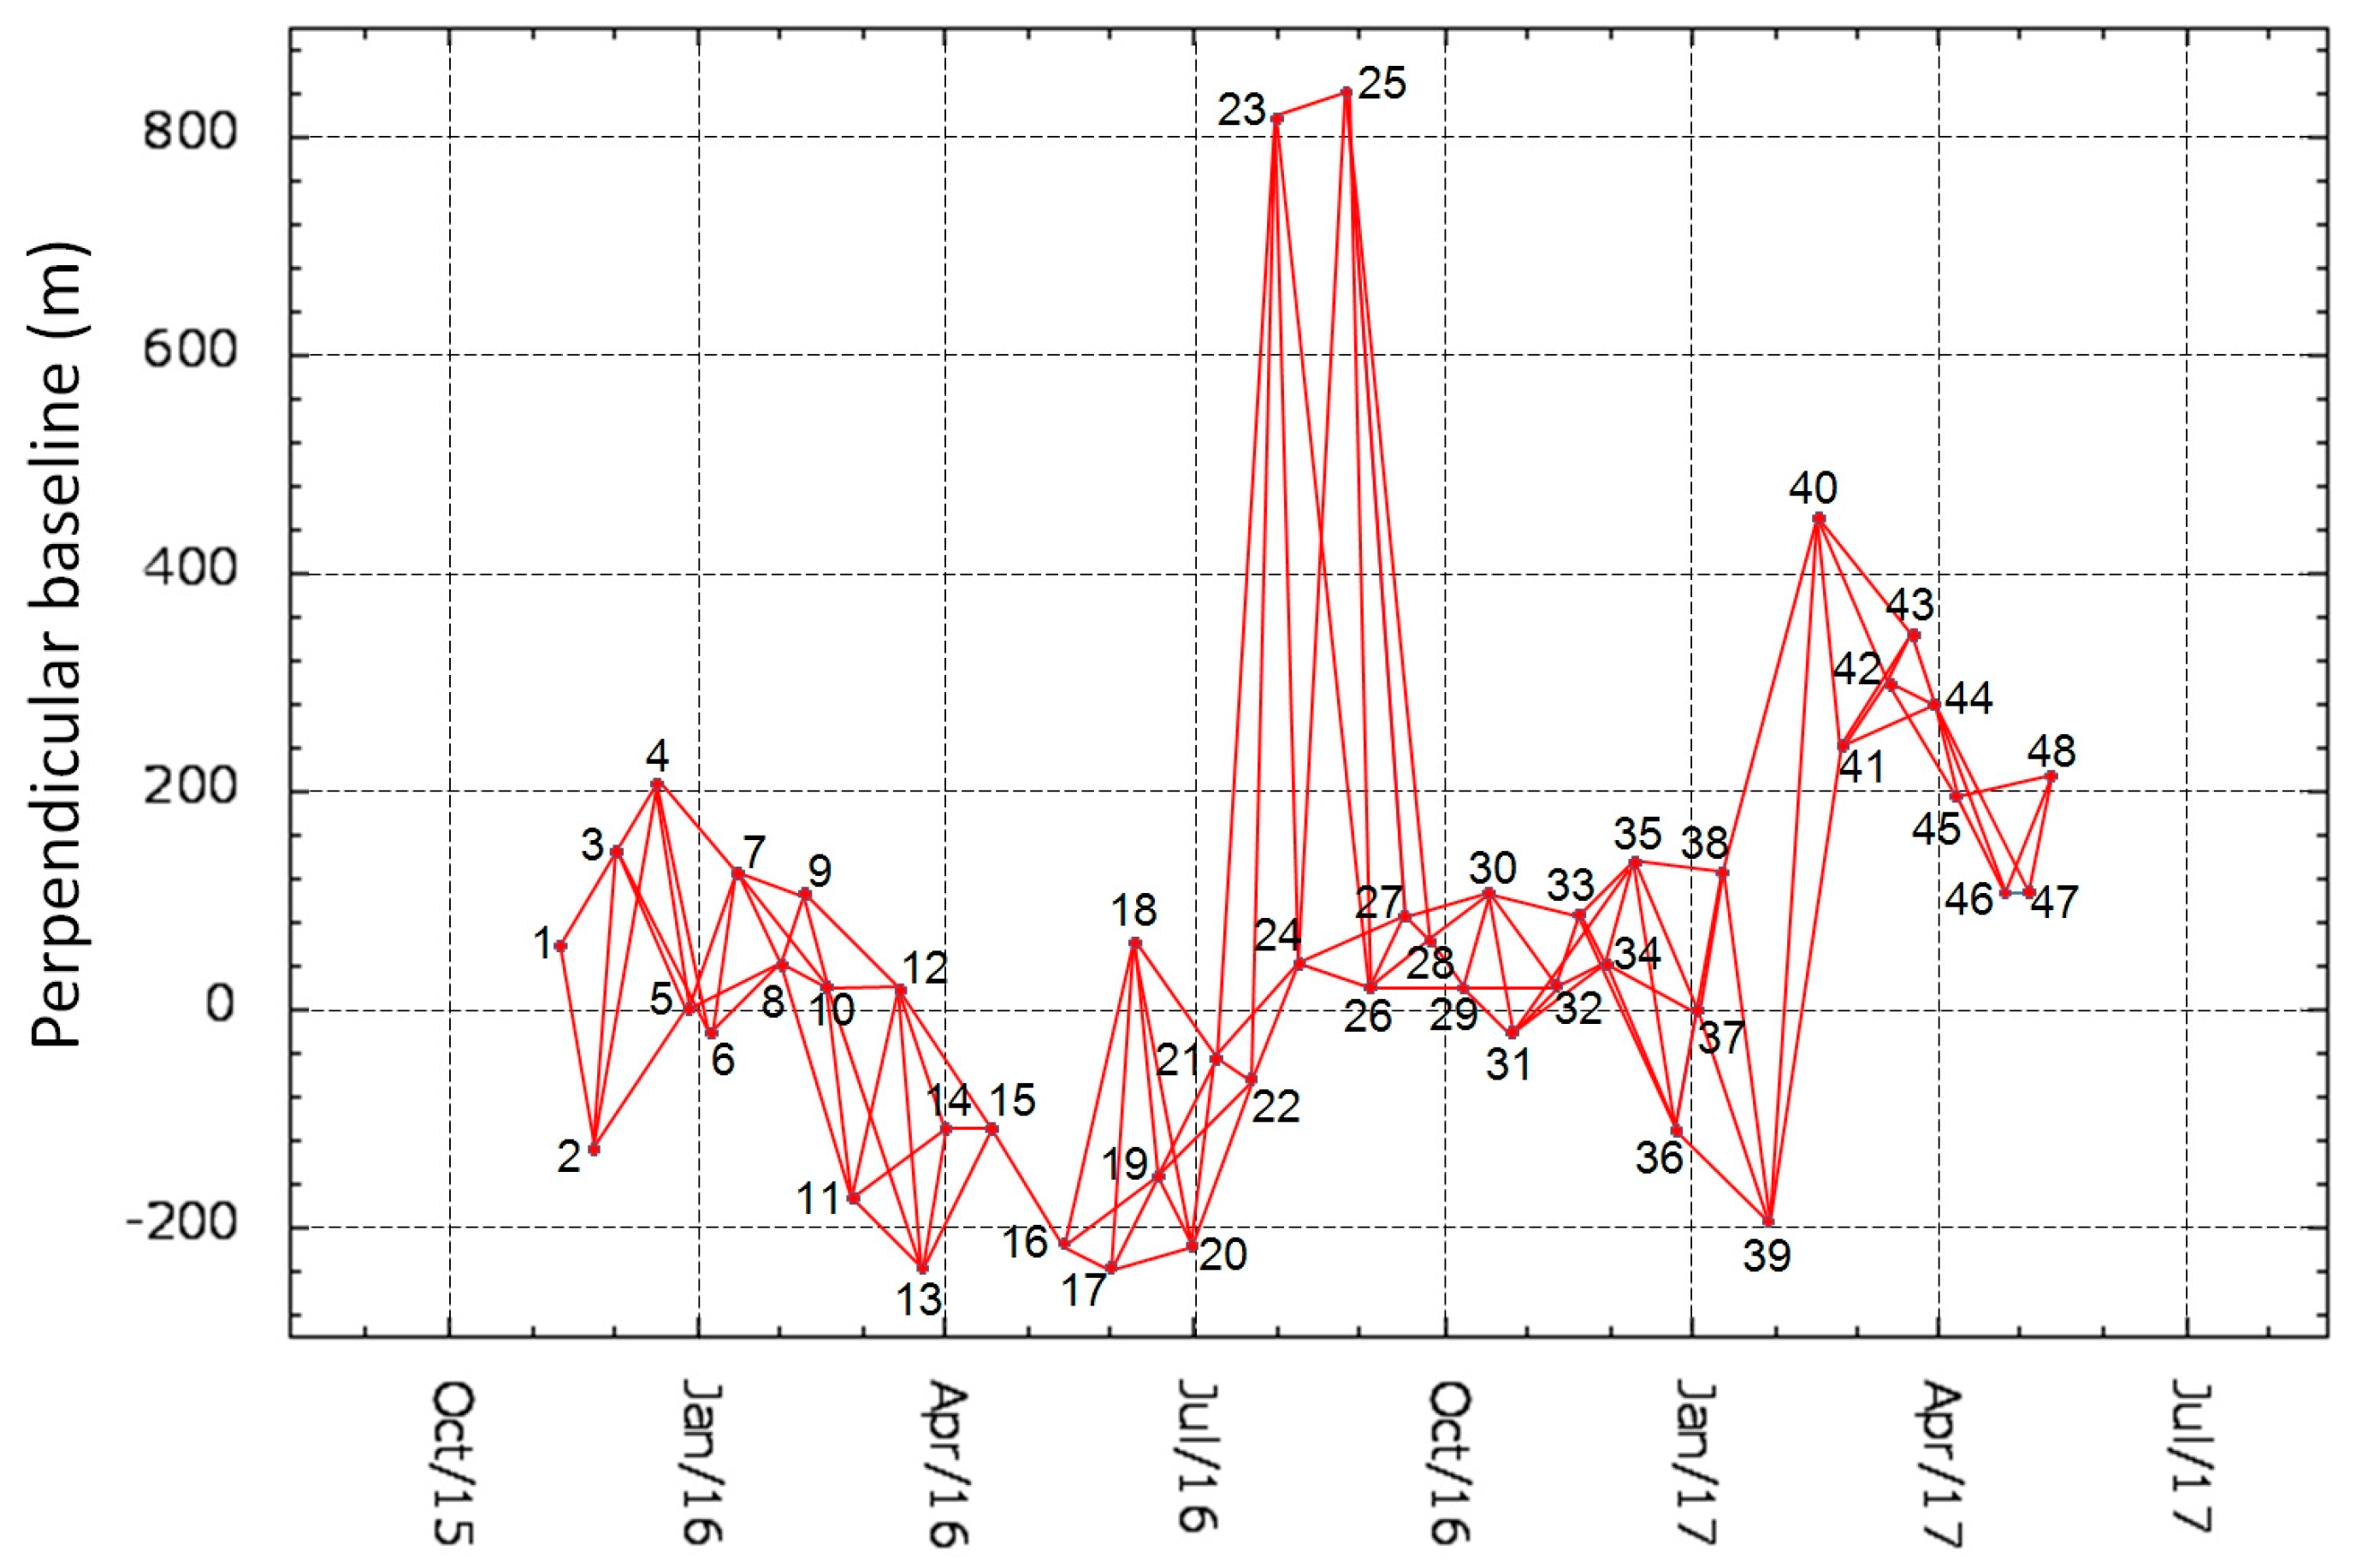
Multi-referenced differential interferograms, with topographic phase components removed (simulated from a precise DEM) were generated from the stack of images. The combination of interferometric pairs to perform the time-series analysis was based on the concept of a small baselines subset (SBAS) [7], where pairs of images were selected based on maximum values of time difference (temporal baseline) and distances (perpendicular baseline). In this work, a time interval of 42 days and normal baseline of 900 m were used, generating 118 interferograms, as shown in Figure 4. The interferograms were spatially filtered (multi-look) using a 2 × 2 window size, which resulted in pixels size of 3.8 × 1.8 m (azimuth and slant range), with the purpose of reducing the phase noise component.
An adaptive spectral filter with a window size of 32 × 32 was applied to the interferograms to generate interferometric coherence images [32]. Regions with coherence below 0.5 were masked out (especially in vegetated areas around the study area). The spatial phase unwrapping of the interferograms was carried out using the MCF (Minimum Cost Flow) algorithm [33]. Visual inspection was also used to discard interferograms with compromising phase unwrapping errors.
For the inversion of the system of equations with the SBAS approach, a set of weighted constraints on the acceleration of the displacement was introduced to control the smoothness of the time-series solution [8], thereby minimizing the atmospheric artifacts. The smoothing constraint parameter (with the value of 1.6) and the terms related to the derivative of the phase in relation to the height (proportional to the normal baseline) for topographic error estimation were incorporated into the system of equations, and the inversion was performed using an extension of the SVD [34].
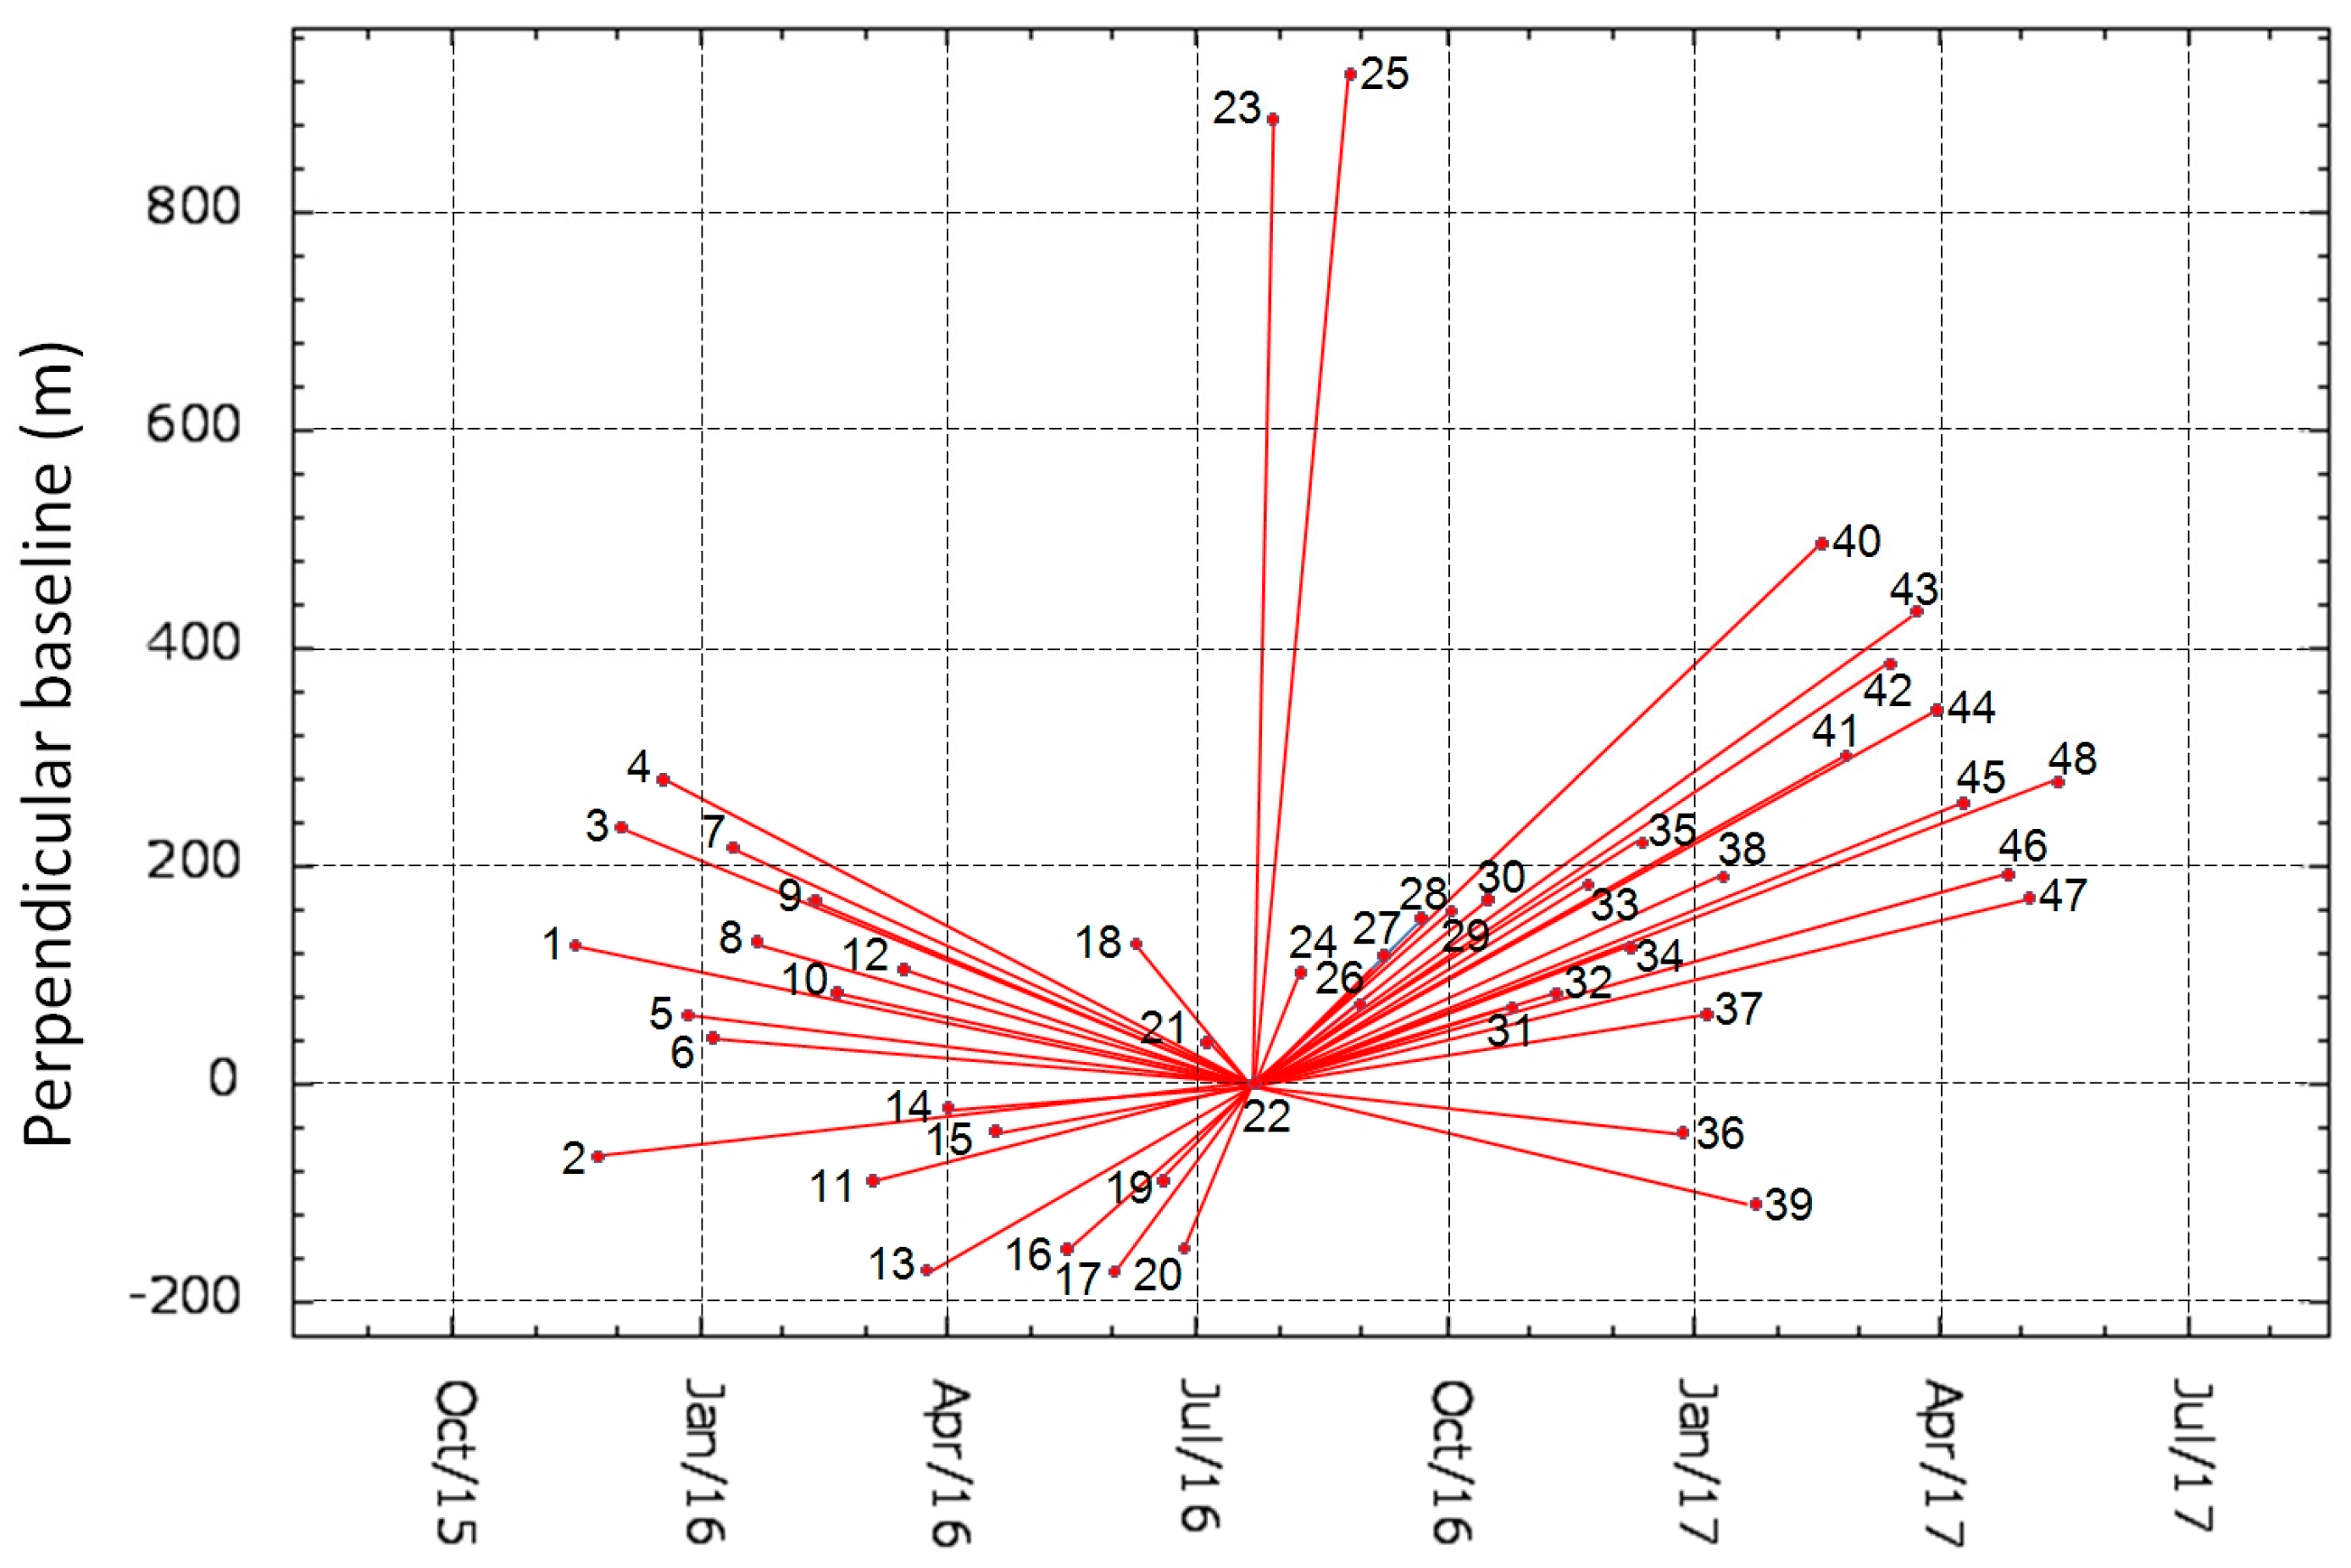
For the PSI analysis, a stack of 48 co-registered SLC images was used to generate the interferometric pairs in relation to a master image, acquired on 22 July 2016, whose selection was made based on low perpendicular baseline dispersion and its position nearly at the center of the time series, as shown in Figure 5. A reference point was selected in a stable area, and the phase value of this point was subtracted (modulo-2π) from all PS phase values, creating a set of differential interferograms for each PS. As PSI analysis is related to the master image, the phase related to the ground displacement and topographic phase errors, previously found with SBAS solution, were spatially interpolated to full resolution, and then reorganized according to the master scheme (single reference), before subtraction in modulus 2π from the PS phase.
PSI analysis was performed using the IPTA module approach [12], i.e., the approach implemented in GAMMA RS software. The topographic error was estimated based on a linear dependence of the topographic phase to the perpendicular baseline components, presenting diversity values from −173.16 up to 914.83 m for the 48 pairs, as shown in Figure 5.
The PSI analysis was performed on the residual phase of each PS obtained after the subtraction of the phase displacement and topographic phase error, provided by SBAS analysis. The residual ground displacement was estimated through linear time dependence to the deformation, which was computed through a linear regression between time and phase variation for each PS, using limited deformation rates from −10 up to 10 mm/years. The phase standard deviation of the linear regression was predefined to 1.2 radians, which allowed detecting and rejecting points which were not suitable for PSI analysis. Atmospheric phase delay may account for most of the linear regression deviation (residues) related to the deformation, and its components were strongly attenuated by using a spatial filter of 500 × 500 samples, considering its characteristic, i.e., being spatially correlated and temporally uncorrelated. After removing the atmospheric phase (spatially-filtered residues) and noise phase (temporarily-filtered residues), the remaining phase accounts for the residual linear and nonlinear deformation phase. After a step-wise iteration, the outputs of the PSI analysis, ground displacement, and topographic errors were added to the interpolated SBAS results, providing the final ground displacement estimation and the final topographic error, pointing out that only the PSs that fulfilled the PSI processing constraint were added.

5. Results

The results of the SBAS based on the interferometric pairs configuration are shown in Figure 4, providing information regarding the displacement velocity (Figure 6) and the digital elevation error (Figure 7). These results were used as preliminary information to perform the PSI analysis.
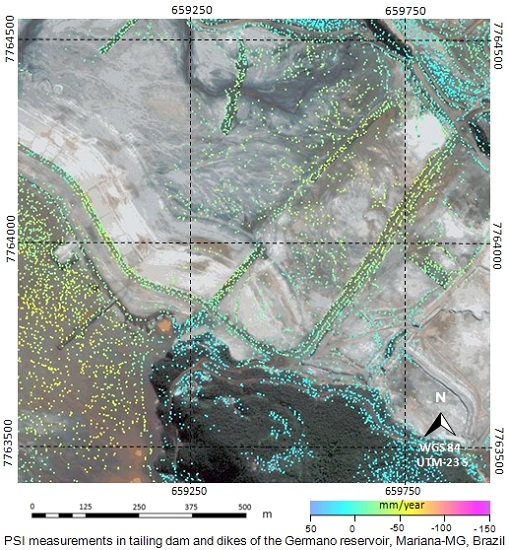
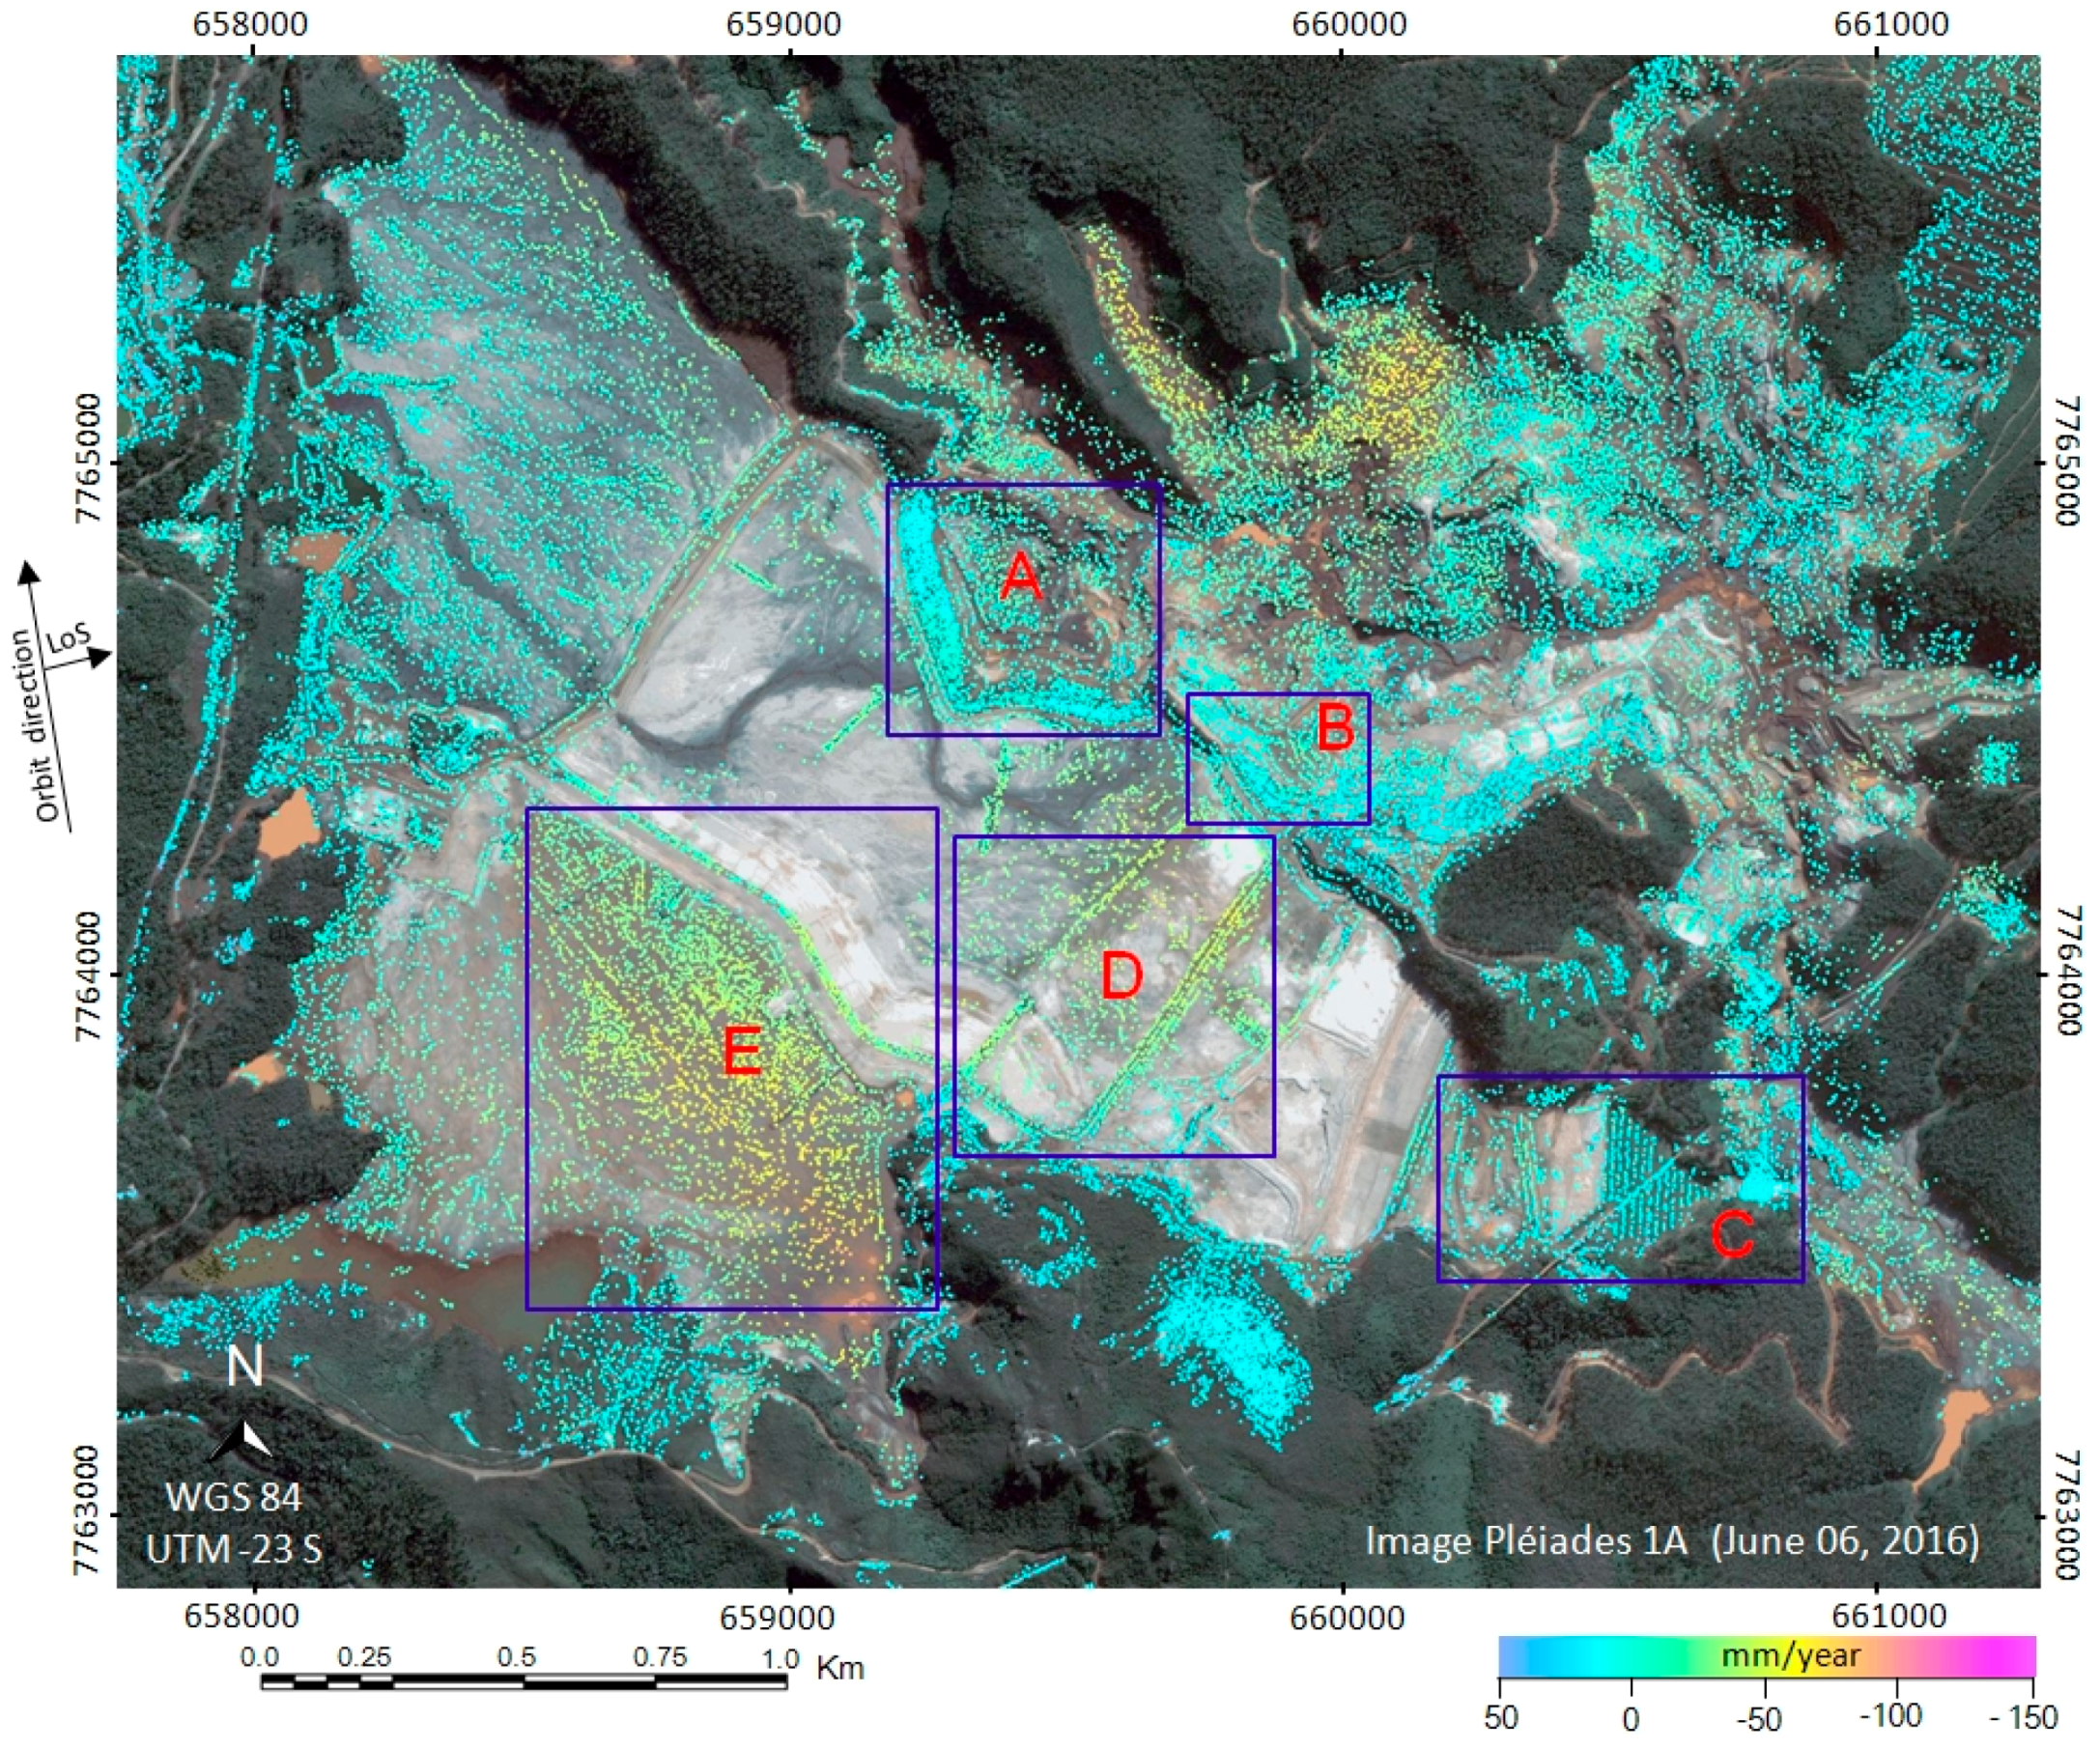
The results of PSI processing are presented in Figure 8, showing the Sela & Tulipa dike (A), Selinha dike (B), and the main Germano dam and buttress area (C). In these structures, patterns of stability can be seen. In the auxiliary dikes used for the access of trucks and heavy equipment (D), and in the Baía 3 dam and reservoir (E), patterns of the ground displacement can be observed.
During the period of TSX-1 acquisitions (11 November 2015 to 15 May 2017) sectors of the Germano dam were monitored with a total robotic station covering several intermittent time intervals. We used the time intervals with topographic measurements to perform the comparison between in situ topographic measurements and PSI results; the longest period was from 9 August 2016 to 15 May 2017.
Topographic monitoring was performed with a Leica TM50 0.5″ (half second) robotic station, whose manufacturer-specified nominal accuracy is 0.6 mm + 1.0 ppm. The prisms used for monitoring were the 2” GPR112 (two seconds) model. Considering that the longest monitoring distance was 815 m, and the angular errors of the prisms and the station were 2.5” (two seconds and half), the monitoring error (ME) totaled ±10 mm (ten millimeters). Since, in theory, the zero reading can present the same nominal error, the limit of two times the nominal error (accumulated error totalizing 20 mm) was established as a safety limit for the detection of movements according to the geotechnical team of SAMARCO Company, and used for purposes of analysis of the results. Thus, values of vertical displacement projected in LoS (35° of incidence angle) within the interval of ±16 mm (bar error limits) were interpreted as accepted errors, while accumulated displacement outside this interval probably expresses real deformation.
The accuracy of the PSI results depends on many parameters, such as the number of SAR images, the spatial distribution of PS, climatic conditions, distance from the reference point, and the quality of PS within the area of interest. Typically, using datasets of more than 20–30 satellite images, errors on individual measurements are usually limited to within ±5 mm [21].
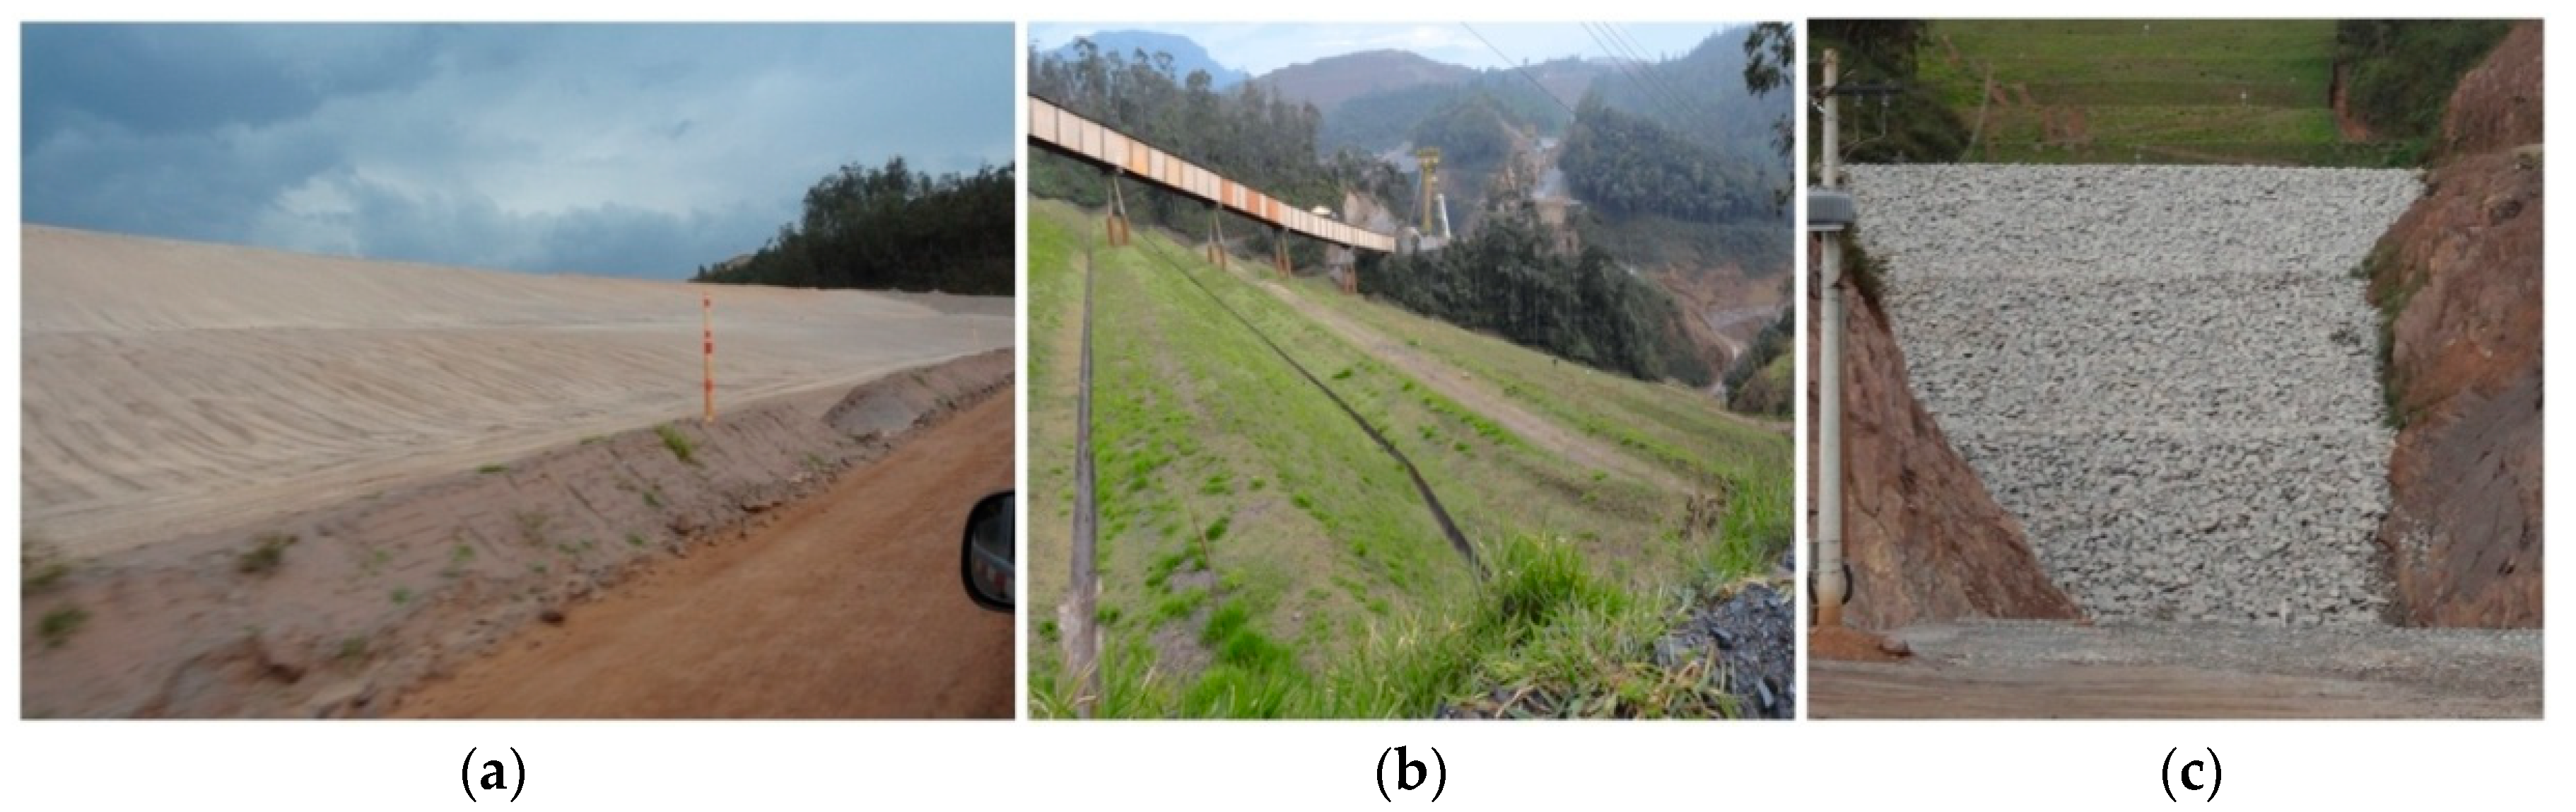
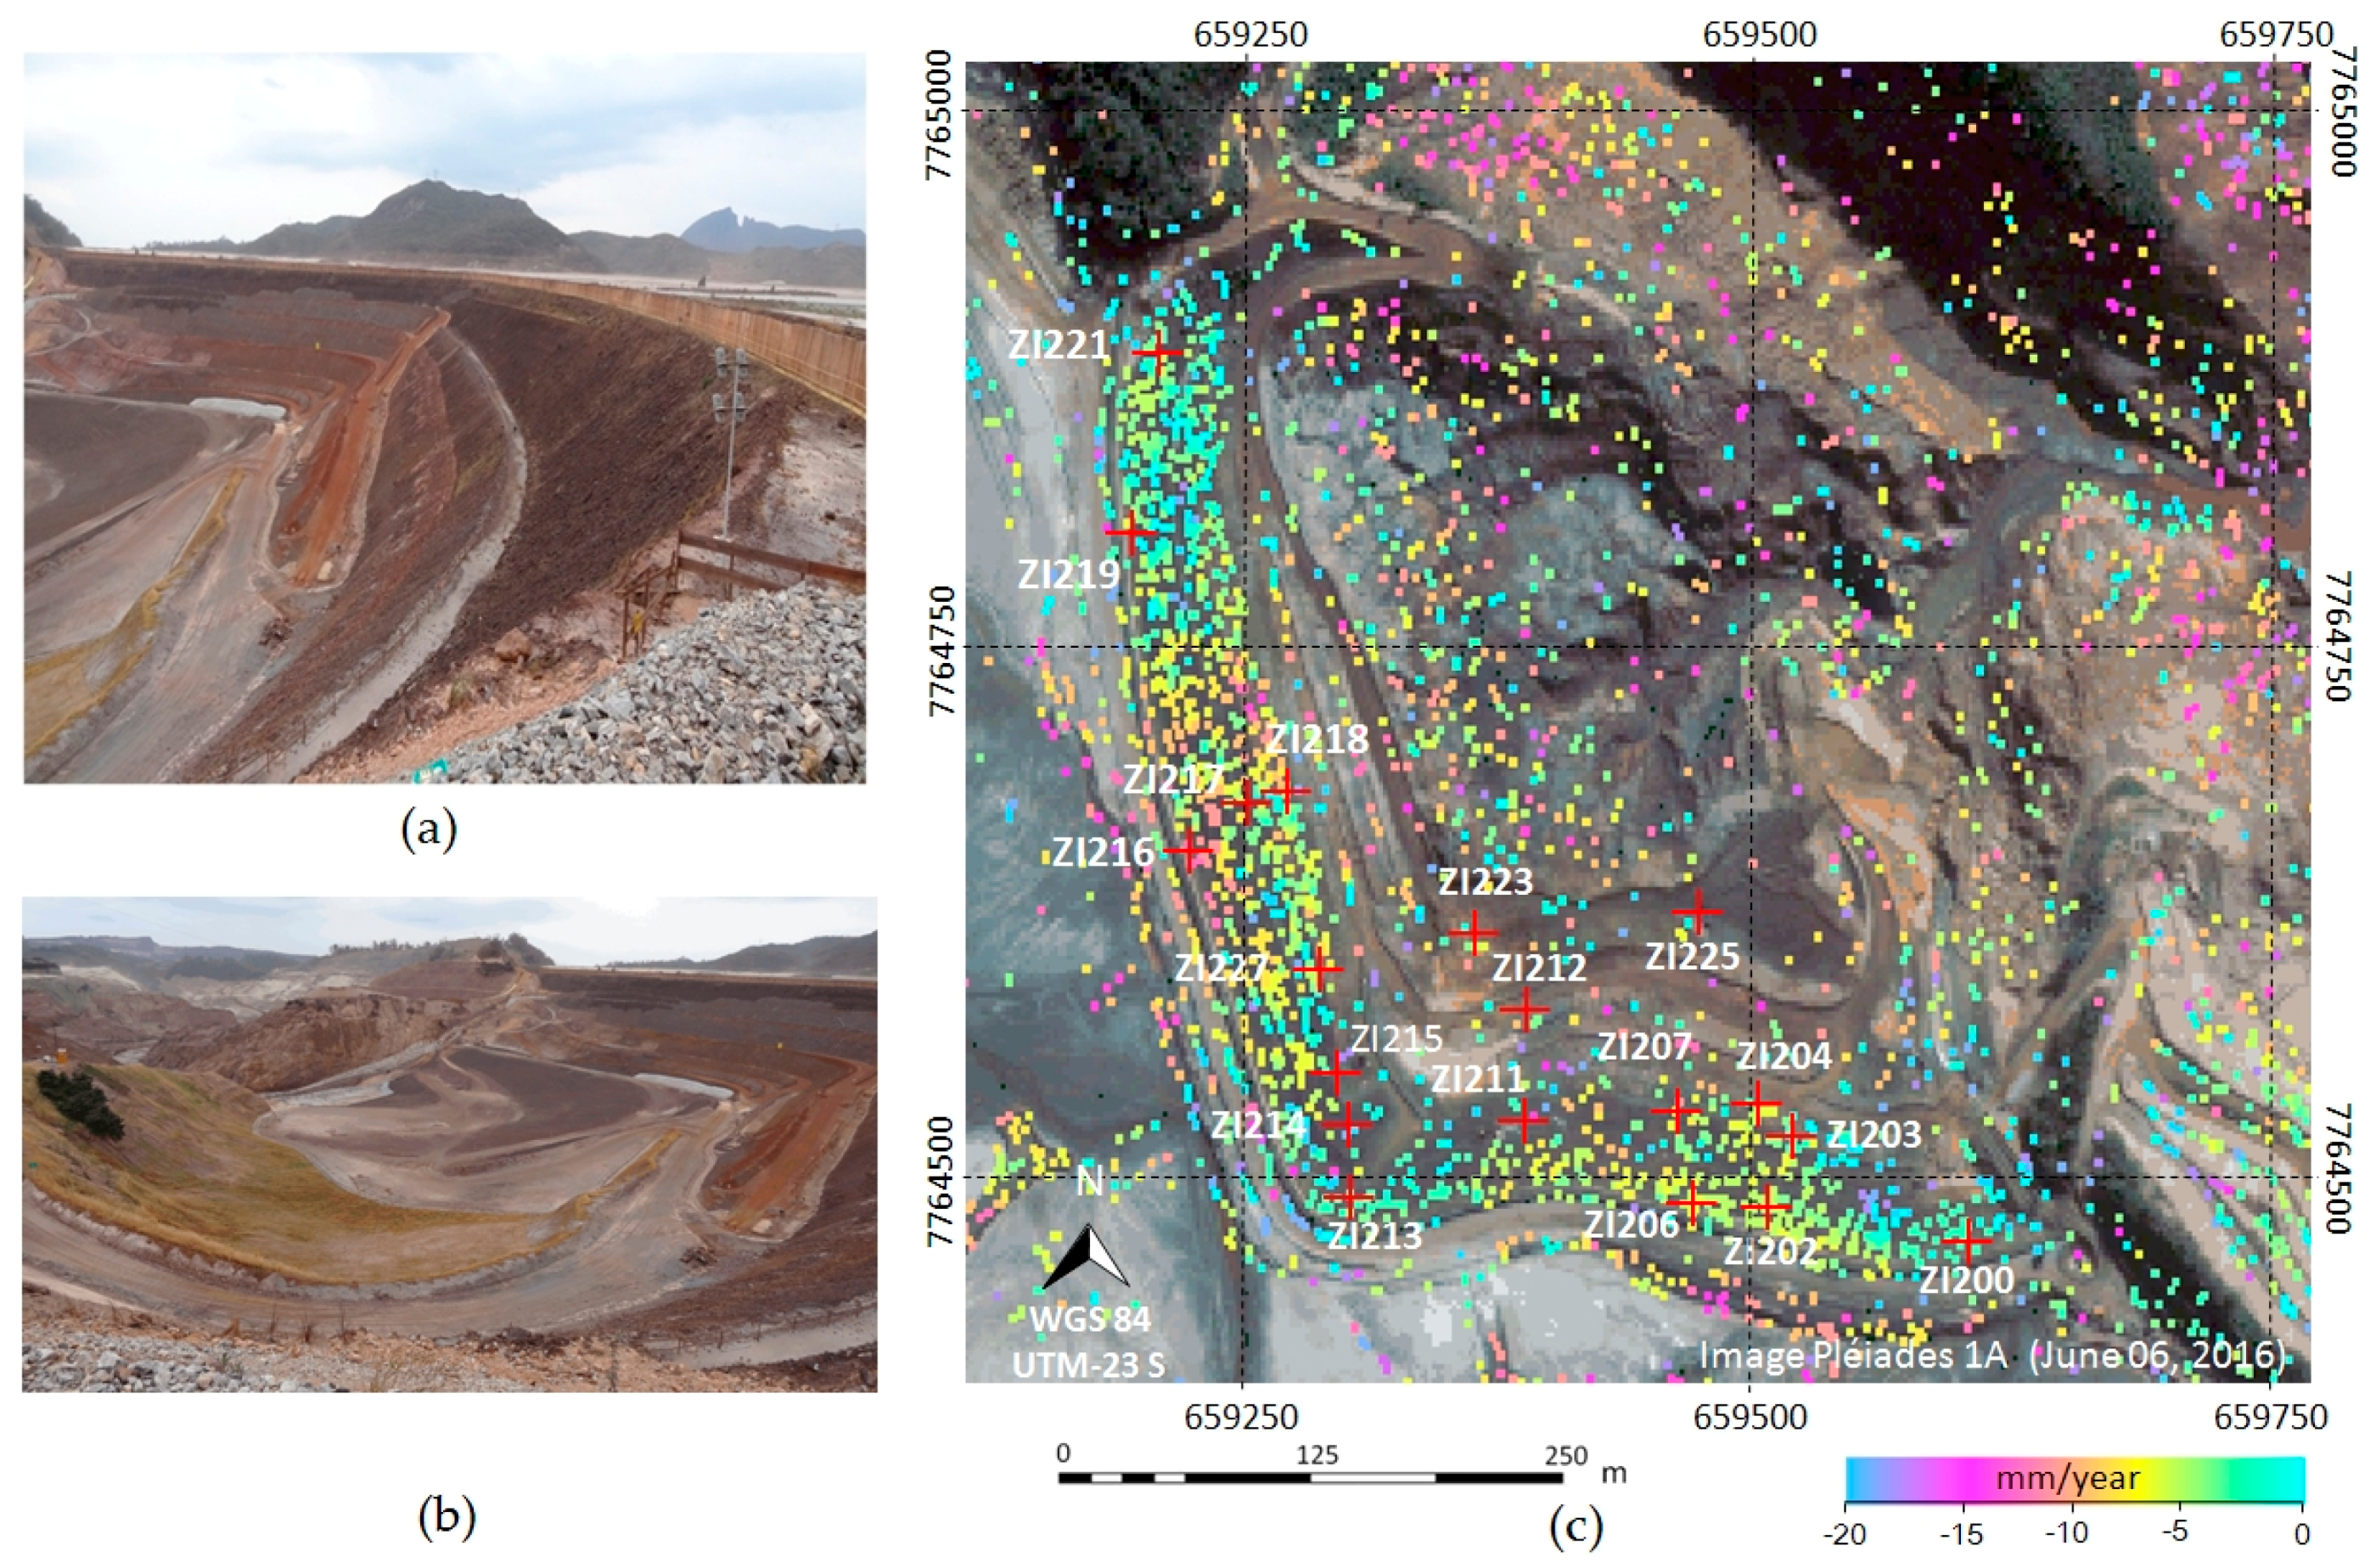
Figure 9 shows field pictures of the main wall of the Germano dam divided into three sectors: the upper sector (a), steepest sector (b), and buttress sector (c). 
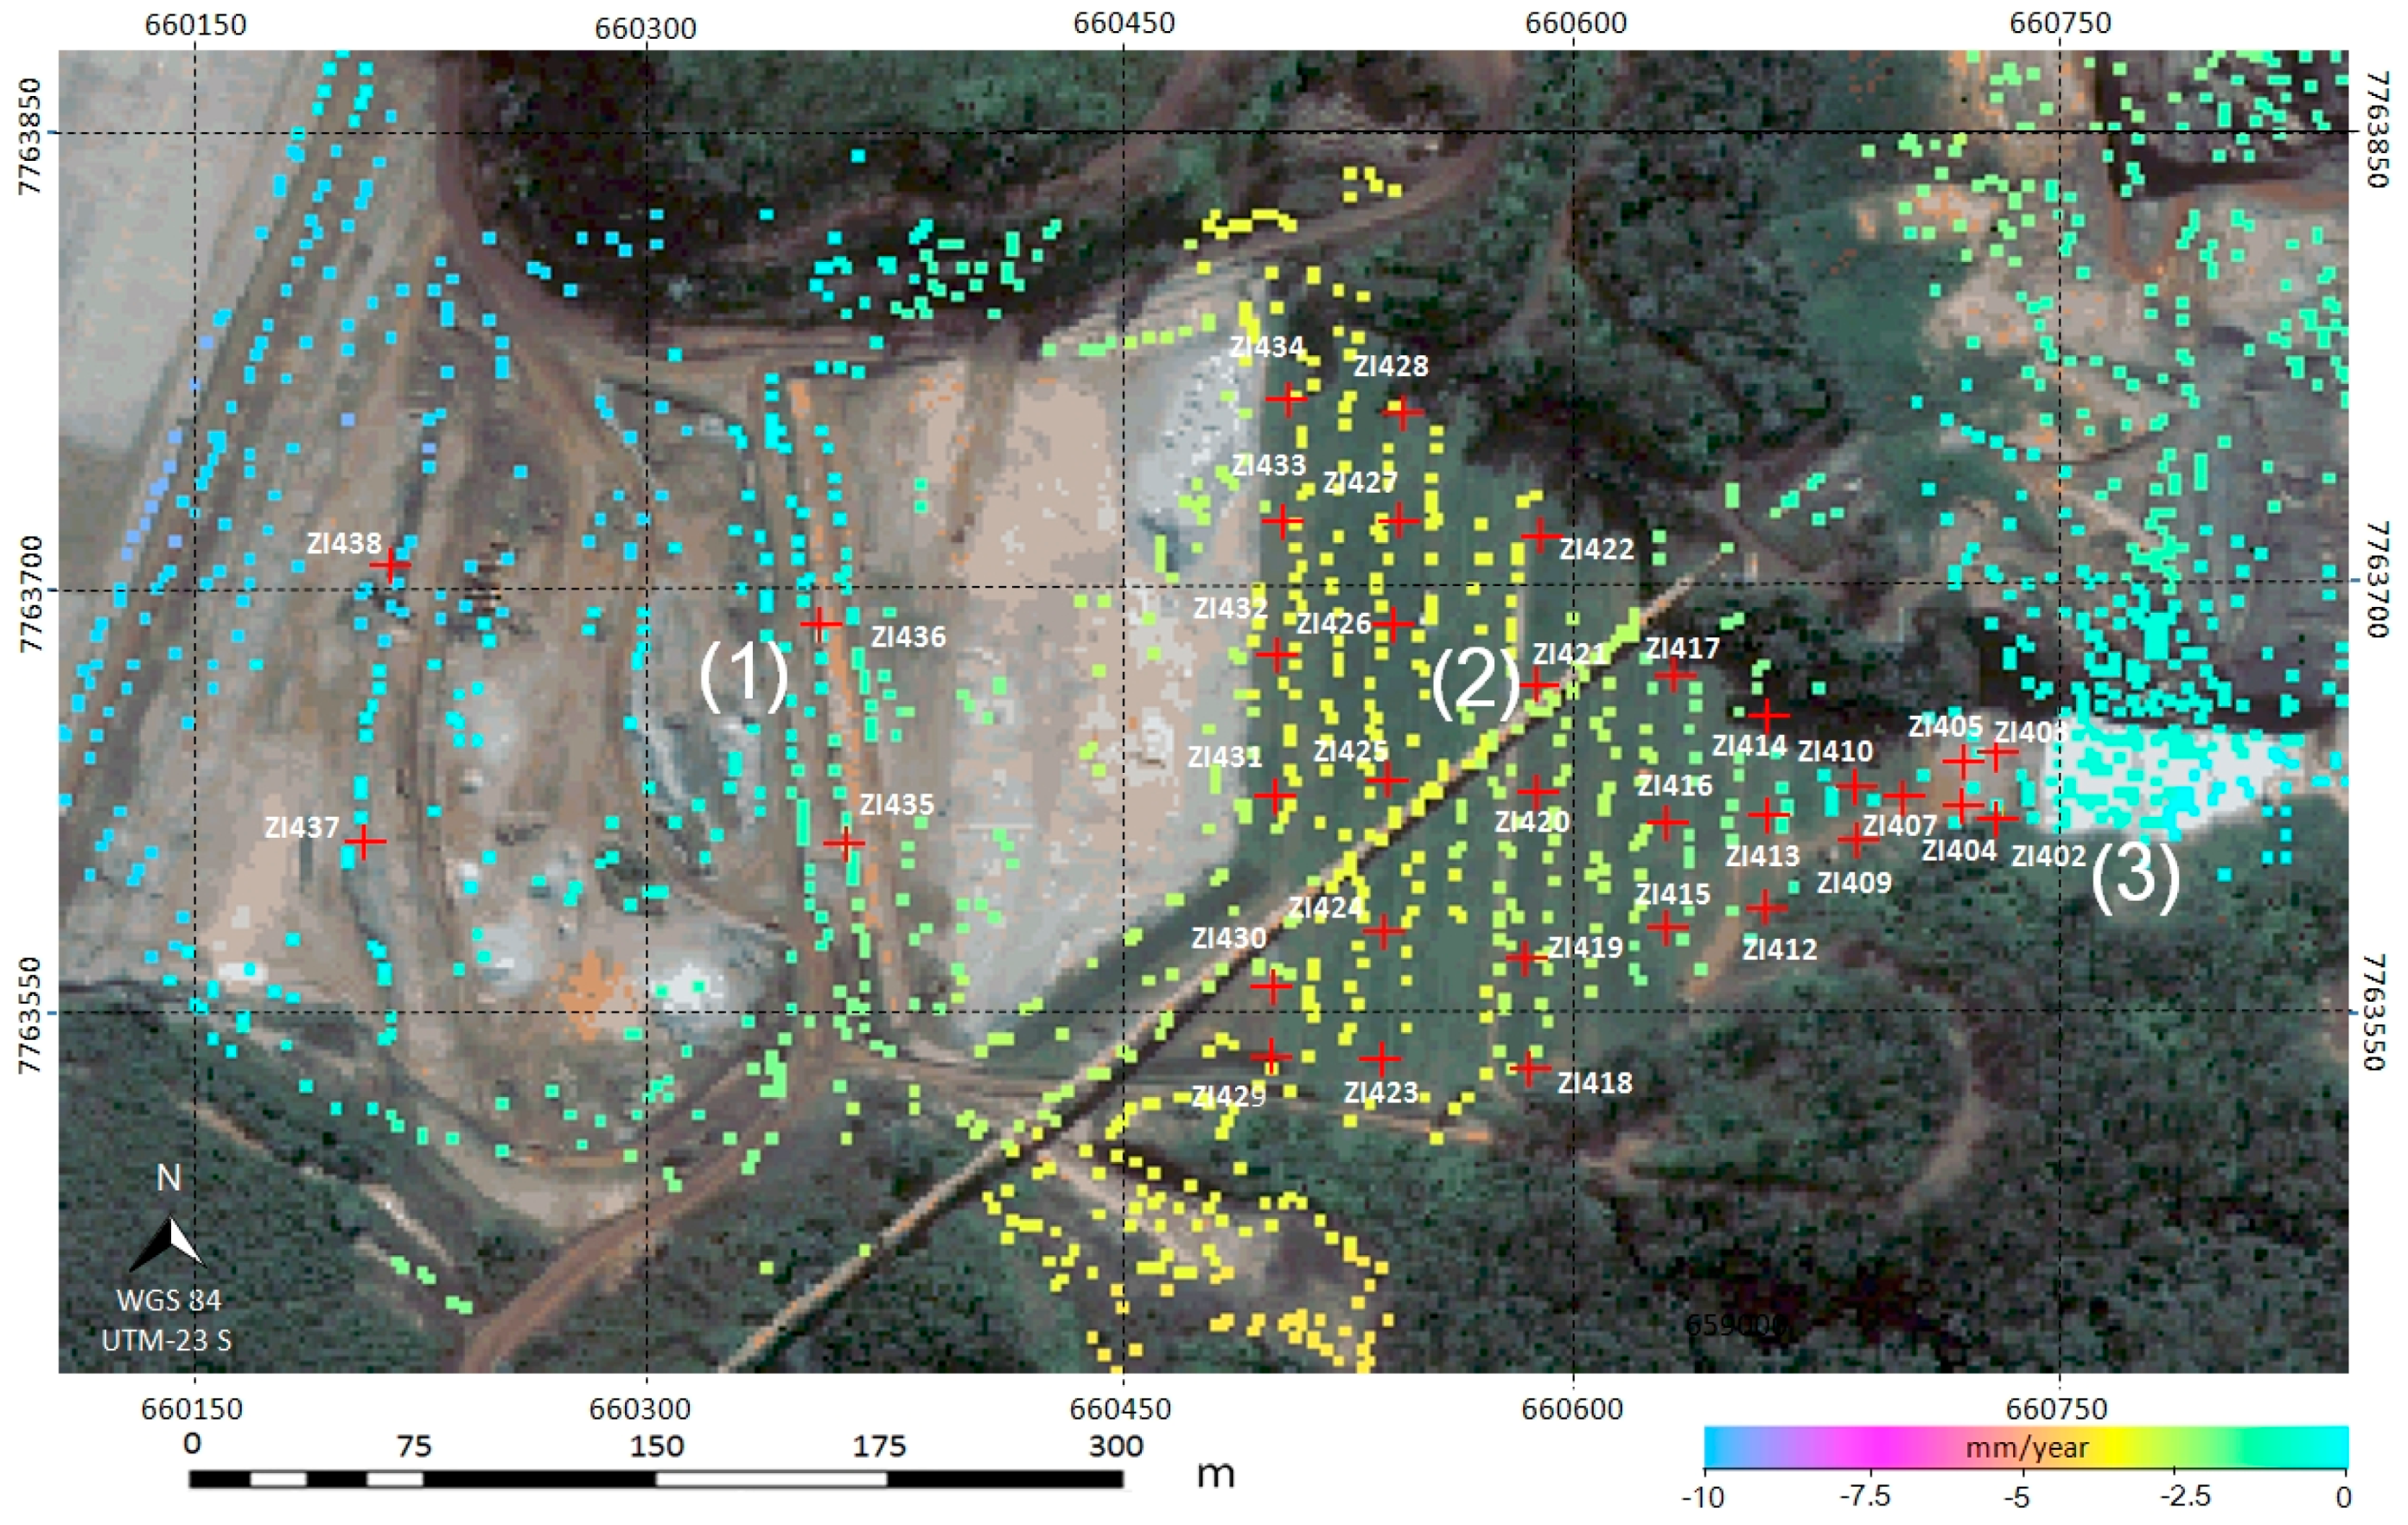
Figure 10 shows the ground displacement map of each sector with the positions of the 34 prisms located along the wall.
The main wall region of the Germano dam did not suffer a direct impact of the rupture of the Fundão dam, like those suffered by the dikes of Sela & Tulipa and Selinha, whose mining waste material of Fundão reservoir made direct contact with these dikes. Figure 10 shows the map of the ground displacement in three sectors of the main Germano dam: the upper sector (1), steepest sector (2), and buttress sector (3). Patterns of stability can be seen in these three sectors, with the sector (1) showing a very small displacement rate. The PSI results were compared with in situ topographic measurement with robotic station as shown in Figure 11.
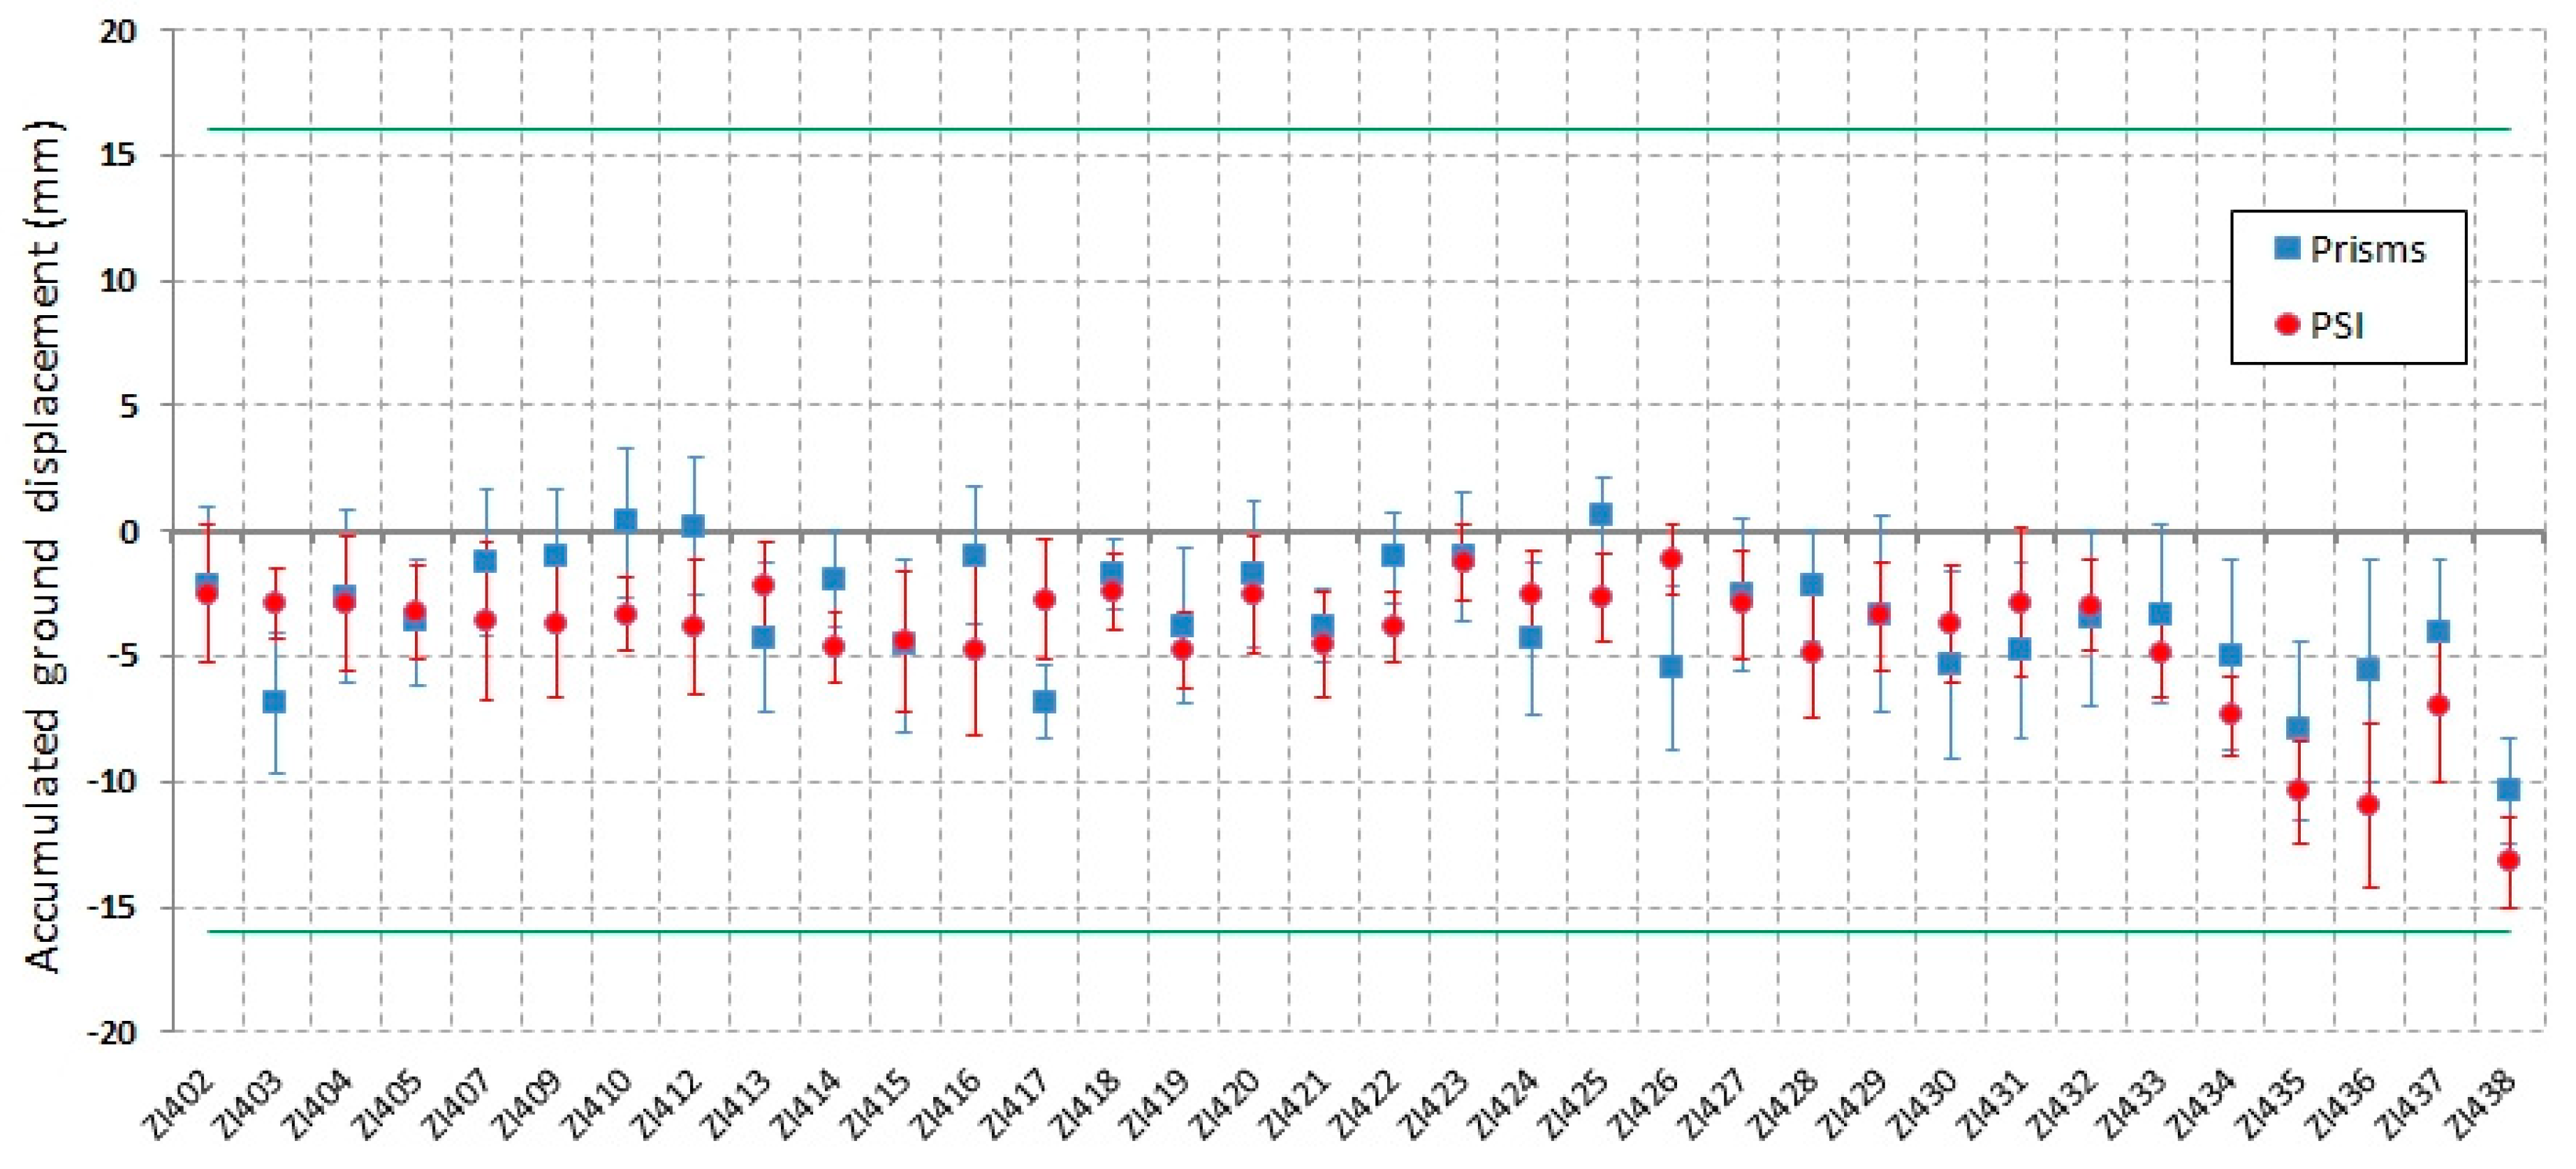
Figure 11 shows the box plot of the accumulated displacement (projected in LoS) and standard deviation for the 34 prisms monitored with robotic station during the period of 11 November 2015 to 15 May 2017 in the main Germano dam (Figure 10). All prisms presented accumulated displacements within the error limit (±16 mm). PSI results also exhibited low accumulated displacements for the 34 PS analyzed (closed to the prisms positions), showing values also within error bar limits. The results shown in Figure 11 indicate stability in the main Germano dam during the time interval of the analysis (11 November 2015 to 15 May 2017) according to the safety criterion used by the geotechnical team of the SAMARCO Company.
The points ZI435, ZI436, ZI437, and ZI438 with more pronounced accumulated displacement are located in the sector 1 (Figure 10), corresponding to the dam sector constructed with a compact mixture of sand and silt-sized particles (Figure 9a), that suffered an accommodation due to the traffic of heavy vehicles, and no deposition of material during the period of the analysis.
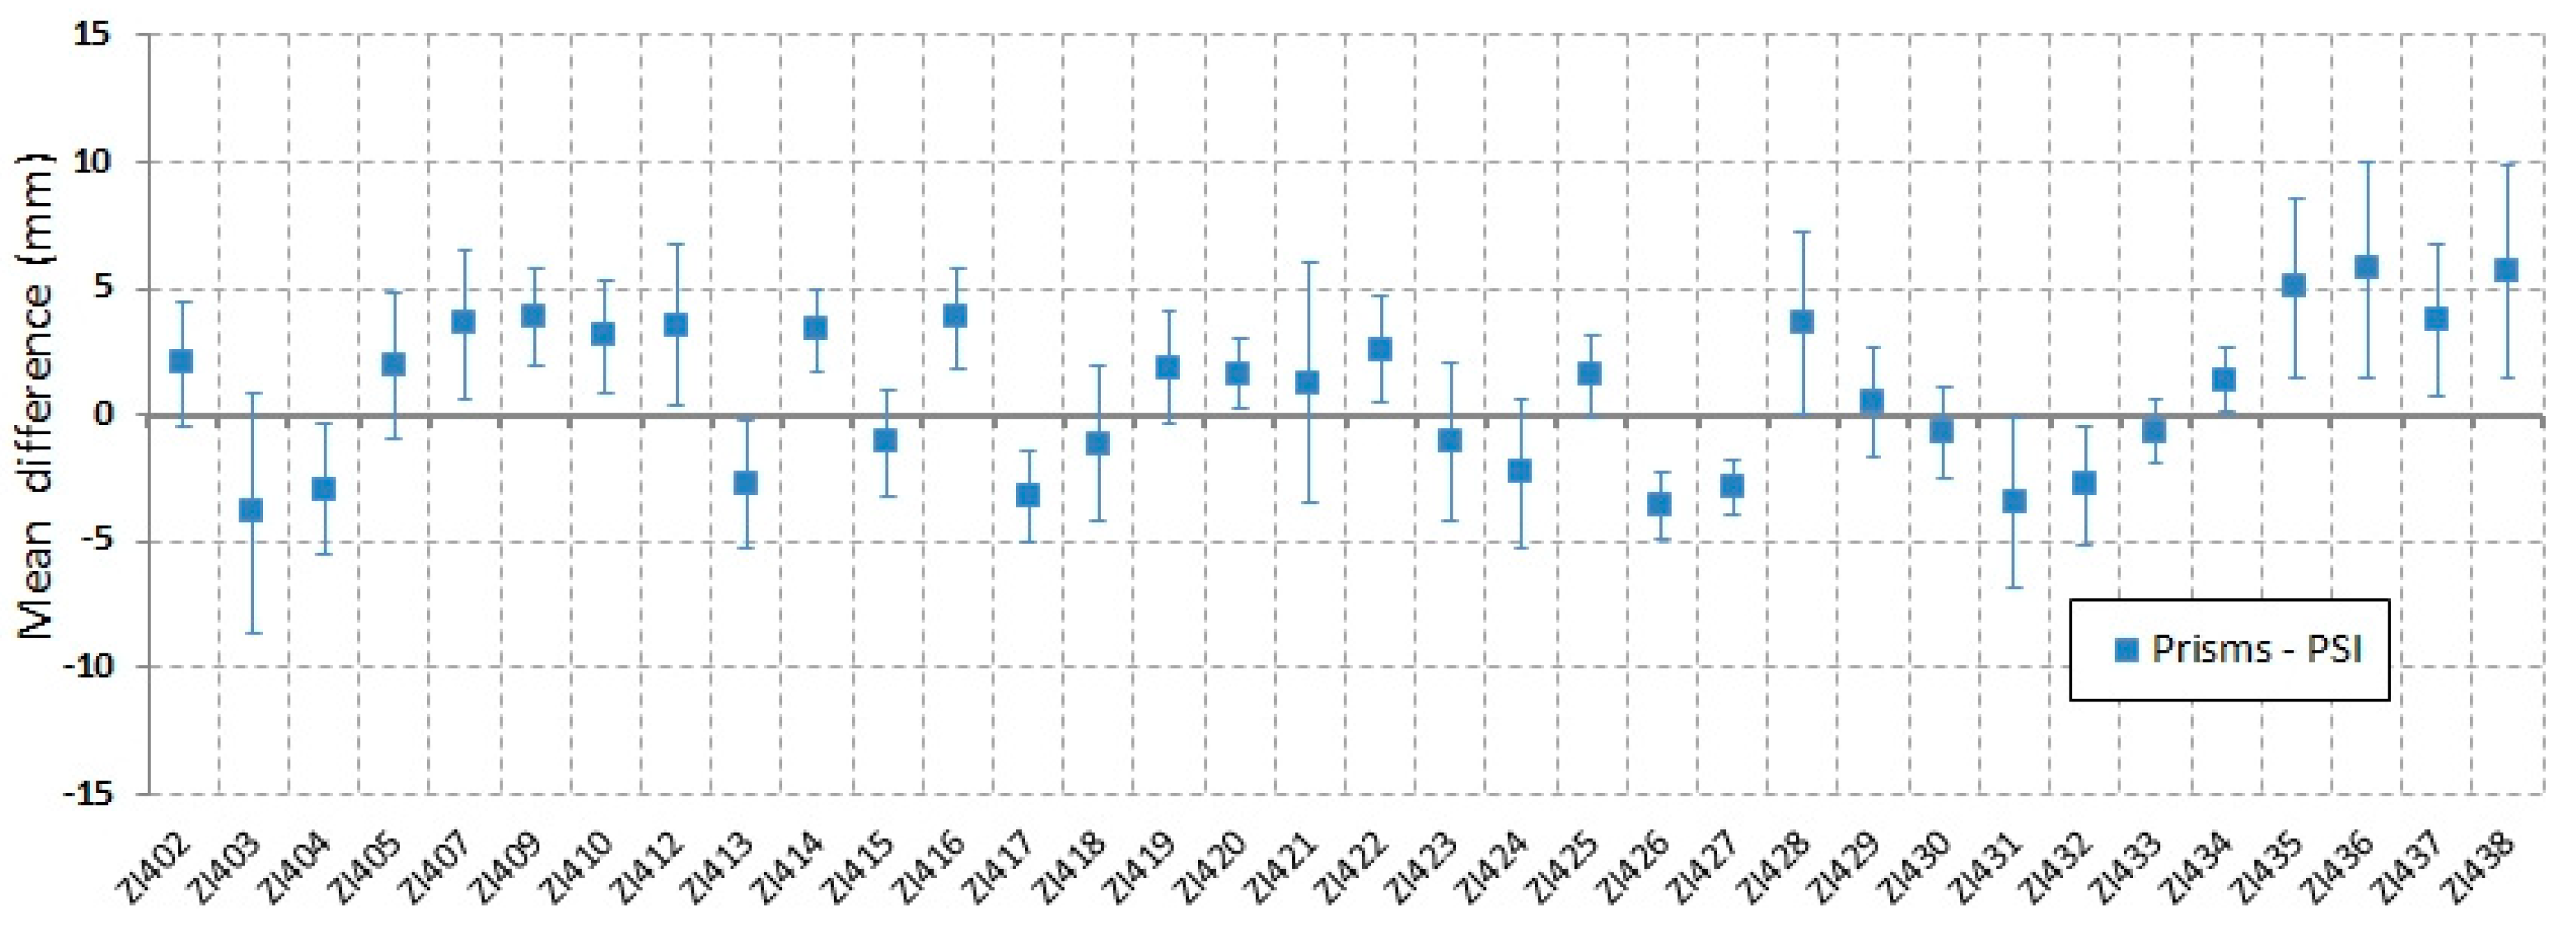
A box plot of the mean difference and standard deviations of the measurements (topographic minus PSI), performed during the period of 11 November, 2015 to 15 May 2017, is shown in Figure 12. Some points (ZI403, ZI431, ZI435, ZI436, ZI437, and ZI438) presented significant discrepancy between the two methods. This could be explained by the intrinsic errors of the topographic data collection (including adverse weather conditions, dust and haze during dry and wet seasons impairing the visibility among station and prisms, distinct operator teams, etc.), the intrinsic errors of the PSI processing, as well as the PS positioning that does not exactly match the prisms (the PS selection was based on the nearest neighbor of the prism).
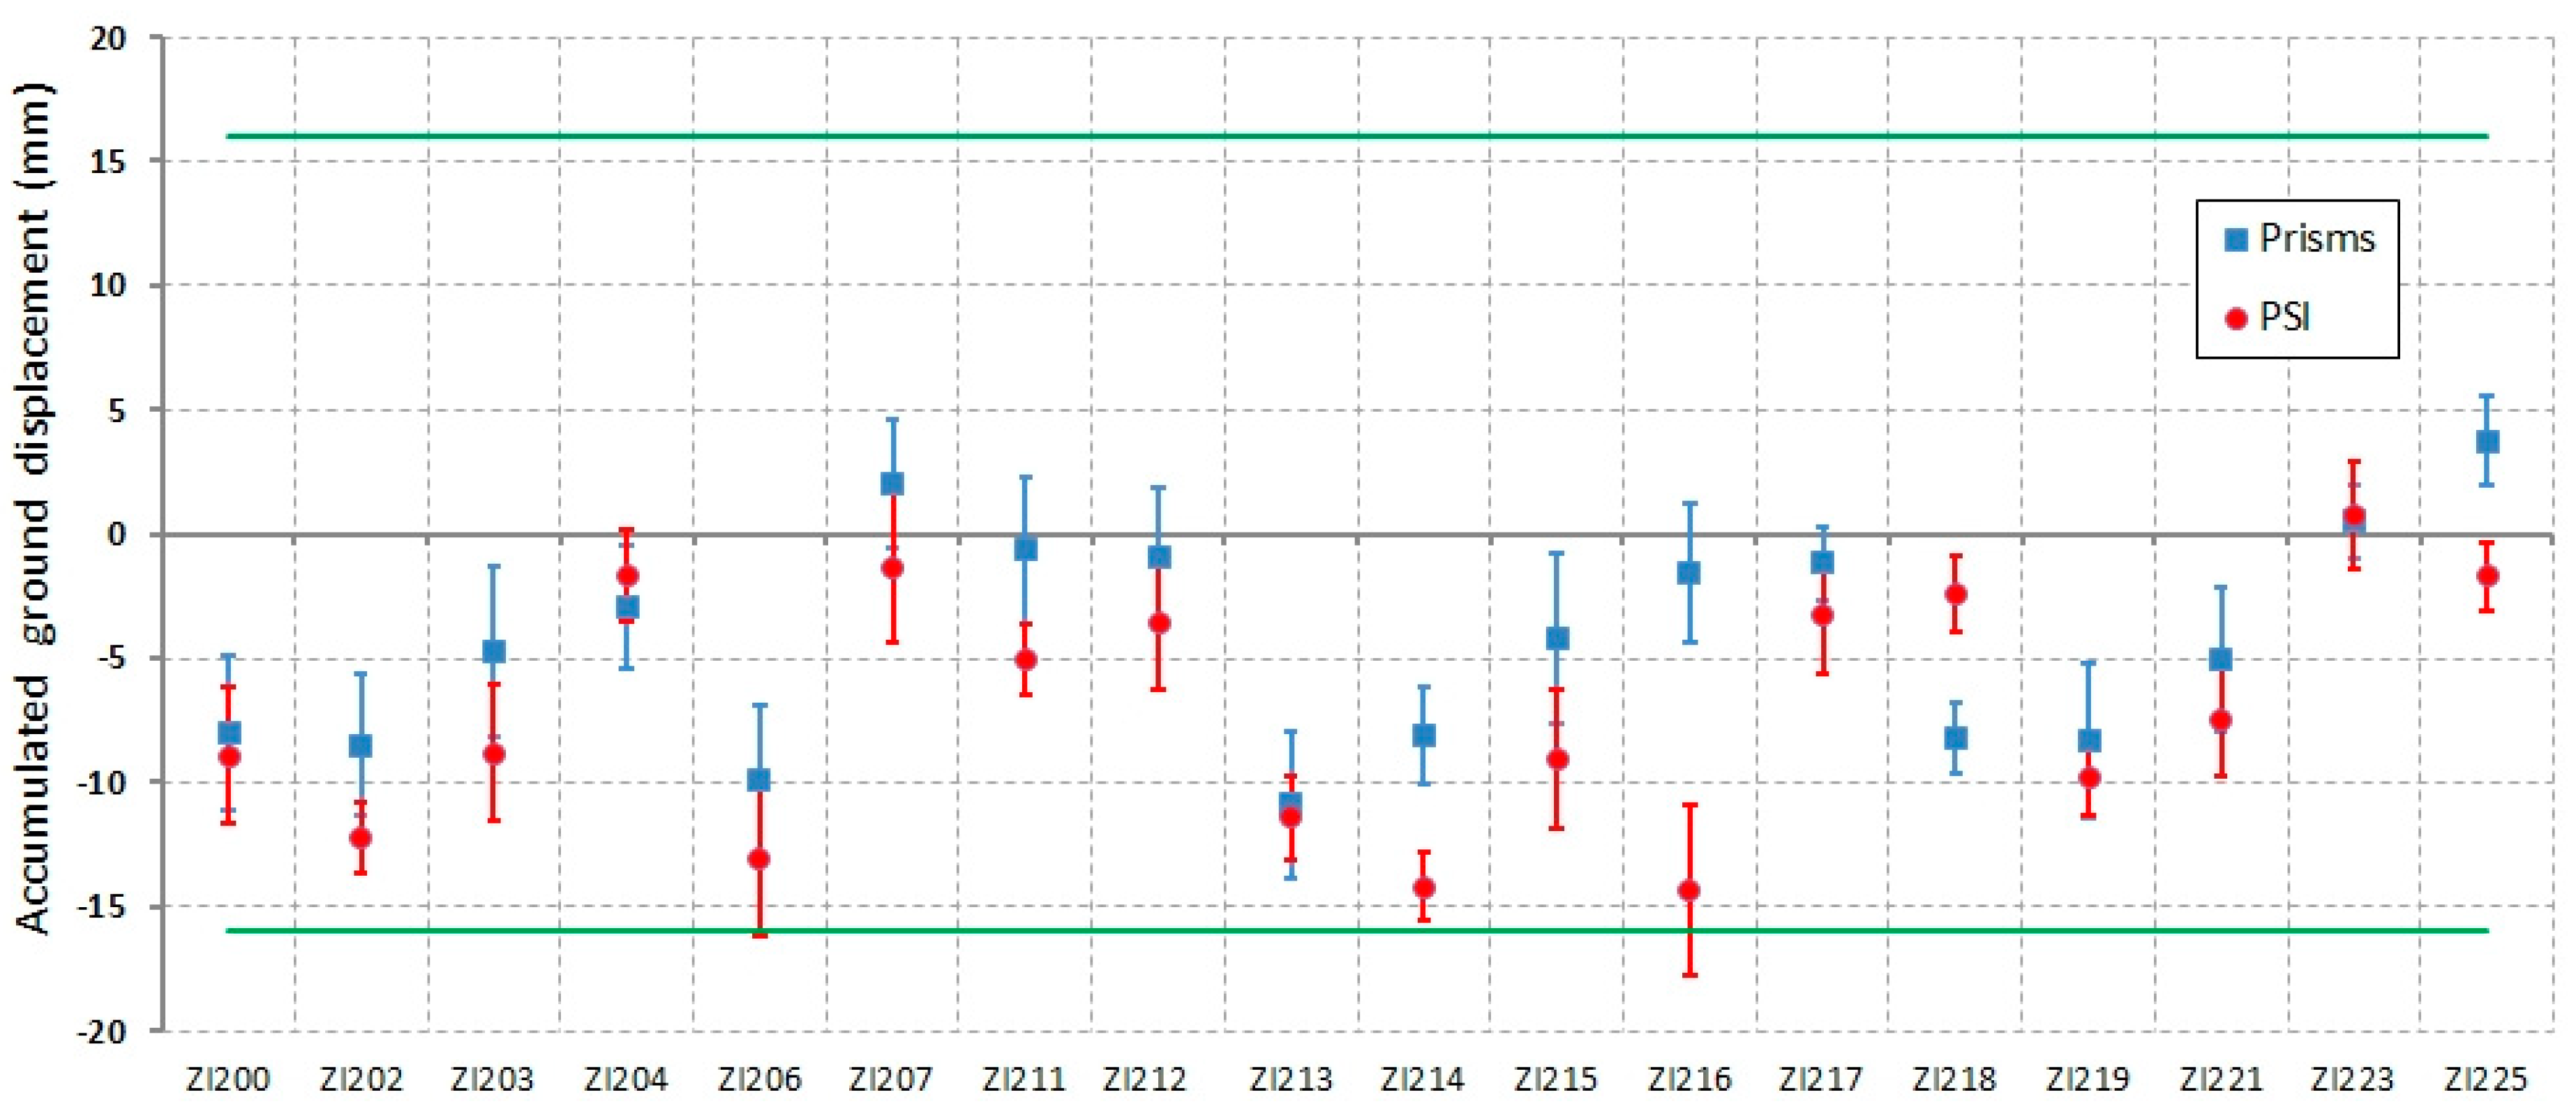
Figure 13 shows the Sela & Tulipa dike with details of the field pictures of the wall (upper picture), the empty Fundão reservoir (lower picture), and the ground displacement map of the dike and surrounding area, with 18 points of in situ topographic measurements.
Figure 14 shows a box plot of the accumulated displacement and standard deviations for the 18 points monitored with robotic station and the PSI results in Sela & Tulipa dike, performed during the period of 11 November 2015 to 15 May 2017. All prisms presented accumulated displacement within the error limit (±16 mm). PSI results also exhibited low accumulated displacements for the 18 PS analyzed (closed to the prisms positions), showing values also within the error limits.
Several points in the Sela & Tulipa dike (ZI200, ZI202, ZI206, ZI2013, ZI214, ZI215, ZI216, and ZI219) presented a more pronounced ground displacement for both measurements techniques, but were still within the error limits This could be explained by the fact that after the disaster, this dike was reinforced, and the material placed on it had been compacted during the period of the analysis. This fact did not compromise the stability of this structure, according to the geotechnical team of the SAMARCO Company (Mariana, Brazil).
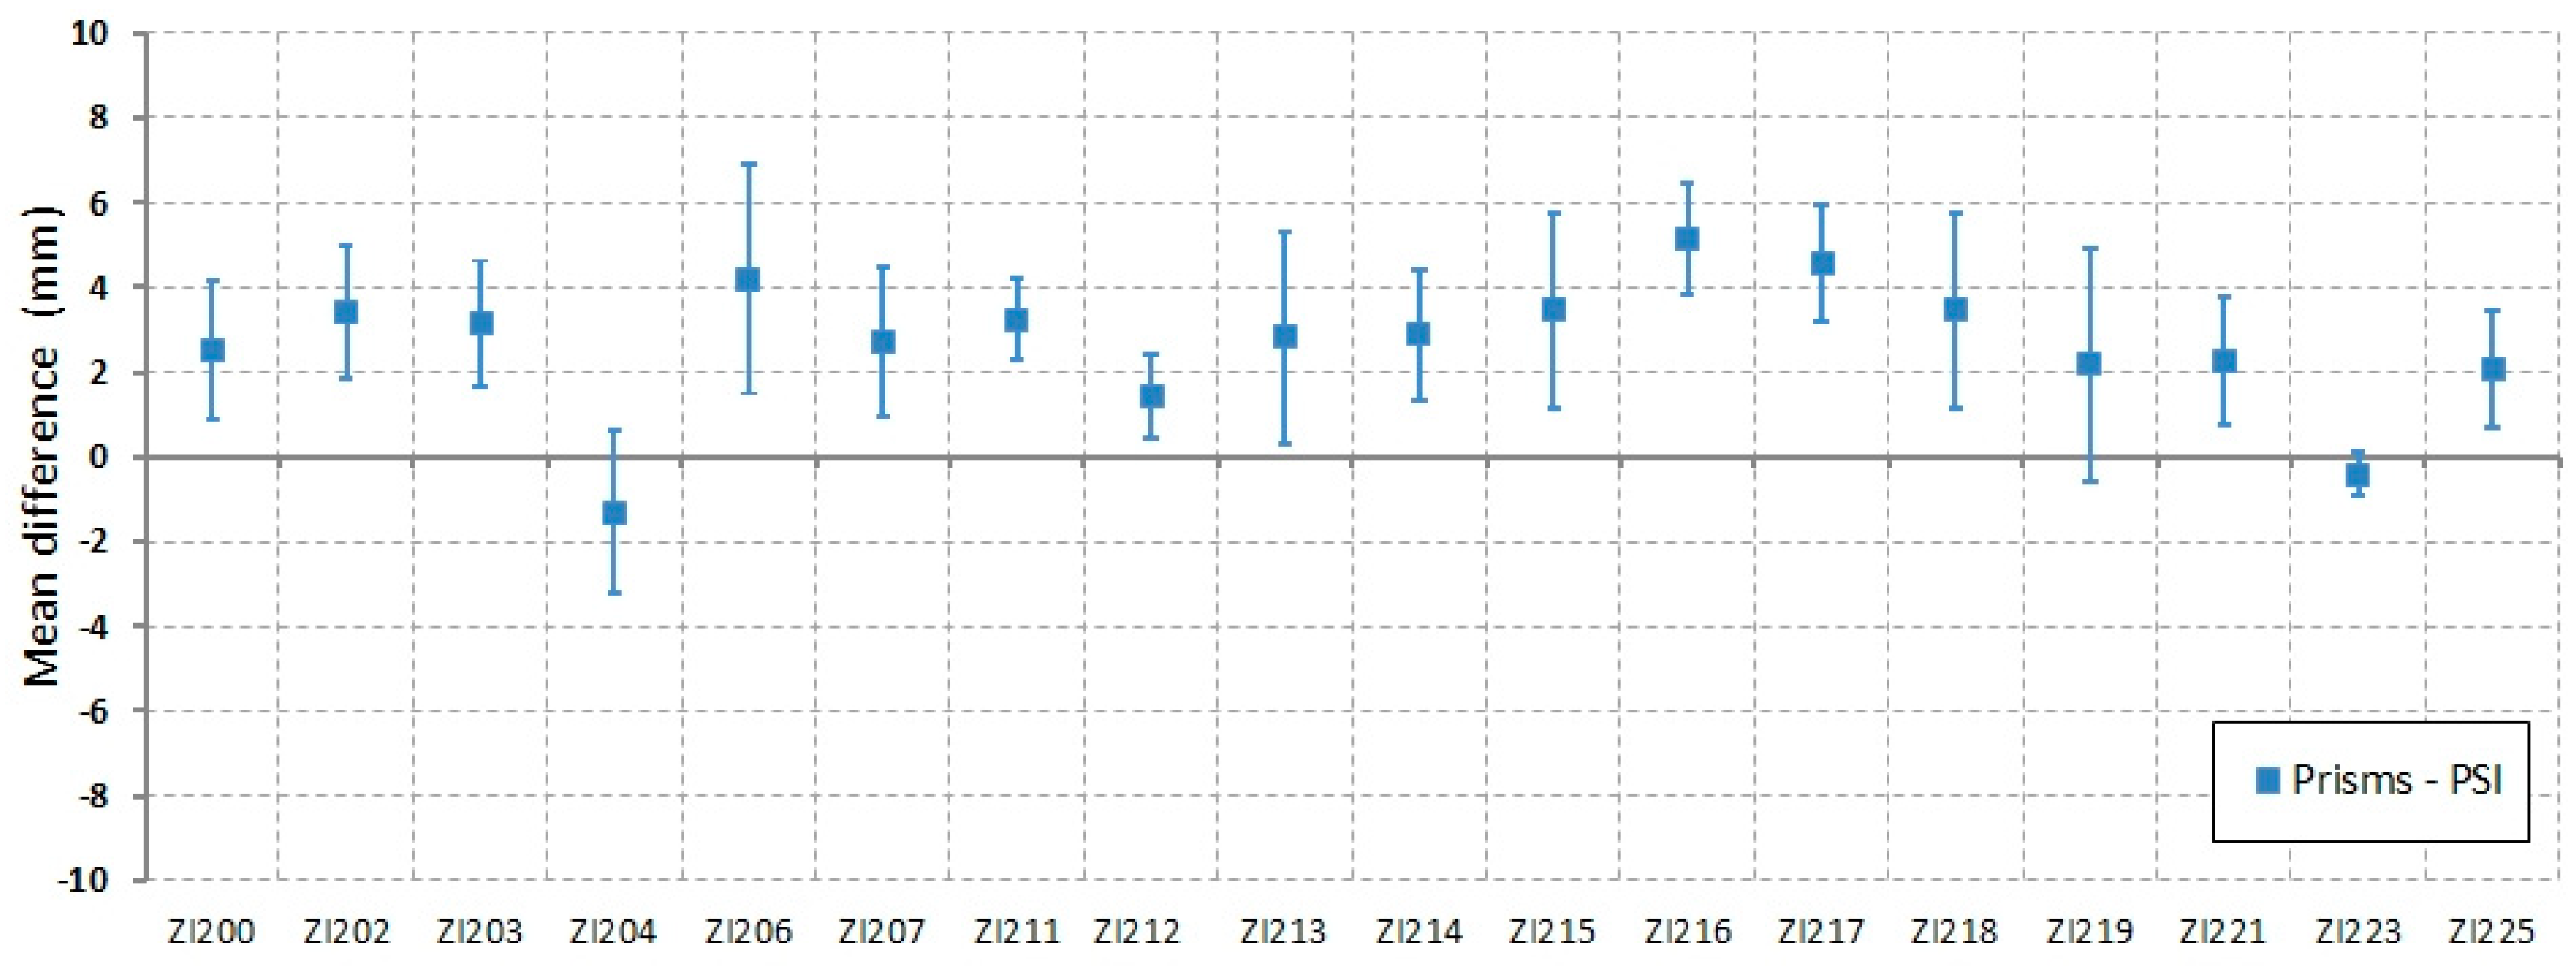
A box plot of the mean difference and standard deviation of the measurements (topographic minus PSI) performed during the period of 11 November 2015 to 15 May 2017 is shown in Figure 15 for the Sela & Tulipa dike. Some points (ZI206, ZI216 and ZI217) presented significant discrepancy in mean value difference between the two methods; a possible reason for this was already explained for the results presented the Figure 12. It can be noticed in Figure 15 that the mean values of the differences are slightly smaller than those shown in Figure 12, probably due to the denser grid of PS in the wall of Sela & Tulipa dike, meaning smaller distances between prisms and PS positions.
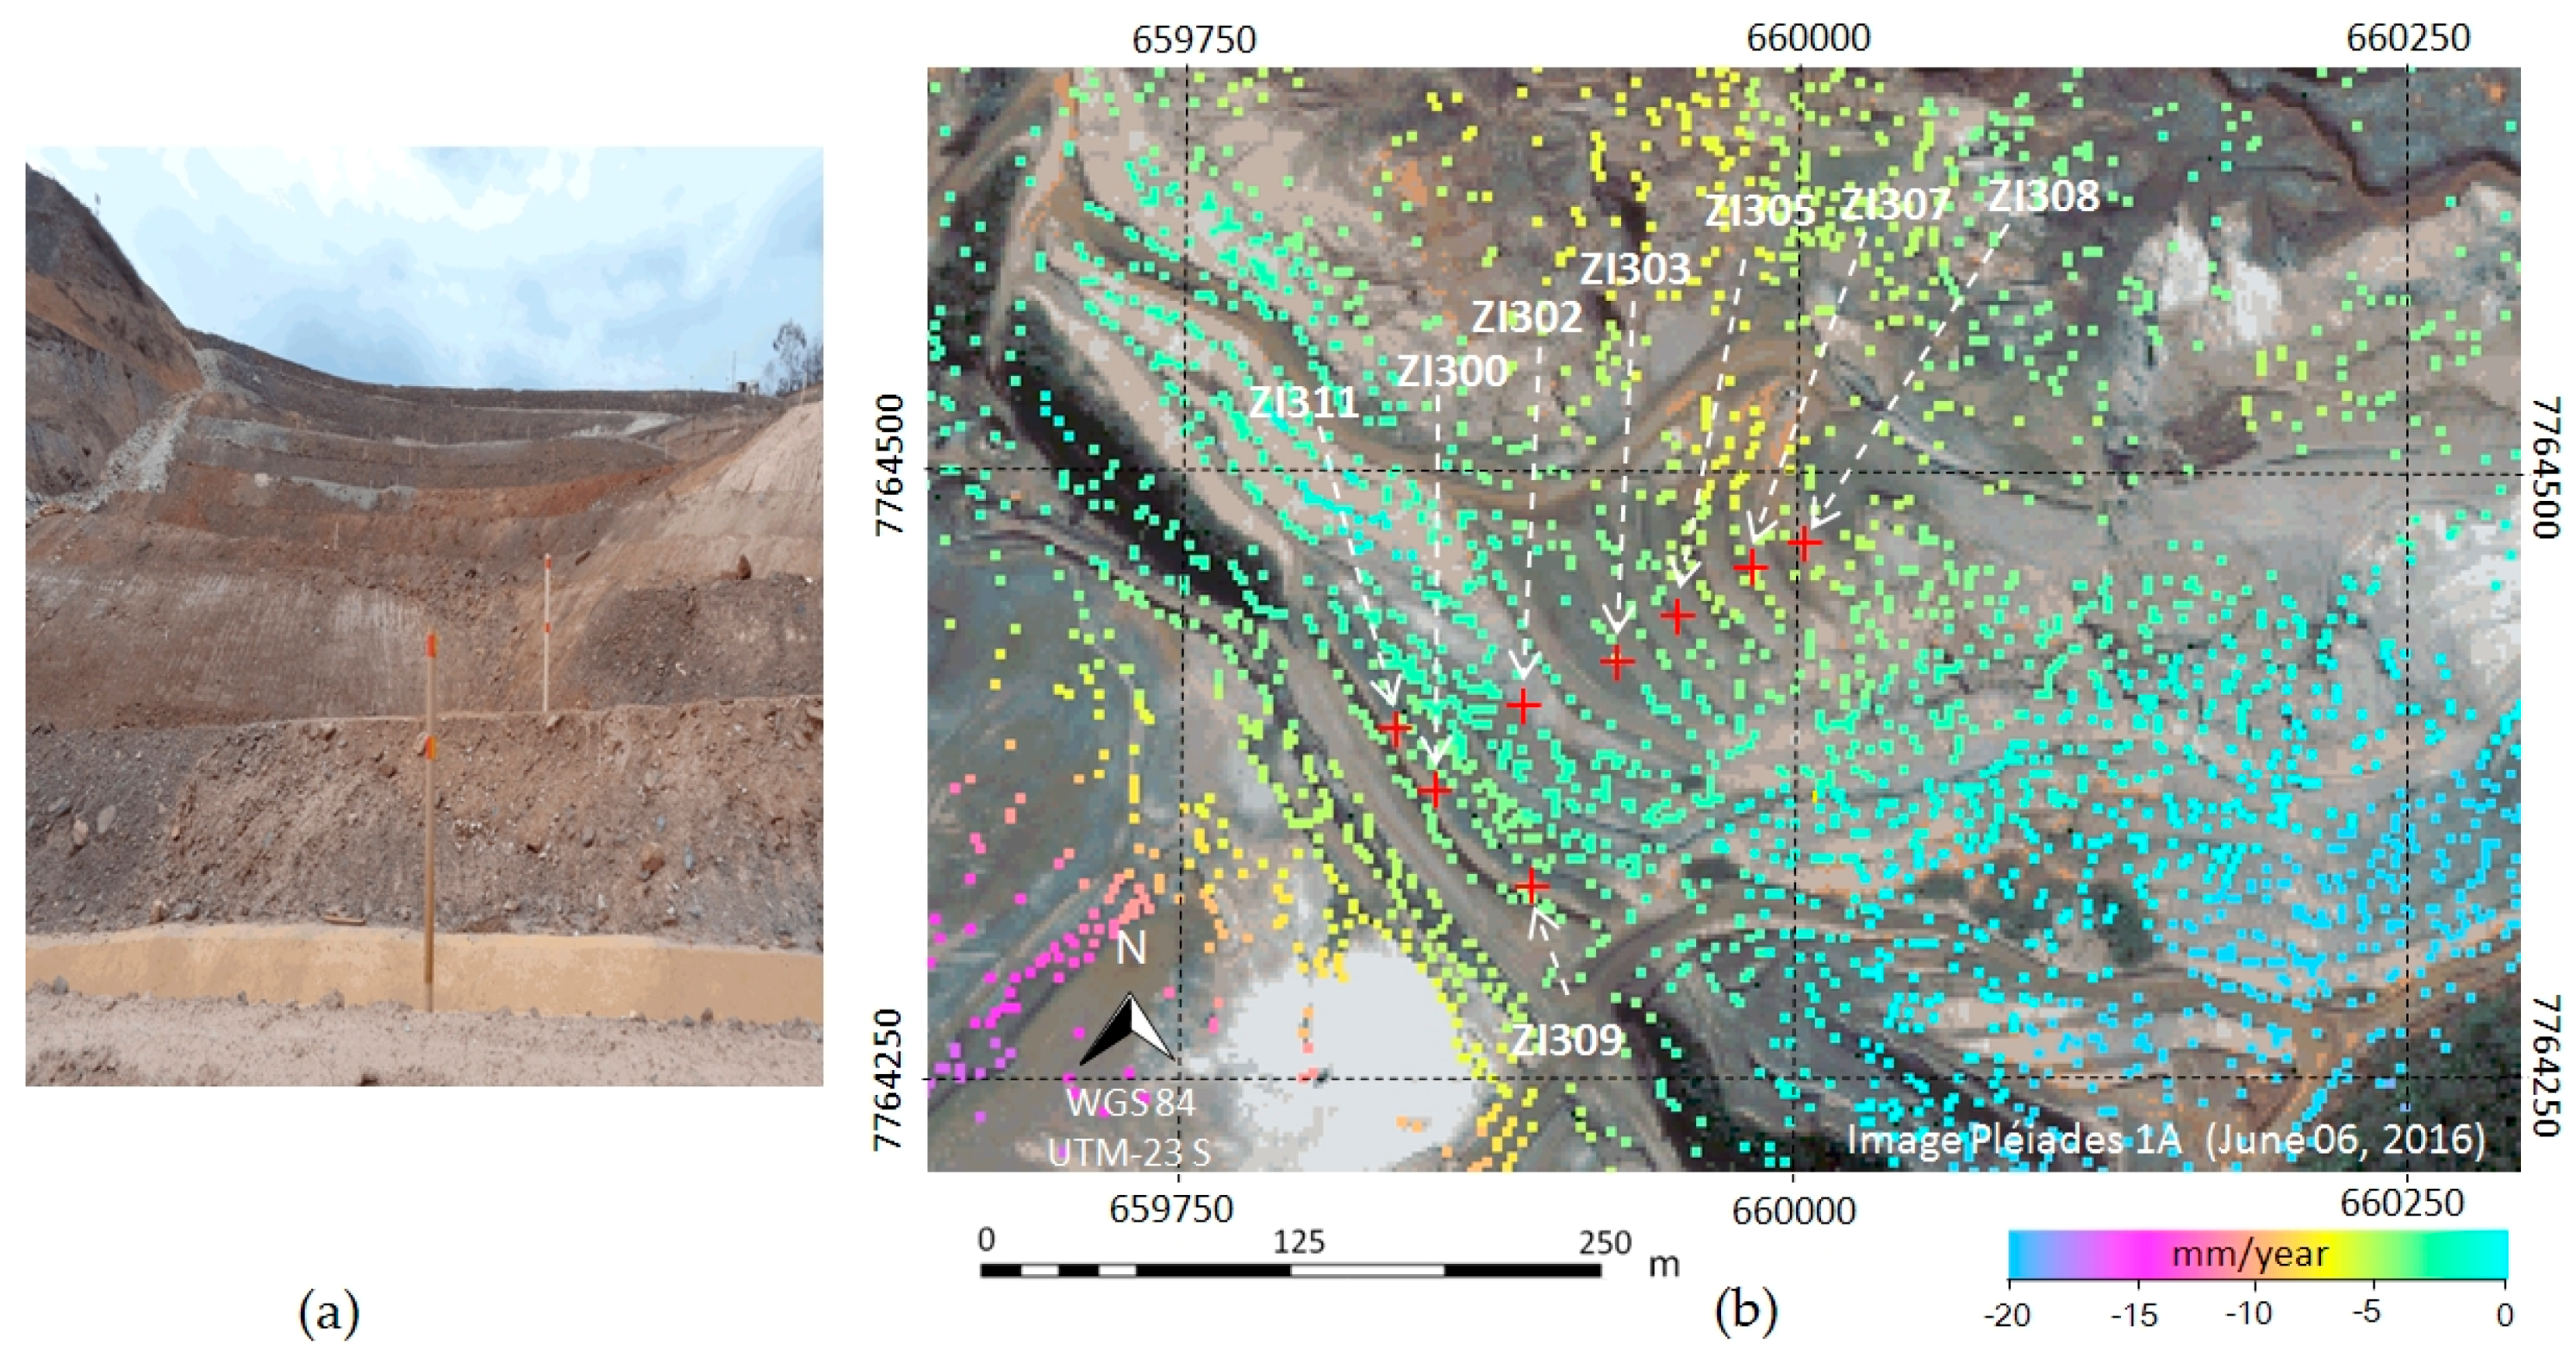
The Selinha dike is shown in Figure 16, with a field picture of the wall (a) and the ground displacement map of the dike and surrounding area, with the location of 8 points of field topographic measurements (b). The comparison between the topographic measurements and the PSI results are presented in Figure 17.
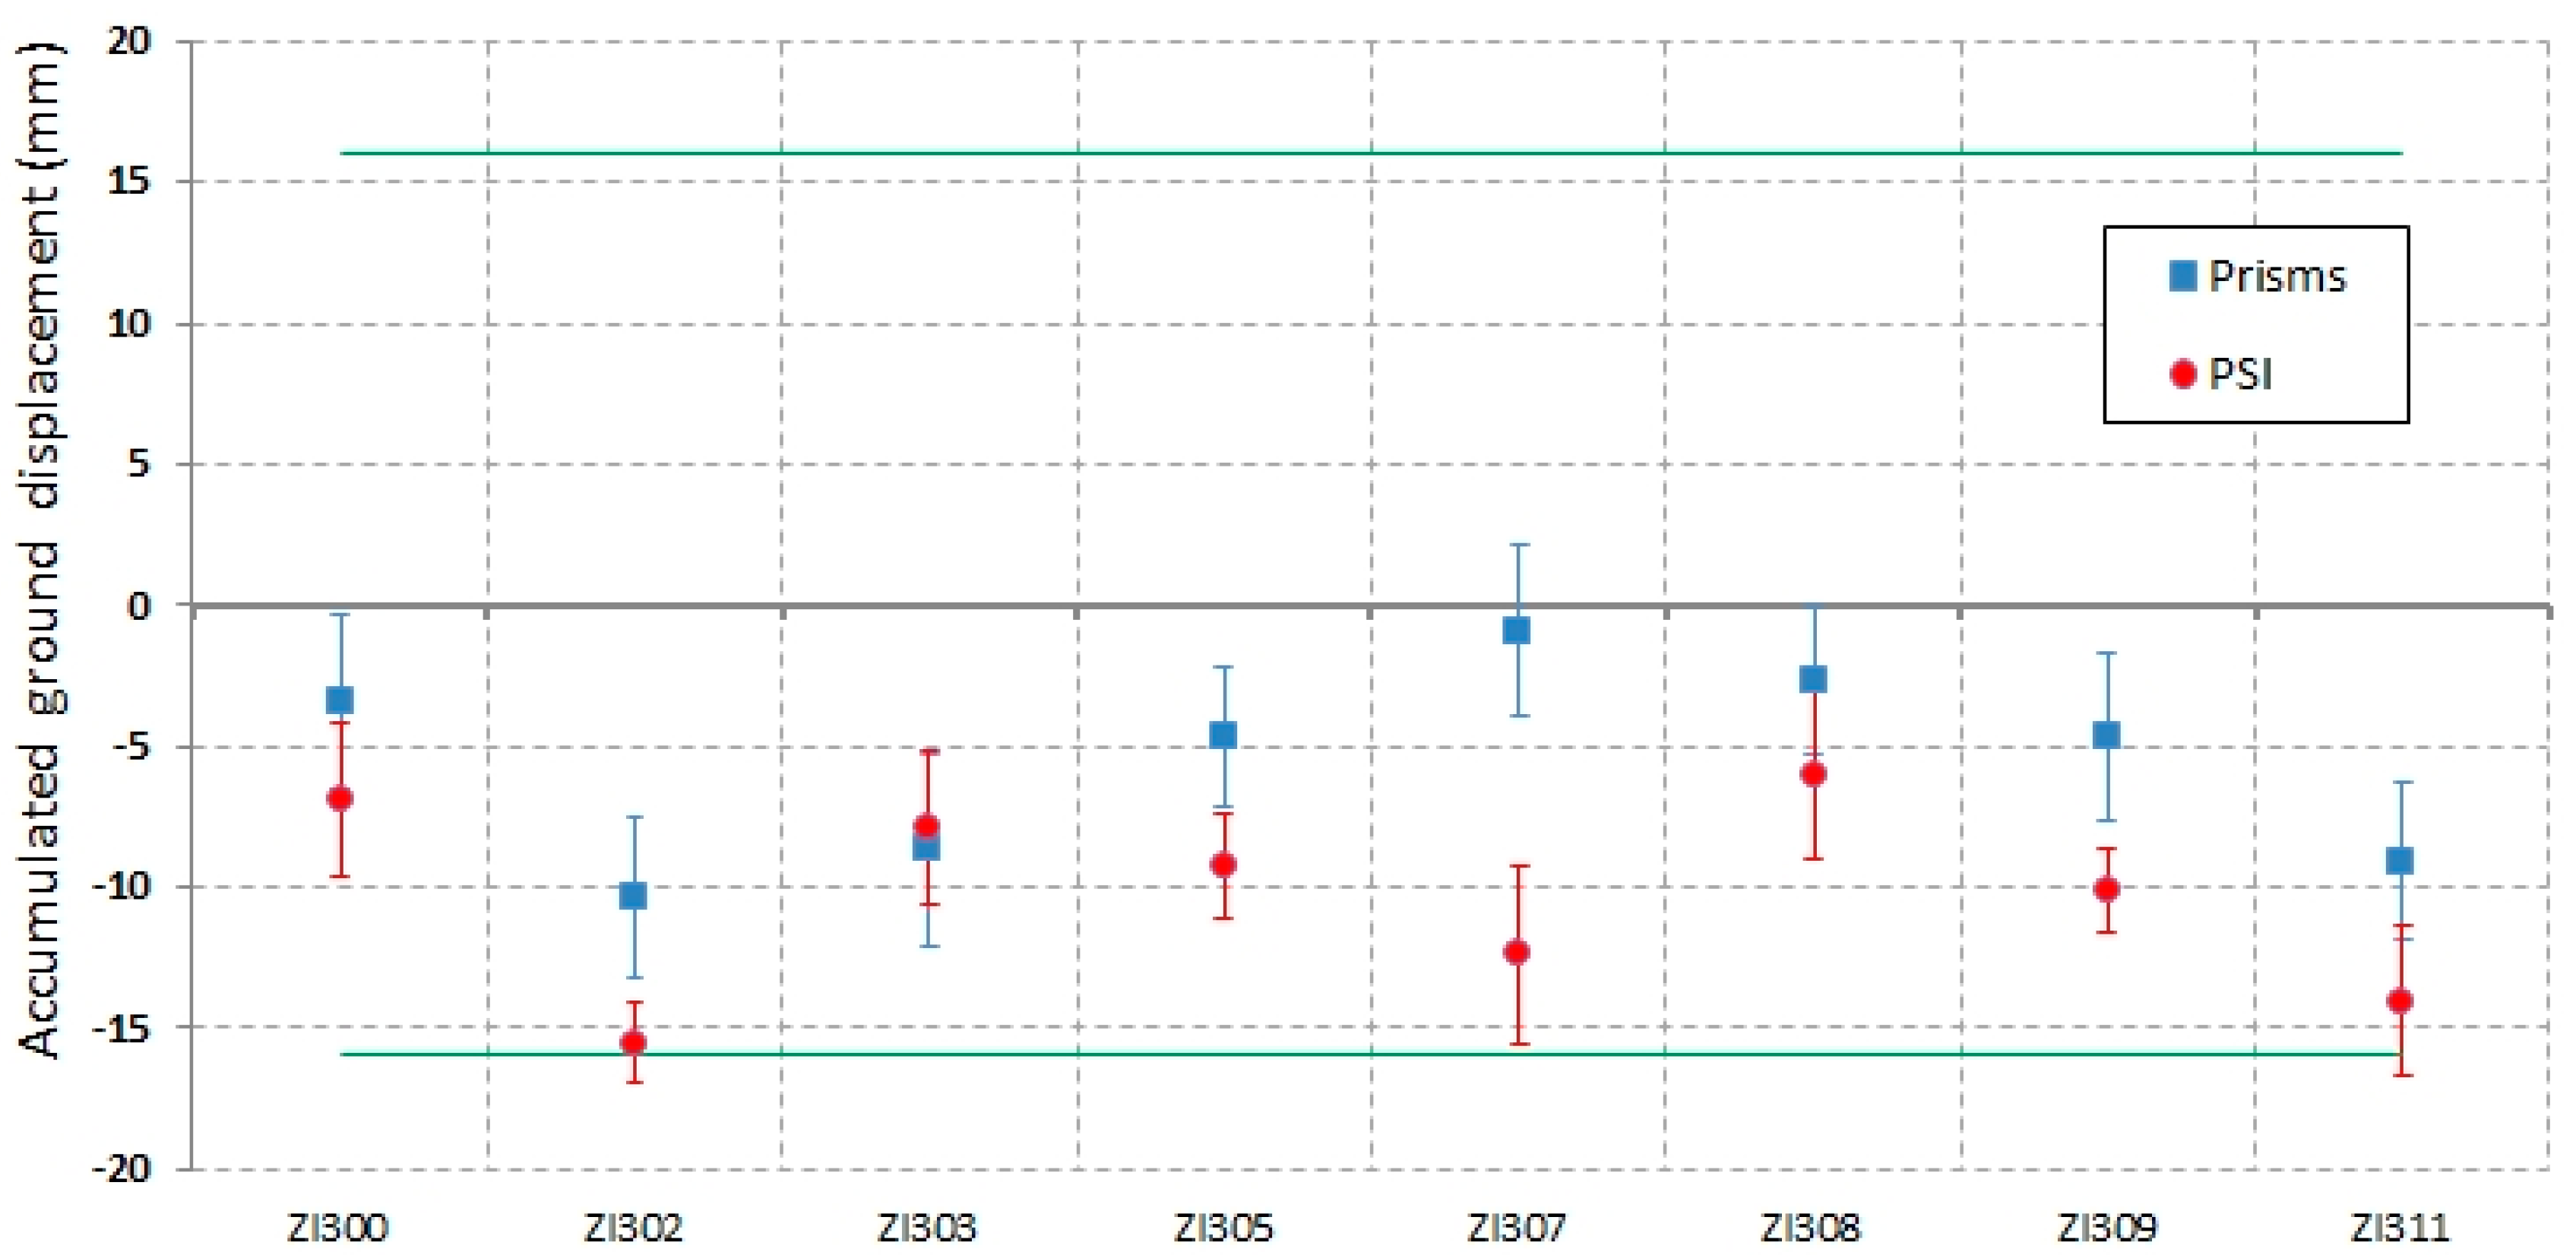
Box plot of the mean difference and standard deviation of the measurements (topographic minus PSI) performed during the period of 11 November 2015 to 15 May 2017 is shown in Figure 17 for Selinha dike. All prisms presented accumulated displacement within the error limits. PSI results also exhibited low accumulated displacement for the 8 PS analyzed (closed to the prisms positions), showing values within the error limits. The results shown in Figure 17 are indicative of stability in the Selinha dike during the time interval of the analysis, according to the criterion of the error limit (±16 mm).
Several points in the Selinha dike (ZI302, ZI303, ZI305, ZI307, ZI309, and ZI311) presented a clear accumulated ground displacement. The causes of these behaviors can be explained due to the structural reinforcement works implemented in the dyke after the disaster, with material showing compaction during the period of the analysis. This fact did not modify the stability conditions of this structure, according to the geotechnical team of the SAMARCO Company.
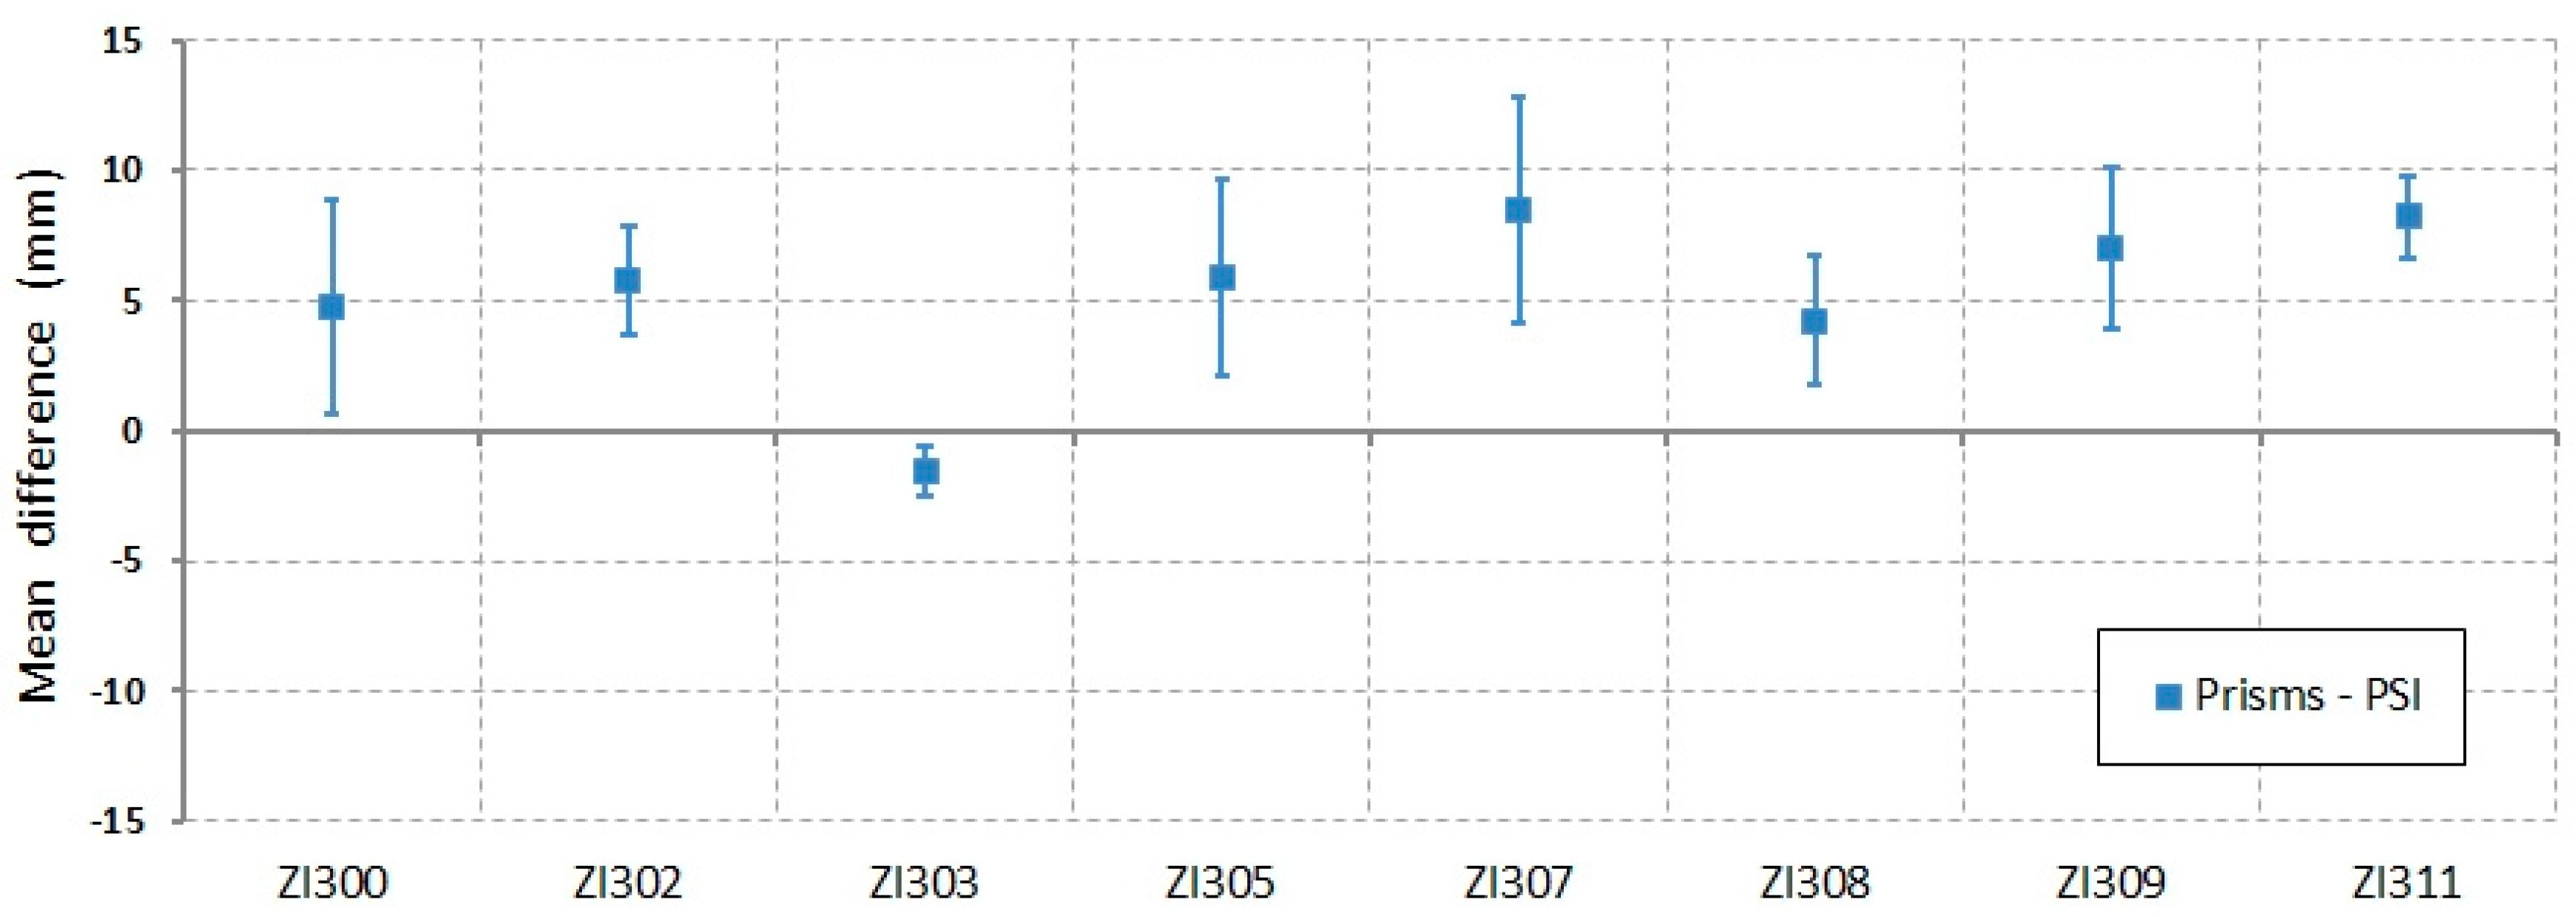
The points ZI302, ZI307, and ZI311 presented accumulated ground displacement near to the error limit for the PSI analysis (Figure 17), overestimating the ground displacement in relation to the prism measurements. It can be noted in Figure 18 that the mean values of the differences are slightly greater than those presented in Figure 12 and Figure 15, probably due to the sparser grid of PS along the wall of Selinha dike.
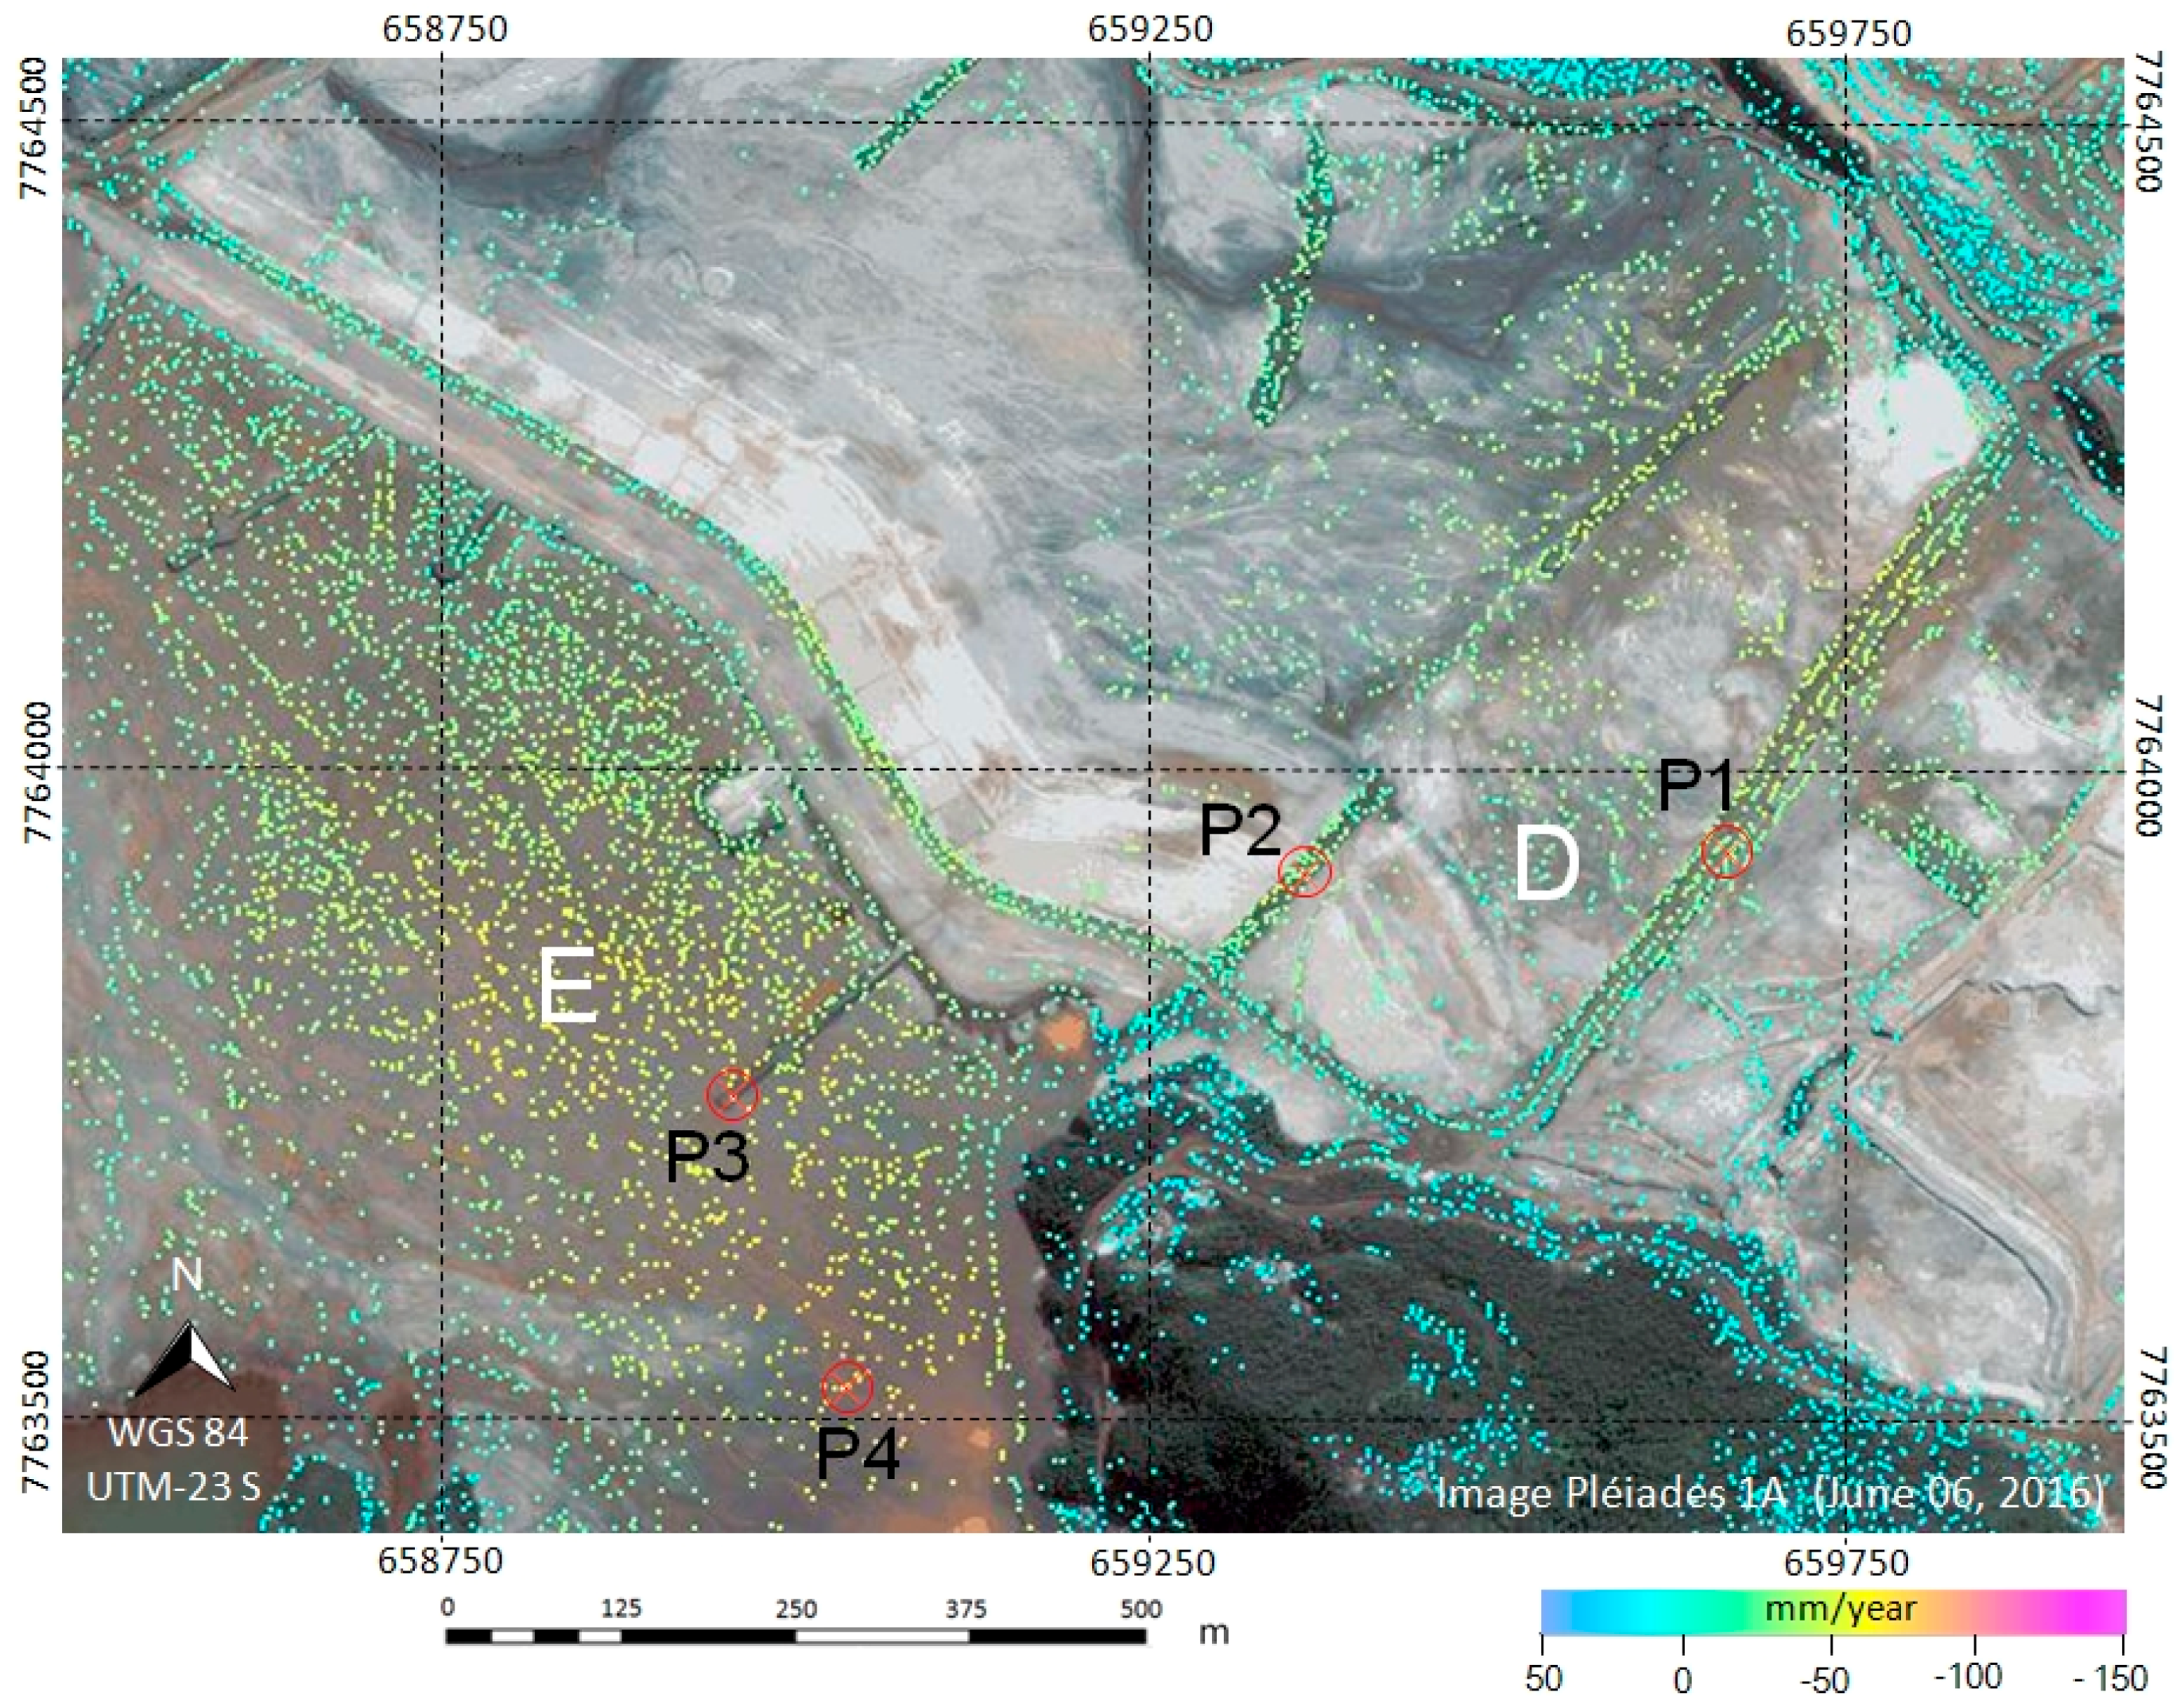
The sectors D and E of the study area, as shown in Figure 8, are related to auxiliary dikes and the reservoir. The dikes are supporting structures which serve to delimit the areas for tailings impoundment, allow proper handling material, and are also used as access routes. Since no deposition of material occurred after the Fundão rupture, the soils within the reservoir underwent an overall compaction (settlement). In addition, compaction also occurred along the auxiliary dikes due to continuous traffic of trucks and heavy equipment. Figure 19 shows field pictures of the Baía 3 dam and its reservoir and the auxiliary dike that is used for trunk movements and monitoring.
Figure 20 shows the map of ground displacement in LoS of the sector D and E (Figure 8) occurred during the period of 11 November 2015 up to 15 May 2017. Four points in this area, P1, P2, P3 (located on the auxiliary dike), and P4 (located in the Baía 3 reservoir) were selected for verification of displacements during the analysis period.
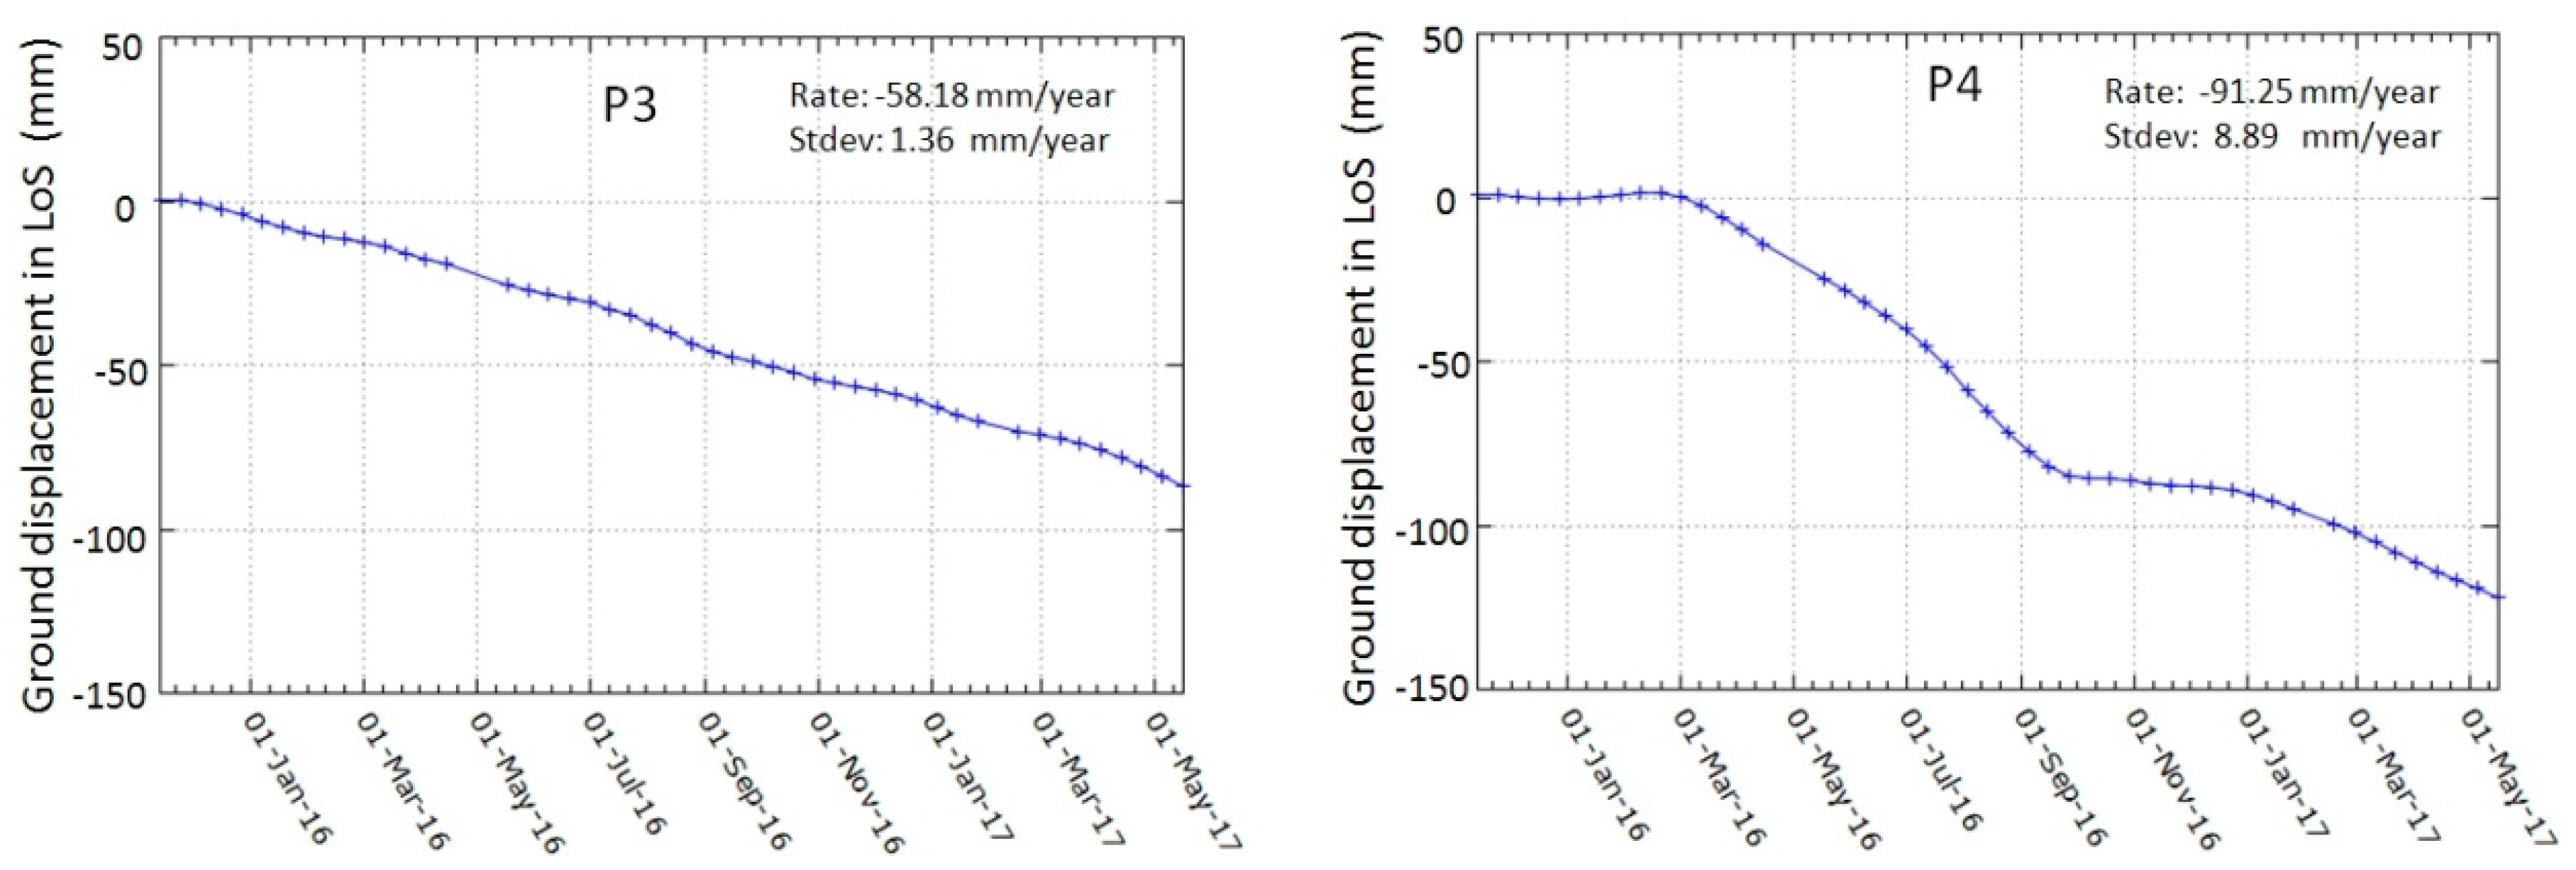
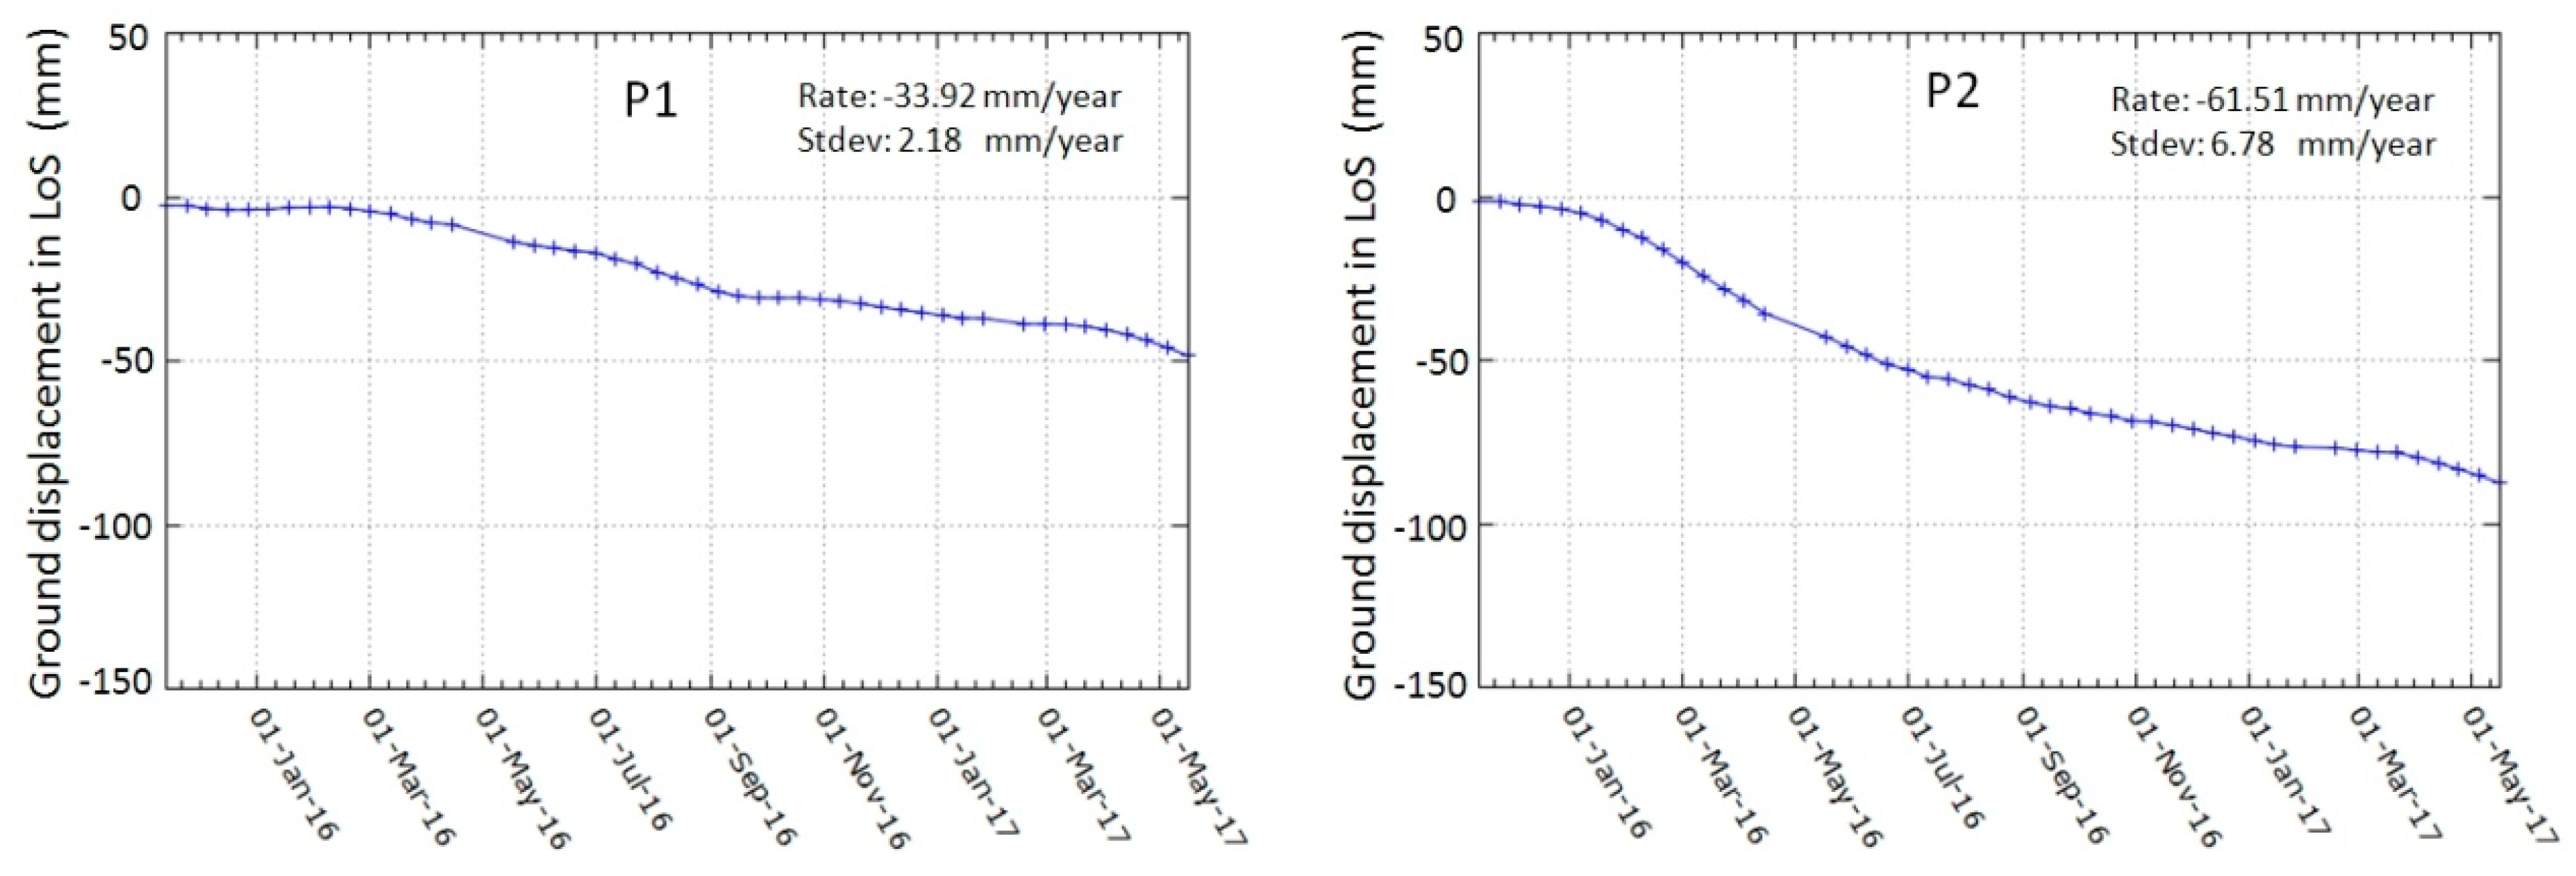
Graphs of the accumulated ground displacement are shown in Figure 21 for the point P1 and P2, with accumulated values of −49.52 and −82.06 mm, respectively, and in Figure 22 for the point P3 and P4, with accumulated values of −80.43 and −125.67 mm, respectively.
The criterion for the selection of the points P1, P2, and P3 was based only on their location on the auxiliary dikes, and on significant degree of subsidence. Point P4 was selected in a position within the reservoir of Baía 3 that presented a high degree of subsidence. Auxiliary dikes were built with a compact mixture of sand and silt-sized particles in roughly equal proportion, in order to withstand heavy vehicle traffic. The Baía 3 reservoir is composed by fine tailings (mud), being more affected by the terrain accommodation. Since no deposition of material occurred after the Fundão rupture, the soils underwent an overall compaction (settlement), affecting the auxiliary dikes and reservoir in different ways, depending on the material used in their creation. Points P1, P2, and P3 presented a quite linear behavior of deformation (Figure 21 and Figure 22), probably due to the same type of material used on auxiliary dikes constructions (Figure 20), as opposed to the mud filled reservoir where P4 is located (Figure 20) presenting a high nonlinear ground displacement (Figure 22).
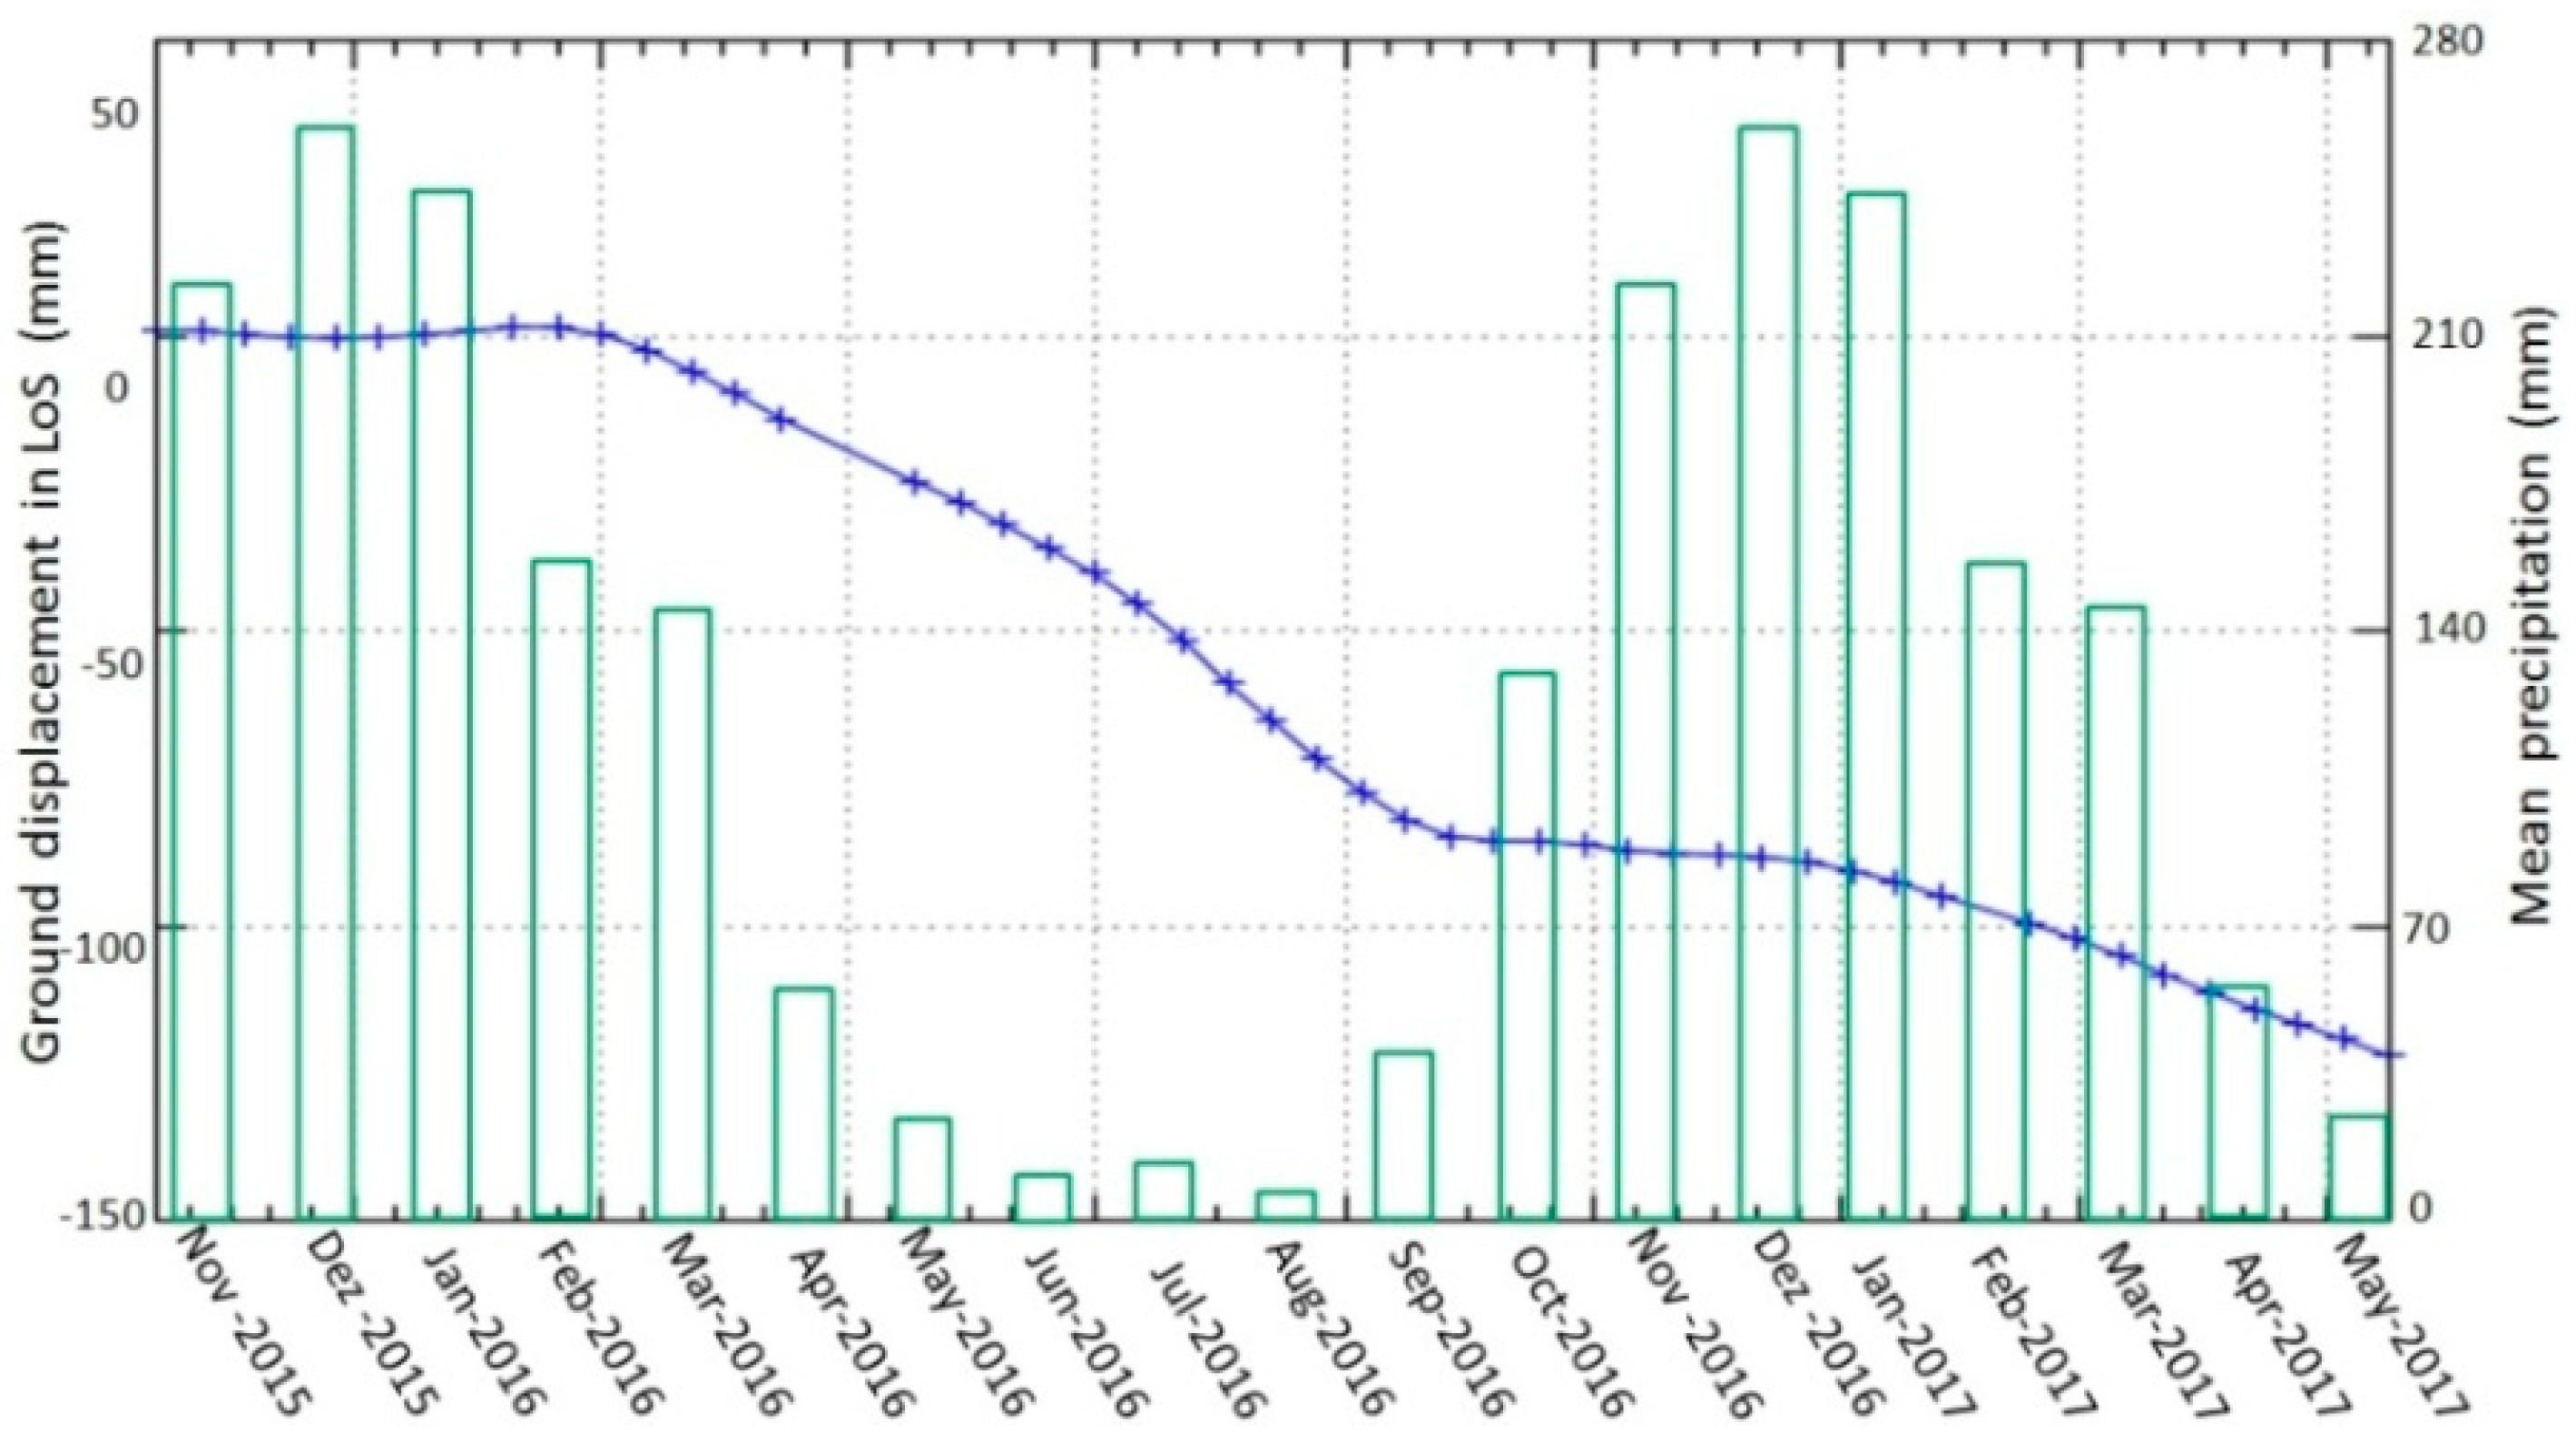
Figure 23 shows the ground displacement of the point P4 in the Baía 3 reservoir and its relationship with the annual average precipitation in Mariana-MG municipality [35] during the period of the A-DInSAR analysis. It can be noted in Figure 23 that the ground displacement increases during the dry season due to the process of the soil compaction (dry mud) within the Baía 3 reservoir, being less accentuated during the wet season.

6. Discussion

Over the last decades, DInSAR has proven to be an effective way for the detection and mapping of ground displacement in various fields of applications. This continuous growth can be related to (a) advances in the performance of satellite systems, providing data with improved temporal and spatial resolutions, (b) development made in data processing and analysis, including single interferogram methods and sophisticated implementations of A-DInSAR, such as PSI and SBAS, and (c) increases in computational capabilities with reduction of processing tasks.
Tailings dams are challenging to be monitored due to their size and sectors of inaccessibility. However, in order to keep functioning and to be considered structurally healthy need constant monitoring and assessing the deformation can be time consuming and economically costly.
Stability is basically measured with in-situ geotechnical instruments and visual inspections. However, with these conventional systems are not always possible to cover a vast area and information of displacements is limited to discrete number of survey points or sectors of the infrastructure. The overall agreement between remote and field information in our research means that A-DInSAR analysis is a reliable and powerful way to monitor stability evolution in time, compatible with in situ geotechnical information in this single site at risk. This geodetic technique represents a cost-effective way to monitor millimeter-level displacements (maximum measurement precision rate—lower than 1 mm, year single measure—lower than 5 mm) and can be used as supplemental analysis to detect movements in the tailings dam and its surroundings. Compared to conventional terrestrial methods of measurement (robotic station, ground-based radar) its advantages are: the time saved, the possibility to monitor a vast area with high density and without the need of any field visit or equipment installation.
However, the capability to measure fast deformation phenomena is limited due to the ambiguous nature of its observations, i.e., the wrapped interferometric phases. In fact, when the differential DInSAR displacement phase between two subsequent acquisitions is bigger than π, the actual deformation cannot be retrieved unambiguously. In order to get a correct estimation of the phase ambiguity, the phase gradient between close pixels has to be <π, this corresponds on the differential phases to a maximum differential deformation in LoS of the λ/4 (λ = 3.1 cm for TSX-1) in the revisit interval. It is important to note that the abovementioned condition concerns differential phases, i.e., phases computed over pairs of measured points. The actual capability to measure deformation over a given point depends on the spatial pattern of the specific deformation phenomenon in study; the smoother this pattern, the better capability; and the high point density over this phenomenon, the better capability [36]. The limitation in detecting high rate of ground displacement can be addressed by reducing the temporal span between images. In the case of slow motion phenomena the main scope is the minimum detection limit. In these cases, multiple SAR images during long temporal periods can be acquired in order to get a redundant dataset of DInSAR observations. The advantage of adding redundancy is that atmospheric artifacts and noise from the phase signal can be cancelled.
In addition, the one-dimensional estimation of the movement in the LoS direction adds insensitivity to the N-S movements and limits the capacity of getting the entire frame of the ground motion. Results in our study, using solely the ascending mode, are highly sensitive to East oriented slope movements. However, incorporating multiple radar passes using different viewing geometries (ascending and descending orbits), the displacement vectors can be extended up to 3D.
Finally, despite of these advances with A-DInSAR, the cost of the commercial data has been a major obstacle for the operational used of the technology for this kind of purpose. With new data available based on constellation systems, with short revisiting time, almost daily coverage, and particularly systems providing free access data, such as Sentinel-1A and 1B, new possibilities are opened for the use of A-DInSAR for tailings dam monitoring. This will change the paradigm of static satellite analysis to the use aiming at near-real time monitoring.

7. Conclusions

The integration of SBAS and PSI techniques, using high-resolution TSX-1 data acquired at relatively short intervals (11 days) and covering the time span from 11 November 2015 to 15 May 2017, allowed monitoring of the presence of changes in ground displacement patterns on the remaining tailings dam and dikes of Germano mining complex. In general, a pattern indicative of overall stability was characterized through A-DInSAR analysis, particularly in the areas of the main Germano dam, and the Sela & Tulipa and Selinha dikes, which are the main supporting structures affected by the Fundão rupture. Surface displacements detected on the reservoir of Baía 3 reached accumulated values up to −125 mm, and were interpreted as being caused by soil settlements due to the deposition of waste material in the reservoir since the tragedy. For the auxiliary dikes, the accumulated ground displacement reached values up to −80 mm caused by soil settlements and terrain compaction due to the continuous traffic of truck and heavy equipment.
Validation of the PSI results with a topographic survey was carried out on the Sela & Tulipa and Selinha dikes, and in the main Germano dam. Based on the comparison between the two methods, we can conclude that the differences found among them were not significant, with both providing evidence of the stability of these structures. The research demonstrated how A-DInSAR analysis, using satellite SAR coverage with short revisiting times, can be used to verify possible instability signals over an area impacted by a large dam rupture, aiming at risk mitigation strategies.
The advantages of A-DInSAR in relation to total station/prisms or ground-based radar measurements are that satellite monitoring can be made without fieldwork, and detailed surface displacement (millimeter scale) can be found, providing a synoptic visualization of the displacement phenomenon over large areas and in all-weather conditions. Since this technique is not real-time monitoring, integration with topographic surveys and ground-based radar is recommended for operational purposes.

Author Contributions

J.C.M. wrote the manuscript and was in charge of SAR processing, performed with the support of F.F.G. and P.N.; W.R.P. wrote the manuscript and carried out the analysis of the area and the data interpretation. C.G.O. and W.S.B. provided de SAR data and the generation of the Digital Elevation Model (DEM) from Pléiades 1A images. S.C. provided the access to test area and the data of the topographic measurements based on total robotic station. All the authors worked on the manuscript revisions

Funding

This research received no external funding.

Acknowledgments

The authors are grateful for the support of VISIONA TECNOLOGIA ESPACIAL S.A. and AIRBUS DEFENCE & SPACE companies providing the TerraSAR-X and Pléiades 1A images for the research. The National Council for Scientific and Technological Development (CNPq) is also acknowledged for grants received by the third and fourth authors during the investigation. Finally, the authors are particularly grateful to the SAMARCO Company team in Mariana-MG for the support during the field work campaign. The paper improved significantly from the journal’s reviewers.

Conflicts of Interest

The authors declare no conflict of interest.

Abbreviations

The following abbreviations are used in this manuscript:
A-DInSARAdvanced Differential SAR technique
PSIPersistent Scatterer Interferometry
IPTAInterferometry Point Target Analysis
SBASSmall Baseline Subset
MCFMinimum Cost Flow
SVDSingular Value Decomposition
LoSLine-of-Sight

References

  1. Castilho, B.M. Analysis of the Trigger of Dynamic Liquefaction and Numeric Modeling of the Germano Dam. Master’s Thesis, Geotechnical Engineering, Federal University of Ouro Preto, Ouro Preto, Brazil, 2017. (In Portuguese). [Google Scholar]
  2. Rosiere, C.A.; Rolim, V.K. Iron formation and associated high-grade iron ore: The iron ore of Brazil, geology, metallogenesis and economy. In Mineral Resources in Brazil, Problems and Challenges; Brazilian Academy of Sciences: Rio de Janeiro, Brazil, 2016; pp. 2–45. (In Portuguese) [Google Scholar]
  3. Carmo, F.F.; Kamino, L.H.H.; Tobias, R., Jr.; Campos, I.C.; Silvino, G.; Castro, K.J.S.X.; Mauro, M.L.; Rodrigues, N.U.A.; Miranda, P.S.; Pinto, C.E.F. Fundão tailings dam failures: The environment tragedy of the largest technological disaster of Brazilian mining in global context. Perspect. Ecol. Conserv. 2017, 15, 145–151. [Google Scholar] [CrossRef]
  4. Morgenstern, N.R.; Vick, S.G.; Viotti, C.B.; Watts, B.D. Fundão Tailings Dam Review Panel: Report on the Immediate Causes of the Failure of the Fundão Dam; SAMARCO, S.A., Vale, S.A., Eds.; BHP Brasil Ltd.: Mariana, Brazil, 2016; p. 76. Available online: http://fundaoinvestigation.com/the-panel-report/ (accessed on 18 May 2018).
  5. Agurto-Detzel, H.; Bianchi, M.; Assumpção, M.; Schimmel, M.; Collaço, B.; Ciardelli, C.; Barbosa, J.R.; Calhau, J. The tailings dam failure of 5 November 2015 in SE Brazil and its preceding seismic sequence. Geophys. Res. Lett. 2016, 43, 4929–4936. [Google Scholar] [CrossRef] [Green Version]
  6. Usai, S. A least-squares approach for long-term monitoring of deformations with differential SAR interferometry. In Proceedings of the IEEE International Geoscience and Remote Sensing Symposium (IGARSS 2002), Toronto, ON, Canada, 24–28 June 2002; pp. 1247–1250. [Google Scholar]
  7. Berardino, P.; Fornaro, G.; Lanari, R.; Sansosti, E. A new algorithm for surface deformation monitoring based on small baseline differential SAR interferogramas. IEEE Trans. Geosci. Remote Sens. 2002, 40, 2375–2383. [Google Scholar] [CrossRef]
  8. Schmidt, D.A.; Bürgmann, R. Time-dependent land uplift and subsidence in the Santa Clara valley, California from a large InSAR data set. J. Geophys. Res. 2003, 108, 2416–2429. [Google Scholar] [CrossRef]
  9. Lanari, R.; Mora, O.; Manunta, M.; Mallorquí, J.J.; Berardino, P.; Sansosti, E. A small-baseline approach for investigating deformations on full-resolution differential SAR interferogramas. IEEE Trans. Geosci. Remote Sens. 2004, 42, 1377–1386. [Google Scholar] [CrossRef]
  10. Crosetto, M.; Crippa, B.; Biescas, E. Early detection and in-depth analysis of deformation phenomena by radar interferometry. Eng. Geol. 2005, 79, 81–91. [Google Scholar] [CrossRef]
  11. Ferretti, A.; Prati, C.; Rocca, F. Permanent scatterers in SAR interferometry. IEEE Trans. Geosci. Remote Sens. 2001, 39, 8–20. [Google Scholar] [CrossRef] [Green Version]
  12. Werner, C.; Wegmuller, U.; Strozzi, T.; Wiesmann, A. Interferometric Point Target Analysis for Deformation Mapping. In Proceedings of the IEEE International Geoscience and Remote Sensing Symposium, Toulouse, France, 21–25 July 2003; Volume 7, pp. 4362–4364. [Google Scholar]
  13. Hopper, A.; Bekaert, D.; Spaans, K.; Arikan, M. Recent advances in SAR Interferometry time series analysis for measuring crustal deformation. Tectonophysics 2012, 514–517, 1–13. [Google Scholar] [CrossRef]
  14. Colesanti, C.; Mouelic, S.L.; Bennani, M.; Raucoules, D.; Carnec, C.; Ferretti, A. Detection of mining related ground instabilities using the Permanent Scatterers technique: A case study in the east of France. Int. J. Remote Sens. 2005, 26, 201–207. [Google Scholar] [CrossRef]
  15. Herrera, G.; Tomás, R.; Lopez-Sanchez, J.M.; Delgado, J.; Mallorqui, J.J.; Duque, S.; Mulas, J. Advanced DInSAR analysis on mining areas: La Union case study (Murcia, SE Spain). Eng. Geol. 2007, 90, 148–159. [Google Scholar] [CrossRef] [Green Version]
  16. Perski, Z.; Hanssen, R.; Wojcik, A.; Wojciechowski, T. InSAR analyses of terrain deformation near the Wieliczka Salt Mine, Poland. Eng. Geol. 2009, 106, 58–67. [Google Scholar] [CrossRef]
  17. Ng, A.-H.M.; Ge, L.; Yan, Y.; Li, X.; Chang, H.-C.; Zhang, K.; Rizos, C. Mapping accumulated mine subsidence using small stack of SAR differential interferograms in the Southern coalfield of New South Wales, Australia. Eng. Geol. 2010, 115, 1–15. [Google Scholar] [CrossRef]
  18. Wegmüller, U.; Walter, D.; Spreckels, V.; Werner, C.L. Nonuniform Ground Deformation Monitoring with TerraSAR-X Persistent Scatterer Interferometry. IEEE Trans. Geosci. Remote Sens. 2010, 48, 895–904. [Google Scholar] [CrossRef]
  19. Herrera, G.; Tomas, R.; Vicente, F.; Lopez-Sanches, J.M.; Mallorquí, J.J.; Mulas, J. Mapping ground movements in open pit mining areas using differential SAR interferometry. Int. J. Rock Mech. Min. Sci. 2010, 47, 1114–1125. [Google Scholar] [CrossRef]
  20. Hartwig, M.E.; Paradella, W.R.; Mura, J.C. Detection and monitoring of surface motions in active mine in the Amazon region, using persistent scatterer interferometry with TerraSAR-X satellite Data. Remote Sens. 2013, 5, 4719–4734. [Google Scholar] [CrossRef]
  21. Paradella, W.R.; Ferretti, A.; Mura, J.C.; Colombo, D.; Gama, F.F.; Tamburini, A.; Santos, R.A.; Novalli, F.; Galo, M.; Camargo, P.O.; et al. Mapping surface deformation in open pit iron mines of Carajás Province (Amazon Region) using an integrated SAR analysis. Eng. Geol. 2015, 193, 61–78. [Google Scholar] [CrossRef]
  22. Pinto, C.A.; Paradella, W.R.; Mura, J.C.; Gama, F.F.; Santos, A.R.; Silva, G.G.; Hartwig, M.E. Applying persistent scatterer interferometry for surface displacement mapping in the Azul open pit manganese mine (Amazon region) with TerraSAR-X data. J. Appl. Remote Sens. 2015, 9, 095978. [Google Scholar] [CrossRef]
  23. Mura, J.C.; Paradella, W.R.; Gama, F.F.; Silva, G.G.; Galo, M.; Camargo, P.; Silva, A.; Silva, A. Monitoring of Non Linear Ground Movement in an Open Pit Iron Mine Based on an Integration of Advanced DInSAR Techniques Using TerraSAR-X Data. Remote Sens. 2016, 8, 409. [Google Scholar] [CrossRef]
  24. Gama, F.F.; Cantone, A.; Mura, J.C.; Pasquali, P.; Paradella, W.R.; dos Santos, A.R.; Silva, G.G. Monitoring subsidence of open pit iron mines at Carajás Province based on SBAS interferometric technique using TerraSAR-X data. Remote Sens. Appl. Soc. Environ. 2017, 8, 199–211. [Google Scholar] [CrossRef]
  25. Silva, G.G.; Mura, J.C.; Paradella, W.R.; Gama, F.F.; Temporin, F.A. Monitoring of ground movement in open pit iron mines of Carajás Province (Amazon region) based on A-DInSAR techniques using TerraSAR-X data. J. Appl. Remote Sens. 2017, 11, 026027. [Google Scholar] [CrossRef] [Green Version]
  26. Raventós, J.; Arroyo, M.; Guerra, J.M.G.; Conde, A.; Salva, B.; Garcia, M. The use of InSAR to monitor stability of dams and water reservoirs. In Proceedings of the 85th Annual Meeting of International Commission on Large Dams, Prague, Czech Republic, 3–7 July 2017. [Google Scholar]
  27. Borghero, C. Feasibility Study of Dam Deformation Monitoring in Northern Sweden Using Sentinel1 SAR Interferometry. Master’s Thesis, University of Gavle, Gavle, Sweden, 2017. [Google Scholar]
  28. Iannacone, J.P.; Lato, M.; Troncoso, J.; Perissin, D. InSAR Monitoring of Active, Inactive and Abandoned Tailings Facilities. In Proceedings of the 5th International Seminar on Tailings Management, Santiago, Chile, 11–13 July 2018. [Google Scholar]
  29. Ostrowski, J.A.; Cheng, P. DEM extraction from stereo SAR satellite imagery. In Proceedings of the International Geoscience and Remote Sensing Symposium (IGARSS’2000), Honolulu, HI, USA, 25–28 July 2000; IEEE: New York, NY, USA, 2000. [Google Scholar]
  30. Osmanoglu, R.; Sunar, F.; Wdowinski, S.; Cabral-Cano, E. Time Series Analysis of InSAR data: Methods and trends. ISPRS J. Photogramm. Remote Sens. 2016, 115, 90–102. [Google Scholar] [CrossRef]
  31. Kampes, B.M. Radar Interferometry: Persistent Scatterer Technique; Springer: Dordrecht, The Netherlands, 2006. [Google Scholar]
  32. Goldstein, R.M.; Werner, C.L. Radar interferogram filtering for geophysical applications. Geophys. Res. Lett. 1998, 25, 4035–4038. [Google Scholar] [CrossRef] [Green Version]
  33. Constantini, M. A Novel Phase-Unwrapping Algorithm based on Network Programming. IEEE Trans. Geosci. Remote Sens. 1998, 36, 813–820. [Google Scholar] [CrossRef]
  34. Golub, G.; Loan, C. Matrix Computations; John Hopkins University Press: Baltimore, MD, USA, 1989; pp. 427–435. [Google Scholar]
  35. Climate-Data.org—Climograma Mariana. Available online: https://pt.climate-data.org/location/25091/ (accessed on 28 May 2018).
  36. Crosetto, M.; Monserrat, O.; Cuervas-Gonzales, M.; Devanthéry, N.; Crippa, B. Persistent Scatterer Interferometry: A review. ISPRS J. Photogramm. Remote Sens. 2016, 115, 79–89. [Google Scholar] [CrossRef]
Figure 1. The Germano mining complex location showing the Germano and Fundão tailings dams.
Remotesensing 10 01507 g001
Figure 2. Images (Landsat) over Germano Complex area before (20 July 2015) (a) and after (9 November 2015) (b) the Fundão dam rupture.
Remotesensing 10 01507 g002
Figure 3. Study area of the main structures of the Germano dam after the Fundão collapse.
Remotesensing 10 01507 g003
Figure 4. Baselines used to generate interferograms for SBAS processing.
Remotesensing 10 01507 g004
Figure 5. Normal Baselines used for the PSI analysis (reference acquired on 22 July 2016).
Remotesensing 10 01507 g005
Figure 6. Displacement velocity map in LoS derived from SBAS analysis.
Remotesensing 10 01507 g006
Figure 7. Digital elevation error derived from SBAS analysis.
Remotesensing 10 01507 g007
Figure 8. Ground displacement map in LoS of the Germano reservoir derived from the PSI analysis.
Remotesensing 10 01507 g008
Figure 9. Field pictures presenting the upper sector (a), steepest sector (b) and buttress sector (c) of the main Germano dam.
Remotesensing 10 01507 g009
Figure 10. PSI ground displacement map in LoS showing the positions of the prisms and the upper sector (1), steepest sector (2), and buttress sector (3) of the main Germano dam.
Remotesensing 10 01507 g010
Figure 11. Accumulated displacements from 11 November 2015 to 15 May 2017 for prisms (robotic station) and corresponding PS (closed to the prisms positions) and its related standard deviations in the main Germano dam. The error bar limits (±16 mm) are shown in green color.
Remotesensing 10 01507 g011
Figure 12. Mean difference and the standard deviation between the measurements of the two methods (Prisms minus PSI) during the period of 11 November 2015 to 15 May 2017 for the 34 points analysed in the main Germano dam.
Remotesensing 10 01507 g012
Figure 13. The wall of Sela & Tulipa dike (a), the empty Fundão reservoir (b) and the PSI ground displacement map showing the positions of the prisms (c).
Remotesensing 10 01507 g013
Figure 14. Accumulated displacements from 11 November 2015 to 15 May 2017 for prisms (robotic station) and corresponding PS (closed to the prisms positions) and its related standard deviations in the Sela & Tulipa dike. The error bar limits (±16 mm) are shown in green.
Remotesensing 10 01507 g014
Figure 15. Mean difference and the standard deviation between the measurements of the two methods (Prisms minus PSI) for the 34 points analysed in the Sela & Tulipa dike.
Remotesensing 10 01507 g015
Figure 16. Field picture of the wall of the Selinha dike (a) and the ground displacement map derived from PSI analysis showing the positions of the prisms (b).
Remotesensing 10 01507 g016
Figure 17. Accumulated displacement from 11 November 2015 to 15 May 2017 for prisms (robotic station) correspond to PS (closed to the prisms positions) and its related standard deviations in the Selinha dike. The error bar limits (±16 mm) are shown in green.
Remotesensing 10 01507 g017
Figure 18. Mean difference and the standard deviation between the measurements of the two methods (Prisms minus PSI) for the 34 points analysed in the Selinha dike.
Remotesensing 10 01507 g018
Figure 19. Field picture of the Baía 3 dam and its reservoir (a) and the auxiliary dike that cross the Germano reservoir (b).
Remotesensing 10 01507 g019
Figure 20. PSI ground displacement map in LoS showing the auxiliary dikes in sector (D) and the Baía 3 dam and its reservoir in sector (E) and the points P1, P2, P3, and P4 selected for plotting of the ground displacement.
Remotesensing 10 01507 g020
Figure 21. PSI results of the ground displacement in LoS of the points P1 and P2 in the auxiliary dikes of the sector D.
Remotesensing 10 01507 g021
Figure 22. PSI results of the ground displacement in LoS of the points P3 and P4 in the auxiliary dike and reservoir of Baía 3, respectively.
Remotesensing 10 01507 g022
Figure 23. PSI results of the ground displacement in LoS of the point P4 in the reservoir of Baía 3 versus the mean precipitation during the period of November 2015 up to May 2017.
Remotesensing 10 01507 g023

