Letter

Extreme Wave Height Events in NW Spain: A Combined Multi-Sensor and Model Approach

by
Pablo Lorente
1,*,
Marcos G. Sotillo
1,
Lotfi Aouf
2,
Arancha Amo-Baladrón
1,
Ernesto Barrera
3,
Alice Dalphinet
2,
Cristina Toledano
3,
Romain Rainaud
2,
Marta De Alfonso
1,
Silvia Piedracoba
4,
Ana Basañez
5,
Jose Maria García-Valdecasas
1,
Vicente Pérez-Muñuzuri
5 and
Enrique Álvarez-Fanjul
1
1
Puertos del Estado, 28042 Madrid, Spain
2
Meteo-France, 31100 Toulouse, France
3
AEMET (Agencia Española de Meteorología), 28071 Madrid, Spain
4
CETMAR (Centro Tecnológico del Mar), 36208 Vigo, Pontevedra, Spain
5
USC (Universidad de Santiago de Compostela), 15782 Santiago de Compostela, La Coruña, Spain
*
Author to whom correspondence should be addressed.
Remote Sens. 2018, 10(1), 1; https://doi.org/10.3390/rs10010001
Submission received: 10 November 2017 / Revised: 7 December 2017 / Accepted: 13 December 2017 / Published: 21 December 2017
(This article belongs to the Special Issue Radar Remote Sensing of Oceans and Coastal Areas)

Abstract

:
The Galician coast (NW Spain) is a region that is strongly influenced by the presence of low pressure systems in the mid-Atlantic Ocean and the periodic passage of storms that give rise to severe sea states. Since its wave climate is one of the most energetic in Europe, the objectives of this paper were twofold. The first objective was to characterize the most extreme wave height events in Galicia over the wintertime of a two-year period (2015–2016) by using reliable high-frequency radar wave parameters in concert with predictions from a regional wave (WAV) forecasting system running operationally in the Iberia-Biscay-Ireland (IBI) area, denominated IBI-WAV. The second objective was to showcase the application of satellite wave altimetry (in particular, remote-sensed three-hourly wave height estimations) for the daily skill assessment of the IBI-WAV model product. Special attention was focused on monitoring Ophelia—one of the major hurricanes on record in the easternmost Atlantic—during its 3-day track over Ireland and the UK (15–17 October 2017). Overall, the results reveal the significant accuracy of IBI-WAV forecasts and prove that a combined observational and modeling approach can provide a comprehensive characterization of severe wave conditions in coastal areas and shows the benefits from the complementary nature of both systems.

Graphical Abstract

1. Introduction

The Galician coast facing the Atlantic on the northwestern corner of the Iberian Peninsula (Figure 1a) is a region that is strongly influenced by the presence of low pressure systems in the mid-Atlantic Ocean and the periodic passage of storms that give rise to severe sea states (Figure 1b). As a consequence, its wave climate is one of the most energetic in Europe, with the mean available power flux reaching approximately 45 kW·m−1 [1,2].
Since it is a region with intense maritime traffic, a comprehensive characterization of the significant wave height (Hs) events is required in order to underpin efficient operations, minimize the associated risks, and increase marine safety in coastal waters. In this context, a multi-platform methodology based on the synergistic integration of wave model predictions and a variety of in situ and remote sensed observations could constitute a useful approach to properly portray the ocean state and its variability.
As previous works have unequivocally revealed the importance of rigorous validation of operational wave forecasting systems [3,4] and the analysis of extreme wave height events using models [5,6] and shore-based high-frequency radar (HFR) [7,8], the objectives of this paper were twofold. The first objective was to analyze the main features of extreme wave height events in Galicia over the wintertime of a two-year period (2015–2016) by using HFR remote-sensed hourly wave parameters in tandem with predictions from an operational wave (WAV) forecasting system running in the Iberia-Biscay-Ireland (IBI) area, denominated IBI-WAV (Figure 1b).
The second objective was to showcase the application of satellite-derived Hs estimations for the daily skill assessment of the IBI-WAV wave forecast system and how the use of wave altimetry can effectively increase the possibility of obtaining better spatiotemporal coverage of wave data collection. Attention was focused on monitoring Ophelia—one of the major hurricanes on record in the easternmost Atlantic—during its 3-day track over Ireland and UK (15–17 October 2017). Although weakened and downgraded to a post-extratropical cyclone, it brought impactful weather in terms of heavy rain, damaging gusts (up to 150 km·h−1), large waves, and storm surges with subsequent coastal flooding. In this context, the ability of the IBI-WAV model to capture basic synoptic details of the wave height field during these unusual circumstances has been evaluated.
In this paper, the model setup of IBI-WAV and the datasets are described in Section 2. Results are presented and interpreted in Section 3. A detailed discussion and future work are addressed in Section 4. Finally, the main conclusions are summarized in Section 5.

2. Materials and Methods

2.1. The Iberia-Biscay-Ireland Wave (IBI-WAV) Operational Forecasting System

The IBI-WAV system, implemented in the frame of the Copernicus Marine Environment Monitoring Service (CMEMS), provides a 5-day regional wave forecast, which is updated twice a day (cycles at 00 z and 12 z). The wave model used as the base of this operating system is the MF-WAM. This model is based on the IFS-ECWAM (cycle 38R2) code, with changes according to dissipation by the wave breaking and the swell damping source terms as developed in Ardhuin et al. [9]. The MF-WAM model was updated in 2014 with the improvements implemented in the FP7 European research project MyWave [10]. The model performs a partitioning technique on wave spectra that allows the separation between sea wind and wave swell systems. A classification of primary and secondary swell systems was also performed. The model was implemented on the IBI domain with a grid size of 10 km and with a spectral resolution of 24 directions and 30 frequencies, starting from 0.035 Hz. The IBI-WAV runs are driven by 3-hourly analyzed ECMWF winds. The boundary conditions (wave spectra) were provided by the global CMEMS wave system, which uses the assimilation of altimeter wave data. Further details about the CMEMS IBI-WAV forecast service can be found in the Product User Manual (PUM) [11] and the Quality Information Document (QUID) [12].

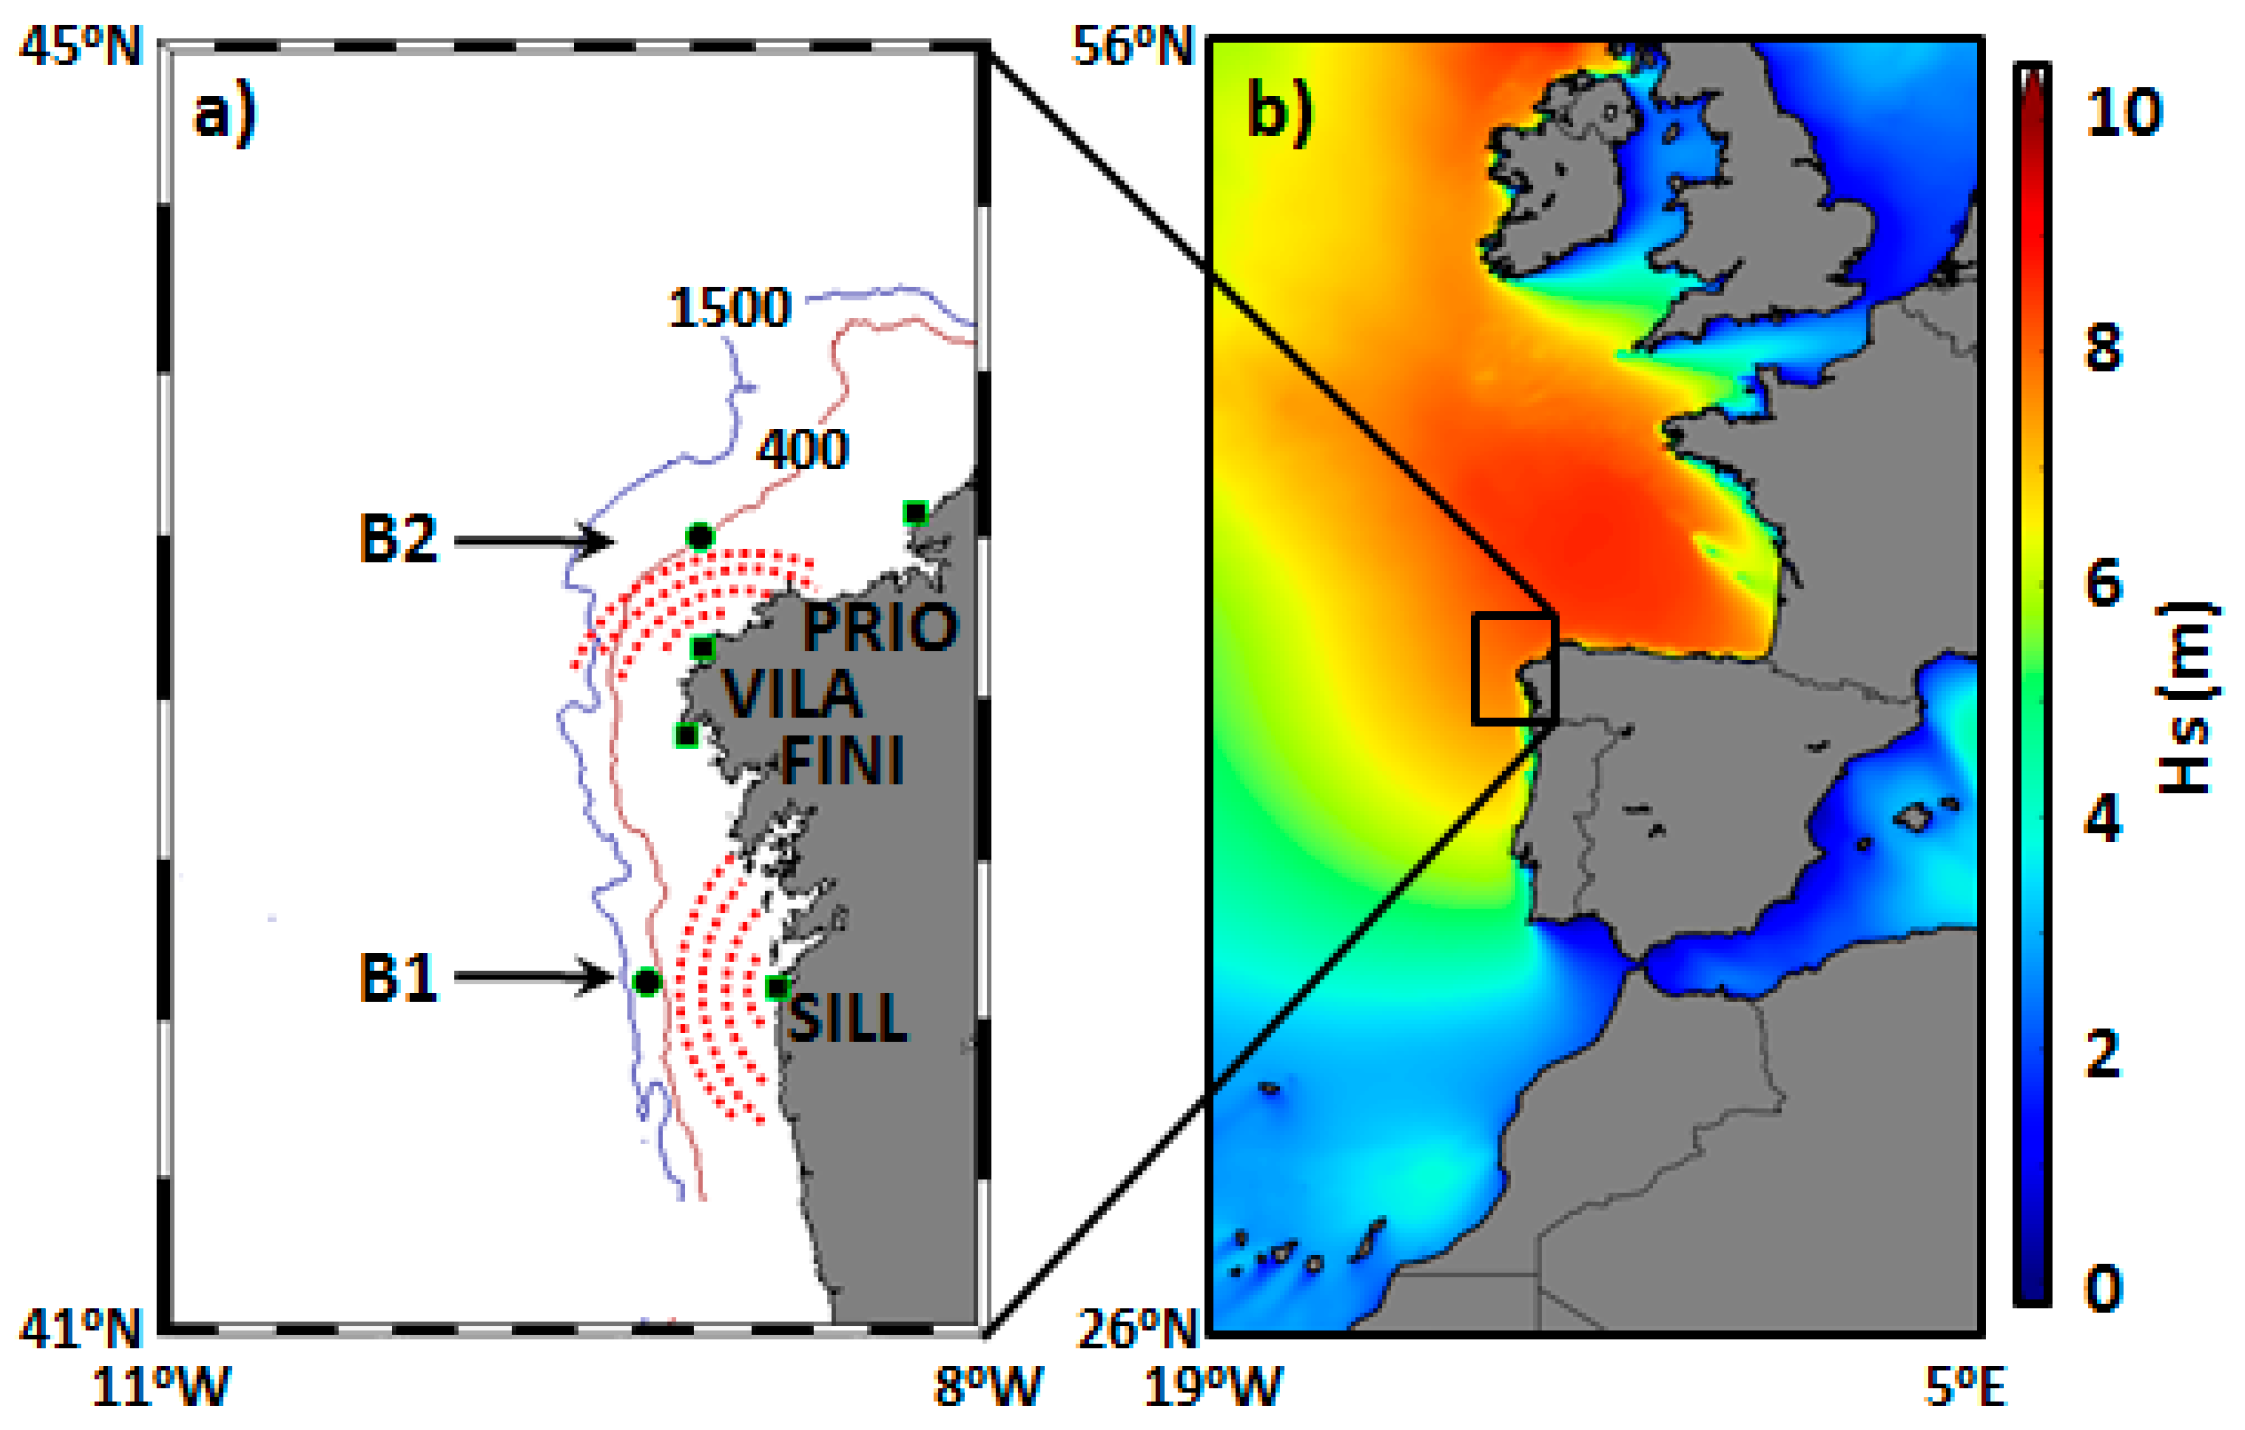
2.2. In Situ Observations

The coverage area of the Galician HFR system includes two deep ocean Seawatch buoys that have been deployed since 1998 in the northwestern waters of the Iberian Peninsula, and which are operated by Puertos del Estado. They are moored on the edge of the continental shelf: Silleiro (42.12° N, 9.44° W; 45 km from shore; 600 m depth) and Vilano (43.50° N, 9.22° W; 37 km from shore; 386 m depth); hereafter B1 and B2, respectively (Figure 1a). Hourly-averaged quality-controlled measurements of spectrally significant wave height (Hs), the wave period at spectral peak (or peak period, Tp), and the mean wave direction (Wd) were provided by a directional Waverider sensor and used in concert as a robust benchmark to conduct a multi-parameter skill assessment of the IBI-WAV. The quality control, defined by the CMEMS in situ team [13], was based on a battery of automatic checks performed in real time (to flag and subsequently filter inconsistent values) and included, among others, the spike test, stuck value test, and the rate of change in time. Finally, it is also worthwhile mentioning the intrinsic uncertainties related to the in situ sensors: the instrumental error was below 0.5% of measured Hs values after calibration, according to the manufacturer.

2.3. HF Radar (HFR)

HFR technology is based on measurements of the radio wave backscattered signal from ocean surface gravity waves in the 3–30 MHz range of the electromagnetic spectrum [14]. Consistent estimations of the surface current field can be derived from the strong signal produced by the resonant first-order Bragg waves, whereas wave parameters can be extracted from the weaker second-order sea-echo Doppler echo spectrum using methods of integral inversion [15]. There is a minimum sensitivity threshold for sea states below which the lower-energy second-order spectrum is closer to the floor noise and more likely to be contaminated [15]. There is also a limiting factor for the HFR during extreme weather events as the wave height increases and exceeds the saturation limit defined (on an inverse proportion) by the radar transmit frequency. If the radar spectrum saturates, the first-order spectra merge with the second-order and interpretation of the spectra becomes impossible with existing methods.
The CODAR SeaSonde long-range 5 MHz HFR system used in this work, and deployed in Galicia since November 2004, is composed of four sites from south to north: Silleiro (SILL) and Finisterre (FINI), operated by Puertos del Estado; Vilano (VILA) and Prior (PRIO), operated by INTECMAR. This system provides 30-min wave data that are subsequently subsampled at 60 min intervals to provide consistency in the temporal resolution of the data for validation and analysis. In this context, the quality control used for in situ wave observations was equally applied to HFR-derived estimations (Hs, Tp, and Wd).
HFR data were retrieved from five individual range cells (RCs), from cell 1 to cell 5 (5.1 and 25.50 km from site origin, respectively). The outermost HFR radar RC (cell 5) of Silleiro and Vilano radar sites (Figure 1a) was selected to perform the comparison against the B1 and B2 buoys, respectively, as it presented the highest percentage of captured data. Since B1 (B2) buoy is 45 (37) km from shore, we can derive that remote-sensed wave estimations are representative of a region 20 (12) km from the B1 (B2) buoy, setting up the context for the discussion of results.
In this paper, the agreement between both in situ and remote-sensing instruments and the IBI-WAV forecasting system has been evaluated by means of computation of a set of statistical metrics: histograms, bias, root mean squared errors (RMSE), scalar correlation, quantile-quantile (Q-Q) plots, the best linear fit of scatterplots, and wave roses. In terms of characterizing wave height events, we adopted the criterion defined by Atan et al. [8] where high (extreme) Hs events are comprised between the 90th and 99th (99th and 100th) percentiles; hereafter, referred to as P90–P99 (P99–P100), respectively.
The statistical metrics used in the present study to compare two datasets x = {x1, x2, x3, …, xN} and y = {y1, y2, y3, …, yN} include the mean ( x ¯ ), bias, standard deviation (σ), root mean squared error (RMSE), and scalar correlation (CORR) and is defined respectively as:
x ¯ = 1 N i = 1 N x i
σ = 1 N 1   i = 1 N ( x i x ¯ ) 2
bias = 1 N i = 1 N ( x i y i )
RMSE = 1 N   i = 1 N ( x i y i ) 2
CORR = 1 N 1 i = 1 N ( x i x ¯ σ x ) ( y i y ¯ σ y )

2.4. Satellite Data

The wave altimetry product used in this paper comprises a pool of three different satellite missions (Jason-2, Saral/Altika, and Cryosat-2) that is subsequently merged and prepared by Meteo-France. The satellite-sensed Hs estimations have been spatially averaged on a 0.1° grid and chosen for specific three-hourly time steps (00–21 h) in order to associate the measured and simulated significant wave heights and objectively validate IBI-WAV on a daily basis. The following skill metrics and quality indicators were computed: maps and histograms of daily differences together with the best linear fit of scatterplots.

3. Results

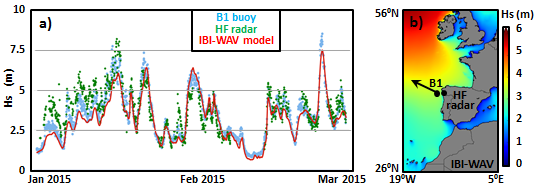
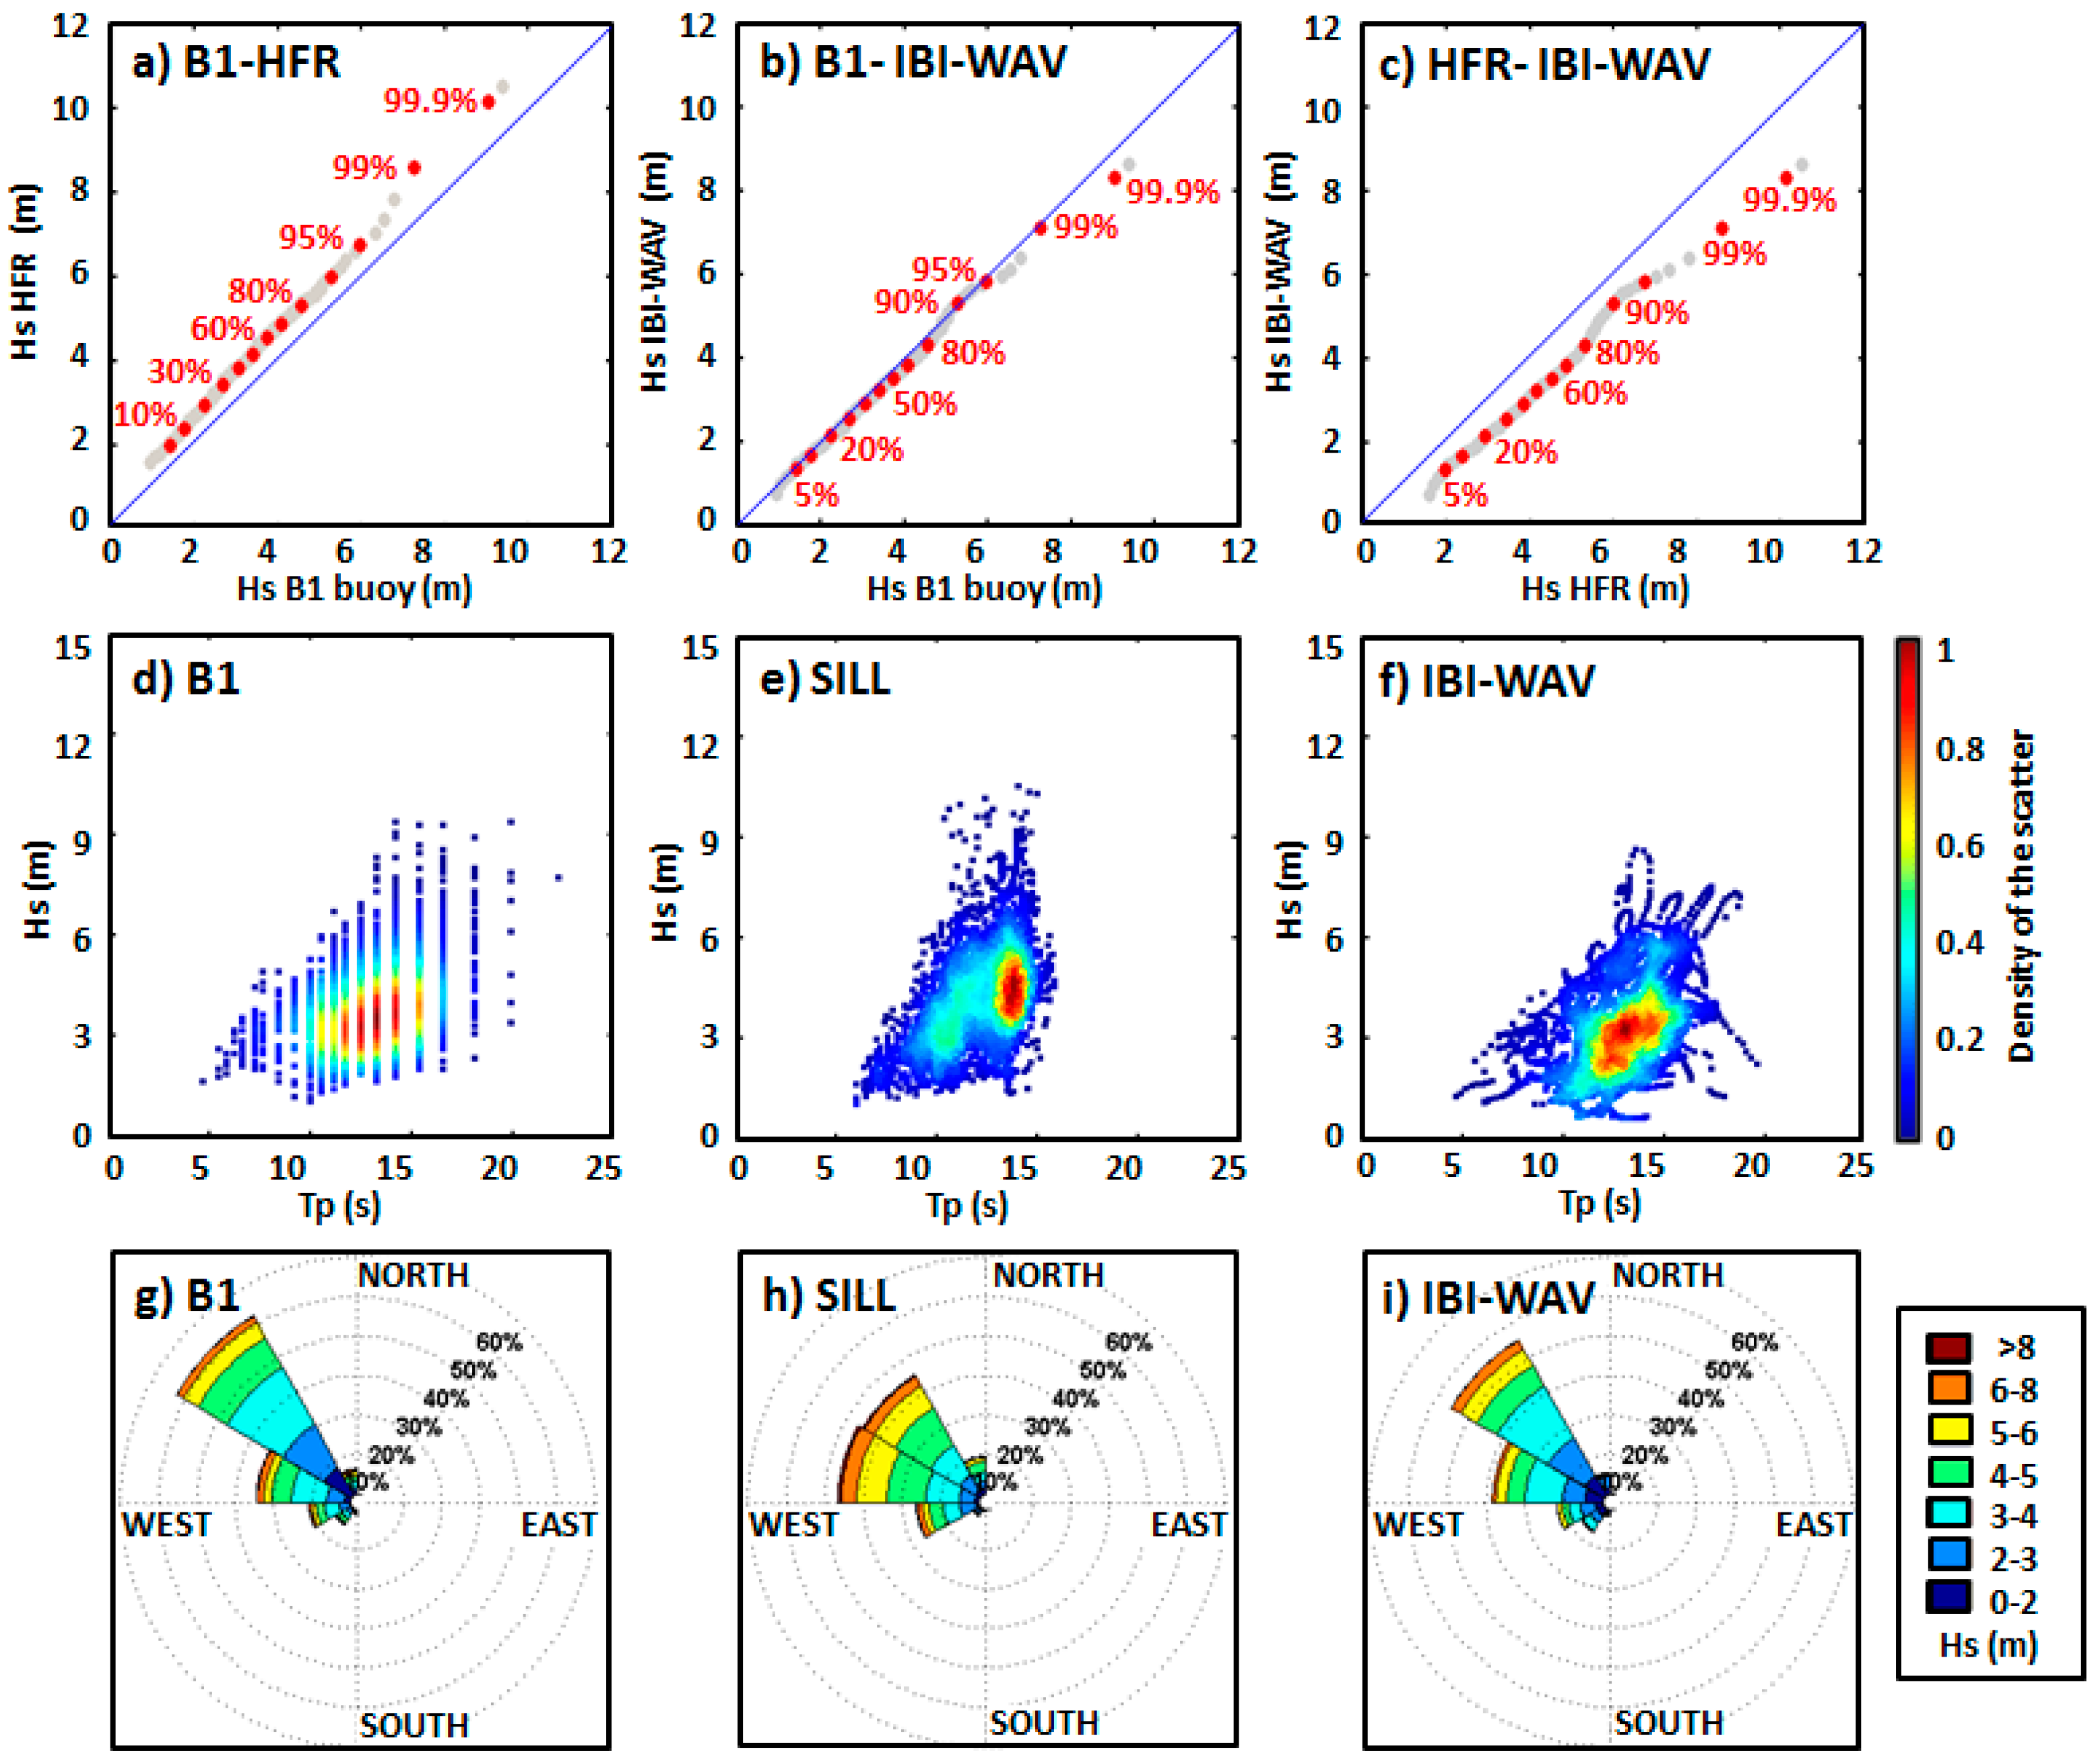
3.1. Preliminary Skill Assessment of HF Radar Wave Height Estimations

Previous comparisons against moored buoys have unequivocally proven the positive contribution of HF system radar to retrieve reliable directional wave information [7,16,17]. In this context, a preliminary accuracy assessment of Galician HFR-derived wave data has been conducted for January–February 2014 (Figure 2), when a number of extreme wave height events (Hs above 10 m) took place.
As can be seen, the 2-month wintertime comparisons reveal the significant skill of both SILL and VILL radar sites (especially the former), with moderate RMSE and correlation coefficients (CORR) above 0.85. HFR appears to properly capture the main peaks of Hs and the minimal spatial variation between both sites. The results derived from the best linear fit of scatterplots show that the slope is close to 1, although HFR estimations seem to slightly overestimate Hs field in the Galician region. Since these results are in line with previous literature on HFR-buoy wave height comparisons [7,16,18], we can state that HFR performance is consistent and it can act as a useful ancillary tool, especially when no in situ wave observations are available, as occurred with the B2 buoy during February 2014 (Figure 2b).

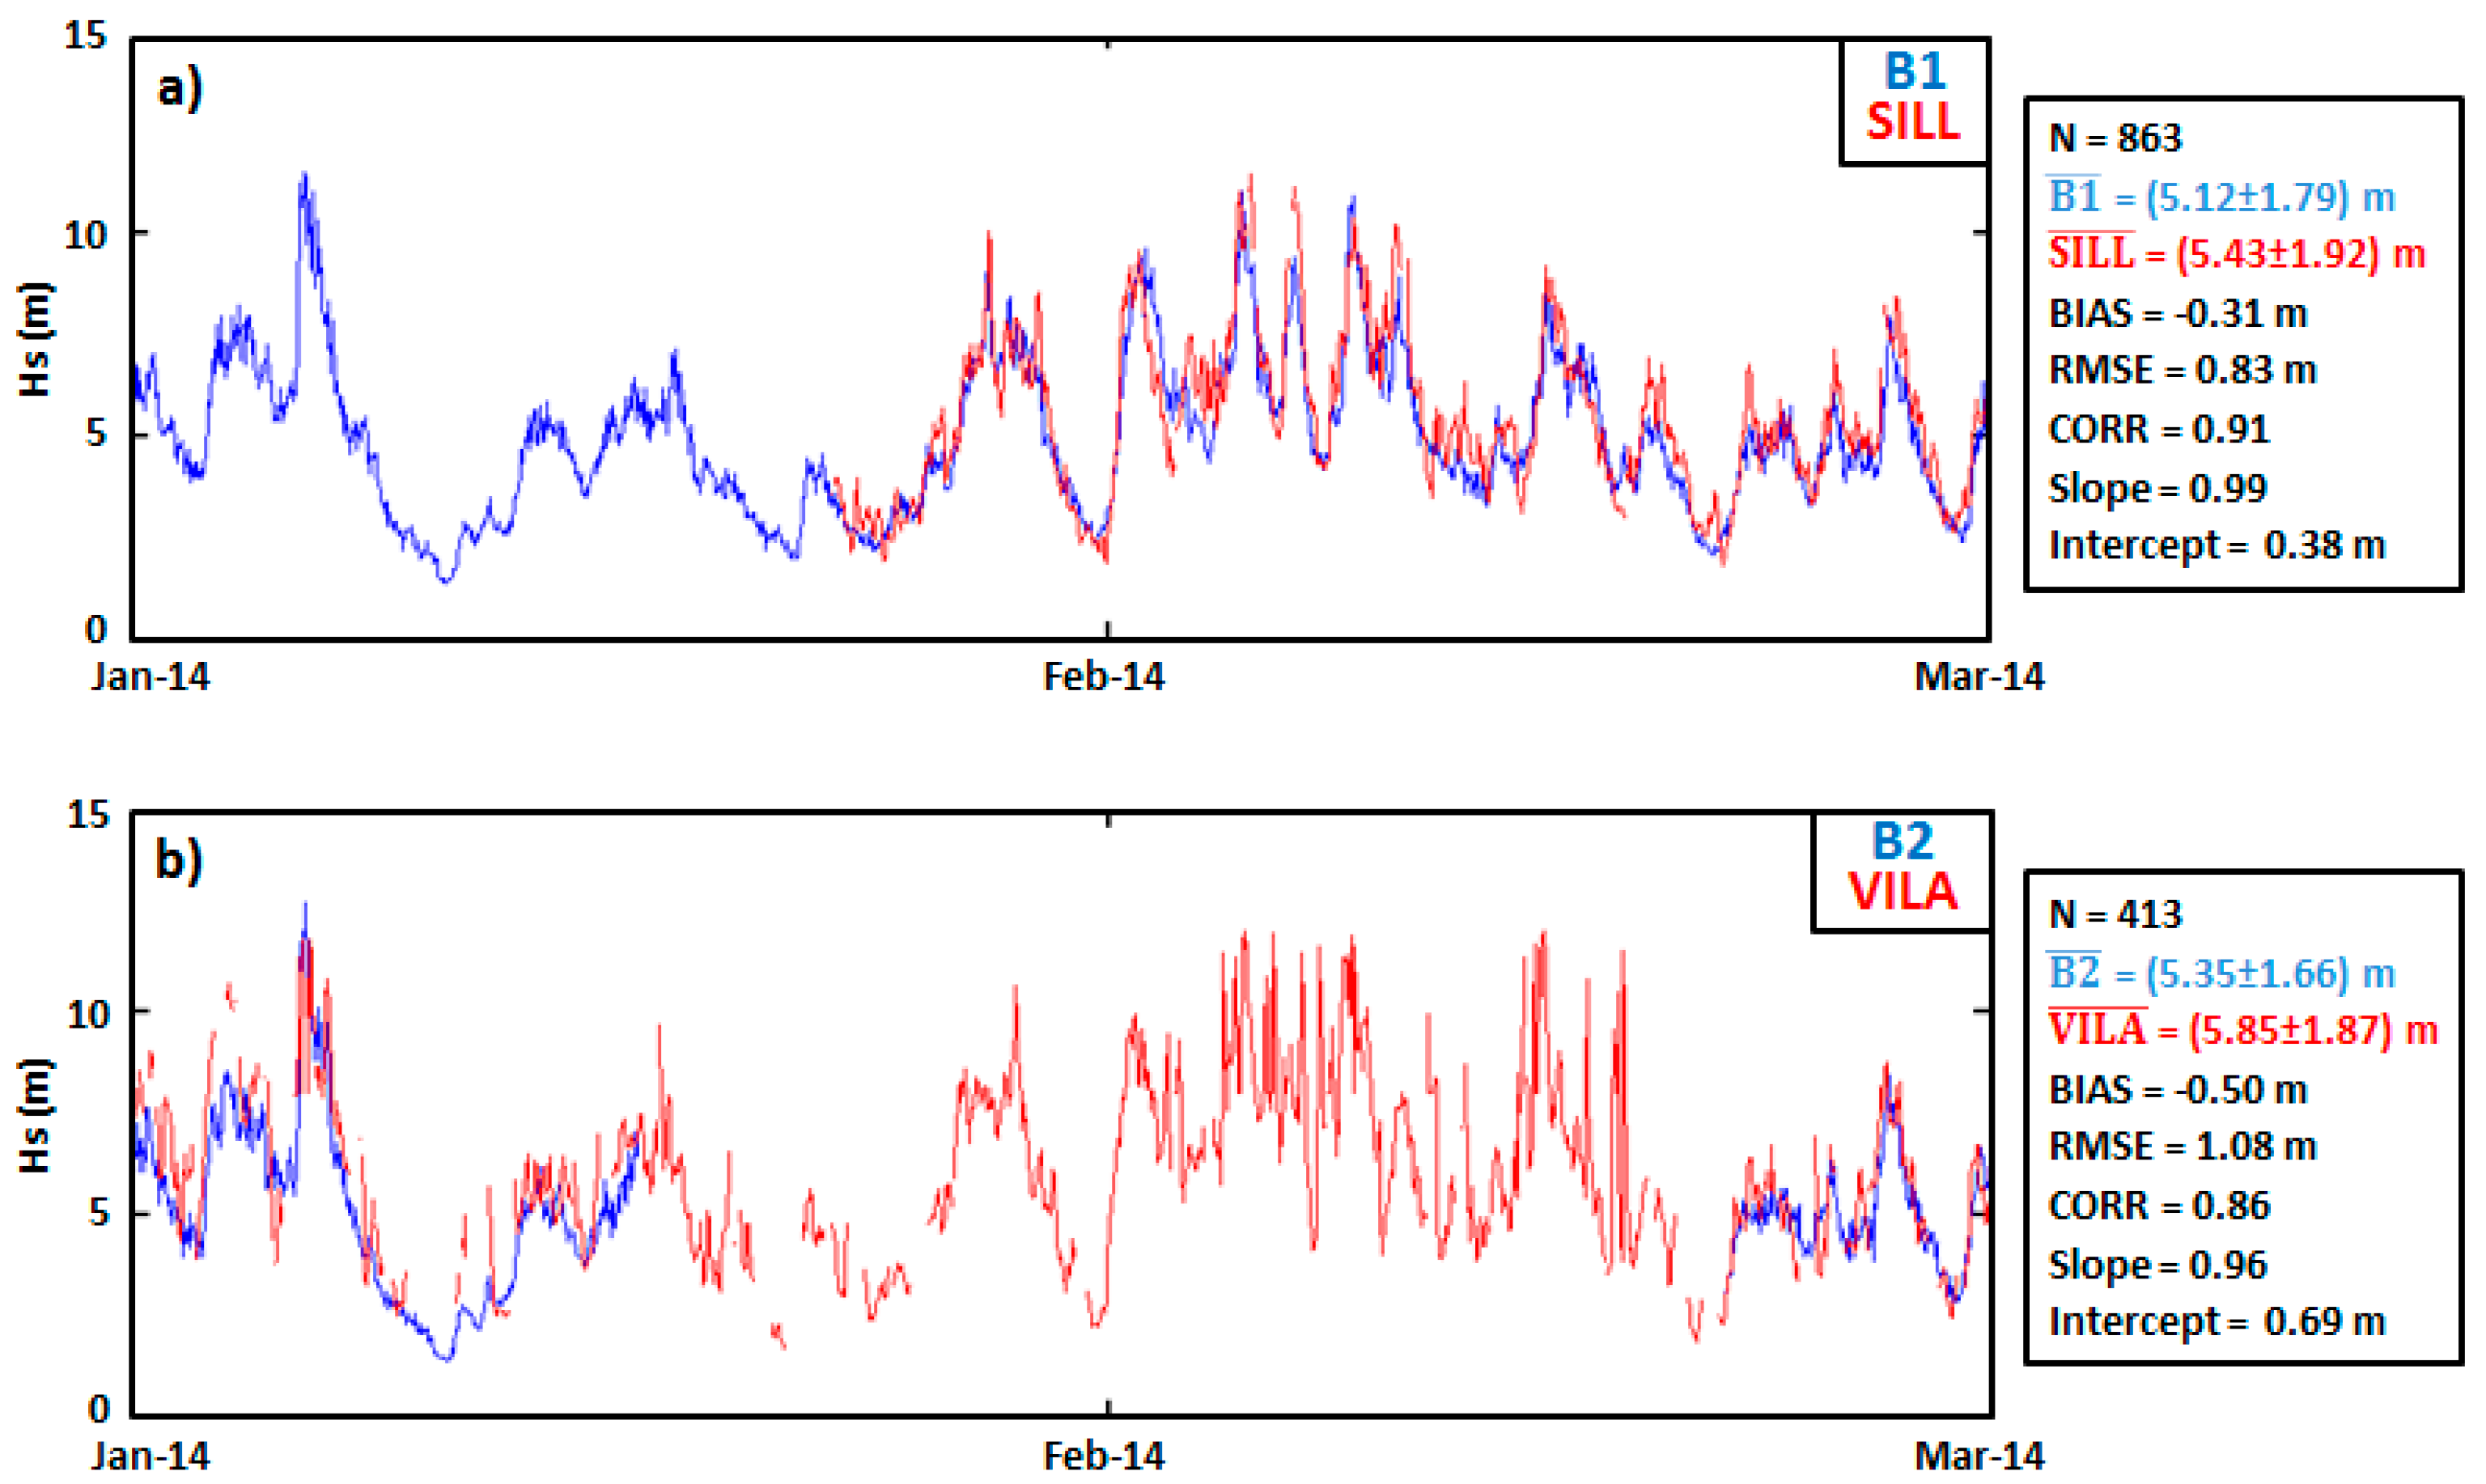
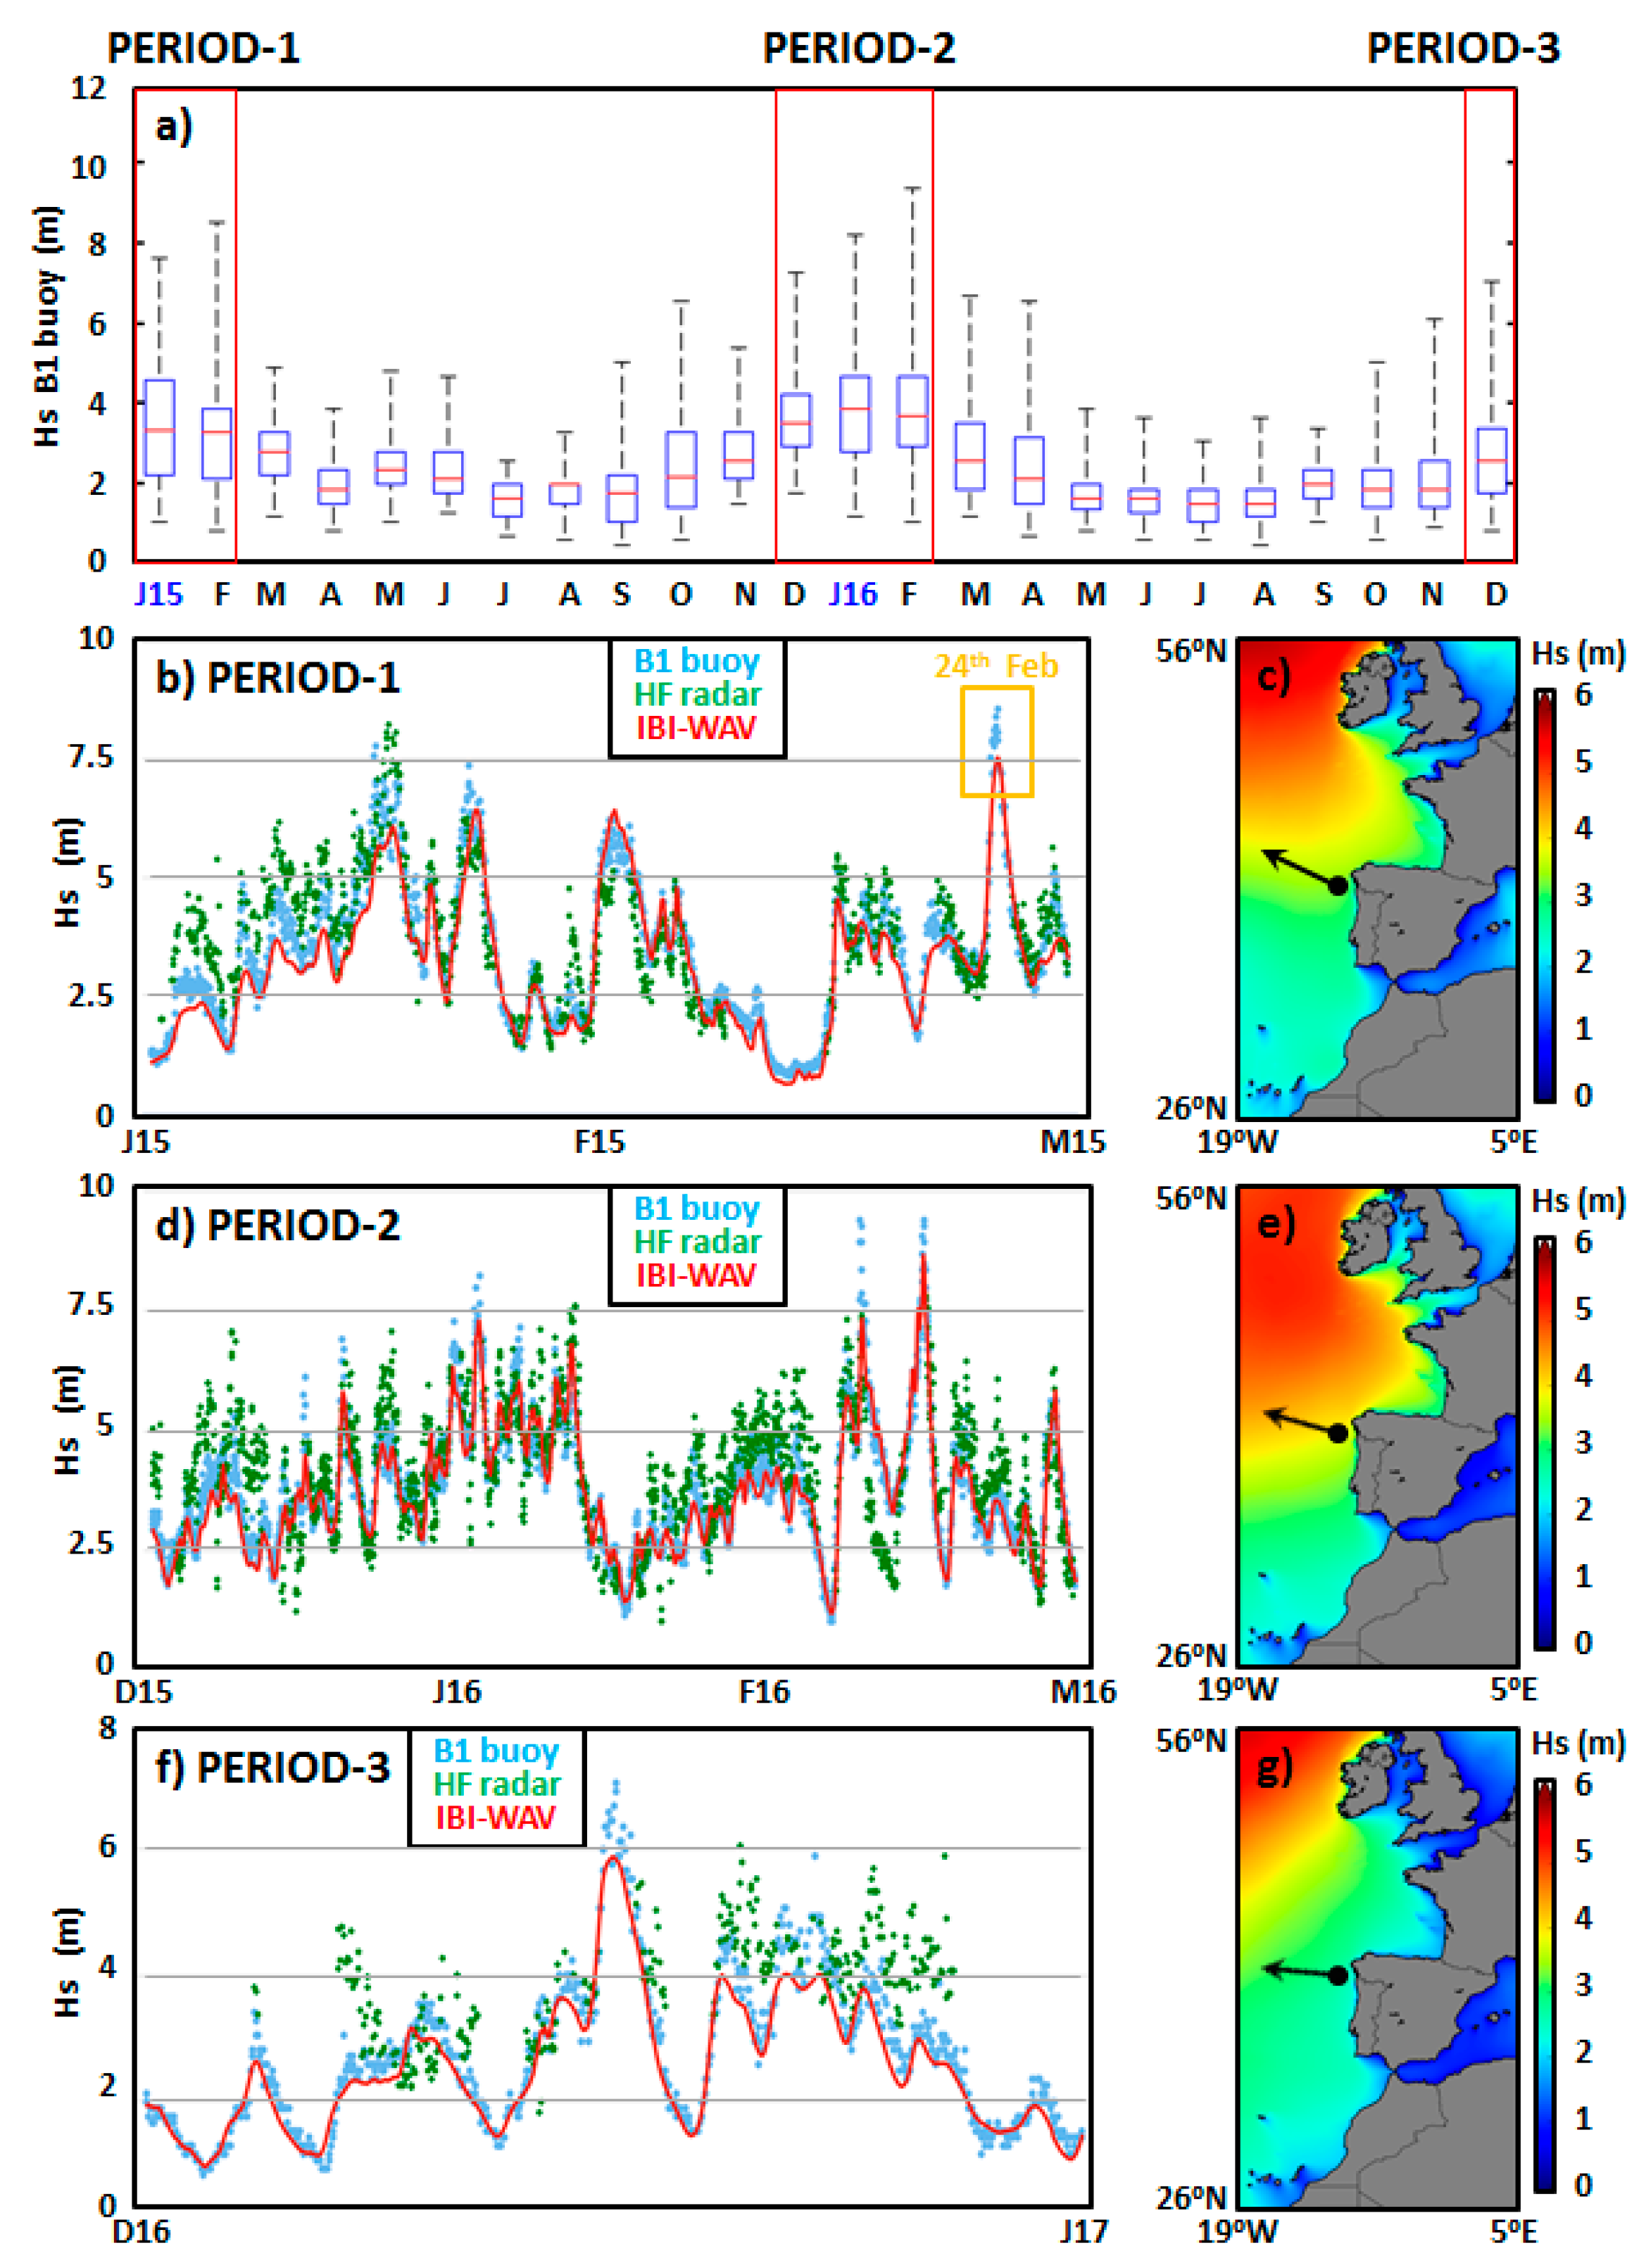
3.2. Analysis of Extreme Wave Height Events in Galicia (2015–2016)

Monthly boxplots of Hs estimated by the B1 buoy (Figure 3a) exhibit a consistent seasonal evolution with a median (central mark) above 3 m for wintertime months (except December 2016) together with relevant peaks of Hs above 7 m. On the contrary, minimum median values can be observed during the months of July and August. Three different periods have been selected (red boxes in Figure 3a) according to a criterion based on the most extreme Hs events: period 1 (January–February 2015), period 2 (December 2015–January 2016–February 2016), and period 3 (December 2016).
In this context, specific intercomparisons of Hs have been conducted for the three selected periods, by using in situ measurements (B1 buoy), remote-sensed estimations (SILL HFR site), and modeled data (IBI-WAV) in the closest grid point (Figure 3b,d,f). As it can be seen, there is a significant resemblance among the three data sources. This statement is supported by the skill metrics gathered in Table 1, with RMSE and CORR values in the ranges of 0.38–1.09 m and 0.73–0.97, respectively. The main peaks are fairly well captured, although some of the most extreme wave height events (above 99th percentile, as shown in Table 2) are not perfectly captured by the model as shown in Figure 3b for the 24 February. The modeled synoptic wave features for this specific day are presented in Figure 1b.
Broadly speaking, IBI-WAV seems to be precise for a wide range of Hs values but also slightly underestimates the most extreme Hs events. However, HFR appears to generally overestimate the in situ significant wave height values registered in the Galician region. Regarding the synoptic characteristics of the wave field, the time-averaged Hs patterns predicted in the IBI area related to the three selected periods are rather similar (Figure 3c,e,g) and in line with previously reported climatological data [19]. Significantly high Hs values ( H s ¯ > 5 m) are found on the western coast of Ireland. A latitudinal gradient is clearly evidenced with Hs values dropping to 2.5 m in the north of the Canarias Islands. In the Galician region, mean Hs values range from 3 m (period 3, Figure 3g) to 4 m (period 2, Figure 3e) and the mean incoming wave direction is the W-NW sector.
Figure 4 shows the results derived from the intercomparison of the 6-month overall period composed of the three selected wintertime intervals. The Q-Q plots confirm the aforementioned slight overestimation of HFR-derived wave height measurements for the entire range of Hs values (Figure 4a). IBI-WAV performance is accurate, despite underestimating the most extreme events (Hs above 8 m, Figure 4b). The Q-Q plot between HFR and IBI-WAV exhibits that the former provides higher values (Figure 4c). The comparison of Hs versus Tp reveals the relevant agreement between the B1 buoy and IBI-WAV, with the most predominant values (red dots) lying in the ranges of 2.8–4.8 m and 12–16 s, respectively (Figure 4d,f).
Some discrepancies are detected for HFR, mainly related to the aforementioned Hs overestimation and some limitations to capture the longest Tp events, mostly constrained to 16 s (Figure 4e). In terms of mean incoming wave direction, once again the concordance between the B1 buoy (Figure 4g) and IBI-WAV (Figure 4i) is noticeable, with NW and W-NW as the predominant sectors (prevailing the former) and residual waves coming from the southern directions. By contrast, HFR seems to indicate that NW and W-NW sectors are almost equally prevalent (Figure 4h).

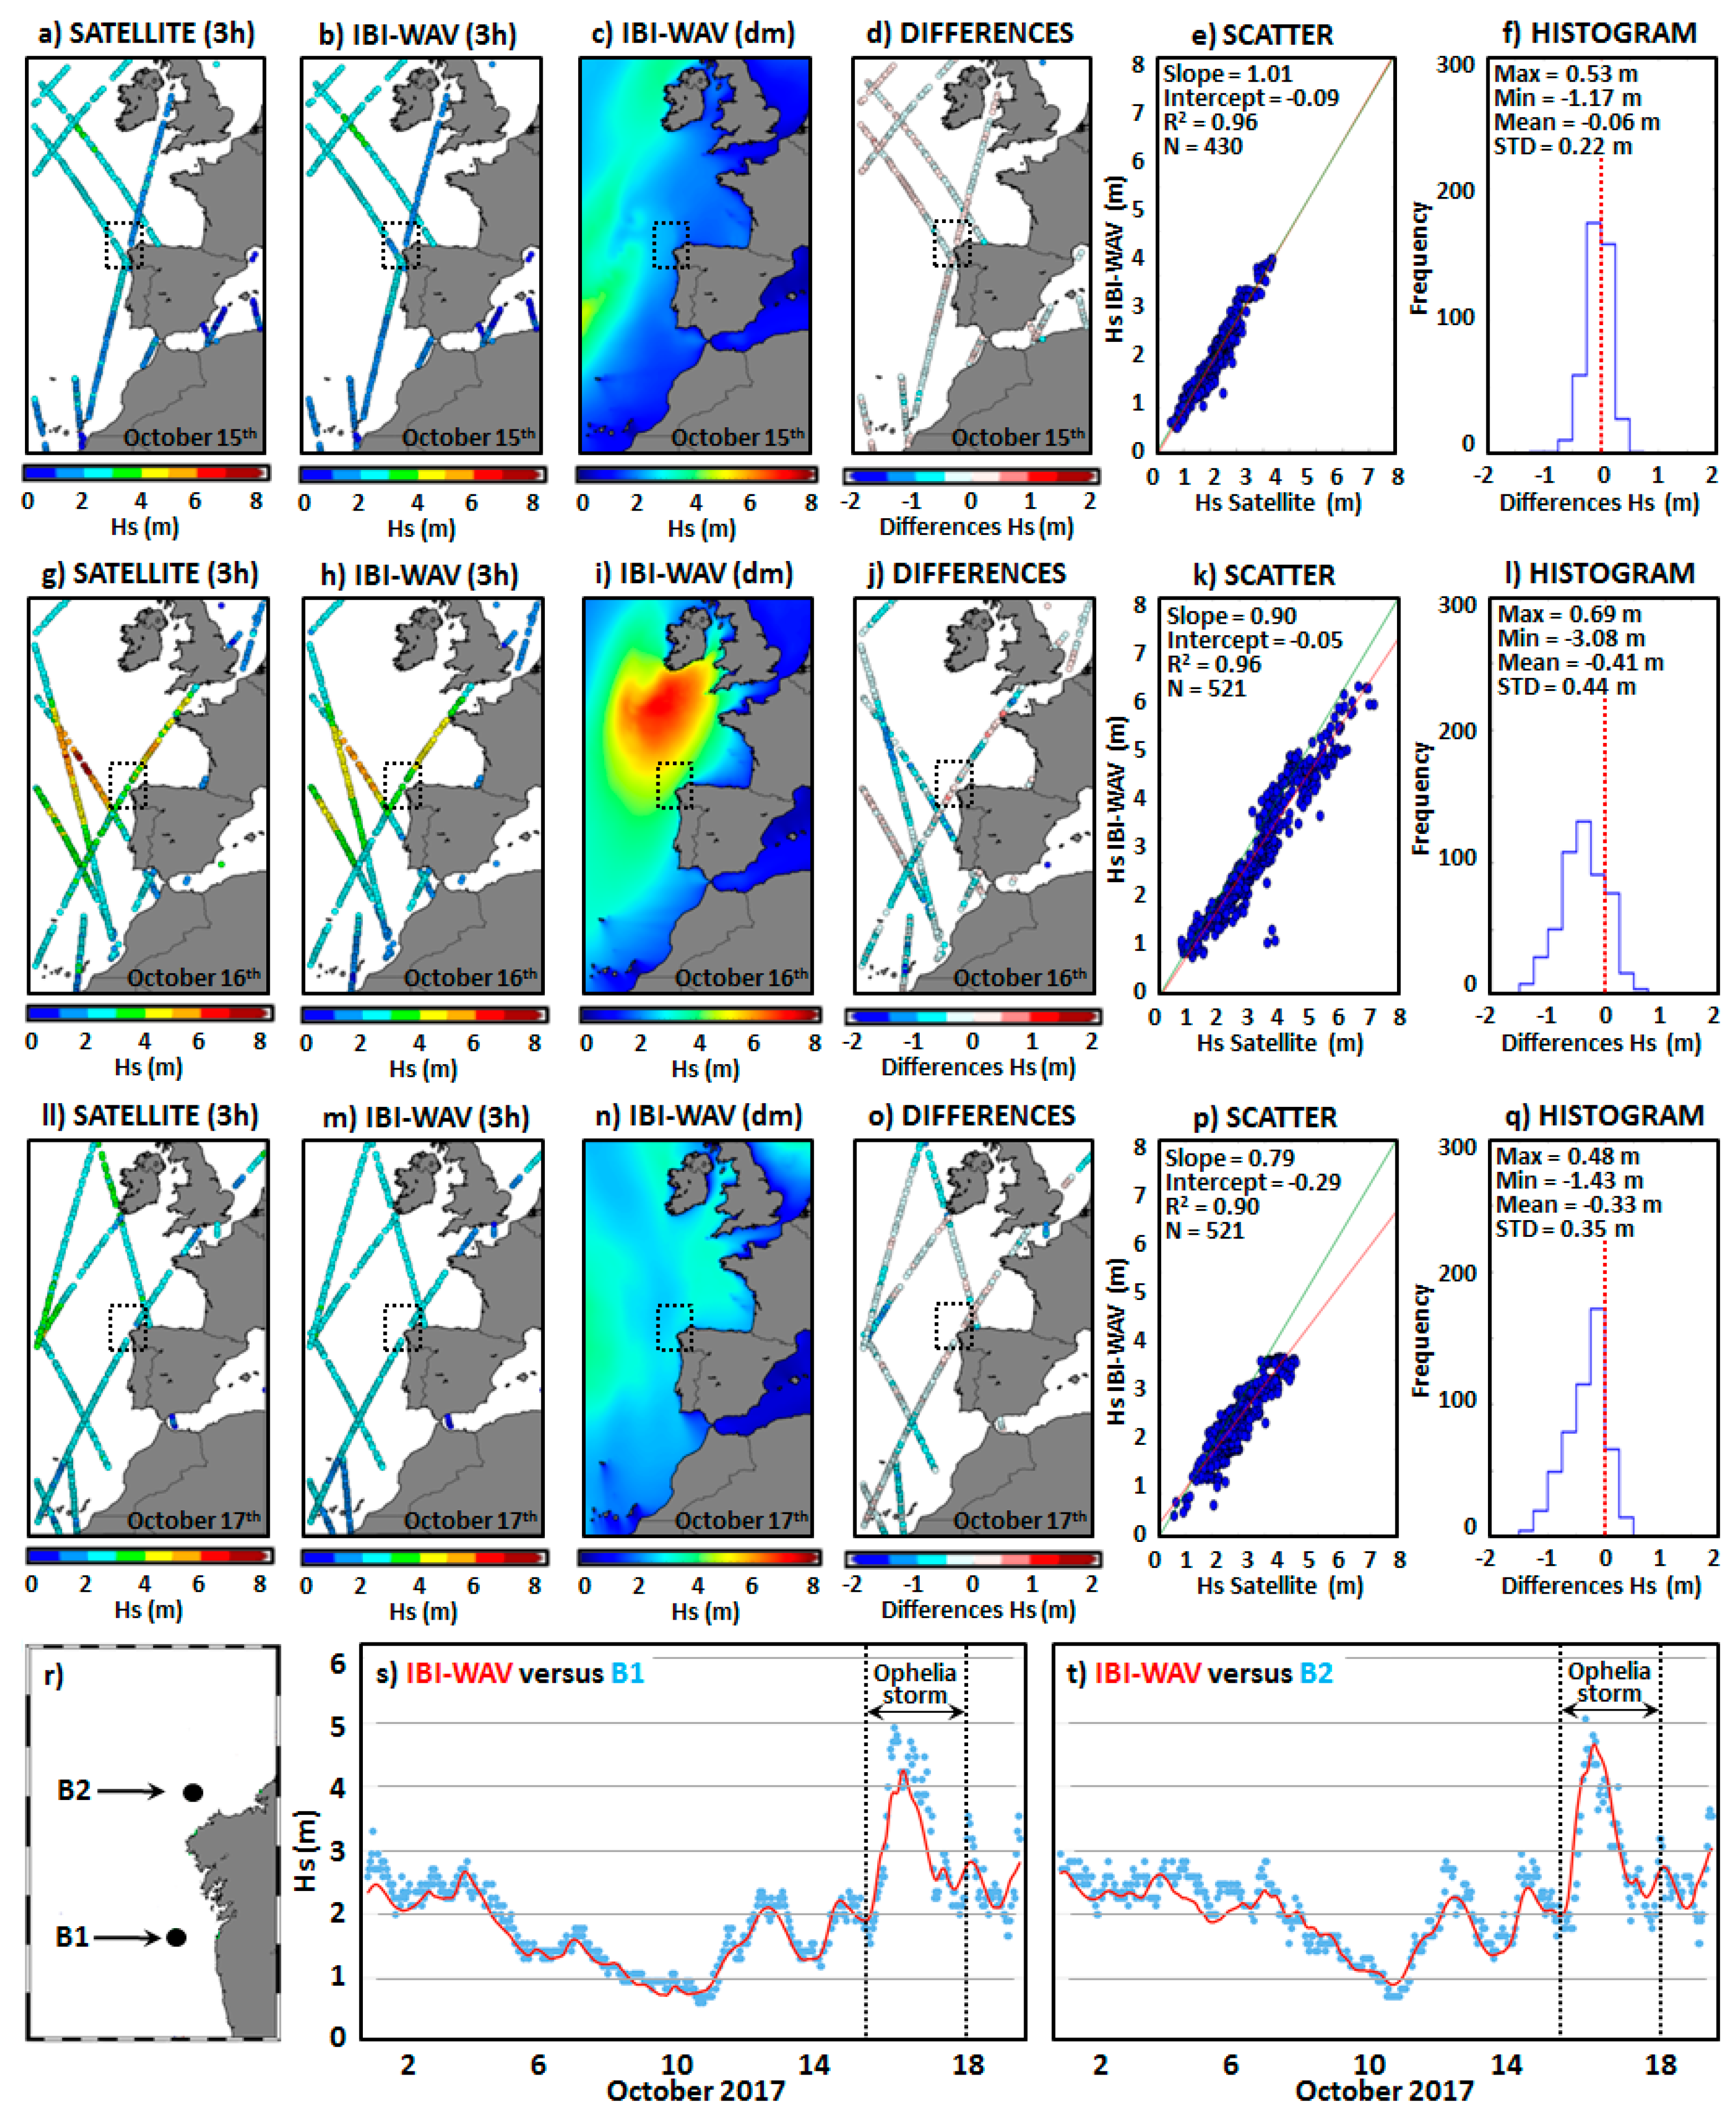
3.3. Use of Satellite-Sensed and IBI-WAV Hs Estimations to Analyze the Impact of Storm Ophelia (October 2017)

Ophelia intensified into a major hurricane on 14 October south of the Azores, brushing the archipelago with severe weather conditions. Shortly after achieving peak intensity, Ophelia weakened and accelerated to the northeast, completing an extratropical transition. The impact of storm Ophelia within the IBI area could already be monitored on 15 October (Figure 5a–c) with effects spanning over distant areas. Although the cyclone remained far offshore, a belt of significantly high waves (3–5 m) was observed from the SW to the NE, along with swells that were already affecting the western Irish coast (Figure 5c). Widely speaking, the validation of IBI-WAV against satellite-derived data reveals that the model was rather precise during the pre-storm conditions, as reflected by the statistical indicators: maps and histogram of differences and best linear fit of scatterplot (Figure 5d–f).
On 16 October, Ophelia’s northeasterly pathway was clearly tracked in the Atlantic wave field with a noticeable enhancement in Hs on the Galician coast (Figure 5g,h). The core of the storm, on average, was about to make landfall over Southern Ireland (Figure 5i), giving rise to sustained wind speeds up to 110 km·h−1 together with extreme wave heights (above 8 m). The IBI-WAV performance was accurate (Figure 5j–l) despite the most energetic wave peaks not being completely reproduced. Early on 17 October, the cyclone crossed the North Sea and struck Western Norway with wind gusts up to 70 km·h−1 before weakening during the evening and eventually dissipating. Remaining effects of the tail of the storm (waves up to 4 m) were detected at several areas within the IBI area (Figure 5ll–n). IBI-WAV appeared to underestimate Hs values in Western Ireland and also far away in front of the Galician coast with differences in the range of 0.5–1 m (Figure 5o). Overall, the skill metrics were consistent (Figure 5p,q). Finally and according to the multi-platform approach adopted, IBI-WAV prediction in the Galician coast (red line) was validated against in situ Hs estimations (blue dots) provided by both the B1 and B2 buoys (Figure 5r–t). There is a significant resemblance in the Hs time series during October 2017, capturing the passage of storm Ophelia. Once again, the IBI-WAV appeared to underestimate the most extreme Hs events.

4. Discussion

On average and according to the proposed observations model approach, wave height events in Galicia are defined as high (extreme) when Hs exceeds 5.2 (7.2) m (Table 2) and take place predominantly in the wintertime (defined as December-January-February). The associated peak period lies typically in the range of 13–19 s, whereas the prevailing incoming wave direction is the NW sector (Figure 4d–i). In terms of overall frequency, 29 (6) high (extreme) wave height hourly events per month were registered during wintertime, with February being the month when the highest peaks (up to 9.38 m) were recorded during the two-year study period (2015–2016).
HFR has been proven to be a valid shore-based remote-sensing instrument to efficiently monitor the wave field in the Galician region, with skill metrics (CORR above 0.85) in accordance with those reported elsewhere [7,8,16,17]. However, HFR seems to slightly overestimate not only the time-averaged Hs values (Table 2) but also those waves of higher amplitude (Figure 4a) as previously described [20]. Large antenna sidelobes and current variability might be interpreted as wave signals in the inversion method, which would lead to overestimation of the wave height [21]. This is especially true for low sea states when the strength of the second-order spectra is very weak and therefore such spurious contributions to the spectrum would have a more relevant impact.
Previous studies have acknowledged that the discrepancies detected here in the mean wave direction and peak period might be partially attributable to several factors: (i) such parameters are much more sensitive to non-sea signals (interference or ships) in the radar backscatter; (ii) in low sea states directional spectra can be contaminated by noise due to spurious features that are probably associated with antenna sidelobes [16,20]; (iii) the distance (20 km) between the B1 buoy and the selected radar range cell (RC-5) is non-negligible and therefore the wind field over this region could be non-uniform. Moreover, the underestimation observed in the peak period at higher Hs (Figure 4e) has been directly related to the overestimation of high-frequency energy, which becomes more serious as Hs increases [20].
Since previous HFR applications to wave measurements are mostly limited to short time intervals, additional development efforts should focus on (i) the long-term skill assessment against in situ devices [17,22], and (ii) the quality control of remote-sensed wave data, which have not been as extensively explored since they are much more sensitive to noise of the Doppler spectrum than current estimations.
A multi-platform skill assessment of the CMEMS IBI-WAV forecasting product has been conducted. In Galicia, IBI-WAV performance is accurate, although a limited underestimation has been observed for extreme Hs events (99th–100th percentiles) as reflected in Figure 3b,d,f and Figure 4b. Such model underestimation, which has been previously reported [23], could be partially explained by the inadequate spatiotemporal resolution of the wind field used as input to force the wave model. A higher temporal resolution (from 3-hourly to hourly) might significantly enhance the predictive skills of IBI-WAV. In terms of peak period and mean wave direction, IBI-WAV is able to properly reproduce the main wave features during wintertime.
Since in situ devices present some instrumental limitations and HFR is constrained to uniquely overlook coastal areas, the coordinated use of IBI-WAV and wave altimetry can provide detailed wave information on a synoptic scale for specific severe weather episodes. Both were able to capture the impact of storm Ophelia on the Hs field during the storm’s 3-day track over Ireland and the UK (Figure 5). Skill metrics show the significant accuracy of IBI-WAV with a daily coefficient of determination (R2) above 0.90. The histograms of differences exhibit a nearly symmetrical Gaussian-like shape clustered around zero mean and shifted slightly to negative values as indicated by the mean value that lies between −0.41 and −0.03 m (Figure 5f,l,q). This underestimation was also manifested on 16 October when Ophelia was about to reach the southern Irish coast: IBI-WAV again underestimated the peak values of Hs (around 8 m). Regarding the Galician region, the resemblance between satellite and IBI-WAV is relevant as the former overpassed this area each day, reporting wave heights in the range of 0.5–4 m.
Finally, there are currently some ongoing actions focused on (1) the inclusion of the CMEMS-wave observational products derived from Sentinel-3A mission measurements as part of the pool of satellite data sources used to validate the IBI-WAV forecast product; (2) the intercomparison of the IBI-WAV product against other CMEMS and non-CMEMS wave model solutions in overlapping regions in order to infer strengths and weaknesses of each operational system. Special emphasis should be placed on providing not only confidence intervals related to in situ wave observations (used here as the benchmark) but also the estimation of uncertainty bands associated with wave model forecast in order to gain consistency in the data analysis and thus deeper insight into the accuracy and skill of each prediction system.

5. Conclusions

A two-year (2015–2016) characterization of the most extreme wintertime wave height events in Galicia (NW Spain) has been conducted. To this aim, robust HFR-derived wave parameters and IBI-WAV model predictions were used in concert on an hourly basis. The results reveal that waves can be considered as extreme when Hs exceeds 7.2 m and the prevailing incoming wave direction is in the NW sector. Equally, skill metrics indicate that IBI-WAV performance was rather consistent with a wide range of sea states despite underestimating the most extreme wave height events. The HFR system has been demonstrated to be a sound remote sensing tool to retrieve wave information in coastal areas, although a slight overestimation was detected in Hs measurements. Additionally, satellite-derived three-hourly wave height estimations were employed to assess the skill of the IBI-WAV model product during the passage of Ophelia—one of the major hurricanes on record for the easternmost Atlantic—during its 3-day track over Ireland and UK (15–17 October 2017). Overall, these results prove that a synergistic observational and modeling approach can provide a comprehensive characterization of severe wave conditions in coastal areas and show benefit from the complementary nature of both systems.

Acknowledgments

The authors gratefully acknowledge: (i) Qualitas Remos Company for their useful technical suggestions and (ii) INTECMAR and Xunta de Galicia for providing the HF radar wave data (VILA site). The authors also would like to thank the support by Interreg Atlantic Area project MyCOAST (EAPA 285/2016) co-funded by the ERDF (EU).

Author Contributions

Experiment design, selection of study area and draft of the manuscript were done by Pablo Lorente and Marcos G. Sotillo. Wave model data processing was conducted by Lotfi Aouf., Alice Dalphinet, Romain Rainaud, Jose Maria García-Valdecasas, Ernesto Barrera, Cristina Toledano and Arancha Amo-Baladrón. High-frequency radar data processing was carried out by Silvia Piedracoba and Ana Basañez. In situ data processing was done by Marta De Alfonso. Supervision and advice on data interpretation were done by Enrique Álvarez-Fanjul, Marcos G. Sotillo and Vicente Pérez-Muñuzuri.

Conflicts of Interest

The authors declare no conflicts of interest.

References

  1. Gleizon, P.; Campuzano, F.; Carracedo, P.; Martinez, A.; Goggins, A.; Atan, R.; Nash, S. Wave energy resources Along the European coast. In Marine Renawable Energies; Springer: Cham, Switzerland, 2017; pp. 37–69. ISBN 978-3-319-53536-4. [Google Scholar]
  2. Iglesias, G.; López, M.; Carballo, R.; Castro, A.; Fraguela, J.A.; Frigaard, P. Wave energy potential in Galicia (NW Spain). Renew. Energy 2009, 34, 2323–2333. [Google Scholar] [CrossRef]
  3. Sembiring, L.; Van Ormondt, M.; Van Dongeren, A.; Roelvink, D. A validation of an operational wave and surge prediction system for the Dutch coast. Nat. Hazards Earth Syst. Sci. 2015, 15, 1231–1242. [Google Scholar] [CrossRef]
  4. Carraccedo, G.P.; Balseiro, C.F.; Penabad, E.; Gómez, B.; Pérez-Muñuzuri, V. One Year Validation of Wave Forecasting at Galician Coast. J. Atmos. Ocean Sci. 2005, 10, 407–419. [Google Scholar] [CrossRef]
  5. Bell, R.J.; Gray, S.L.; Jones, O.P. North Atlantic storm driving of extreme wave heights in the North Sea. J. Geophys. Res. Oceans 2017, 122, 3253–3268. [Google Scholar] [CrossRef]
  6. Guimaraes, P.V.; Farina, L.; Toldo, E.E., Jr. Analysis of extreme wave events on the southern coast of Brazil. Nat. Hazards Earth Syst. Sci. 2014, 14, 3195–3205. [Google Scholar] [CrossRef]
  7. Atan, R.; Goggins, J.; Harnett, M.; Nash, S.; Agostinho, P. Assessment of extreme wave height events in Galway Bay using High Frequency radar (CODAR) data. In Renewable Energies Offshore; CRC Press: Boca Raton, FL, USA, 2015; pp. 49–56. [Google Scholar]
  8. Atan, R.; Goggins, J.; Harnett, M.; Agostinho, P.; Nash, S. Assessment of wave characteristics and resource variability at a ¼-scale wave energy test site in Galwat Bay using waverider and high frequency radar (CODAR) data. Ocean Eng. 2016, 117, 272–291. [Google Scholar] [CrossRef]
  9. Ardhuin, F.; Rogers, E.; Babanin, A.; Filipot, J.-F.; Magne, R.; Roland, A.; Van der Westhuysen, A.; Queffeulou, P.; Lefevre, J.-M.; Aouf, L.; Collard, F. Semi empirical dissipation source functions for wind-wave models: Part I, definition and calibration and validation. J. Phys. Oceanogr. 2010, 40, 1917–1941. [Google Scholar] [CrossRef]
  10. Janssen, P.; Aouf, L.; Behrens, A.; Korres, G.; Cavalieri, L.; Christiensen, K.; Breivik, O. Final Report of Work-Package I of FP7 Research Project MyWave Project; European Commission: Brussels, Belgium, 2014. [Google Scholar]
  11. Aouf, L.; Toledano, C.; Amo-Baladrón, A.; Renaud, R.; Sotillo, M.G. Product User Manual for Atlantic—Iberian Biscay Irish—Wave Analysis and Forecast Product: IBI_ANALYSIS_FORECAST_WAV_005_005. 2017, pp. 1–38. Available online: http://marine.copernicus.eu/documents/PUM/CMEMS-IBI-PUM-005-005.pdf (accessed on 31 March 2017).
  12. Sotillo, M.G.; Aouf, L.; Alfonso, M.; Renaud, R.; Toledano, C.; Lorente, P.; Dalphinet, A. Quality Information Document for Atlantic—Iberian Biscay Irish—Wave Analysis and Forecast Product. 2017, pp. 1–38. Available online: http://marine.copernicus.eu/documents/QUID/CMEMS-IBI-QUID-005-005.pdf (accessed on 31 March 2017).
  13. Copernicus Marine In situ Team. Copernicus In Situ TAC, Real Time Quality Control for WAVES; Copernicus in situ TAC: Toulouse, France, 2017; pp. 1–19. [Google Scholar] [CrossRef]
  14. Crombie, D.D. Doppler spectrum of sea echo at 13.56 Mc/s. Nature 1955, 175, 681–682. [Google Scholar] [CrossRef]
  15. Lipa, B.J.; Nyden, B. Directional wave information from the SeaSonde. IEEE J. Ocean. Eng. 2005, 30, 221–231. [Google Scholar] [CrossRef]
  16. López, G.; Conley, D.; Greaves, D. Calibration, validation and analysis of an empirical algorithm for the retrival of wave spectra from HF radar sea echo. J. Atmos. Ocean. Technol. 2016, 33, 245–261. [Google Scholar] [CrossRef]
  17. Long, R.M.; Barrick, D.; Largier, J.L.; Garfield, N. Wave observations from Central California: SeaSonde Systems and in situ wave measurements. J. Sens. 2011, 1–18. [Google Scholar] [CrossRef]
  18. Lipa, B.; Barrick, D.; Alonso-Martirena, A.; Fernandes, M.; Ferrer, M.; Nyden, B. Brahan project high frequency radar ocean measurements: currents, winds, waves and their interactions. Remote Sens. 2014, 6, 12094–12117. [Google Scholar] [CrossRef]
  19. Sterl, A.; Caires, S. Climatology, variability and extrema of ocean waves: Web-based KNMI/ERA-40 wave atlas. Int. J. Climatol. 2005, 25, 963–977. [Google Scholar] [CrossRef]
  20. Wyatt, L.R.; Green, J.J.; Gurgel, K.W.; Nieto Borge, J.C.; Reichert, K.; Hessner, K.; Günther, H.; Rosenthal, W.; Saetra, O.; Reistad, M. Validation and intercomparison of wave measurements and models during the EuroROSE experiments. Coast. Eng. 2003, 48, 1–28. [Google Scholar] [CrossRef]
  21. Wyatt, L.R.; Thompson, S.P.; Burton, R.R. Evaluation of high frequency radar wave measurements. Coast. Eng. 1999, 37, 259–282. [Google Scholar] [CrossRef]
  22. Falco, P.; Buonocore, B.; Cianelli, D.; De Luca, L.; Giordano, A.; Iermano, I.; Kalampokis, A.; Saviano, S.; Uttieri, M.; Zambardino, G.; et al. Dynamics and sea state in the Gulf of Naples: Potential use of high-frequency radar data in an operational oceanographic context. J. Oper. Oceanogr. 2016, 9, 33–45. [Google Scholar] [CrossRef]
  23. Hisaki, Y. Inter-comparison of wave data obtained from single high-frequency radar, in situ observation and model prediction. Int. J. Remote Sens. 2014, 35, 3459–3481. [Google Scholar] [CrossRef]
Figure 1. (a) General area of study and High-Frequency (HF) radar coverage area, where arcs are shown emerging concentrically from one radar site. Locations of the B1 and B2 buoys and four radar sites (SILL, FINI, VILA, and PRIO) are marked with filled dots and squares, respectively. Bathymetric contours show depths at 400 and 1500 m; (b) The daily averaged significant wave height (Hs) predicted in the Iberia-Biscay-Ireland (IBI) regional domain (24 February 2015).
Remotesensing 10 00001 g001
Figure 2. Two-month comparison of high-frequency radar (HFR)-derived significant wave height (red line) against in situ observations (blue line). (a) Silleiro site against B1 buoy; (b) Vilano site against B2 buoy. Skill metrics are gathered in black boxes on the right side. N represents the number of hourly observations.
Remotesensing 10 00001 g002
Figure 3. (a) Monthly boxplots of Hs registered at the B1 buoy for a two-year period (2015–2016). In each box, the central mark is the median, the edges of the box are the 25th and 75th percentiles, and the whiskers extend to the most extreme data points. Three periods of maximum Hs values have been selected (red boxes) (bg) (Left) Time series of Hs estimations provided by the B1 buoy (blue dots), SILL radar site (green dots), and IBI-WAV (solid red line) for the three selected periods. (Right) Time-averaged Hs fields predicted by IBI-WAV for the three selected periods. Black filled dots represent the B1 buoy location.
Remotesensing 10 00001 g003
Figure 4. (ac) Q-Q plots derived from the intercomparison between in situ (B1 buoy), remote sensed (SILL radar site—HFR), and modeled (IBI-WAV) Hs data for the 2015–2016 wintertime period: 5–99.9% quantiles were established (red filled dots); (df) Comparison of Hs versus Tp for each data source; (gi) Comparison of the main wave directions registered at the B1 buoy, SILL radar site, and IBI-WAV in the closest grid point, respectively.
Remotesensing 10 00001 g004
Figure 5. (aq) Daily validation of IBI-WAV versus satellite-derived Hs estimations during the movement of storm Ophelia though the IBI area (15–17 October 2017, from top to bottom). The dotted black box represents the study area. Three-hourly (3-h) time steps were selected for performing the comparisons. Daily mean (dm) of IBI-WAV Hs fields are also provided, together with the best linear fit of scatterplots and histograms and maps of daily differences. (r) Location of B1 and B2 buoys within the Galician region. (st) Validation of Hs predicted by the IBI-WAV model (red line) against in situ estimation from B1 and B2 buoys (blue dots), respectively, during October 2017.
Remotesensing 10 00001 g005
Table 1. Skill metrics derived from the intercomparison of modeled wave height data (IBI-WAV) against in situ (B1 buoy) and remote sensed high-frequency radar (HFR) data for three selected wintertime periods.
MetricsPeriod 1
(2 Months)
Period 2
(3 Months)
Period 3
(1 Month)
IBI-WAV Versus…B1HFRB1HFRB1HFR
Hourly data1416111321841904744390
Bias (m)−0.20−0.44−0.13−0.39−0.19−0.96
RMSE (m)0.471.060.411.090.381.03
CORR0.960.740.950.730.970.75
Table 2. Summary of statistical information about the wave height modeled and measured in the Galician region for three selected wintertime periods. N represents the number of hourly events.
HsPeriod 1
(2 Months)
Period 2
(3 Months)
Period 3
(1 Month)
SourceB1HFRIBIWB1HFRIBIWB1HFRIBIW
Hourly data141611131416218419042184744390744
Mean (m)3.343.993.133.834.273.702.714.192.52
Std (m)1.471.371.431.291.461.251.191.151.04
Maximum (m)8.558.57.519.389.838.647.036.025.86
High (P90) (m)5.395.665.335.516.125.484.345.463.85
N Events P9011898128178171196653567
Extreme (P99)7.277.966.897.698.357.256.338.045.79
N Events P99131114221921647

