Gap Analysis Based Decision Support Methodology to Improve Level of Service of Water Services


1
Environmental and Plant Engineering Research Institute, Korea Institute of Civil Engineering and Building Technology, 283, Goyangdae-Ro, Ilsanseo-Gu, Goyang, Gyeonggi-Do 10223, Korea
2
Department of Civil and Environmental Engineering, Yonsei University, 50 Yonsei-Ro, Seodaemun-Gu, Seoul 03722, Korea
3
Department of Engineering Technology, Indiana University–Purdue University (IUPUI), 799 W. Michigan St. ET 314J, Indianapolis, IN 46202, USA
*
Author to whom correspondence should be addressed.
Sustainability 2017, 9(9), 1578; https://doi.org/10.3390/su9091578
Submission received: 28 July 2017
/
Revised: 1 September 2017
/
Accepted: 2 September 2017
/
Published: 5 September 2017
Abstract
:One of water utility’s managerial challenges is to make a balance in between two distinctive managerial goals, cost-effective provision of water service and improving customer satisfaction of water service. As management priorities of the water utility perspective do not reconcile from the customer’s perspective, this gap challenges the sustainable provision of water service. In this study, the new methodology based on a gap analysis was proposed to improve the Overall Level of Service (O-LOS) of water service. Two new indexes (Gap Index [GI] and the Efficiency Index [EI]) were developed to improve the O-LOS and minimize the gap between the customers and the service providers. The methodology proposed in this study is effective in supporting the water utility decisions on budget allocation to make a balance in between the customers’ demand and the service providers’ needs.

1. Introduction
One of water utility’s issues as a water service provider is to balance between the two adverse directions, improving cost-effectiveness by the lowering water charge and customer satisfaction by increasing capital investment. Previous studies show that water utility management mainly focused on a preventive approach, using risk-based methods [1,2,3], cost-benefit methods [4,5], and techniques for water leakage control [6,7,8]. In addition, some studies used numerical and statistical modeling to predict the pipeline failure of critical utility services such as gas networks and potable water mains [9,10].
Water utilities often overemphasize their routine tasks and traditional engineering duties such as operation & maintenance, and capital asset management. Therefore, they may possibly overlook the customers’ perspective directly related to their water service satisfaction. Some previous studies have focused on evaluating customer satisfaction [11,12,13]. However, the previous studies only covered a few subjects, such as water quality and water charge [14,15,16,17]. As aspects and values of water service satisfaction in between a customer and service provider are different [18], a gap in between the two parties gets widened and it makes it difficult to achieve the sustainable provision of water service. Although a few studies conducted for other industries have addressed gap analyses between customers and service providers [19,20], a similar gap analysis for the water industry about improving the level of service (LOS) which specifically included both customers and providers was not known [18].
Improving LOS is a part of enhancing the sustainable development of the water industry. The basic concept of sustainable development is theoritically based on a triple bottom line (TBL) concept, the concept that includes people (social responsibility), planet (environmental stewardship), and profit (economic prosperity), was adopted to enhance sustainability in corporate management [21]. Many public organizations have also adopted the concept to enhance their sustainability performance. The TBL framework consists of a fundamental evaluation framework to improve the organization’s long-term decision-making process [22]. The TBL is used to develop performance indicators (PIs). For instance, international organizations such as the International Water Association (IWA) and American Water Works Association (AWWA) developed PIs for water service [23,24].
As a case study using the TBL, some studies were performed to determine the alternatives regarding sustainability [25,26,27], and a previous study was performed to find out that there is a gap between customer’s and water provider’s perspective while using an AHP analysis [18].
A similar attempt to quantify the gap between customer’s and service provider’s perspectives has been tried in commercial marketing. Parasuraman et al. [28] identified gap patterns from executive interviews in four service categories (retail banking, credit card, securities brokerage, and product repair and maintenance) and developed a service quality model (SERVQUAL). However, Carman [29] criticized the ability of SERVQAUL to measure the value of customer expectations because the greater emphasis was placed on the importance of specific service attributes than on the level of service expected by customers. In response, Cronin and Taylor [30] developed a performance-based method for measuring service quality (SERVPERF), in which service quality or LOS is considered a reflection of the performance perceived by customers [30].
This study is to focus on improving the water industry’s LOS. Two main objectives are (i) to quantify overall LOS regarding water service from customer’s and water provider’s perspective prioritizing budget allocation, and (ii) to develop a methodology reducing a gap in between customers and providers that improve customer satisfaction as well as cost-effective management.
2. Research Approach and Methodology
The New Zealand National Asset Management Steering Group [31,32] suggested a systematic method for developing a manual to reflect the levels of service (LOS) from the customer perspective. The purpose of the manual is to help service providers deliver better customer value, and the manual was developed based on the customers’ review of the LOS provision together with the group’s independent monitoring of performance outcomes. The manual was partially adopted in this work. In addition, as proposed in our previous studies, six customer values, (i) environmental sustainability; (ii) affordability; (iii) quality; (iv) health & safety; (v) reliability & responsiveness; and, (vi) customer service, were considered in the LOS evaluation.
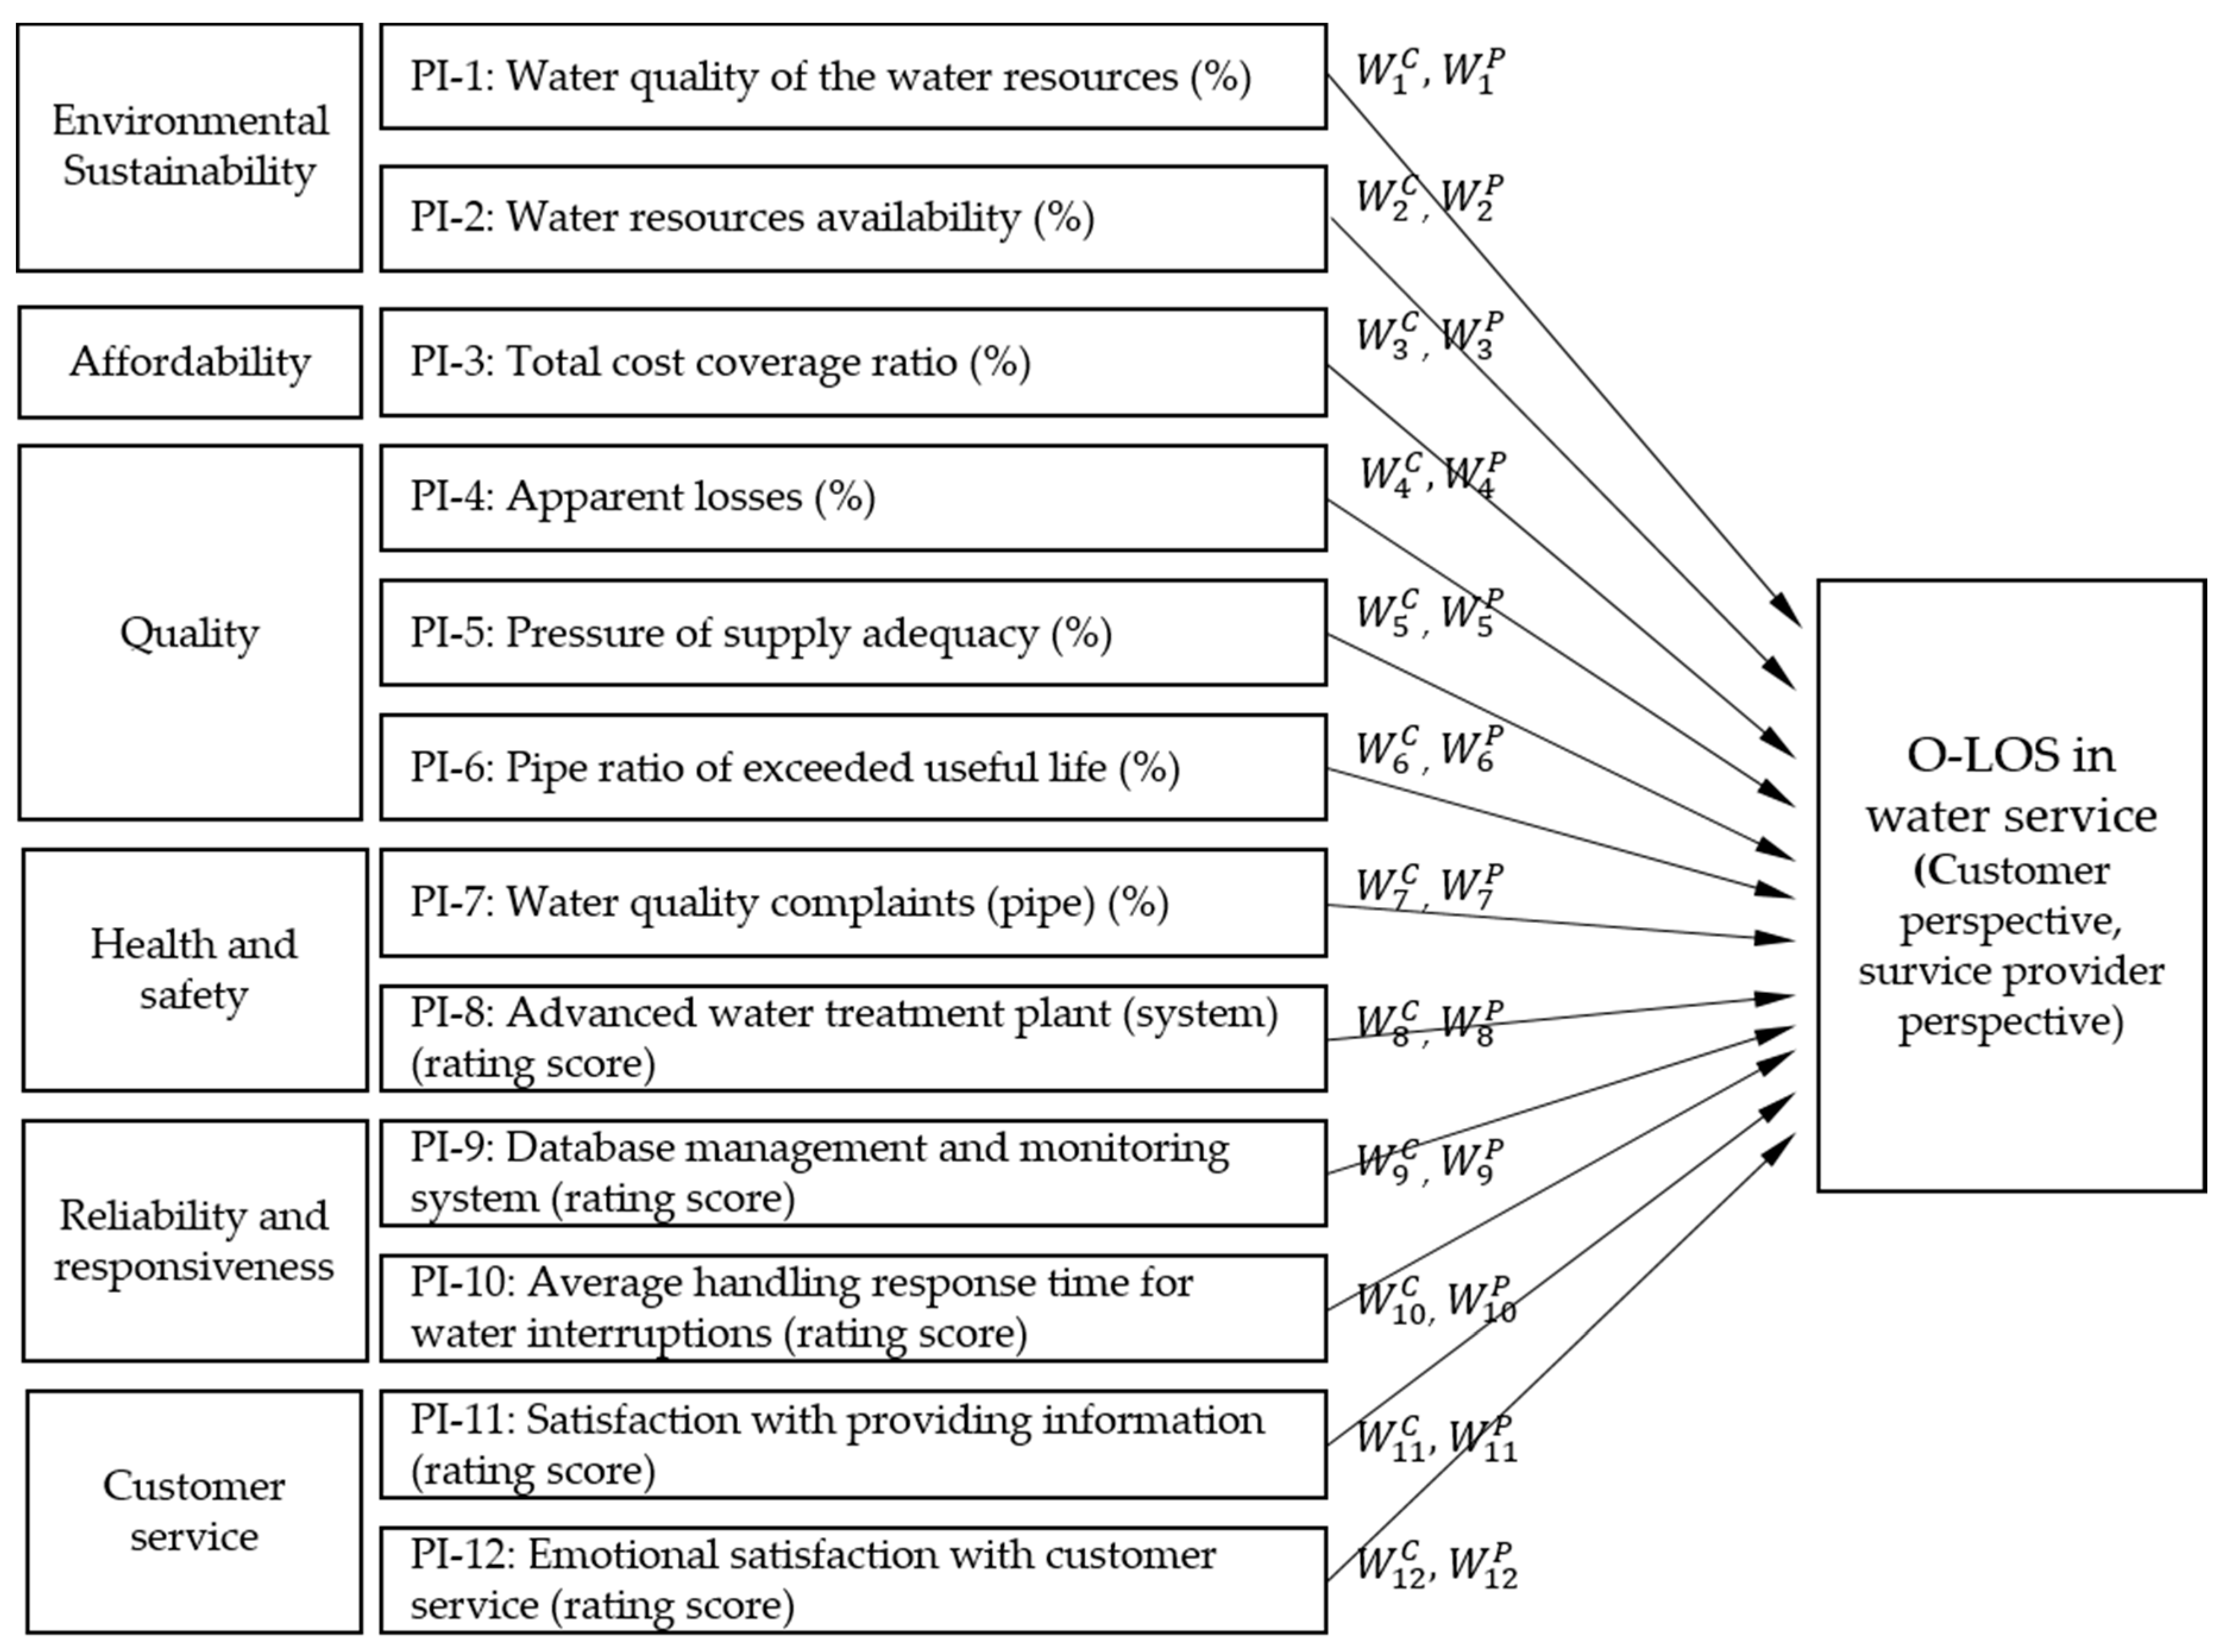
Figure 1 shows that the relative weights of their water service attributes were estimated from the customer perspective [33] and the provider perspective [18]. To evaluate the influence weights of LOS from the customer perspective, the levels of the customer value attributes (Equivalent performance indicators) were defined and their influence weights were measured using a hierarchical survey customer opinion from approximately 800 respondents [33]. To evaluate the influence weights LOS from the service provider perspective, key performance indicators (PIs) were developed, and their influence weights were measured using the analytic hierarchy process (AHP) from eight water service experts [18]. The results show that there is a difference of perceptions between the customer and the service provider regarding water service.
Based upon Cronin and Taylor’s SERVPERF model [30], the overall LOS (O-LOS) was calculated using Equation (1).
Wi is the relative weight of each key PI for the six customer values, and is the score (%, rating score) of each PI. The scheme of the O-LOS calculation was presented in Figure 2. Because the relative weights of PIs are different between the customer and service provider perspectives [18], the O-LOS from the customer perspective (O-CLOS), and the O-LOS from the service provider perspective (O-PLOS) can be estimated differently. On the selected Key PIs, the customer value of ‘environmental sustainability’ can be expressed as the quantity and quality of water resources (PI-1 and PI-2) that should be provided for present and future generations. The customer value of ‘affordability’ can be expressed as the water service level at the lowest possible cost (PI-3). The customer value of ‘quality’ indicates the structural and functional stability and quality of the pipe system, and the water supply pressure (PI-4 to PI-6). The customer value of ‘health/safety’ can be selected as the availability of drinking water and the perspective of risk to customer health and safety (PI-7, PI-8). The customer value of ‘reliability/responsiveness’ represents the reliable and responsive provisions of water services without inconvenience or interruption (PI-9, PI-10). The customer value of ‘customer service’ can be described as the availability of polite and transparent provisions regarding water services (PI-11, PI-12).
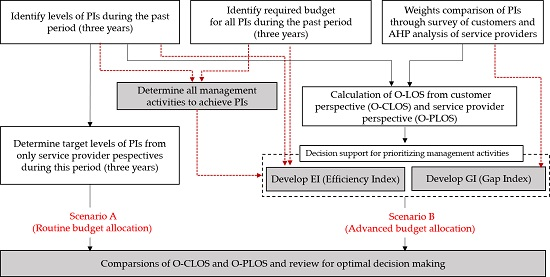
A methodology for advanced decision-making through O-LOS modeling and its flow are presented in Figure 3. According to a traditional asset management process, as service providers frequently attempt to quantify their performance, water providers implement the process that they identify current levels of PIs and determine target levels of Pls. Although the water providers establish three years of budget improving overall PIs, it is difficult to identify budgets for specific PIs, which is appropriately allocated in the Scenario A. The newly proposed O-LOS modeling process includes all the levels of overall water service from two perspectives to support the decision-making for prioritizing management activities using efficiency and gap indices (Scenario B).
3. Development of Indices for O-LOS Modeling
3.1. Identification of All Management Activities
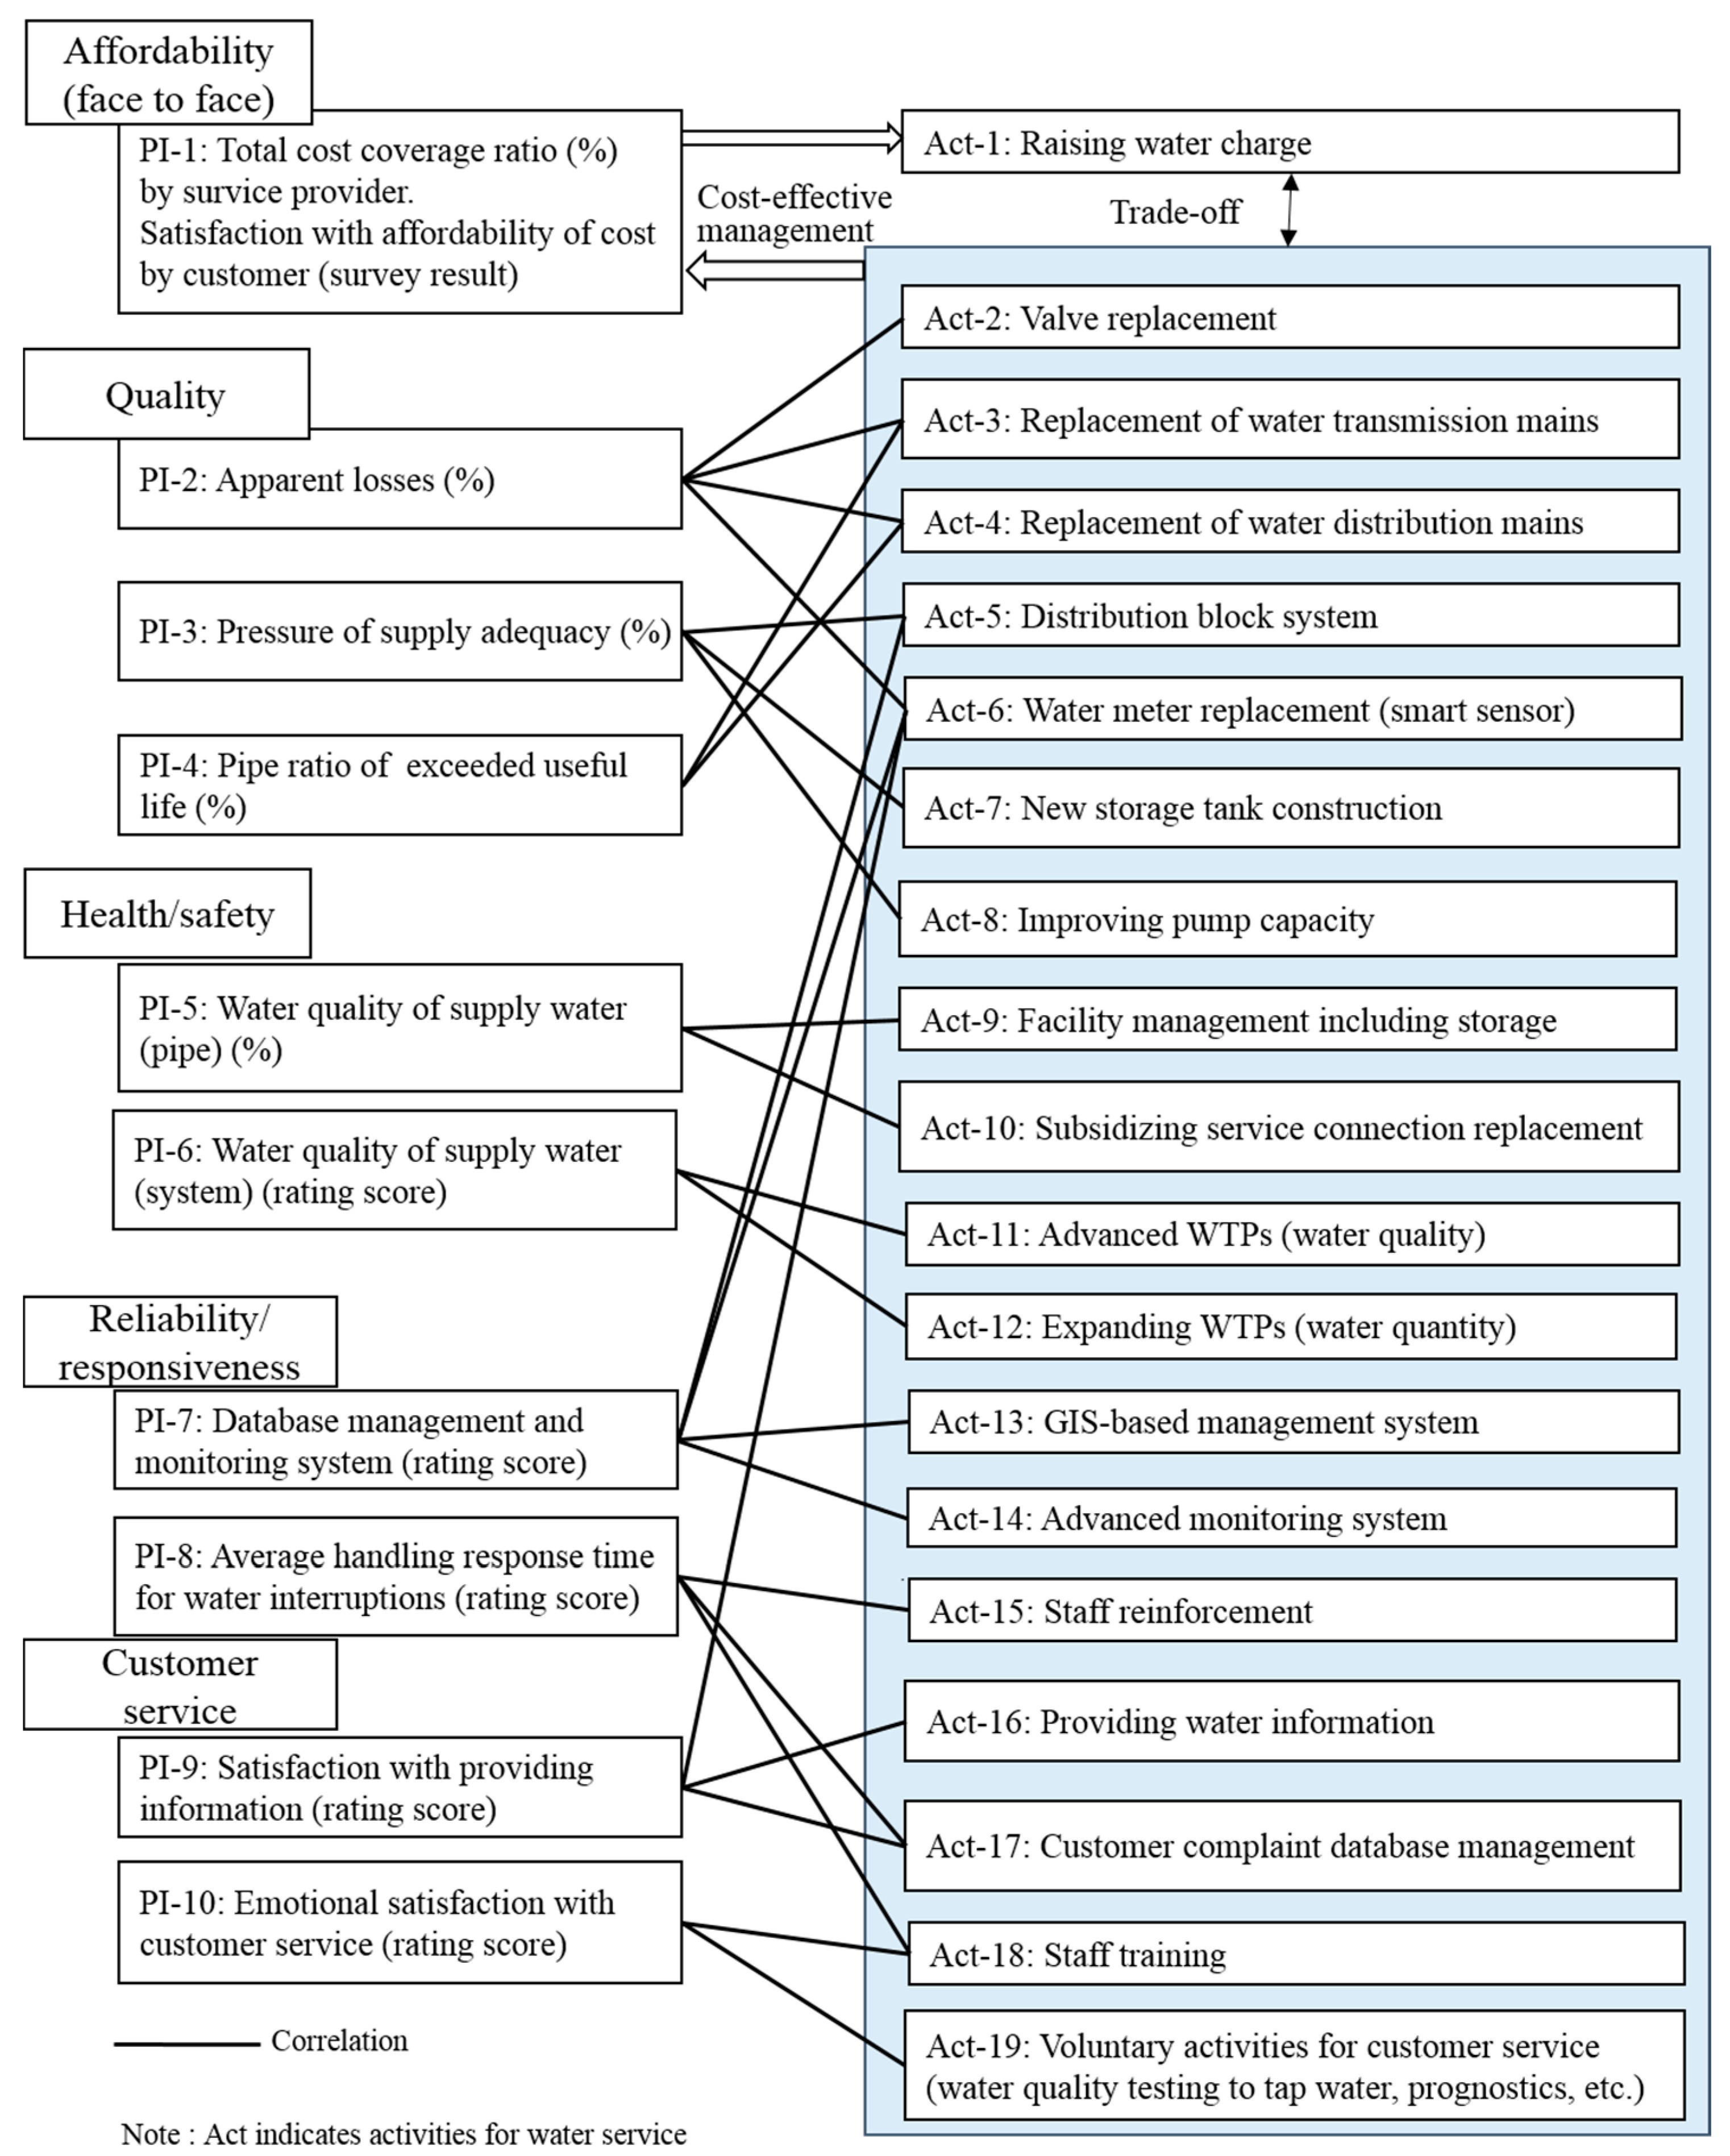
The management activities considered in LOS improvement regarding the customer values are presented in Figure 4. Each management activity (Act) is categorized with respect to the key PIs. This study excludes the two PIs (water resource quality and quantity) of environmental sustainability among 6-customer values. The reasons are that local water utilities cannot involve budgets of management activities with regard to control quantity and the quality of large-scale water resources and PIs of environmental sustainability are also handled according to the master plan of national scale in Korea.
The distinctive feature of ‘affordability’ has the opposite sides of satisfaction between customers and service providers. Customers want an affordable water charge and also to be provided better water service. While service providers continuously invest capital in improving water service, they eventually have to increase water rate that potentially decreases customer’s satisfaction.
In water service, ‘quality’ among customer values could be constituted with key PIs regarding the ability of water supply systems, which was selected as ‘apparent losses’, ‘pressure of supply adequacy’, and ‘pipe ratio exceeded useful life’. To reduce water losses (PI-2), management activities are directly correlated to valve replacement (Act-2), replacement of water transmission mains (Act-3), replacement of water distribution mains (Act-4), and water meter replacement (Act-6). On customer value of ‘health and safety’ as a unique role of drinking water, to improve the water quality of supply water (pipe) (PI-5), the required management activities are directly related to facility management, including storage (Act-9) and subsidizing service connection replacement (Act-10). For water quality of supply water (system) (PI-6), the directly related management activities are using advanced and expanding water treatment systems (Act-11, Act-12).
‘Reliability and responsiveness’ means the capacity of system and manpower when some problems like water pipe breakage accident happen. For database management and monitoring systems (PI-7), the management activities are directly related to the distribution block system (Act-5), water meter replacement (Act-6), GIS-based management system (Act-13), and advanced monitoring system (Act-14). For average handling response time for water interruptions (PI-8), staff reinforcement (Act-15), customer complaint database management (Act-17), and staff training (Act-18) is directly related to the required management activities.
‘Customer service’ could be classified into information provision and emotional satisfaction regarding water service. On improving customer service information (PI-9), water meter replacement (Act-6), water information provision such as online homepage (Act-16), and customer complaint database management (Act-17) are directly related to management activities. Staff training (Act-18) and voluntary activities for customer service (Act-19) are the directly related management activities for customer emotional satisfaction (PI-10).
3.2. Application of Efficiency Index
The concept of cost efficiency is widely used in various areas such as economics, marketing, and engineering. For example, cost performance index utilizes to measure the efficiency of expenses spent on a project [34]. To implement advanced budget allocation, the LOS improvement that can be obtained from a certain budgetary input must be estimated. To address this issue, a new index, the Efficiency Index (EI), was developed for this study (Equation (2)). EI is a type of sensitivity indicator in response to the input cost for improving the LOS.
is the extent of the improvement in LOS for a specific PI, and is expressed in Equation (3).
Here, is the target value of the performance indicator’s LOS in the future, and is the current value of the performance indicator’s LOS (performance measure) in the current year. can be expressed by comparing PI’s levels among similar water utilities. Therefore, is expressed as following Equation (4).
Here, is the worst performance measurement value of PIi, and is the relevant performance measurement value of a specific utility.
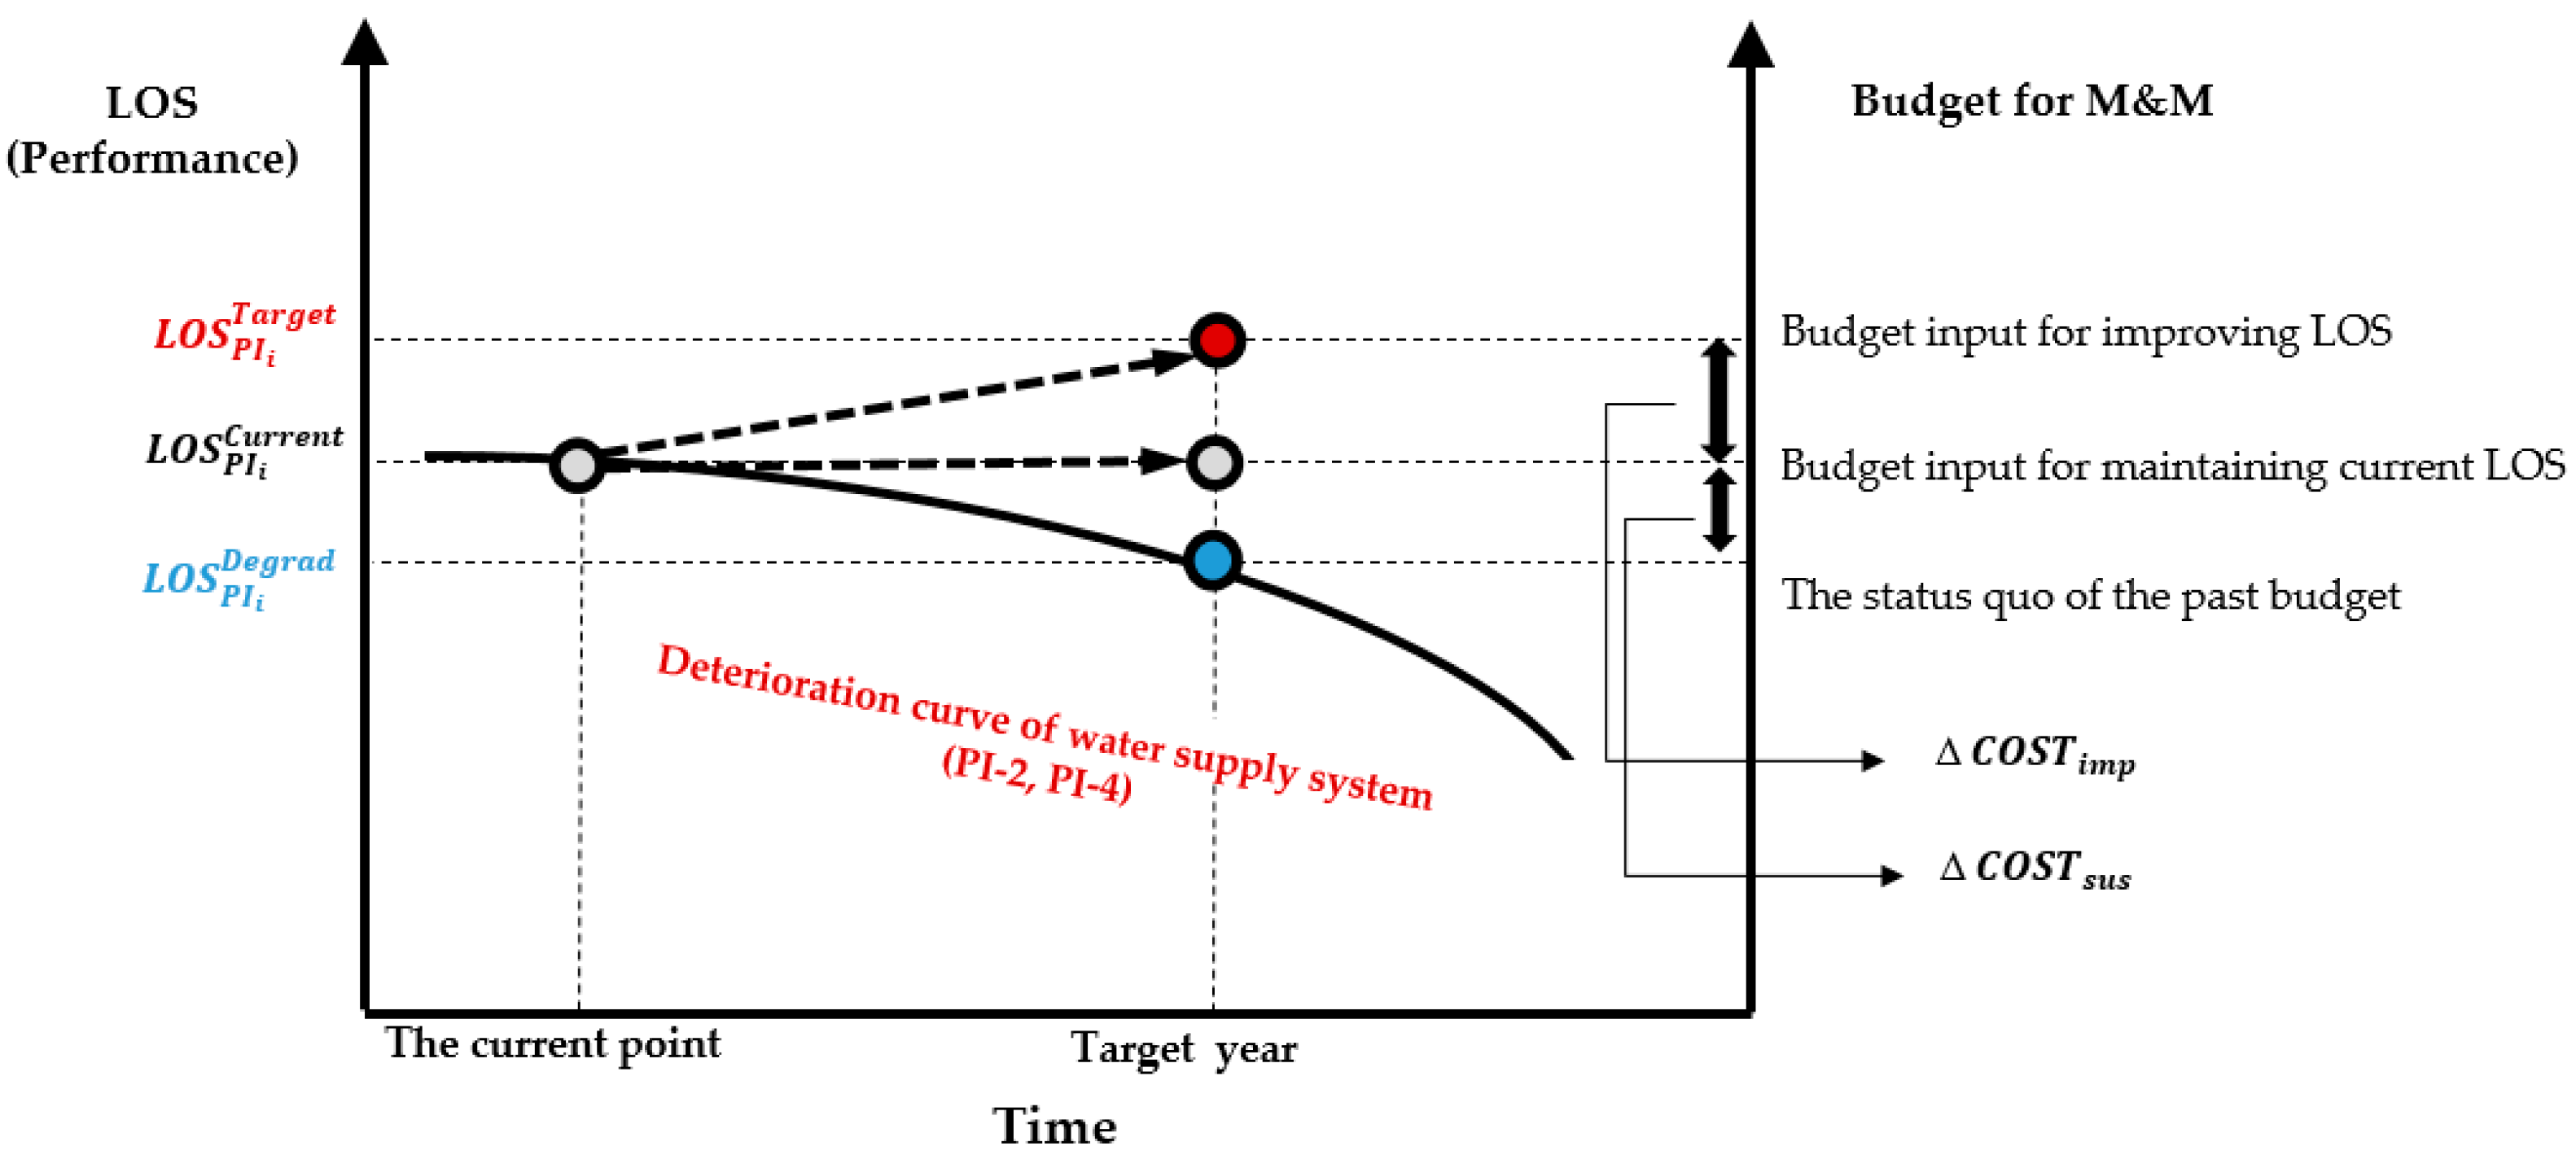
However, some PIs are closely related to system deterioration. For example, the apparent loss (PI-2) and pipe ratio of exceeded useful life (PI-4) are related to pipe deterioration (Figure 5). Because of the nature of system deterioration, additional costs are required to maintain and improve the LOS of PIs. The can be expressed as follows (Equation (5)):
Here, indicates the status of the past budget. is the sustainable management cost that is necessary to maintain the current level (). is the additional required cost to reach the target LOS (). As the water system ages, an additional cost () is obviously required to maintain the current LOS, and an extra cost () is required to improve the LOS (Figure 5).
Based on data from the Korean government [35,36], the cost for increasing the LOS by 5% using PI-2 is 26 million dollars/year. The ) and its required cost () are calculated for each PI (Figure 6) using the above methods and the Statistical Yearbook for Water Service and the City of Seoul’s financial statements for 2008–2013 [35,36,37,38,39,40,41]. The extent of improvement of the LOS is greater for PI-5/6 (health/safety), PI-7 (reliability/responsiveness), and PI-9/10 (customer service) than for the other PIs, whereas the required budgets (costs) for PI-4 (quality) and PI-5/6 (health/safety) are greater than those of the other PIs. Here, the reason why the combination of PI-5 and PI-6 is calculated is that service provider takes care of both improving the water treatment and managing the water supply system, but customers only evaluate it as levels of drinking water quality. The values of the estimated EIs range from −0.0016 (PI-4) to 0.9, meaning that PI-4 (quality—pipe) is the least cost-effective to improve the LOS, whereas PI-10 (customer service–emotional) is the most cost-effective to improve the LOS. The results suggest that EI is a good indicator of the cost-effectiveness of a specific PI in improving the LOS. The negative value of PI-4 indicates that pipe ratio of exceed useful life was increased during from 2010 to 2013, as the two PIs regarding the characteristics of deterioration were shown in the Figure 5. Therefore, it means that PI-4 need to invest more budget for improving LOS of PI-4 in the long term.
3.3. Application of Gap Index
In general, gap analysis makes service providers identify gaps between their current status and future goals, which identifies the gap among similar companies and sets a target level of their performance through benchmarking [42,43]. This benchmarking principle allows for quantitative formulation. A low PIs score indicates a relatively poor performance among the currently evaluated water utilities. Thus, the inverse of the LOS score (%) for a specific PI (LOSPIi) is an indication of the gap in the specific performance when compared with other competitive utilities. In asset management, service providers (local government administrators or utility service providers) prioritize improving the performance of PIs with low scores. The LOSPIi was calculated using Equation (4).
To estimate the LOS score for each PI (LOSPIi), 2010 data for the City of Seoul [39] are used. For PI-2, the LOS score is 0.888 (88.8 points) based upon the apparent losses of Seoul (6.2%) and the worst apparent losses in Korea (55.4%) as shown in Table 1.
For PI-3, the LOS score for Seoul is 0.787 (78.7 points), based on the number of water pressure complaints in Seoul (1.46 cases per 1000 users) and the worst case in Korea (6.87 cases per 1000 users). For PI-4, the LOS score is 0.929 (92.9 points), as calculated from the pipe ratio of exceeded useful life specified in waterworks statistics for Seoul (41.89 m per 1000 users) and the Korea worst case (590.70 m per 1000 users) [39]. For PI-5 and PI-6, the LOS score (66.0 points) is calculated by combining the performance measurements of the water quality of supplied water from pipe (PI-5) and the water quality of supplied water from treatment plant (PI-6) using the relative weights of PI-5 and PI-6 determined from our previous expert AHP analysis [18]. The LOS score for PI-7 is calculated considering four factors (distribution block system, GIS-based management, water metering automation and advanced monitoring system). The weights of the four factors are given in Table 2. For PI-8, the LOS score is determined from Equation (6) [18]. The empirical equation was constructed from a regression analysis of the expert survey results (curve fitting between the LOS score and ART (average handling response time)).
The LOS scores for PI-9 and PI-10 are calculated considering the various factors and their corresponding weights in Table 2.
The inverse LOS score (100/LOSPIi) indicates the degree of the LOS gap between a particular utility (or local government) and another utility. In addition to the gap among utilities, it is necessary to reduce the gaps between the customers’ and service providers’ perspectives. To reflect these gaps, another new index, Gap Index (GI), was developed (Equation (7)).
where, is the relative weight of the customer perspective for each PIi, and is the relative weight of the service provider perspective for each PIi. The values of Wc and Wp were taken from the gap analysis in our previous study [18]. GI can be used to decide which PIs are more effective in reducing gaps among utilities, as well as between customers and service providers. The results of ranking PIs using GI are illustrated in Table 3. According to the GI analysis, the customer service PIs (PI-9, PI-10) and reliability/responsibility (PI-8) were identified as more effective in reducing gaps than the other PIs. PI-1 regarding affordability of cost has a high gap between customer and service provider, but the GI value of PI-1 is inapplicable because a perspective from the provider’s and the customer’s cost is not reconcilable and tends to move in opposite directions for their own benefits.
4. Results of O-LOS Modeling
O-LOS modeling was conducted to optimize the budget allocation for improving water service. The following conditions were assumed. Interests in the affordability of cost are exclusively conflicting between customers and service providers. For example, increasing the budget leads to a decrease in the customer perspective .
To calculate the extent of the improved LOS for the budgeting year (a future event), Equation (8) can be used. The improved LOS (for each PI) for the future is estimated by multiplying its increased budget by the corresponding EI, assuming a constant EI value for each PI.
To illustrate the current status of the budget allocation for the water infrastructure asset management, the LOS score of each (LOSPIi) and weights (Wc, Wp) are estimated for water service utilities in the City of Seoul and compared between 2010 and 2013. According to the results of Table 4, the City of Seoul improved the overall LOS from 2010 to 2013. In this case, the overall budget for 2013 was 15% higher than that for 2010. With the exceptions of PI-1, PI-2, PI-3, and PI-6, the LOS scores for the other PIs increased in 2013.
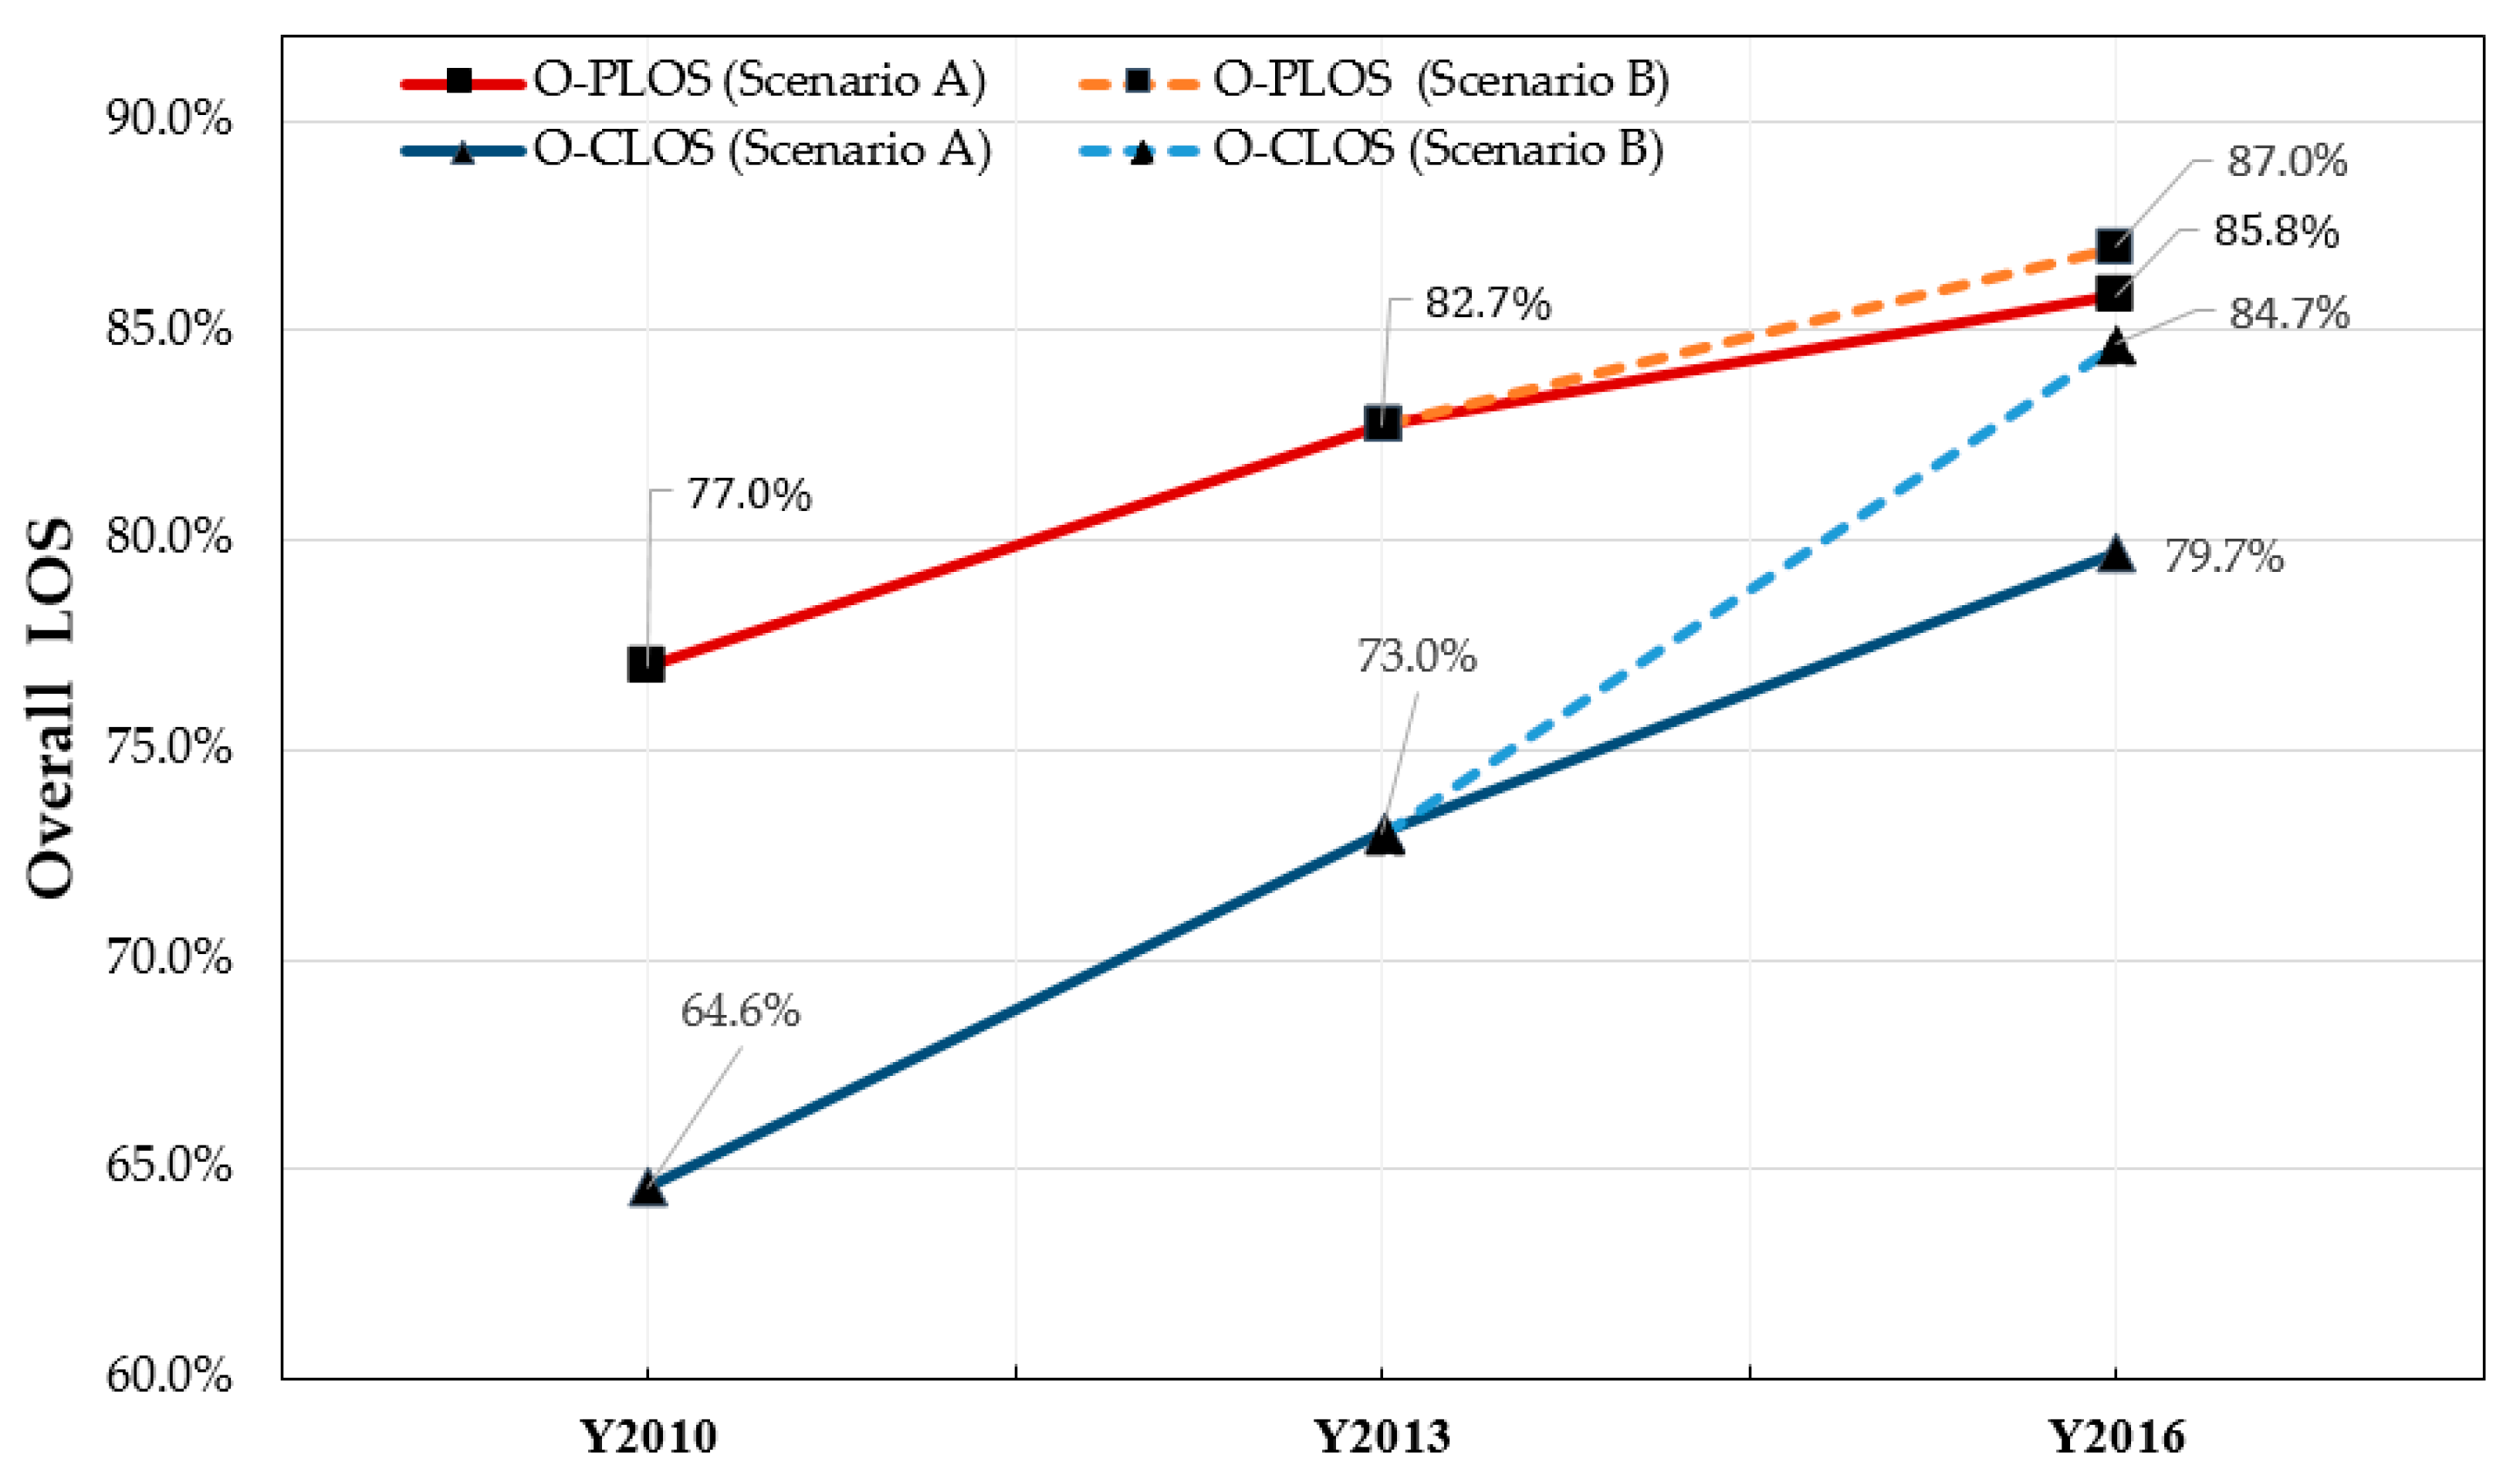
To illustrate the application of the newly developed indexes (GI and EI) to minimize the gap, the study simulated two different budget allocation scenarios based on 2016 data, as identified in Figure 3. The results of the simulation are summarized in Table 5. For scenario A, the budget allocations for PI-2 to PI-10 were increased consistently by 15% without the prioritization of budget allocation. Although the gap between the O-PLOS and O-CLOS was reduced as compared to 2013, a 6.1% gap still remained (Figure 7).
Meanwhile, for scenario B, the budget allocations for the PIs were prioritized using the GI and EI rankings. Because the purposes of the budget allocation were to improve O-CLOS and O-PLOS, and to minimize the gap between them, a GI and EI combined ranking was proposed in this study. The first and second GI- and EI-ranked PIs (PI-9, PI-10; combined ranking = 3) were the highest prioritized in the budget allocation (five stars in Table 5), and the third GI- and EI-ranked PI-8 (combined ranking = 6) was the second highest prioritized (four stars). The fourth GI-ranked and the seventh EI-ranked PI-3 (combined ranking = 11) was the third highest prioritized (three stars), although its EI ranking was low. This prioritization was the result of a greater emphasis on GI rather than EI to reduce the gap between O-CLOS and O-PLOS. The budget allocations for the first, second, and third prioritized PIs (‘five stars’, ‘four stars’, and ‘three stars’ PIs) were increased when compared to scenario A. The PIs with a combined ranking of 12 (the sixth GI- and EI-ranked PI-5,6, and the seventh GI-ranked and fifth EI-ranked PI-7) were classified into the ‘two star’ group, in which the budget allocations were similar to those of scenario A. PI-2 (combined ranking = 12) and PI-4 (combined ranking = 13) were classified into the ‘one star’ group because the PIs were the lowest ranked by either GI or EI, although its combined ranking was close or equal to the ‘two star’ PIs. The budget allocations for the ‘one star’ PIs were reduced when compared to scenario A. Consequently, O-PLOS and O-CLOS were increased, and the gap between O-PLOS and O-CLOS was way reduced to 2.3% (Figure 7). This reduction of the gap indicates that the utilization of the GI and EI rankings allowed us to achieve a more optimized budget allocation to increase the O-LOS and minimize the gap between O-CLOS and O-PLOS.
5. Conclusions
Many water utility providers experience a very tight budget allocation and a limited capability to increase water charge to sustain their water systems and services at the best possible level. On the other hand, water customers believe that the customer perspective is not effectively applied to make a better water service and budget are not well used for their satisfaction. The gap in between the two parties has widened in recent years. This existing circumstance is a significant issue because most water utility services are regulated by public entities including local municipal governments or publically incorporated agencies in South Korea. One of the best management approaches to close this gap is to make better decision making for the budget allocation to improve both parties’ satisfaction.
The main objectives are successfully achieved. This paper proposes a methodology to support local water utility providers. The methodology is effective in supporting a decision making process on budget allocation which taking account of critical aspects of water utility service operation, maintenance, and sustainability. Customer’s involvement in the budget allocation is a key for this decision-making methodology. The methodology is proven in the paper using data from cases for the City of Seoul. Details of the methodology are presented in the paper, including conceptual framework development, O-LOS model development, application of Efficiency Index (EI) and Gap Index (GI), and prioritizing budget allocations as a result of the O-LOS modeling. The simulation results from optimal budget allocation using GI and EI improve the O-LOS while minimizing the gap between customers and service providers. This proposed methodology is suitable to be used to support improving customer satisfaction as well as cost-effective management.
Acknowledgments
This research was supported by the KICT Research Fund (2017-0139 and 2017-0280) in Korea Institute of Civil Engineering and Building Technology. We thank the eight experts who participated in the surveys and discussion for the AHP analysis.
Author Contributions
Sangjong Han developed the concept and conducted the surveys. Sangjong Han and Dan Daehyun Koo were primarily responsible for writing the manuscript. Youngkyung Kim and Seonghoon Kim calculated the values of the LOS score, cost, and GI/EI from the City of Seoul data and created the figures and tables. Joonhong Park reviewed Sangjong Han’s doctoral dissertation.
Conflicts of Interest
The authors declare no conflict of interest.
References
- Kleiner, Y.; Sadiq, R.; Rajani, B. Modeling failure risk in buried pipes using fuzzy markov deterioration process. In Proceedings of the ASCE International Conference on Pipeline Engineering and Construction, San Diego, CA, USA, 2–4 August 2004. [Google Scholar]
- Rogers, P.D.; Grigg, N.S. Failure assessment modeling to prioritize water pipe renewal: Two case studies. J. Infrastruct. Syst. 2009, 15, 162–171. [Google Scholar] [CrossRef]
- Baah, K.; Dubey, B.; Harvey, R.; McBean, E. A risk-based approach to sanitary sewer pipe asset management. Sci. Total Environ. 2015, 505, 1011–1017. [Google Scholar] [CrossRef] [PubMed]
- Giustolisi, O.; Laucelli, D.; Savic, D.A. Development of rehabilitation plans for water mains replacement considering risk and cost-benefit assessment. Civ. Eng. Environ. Syst. 2006, 23, 175–190. [Google Scholar] [CrossRef]
- Gaivoronski, A.; Sechi, G.M.; Zuddas, P. Cost/risk balanced management of scarce resources using stochastic programming. Eur. J. Oper. Res. 2012, 216, 214–224. [Google Scholar] [CrossRef]
- Martini, A.; Troncossi, M.; Rivola, A. Leak detection in water-filled small-diameter polyethylene pipes by means of acoustic emission measurements. Appl. Sci. 2017, 7, 2. [Google Scholar] [CrossRef]
- Martini, A.; Troncossi, M.; Rivola, A. Vibroacoustic measurements for detecting water leaks in buried small-diameter plastic pipes. J. Pipeline Syst. Eng. Pract. 2017, 8, 04017022. [Google Scholar] [CrossRef]
- Yazdekhasti, S.; Piratla, K.R.; Atamturktur, S.; Khan, A. Experimental evaluation of a vibration-based leak detection technique for water pipelines. Struct. Infrastruct. Eng. 2017, 13, 1–10. [Google Scholar] [CrossRef]
- Pietrucha-Urbanik, K.; Tchórzewska-Cieslak, B. Water supply system operation regarding consumer safety using kohonen neural network. In Safety, Reliability and Risk Analysis: Beyond the Horizon; Steenbergen, R.D.J.M., van Gelder, P.H.A.J.M., Miraglia, S., Vrouwenvelder, A.C.W.M., Eds.; Taylor & Francis Group: London, UK, 2014; pp. 1115–1120. [Google Scholar]
- TchórzewskA-cieślAk, B. Analysis of the gas network failure and failure prediction using the Monte Carlo simulation method analiza awaryjności sieci gazowych oraz prognozowanie awarii z zastosowaniem symulacyjnej metody Monte Carlo. Eksploatacja I Niezawodnosc 2016, 18, 254. [Google Scholar] [CrossRef]
- Kiwa Water Research (KWR). Consumer Satisfaction, Preference and Acceptance Regarding Drinking Water Services: An Overview of Literature Findings and Assessment Methods; Kiwa Water Research: Nieuwegein, The Netherlands, 2008. [Google Scholar]
- Ojo, V.O. Customer Satisfaction: A Framework for Assessing the Service Quality of Urban Water Service Providers in Abuja, Nigeria. Ph.D. Thesis, Loughborough University, Loughborough, UK, 2011. [Google Scholar]
- Hanson, J.J.; Murrill, S.D. South Tahoe Public Utility District 2012 Customer Satisfaction and Perceptions Survey Report of Results; Meta Research, Inc.: Sequim, WA, USA, 2013. [Google Scholar]
- Levallois, P.; Grondin, J.; Gingras, S. Evaluation of consumer attitudes on taste and tap water alternatives in Québec. Water Sci. Technol. 1999, 40, 135–139. [Google Scholar]
- Lou, J.C.; Lee, W.L.; Han, J.Y. Influence of alkalinity, hardness and dissolved solids on drinking water taste: A case study of consumer satisfaction. J. Environ. Manag. 2007, 82, 1–12. [Google Scholar] [CrossRef] [PubMed]
- Kayaga, S.; Calvert, J.; Sansom, K. Paying for water services: Effects of household characteristics. Util. Policy 2003, 11, 123–132. [Google Scholar] [CrossRef]
- Wahid, N.A.; Hooi, C.K. Factors determining household consumer’s willingness to pay for water consumption in Malaysia. Asian Soc. Sci. 2015, 11. [Google Scholar] [CrossRef]
- Han, S.; Hwang, H.; Kim, S.; Baek, G.S.; Park, J. Sustainable water infrastructure asset management: A gap analysis of customer and service provider perspectives. Sustainability 2015, 7, 13334–13350. [Google Scholar] [CrossRef]
- Tsai, W.H.; Hsu, W.; Chou, W.C. A gap analysis model for improving airport service quality. Total Qual. Manag. Bus. Excell. 2011, 22, 1025–1040. [Google Scholar] [CrossRef]
- Anand, S.V.; Selvaraj, M. Evaluation of service quality and its impact on customer satisfaction in Indian banking sector—A comparative study using SERVPERF. Life Sci. J. 2013, 10, 3267–3274. [Google Scholar]
- Elkington, J. Towards the sustainable corporation: Win-Win-Win Business Strategies for sustainable development. Calif. Manag. Rev. 1994, 36, 90–100. [Google Scholar] [CrossRef]
- Hall, T.J. The triple bottom line: What is it and how does it work? Indiana Bus. Rev. 2011, 86, 4. [Google Scholar]
- Lafferty, A.K.; Lauer, B.; Association, A.W.W. Benchmarking Performance Indicators for Water and Wastewater Utilities: Survey Data and Analyses Report; American Water Works Association: Denver, CO, USA, 2005. [Google Scholar]
- Alegre, H. Performance Indicators for Water Supply Services; IWA Publishing: London, UK, 2006. [Google Scholar]
- Koo, D.H.; Ariaratnam, S.T. Application of a sustainability model for assessing water main replacement options. J. Constr. Eng. Manag. 2008, 134, 563–574. [Google Scholar] [CrossRef]
- Koo, D.H.; Ariaratnam, S.T.; Kavazanjian, E. Development of a sustainability assessment model for underground infrastructure projects. Can. J. Civ. Eng. 2009, 36, 765–776. [Google Scholar] [CrossRef]
- Liner, B.; deMonsabert, S. Balancing the triple bottom line in water supply planning for utilities. J. Water Resour. Plan. Manag. 2011, 137, 335–342. [Google Scholar] [CrossRef]
- Parasuraman, A.; Zeithaml, V.A.; Berry, L.L. A conceptual model of service quality and its implications for future research. J. Mark. 1985, 49, 41–50. [Google Scholar] [CrossRef]
- Carman, J.M. Consumer perceptions of service quality: An assessment of the servqual dimensions. J. Retail. 1990, 66, 33–55. [Google Scholar]
- Cronin, J.J., Jr.; Taylor, S.A. Measuring service quality: A reexamination and extension. J. Mark. 1992, 56, 55–68. [Google Scholar] [CrossRef]
- NAMS Group. International Infrastructure Management Manual; NZ National Asset Management Steering Group (NAMS), Association of Local Government Engineers New Zealand: Thames, New Zealand, 2006. [Google Scholar]
- NAMS Group. Developing Levels of Service and Performance Measures; NZ National Asset Management Steering Group (NAMS), Association of Local Government Engineers New Zealand: Thames, New Zealand, 2007. [Google Scholar]
- Han, S.; Chae, M.; Hwang, H.; Choung, Y. Evaluation of customer-driven level of service for water infrastructure asset management. J. Manag. Eng. 2014, 31, 04014067. [Google Scholar] [CrossRef]
- BusinessDictionary. Available online: http://www.businessdictionary.com/definition/cost-performance-index-CPI.html (assessed on 15 July 2017).
- Ministry of Environment in Korea. Statistical Yearbook for Water Service in 2012; Ministry of Environment: Seoul, Korea, 2014.
- Ministry of Environment in Korea. Statistical Yearbook for Water Service in 2013; Ministry of Environment: Seoul, Korea, 2015.
- Ministry of Environment in Korea. Statistical Yearbook for Water Service in 2008; Ministry of Environment: Seoul, Korea, 2010.
- Ministry of Environment in Korea. Statistical Yearbook for Water Service in 2009; Ministry of Environment: Seoul, Korea, 2011.
- Ministry of Environment in Korea. Statistical Yearbook for Water Service in 2010; Ministry of Environment: Seoul, Korea, 2012.
- Ministry of Environment in Korea. Statistical Yearbook for Water Service in 2011; Ministry of Environment: Seoul, Korea, 2013.
- The Office of Waterworks Seoul Metropolitan Government. Management Information Regarding Financial Statements. Available online: http://arisu.seoul.go.kr/c5/sub3_1.jsp (assessed on 15 July 2017).
- United States Environmental Protection Agency (USEPA). The Clean Water and Drinking Water Infrastructure Gap Analysis; EPA-816-R-02-020; USEPA: Washington, DC, USA, 2002.
- Graf, W. Assessing Utility Practices with the Strategic Asset Management Gap Analysis Tool (SAM Gap); SAM2C06; Water Research Foundation: Denver, CO, USA, 2010. [Google Scholar]
Figure 1.
Weights comparison between customer perspective and service provider perspective for water service.
Figure 1.
Weights comparison between customer perspective and service provider perspective for water service.
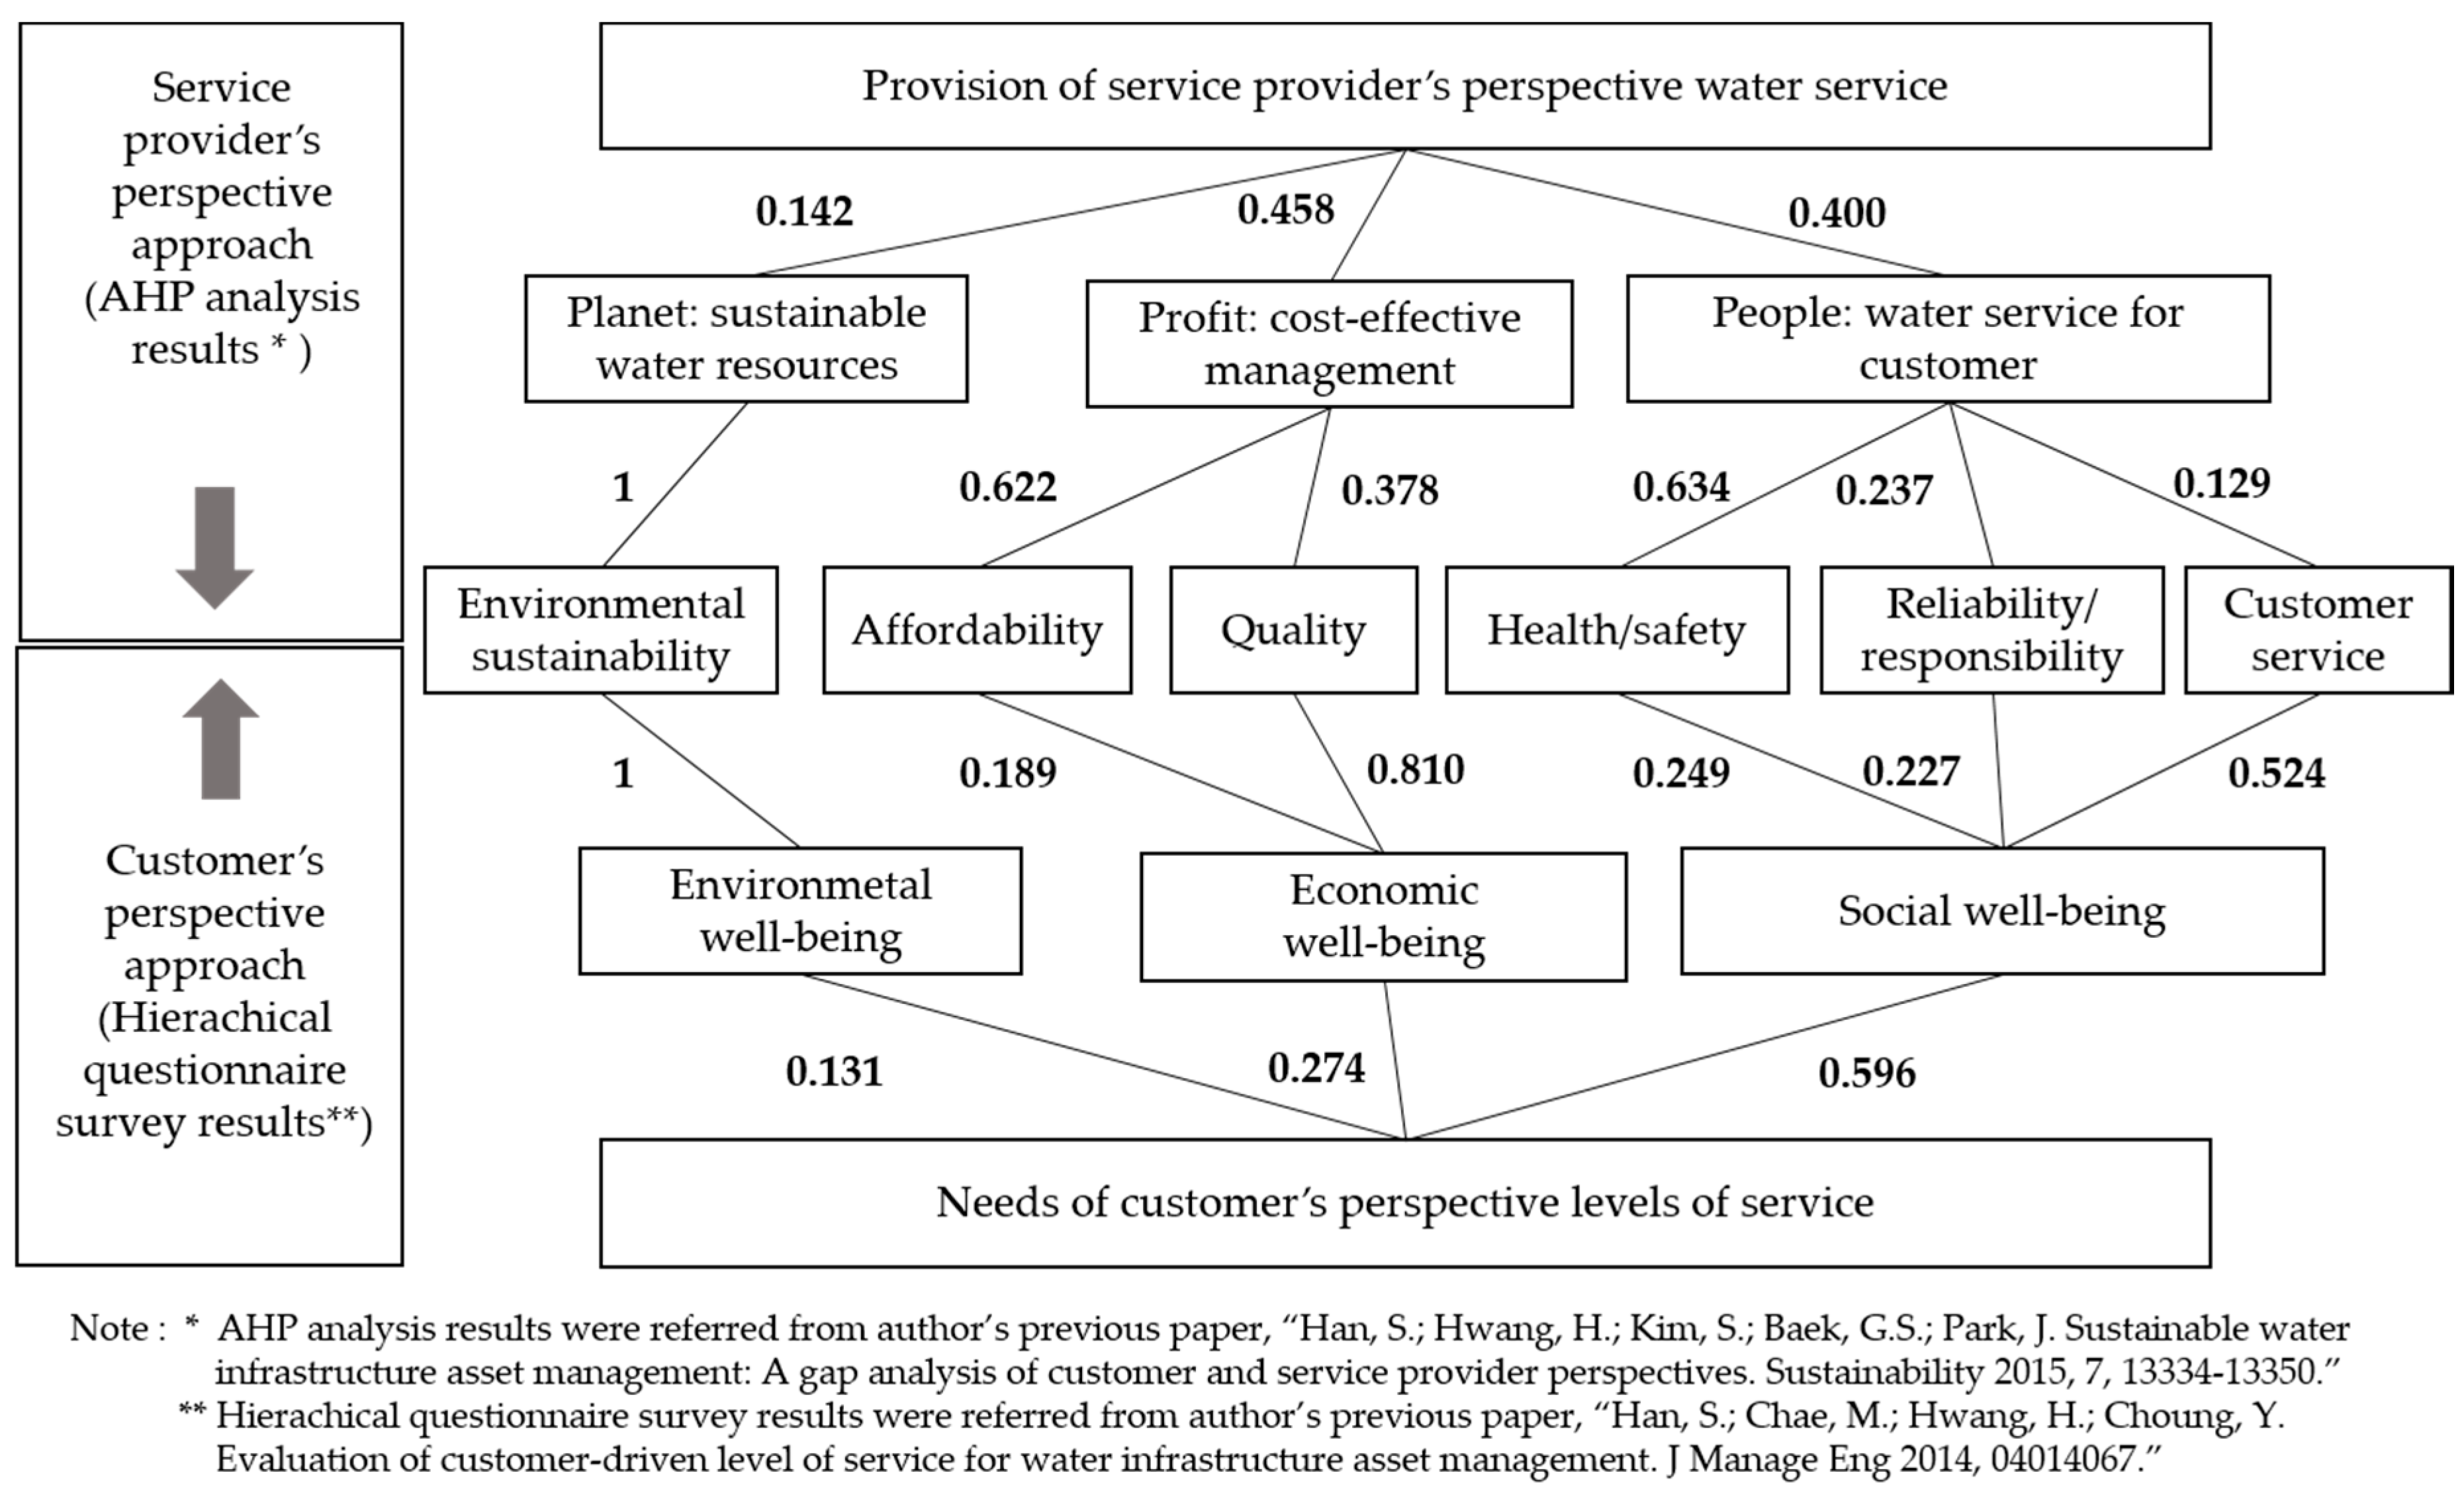
Figure 2.
Scheme of overall level of service (O-LOS) estimation for water service.

Figure 3.
Decision-making framework using O-LOS modeling in this paper.
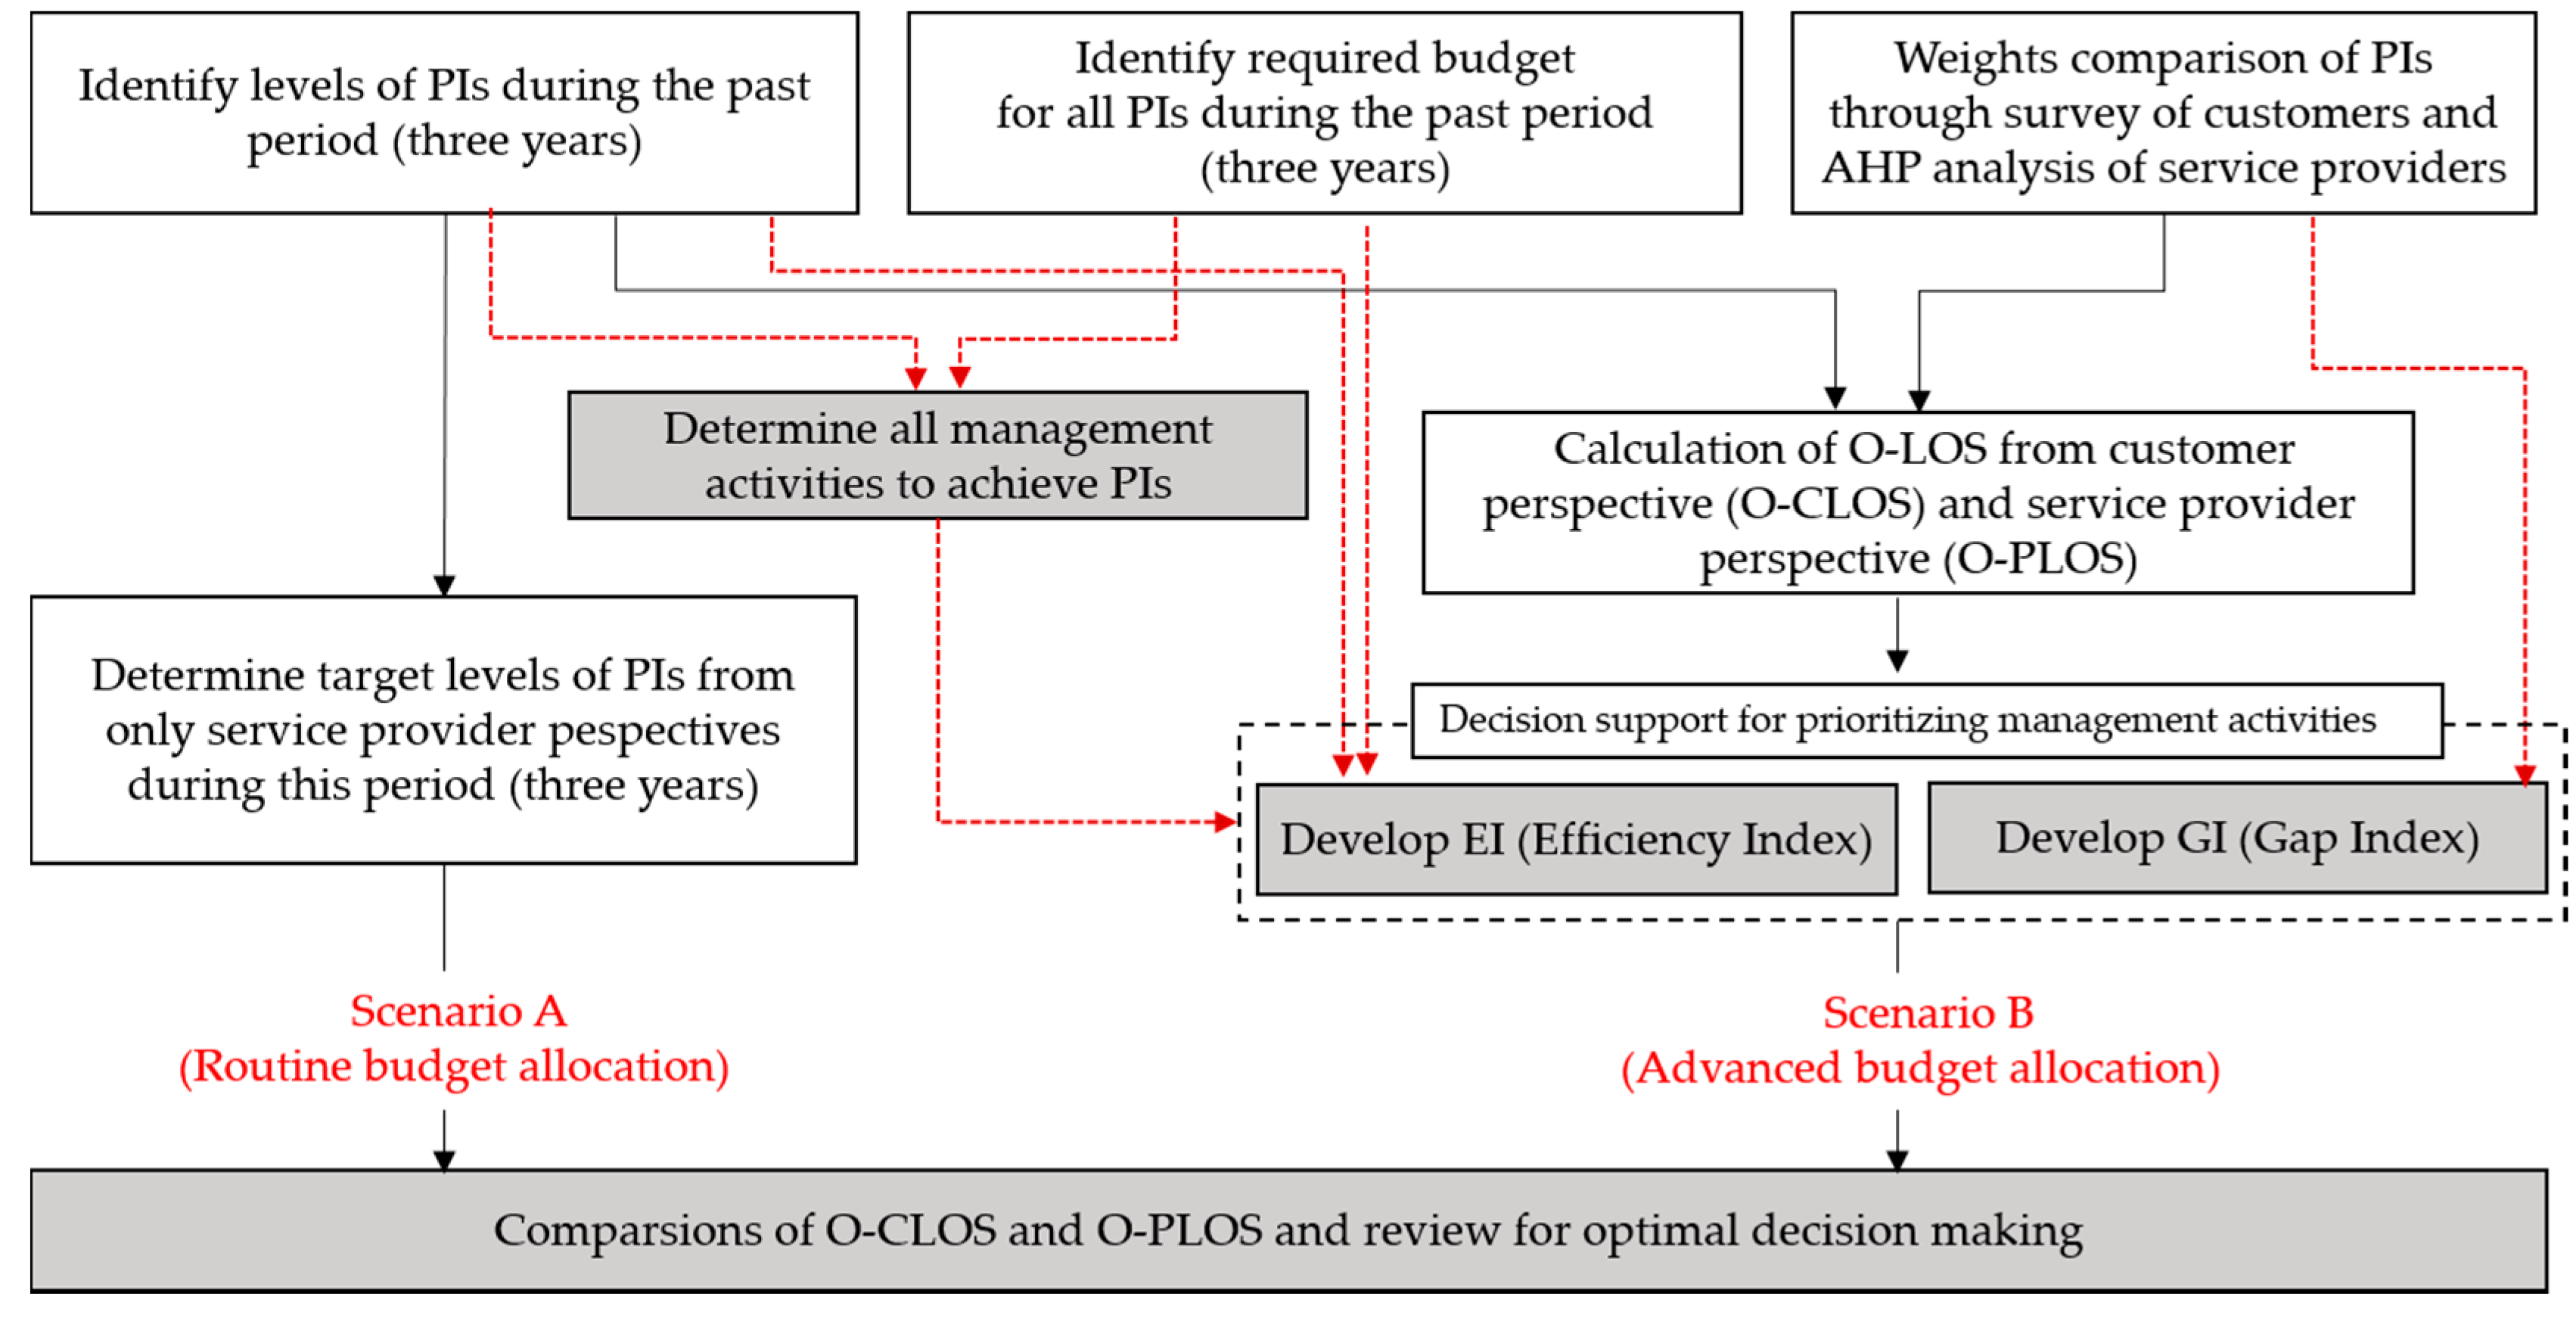
Figure 4.
Management activities for water service improvement.

Figure 5.
Additional costs for sustaining and improving Level of Service (LOS)PIi.

Figure 6.
Estimated improved LOS (LOSPIi) for PIs, and their corresponding required costs (COSTPIi) and EI values.
Figure 6.
Estimated improved LOS (LOSPIi) for PIs, and their corresponding required costs (COSTPIi) and EI values.
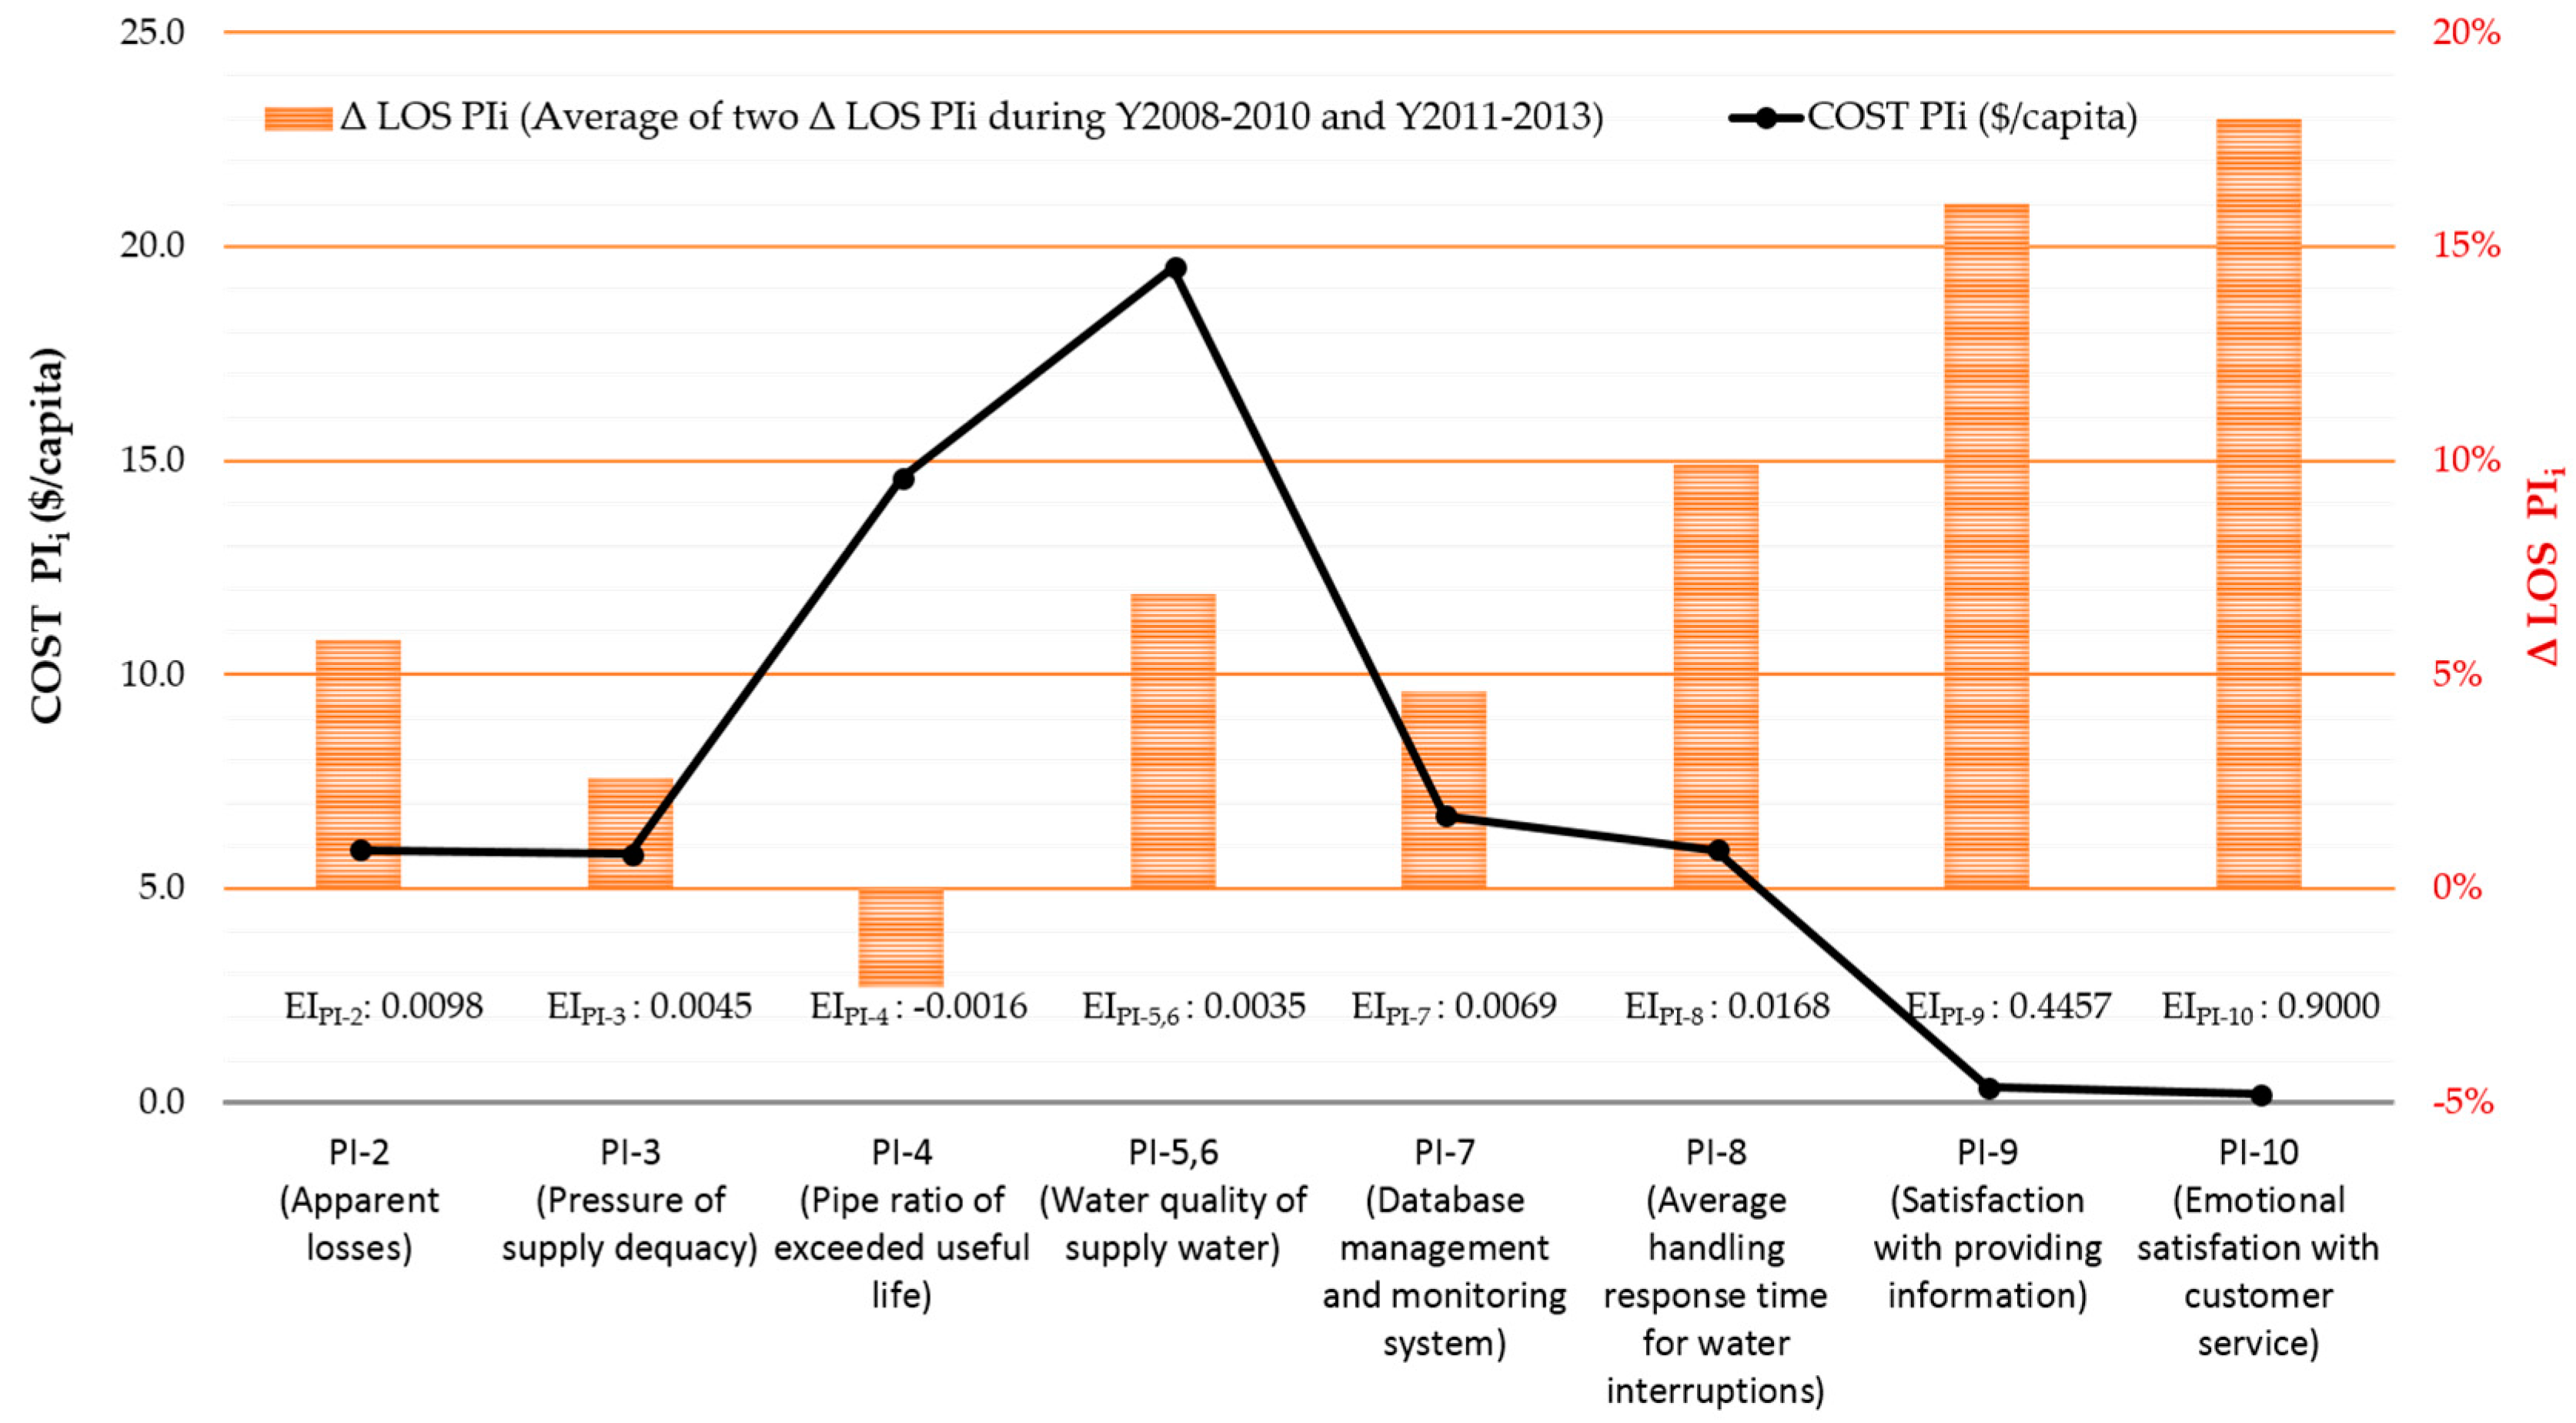
Figure 7.
Comparison between routine budget allocation and advanced budget allocation.


Table 1.
Apparent losses in Korean cities (2010).
| Cities | Apparent Losses |
|---|---|
| Seoul-City (metropolitan) | 6.2% |
| Busan-City (metropolitan) | 9.1% |
| Daegu-City (metropolitan) | 12.4% |
| Incheon-City (metropolitan) | 12.8% |
| Gwangju-City (metropolitan) | 17.2% |
| Daejeon-City (metropolitan) | 13.5% |
| Ulsan-City (metropolitan) | 12.4% |
| Kapeong-Gun (Gyeonggi-Do) | 23.4% |
| Taebaek-City (Kangwon-Do) | 55.4% |
| Buyeo-Gun (Chungcheongnam-Do) | 39.2% |
| Wanju-Gun (Cheonlabuk-Do) | 32.6% |
| Jindo-Gun (Cheonlanam-Do) | 45.4% |
| Gosung-Gun (Gyeongsangnam-Do) | 39.8% |
Table 2.
Factors for calculating LOS scores of PIs regarding social well-being.
| PIs | Factors (Weights) | ||||||||||
|---|---|---|---|---|---|---|---|---|---|---|---|
| PI-7: Database management and monitoring system | Distribution block system (0.3) | GIS-based management (0.3) | Water metering automation (0.3) | Advanced monitoring system (0.1) | |||||||
| PI-9: Satisfaction of providing information | Asset management plan (0.15) | Water quality information (0.20) | Announcement of planned water interruptions (0.10) | DB management of complaints (0.15) | Water charge calculation (0.10) | Survey of customer service (0.10) | Process of requiring to water service (0.10) | Statistics of water services (0.05) | Financial statements (0.03) | Bidding information (0.02) | |
| PI-10: Emotional satisfaction of customer service | Staff education (0.4) | Water quality testing to tap-water (0.3) | Water metering automation (0.1) | Voluntary response for the rapid water consumption (pipe leakage) (0.1) | Follow-up management (0.1) | ||||||
Table 3.
Ranking performance indicators (PIs) using Gap Index (GI) values regarding water service in the city of Seoul (2010).
Table 3.
Ranking performance indicators (PIs) using Gap Index (GI) values regarding water service in the city of Seoul (2010).
| PIs | Gap among Utilities | Gap between Customer and Service Provider | ( | Ranking PIs | |
|---|---|---|---|---|---|
| PI-1: Total cost coverage ratio/Affordability of cost | 87.5 | 0.317 | 0.062 | 5.843 | N/A |
| PI-2: Apparent losses | 88.8 | 0.032 | 0.049 | 0.735 | 8 |
| PI-3: Water pressure complaints | 78.7 | 0.072 | 0.056 | 1.634 | 4 |
| PI-4: Pipe ratio of exceeded useful life | 92.9 | 0.118 | 0.099 | 1.281 | 6 |
| PI-5, PI-6: Water quality of supplied water (Pipe and WTP) | 66.0 | 0.148 | 0.165 | 1.359 | 5 |
| PI-7: Reliability and responsibility (system) | 65.9 | 0.040 | 0.076 | 0.799 | 7 |
| PI-8: Reliability and responsibility (organization) | 63.1 | 0.096 | 0.051 | 2.983 | 3 |
| PI-9: Satisfaction with providing information | 49.0 | 0.162 | 0.036 | 9.184 | 2 |
| PI-10: Emotional satisfaction with customer service | 43.0 | 0.150 | 0.036 | 9.690 | 1 |
| PIs | Weights of Customer Perspective (Wc) | Weights of Service Provider Perspective (Wp) | (2010) | (2013) |
|---|---|---|---|---|
| PI-1 | 0.052 | 0.317 | 74.1 */87.5 ** | 70.4 */92.8 ** |
| PI-2 | 0.032 | 0.049 | 88.8 | 94.6 |
| PI-3 | 0.072 | 0.056 | 78.7 | 81.3 |
| PI-4 | 0.118 | 0.099 | 92.9 | 90.6 |
| PI-5,6 | 0.148 | 0.165 | 66.0 | 72.9 |
| PI-7 | 0.04 | 0.076 | 65.9 | 70.5 |
| PI-8 | 0.095 | 0.051 | 63.1 | 73.0 |
| PI-9 | 0.162 | 0.036 | 49.0 | 65.0 |
| PI-10 | 0.15 | 0.036 | 43.0 | 61.0 |
* CLOS regarding the affordability of cost (customer perspective) was assumed to be reduced by 5% (from 74.1 to 70.4) in accordance with PI-1 (total cost coverage ratio), as shown in Figure 4. Here, 74.1 points were drawn from customer survey [Han et al., 2014]. ** PLOS regarding PI-1 (Total cost coverage ratio) was based on Statistics for water service in Seoul, Korea [Ministry of Environment, 2012; 2015].
Table 5.
Optimal budget allocation using GI and EI.
| PIs | (2013) | GI Ranking | EI Ranking | The Past Allocated Budget (2011–2013) | Budget Allocation Scenario (2014–2016) | Prioritizing Budget Allocation (see Table Foot Note for Star(s)) | |
|---|---|---|---|---|---|---|---|
| Scenario A (Routine Budget Allocation) | Scenario B (Advance Budget Allocation ) | ||||||
| PI-2 | 0.946 | 8 | 4 | $43,589,514 | $50,127,941 | $45,115,147 | ★ |
| PI-3 | 0.813 | 4 | 7 | $9,388,511 | $10,796,787 | $13,495,984 | ★★★ |
| PI-4 | 0.906 | 5 | 8 | $84,496,597 | $97,171,086 | $92,312,532 | ★ |
| PI-5,6 | 0.729 | 6 | 6 | $119,368,208 | $137,273,439 | $130,409,767 | ★★ |
| PI-7 | 0.705 | 7 | 5 | $48,283,769 | $55,526,335 | $55,526,335 | ★★ |
| PI-8 | 0.730 | 3 | 3 | $12,607,429 | $14,498,543 | $23,197,669 | ★★★★ |
| PI-9 | 0.650 | 1 | 2 | $3,353,040 | $3,855,995 | $7,711,991 | ★★★★★ |
| PI-10 | 0.610 | 2 | 1 | $1,247,331 | $1,434,430 | $2,868,861 | ★★★★★ |
| Sum | $322,334,398 | $370,684,557 | $370,638,285 | ||||
Note: the stars represent Likert scale of the budget prioritization. For example, a star indicates the least priority and five starts indicates the highest priority of the PI.
© 2017 by the authors. Licensee MDPI, Basel, Switzerland. This article is an open access article distributed under the terms and conditions of the Creative Commons Attribution (CC BY) license (http://creativecommons.org/licenses/by/4.0/).
Share and Cite
MDPI and ACS Style
Han, S.; Koo, D.D.; Kim, Y.; Kim, S.; Park, J. Gap Analysis Based Decision Support Methodology to Improve Level of Service of Water Services. Sustainability 2017, 9, 1578. https://doi.org/10.3390/su9091578
AMA Style
Han S, Koo DD, Kim Y, Kim S, Park J. Gap Analysis Based Decision Support Methodology to Improve Level of Service of Water Services. Sustainability. 2017; 9(9):1578. https://doi.org/10.3390/su9091578
Chicago/Turabian StyleHan, Sangjong, Dan Daehyun Koo, Youngkyung Kim, Seonghoon Kim, and Joonhong Park. 2017. "Gap Analysis Based Decision Support Methodology to Improve Level of Service of Water Services" Sustainability 9, no. 9: 1578. https://doi.org/10.3390/su9091578
Note that from the first issue of 2016, this journal uses article numbers instead of page numbers. See further details here.