Irrigation-Induced Changes in Evapotranspiration Demand of Awati Irrigation District, Northwest China: Weakening the Effects of Water Saving?

State Key Laboratory of Simulation and Regulation of Water Cycle in River Basin, China Institute of Water Resources and Hydropower Research, Beijing 100038, China
*
Author to whom correspondence should be addressed.
Sustainability 2017, 9(9), 1531; https://doi.org/10.3390/su9091531
Submission received: 1 June 2017
/
Revised: 22 August 2017
/
Accepted: 24 August 2017
/
Published: 28 August 2017
(This article belongs to the Special Issue Sustainable Irrigation for the Future: Addressing the Challenges to Improved Water Use Efficiency)
Abstract
:The evapotranspiration demand of the Awati irrigation district has changed with irrigation development since 1980. During the first period of traditional irrigation expansion from 1980 to 1997, reference crop evapotranspiration (ET0) decreased as irrigation intensity increased. Since the second period of water-saving irrigation extension began in 1998, the gross irrigation quota has decreased as the water use efficiency improved, whereas ET0 has been increasing accordingly. The increasing evapotranspiration demand has enlarged the irrigation water requirement per unit area, which partly weakens the effects of water-saving irrigation. Findings show that irrigation-induced changes in evapotranspiration demand should be considered when evaluating the performance of water-saving technologies in irrigation districts in arid areas.
1. Introduction
As the most important component of water use, irrigation accounts for approximately 80% of global freshwater consumption [1]. Irrigation water use is classified as either consumptive or non-consumptive, considering that only a fraction of irrigation water withdrawal is lost through evaporation [2]. Evapotranspiration is the most important part of consumptive use [3], which includes crop evapotranspiration, excess soil water and phreatophyte evapotranspiration, and canal and reservoir evaporation. The water balance equation of an irrigation district can be expressed as:
where P is precipitation; I is irrigation water withdrawal from outside; is crop evapotranspiration; ETn is non-crop evapotranspiration, i.e., evapotranspiration from water surface, natural vegetation, and bare soil; D is discharge to drainage; ΔSw is change in regional water storage; and R is local river runoff. Evapotranspiration is further divided into beneficial and non-beneficial components [2,4,5]. In other studies, these components have been defined as productive and non-productive consumption [6,7,8]. Beneficial use is defined as that which supports crop production; thus, is regarded as the main component of beneficial use, whereas the majority of is considered to be of non-beneficial use [2]. For example, soil evaporation in excess of basal is considered to be non-beneficial in the arid southwest part of the United States [9].
Irrigation development is driven by the need to achieve high-value crop production with less water. Increasing water scarcity requires communities to increase irrigation efficiency through water conservation and saving technologies [3]. The ratio of crop evapotranspiration to the amount of water applied is used as a classic index of irrigation efficiency and is expressed as follows:
where is effective precipitation. Through water-saving technologies, ETn is expected to be reduced with changeless [10]. I can then be reduced, and IE increases accordingly. Reducing ETn has been proposed to improve water use efficiency in the Yellow River Basin of China [6].
Although improving irrigation efficiency through water-saving technologies provides an opportunity to reduce water consumption, irrigation water withdrawal continues to increase in many regions [11]. This condition is referred to as the rebound effect or Jevons paradox [8,12]. This efficiency paradox has been gaining widespread attention from researchers studying arid or semi-arid regions [13,14,15,16]. From an economic perspective, the augmentation of irrigated land is responsible for the increasing irrigation water consumption, and the rebound effect would be insignificant if irrigated land is constrained [12,17]. However, total water consumption depends on not only irrigated area but also on crop water requirement per unit area, which should also be considered when predicting irrigation water consumption. For a specific crop, water requirement is determined by evapotranspiration demand, which is usually estimated by reference crop evapotranspiration (ET0). According to the crop water production function, the crop yield to the maximum possible yield under given agronomic conditions relies not only on ETcrop but also on crop water requirement (ETC, crop evapotranspiration under non-stressed, standard conditions) [18,19,20]. Therefore, the changes in evapotranspiration demand and the ratio of ETcrop to ET0 should also be treated seriously when assessing irrigation performance.
Regional climate conditions, which determine evapotranspiration demand, are significantly altered by irrigation, especially in arid and semi-arid regions where atmosphere and soil moisture are strongly coupled [21,22,23]. The surface wind speed would also be altered by irrigation development [24,25]. The additional water added through irrigation enhances evapotranspiration and results in near-surface atmospheric cooling and wetting [26]. Accordingly, evapotranspiration demand and crop water requirement decrease with changing climate conditions [27,28]. The impacts of irrigation expansion on evapotranspiration demand have been studied under the framework of a complementary relationship [29] in irrigation districts in southeast Turkey [30] and northwest China [28]. However, the effects of irrigation on climate depend on the rate of irrigation development [31]. The cooling and wetting effects of irrigation would be reversed if irrigation intensity decreases, i.e., through water-saving technologies. For example, the end of the irrigation expansion in California was accompanied by a slowdown in irrigation-induced cooling [32]. The absence of irrigation also increased the incidence of heat waves in the United States [33]. The reversal of irrigation-induced regional climate effects would substantially alter evapotranspiration demand and irrigation water requirement.
Since 1998, water-saving technologies, such as drip and sprinkler irrigation systems, have been widely utilized in the extremely arid Xinjiang Autonomous Region, northwest China, through the efforts of the central and local governments in improving water use efficiency [15,34,35]. During the expansion of water-saving irrigation, the gross irrigation quota decreased rapidly [36]. Although the water saved through water-saving technologies has been reused in the further expansion of irrigated lands in some regions [15], actual evapotranspiration would be significantly reduced if water withdrawal is restrained. According to the complementary relationship, it may result in an increase in evapotranspiration demand, thereby negatively affecting crop production. Thus, changes in evapotranspiration demand induced by irrigation development in the irrigation districts of Xinjiang should be examined to accurately predict irrigation water requirement and appropriately assess water-saving technologies at the district scale. Specifically, the impacts of recent rapid water-saving irrigation expansion should be carefully studied.
In the current study, the Awati irrigation district, which is located downstream of the Akesu River, is chosen as a case study because the data on irrigation development, water withdrawal, and meteorology is available for this district. An evaluation of irrigation development and water balance since 1980 is first conducted. The changes in potential evaporation, reference evapotranspiration, and crop water requirement are then evaluated, and the contrast between the periods of rapid gross irrigation quota increase (1980 to 1997) and decrease (1998 to 2012) is highlighted. Whether the changes in evaporation demand are due to local irrigation development is analyzed through comparisons with other regions, as well as an analysis based on the complementary relationship. The results can be used to accurately estimate agricultural water requirements with water-saving irrigation development for a sustainable agricultural water management system in Xinjiang.
2. Study Area, Data, and Method
2.1. Irrigation Development of Awati
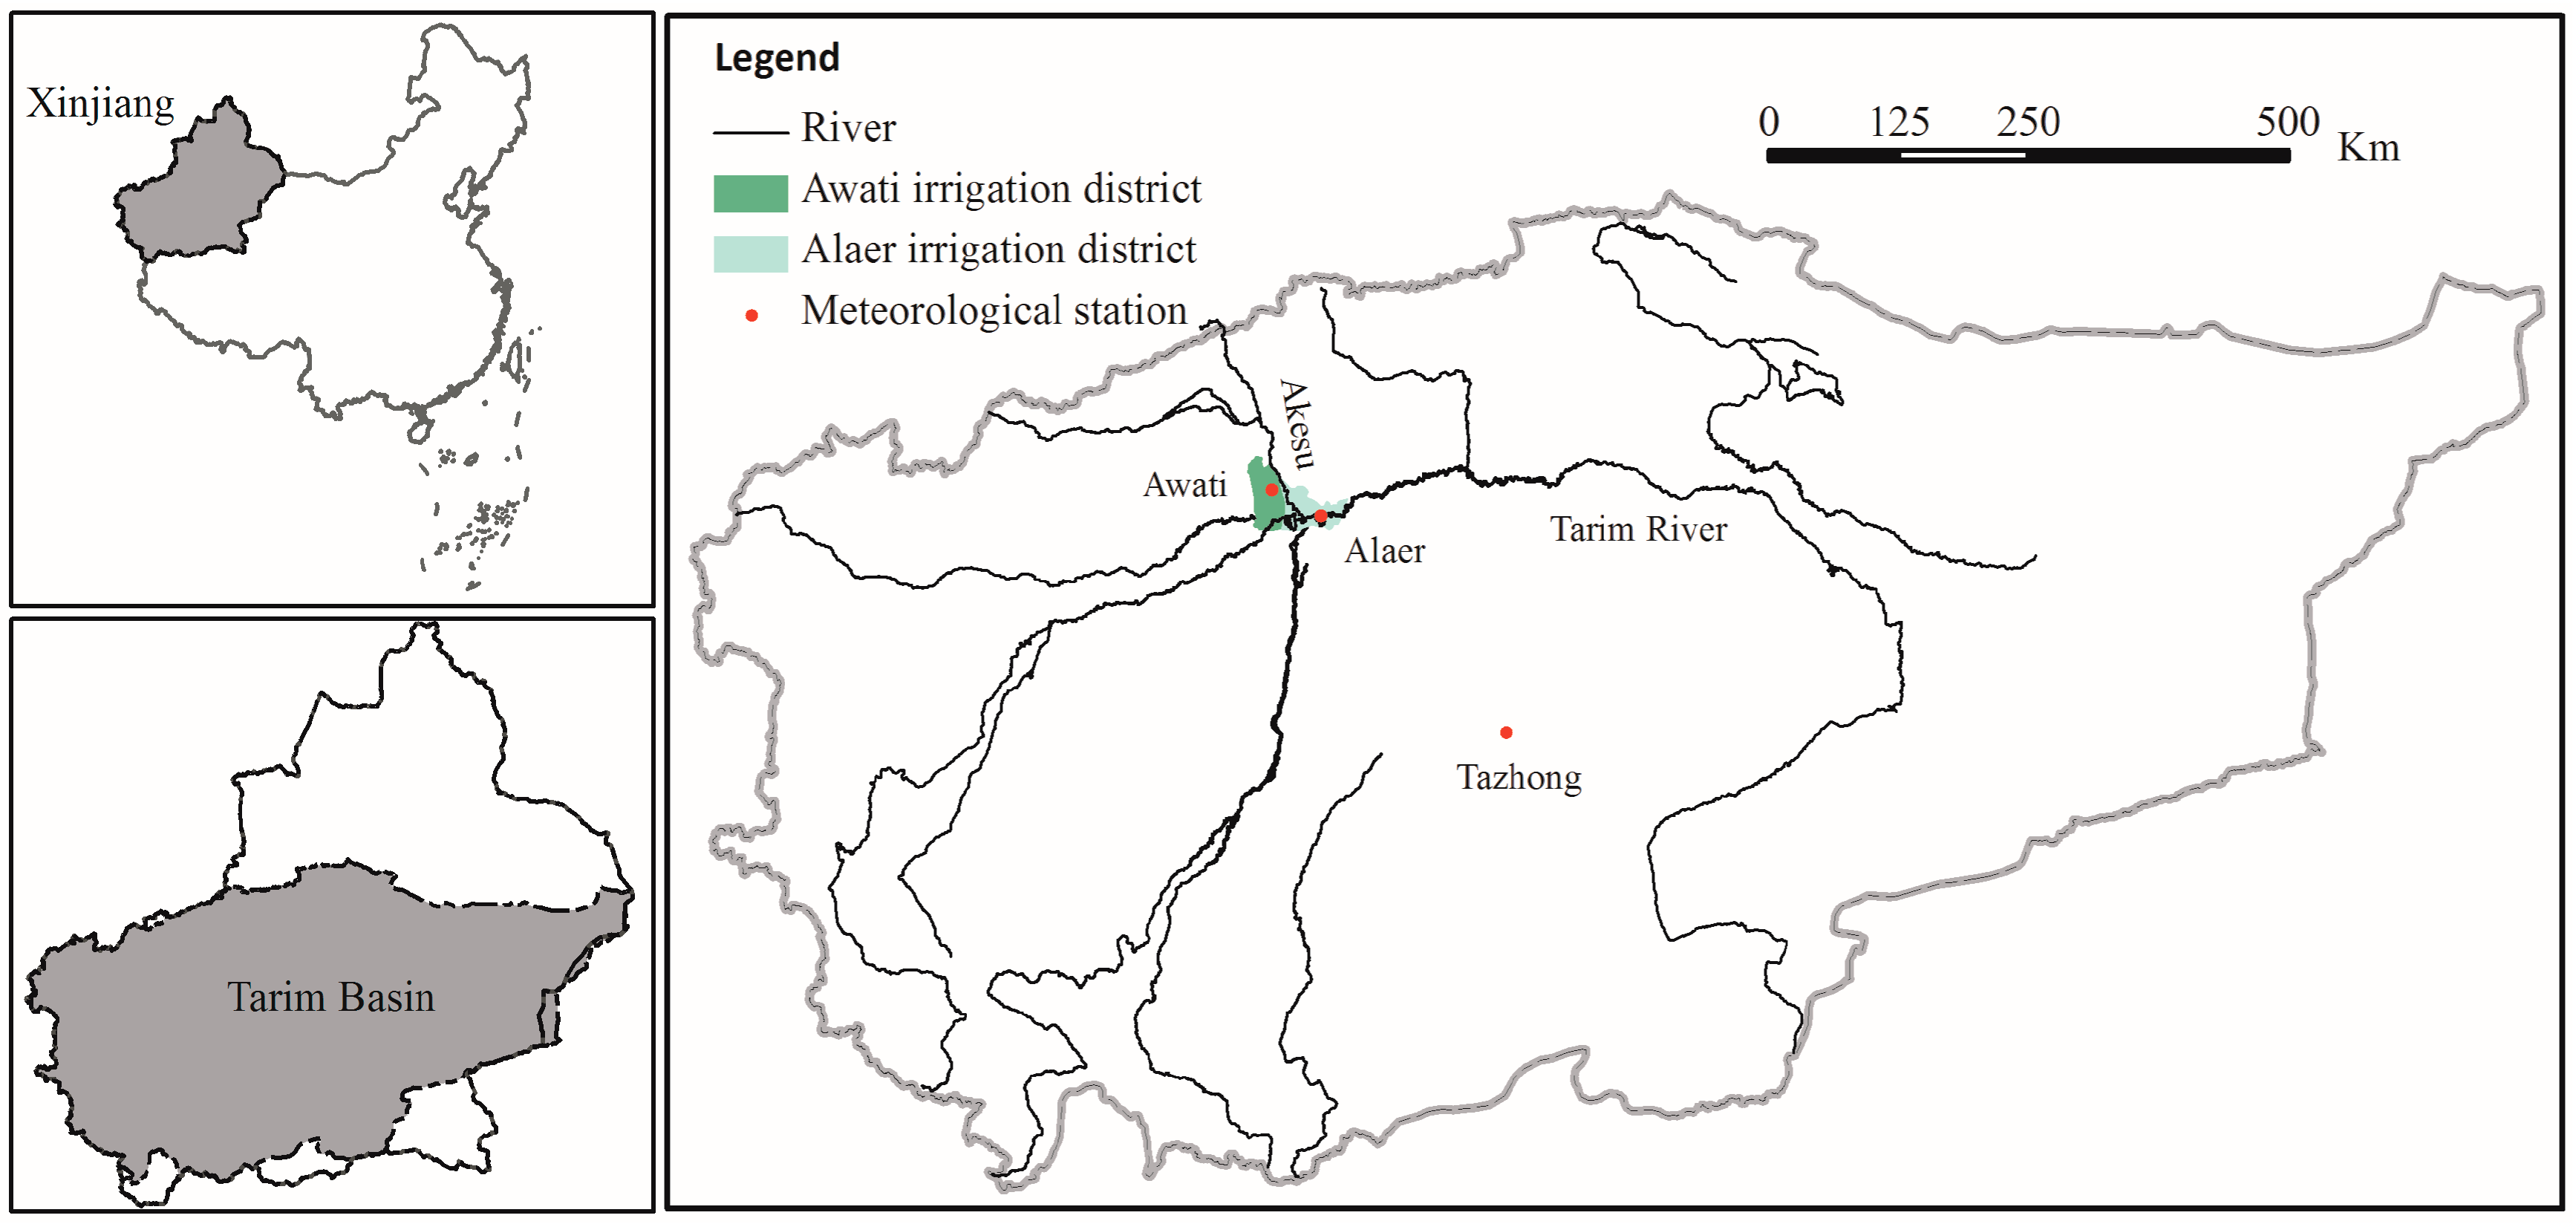
The Tarim River located south of Xinjiang is the largest inland river in central Asia, with the Akesu River being its largest tributary. The Tarim Basin can be roughly divided into three regions: the mountainous regions, the oasis regions, and the desert region. The oasis and desert regions are extremely arid with an annual precipitation of less than 100 mm. There is a long history of agricultural development in the Tarim Basin. The local characteristic of the agriculture is ‘desert oasis, irrigated agriculture.’ Oases dot along the streams in the deserts, and the cultivated lands are distributed among the oases. Because of the extremely arid climate, almost all of the cultivated lands are irrigated. The Tarim River Basin has experienced rapid irrigation development since 1950s. The increasing water consumption resulted in serious depletion of the ecosystem, especially downstream along the river [37]. Efforts have evolved to mitigate and restore the ecological system since the late 1990s.
The Awati irrigation district (71°39′–93°45′ E and 34°20′–43°39′ N) is along the Akesu River (Figure 1), with an altitude of 1100–1200 m. The study area is extremely arid, having a mean annual precipitation of 57 mm and a pan evaporation of 1900 mm. The total area is 1805.8 km2, with farmland, natural vegetation, bare land, and water body as main land-use types. The main water source for irrigation is the Akesu River. The streamflow is concentrated in the high-water period from May to September because of precipitation and the melting of glaciers in the mountainous upstream area during summer. Irrigated water is diverted to the Awati irrigation district through three channels, and is drained out of the study area through seven canals. The discharge of these canals is observed and controlled for quality by the Akesu River Basin Authority. The monthly discharge of these channels, as well as the discharge of the irrigated areas of different crops from 1980 to 2012 were directly acquired from the Akesu River Basin Authority. Then, the annual water withdrawal and drainage were calculated from the monthly discharges of the corresponding channels.
The annual irrigated areas of different crops are censused by the Akesu River Basin Authority. The changes in the irrigated area from 1980 to 2012 were collected. As of 2012, the irrigated area was 1088.8 km2, while the rest of the area was composed of natural vegetation, bare land, and water body. Cotton, wheat, and maize are the three main crops, which occupied 87.7% of the total irrigated area in 2012. The rest of the irrigated area is planted with vegetables, pasture, and wood. The area proportions of different crops are shown in Table 1.
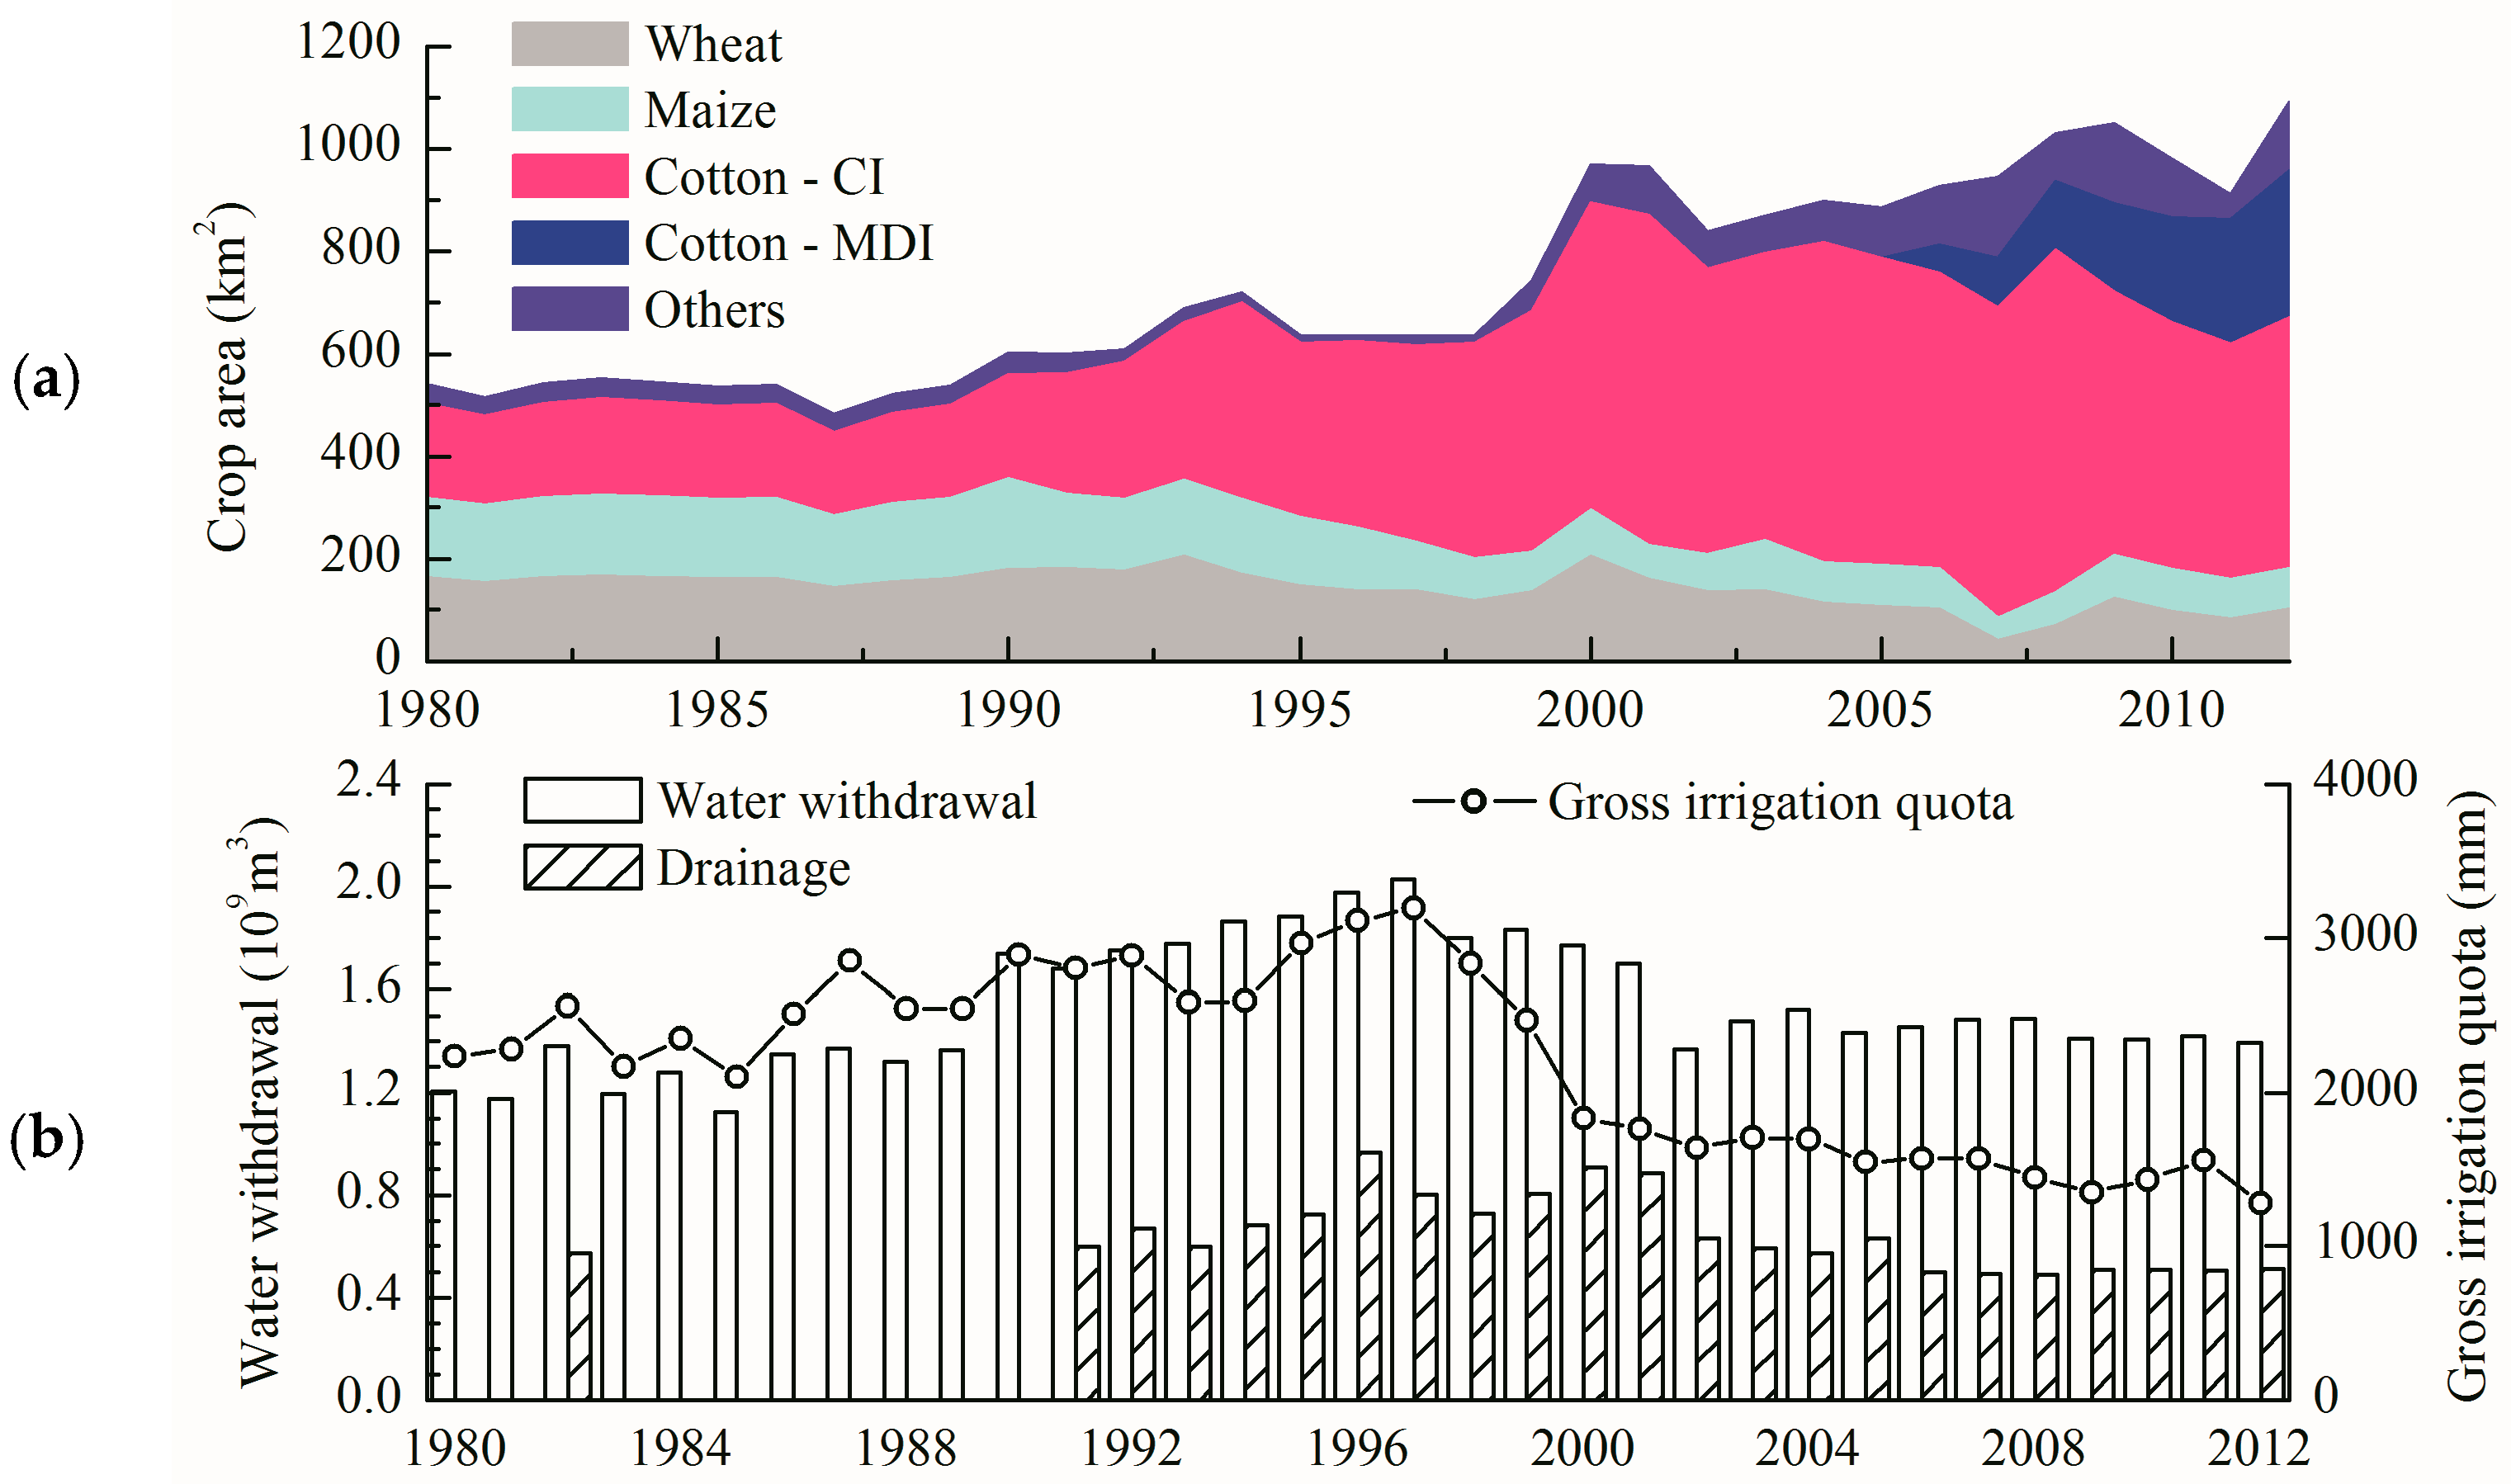
The irrigation development in Awati can be divided into two distinct periods: the conventional irrigation expansion from 1980 to 1997, and the water-saving irrigation expansion since 1998. Along with the increase of surface inflow, irrigation water withdrawal increased from 1.20 × 10⁹ m3 in 1980 to 2.03 × 10⁹ m3 in 1997 (with an annual increase rate of 0.05 × 10⁹ m3). Meanwhile, the irrigated area increased slowly from 538.7 km2 in 1980 to 635.6 km2 in 1997. During this period, the gross irrigation quota increased from 2235 to 3190 mm (Figure 2).
To restore the riparian vegetation along the lower Tarim River, water transfers were implemented to the downstream [38,39]. Meanwhile, the inflow of the Akesu River decreased from 10.15 × 10⁹ m3 in 1998 to 8.27 × 10⁹ m3 in 2012. Thus, water diversion from the Akesu River has been constrained to ensure discharge to the mainstream [40]. Therefore, water-saving technologies have been promoted in the Akesu River Basin by the Xinjiang government since 1998. As an effective and economic method to increase water use efficiency, drip irrigation under plastic mulch has been extensively adopted by local cotton farmers [15,41]. The water requirement of cotton with drip irrigation under plastic mulch is considerably less than that of traditional cotton [41,42].
Water-saving technologies significantly reduce the irrigation quota [36]. The water right quota to the Awati irrigation district has decreased to only 0.8 × 10⁹ m3 since 2005 [43]. Accordingly, irrigation water withdrawal in Awati decreased from its maximum in 1997 to 1.43 × 10⁹ m3 in 2012. However, water-saving irrigation in Awati did not lead to a reduction in the irrigated area. Instead, the irrigated area has increased because of the rebound effect of water-saving technologies and the loose farmland policy. Crop production increases rapidly with water-saving technologies, especially for cotton with drip irrigation under plastic mulch [41]. Therefore, a farmer’s demand for farmland increases because of the increasing earnings and decreasing costs. Meanwhile, the loose farmland policy encourages farmers to reclaim more farmland using the water saved from the existing irrigated land. Therefore, the irrigated area increases rapidly. In 2012, the cotton area was 774.1 km2, of which 287 km2 employed drip irrigation under mulch.
Accordingly, the gross irrigation quota decreases rapidly in the context of a growing irrigated area and a decreasing water withdrawal. The amount was 1281 mm in 2012, which was only 40% of the maximum value in 1997. The decline in P + I − D implies that the total actual evapotranspiration in Awati increased from 1980 to 1997 and decreased from 1998 to 2012. Because of the rapidly increasing irrigated area, the proportion of ETcrop to the total actual evapotranspiration significantly increased during the expansion of water-saving irrigation.
2.2. Methods of Calculating Evapotranspiration Demand
The Awati Meteorological Station (80°24′ E, 40°39′ N) is in the study area, and its climate data are representative of the Awati irrigation district. The meteorological data of Awati from 1980 to 2014, including precipitation, mean, maximum, and minimum air temperatures, sunshine duration, wind speed, and relative humidity, were collected. The data were deemed to be of good quality after being quality-tested by the Climate Data Center of the National Meteorological Information Center, China Meteorological Administration.
The reference crop evapotranspiration (ET0), which is the evapotranspiration rate from hypothetical grass with specific and well-known characteristics [44], is appropriate for estimating evapotranspiration demand in agricultural areas. Therefore, ET0 is used in this study and is expressed as:
where (kPa C−1) is the slope of the saturation vapor curve at air temperature; (kPa C−1) is a psychrometric constant; and are the net radiation and ground heat flux, MJ m−2 day−1, respectively; u is the wind speed measured at 2 m, m s−1; T is the air temperature, °C; and D is the vapor pressure deficit, kPa. The rate of potential evaporation is also calculated by the Penman equation for comparison, as follows:
where Ep is the potential evaporation, mm day−1; and is latent heat of vaporization, MJ kg−1. The first term on the right side of Equation (4) is the radiation term (Erad), which is used to denote the solar energy input of the irrigation system.
In order to exhibit the different changes before and after the expansion of water-saving irrigation in Awati, the deviations in evapotranspiration demand from the corresponding values in 1998 is calculated. The Alaer irrigation district located downstream of Awati is characterized by water-saving irrigation expansion similar to that in Awati. Therefore, the changes of evapotranspiration demand in Alaer (81°27′ E, 40°55′ N) are also evaluated for comparison.
The changes in evapotranspiration demand in an agricultural area like Awati could be affected by the background changes related to the large-scale climate system, and/or local changes related with irrigation development [45]. The irrigation effects on evaporation demand and climate conditions has been widely demonstrated by pairwise comparisons of evapotranspiration demand between irrigated and non-irrigated locations [24,28,46]. In this study, the background changes should be clearly exhibited to further confirm whether the changes in evapotranspiration demand in Awati are attributed to the local changes induced by irrigation. In the Tarim Basin, the irrigation districts are located in the oases. The oases are isolated by deserts. The oasis region is significantly affected by irrigation development, whereas the desert regions are little affected by human activities. Therefore, the background changes of the evpotranspiration demand could be detected from plenty of stations located in the deserts. However, the study area is poorly gauged. The Tazhong station (83°40′ E, 39°00′ N) located in the Taklimakan Desert is the only station found nearby. Therefore, the change in evapotranspiraiton demand of Tazhong station is used for comparison, in spite of uncertainties. The data from 1998 to 2014 is available in Tazhong. If the changes in evapotranpiration demand in Awati and Tazhong are significantly different, it can be demonstrated to some extent that the changes in Awati are not attributed to the background changes.
The crop water requirement is calculated using a single-crop coefficient approach following the procedure recommended by the Food and Agriculture Organization [44]. The crop water requirement is calculated according to the crop coefficient and ET0 as follows:
where d is the time step (one day in this study) and Kc0d is the crop coefficient (a function of the crop type and the day of the growing season). The approximate planting and harvesting date (Table 1), the length of growth stage, and the crop coefficient of each crop were investigated during the Water and Salt Monitoring Project of Akesu (1999–2002). As the purpose of this study is to evaluate the changes in water requirement corresponding to irrigation expansion, a single growing cycle for each crop was assumed during the study period.
3. Results and Discussion
3.1. Changes in Evapotranspiration Demand with Irrigation Development
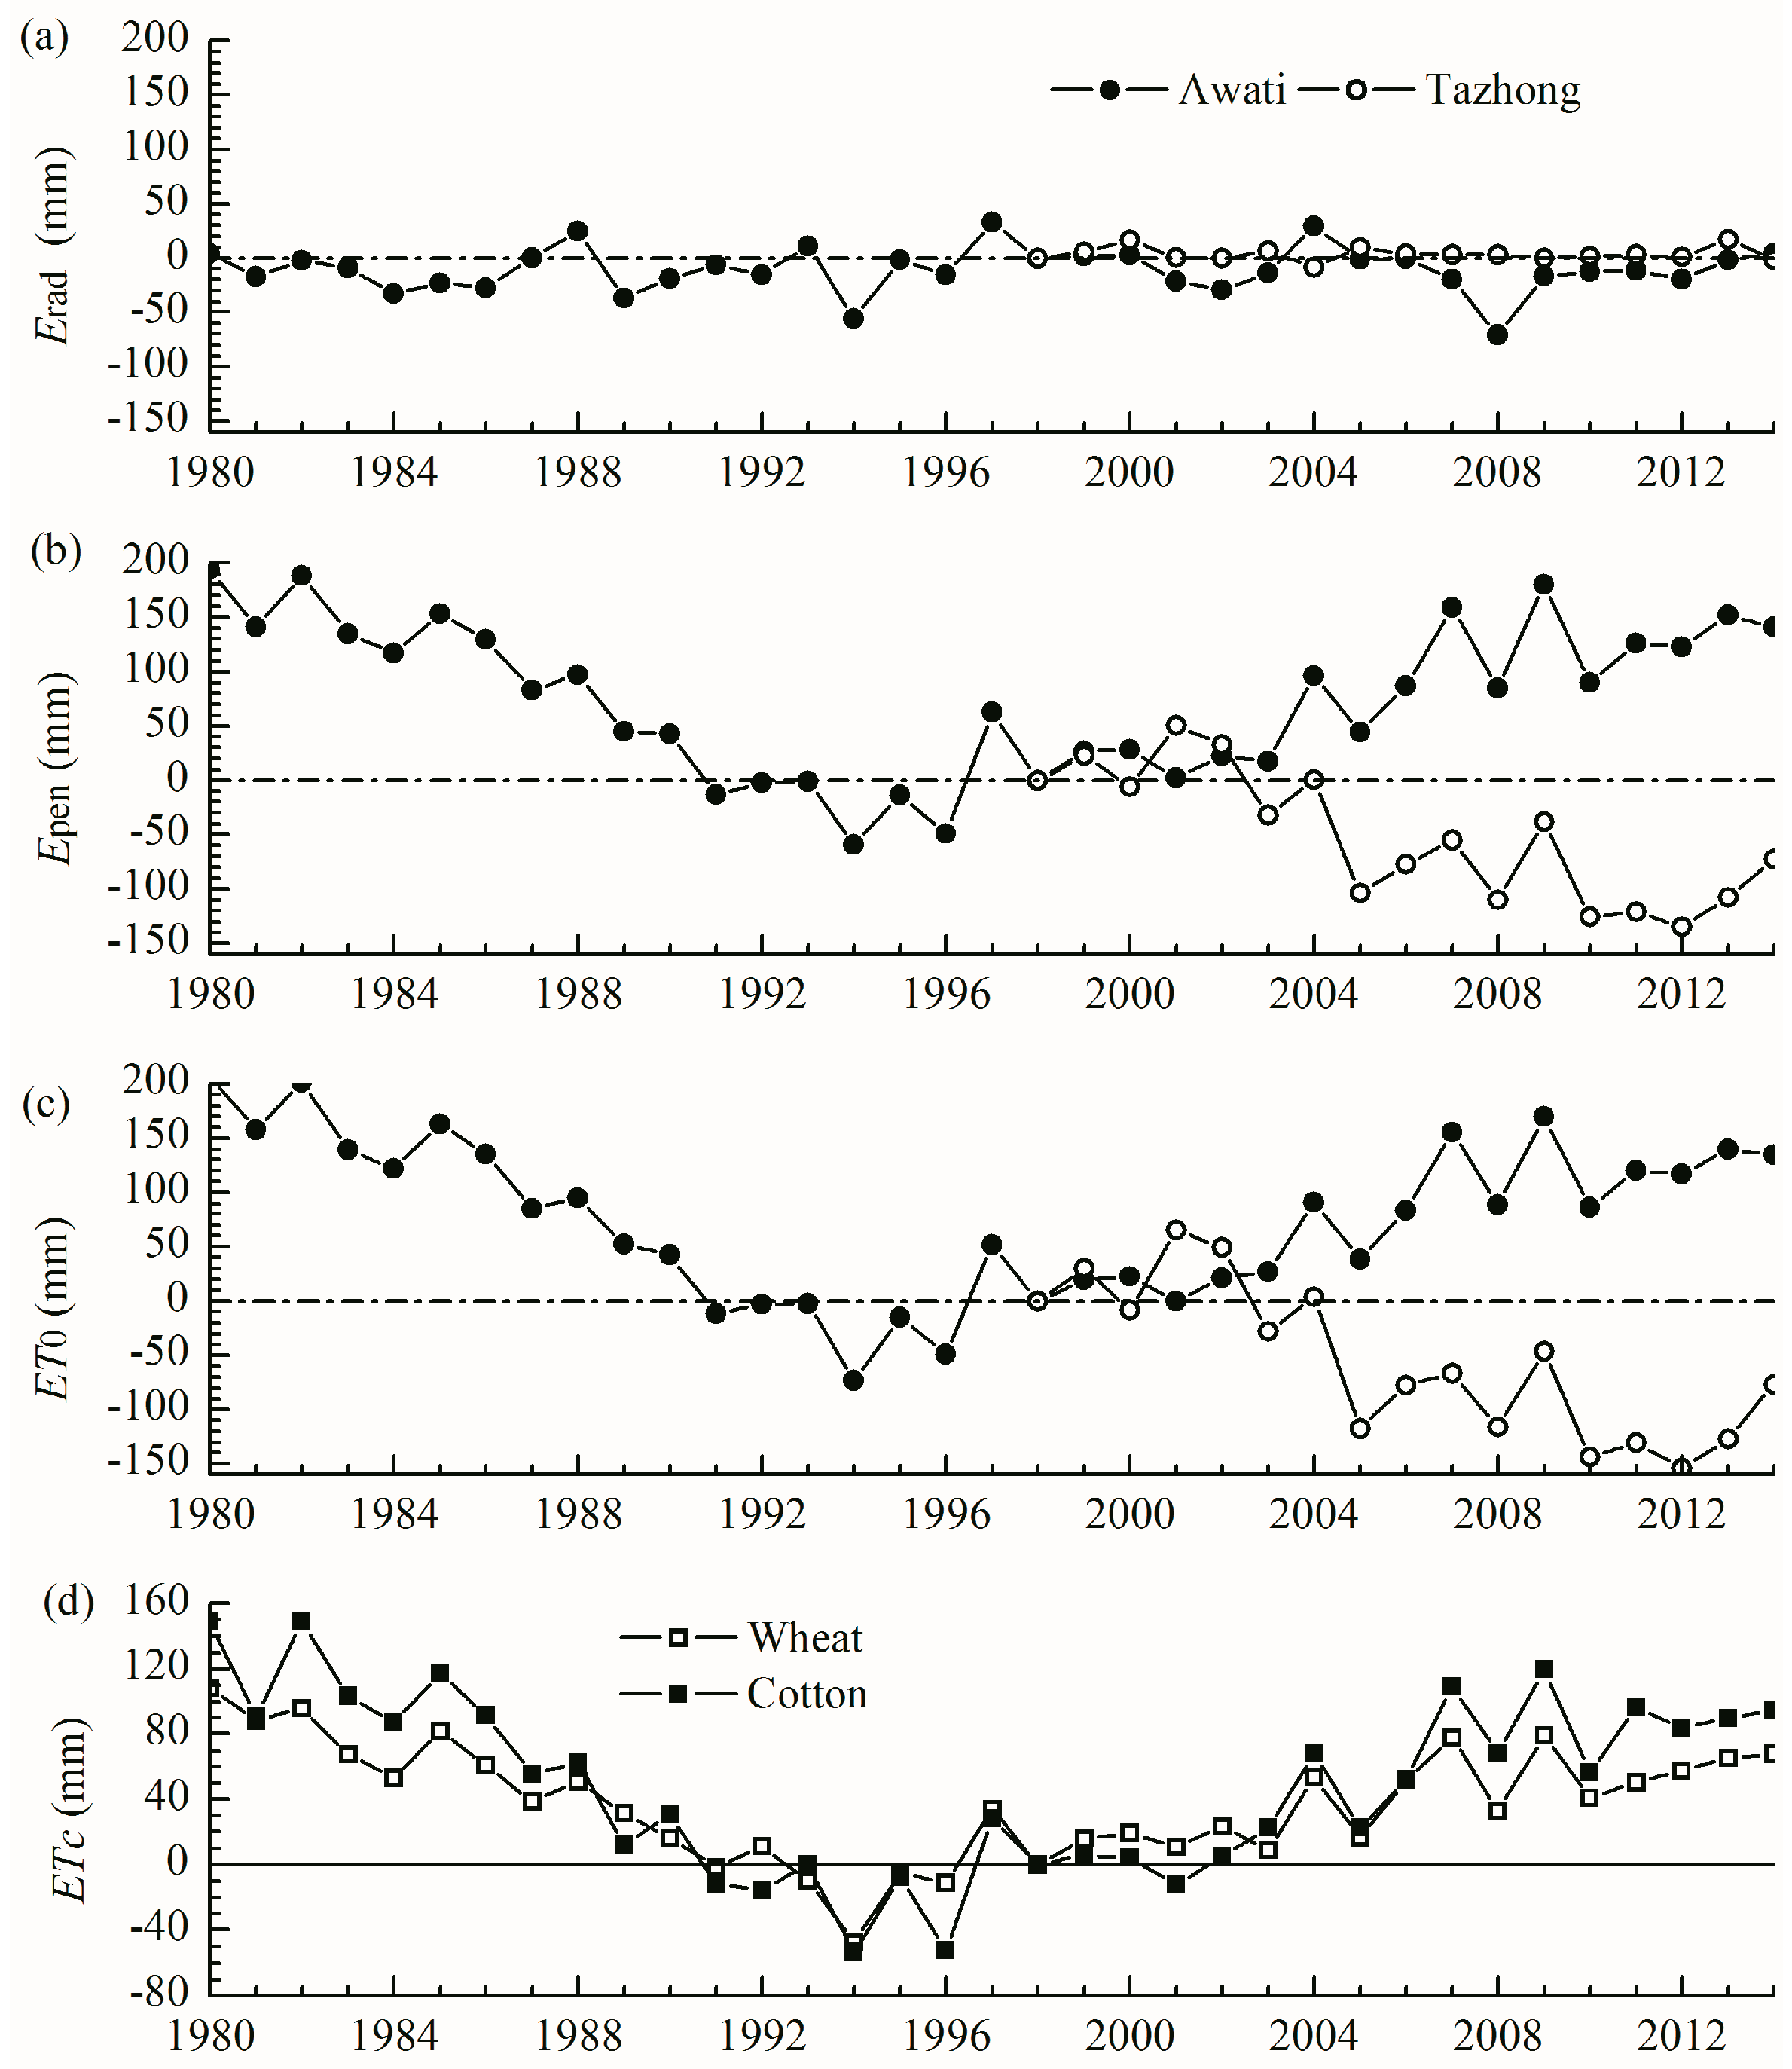
As shown in Figure 3, Ep and ET0 changed in opposite directions with the time series of irrigation water withdrawal. Ep and ET0 decreased from 1980 to 1997 (at −14.9 and −15.6 mm year−1, respectively) when irrigation water withdrawal and gross irrigation quota increased, and then rapidly increased (at 9.7 and 9.2 mm year−1, respectively) when irrigation water withdrawal and gross irrigation quota decreased (Table 1). Comparably, Erad remained stable during both periods, which implies that the changes in evapotranspiration demand are attributed to the aerodynamic term. The mean annual meteorological variables (i.e., precipitation (P), air temperature (T), relative humidity (RH), wind speed (u), and sunshine duration (SD)) in Awati during the two periods are also compared in Table 2. From 1998 to 2014, the mean u increased significantly (0.03 m s−1 year−1) and RH decreased significantly (0.6% year−1), which is the opposite of the conditions occurring from 1980 to 1997. The changes in u and RH are the main drivers of change in the evapotranspiration demand.
The time series of the water requirement per unit area of cotton and wheat from 1980 to 2014 are shown in Figure 3d. The crop water requirement per unit area in Awati decreased during the first period and significantly increased during the second period. The changes in ET0 induced by irrigation development are the main reason for the changes in the irrigation water requirement.
The components of water balance in three typical years (1982, 1997, and 2012) are compared in Table 3. Irrigation water withdrawal in 1997 was considerably larger than that in 1982 and 2012. ET0 in 1997 (992.2 mm) was considerably smaller than that in 1982 (1141.5 mm) and 2012 (1057.3 mm). However, Erad differs little between the three years.
3.2. Comparisons with Changes in Evapotranspiration Demand in Other Regions
Similar changes in evaporation demand with water-saving irrigation expansion occurred in an irrigation district downstream of Awati, in the Alaer irrigation district. Along with the water-saving irrigation extension since 1998, irrigation water decreased from 1.26 × 10⁹ m3 in 1998 to 1.08 × 10⁹ m3 in 2012, at an annual rate of 14 × 106 m3. Meanwhile, Ep and ET0 significantly increased from 1998 to 2014 (at 7.3 and 8.0 mm year−1, respectively), with stable Erad.
Different changes in evaporation demand from 1998 to 2014 were found in Tazhong, the nearby desert location, which represents the changes of the background. The Ep and ET0 in Tazhong significantly decreased from 1998 to 2014 (at −8.9 and −10.4 mm year−1, respectively) (Figure 3), unlike in Awati, whereas Erad also remained stable in Tazhong station, consistent with that in Awati. In addition, the trends in RH and u in Tazhong station from 1998 to 2014 were opposite those in Awati from 1998 to 2014.
Opposite changes in evapotranspiration demand occurred in other regions with increasing irrigation intensity (Table 4). In Harran Plain in south Turkey, where the mean annual precipitation is 372 mm, the total irrigated land increased from 23 km2 in 1980 to 1015 km2 in 2002, which accounts for approximately 76% of the total land area, with 1.18 × 10⁹ m3 surface water for irrigation. Meanwhile, summer potential evaporation decreased from approximately 14 to 7 mm day−1 [30,47]. In the Jingtai irrigation district with a mean annual precipitation of 185 mm in northwest China, after the project was completed in 1972, the irrigated land area rapidly expanded from nearly zero to approximately 55% of the study area, and the irrigation water withdrawal increased from 29.2 × 10⁶ m3 to the maximum of 158 × 106 m3 in 1991. Meanwhile, the mean annual ET0 decreased from 1203 to 983 mm after the project [28]. In both cases, the changes in evapotranspiration demand are more significant than those in natural locations, and the decreasing wind speed was the main driver of decreasing evaporation demand, followed by increasing humidity.
If the changes in Tazhong are considered to be natural climate variability, the obvious different changes in Awati can be referred to as the influences of local environmental alteration. This has been confirmed by the cases of Harran Plain and Jingtai. Therefore, the changes in evapotranspiration demand in Awati are local and related to irrigation development. The changes in RH and u in Awati are local and induced to irrigation, and they represent the main reasons for the decrease in the evapotranspiration demand during the first period and the increase during the second period.
3.3. Analysis Based on Complementary Relationship
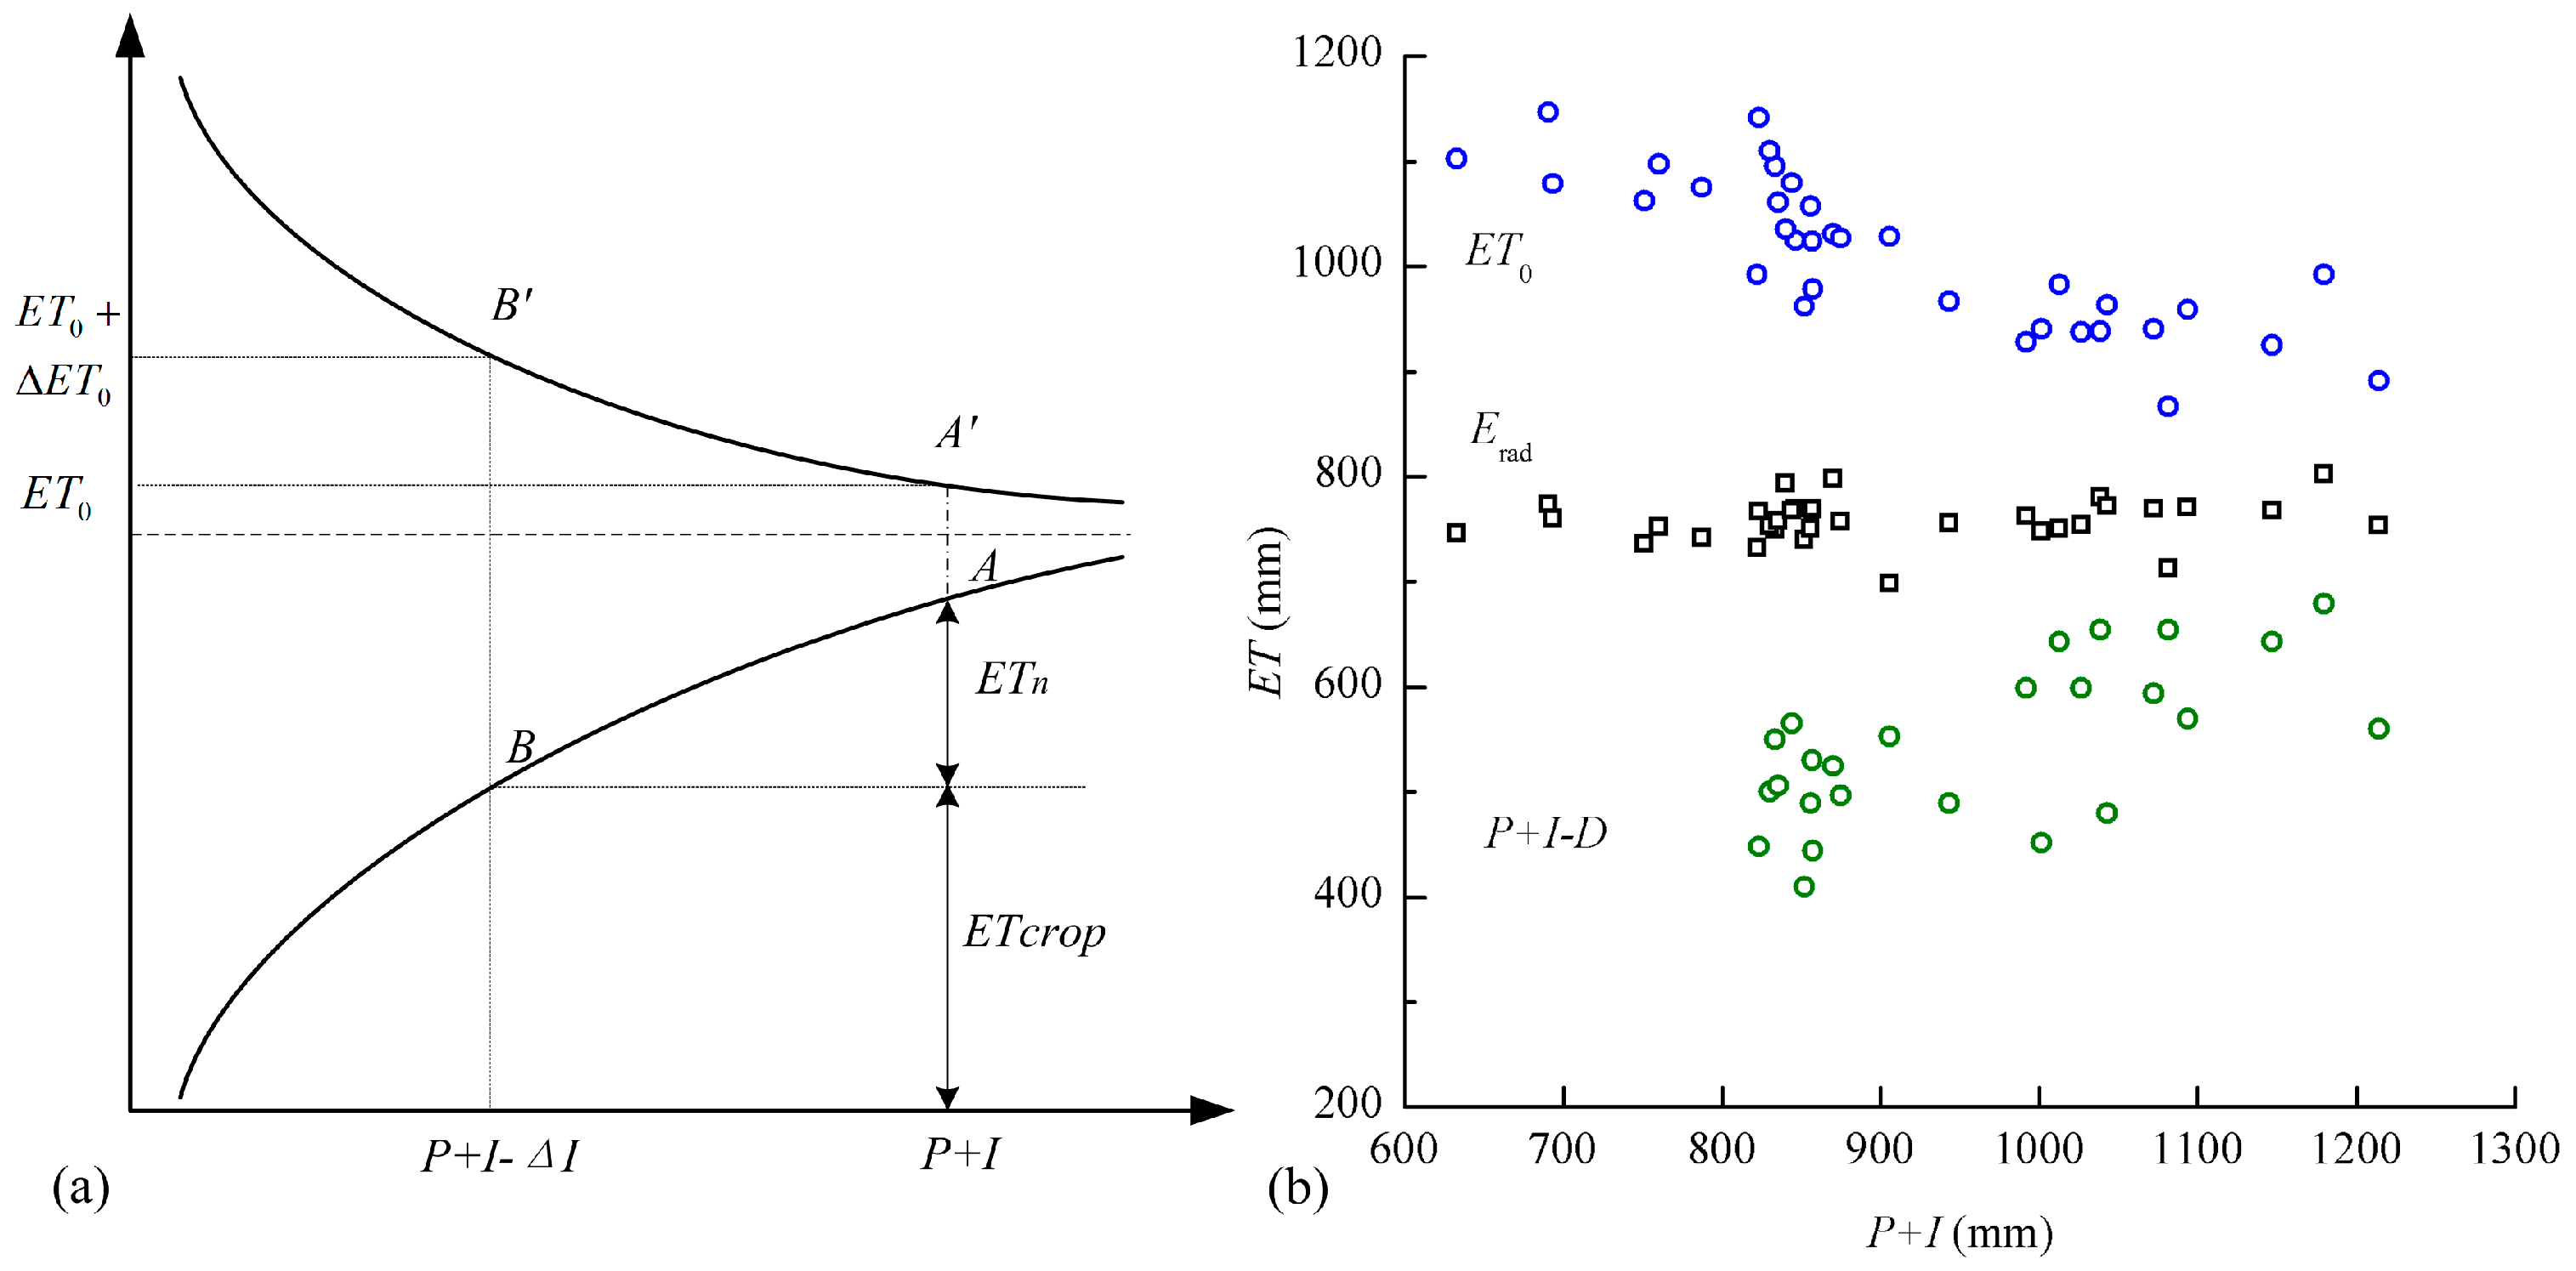
Inspired by studies that analyze the effects of irrigation expansion on evapotranspiration demand under the framework of complementary relationship [28,29], this study investigates the impacts of water-saving irrigation extension on evapotranspiration demand. For an irrigation system with water withdrawalI, the actual evapotranspiration comprises crop evapotranspiration ETcrop and non-crop evapotranspiration ETn (Point A in Figure 4a). The corresponding evapotranspiration demand is ET0. The irrigation efficiency would increase through water-saving irrigation expansion. Supposing an extreme case, irrigation water withdrawal decreases by because of water saving and ETn is reduced to zero with constant ETcrop. The irrigation efficiency increased from to . According to the complementary relationship, evapotranspiration demand would change with the water availability in the opposite direction of actual regional evapotranspiration. As actual evapotranspiration moves toward Point B, the reference crop evapotranspiration would move from Point A’ to Point B’. The evapotranspiration ratio would then increase from to . Therefore, although water-saving technologies increase irrigation efficiency by reducing ETn, they induce an increase in evapotranspiration demand. Considering that the increasing ET0 negatively influences the water abundance, the effects of water saving are partly weakened.
In Awati, P + I − D decreased with the decreasing water withdrawal due to the expansion of water-saving irrigation. Given that the average groundwater table declined slowly from 2.24 m below the surface in 2000 to 3.0 m in 2012, the amount of negative water storage ΔSw is insignificant. Furthermore, the surface runoff in Awati is negligible because of scarce precipitation. Therefore, actual evapotranspiration in Awati decreased with the decreasing water withdrawal. Then, a typical complementary relationship exists, which can be detected from the changes of P + I − D and ET0 against the water availability P + I (Figure 4b). The preceding analysis based on the complementary relationship is suitable for the Awati irrigation district. The irrigation efficiency in the Awati irrigation district is significantly increased by water-saving technologies. The proportion of among the total ET increased significantly with the expansion of water-saving irrigation. was approximately 83.7% of during 1999–2000 [48], whereas it was approximately 1.85 times of during 2009–2011 [40]. However, ET0 increased from 959.3 mm in 1999 to 1057.3 mm in 2012. The crop water requirement increased correspondingly. Accordingly, the effects of water-saving were partly weakened.
It should be noted that the expansion of water-saving irrigation does not inevitably result in increasing ET0, which happens only when the water withdrawal and total actual evapotranspiration decreases with water-saving irrigation. Besides, the above analysis focuses on the evapotranspiration demand and water requirement per unit area. The total evapotranspiration demand and water requirement is also affected by other factors, i.e., irrigated area.
4. Conclusions
The irrigation development in the Awati irrigation district since 1980 can be divided into two distinct periods. During the first period of irrigation expansion from 1980 to 1997, the irrigated area and water withdrawal increased rapidly, and the gross irrigation quota increased from 2235 mm in 1980 to its maximum, 3190 mm in 1997. Accordingly, evapotranspiration demand decreased during this period (ET0 decreased at a rate of −15.6 mm year−1), which was mainly driven by the decreasing wind speed and increasing humidity. By contrast, during the second period of water-saving irrigation expansion, which began in 1998, irrigation water withdrawal and irrigation intensity decreased rapidly while the irrigated area was enlarged. Accordingly, ET0 increased at a rate of 9.2 mm year−1, which raised the irrigation water requirement.
The changes in evapotranspiration demand in the Awati irrigation district exhibit a complementary relationship with actual evapotranspiration. Irrigation efficiency increases during the expansion of water-saving irrigation, which significantly reduces . The accompanied decreases in water withdrawal and total actual evapotranspiration resulted in an increase in the evapotranspiration demand, which partly weakened the effects of water-saving irrigation. , which is usually regarded as non-beneficial, could help stabilize the evapotranspiration demand. The changes in evapotranspiration demand induced by irrigation should be considered when evaluating the performance of water-saving irrigation, as well as in agricultural water planning and the management of irrigation districts such as Awati.
Acknowledgments
This research was partially sponsored by the National Natural Science Foundation of China (No. 51579249), the Research Fund (No. 2016ZY06, 2016TS06, 1503) of State Key Laboratory of Simulation and Regulation of Water Cycle in River Basin, China Institute of Water Resources and Hydropower Research.
Author Contributions
Songjun Han, Di Xu, and Zhiyong Yang analyzed the data; Songjun Han and Di Xu contributed to the analysis work; and Songjun Han wrote the paper.
Conflicts of Interest
The authors declare no conflict of interest.
References
- Döll, P.; Schmied, H.M.; Schuh, C.; Portmann, F.T.; Eicker, A. Globalascale assessment of groundwater depletion and related groundwater abstractions: Combining hydrological modeling with information from well observations and grace satellites. Water Resour. Res. 2014, 50, 5698–5720. [Google Scholar] [CrossRef]
- Burt, C.M.; Clemmens, A.J.; Strelkoff, T.S.; Solomon, K.H.; Bliesner, R.D.; Hardy, L.A.; Howell, T.A.; Eisenhauer, D.E. Irrigation performance measures: Efficiency and uniformity. J. Irrig. Drain. E 1997, 123, 423–442. [Google Scholar] [CrossRef]
- Pereira, L.S.; Cordery, I.; Iacovides, I. Improved indicators of water use performance and productivity for sustainable water conservation and saving. Agric. Water Manag. 2012, 108, 39–51. [Google Scholar] [CrossRef]
- Pereira, L.S.; Oweis, T.; Zairi, A. Irrigation management under water scarcity. Agric. Water Manag. 2002, 57, 175–206. [Google Scholar] [CrossRef]
- Allen, R.G.; Willardson, L.S.; Frederiksen, H. Water Use Definitions and Their Use for Assessing the Impacts of Water Conservation. In Proceedings of the ICID Workshop on Sustainable Irrigation in Areas of Water Scarcity and Drought, Oxford, UK, 11–12 September 1997; pp. 72–82. [Google Scholar]
- Wang, H.; Yang, G.Y.; Jia, Y.W.; Qin, D.Y.; Gan, H.; Wang, J.H.; Han, C.M. Necessity and feasibility for an et-based modern water resources management strategy: A case study of soil water resources in the yellow river basin. Sci. China Ser. E 2009, 52, 3004–3016. [Google Scholar] [CrossRef]
- Wang, H.; Yang, G.Y.; Jia, Y.W.; Qin, D.Y. Study on consumption efficiency of soil water resources in the yellow river basin based on regional et structure. Sci. China Ser. D 2008, 51, 456–468. [Google Scholar] [CrossRef]
- Dumont, A.; Mayor, B.; López-Gunn, E. Is the rebound effect or jevons paradox a useful concept for better management of water resources? Insights from the irrigation modernisation process in Spain. Aquat. Procedia 2013, 1, 64–76. [Google Scholar] [CrossRef]
- Erie, L.J.; French, O.F.; Bucks, D.A.; Harris, K. Consumptive Use of Water by Major Crops in the Southwestern United States; USDA Conservation Research Report 29; USDA: Washington, DC, USA, 1982.
- Zhang, Z.; Tian, F.; Hu, H.; Yang, P. A comparison of methods for determining field evapotranspiration: Photosynthesis system, sap flow, and eddy covariance. Hydrol. Earth Syst. Sci. 2014, 18, 1053–1072. [Google Scholar] [CrossRef]
- Ward, F.A.; Pulido-Velazquez, M. Water conservation in irrigation can increase water use. Proc. Natl. Acad. Sci. USA 2008, 105, 18215–18220. [Google Scholar] [CrossRef] [PubMed]
- Berbel, J.; Gutiérrez-Martín, C.; Rodríguez-Díaz, J.A.; Camacho, E.; Montesinos, P. Literature review on rebound effect of water saving measures and analysis of a Spanish case study. Water Resour. Manag. 2014, 29, 663–678. [Google Scholar] [CrossRef]
- Scott, C.A.; Vicuña, S.; Blanco-Gutiérrez, I.; Meza, F.; Varela-Ortega, C. Irrigation efficiency and water-policy implications for river basin resilience. Hydrol. Earth Syst. Sci. 2014, 18, 1339–1348. [Google Scholar] [CrossRef] [Green Version]
- Loch, A.; Adamson, D. Drought and the rebound effect: A murray–darling basin example. Nat. Hazards 2015, 79, 1429–1449. [Google Scholar] [CrossRef]
- Zhang, Z.; Hu, H.; Tian, F.; Yao, X.; Sivapalan, M. Groundwater dynamics under water-saving irrigation and implications for sustainable water management in an oasis: Tarim river basin of Western China. Hydrol. Earth Syst. Sci. 2014, 18, 3951–3967. [Google Scholar] [CrossRef]
- Sivapalan, M.; Konar, M.; Srinivasan, V.; Chhatre, A.; Wutich, A.; Scott, C.; Wescoat, J.; Rodríguez-Iturbe, I. Socio-hydrology: Use-inspired water sustainability science for the anthropocene. Earth’s Future 2014, 2, 225–230. [Google Scholar] [CrossRef]
- Berbel, J.; Mateos, L. Does investment in irrigation technology necessarily generate rebound effects? A simulation analysis based on an agro-economic model. Agric. Syst. 2014, 128, 25–34. [Google Scholar] [CrossRef]
- Doorenbos, J.; Plusje, J.; Kassam, A.; Branscheid, V.; Bentvelsen, C. Yield Response to Water; Food and Agriculture Organization of the United Nations: Rome, Italy, 1979. [Google Scholar]
- Jensen, M.E. Water consumption by agricultural plants. In Water Deficit and Plant Growth; Kozlowski, T.T., Ed.; Academic Press: New York, NY, USA, 1968. [Google Scholar]
- Stewart, J.; Cuenca, R.; Pruitt, W.; Hagan, R.; Tosso, J. Determination and Utilization of Water Production Functions for Principal California Crops; University of California: Davis, CA, USA, 1977. [Google Scholar]
- Mahmood, R.; Pielke, R.A.; Hubbard, K.G.; Niyogi, D.; Dirmeyer, P.A.; McAlpine, C.; Carleton, A.M.; Hale, R.; Gameda, S.; Beltrán-Przekurat, A. Land cover changes and their biogeophysical effects on climate. Int. J. Climatol. 2014, 34, 929–953. [Google Scholar] [CrossRef]
- Mahmood, R.; Hubbard, K.G.; Leeper, R.D.; Foster, S.A. Increase in near-surface atmospheric moisture content due to land use changes: Evidence from the observed dewpoint temperature data. Mon. Weather Rev. 2008, 136, 1554–1561. [Google Scholar] [CrossRef]
- Cook, B.I.; Puma, M.J.; Krakauer, N.Y. Irrigation induced surface cooling in the context of modern and increased greenhouse gas forcing. Clim. Dyn. 2010, 37, 1587–1600. [Google Scholar] [CrossRef]
- Han, S.; Tang, Q.; Zhang, X.; Di, X.; Kou, L. Surface wind observations affected by agricultural development over Northwest China. Environ. Res. Lett. 2016, 11, 054014. [Google Scholar] [CrossRef]
- Vautard, R.; Cattiaux, J.; Yiou, P.; Thépaut, J.N.; Ciais, P. Northern hemisphere atmospheric stilling partly attributed to an increase in surface roughness. Nat. Geosci. 2010, 3, 756–761. [Google Scholar] [CrossRef]
- Boucher, O.; Myhre, G.; Myhre, A. Direct human influence of irrigation on atmospheric water vapour and climate. Clim. Dyn. 2004, 22, 597–603. [Google Scholar] [CrossRef]
- Ozdogan, M.; Woodcock, C.E.; Salvucci, G.D.; Demir, H. Changes in summer irrigated crop area and water use in Southeastern Turkey from 1993 to 2002: Implications for current and future water resources. Water Resour. Manag. 2006, 20, 467–488. [Google Scholar] [CrossRef]
- Han, S.; Xu, D.; Wang, S.; Yang, Z. Water requirement with irrigation expansion in jingtai irrigation district, Northwest China: The need to consider irrigation-induced local changes in evapotranspiration demand. J. Irrig. Drain. Eng. (ASCE) 2014, 140, 04013009. [Google Scholar] [CrossRef]
- Bouchet, R. Evapotranspiration réelle et potentielle, signification climatique. Int. Assoc. Hydrol. Sci. Publ. 1963, 62, 134–142. [Google Scholar]
- Ozdogan, M.; Salvucci, G.D. Irrigation-induced changes in potential evapotranspiration in Southeastern Turkey: Test and application of bouchet’s complementary hypothesis. Water Resour. Res. 2004, 40, W04301. [Google Scholar] [CrossRef]
- Lobell, D.B.; Bala, G.; Mirin, A.; Phillips, T.; Maxwell, R.; Rotman, D. Regional differences in the influence of irrigation on climate. J. Clim. 2009, 22, 2248–2255. [Google Scholar] [CrossRef]
- Bonfils, C.; Lobell, D. Empirical evidence for a recent slowdown in irrigation-induced cooling. Proc. Natl. Acad. Sci. USA 2007, 104, 13582–13587. [Google Scholar] [CrossRef] [PubMed]
- Lu, Y.; Kueppers, L. Increased heat waves with loss of irrigation in the United States. Environ. Res. Lett. 2015, 10, 064010. [Google Scholar] [CrossRef]
- Zhong, R.; Dong, X.; Ma, Y. Sustainable water saving: New concept of modern agricultural water saving, starting from development of Xinjiang’s agricultural irrigation over the last 50 years. Irrig. Drain. 2009, 58, 383–392. [Google Scholar]
- Zhong, R.; Tian, F.; Yang, P.; Yi, Q. Planting and irrigation methods for cotton in southern Xinjiang, China. Irrig. Drain. 2016, 65, 461–468. [Google Scholar] [CrossRef]
- Zhou, H.; Wang, Y.; Sun, Z.; Chen, J. Irrigation quota and its changes of different irrigation modes in arid Xinjiang region. Water Sav. Irrig. 2013, 38, 5–11. [Google Scholar]
- Liu, Y.; Tian, F.; Hu, H.; Sivapalan, M. Socio-hydrologic perspectives of the co-evolution of humans and water in the tarim river basin, Western China: The Taiji–Tire model. Hydrol. Earth Syst. Sci. 2014, 18, 1289–1303. [Google Scholar] [CrossRef] [Green Version]
- Liu, D.; Tian, F.; Hu, H.; Lin, M.; Cong, Z. Ecohydrological evolution model on riparian vegetation in hyperarid regions and its validation in the lower reach of Tarim river. Hydrol. Process. 2012, 26, 2049–2060. [Google Scholar] [CrossRef]
- Chen, Y.; Chen, Y.; Xu, C.; Ye, Z.; Li, Z.; Zhu, C.; Ma, X. Effects of ecological water conveyance on groundwater dynamics and riparian vegetation in the lower reaches of Tarim river, China. Hydrol. Process. 2010, 24, 170–177. [Google Scholar] [CrossRef]
- Thevs, N.; Peng, H.; Rozi, A.; Zerbe, S.; Abdusalih, N. Water allocation and water consumption of irrigated agriculture and natural vegetation in the aksu-tarim river basin, Xinjiang, China. J. Arid. Environ. 2015, 112, 87–97. [Google Scholar] [CrossRef]
- Yang, P.; Hu, H.; Tian, F.; Zhang, Z.; Dai, C. Crop coefficient for cotton under plastic mulch and drip irrigation based on eddy covariance observation in an arid area of Northwestern China. Agric. Water Manag. 2016, 171, 21–30. [Google Scholar] [CrossRef]
- Tian, F.; Yang, P.; Hu, H.; Dai, C. Partitioning of cotton field evapotranspiration under mulched drip irrigation based on a dual crop coefficient model. Water 2016, 8, 72. [Google Scholar] [CrossRef]
- Zhong, R.; Dong, X.; Du, W. Strategies of its optimal allocation and current situation of water-soil resources in awati irrigation area (in Chinese with English abstract). J. Soil Water Conserv. 2007, 21, 174–178. [Google Scholar]
- Allen, R.G.; Pereira, L.S.; Raes, D.; Smith, M. Crop Evapotranspiration: Guidelines for Computing Crop Water Requirements; FAO Irrigation and Drainage Paper No. 56; Food and Agricultural Organization of the U.N.: Rome, Italy, 1998. [Google Scholar]
- Han, S.; Hu, H. Spatial variations and temporal changes in potential evaporation in the Tarim Basin, northwest china (1960–2006): Influenced by irrigation? Hydrol. Process. 2012, 26, 3041–3051. [Google Scholar] [CrossRef]
- Lobell, D.B.; Bonfils, C. The effect of irrigation on regional temperatures: A spatial and temporal analysis of trends in California, 1934–2002. J. Clim. 2008, 21, 2063–2071. [Google Scholar] [CrossRef]
- Ozdogan, M. The hydroclimatologic Effects of Irrigation in Southeastern Turkey. Ph.D. Thesis, Boston University, Boston, MA, USA, 2005. [Google Scholar]
- Lei, Z.; Hu, H.; Yang, S.; Tian, F. Analysis on water consumption in oases of the Tarim Basin. J. Hydr. Eng. 2006, 12, 1470–1475. [Google Scholar]
Figure 1.
Location of the study area in Mainland China.

Figure 2.
(a) Crops area, (b) irrigation water withdrawal, drainage, and gross irrigation quota in the Awati irrigation district from 1980 to 2012.
Figure 2.
(a) Crops area, (b) irrigation water withdrawal, drainage, and gross irrigation quota in the Awati irrigation district from 1980 to 2012.

Figure 3.
Deviations in (a) annual radiation term (Erad), (b) Penman potential evaporation (Ep), (c) reference evapotranspiration (ET0), and (d) water requirement per unit area of cotton and wheat from the corresponding values in 1998 in Awati station from 1980 to 2014 and in the Tazhong station from 1980 to 2014.

Figure 4.
(a) Effects of on evapotranspiration demand under the framework of complementary relationship, and (b) assessment of the Awati irrigation district.
Figure 4.
(a) Effects of on evapotranspiration demand under the framework of complementary relationship, and (b) assessment of the Awati irrigation district.


Table 1.
Growth periods and area proportions of crops in different periods.
| Crop | Cotton | Wheat | Maize | Vegetable | Pasture | Wood | |||
|---|---|---|---|---|---|---|---|---|---|
| CI 1 | MDI 2 | Summer | Spring | ||||||
| Planting day Harvesting day | 25/4 1/11 | 22/4 4/10 | 25/9 20/6 | 20/6 10/10 | 25/4 1/9 | 10/4 10/9 | 1/4 30/9 | ~ | |
| Proportion % | 1980 | 33.8 | 0 | 30 | 25.1 | 3.9 | 1.8 | 0.4 | 5 |
| 1998 | 66.3 | 0 | 18.5 | 11.5 | 1.3 | 0.6 | 0.1 | 1.7 | |
| 2012 | 44.7 | 26.4 | 9.2 | 7.3 | 0.2 | 1.2 | 0 | 11.1 | |
1 Conventional irrigation; 2 mulched drip irrigation.
Table 2.
Comparison of the mean value and trend per year of potential evaporation (Ep) and its radiation term (Erad), reference evapotranspiration (ET0), mean daily temperature (T), relative humidity (RH), wind speed (u), sunshine duration (SD) and precipitation (P) during the two periods in Awati (AW), Alaer (AL) and Tazhong (TZ).
| Site | Period | Erad | Ep | ET0 | T | RH | u | SD | P | |
|---|---|---|---|---|---|---|---|---|---|---|
| (mm) | (mm) | (mm) | (°C) | (%) | (m s−1) | (Hour) | (mm) | |||
| AW | 1980–1997 | Mean | 758.7 | 1167.9 | 1012.1 | 10.47 | 58.8 | 1.32 | 2906 | 62.7 |
| Trend | 0.5 | −14.9 ** | −15.6 ** | −0.01 | 0.34 * | −0.08 ** | −8.9 | 1.8 | ||
| 1998–2014 | Mean | 758.7 | 1179.7 | 1017.5 | 11.35 | 56.7 | 1.19 | 2876 | 71.0 | |
| Trend | −0.1 | 9.7 ** | 9.2 ** | 0.06 | −0.62 ** | 0.03 ** | 21.7 ** | 0.3 | ||
| AL | 1998–2014 | Mean | 762.5 | 1183.9 | 1026.1 | 10.81 | 57.26 | 1.25 | 2910 | 51.0 |
| Trend | 2.13 | 7.3 ** | 8.0 ** | −0.03 | −0.19 | 0.03 ** | 21.4 ** | −0.6 | ||
| TZ | 1998–2014 | Mean | 689.8 | 1568.8 | 1460.9 | 11.76 | 34.30 | 2.12 | 2708 | 25.6 |
| Trend | 2.0 | −8.9 ** | −10.4 ** | −0.14 | 0.07 | −0.03 * | 11.2 | −0.1 | ||
Note: * Significant at 95% confidence level; ** Significant at 99% confidence level.
Table 3.
Water balance components and evapotranspiration demand in three typical years.
| Year | Irrigated Area (km2) | P (mm) | I (mm) | D (mm) | Erad (mm) | Ep (mm) | ET0 (mm) |
|---|---|---|---|---|---|---|---|
| 1982 | 540.5 | 57.3 | 766.0 | 317.7 | 766.8 | 1286.9 | 1141.5 |
| 1997 | 635.6 | 56.6 | 1123.1 | 444.0 | 802.2 | 1161.1 | 992.2 |
| 2012 | 1088.8 | 83.4 | 772.2 | 283.2 | 750.2 | 1221.4 | 1057.3 |
Table 4.
Directions of changes in evapotranspiration demand and its drivers corresponding to increases (↑) or decreases (↓) in irrigation intensity for various regions.
Table 4.
Directions of changes in evapotranspiration demand and its drivers corresponding to increases (↑) or decreases (↓) in irrigation intensity for various regions.
| Region | Period | Irrigation Intensity | Evaporation Demand | Main Factors | Crop Water Requirement | References |
|---|---|---|---|---|---|---|
| Harran Plain, Turkey | 1980–2002 | ↑ | ↓ | u↓, RH↑ | ↓ | [30,47] |
| Jingtai, China | 1972–1991 | ↑ | ↓ | u↓, RH↑ | ↓ | [28] |
| Awati, China | 1980–1997 | ↑ | ↓ | u↓, RH↑ | ↓ | |
| 1998–2014 | ↓ | ↑ | u↑, RH↓ | ↑ | ||
| Alaer, China | 1998–2014 | ↓ | ↑ | u↑, RH↓ | ↑ |
© 2017 by the authors. Licensee MDPI, Basel, Switzerland. This article is an open access article distributed under the terms and conditions of the Creative Commons Attribution (CC BY) license (http://creativecommons.org/licenses/by/4.0/).
Share and Cite
MDPI and ACS Style
Han, S.; Xu, D.; Yang, Z. Irrigation-Induced Changes in Evapotranspiration Demand of Awati Irrigation District, Northwest China: Weakening the Effects of Water Saving? Sustainability 2017, 9, 1531. https://doi.org/10.3390/su9091531
AMA Style
Han S, Xu D, Yang Z. Irrigation-Induced Changes in Evapotranspiration Demand of Awati Irrigation District, Northwest China: Weakening the Effects of Water Saving? Sustainability. 2017; 9(9):1531. https://doi.org/10.3390/su9091531
Chicago/Turabian StyleHan, Songjun, Di Xu, and Zhiyong Yang. 2017. "Irrigation-Induced Changes in Evapotranspiration Demand of Awati Irrigation District, Northwest China: Weakening the Effects of Water Saving?" Sustainability 9, no. 9: 1531. https://doi.org/10.3390/su9091531
Note that from the first issue of 2016, this journal uses article numbers instead of page numbers. See further details here.