Article

Exploring the Spatial Distribution of Occupations Vulnerable to Climate Change in Korea

1
Korea Environment Institute, 370 Sicheong-daero, Sejong 30147, Korea
2
School of City and Regional Planning, Georgia Institute of Technology, 245 4th Street NW, Atlanta, GA 30332, USA
3
Department of Urban Planning and Engineering, Yonsei University, 50 Yonsei-ro, Seodamun-gu, Seoul 03722, Korea
*
Author to whom correspondence should be addressed.
Sustainability 2016, 8(1), 34; https://doi.org/10.3390/su8010034
Submission received: 26 September 2015 / Revised: 16 December 2015 / Accepted: 24 December 2015 / Published: 31 December 2015

Abstract

:
This article aims to identify occupations at risk of climate change, and explore their spatial distribution by investigating their spatial concentration and cluster patterns in Korea. In order to identify professions vulnerable to climate change, we used three criteria: (1) exposure to the risks of job activities; (2) sensitivity to work environments; and (3) adaptive capacities based on the socioeconomic conditions of a person’s occupation. We identified 26 vocations as vulnerable, which corresponds to 16.5% of the total number of careers. Then, we used exploratory spatial data analysis (ESDA) techniques to examine the spatial distribution of jobs at risk of climate change effects. Endangered occupations show the extremely uneven spatial distributions across regions, indicating that there is a wide range of values for the proportion of endangered occupations across regions. The regions with high proportions of professions in jeopardy show clear spatial clustering based on the large geographic belt from the southwest to the northeast. Our results suggest that policymakers should consider the specific geographies of vulnerable occupations. The current work provides helpful hints on regional policy coordination to promote a virtuous circle of sustainable regional development.

1. Introduction

A number of studies that have measured the effects of climate change assert that socioeconomic disruption is an unavoidable consequence [1,2,3,4]. As part of the environment, climate change will not only affect human society but also the living conditions of various creatures in the ecosystem. Scientists generally anticipate that climate change will degrade human health by negatively impacting basic biological requirements such as sufficient food, clean water, and unpolluted air [1]. Scientists expect that climate change will intensify pre-existing health problems, and that this situation will aggravate unfair disadvantages in medical care and other problems facing the underprivileged, which, in turn, will have serious implications for human security [4,5,6].
Climate change is generally defined as a change in the state of the climate that can be identified by changes in the mean and/or the variability of its properties, and that persists for an extended period, typically decades or longer [7]. The United Nations Framework Convention on Climate Change (UNFCCC) defines climate change in their Article 1 as follows: “a change in climate which is attributed directly or indirectly to human activity that alters the composition of the global atmosphere and which is in addition to natural climate variability observed over comparable time periods” (p. 3) [8].
Climate change covers various topics from greenhouse gas (GHG) emissions to impact and adaptation. The Intergovernmental Panel on Climate Change (IPCC) report states that unprecedented phenomena have been investigated since 1950, all of which could be traced to human activities [7]. Responses to climate change are divided into GHG mitigation and adaptation as a solution to unavoidable climate change impact. Despite efforts to reduce GHG emissions, such emissions would continue to increase, and the definition of adaptation and risk relevant to socioeconomic sectors is emphasized [9].
If Korea maintains the current trend of GHG emissions, the global temperature is expected to increase by 5.7 °C by the end of the 21st century, and the incidence of heat waves and tropical nights is expected to increase by more than 30 times [10]. Changes associated with high temperatures are expected to cause various impacts on socioeconomic activities across regions, industries, and working environments. Issues associated with human labor and productivities along with health and economic capabilities have been discussed as the topic of climate change adaptation of vulnerable groups [11].
Studies that examine the effects of climate change on health inequality point to socioeconomic status as the main cause of differential vulnerabilities [2,3,4,12]. They address how static conditions such as low-income jobs, poverty, and a lack of education increase vulnerability to climate change. Considering that health problems are closely linked with the patterns of a person’s long-term activities, we can conclude that dynamic properties of socioeconomic performance are strongly connected to how climate change impacts an individual’s health. However, the discourse on climate-related vulnerabilities has not sufficiently considered occupation as the basis for these dynamics and people’s socioeconomic conditions [2,3].
Economic activity, which occupies much of daily life and is the foundation of people’s socioeconomic circumstances, includes work environments that involve danger, external stimuli, and regular activity patterns. These patterns and job situations are linked to the type of occupation; that is, the general classification that requires someone to carry out the same tasks repeatedly. We define a person’s occupation by dividing his or her particular daily activities into concrete tasks and duties. Individual economic activities constitute jobs. We classified jobs under an “occupation” which is a group of similar jobs. Different vocations necessitate distinct levels of knowledge, skills, education, and pay systems, and are widely used to measure socioeconomic status [6,7].
Climate change alters the work environment related to a person’s economic activities. The work environment is composed of physical circumstances such as high temperatures, noise, and vibrations, in addition to psychological conditions such as mental stress [13]. Climate change affects these work settings, which used to be seen as fixed. However, environments that directly and indirectly impact workers’ health can be fundamentally altered, leading to increased working hours, a drop in pay, weakened job security, less safety on the job, and a rise in work-related health hazards [2,14].
In order to understand the future structure of employment and how the policies of local economies are changing, it is necessary to study the effects of climate change, the kinds of careers at risk, and possible spatial inequalities. Research should be conducted on what types of occupations are in jeopardy, where those jobs concentrate, and their relationship with pre-established, underdeveloped geographic areas. Since there has not been enough related research, many details are difficult to determine such as the consequences of climate change for individual workers, what methods should be employed to measure the effects of climate change (based on the type of occupation), and what standards should be used to assess them. Given this context, this article aims to identify occupations at risk of climate change and explore their spatial distribution by investigating their spatial concentration and cluster patterns in Korea.
The remainder of this article is organized as follows. Section 2 presents a conceptual framework for measuring vulnerability in order to pinpoint careers at risk of climate change. Our criteria for vulnerability are based on the links among exposure, sensitivity, and capacity, concepts largely adopted by the IPCC. Section 3 explains the Korean Working Conditions Survey (KWCS) and the standard classification of occupations this study uses, in addition to how we identified at-risk vocations and explored their spatial distribution. Section 4 presents our results. This article closes with concluding remarks in Section 5.

2. Conceptual Framework for Identifying Occupations Vulnerable to Climate Change

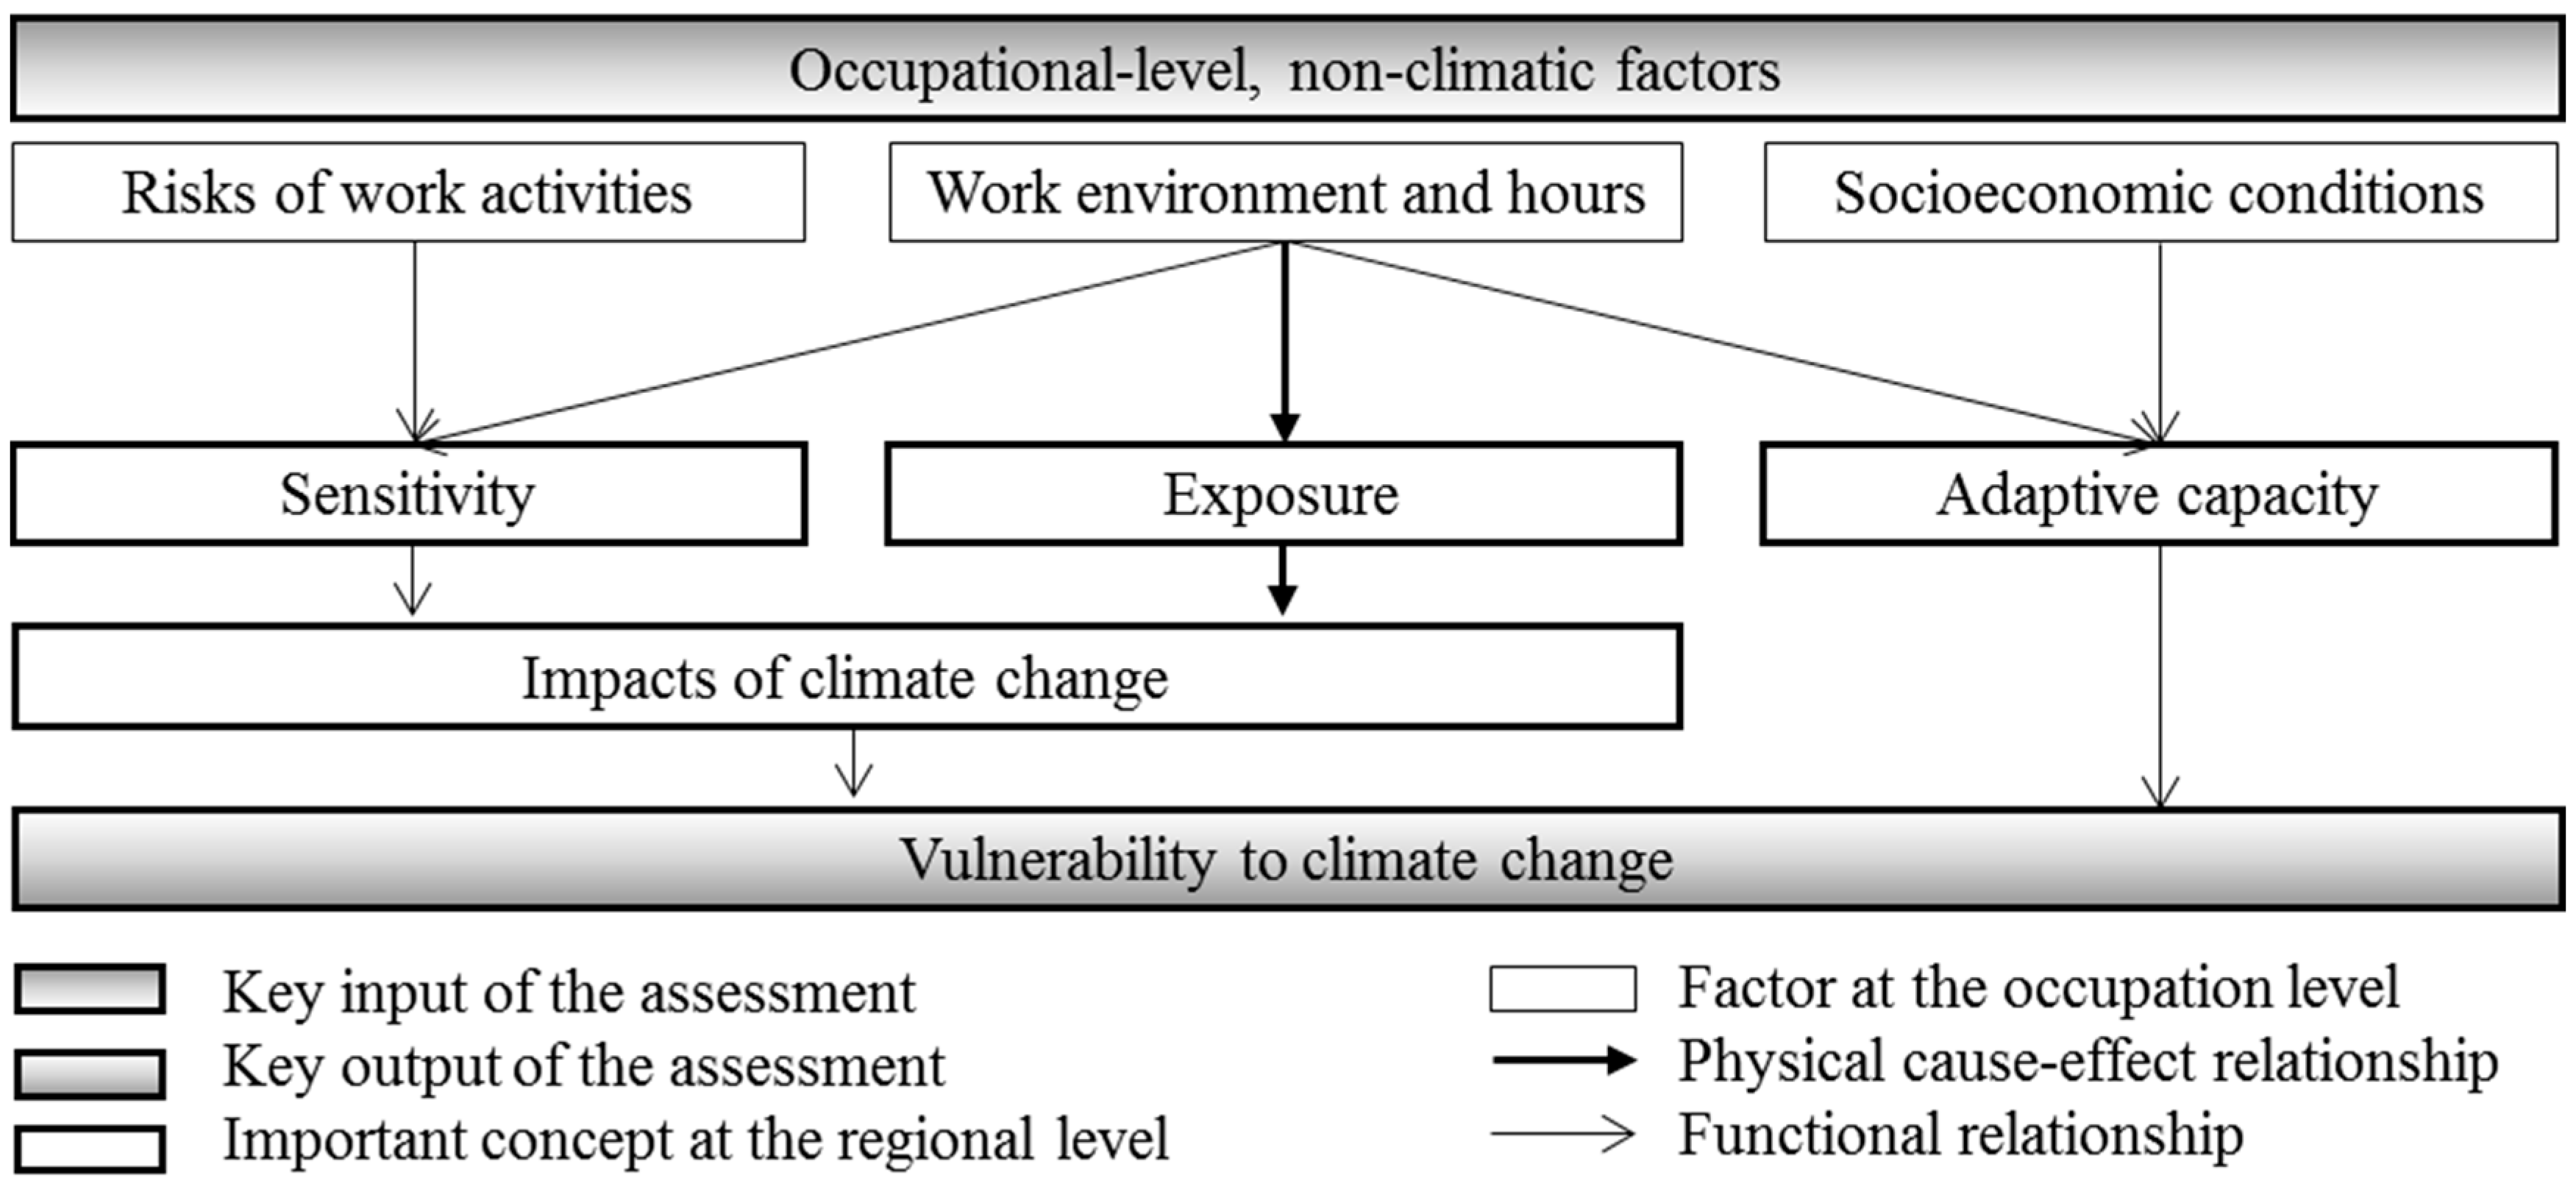
2.1. Assessing Vulnerability to Climate Change

Vulnerability is the degree of the negative impacts of climate change that influence a system or organization, and is shown by the relationship among exposure, sensitivity, and adaptive capacity in response to climate change effects [15,16,17]. In the climate change context, “exposure” is defined as the nature and degree to which a system is exposed to significant climate variations and experiences environmental stress. “Sensitivity” refers to the degree to which a system is affected, either adversely or beneficially, by climate or climate-related stimuli. “Adaptive capacity” is defined as the ability of a system to adjust to climate change in order to alleviate potential damages or accommodate environmental hazards [18].
These three components are related to various parts of society [12]. The features of society’s pre-existing socioeconomic structure have the potential to determine a particular geographic area’s vulnerability and its population. The external, environmental elements of climate change and climate variability shape a society’s or individual’s exposure, sensitivity, and adaptive capacity, insofar as they combine with non-climatic factors such as the economy, society, population, technology, and politics, which seem independent of climate on the surface. For this reason, social vulnerability is considered a contextual and systematic attribute; it is distinct from biophysical vulnerability, which emphasizes the risks of natural hazards [19].
The framework for assessing vulnerability to climate change has been developing along with biophysical and social vulnerability. This conceptual framework includes both cause-and-effect relationships of climate change’s physical consequences, and the functional links of social effects in relation to pre-established social systems [15]. Pre-existing socioeconomic components—including environmental, economic, social, demographic, technological, and political elements—affect exposure, sensitivity, and adaptive capacity.
The framework for assessing vulnerability contributes significantly to this study in terms of identifying at-risk people in relation to their economic activities, which are determined by their occupations. The attributes unique to a given occupation—such as the work environment, the knowledge needed to perform tasks, and work patterns and wages—are closely related to exposure to the risks of job activities, sensitivity to work environments, and various capacities based on the socioeconomic conditions of a person’s job. Each of these elements works differently. Employees in fields with functional relationships that predispose them to vulnerability are more susceptible to the consequences of climate change; such a situation can cause inequalities in healthcare, which relates to the effects of climate change and economic activity.

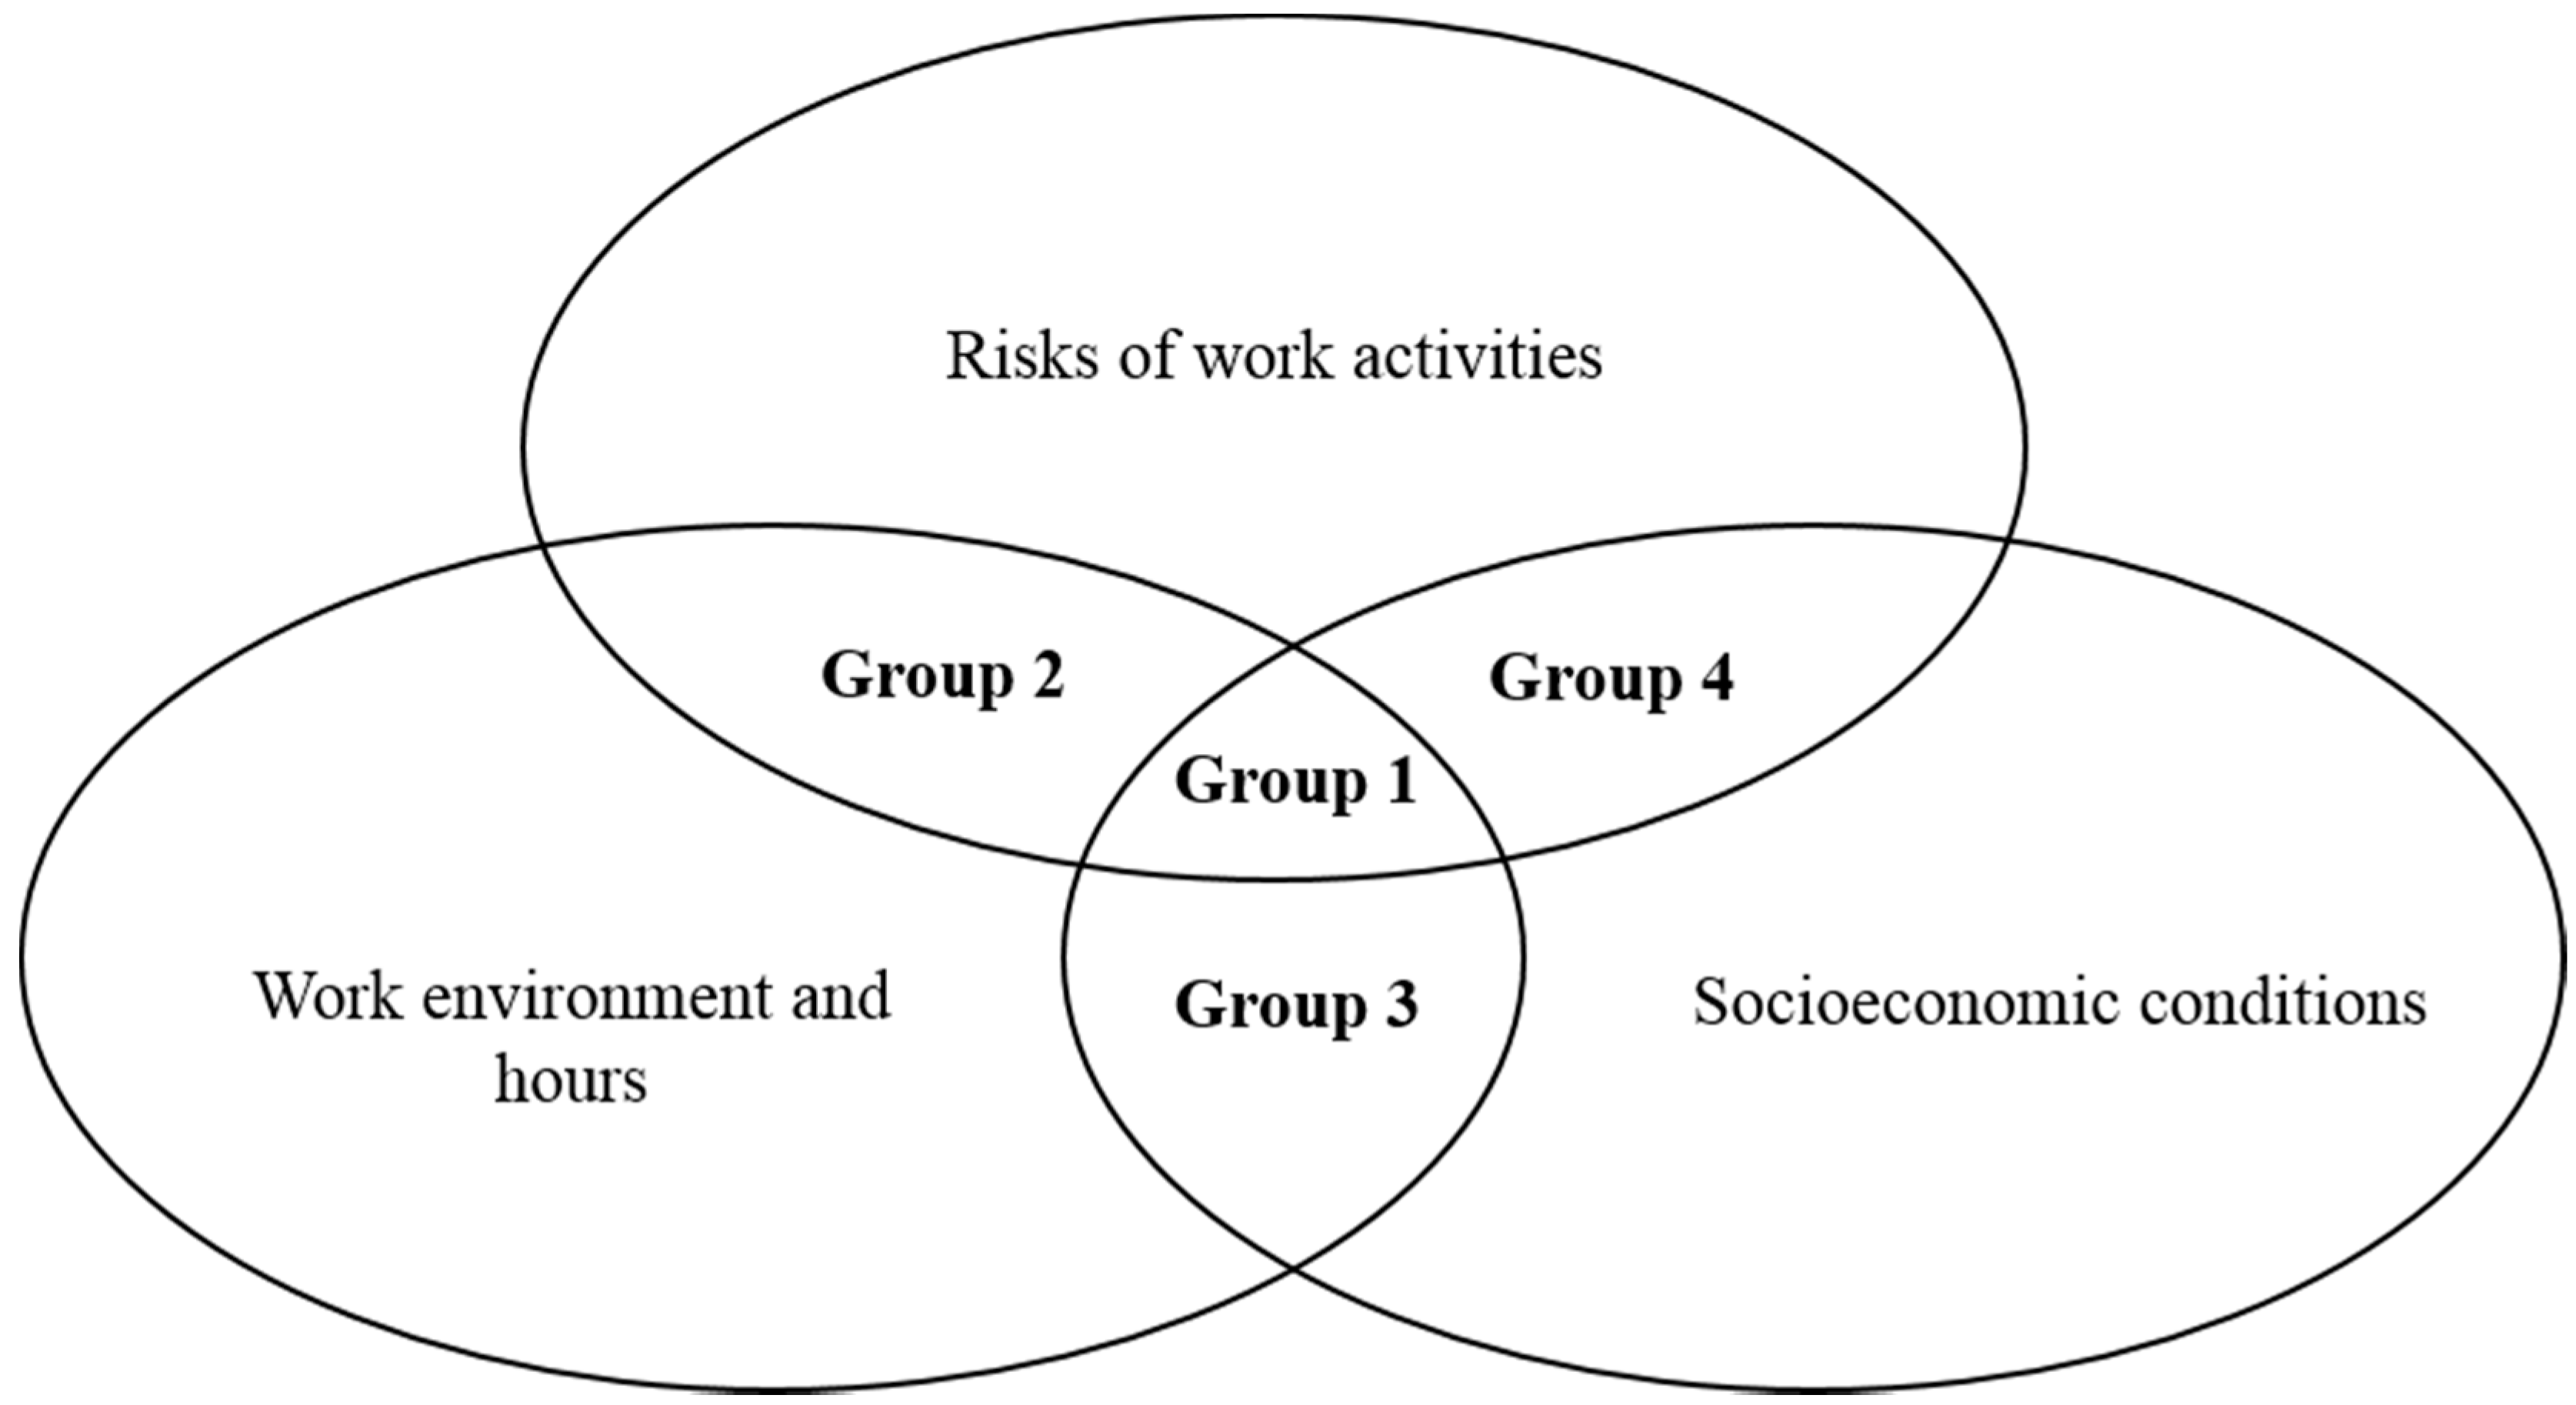
2.2. Strategies for Identifying Occupations Vulnerable to Climate Change

Workers with the same type of job are subject to similar work environments. We will now discuss socioeconomic traits, as well as the internal and external stresses regarding workers’ performance. Socioeconomic characteristics include pay, working hours, and health conditions, all of which are influenced by a person’s expertise and educational background. Within the framework of assessing vulnerability, we can discuss the work environments of certain jobs in the context of vulnerable occupations. Within the framework of assessing vulnerability by Füssel and Klein [14], we can discuss the work environment of certain jobs in the context of vulnerable occupations. As shown in Figure 1, the environment forms according to exposure, sensitivity, and capacity.
Figure 1. Relationship between the characteristics of occupation types and the vulnerability of workers’ health and safety; Note: This framework uses the legend to the conceptual framework diagrams and conceptual framework for a second-generation vulnerability assessment of Füssel and Klein [14].
Sustainability 08 00034 g001
The risks of work activities relate to sensitivity to climate change effects; these risks can exacerbate vulnerability to exposure. Schulte and Chun [3] stated that the impacts of climate change expand and intensify the pre-existing risks involved in performing tasks for certain vocations. Workers in specific professions that require exposure to high temperatures, as well as associated physical and biochemical risks, are susceptible to environmental shifts. These changes include increased average temperatures, toxic chemical substances, ultraviolet radiation, abnormal weather conditions, and the prevalence of disease carriers, all of which can be caused by climate change. Accordingly, workers’ health and safety are likely jeopardized [3].
A person’s work environment and hours are generally linked to exposure to the harmful effects of climate change, and are partly related to sensitivity and capacity. Outdoor and unstable work settings are the main elements that increase exposure to the impacts of climate change; they are uncontrollable, external changes [1]. Due to the characteristics of the required tasks, vulnerability rises for workers whose environment cannot be easily controlled. Irregular hours make it difficult to estimate exposure, and excessive hours raise the likelihood of being subject to external risks. This situation can lead to employees being exhausted and their immune systems deteriorating, which, in turn, can decrease their physical capacity to cope with the aforementioned health and safety risks [20].
Socioeconomic circumstances such as pay, safety, knowledge, and skill level are closely related to adaptive capacity, and are important in assessing the ability to cope with climate change effects [21]. Pay level can determine economic capacity. Job security can prevent stress when becoming unemployed and getting a new job. Knowledge and skill level are relevant because they enable workers to gain information about the effects of climate change, and can strengthen their voluntary adaptation.
We used three measurements to classify vulnerable occupations: (1) exposure to the risks of job activities; (2) sensitivity to work environments; and (3) various capacities based on the socioeconomic conditions of a person’s job. Figure 2 illustrates these measurements and divides the types of occupations into four groups. Group 1 has high levels of exposure and sensitivity, and a low level of capacity. People in this group face frequent exposure to the effects of climate change due to unstable, outdoor work environments, as well as strenuous working hours. Their activities are relatively high-risk, and their socioeconomic status is low and precarious. This group can be classified as having a vulnerable occupation in a narrow sense.
Figure 2. Four occupational groups vulnerable to climate change.
Sustainability 08 00034 g002
Group 2 is exposed to outdoor risks caused by climate change, and negative elements are also found in the workplace. People in this group have economic power, and can voluntarily cope with and adapt to the effects of climate change. However, it is highly likely that their health will be at risk. As such, this group should be categorized as eligible for systematic help, as should Group 1. For a long-term plan to reduce these groups’ vulnerability, it is necessary to improve and revise their work standards and environments.
Group 3 works long hours and has an adverse job setting; their socioeconomic conditions are poor. This group is not likely to be directly exposed to danger while working. However, since, like Group 1, they face a small increase in indirect risks while working, they also require systematic care. It is necessary to administer and improve this group’s work environment and enhance its socioeconomic conditions, such as employment stability.
Group 4 faces risks in terms of work and poor socioeconomic capacity. They can be included in Group 1 if employers’ internal situations or an economic crisis alters their socioeconomic circumstances, such as working hours or environment. Prolonged exposure to work-related risks can cause shortened working hours and thus a decrease in pay. Employees may need to change jobs due to reduced physical capacity. From a socioeconomic angle, this group displays a high risk of vulnerability. In order to reduce its vulnerability, their work standards, environments, and socioeconomic circumstances need to be improved.

3. Data and Methods

This study consisted of two stages. The first involved classifying types of occupations vulnerable to climate change, and the second entailed assessing their spatial concentration and disparity in the context of geographical space. In categorizing at-risk vocations, we used the third edition of the KWCS, which surveyed individual workers’ exposure, sensitivity, and capacity. The KWCS provides comprehensive information on working modes, job types, degrees of exposure to risks at work, and employment conditions, in addition to different kinds of occupations and businesses. The third version of the KWCS surveyed employees 16 and older using the pen-and-paper interviewing (PAPI) method. Based on the Population and Housing Census, the KWCS selected samples via the probability proportional to size (PPS) technique, which involved two stages of stratification. The total number of employees 16 and older was 50,032.
To classify vulnerable professions, we used the sixth edition of the Korean Standard Classification of Occupations (KSCO) from Korea’s National Statistical Office. Based on the International Labour Organization (ILO) and the International Standard Classification of Occupations (ISCO), KSCO’s system is comprised of 10 categories, 52 divisions, 149 sections, and 426 sub-sections. The third edition of KWCS contains information on the sub-sections, but we chose the 149 sections instead, as these were more suitable for representing the attributes of the various vocations.
After classifying at-risk careers, we assessed their spatial concentration and disparity based on data from the 2010 Population and Housing Census, conducted by the National Statistical Office. The Population and Housing Census provided information on the job types in the 149 sections on a national scale, which is useful for discerning the relative degree of spatial concentration of jobs in jeopardy. In gauging spatial concentration and disparity, we used si, gun, and gu as spatial units of analysis, which are basic administrative units in Korea. Table 1 presents the variables for organizing vulnerable professions based on the survey items in the KWCS. We applied the same weight to the three measurements (i.e., exposure, sensitivity, and adaptive capacity) to gain the final values for vulnerable occupations.
Table 1. Variables for assessing types of occupations vulnerable to climate change.
CategoriesVariablesOperational Definitions
Work environment and hours(1) Instability in the workplacePercentage of workers who travel for work or engage in outdoor work
(2) Irregularity of daily tasksPercentage of workers who have irregular hours or unfixed times to start and end work every week
(3) Excessive working hoursPercentage of workers who work more than 52 h per week
Risks of work activities(4) Musculoskeletal risk factorsStandardized value of principal component analysis to percentage of workers who spend more than 25% of their working hours in each of the risks as vibrations, tiring position, lifting people, carrying heavy loads, standing, and repetitive movement
(5) Biochemical risk factorsStandardized value of principal component analysis to percentage of workers who spend more than 25% of their working hours in each of the risks as dust, vapors, chemicals, and infectious materials
(6) Exposure to high temperaturesPercentage of workers who spend more than 25% of their working hours in high temperatures
Socioeconomic conditions(7) Pay levels for different jobsAverage pay level for types of occupations (monthly, USD)
(8) Employment stabilityPercentage of full-time regular employees in each occupation type
(9) Levels of knowledge and skillsAverage number of years of education for each occupation type
We used exploratory spatial data analysis (ESDA) to examine the spatial concentration and disparity of the classified types of at-risk jobs. To identify local spatial clusters, we used a local indicator of spatial association (LISA). For each geographic area i , the local Moran’s I i statistic can be defined as follows:
I i = z i j w i j z j
where z i and z j are deviations from the mean for the corresponding x values, or
z i = x i x ¯ s
where s is the standard deviation of the variable x [22,23]. A positive value for I i indicates spatial clustering of similar values, whereas a negative value means spatial clustering of dissimilar values between a geographic area and its vicinity.
The local Moran’s I i statistic can be visualized in the form of a LISA cluster map, which depicts the locations of significant local Moran’s I i statistics, classified by type of spatial association. The four kinds of local spatial association between a geographic area and its neighbors are: (i) HH: high-high association (high values surrounded by high values); (ii) LH: low-high association (low values surrounded by high values); (iii) LL: low-low association (low values surrounded by low values); (iv) HL: high-low association (high values surrounded by low values). We used the LISA cluster map to examine the spatial clustering formed by each type of vulnerable job. Then, we explored the traits of the areas where at-risk professions are concentrated in comparison with other parts of the country. To do so, we looked into the distribution of financial independence, which can show the characteristics of underdeveloped areas.

4. Findings

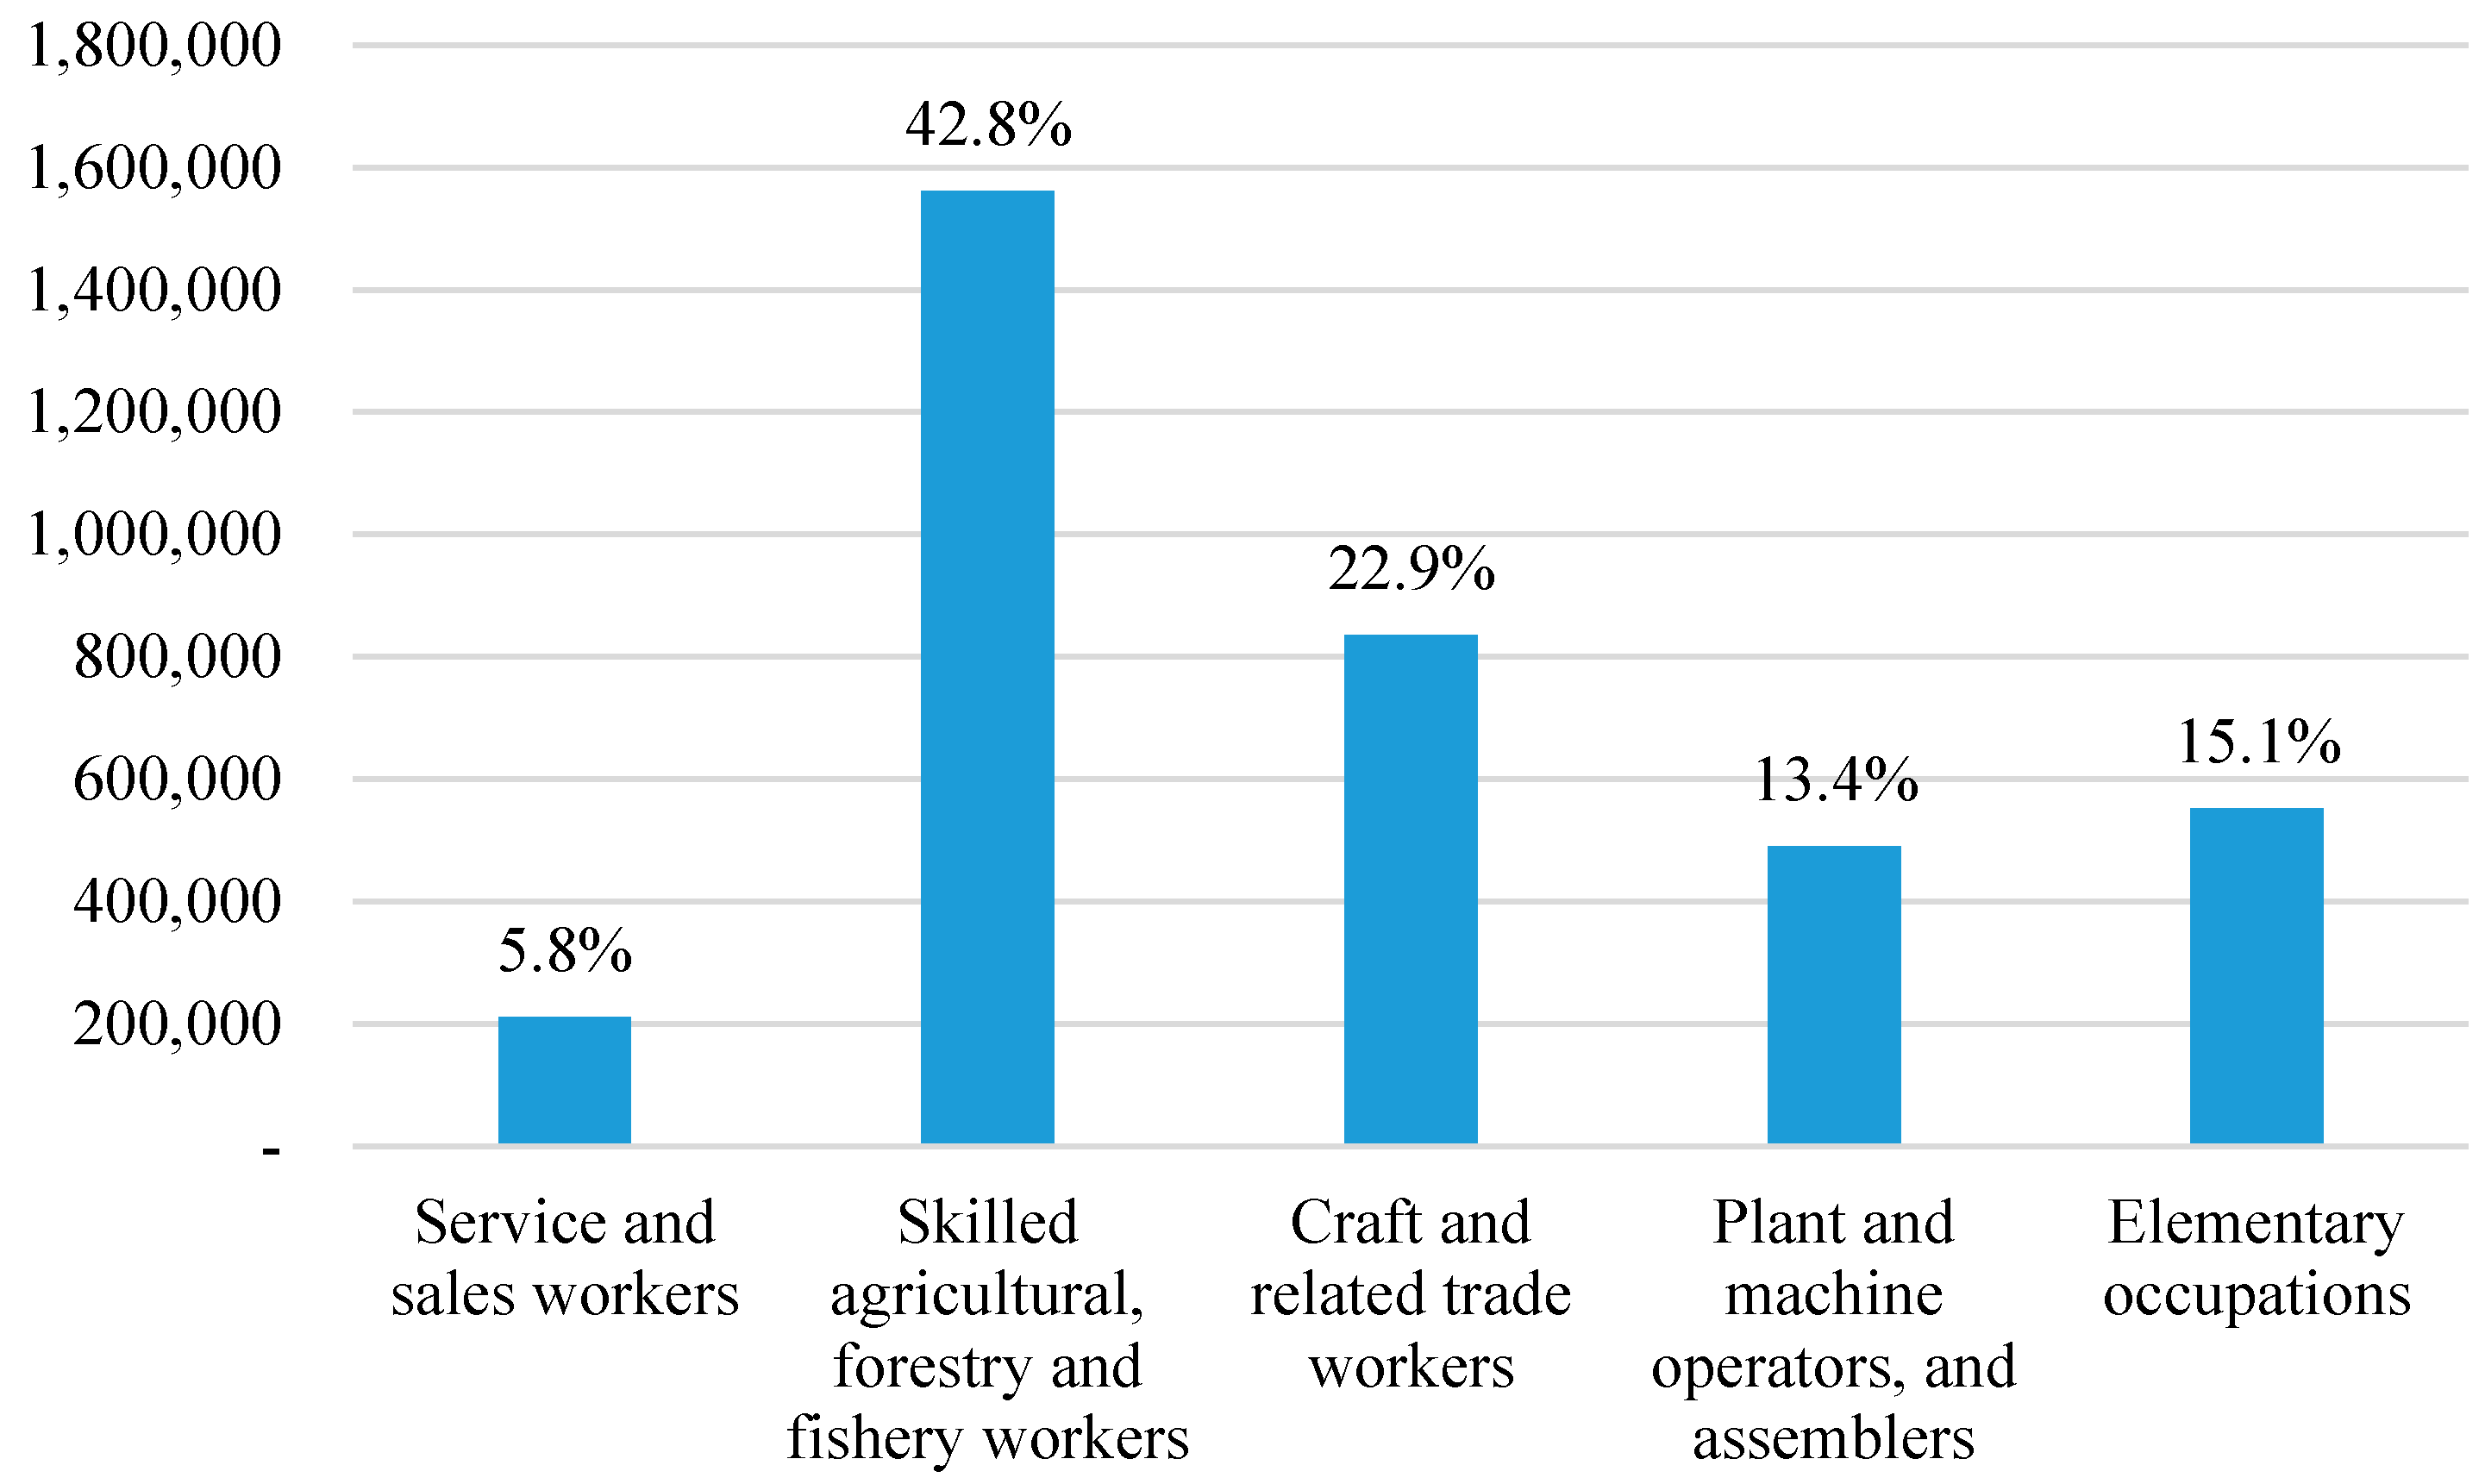
4.1. Occupations Vulnerable to the Effects of Climate Change

The types of jobs endangered by climate change are mostly found among employees in sales and the service industry; skilled agricultural, forestry, and fishery workers; crafts and related trade workers; plant and machine operators and assemblers; and elementary occupations. As seen in Figure 3, 42.8% of workers in vulnerable vocations are in the occupational group of skilled agricultural, forestry, and fishery workers. Table 2 shows the careers at risk of climate change, which we derived by analyzing the factors used to classify at-risk jobs and assess their vulnerability. In total, there are 26 occupations in jeopardy owing to climate change, including the at-risk jobs in Group 1, and the potentially vulnerable professions in the other three groups. Overall, Group 1 showed six endangered occupations, while the other three groups revealed 20 potentially jeopardized jobs.
Figure 3. The number of workers in occupations vulnerable to climate change.
Sustainability 08 00034 g003
Group 1 is in the bottom 25% of every aspect including work environment, hours, risks of job activities, and working conditions. Workers in Group 1 often perform irregular kinds of work in hot, outdoor environments such as greenhouses, mines, construction sites, and farm fields. Their tasks are physically demanding and thus carry elements of risk, including damaging their musculoskeletal systems and exposure to high temperatures. Many of these jobs are temporary; thus, the levels of employment stability and pay are low. We expect that workers cannot prepare for their health and safety in advance, and are unable to properly respond to the circumstances. These occupations are considered vulnerable since the workers in these jobs are more likely to directly experience the negative impacts of climate change with respect to their health and safety, and are unable to manage their work environment voluntarily. The total number of employees in Group 1 was 2,150,737 in 2010, comprising 9.7% of all workers at the time.
Table 2. Results of assessment of the vulnerability of health and safety with respect to climate change.
OccupationsWork Environment and HoursRisks of Work ActivitiesSocioeconomic ConditionsGroup
(1)(2)(3)PR(4)(5)(6)PR(7)(8)(9)PR
Crop growers0.960.960.280.681.15−0.050.5216.336920.018.466.801
Horticultural and landscape workers0.640.550.2412.241.07−0.110.4819.7313840.2511.9312.241
Construction/structure-related workers0.450.450.3320.411.541.060.586.8017300.2512.219.731
Construction-related technical workers0.680.630.383.401.671.010.548.1617300.5011.566.121
Building/finishing-related technical workers0.660.620.422.721.221.760.4012.2417300.3011.9113.611
Construction and mining-related unskilled laborers0.760.650.226.121.530.740.5410.8812110.8610.780.681
Livestock industry and stockbreeding-related workers0.860.820.5601.16−0.230.4620.4117300.0311.2129.932
Wood and furniture, musical instrument and signboard-related trade workers0.360.390.4818.371.471.550.3911.5619030.1012.8743.542
Machinery equipment fitters and mechanics0.370.450.3921.770.920.810.3518.3719890.0512.9051.022
Plumbers0.580.550.494.081.411.210.4810.2019030.2012.4026.532
Laundry-related machine operators0.100.430.888.840.931.060.2721.7714700.0211.6329.252
Construction and mining machine operators0.840.620.302.040.750.530.4617.6923780.1712.6442.862
Ship deck workers and related workers0.500.500.2517.691.020.680.755.4428110.2511.1328.572
Hairdressing, wedding and medical assistance service workers0.370.820.316.80−1.52−0.860.0395.248650.0310.3611.563
Leisure services and sports-related workers0.060.440.6124.49−0.51−0.580.1363.9514700.2212.9822.453
Forestry-related workers0.860.450.0516.331.19−0.500.4525.8514270.3211.279.523
Fishery-related workers0.830.960.381.361.43−0.500.3332.6510380.129.157.483
Garment-related workers0.040.550.5917.010.39−0.190.1246.9410380.0210.9618.373
Delivery workers0.630.370.558.160.32−0.380.2442.1812970.2812.6312.933
Agriculture, forestry and fishing-related unskilled workers0.770.680.194.760.87−0.470.4331.976310.877.8803
Food processing-related machine operators0.050.420.5928.571.46−0.030.3324.4912970.0711.1720.414
Beverage processing machine operators0.100.400.4044.221.152.440.503.4015130.3013.1017.014
Textile manufacturing and processing machine operators0.040.340.6038.781.301.440.479.5217300.2311.9319.054
Textile and shoe-related machine operators and assemblers0.060.250.5446.261.392.020.408.8415570.2912.5114.974
Chemical, rubber and plastic production machine operators0.060.270.4361.221.282.210.474.0816430.2212.6723.134
Wood and paper-related operators0.050.280.5051.701.592.530.560.6815570.2212.8623.814
Note 1: (1) Instability in the workplace, (2) Irregularity of daily tasks; (3) Excessive working hours; (4) Musculoskeletal risk factors; (5) Biochemical risk factors; (6) Exposure to high temperatures, (7) Pay levels of different job; (8) Employment stability; (9) Levels of knowledge and skills; Note 2: PR value is percentile rank, which is the sum of the standardized value of each variable. This means each variable represents the number of lower percentage; Note 3: Group 1 is in case of work environment and hours, risks from work activities, and socioeconomic conditions are below 25%. Group 2 is in case of work environment and hours, risks from work activities are below 25%; Group 3 is in case of work environment and hours, socioeconomic conditions are below 25%; Group 4 is in case of risks from work activities, socioeconomic conditions are below 25%.
In Group 2, seven occupations belong in the bottom 25% with respect to working hours and environment, in addition to risks from work activities. Considering that these occupations have higher levels of pay, job security, knowledge, and skills than those in Group 1, they have a basic adaptive capacity. However, similarly to Group 1, these employees work in unsafe settings (e.g., being exposed to high temperatures), and are thus highly likely to experience the negative effects of climate change in terms of health and safety. Therefore, basic preparations regarding exposure and safety are necessary. The total number of workers in Group 2 was 483,578, constituting 2.2% of all employees.
In Group 3, seven types of occupations belong in the bottom 25% with respect to work environment, hours, and conditions. The occupations in Group 3 include those that previous studies predicted to be heavily influenced by climate change such as emergency rescue work, leisure tours, agriculture, forestry, fishing industries, and delivery services. These vocations entail unsafe work environments and irregular conditions, and are thus vulnerable to the potential risks of climate change. However, compared to the workers in Group 1, we expect those in Group 3 to face a lower risk of directly experiencing fatalities related to climate change, as they do not have many chances of being exposed to its effects on the job. As the impacts of climate change grow and exposure to its effects continues, we need to prepare for health and safety risks. Overall, Group 3 had 648,208 workers, comprising 2.9% of all employees.
In Group 4, six occupations belong in the bottom 25% with respect to risks from work activities and conditions. The occupations in Group 4 involve operating and assembling equipment and machines; thus, the workers in these occupations carry out physically demanding tasks, and are highly likely to be exposed to toxic chemicals while processing textiles, rubber, and wood. The employees in this group perform high-risk tasks in general, but have a low probability of being directly exposed to the impacts of climate change. Nonetheless, if climate change negatively influences their work environments for a long period of time, it is quite possible that their health and safety will deteriorate. Accordingly, for these occupations we must improve the work environment, reinforce job standards, and train employees to control and reduce their risk factors in general. Group 4 had 367,684 workers, constituting 1.7% of all employees.

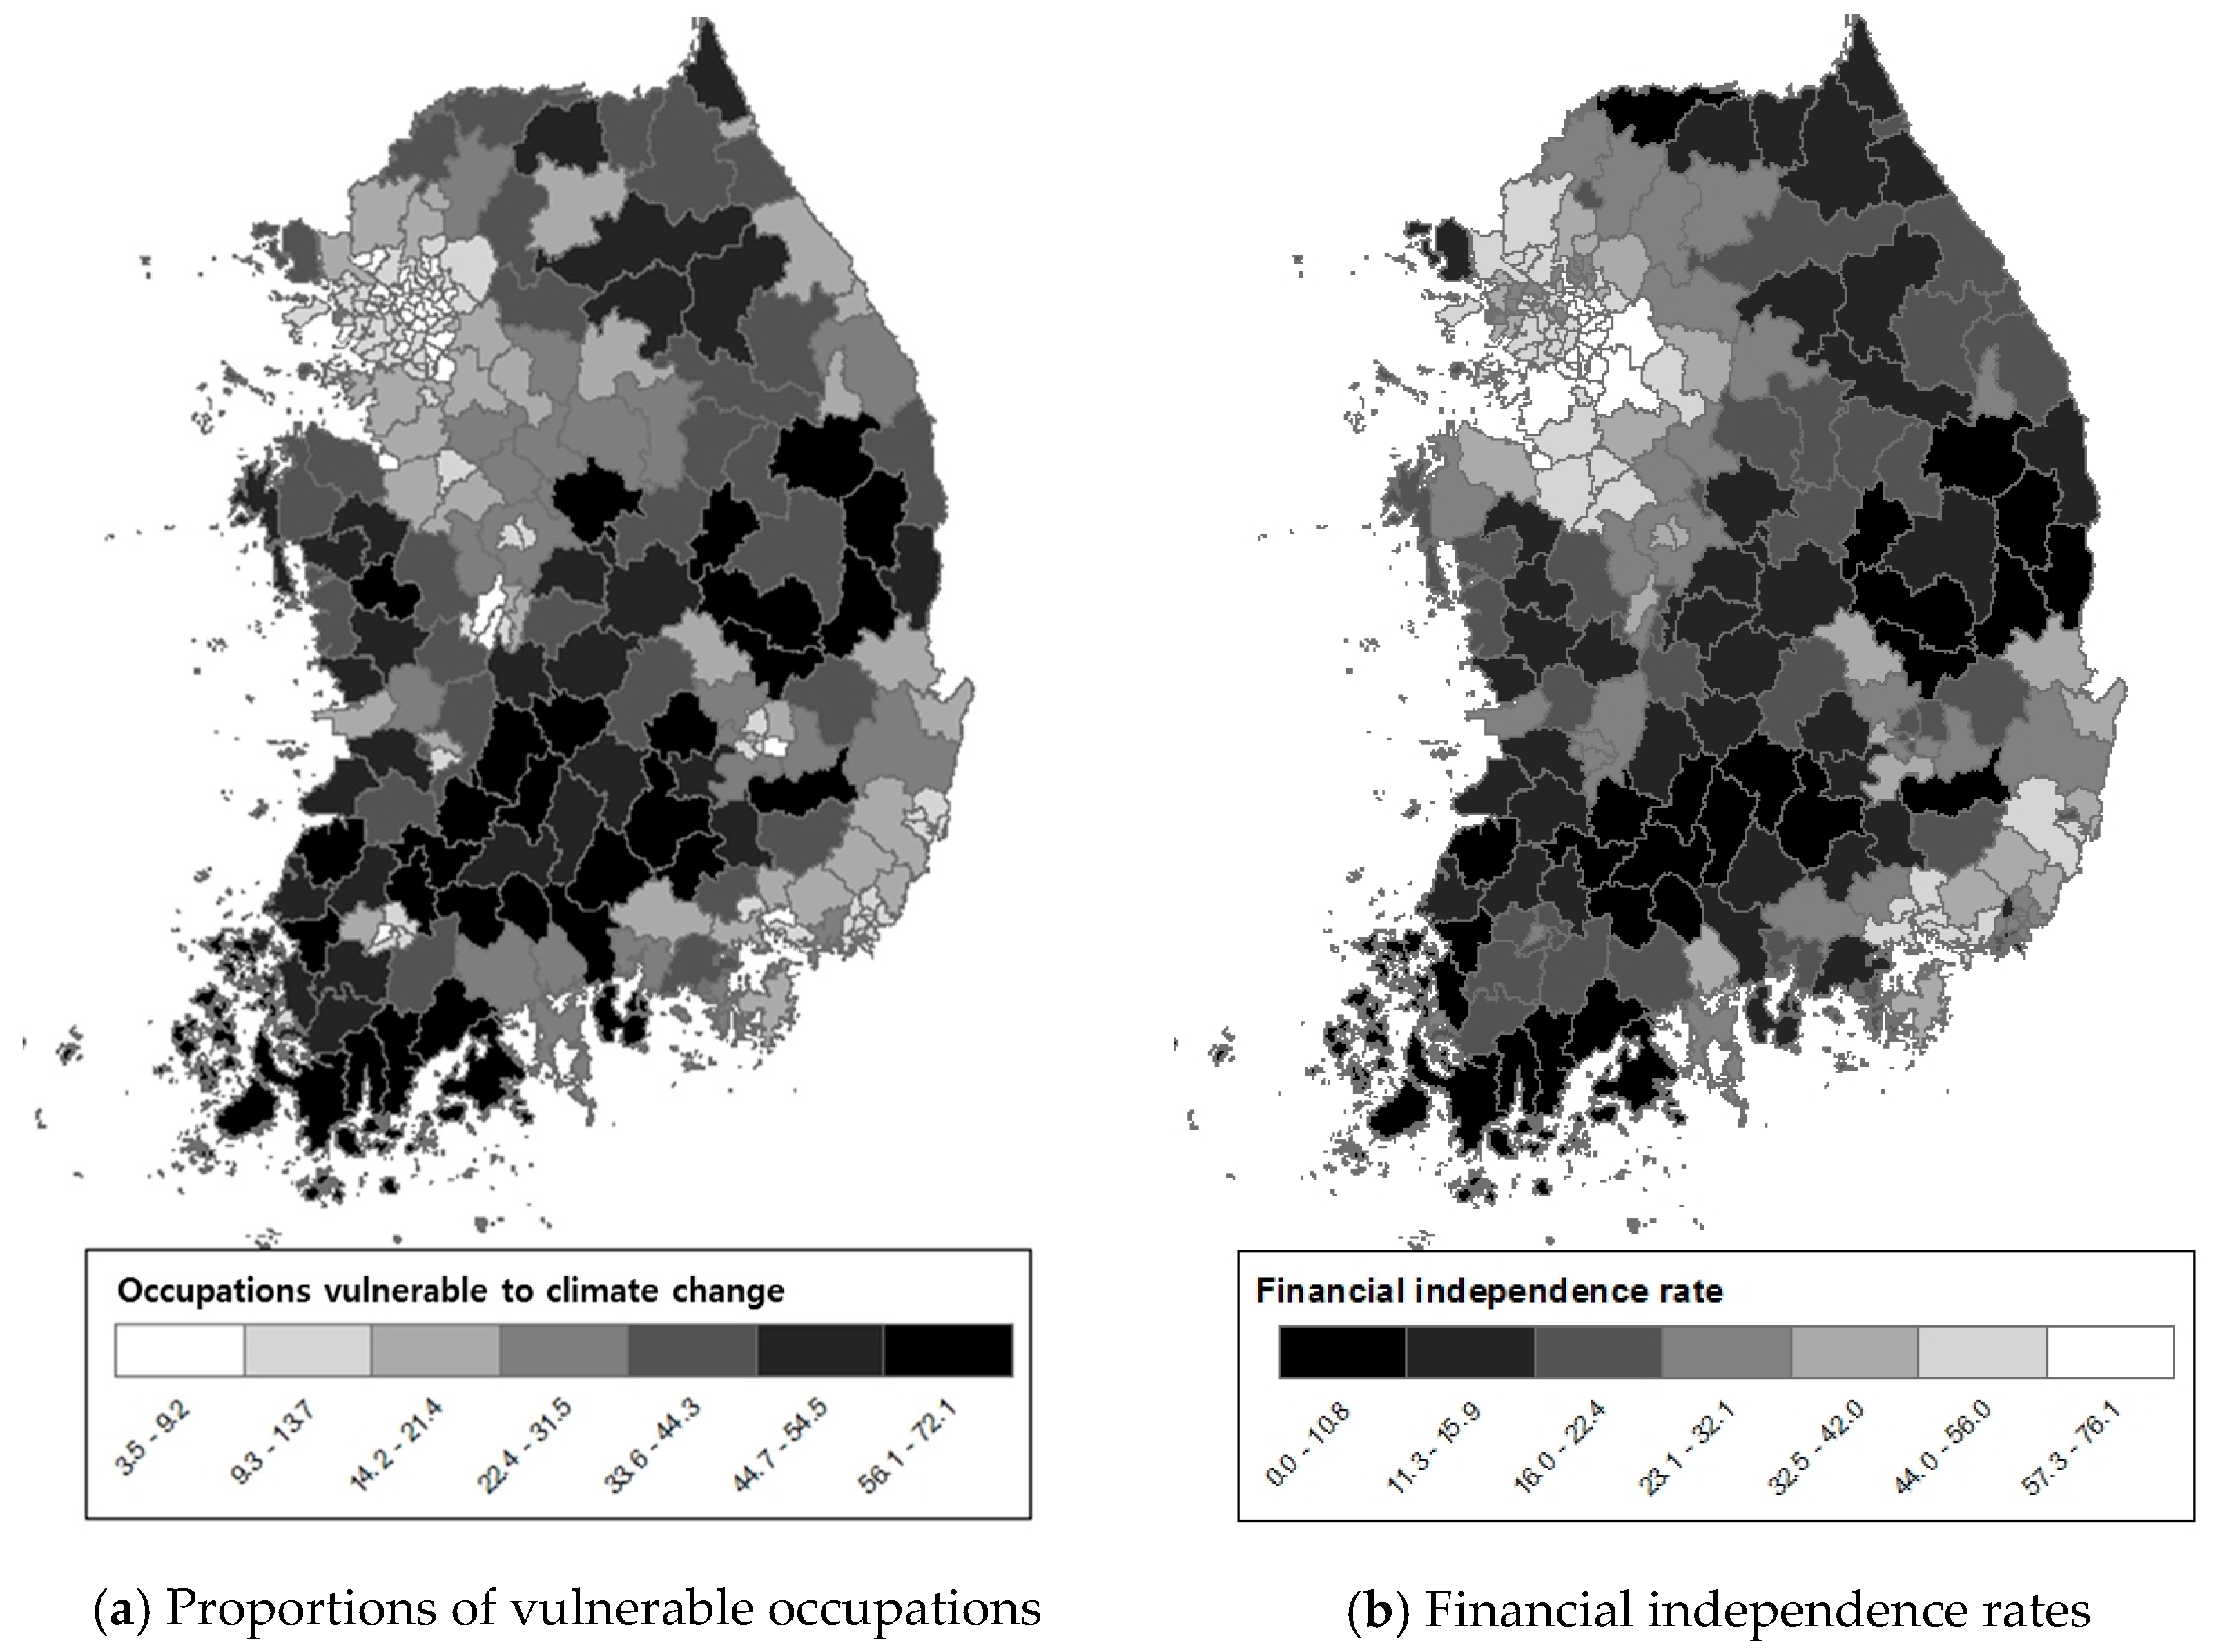
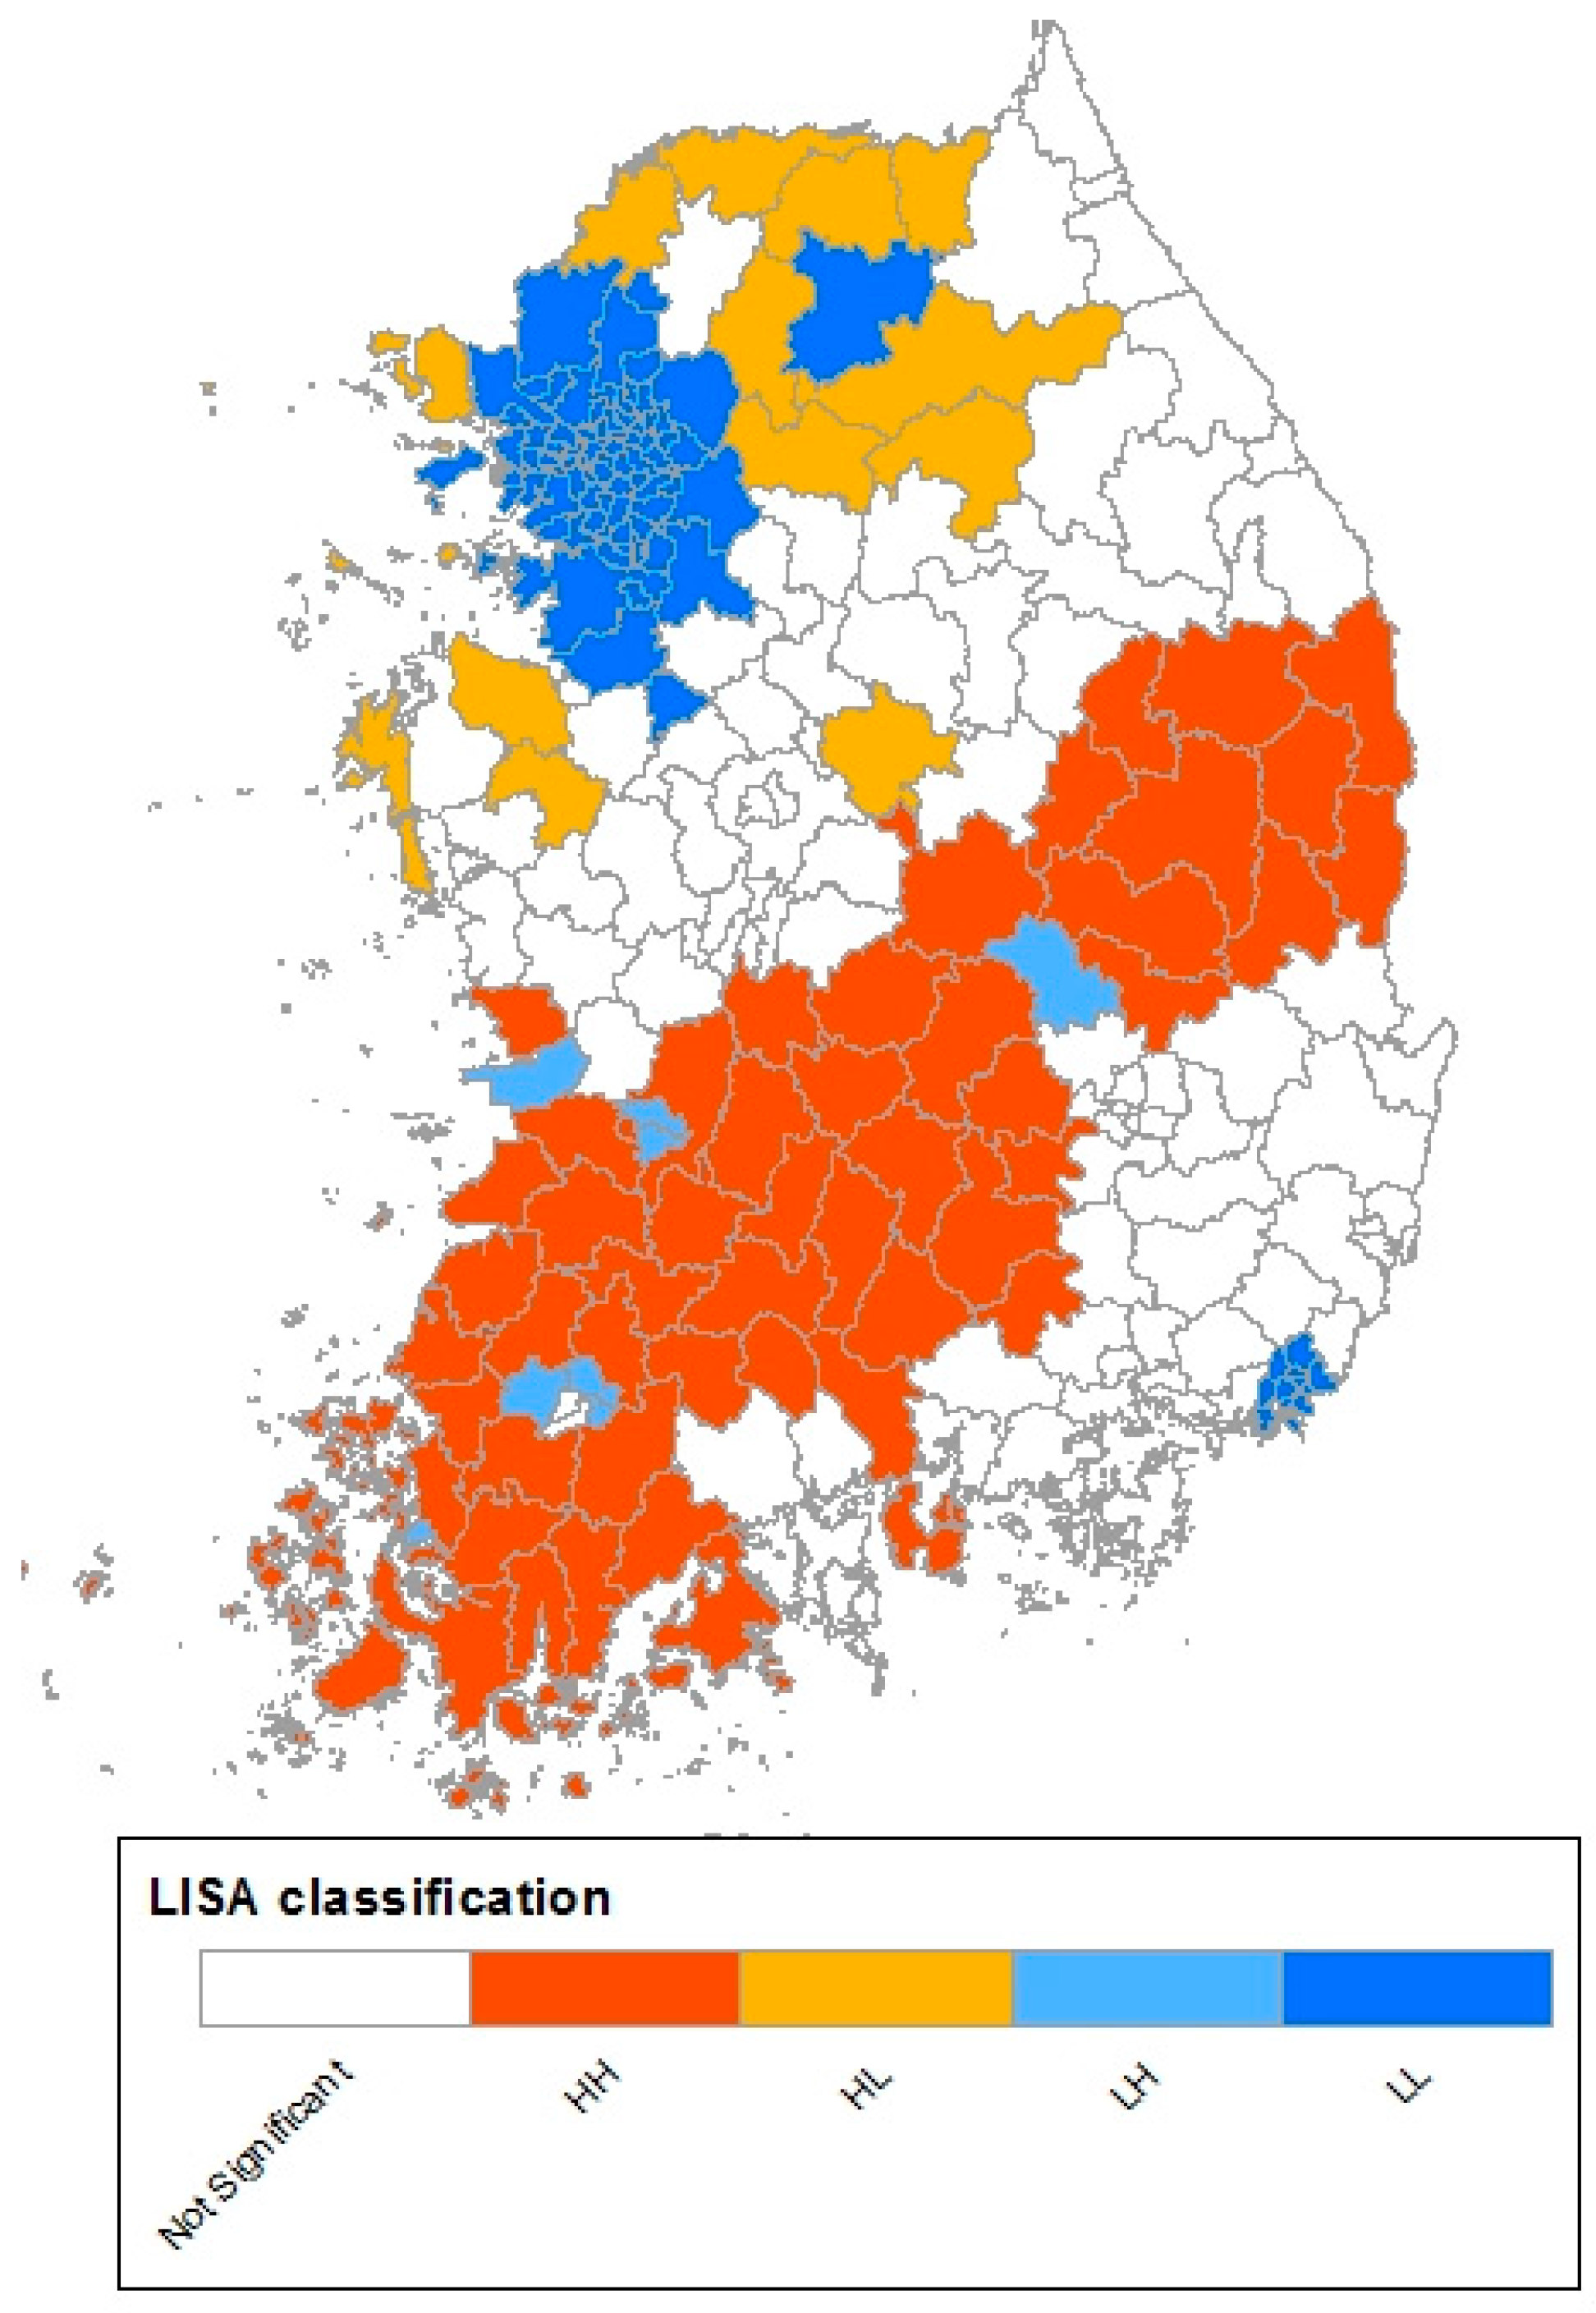
4.2. The Spatial Distribution of Vulnerable Occupations

By examining the proportion of vulnerable jobs in each geographical area, we can examine their spatial concentration and cluster patterns. Understanding their spatial distribution is important for regional planning and development strategies. This can help identify the direction of regional policies to stimulate recovery from the effects of climate change and ensure that a region will grow sustainably. If the pre-existing social structure of occupations is based on job types at risk of climate change, decision-makers can use this knowledge to determine the policies needed to prevent damages.
Figure 4 displays the spatial distribution of at-risk professions. There are several different classification methods for organizing data when doing thematic mapping: equal interval, natural breaks, quantile, equal area, and standard deviation. To emphasize the difference in relative position between features, we use the quantile classification method, which classifies data into a certain number of categories with an equal number of features in each category. Endangered occupations show the extremely uneven spatial distributions across regions, indicating that there is a wide range of values for the proportion of endangered occupations across regions. Based on the categories of jeopardized jobs, areas that mainly rely on primary industry have especially high percentages of vulnerable occupations. These areas form a large belt spanning the midwest (Chungcheongnam-do), southwest (Jeollanam-do), mideast (Gyeongsangbuk-do), and northeast (Gangwon-do). Figure 4 also shows the average of local, self-governing bodies’ financial independence over five years (2010–2014). A high, negative correlation (ρ = −0.724) appears between the proportions of vulnerable jobs and the levels of financial independence. This indicates that regions with poor financial and economic capacities show relatively high numbers of at-risk careers.
The spatial concentrations of at-risk occupations display clear patterns of spatial inequalities. We used LISA to examine the local spatial autocorrelation of vulnerable jobs. As shown in Figure 5, the regions with high proportions of at-risk professions show clear spatial clustering based on the large belt from the southwest to the northeast. Higher-order service industries occupy the central parts of the capital and large megalopolitan areas; these zones show spatial organization with a small number of vulnerable vocations. On the other hand, at-risk jobs cluster in small and medium-sized cities, as well as in places where changes in industrial structure are slow. The LL LISA cluster in the capital and southern regions support this claim.
Figure 4. Spatial distributions of the proportions of vulnerable occupations and financial independence rates.
Sustainability 08 00034 g004
Figure 5. LISA cluster map for the proportion of occupations vulnerable to climate change.
Sustainability 08 00034 g005
The uneven spatial distribution of vulnerable occupations is linked with past national and regional development policies driven by the central government. During the country’s rapid growth from the 1960s–1980s, Korea industrialized its capital and southeast regions based on the central government’s developmental strategies. Accordingly, the government carried out a growth center policy of specializing regional industries; this was naturally followed by spatially concentrating certain jobs. Industrial infrastructures, which the government pursued as part of its development plans, gradually converged in selected regions. This led to unequal economic growth and an unbalanced distribution of jobs throughout different zones. Today, this phenomenon of the past still causes growth disparities, wage gaps, and disparate employment problems across regions.
The uneven spatial distribution of vulnerable professions is also closely linked with the hierarchical, spatial organization of cities. Generally, workers of higher-order services and knowledge-based industries tend to flock together in upper-level cities; as centers of the regions, these metropolitan areas often specialize in assisting headquarter businesses [24]. Large metropolitan areas have high percentages of careers that involve cognitive and relational activities, and therefore diverse occupations [25]. However, small and medium-sized cities remain at the level of primary or secondary industries. Since large metropolitan areas no longer engage in traditional manufacturing industries, small and medium-sized cities tend to generate manufacturing jobs.

5. Discussion

Climate change can cause harm while also presenting new opportunities. In the course of transforming production modes via new energy sources, possibilities for new jobs and business opportunities emerge [26,27]. However, regarding workers’ health and safety, climate change can cause harm, rather than create opportunities [1]. Direct exposure to heat and ultraviolet radiation will increase related diseases; indirectly, the toxicity of air pollution, immune-mediated diseases, and work-related accidents are expected to rise. Unlike private spaces, workplaces hardly allow people to modify their environment and job responsibilities. Continuous repetition of similar activities for an extended period leads to the accumulation of negative effects on health and safety, or causes regular exposure to certain risks. Above all, workers’ health, safety, and productivity interact with socioeconomic consequences at all societal levels, including family, community, region, and nation; therefore, these elements require special strategic attention [1].
The consequences of climate change intensify the vulnerability of workers who are socially and economically at-risk in the first place. In connection with pre-existing, job-related risks and environments, employees in jeopardy can simultaneously face deterioration in the workplace, as well as a lack of job security and temporary employment. As pointed out by Olsen [28], climate change may result in both the disappearance and transformation of “old jobs” There will be a shift in the location of jobs between sectors and the creation of new jobs to address climate change. Many of these new jobs can be so-called 3D (dirty, dangerous, and difficulty) jobs, which may become subsidiary to traditionally stable and skilled employment. Thus, it is highly possible that climate change will exacerbate pre-existing inequality in terms of income and workers’ health. Thus, it is highly possible that climate change will exacerbate pre-existing inequality in terms of income and workers’ health.
Scientists, scholars, and organizations are currently discussing this kind of strategic intervention; it is gradually gaining attention and is supported by some international groups. The International Organization for Standardization (ISO) offers recommendations regarding the quality of air and water, exhaust fumes, and environmental control schemes. The ILO works on projects related to adaptive capacities for climate change in the workplace, such as employment standards and conditions, social safety networks, and an increase in skilled workers [1,29]. However, from the perspective of workers, the issues of employment, health, safety, and vulnerability have just begun to be discussed.
The central or local governments’ policies and interventions for accommodating climate change focus on industries rather than individual workers, and groups of people who are generally and conventionally at-risk, rather than regular workers. Policymakers should more actively consider adapting to climate change and introducing new policies in terms of employment strategies, developing workers’ capacity, as well as improving workplace standards and policies for equal employment. They should especially make predictions on climate-related losses and safety issues for workers, provide information, education, and training, increase the number of skilled workers, and ensure stable employment.
This research used a conceptual framework of climate change vulnerability to shed light on the types of vulnerable occupations and find areas where vulnerable occupations are highly located. Specific non-climate factor, consists of work environment and hours, risks from work activities, and socioeconomic conditions, is used to illuminate the types of vulnerable occupations. As a result, a total of 26 climate change vulnerable occupations are classified. Six occupations correspond to all the categories; 20 occupations correspond to two categories. The ratio of labor in six vulnerable occupations is 9.7% of the total labor. Labor in 20 occupations as potential vulnerable occupations is 6.8% of the total labor. Depending on the region, the range of vulnerable occupations differs from 3.5% to 72.5%. The region with highly vulnerable occupations is a relatively underdeveloped region of Korea, and this means labor industries with high vulnerable occupations are located in financially and economically underdeveloped areas. This relation between vulnerable occupations and underdeveloped area signifies possibilities of fixation to backward regions.
We need to discuss policies for vulnerable professions, along with employment and regional development policies that consider a region’s different social strata. Local administrative bodies are the basic units that can collaborate with employers and workers to create and push for preventive measures, such as tending to workers’ health, installing systems to monitor heat-related symptoms, and providing breaks [1]. Considering that at-risk jobs emerge unevenly in certain geographic areas, policymakers should simultaneously promote collaboration among local governments, prepare joint countermeasure plans, and reorganize regional development strategies. Our results suggest that policymakers should consider the specific geographies of vulnerable occupations and provide helpful hints on regional policy coordination to promote a virtuous circle of sustainable regional development.

6. Conclusions

This research highlights the discussion on working condition targeting climate change vulnerable groups. However, as an exploratory research, this work has a limitation in defining vulnerable occupations. To increase the level of the discussion and practice policy based on the research, the following research efforts are suggested. First, by applying various research methodologies, assessment of climate change vulnerability targeting occupation shall be conducted. Vulnerability assessment based on other variables affecting labor activities and socioeconomic external and internal factors, as well as variables from this research, is required. This means assessment considering the working environment and socioeconomic conditions.
Second, the level of individual occupations needs to be discussed with consideration for regional occupations and industries in climate change vulnerability research. One specific region in industries and occupation emphasizes its negativity from climate change disasters and urban resilience, and it requires various industries and occupations. In the case of resilience, climate impacts require a review of the theory relevant to diversity and specialization, which has been discussed as part of regional development strategies. The traditional theory of regional development strategies could be discussed with climate change vulnerability.
Finally, research that links climate change impacts and employment is required. Further research needs to discuss the types of occupations that would increase in demand because of climate change, whether increasing employment is an additional factor to sustain productivities, and how productivities would change based on the type of occupations. This research would be used to create a sustainable development policy in employment as well as to suggest policy directions regarding climate change adaptation.

Acknowledgments

This research was performed in the Korea Environment Institute (2015-055) supported by the National Research Foundation of Korea (NRF) grant funded by the Korea government (Ministry of Science, ICT, and Future Planning) (No. NRF-2013R1A1A1007751).

Author Contributions

Donghyun Kim designed the research and drafted the manuscript. Heonyeong Lee collected the data and conducted the exploratory spatial data analysis. Up Lim reviewed the analytical results and provided extensive revision during the study. All authors wrote, read, and approved the final manuscript.

Conflicts of Interest

The authors declare no conflict of interest.

References

  1. Nilsson, M.; Kjellstrom, T. Climate change impacts on working people: How to develop prevention policies. Glob. Health Action 2010. [Google Scholar] [CrossRef] [PubMed]
  2. Adam-Poupart, A.; Labreche, F.; Smargiassi, A.; Duguay, P.; Busque, M.A.; Gagne, C.; Rintamaki, H.; Kjellstrom, T.; Zayed, J. Climate change and occupational health and safety in a temperate climate: Potential impacts and research priorities in Quebec, Canada. Ind. Health 2013, 51, 68–78. [Google Scholar] [CrossRef] [PubMed]
  3. Schulte, P.A.; Chun, H. Climate change and occupational safety and health: Establishing a preliminary framework. J. Occup. Environ. Hyg. 2009, 6, 542–554. [Google Scholar] [CrossRef] [PubMed]
  4. Smith, K.R.; Woodward, A.; Campbell-Lendrum, D.; Chadee, D.D.; Honda, Y.; Liu, Q.; Olwoch, J.M.; Revich, B.; Sauerborn, R. Human health: Impacts, adaptation, and co-benefits. In Climate Change 2014: Impacts, Adaptation, and Vulnerability. Part A: Global and Sectoral Aspects; Field, C.B., Barros, V.R., Dokken, D.J., Mach, K.J., Mastrandrea, M.D., Bilir, T.E., Chatterjee, M., Ebi, K.L., Estrada, Y.O., Genova, R.C., et al., Eds.; Cambridge University Press: Cambridge, UK, 2014. [Google Scholar]
  5. Dulal, H.; Shah, K.; Ahmad, N. Social equity considerations in the implementation of Caribbean climate change adaptation policies. Sustainability 2009, 1, 363–383. [Google Scholar] [CrossRef]
  6. Deonandan, R.; Campbell, K.; Ostbye, T.; Tummon, I.; Robertson, J. A comparison of methods for measuring socio-economic status by occupation or postal area. Chronic Dis. Can. 2000, 21, 114–118. [Google Scholar] [PubMed]
  7. Intergovernmental Panel on Climate Change. Climate Change 2013: The Physical Science Basis. Contribution of Working Group I to the Fifth Assessment Report of the Intergovernmental Panel on Climate Change; Stocker, T.F., Qin, D., Plattner, G.-K., Tignor, M.M.B., Allen, S.K., Boschung, J., Nauels, A., Xia, Y., Bex, V., Midgley, P.M., et al., Eds.; Cambridge University Press: Cambridge, UK, 2013. [Google Scholar]
  8. United Nations. United Nations Framework Convention on Climate Change; United Nations: Bonn, Germany, 1992; Available online: https://unfccc.int/resource/docs/convkp/conveng.pdf (accessed on 23 June 2015).
  9. Intergovernmental Panel on Climate Change. Climate Change 2014: Impacts, Adaptation, and Vulnerability. Part A: Global and Sectoral Aspects. Contribution of Working Group II to the Fifth Assessment Report of the Intergovernmental Panel on Climate Change; Cambridge University Press: Cambridge, UK, 2014. [Google Scholar]
  10. Korea Meteorological Administration. Climate Change Report on the Korea Peninsula; Korea Meteorological Administration: Seoul, Korea, 2012; Available online: http://www.climate.go.kr/home/cc_data/2013/ korea_climate /13-0311_korea_climate.pdf (accessed on 23 June 2015).
  11. Kjellstrom, T.; Kovats, R.S.; Lloyd, S.J.; Holt, T.; Tol, R.S.J. The direct impact of climate change on regional labor productivity. Arch. Environ. Occup. Health 2009, 64, 217–227. [Google Scholar] [CrossRef] [PubMed]
  12. Liberatos, P.; Link, B.G.; Kelsey, J.L. The measurement of social class in epidemiology. Epidemiol. Rev. 1988, 10, 87–121. [Google Scholar] [PubMed]
  13. Eurofound. Fifth European Working Conditions Survey: Overview Report; Publications Office of the European Union: Luxembourg, 2012. [Google Scholar]
  14. Füssel, H.M.; Klein, R.T. Climate change vulnerability assessments: An evolution of conceptual thinking. Clim. Chang. 2006, 75, 301–329. [Google Scholar] [CrossRef]
  15. Intergovernmental Panel on Climate Change. Climate Change 2001: Synthesis Report. A Contribution of Working Groups I, II and III to the Third Assessment Report of the Intergovernmental Panel on Climate Change; Cambridge University Press: Cambridge, UK, 2001. [Google Scholar]
  16. McCarthy, J.J. Climate Change 2001: Impacts, Adaptation, and Vulnerability: Contribution of Working Group II to the Third Assessment Report of the Intergovernmental Panel on Climate Change; Cambridge University Press: Cambridge, UK, 2001. [Google Scholar]
  17. Ribot, J. Vulnerability does not fall from the sky: Toward multiscale, pro-poor climate policy. In Social Dimensions of Climate Change: Equity and Vulnerability in a Warming World; World Bank: Washington, DC, USA, 2010; pp. 47–74. [Google Scholar]
  18. Adger, W.N. Vulnerability. Glob. Environ. Chang. 2006, 16, 268–281. [Google Scholar] [CrossRef]
  19. Brooks, N. Vulnerability, risk and adaptation: A conceptual framework. In Tyndall Centre for Climate Change Research; University of East Anglia: Norwich, UK, 2003. [Google Scholar]
  20. Spurgeon, A.; Harrington, J.M.; Cooper, C.L. Health and safety problems associated with long working hours: A review of the current position. Occup. Environ. Med. 1997, 54, 367–375. [Google Scholar] [CrossRef] [PubMed]
  21. Perch, L. Mitigation of What and by What? Adaptation by Whom and for Whom? Dilemmas in Delivering for the Poor and the Vulnerable in International Climate Policy; Working Paper 79; International Policy Centre for Inclusive Growth, United Nations Development Programme: Brasilia, Brazil, 2011. [Google Scholar]
  22. Anselin, L. Local indicators of spatial association–LISA. Geogr. Anal. 1995, 27, 93–115. [Google Scholar] [CrossRef]
  23. Wong, D.W.S.; Lee, J. Statistical Analysis of Geographic Information with ArcView GIS and ArcGIS; John Wiley & Sons: Hoboken, NJ, USA, 2005. [Google Scholar]
  24. Duranton, G.; Puga, D. From sectoral to functional urban specialisation. J. Urban Econ. 2005, 57, 343–370. [Google Scholar] [CrossRef]
  25. Scott, A.J. Human capital resources and requirements across the metropolitan hierarchy of the USA. J. Econ. Geogr. 2009, 9, 207–226. [Google Scholar] [CrossRef]
  26. Martinez-Fernandez, C.; Hinojosa, C.; Miranda, G. Green Jobs and Skills: The Local Labour Market Implications of Addressing Climate Change; Working Paper; Local Economic and Employment Development Programme, Organisation for Economic Co-operation and Development: Paris, France, 2010. [Google Scholar]
  27. Torres, R. The social impact of policies to address climate change: A review of the issues. Int. Labour Rev. 2008, 147, 275–279. [Google Scholar] [CrossRef]
  28. Olsen, L. The Employment Effects of Climate Change and Climate Change Responses: A Role of International Labour Standards? Discussion Paper 12; Global Union Research Network, International Labour Office: Geneve, Switzerland, 2009. [Google Scholar]
  29. Harsdorff, M.; Lieuw-Kie-Song, M.; Tsukamoto, M. Towards an ILO Approach to Climate Change Adaptation; Employment Working Paper 104; International Labour Organisation: Geneve, Switzerland, 2011. [Google Scholar]

