
Using a Coupled Human-Natural System to Assess the Vulnerability of the Karst Landform Region in China

Abstract
:1. Introduction
2. Research Methods
2.1. Confirmation of Weighted Coefficient
2.2. Grey Correlation Analysis Modeling
3. Construction of the Evaluation Framework and Indexes
3.1. Evaluation Index Construction

| Dimension Layer | Index Layer | Parameter Layer | Properties |
|---|---|---|---|
| Sensitivity | climate | X1, annual mean precipitation (mm) | + |
| X2, annual average frost free period (d) | + | ||
| landforms | X3, the proportion of mountain areas (%) | − | |
| X4, >25°slope areas proportion (%) | − | ||
| plants | X5, forest coverage (%) | + | |
| hydrology | X6, annual mean runoff (mm) | + | |
| soil | X7, proportion of stony desertification area (%) | − | |
| Exposure | water resources quality | X8, inferior level water quality proportion (%) | − |
| human activities intensity | X9, unit fixed assets invested (10,000 Yuan/km2) | + | |
| population | X10, inhabitant density (people/km2) | − | |
| X11, village employee proportion (%) | − | ||
| economic level | X12, per capita total output value (Yuan/person) | + | |
| X13, unit total output value of energy consumption (tons of SCE/10000 yuan) | − | ||
| X14, incidence of rural poverty (%) | − | ||
| Resilience | government financial strength | X15, per capita financial revenue (Yuan/person) | + |
| social security | X16, medical staff per thousand (person/1000 person) | + | |
| educational level | X17, locality university student’s proportion (%) | + | |
| X18, internet proportion (%) | + | ||
| X19, road net density(km/km2) | + |
3.2. Index Evaluation Framework Construction
| Index Level | District | ||||||||
|---|---|---|---|---|---|---|---|---|---|
| Parameter Layer | Guiyang | Liupanshui | Zunyi | Anshun | Tongren | Bijie | Qianxinan | Qiandongnan | Qiannan |
| X1 | 1095.7 | 1315.8 | 1077 | 1275 | 1228.6 | 1023.3 | 1273.3 | 1235.8 | 1235.3 |
| X2 | 270 | 250 | 285 | 245 | 220 | 240 | 300 | 240 | 280 |
| X3 | 40.1 | 66.7 | 61.9 | 46.8 | 64.1 | 57.8 | 62.8 | 72.8 | 60.4 |
| X4 | 5.77 | 13.83 | 14.71 | 19.99 | 20.71 | 10.54 | 36.23 | 31.29 | 26.88 |
| X5 | 42.3 | 38 | 48.6 | 39 | 49.8 | 41.5 | 46 | 63 | 53.76 |
| X6 | 561.9 | 542.9 | 560.4 | 670.9 | 697.8 | 500.5 | 677.2 | 633.1 | 620.5 |
| X7 | 23.36 | 32.94 | 15.19 | 32.04 | 18.18 | 26.1 | 29.94 | 5.88 | 29.46 |
| X8 | 25.1 | 8.2 | 18.3 | 4.2 | 44.3 | 2.3 | 5.9 | 34.5 | 17.2 |
| X9 | 1763.28 | 443.89 | 222.78 | 178.66 | 166.64 | 234.92 | 179.23 | 115.55 | 152.72 |
| X10 | 546.43 | 287.47 | 198.3 | 246.03 | 171.08 | 242.8 | 166.63 | 114.05 | 122.55 |
| X11 | 26.97 | 49.09 | 65.64 | 62.92 | 72.94 | 68.97 | 65.55 | 69.39 | 67.07 |
| X12 | 31,712.39 | 21,522 | 18,335.05 | 12,472.14 | 11,621.95 | 11,294.97 | 13,385.75 | 11,047.48 | 13,765.12 |
| X13 | 1.42 | 2.83 | 1.34 | 2.13 | 1.64 | 1.88 | 1.71 | 1.92 | 1.77 |
| X14 | 16.8 | 38.3 | 21.85 | 30.79 | 38.75 | 35.54 | 36.23 | 42.11 | 36 |
| X15 | 4291.49 | 2468.22 | 1383.49 | 1157.47 | 919.22 | 1236.26 | 1622.82 | 1303.67 | 1216.41 |
| X16 | 7.61 | 2.9 | 2.66 | 2.18 | 1.81 | 1.49 | 2.25 | 2.46 | 2.4 |
| X17 | 6.31 | 0.27 | 0.8 | 0.62 | 0.45 | 0.25 | 0.41 | 0.75 | 0.65 |
| X18 | 0.81 | 0.44 | 0.43 | 0.4 | 0.33 | 0.3 | 0.41 | 0.43 | 0.39 |
| X19 | 1.15 | 1.2 | 0.78 | 1 | 1.19 | 0.93 | 0.49 | 1.59 | 0.59 |
4. Calculation
4.1. Calculation of Weight Coefficient and Evaluation Index Value
| Index Level | District | ||||||||
|---|---|---|---|---|---|---|---|---|---|
| Parameter Layer | Guiyang | Liupanshui | Zunyi | Anshun | Tongren | Bijie | Qianxinan | Qiandongnan | Qiannan |
| X1 | 0.2475 | 1.0000 | 0.1836 | 0.8605 | 0.7019 | 0.0000 | 0.8547 | 0.7265 | 0.7248 |
| X2 | 0.6250 | 0.3750 | 0.8125 | 0.3125 | 0.0000 | 0.2500 | 1.0000 | 0.2500 | 0.7500 |
| X3 | 1.0000 | 0.1865 | 0.3306 | 0.3333 | 0.7951 | 0.2661 | 0.3058 | 0.0000 | 0.3792 |
| X4 | 1.0000 | 0.7354 | 0.7065 | 0.5332 | 0.5095 | 0.8434 | 0.0000 | 0.1622 | 0.3070 |
| X5 | 0.1720 | 0.0000 | 0.4240 | 0.0400 | 0.4720 | 0.1400 | 0.3200 | 1.0000 | 0.6304 |
| X6 | 0.3112 | 0.2149 | 0.3036 | 0.8637 | 1.0000 | 0.0000 | 0.8956 | 0.6721 | 0.6082 |
| X7 | 0.3540 | 0.0000 | 0.6559 | 0.0333 | 0.5455 | 0.2528 | 0.1109 | 1.0000 | 0.1286 |
| X8 | 0.4571 | 0.8595 | 0.6190 | 0.9548 | 0.0000 | 1.0000 | 0.9143 | 0.2333 | 0.6452 |
| X9 | 1.0000 | 0.1993 | 0.0651 | 0.0383 | 0.0310 | 0.0724 | 0.0386 | 0.0000 | 0.0226 |
| X10 | 1.0000 | 0.4011 | 0.1948 | 0.3053 | 0.1319 | 0.2978 | 0.1216 | 0.0000 | 0.0197 |
| X11 | 1.0000 | 0.5188 | 0.1588 | 0.2180 | 0.0000 | 0.0864 | 0.1608 | 0.0772 | 0.1277 |
| X12 | 1.0000 | 0.5069 | 0.3527 | 0.0689 | 0.0278 | 0.0120 | 0.1132 | 0.0000 | 0.1315 |
| X13 | 0.9493 | 0.0000 | 1.0020 | 0.4672 | 0.8007 | 0.6407 | 0.7523 | 0.6079 | 0.7081 |
| X14 | 1.0000 | 0.1505 | 0.8005 | 0.4473 | 0.1328 | 0.2596 | 0.2323 | 0.0000 | 0.2414 |
| X15 | 1.0000 | 0.4593 | 0.1377 | 0.0706 | 0.0000 | 0.0940 | 0.2086 | 0.1140 | 0.0881 |
| X16 | 1.0000 | 0.2311 | 0.1916 | 0.1129 | 0.0515 | 0.0000 | 0.1241 | 0.1583 | 0.1487 |
| X17 | 1.0000 | 0.0033 | 0.0908 | 0.0611 | 0.0330 | 0.0000 | 0.0264 | 0.0825 | 0.0660 |
| X18 | 0.9982 | 0.2811 | 0.2546 | 0.1932 | 0.0616 | 0.0000 | 0.2198 | 0.2538 | 0.1755 |
| X19 | 0.5973 | 0.6461 | 0.2645 | 0.4598 | 0.6407 | 0.3973 | 0.0034 | 1.0000 | 0.0946 |
| Sensitivity (wj = 0.2734) | Exposure (wj = 0.3918) | Resilience (wj = 0.3348) | |||
|---|---|---|---|---|---|
| Parameters | Weighting (wj) | Parameters | Weighting (wj) | Parameters | Weighting (wj) |
| X1 | 0.0978 | X8 | 0.0595 | X15 | 0.1960 |
| X2 | 0.1055 | X9 | 0.2953 | X16 | 0.1895 |
| X3 | 0.1191 | X10 | 0.1397 | X17 | 0.3818 |
| X4 | 0.0982 | X11 | 0.1513 | X18 | 0.1413 |
| X5 | 0.1624 | X12 | 0.1999 | X19 | 0.0913 |
| X6 | 0.2320 | X13 | 0.0465 | - | - |
| X7 | 0.1851 | X14 | 0.1076 | - | - |
| Dimension Index | district | ||||||||
|---|---|---|---|---|---|---|---|---|---|
| Guiyang | Liupanshui | Zunyi | Anshun | Tongren | Bijie | Qianxiana | Qiandongnan | Qiannan | |
| Sensitivity | 0.4731 | 0.2816 | 0.4731 | 0.4221 | 0.6229 | 0.2104 | 0.5057 | 0.6167 | 0.4926 |
| Exposure | 0.9653 | 0.3109 | 0.2738 | 0.1706 | 0.0847 | 0.1362 | 0.1354 | 0.0400 | 0.1140 |
| Resilience | 0.9631 | 0.2338 | 0.1581 | 0.1279 | 0.0896 | 0.0547 | 0.1059 | 0.2111 | 0.1041 |
4.2. Calculation of the Grey Correlation Degree
4.2.1. Calculation of the Grey Relational Coefficients
| Index | District | |||||||||
|---|---|---|---|---|---|---|---|---|---|---|
| Dimension Layer | Parameters | Guiyang | Liupanshui | Zunyi | Anshun | Tongren | Bijie | Qianxiana | Qiandongnan | Qiannan |
| Sensitivity | X1 | 0.3992 | 1.0000 | 0.3798 | 0.7819 | 0.6265 | 0.3333 | 0.7748 | 0.6464 | 0.6450 |
| X2 | 0.5714 | 0.4444 | 0.7273 | 0.4211 | 0.3333 | 0.4000 | 1.0000 | 0.4000 | 0.6667 | |
| X3 | 1.0000 | 0.3807 | 0.4276 | 0.4286 | 0.7093 | 0.4052 | 0.4187 | 0.3333 | 0.4461 | |
| X4 | 1.0000 | 0.6539 | 0.6301 | 0.5171 | 0.5048 | 0.7615 | 0.3333 | 0.3737 | 0.4191 | |
| X5 | 0.3765 | 0.3333 | 0.4647 | 0.3425 | 0.4864 | 0.3676 | 0.4237 | 1.0000 | 0.5750 | |
| X6 | 0.4206 | 0.3891 | 0.4179 | 0.7857 | 1.0000 | 0.3333 | 0.8273 | 0.6039 | 0.5607 | |
| X7 | 0.4363 | 0.3333 | 0.5924 | 0.3409 | 0.5238 | 0.4009 | 0.3599 | 1.0000 | 0.3646 | |
| Exposure | X8 | 0.4795 | 0.7807 | 0.5676 | 0.9170 | 0.3333 | 1.0000 | 0.8537 | 0.3947 | 0.5850 |
| X9 | 1.0000 | 0.3844 | 0.3485 | 0.3421 | 0.3404 | 0.3502 | 0.3421 | 0.3333 | 0.3384 | |
| X10 | 1.0000 | 0.4550 | 0.3831 | 0.4185 | 0.3655 | 0.4159 | 0.3627 | 0.3333 | 0.3378 | |
| X11 | 1.0000 | 0.5096 | 0.3728 | 0.3900 | 0.3333 | 0.3537 | 0.3733 | 0.3514 | 0.3643 | |
| X12 | 1.0000 | 0.5035 | 0.4358 | 0.3494 | 0.3396 | 0.3360 | 0.3605 | 0.3333 | 0.3654 | |
| X13 | 0.9079 | 0.3333 | 1.0041 | 0.4841 | 0.7150 | 0.5818 | 0.6687 | 0.5605 | 0.6314 | |
| X14 | 1.0000 | 0.3705 | 0.7148 | 0.4749 | 0.3657 | 0.4031 | 0.3944 | 0.3333 | 0.3973 | |
| Resilience | X15 | 1.0000 | 0.4805 | 0.3670 | 0.3498 | 0.3333 | 0.3556 | 0.3872 | 0.3608 | 0.3541 |
| X16 | 1.0000 | 0.3940 | 0.3821 | 0.3605 | 0.3452 | 0.3333 | 0.3634 | 0.3727 | 0.3700 | |
| X17 | 1.0000 | 0.3341 | 0.3548 | 0.3475 | 0.3408 | 0.3333 | 0.3393 | 0.3527 | 0.3487 | |
| X18 | 0.9964 | 0.4102 | 0.4015 | 0.3826 | 0.3476 | 0.3333 | 0.3906 | 0.4012 | 0.3775 | |
| X19 | 0.5539 | 0.5856 | 0.4047 | 0.4807 | 0.5819 | 0.4535 | 0.3341 | 1.0000 | 0.3558 | |
4.2.2. Calculation of the Grey Correlation Degree (Rij)
4.2.3. Ranking the grey correlation degree
| layer | Correlation Degree | Guiyang | Liupanshui | Zunyi | Anshun | Tongren | Bijie | Qianxinan | Qiandongnan | Qiannan |
|---|---|---|---|---|---|---|---|---|---|---|
| the first step evaluation | Rsensitivity | 0.6885 | 0.6097 | 0.6674 | 0.6678 | 0.7583 | 0.5720 | 0.7149 | 0.7722 | 0.6767 |
| vulnerability rank | light | light | light | light | slight | middle | light | slight | light | |
| Rexposure | 0.9382 | 0.5689 | 0.5699 | 0.5211 | 0.4983 | 0.5110 | 0.5114 | 0.4834 | 0.5489 | |
| vulnerability rank | slight | middle | middle | middle | middle | middle | middle | middle | middle | |
| Rresilience | 0.9735 | 0.5753 | 0.5424 | 0.5365 | 0.5295 | 0.5162 | 0.529 | 0.5782 | 0.5277 | |
| vulnerability rank | slight | middle | middle | middle | middle | middle | middle | middle | middle | |
| the second step evaluation | Rcomprehensive | 0.9409 | 0.4060 | 0.4568 | 0.4242 | 0.5304 | 0.3639 | 0.4667 | 0.5012 | 0.4365 |
| vulnerability rank | slight | strong | middle | strong | middle | strong | middle | middle | strong |
| Grades | Value | Properties |
|---|---|---|
| acute vulnerability | 0–0.30 | Live environment extremely worst; natural affect acute; environment vulnerable strong; soc-economy extremely backward; human-natural system self-recovery lowness |
| strong vulnerability | 0.3–0.45 | Live environment relatively worst; environment vulnerable intensity; soc-economy very backward; human-natural system self-recovery lowness |
| middle vulnerability | 0.45–0.60 | Live environment common; environment vulnerable lightly; soc-economy level backward; human-natural system have some self-recovery ability |
| light vulnerability | 0.60–0.75 | Live environment good; soc-economy level high; human-natural system have evident self-recovery ability |
| slight vulnerability | 0.75–1.0 | Live environment very good; soc-economy level very high; human-natural system have strong self-recovery ability |
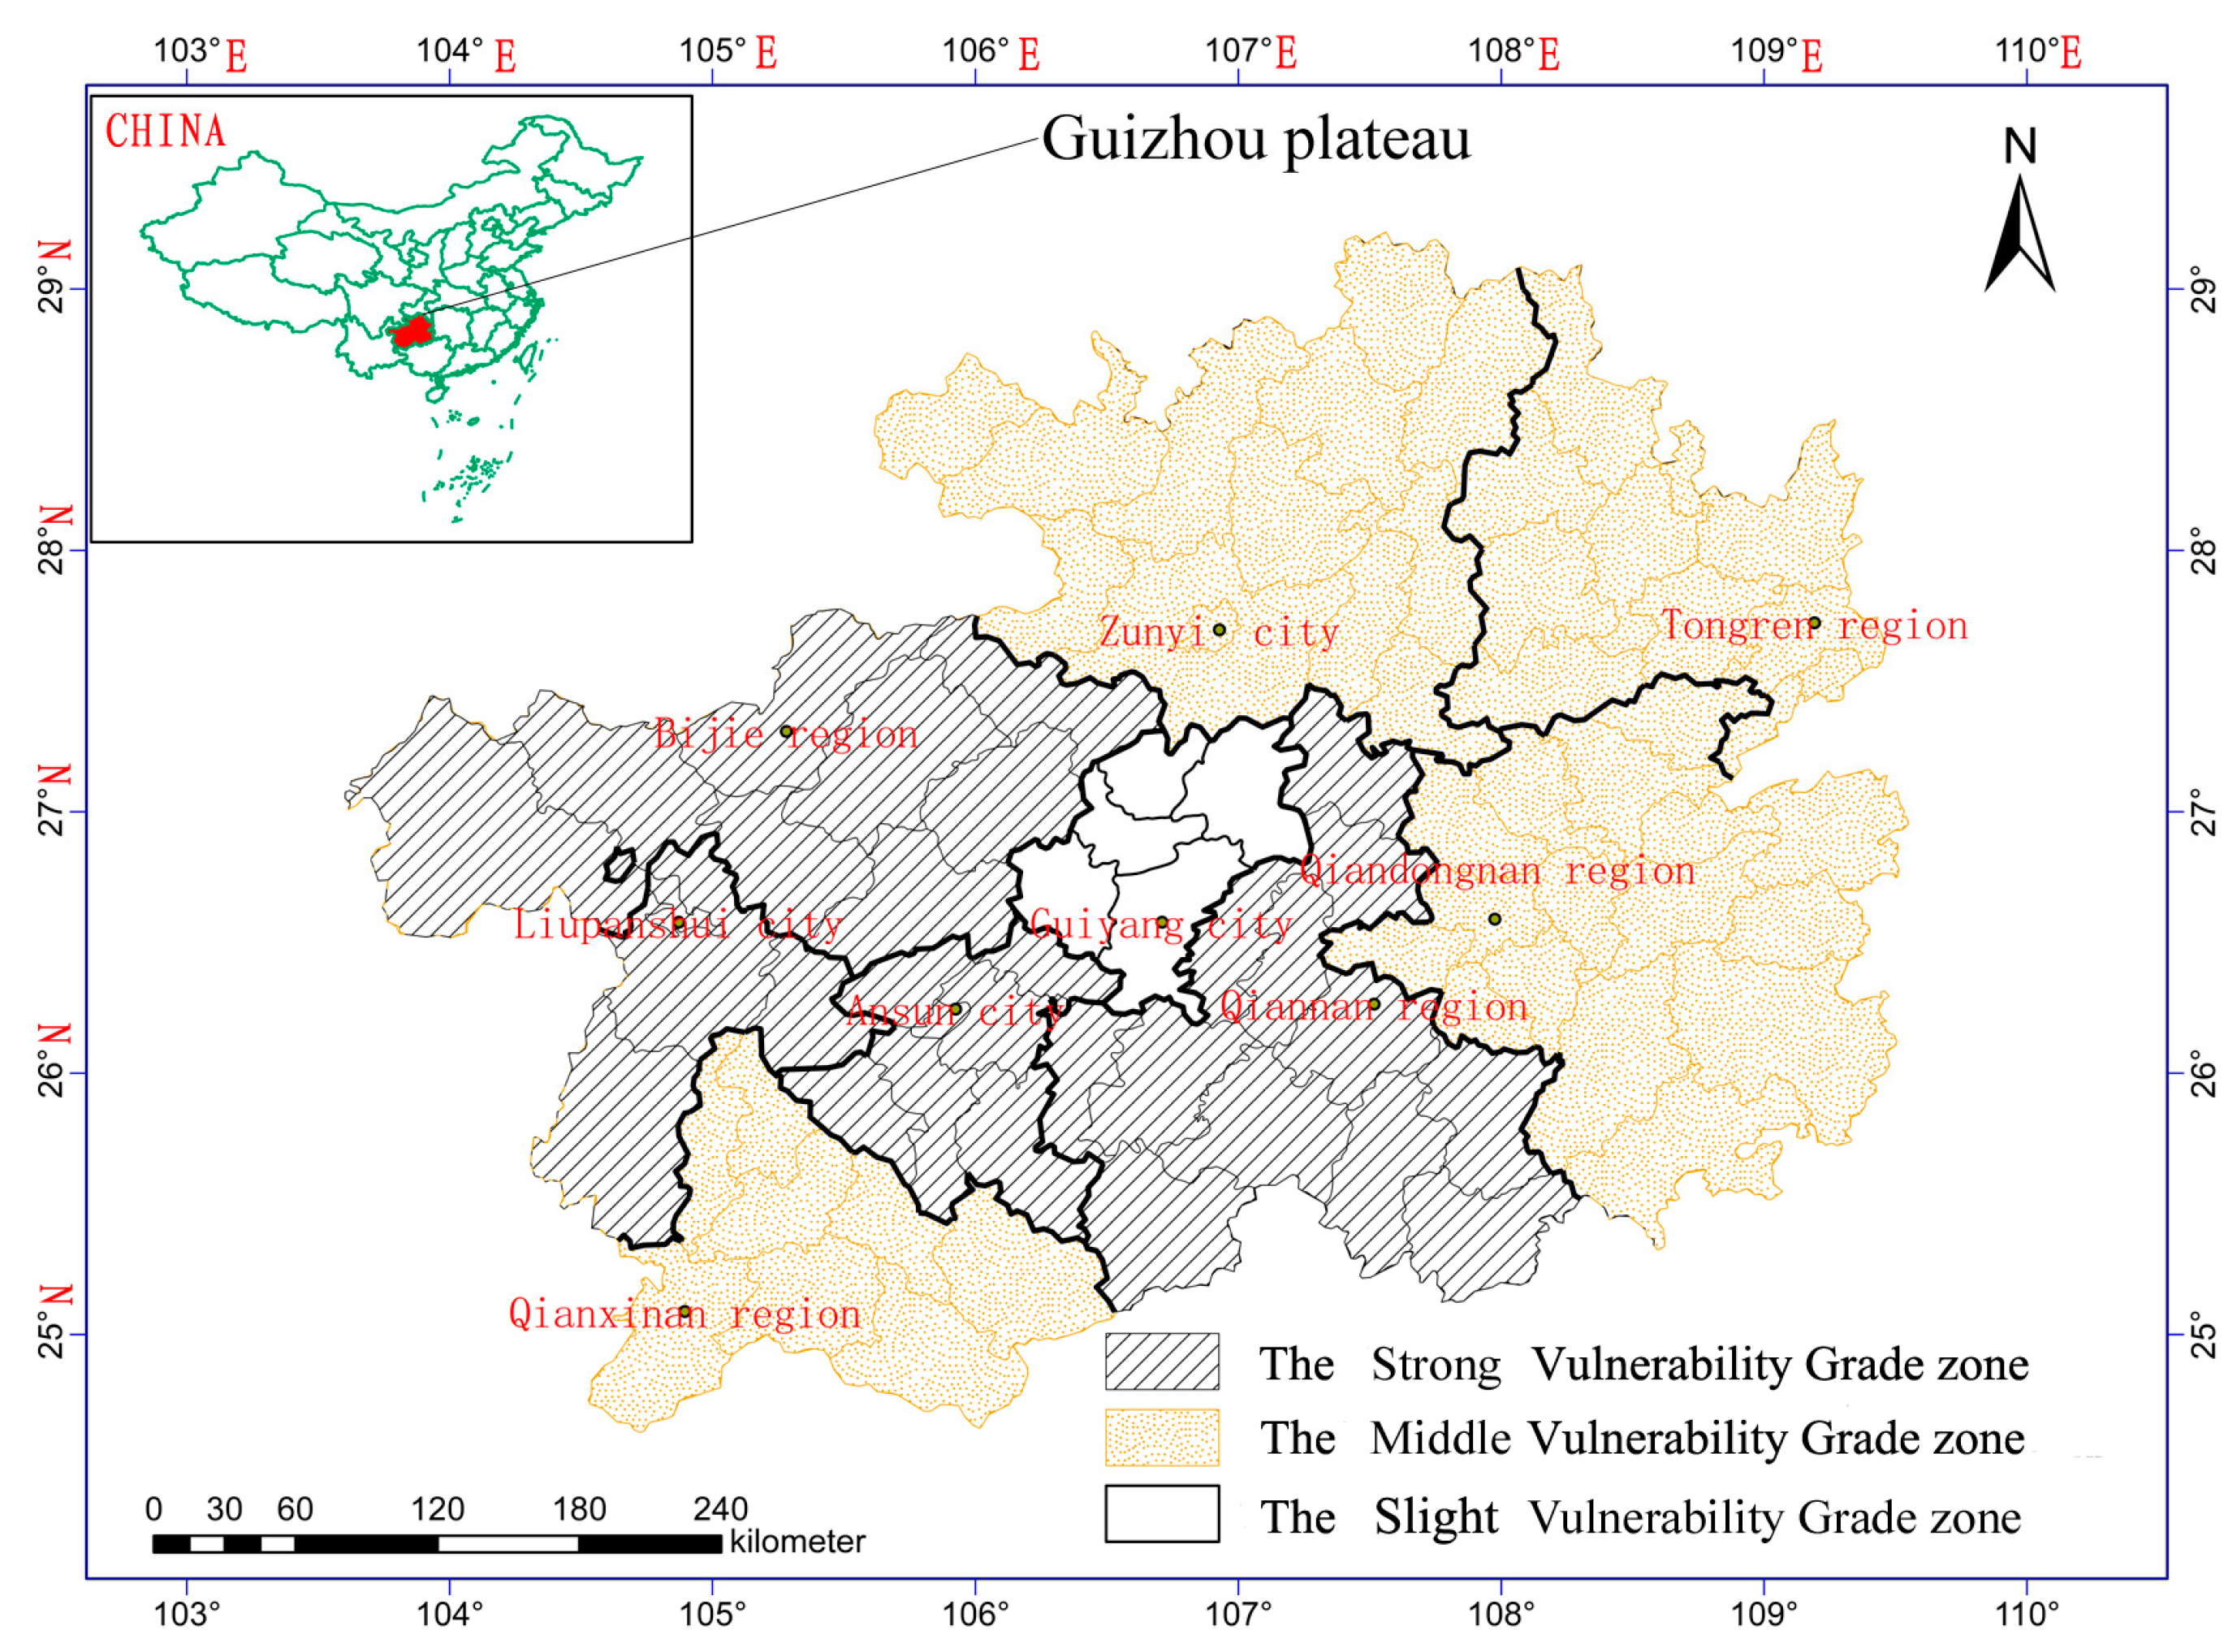
5. Zoning and Results Analyses

5.1. Strong Vulnerability Degree Zone
5.2. Middle Vulnerability Degree Zone
5.3. Slight Vulnerability Degree Zone
6. Conclusions
Acknowledgments
Author Contributions
Conflicts of interest
References
- Liu, J.G.; Dietz, T.; Carpenter, S.R.; Alberti, M.; Folke, C.; Moran, E.; Pell, A.N.; Deadman, P.; Kratz, T.; Lubchenco, J.; et al. Complexity of coupled human and natural systems. Science 2007, 317, 1513–1516. [Google Scholar] [CrossRef]
- Cutter, S.L.; Christopher, T.E. Moral hazard, social catastrophe: The changing face of vulnerability along the hurricane coasts. Ann. Am. Acad. Polit. Soc. Sci. 2006, 604, 102–112. [Google Scholar] [CrossRef]
- Gunderson, L.H.; Holling, C.S. Panarchy: Understanding Transformations in Human and Natural Systems; Island Press: Washington, DC, USA, 2002. [Google Scholar]
- Levin, S.A.; Dominion, F. Complexity and the Commons; Perseus Books: Reading, MA, USA, 1999. [Google Scholar]
- Dow, K. Exploring Differences in Our Common Future(s): The Meaning of Vulnerability to Global Environmental Change. Geoforum 1992, 23, 417–436. [Google Scholar] [CrossRef]
- Cutter, S.L.; Boruff, B.J.; Shirley, W.L. Social Vulnerability to Environmental Hazards. Soc. Sci. Q. 2003, 84, 242–261. [Google Scholar] [CrossRef]
- Cutter, S.L.; Mitchell, J.T.; Scott, M.S. Revealing the Vulnerability of People and Places: A Case Study of Georgetown County, South Carolina. Ann. Assoc. Am. Geogr. 2000, 90, 713–737. [Google Scholar] [CrossRef]
- Adger, W.N. Vulnerability. Glob. Environ. Chang. 2006, 16, 268–281. [Google Scholar] [CrossRef]
- Wu, C.J. The research core on geography of the man-earth areal system. Econ. Geogr. 1991. (In Chinese) [Google Scholar] [CrossRef]
- Messerli, B.; Grosjean, M.; Hofer, T. From nature-dominated to human-dominated environmental changes. Q. Sci. Rev. 2000, 19, 459–479. [Google Scholar] [CrossRef]
- Hooper, D.U.; Chapin, F.S., III; Ewel, J.J. Effects of biodiversity on ecosystem function: A consensus of current knowledge. Ecol. Monogr. 2005, 75, 3–35. [Google Scholar] [CrossRef]
- Turner, B.L.; Kasperson, R.E.; Matson, P.A. A framework for vulnerability analysis in sustainability science. Proc. Natl. Acad. Sci. USA 2003, 100, 8074–8079. [Google Scholar] [CrossRef] [PubMed]
- Polsky, C.; Neff, R.; Yarnal, B. Building comparable global change vulnerability assessments: The vulnerability scoping diagram. Glob. Environ. Chang. 2007, 17, 472–485. [Google Scholar] [CrossRef]
- Walker, B.; Carpenter, S.; Anderies, J.; Abel, N.; Cumming, G.; Janssen, M.; Lebel, L.; Norberg, J.; Peterson, G.D.; Pritchard, R. Resilience management in social-ecological systems: A working hypothesis for a participatory approach. Conserv. Ecol. 2002, 6. Article 14. [Google Scholar]
- Folke, C.; Carpenter, S.R.; Elmqvist, T.; Gunderson, L.; Holling, C.S. Resilience and sustainable development: Building adaptive capacity in a world of transformations. AMBIO 2002, 31, 437–440. [Google Scholar] [CrossRef] [PubMed]
- Gunderson, L.H. Ecological resilience-in theory and application. Ann. Rev. Ecol. Syst. 2000, 31, 425–439. [Google Scholar] [CrossRef]
- Yuan, D.X. Chinese Karstology; Geological Publishing House: Beijing, China, 1993. (In Chinese) [Google Scholar]
- Yang, M.D. Study the Vulnerability of Karst Environment; Nationality Publishing House: Guiyang, China, 1990. (In Chinese) [Google Scholar]
- Xie, X.N.; Wang, S.J.; Zhou, Y.C. Three-dimensional fluorescence spectral characteristics of dissolved organic carbon in cave drip waters and their responses to environment changes: Four cave systems as an example in Guizhou Province, China. Chin. Sci. Bull. 2008, 53, 884–889. [Google Scholar] [CrossRef]
- Gilberto, G.C. Linkages between vulnerability, resilience, and adaptive capacity. Golb. Environ. Chang. 2006, 16, 293–303. [Google Scholar]
- Shannon, C. The mathematical theory of communication. Bell Syst. Tech. J. 1948, 27, 379–423. [Google Scholar] [CrossRef]
- Deng, J.L. Control problems of grey systems. Syst. Control Lett. 1982, 1, 288–294. [Google Scholar]
- Ng, D.K.W.; Deng, J. Contrasting grey system theory to probability and fuzzy. J. Grey Syst. 1995, 20, 3–9. [Google Scholar] [CrossRef]
- Yi, L.N.; Liu, S.F. Solving Problems with Incomplete Information: A Grey Systems Approach. Adv. Imaging Electron. Phys. 2006, 141, 77–174. [Google Scholar]
- Liu, S.F.; Li, Y. Grey Information: Theory and Practical Applications; Springer-Verlag: London, UK, 2005. [Google Scholar]
- Hao, H. Gray correlation model of enterprise commercial credit risk assessment. Inf. Comput. Appl. 2013, 391, 519–530. [Google Scholar]
- Luthar, S.S.; Cicchetti, D. The construct of resilience: Implications for interventions and social policies. Dev. Psychopathol. 2000, 12, 857–885. [Google Scholar] [CrossRef]
- Walker, B.; Holling, C.S.; Carpenter, S.R.; Kinzig, A. Resilience, adaptability and transformability in social–ecological systems. Ecol. Soc. 2004, 9. Article 5. [Google Scholar]
- Zhang, B.P.; Xiao, F.; Wu, H.Z.; Mo, S.G.; Zhu, S.Q.; Yu, L.F.; Xiong, K.N.; Lan, A.J. Combating the Fragile Karst Environment in Guizhou, China. AMBIO 2006, 35, 94–97. [Google Scholar] [PubMed]
- Ouyang, Z.Y.; Wang, X.K.; Miao, H. China’s Eco-environmental sensitivity and its spatial heterogeneity. Acta Ecol. Sin. 2000, 20, 9–12. (In Chinese) [Google Scholar]
- Ortega, S.T.; Hanley, N.; Simal, P.D. A Proposed Methodology for Prioritizing Project Effects to Include in Cost-Benefit Analysis Using Resilience, Vulnerability and Risk Perception. Sustainability 2014, 6, 7945–7966. [Google Scholar] [CrossRef]
- Zhang, D.F; Ouyang, Z.Y.; Wang, S.J. Population Resources Environment and Sustainable Development in the Karst Region of Southwest China. China Popul. Resour. Environ. 2011, 11, 77–81. (In Chinese) [Google Scholar]
© 2015 by the authors; licensee MDPI, Basel, Switzerland. This article is an open access article distributed under the terms and conditions of the Creative Commons Attribution license (http://creativecommons.org/licenses/by/4.0/).
Share and Cite
He, X.; Lin, Z.; Xiong, K. Using a Coupled Human-Natural System to Assess the Vulnerability of the Karst Landform Region in China. Sustainability 2015, 7, 12910-12925. https://doi.org/10.3390/su70912910
He X, Lin Z, Xiong K. Using a Coupled Human-Natural System to Assess the Vulnerability of the Karst Landform Region in China. Sustainability. 2015; 7(9):12910-12925. https://doi.org/10.3390/su70912910
Chicago/Turabian StyleHe, Xiang, Zhenshan Lin, and Kangning Xiong. 2015. "Using a Coupled Human-Natural System to Assess the Vulnerability of the Karst Landform Region in China" Sustainability 7, no. 9: 12910-12925. https://doi.org/10.3390/su70912910
APA StyleHe, X., Lin, Z., & Xiong, K. (2015). Using a Coupled Human-Natural System to Assess the Vulnerability of the Karst Landform Region in China. Sustainability, 7(9), 12910-12925. https://doi.org/10.3390/su70912910