Article

Spatiotemporal Changes and Trade-Offs/Synergies in Island Ecosystem Services: A Case Study of the Zhoushan Archipelago


College of Oceanography and Ecological Science, Shanghai Ocean University, Shanghai 201306, China
*
Author to whom correspondence should be addressed.
Sustainability 2026, 18(5), 2297; https://doi.org/10.3390/su18052297
Submission received: 31 January 2026 / Revised: 19 February 2026 / Accepted: 24 February 2026 / Published: 27 February 2026
(This article belongs to the Section Development Goals towards Sustainability)

Abstract

With the rapid development of the social economy, island ecosystem services (ESs) are facing increasingly severe disruptions from human activities. This study constructs an integrated analytical framework of spatiotemporal changes–driving mechanisms–trade-offs/synergies. It aims to support regional sustainability by assessing the spatiotemporal patterns of ESs in the Zhoushan Archipelago, identifying key ecological functional zones and areas with high trade-offs and synergies, in order to formulate management strategies for long-term ecological balance. The results indicate that all four ESs in the Zhoushan Archipelago exhibited declining trends from 2000 to 2020. Spatially, these four ESs collectively exhibit a distribution pattern characterized by higher values in the south and lower values in the north. The cold spot and hot spot analysis results indicate that both the significant cold spot areas and significant hot spot areas have expanded, with noticeable changes occurring on Zhoushan Island, Daishan Island, and Liuheng Island. Based on these spatiotemporal variation characteristics, ecological functional zoning was conducted. The results show that the area of ecologically vulnerable zones has significantly increased, while the area of other functional zones has decreased. Driving factor analysis reveals that the land use/land cover, annual average precipitation, digital elevation model, slope, and normalized difference vegetation index have the most significant impact on the spatial heterogeneity of ESs. Furthermore, trade-off/synergy analysis among ESs was conducted. Spatially, high-trade-off areas are primarily located in central Zhoushan Island, Liuheng Island, Jintang Island, Daishan Island, and Sijiao Island. High-synergy areas are mainly distributed in northern Zhoushan Island, Qushan Island, Taohua Island, and the Ma’an Archipelago. These findings provide a scientific basis for the ecological conservation and restoration of the Zhoushan Archipelago, offering significant reference value for promoting sustainable development in island regions.

1. Introduction

As a critical bridge linking ecosystem health and human development needs, ecosystem services (ESs) and sustainability are inextricably interconnected [1]. Sustainability is defined as the capacity to meet present developmental needs without compromising future generations [2]. It fundamentally relies on ESs as the natural capital foundation that underpins socio-economic functioning and human well-being through material supplies, environmental regulation, life support, and cultural benefits [3,4]. Related studies have also demonstrated a significant positive correlation between ecosystem service provision and ecosystem degradation. Therefore, the sustained and stable provision of ecosystem services is a fundamental prerequisite for maintaining and enhancing regional sustainability.
Islands, as independent units that possess both geographical specificity and strategic importance, occupy a crucial position in the global blue economy and ecological security landscape [5,6]. Balzan, et al. [7] define “island ecosystem services” as the contributions of the integrated island social–ecological system—including its terrestrial, coastal, and adjacent marine components—to human well-being. Their study emphasizes the ecosystem processes and functions occurring within the island system that generate benefits, primarily for local residents and the environment. Their role extends beyond marine resource development, climate change monitoring, and biodiversity conservation, but their ecosystem services also constitute a vital link in sustaining regional sustainability and human well-being [8,9]. However, against the backdrop of global climate change and intensified human activities, islands are confronted with multiple pressures due to their limited terrestrial space, constrained ecological carrying capacity, freshwater shortages, biodiversity degradation, sea level rise, and frequent extreme climate events. All these factors significantly impact ecosystem stability and service functions, thereby threatening long-term sustainability [10,11,12,13]. ES assessments comprehensively reflect the state of the natural environment and its capacity to support human society, serving as essential scientific tools for diagnosing the coupled human–environment relationships on islands, identifying ecological risks, evaluating sustainability development levels, and ultimately guiding the transition toward sustainability [14,15,16]. Therefore, systematically assessing island ESs is not only fundamental for understanding their ecological value and evolutionary patterns but also an urgent requirement for providing scientific support to island ecological restoration, spatial optimization, and adaptive management aimed at enhancing long-term sustainability.
Island ES assessment serves as a quantitative bridge linking island ecological processes with socio-economic decision making. This evaluation helps society clearly recognize that protecting and effectively managing island ecosystems is not an economic burden but a crucial investment in safeguarding biodiversity security, mitigating the impacts of climate change, and securing island sustainability [17]. For example, Zhang, et al. [18] investigated the spatiotemporal evolution and trade-offs/synergies relationships of ESs in the three major river basins of Hainan Island based on data from 1980 to 2020. The study found an overall decline in ecosystem service functions, presenting a pattern of “higher in the central areas and lower in the periphery.” While synergies dominated the relationships among services, the synergies between water conservation and habitat quality weakened. The authors recommend enhancing watershed sustainability through the establishment of ecological corridors and ecological compensation mechanisms. For instance, Romadhon, et al. [19] investigated cultural ESs on Sapudi Island, Indonesia. They constructed a Cultural ES Index, which indicated an overall moderate level of cultural ESs. The results revealed high religious value but low educational value. To advance tourism for sustainability, the study proposed enhancing education, community participation, and infrastructure development. Similarly, Xu, et al. [20] examined the ecosystem service functions of Pingtan Island in Fujian, China. Their findings demonstrated a continuous decline in ecological functions between 2000 and 2020, with key influencing factors including vegetation coverage, GDP, and population. The study highlighted that accelerated urbanization exacerbated these negative effects, underscoring the urgent need to strengthen ecological conservation and restoration efforts. While existing studies provide valuable insights into island ESs, most current research still exhibits certain limitations. Firstly, the scale of investigation is often confined to single islands or localized regions, with a predominant focus on individual ESs [21,22,23,24]. These studies fail to reveal the spatial interconnections and regional heterogeneity of ESs at the archipelago scale and lack systematic analysis of the spatiotemporal synergies and trade-offs among multiple services, making it difficult to meet the needs of comprehensive archipelago planning. Secondly, many existing assessments remain at the level of static description or trend analysis. The resulting research outcomes show a noticeable disconnect from governance practices such as island spatial planning and ecological restoration projects, limiting their direct applicability in supporting refined and differentiated management decisions [25]. Therefore, there is an urgent need to develop multi-scale, multi-service integrated assessments tailored to archipelago ecosystems and strengthen the institutional integration of assessment results with sustainable development decision making for islands.
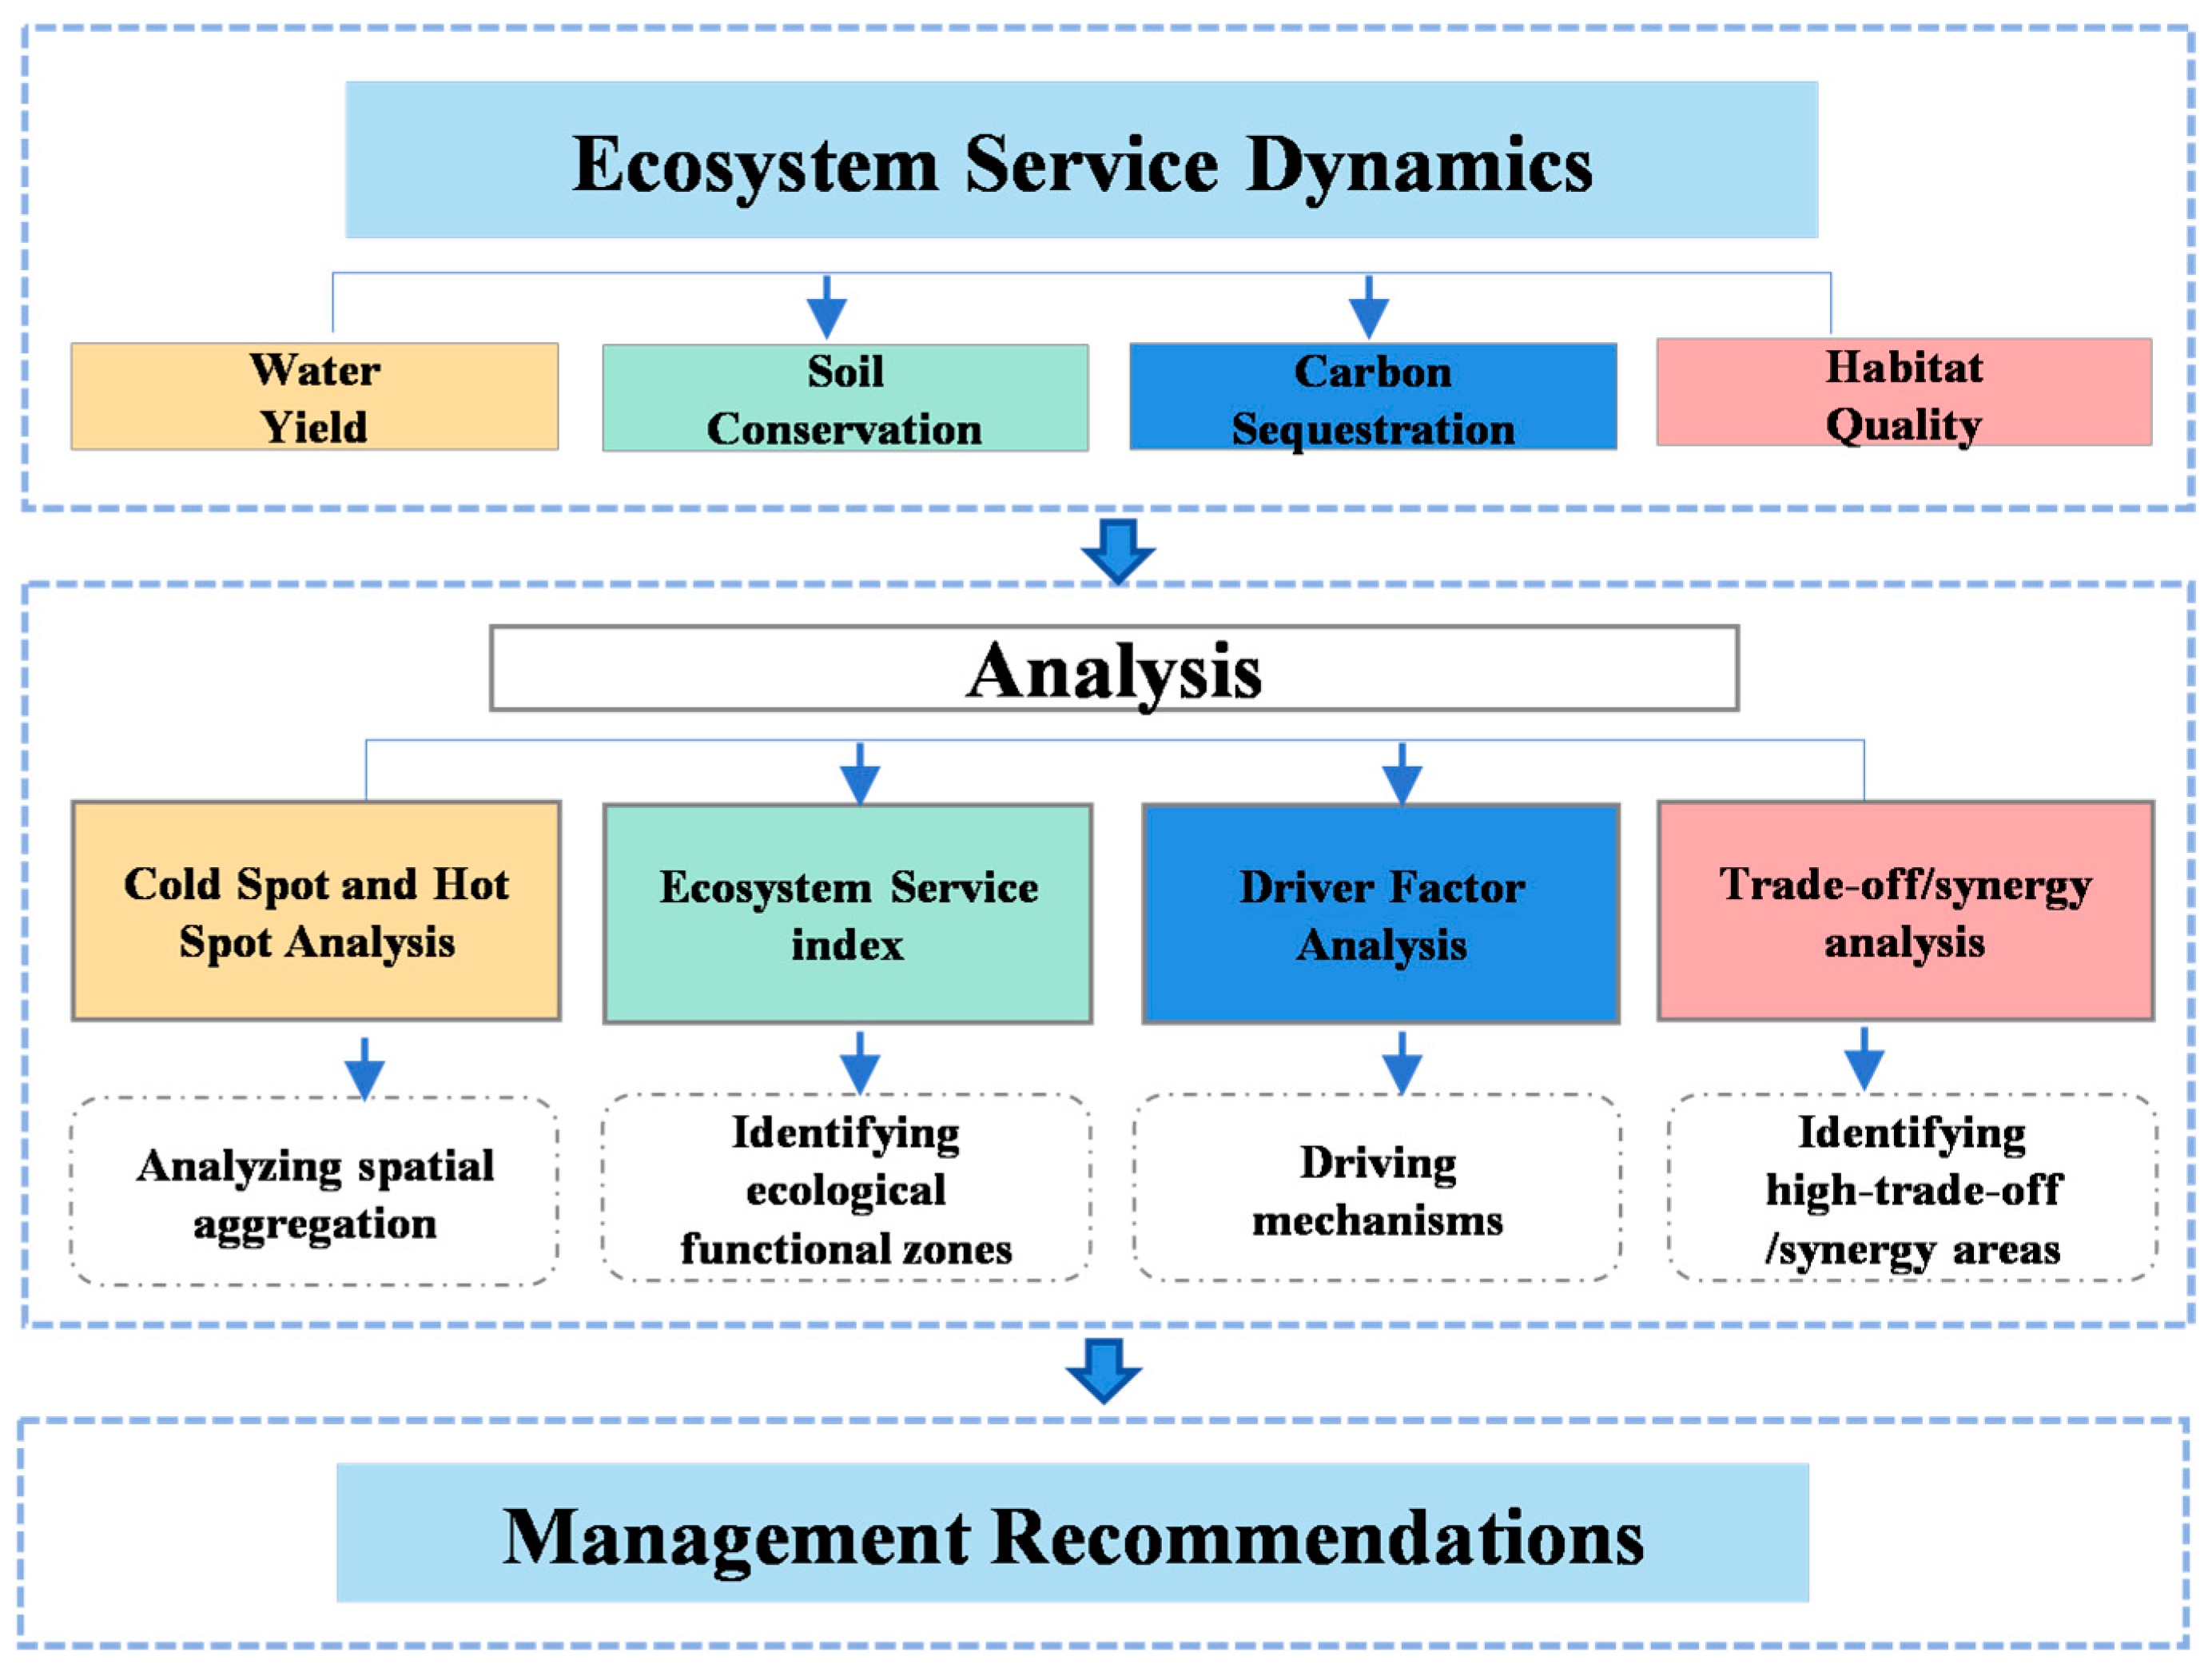
The Kunming-Montreal Global Biodiversity Framework, under its Target 2, explicitly requires that by 2030, at least 30% of degraded terrestrial, inland water, coastal, and marine ecosystems be effectively restored to enhance biodiversity, ecosystem functions and services, ecological integrity, and connectivity [26]. Although islands account for only about 6.67% of the Earth’s land area, they harbor approximately 20% of the world’s species [27]. The high biodiversity and geographic isolation of islands render them priority areas urgently requiring conservation and restoration under Target 2 of the Kunming-Montreal Global Biodiversity Framework [28]. As the largest archipelago in China and a biodiversity hotspot in the East China Sea, the Zhoushan Archipelago exemplifies both high ecological value and intense human disturbance. Therefore, this study selects the Zhoushan Archipelago as the research area. To accurately identify the spatial distribution and restoration priorities of degraded ecosystems in the Zhoushan Archipelago and clarify the interactions among ESs critical for sustainability, this study constructs an integrated analytical framework of “spatiotemporal changes–driving mechanisms–trade-offs/synergies” (Figure 1). It assesses key ESs, delineates ecological functional zones oriented toward sustainability, identifies high-trade-off/synergy areas, and analyzes the driving mechanisms influencing the spatial distribution of ESs.

2. Materials and Methods

2.1. Study Area

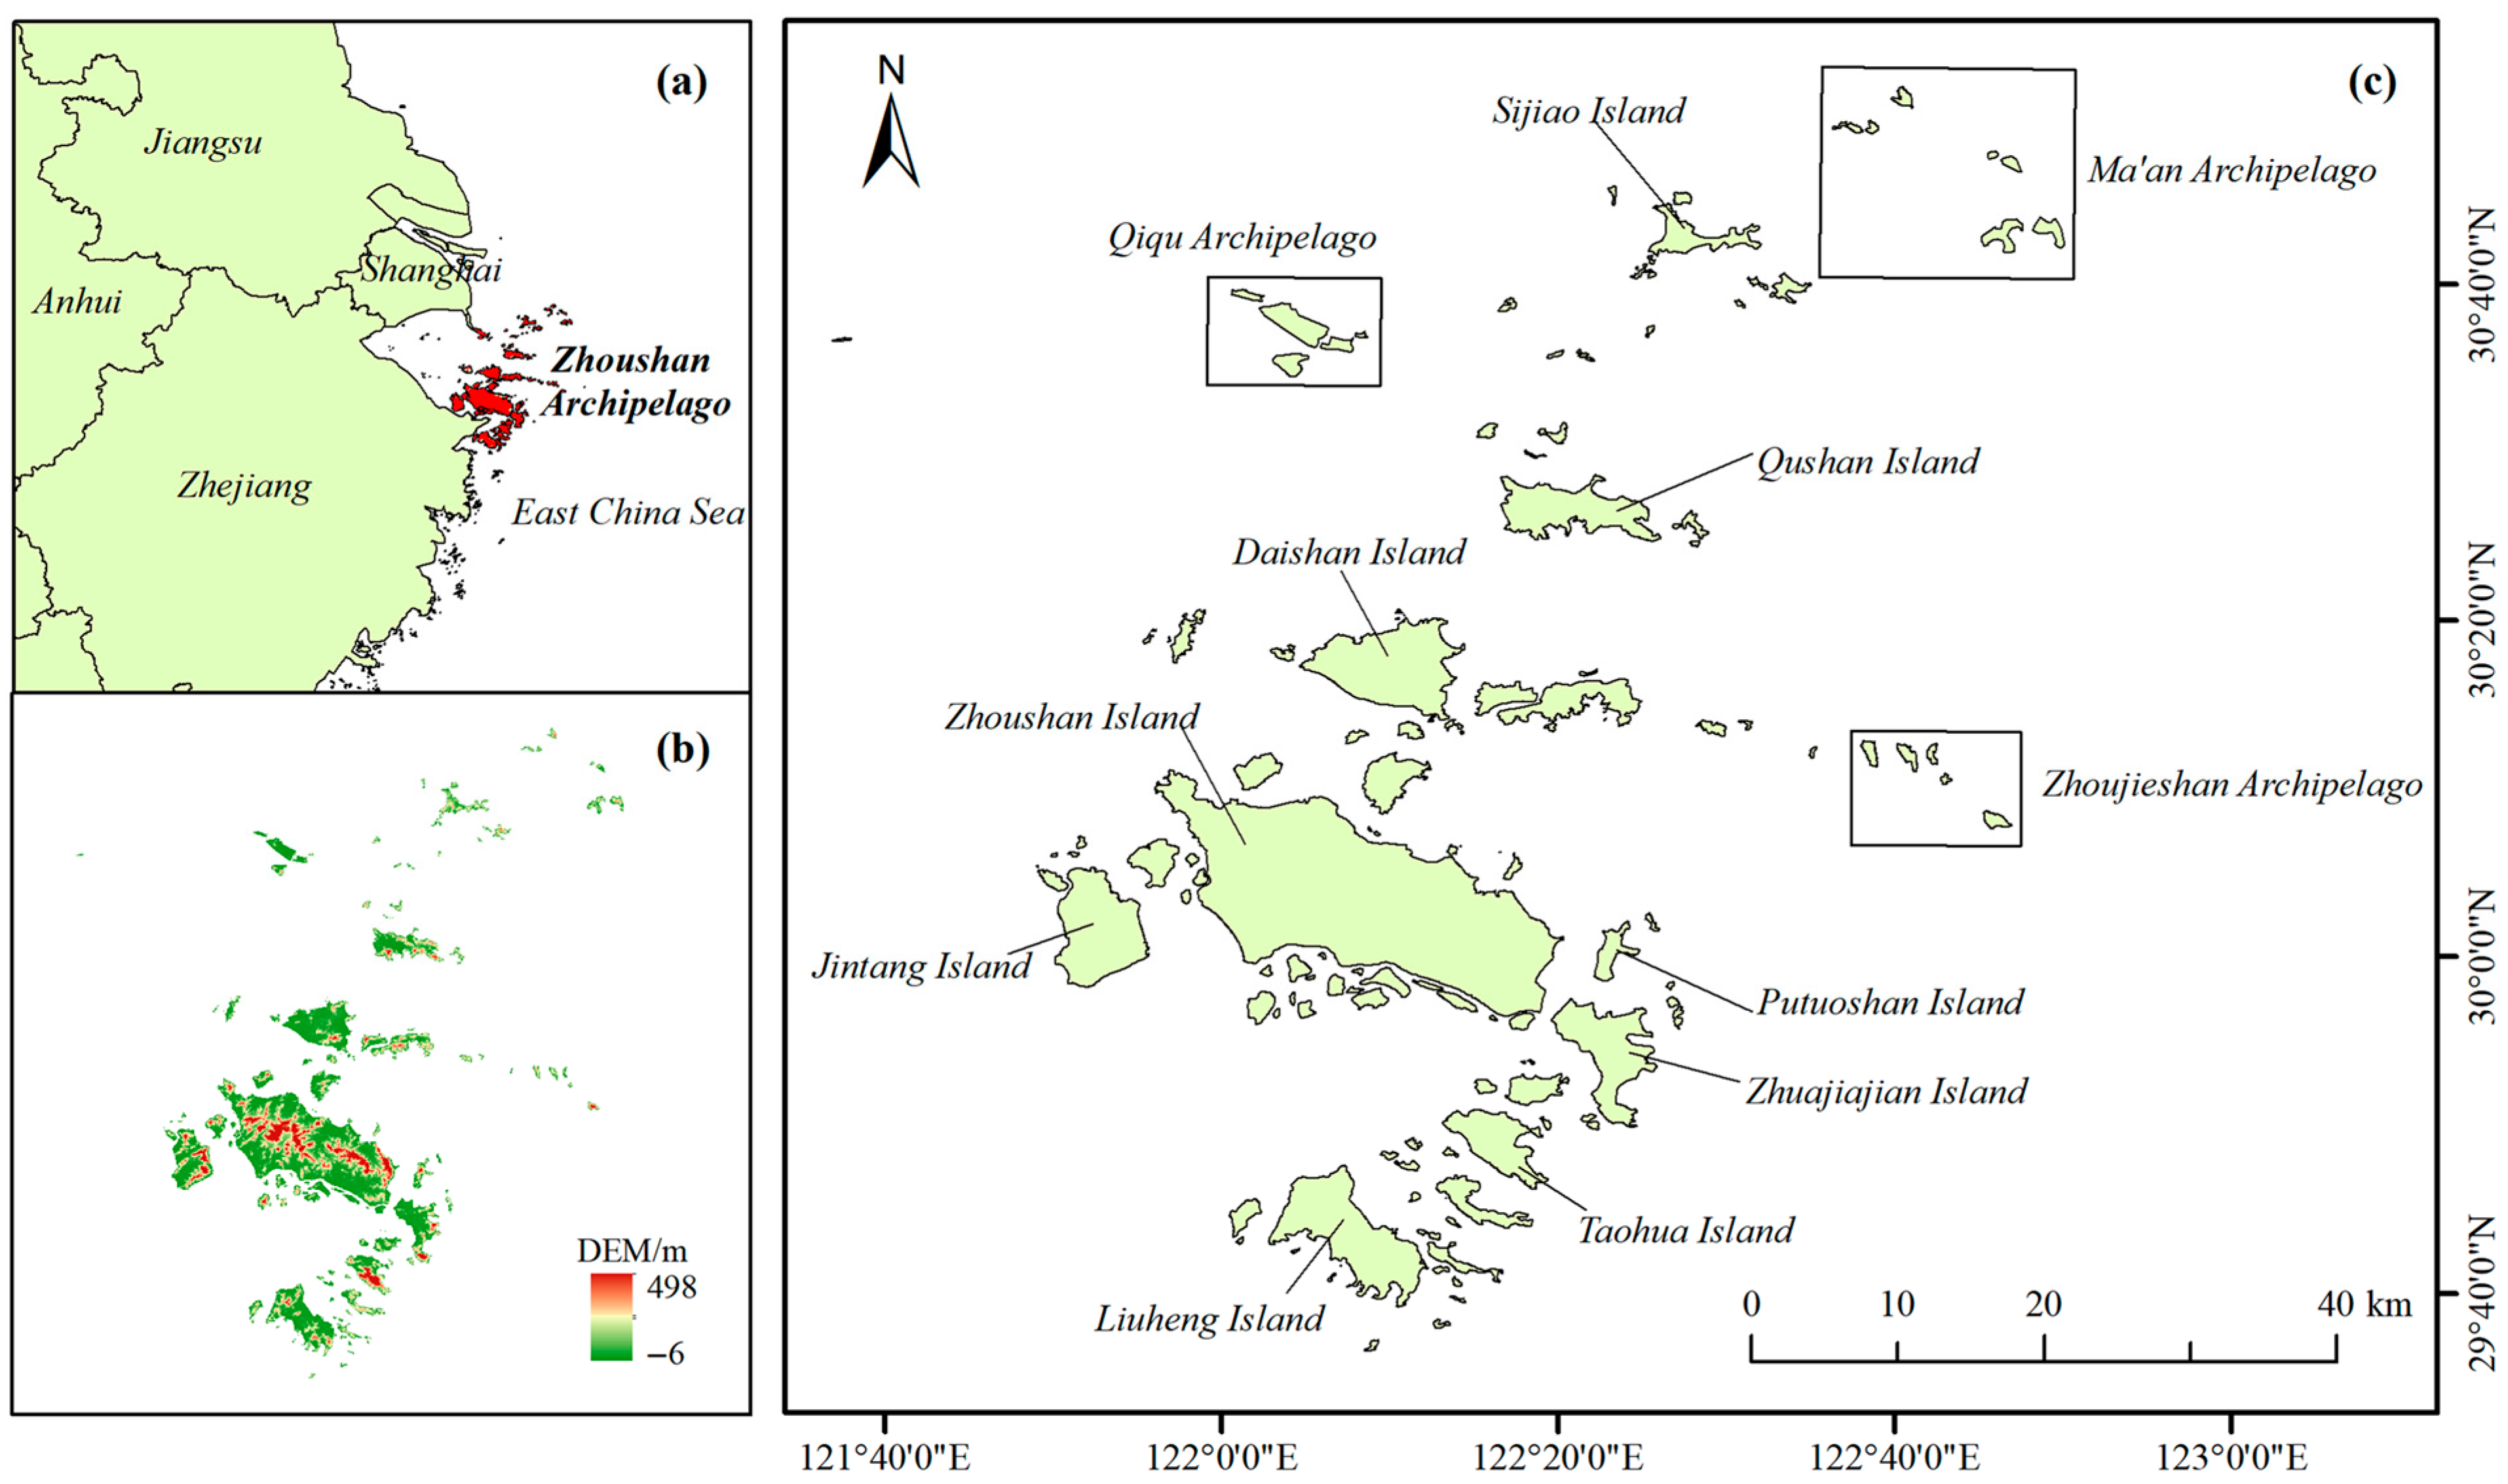
The Zhoushan Archipelago is located off China’s eastern coast and is the nation’s largest archipelago. Its geographical coordinates span between 29°32′ and 31°04′ north latitude and 121°30′ and 123°25′ east longitude. The archipelago includes a total of 2085 islands of various sizes, with a land area of 1440 km2. The terrain slopes from southwest to northeast. The dominant vegetation is evergreen broadleaf forest, characteristic of the subtropical maritime monsoon climate with four distinct seasons [29,30]. Natural resources are abundant, primarily consisting of fishery resources and harbor resources [31]. Between 2000 and 2020, the permanent population of the Zhoushan Archipelago steadily increased from approximately 1 million to about 1.16 million, while the GDP surged from approximately 11.4 billion yuan to about 151.2 billion yuan, transitioning from slow population growth to rapid economic expansion. This study covers all islands within the Zhoushan Archipelago, focusing on 12 representative islands and island groups: Zhoushan Island, Daishan Island, Qushan Island, Putuoshan Island, Liuheng Island, Zhujiajian Island, Taohua Island, Jintang Island, Sijiao Island, Ma’an Archipelago, Qiqiu Archipelago, and Zhongjieshan Archipelago. The specific distribution is shown in Figure 2.

2.2. Data Collection and Processing

Detailed information on the datasets used in this study is provided in Table 1. These include land use data, climate–vegetation data, and driver factor data covering the years 2000, 2010, and 2020. For spatial statistical analysis, all data were resampled to a 30 m resolution using ArcGIS 10.5 and unified into the same projection coordinate system: WGS_1984_UTM_Zone_51N.

2.3. Methods

2.3.1. ES Assessment

Professional models and tools for quantifying and mapping ESs have become increasingly diverse, with mainstream tools including InVEST, ARIES, and SolVES [40,41,42]. Among these, InVEST has become the most widely applied integrated assessment platform due to its advantages of parameter simplicity and explicit result visualization [43,44,45]. Therefore, this study selected InVEST software (version 3.16.2 Workbench) to quantitatively assess the water yield (WY), soil conservation (SC), carbon sequestration (CS), and habitat quality (HQ) of the Zhoushan Archipelago from 2000 to 2020. To ensure simulation accuracy, this study employed a model calibration approach combining regional field data with literature-derived parameters.
1.
Water Yield
This study employs the WY module within InVEST software. A model is constructed to quantify water production capacity at the grid cell level by incorporating factors such as spatial variations in soil permeability and evapotranspiration across different land use types, which influence runoff [46]. The specific calculation formula is as follows:
Y x   =   P x · ( 1 − AET x P x )
AET x PET x = 1 + ( PET x P x ) − [ ( 1 + ( PET x P x ) ω ) ] 1 ω
PET x = K c x · ETo x
ω x = Z · ( AWC x P x ) + 1.25
In the above equation, Y x represents the annual WY (mm) at grid cell x , P x denotes the annual mean precipitation (mm) at grid cell x , AET x signifies the actual annual mean evapotranspiration (mm), PET x denotes the annual average potential evapotranspiration (mm) at grid cell x , ω x represents a non-physical parameter reflecting natural climate and soil characteristics, K c x is the vegetation evapotranspiration coefficient, ETo x indicates the reference vegetation evapotranspiration (mm) at grid cell x , AWC x signifies the soil available water content (mm) at grid cell x , and Z is the seasonal constant.
2.
Soil Conservation
This study’s SC values were derived using the SC module within InVEST software. Calculated via the Universal Soil Loss Equation, they represent the difference between potential soil erosion under natural vegetation cover and actual erosion under managed conservation practices [47]. The specific calculation formula is as follows:
SDR = RKLS − USLE
RKLS = R × K × LS
USLE = R × K × LS × P × C
In the above equation, SDR denotes soil retention, R represents rainfall erosion potential, K is the soil erodibility factor, LS is the slope length gradient coefficient, P is the SC measure factor, and C is the vegetation and management factor.
3.
Carbon Sequestration
The CS module in InVEST software quantifies the CS of ecosystems. Total CS is calculated by summing the contributions from four components: aboveground biotic CS, belowground biotic CS, soil CS, and dead organic matter CS [48]. Specific carbon densities are shown in Table S1. The specific calculation formula is as follows:
C tot = C above + C above + C soil + C dead
In the above equation, C tot denotes total CS, C above represents aboveground biotic CS, C below represents belowground biotic CS, C soil denotes soil CS, and C dead represents dead organic CS.
4.
Habitat Quality
This study’s HQ was derived using the InVEST software HQ module. This module primarily determines HQ distribution and degradation patterns across the study area by analyzing the sensitivity of different land types to each threat source (Table S2) and habitat threat density data (Table S3). Biodiversity is then assessed based on HQ levels. The specific calculation formula is as follows:
Q xi = H i × [ 1 − ( D xi ( D xi + K ) z ]
In the above equation, Q xi represents the HQ score for land use type grid x , D xi denotes the cumulative threat level experienced, H i indicates the habitat suitability of the land use type, K is the semi-saturation parameter, and z is the normalization constant.

2.3.2. Cold Spot and Hot Spot Analysis

Cold spot and hot spot analysis serves as an effective tool for revealing the spatial heterogeneity and clustering characteristics of ESs [49,50]. Therefore, to better analyze the spatial distribution patterns of ESs in the Zhoushan Archipelago, this study employs cold spot and hot spot analysis to identify areas with significant high- or low-value clusters within the quantitative spatial data of ESs in the archipelago. The specific calculation formula is as follows:
G i * = ∑ i = 1 n w ij x i − x ¯ ∑ i = 1 n w ij S n ∑ i = 1 n w ij 2 − ( ∑ i = 1 n w ij ) 2 n − 1
In the above equation, G i * represents the statistical value of factor i , x i denotes the attribute value of factor i , w ij indicates the spatial weight between factors i and j , x is the average value of all factor attribute values, S is the standard deviation of the attribute values, and n is the total number of factors.

2.3.3. Ecosystem Service Index

The ecosystem service index (ESI) can assess the overall quality of multiple ESs provided by a single ecosystem, and its results can serve as a reference for ecosystem conservation and management [51]. In this study, equal weighting was adopted to aggregate individual ecosystem services, based primarily on the following three considerations: First, equal weighting reflects the principle of policy neutrality. In the absence of clear stakeholder preferences or policy priorities, using equal weights as a “neutral default” avoids a priori bias toward any particular service. Second, this study is exploratory in nature. As a preliminary diagnostic of regional ecosystem services, the existing empirical knowledge is insufficient to support differential weighting, and the equal weighting method helps to avoid subjective assumptions that could potentially interfere with the research findings. Third, equal weighting aligns with the core philosophy of the United Nations 2030 Agenda for Sustainable Development, which emphasizes that the Sustainable Development Goals are “integrated and indivisible.” The use of equal weights thus reflects a balanced consideration of the economic, social, and environmental dimensions of sustainability [52]. The specific calculation formula is as follows:
ESI = ∑ i = 1 n E S i × W i
In the above equation, ESI represents the normalized ecosystem service, and W i represents the weight. In this study, all ESs are assigned equal weight.

2.3.4. Driver Factor Analysis

A geographical detector, which requires no predefined functional form, can both quantitatively measure single-factor explanatory power and identify multi-factor interactions. It has been proven to be a robust tool for revealing the mechanisms driving spatial differentiation [53,54]. The formation and evolution of ESs is a highly complex process involving the influence of both natural environmental factors and socio-economic factors [55]. Therefore, based on the characteristics of the study area and considering both natural and socio-economic conditions, ten drivers were selected: digital elevation model (DEM), slope, average annual precipitation (AP), annual average temperature (AT), normalized difference vegetation index (NDVI), land use/land cover (LULC), soil type (ST), distance to the coastline (DTTC), population density (POP), and GDP. The specific calculation formula is as follows:
q = 1 − ( ∑ i = 1 n N i σ i 2 ) N σ 2
In the above equation, q represents the degree of influence exerted by the driving factor on the spatiotemporal distribution of ESs, varying from 0 to 1. The closer q is to 1, the stronger the explanatory power of the factor over the spatial distribution of the target variable; conversely, the explanatory power is weaker. Here, i = 1, 2, …, where i denotes the i -th driver variable layer, n represents the number of driver samples, N and N i denote the ES quantities in the study area and the i -th study area, respectively, and σ 2 and σ i 2 denote the variances of N and N i , respectively.

2.3.5. Trade-Off/Synergy Analysis

Quantitatively assessing the direction and strength of interactions among ESs is a prerequisite for identifying key constraints, reducing trade-offs losses, and enhancing synergistic gains. Statistical analysis methods, capable of rapidly diagnosing relationships among services, have become a widely adopted approach for exploring trade-off/synergy relationships between ESs [56,57,58]. Spatial distribution maps of trade-offs and synergies can accurately identify areas where ecosystem services either trade off against each other or improve synergistically, thus enabling the visual diagnosis of regional ecological conflicts. On this basis, high-trade-off areas should be designated as priority control and key restoration zones, while high-synergy areas should be classified as conservation and optimization zones. This directly guides the prioritization of ecological protection and land use decision making and improves the relevance and efficiency of management.
1
Global Spatial Autocorrelation Analysis
Global spatial autocorrelation analysis exhibits high spatial sensitivity and strong visualization capabilities [59]. This study employs Moran’s I index to identify and evaluate whether spatial geographic data of ESs within the study area exhibit clustered, dispersed, or random distribution patterns. The specific calculation formula is as follows:
I = n W ∑ i = 1 n ∑ j = 1 n W ij ( x i − x ¯ ) ( x j − x ¯ ) ∑ i = 1 n ∑ j = 1 n W ij
W = ∑ i = 1 n ∑ j = 1 n W ij
In the above equation, I represents Moran’s local index, n denotes the total number of spatial units within the study area, W ij is the spatial weight matrix between units i and j , x i and x j are the attribute values of spatial units i and j , respectively, x ¯ is the average value of all spatial unit attributes, and W is the sum of all spatial weights.
2
Pearson Correlation Analysis
Pearson correlation analysis can rapidly identify linear relationships between variables. A negative correlation coefficient between two variables indicates a trade-off relationship, whereas a positive coefficient signifies a synergistic relationship [60]. The specific calculation formula is as follows:
r = ∑ i = 1 n ( x i − x ¯ ) ( y i − y ¯ ) ∑ i = 1 n ( x i − x ¯ ) 2 ∑ i = 1 n ( y i − y ¯ ) 2
In the above equation, r is the correlation coefficient. A positive value indicates synergies, while a negative value indicates trade-offs. x and y represent two sets of variables, x ¯ and y ¯ denote the sample means, and n is the sample size.
3
Geographically Weighted Regression
Geographically weighted regression effectively captures the spatial heterogeneity and non-stationarity of ES parameters by directly embedding spatial location information into the model [61]. Compared with traditional regression models, geographically weighted regression can more accurately identify and characterize the spatial differentiation patterns of relationships among ESs [62]. The specific calculation formula is as follows:
Y i = β 0 ( a i , b i ) + ∑ i = 1 k β k ( a i , b i ) X ik + ε i
In the above equation, Y i and X ik denote the observed values of the i-th set of dependent variables and independent variables in space, respectively. k represents the number of independent variables. ( a i , b i ) are the geographic coordinates of the i-th grid cell. β 0 ( a i , b i ) is the constant term of the regression model. β k ( a i , b i ) is the value of the continuous function at the i-th grid point. ε i is a random error term.

3. Results

3.1. ESs of the Zhoushan Archipelago

Table 2 presents the changes in the total volume and regional averages of ESs in the Zhoushan Archipelago from 2000 to 2020. Overall, the total ESs in the region exhibited a declining trend during this period, indicating a comprehensive degradation of the four ES functions. Specifically, WY and SC followed a similar pattern, initially increasing from 2000 to 2010 before declining sharply by 2020, with cumulative reductions of 1.74 × 108 mm and 5.88 × 10⁶ tons, respectively. In contrast, CS decreased modestly in the first decade but showed a slight recovery afterward, resulting in a net decline of 0.27 × 10⁶ tons. HQ continuously declined throughout the period, with its index falling from 0.52 to 0.45. With the exception of CS’s minor rebound, all other services experienced varying degrees of overall decline, reflecting increasing pressure on the region’s ecological sustainability.
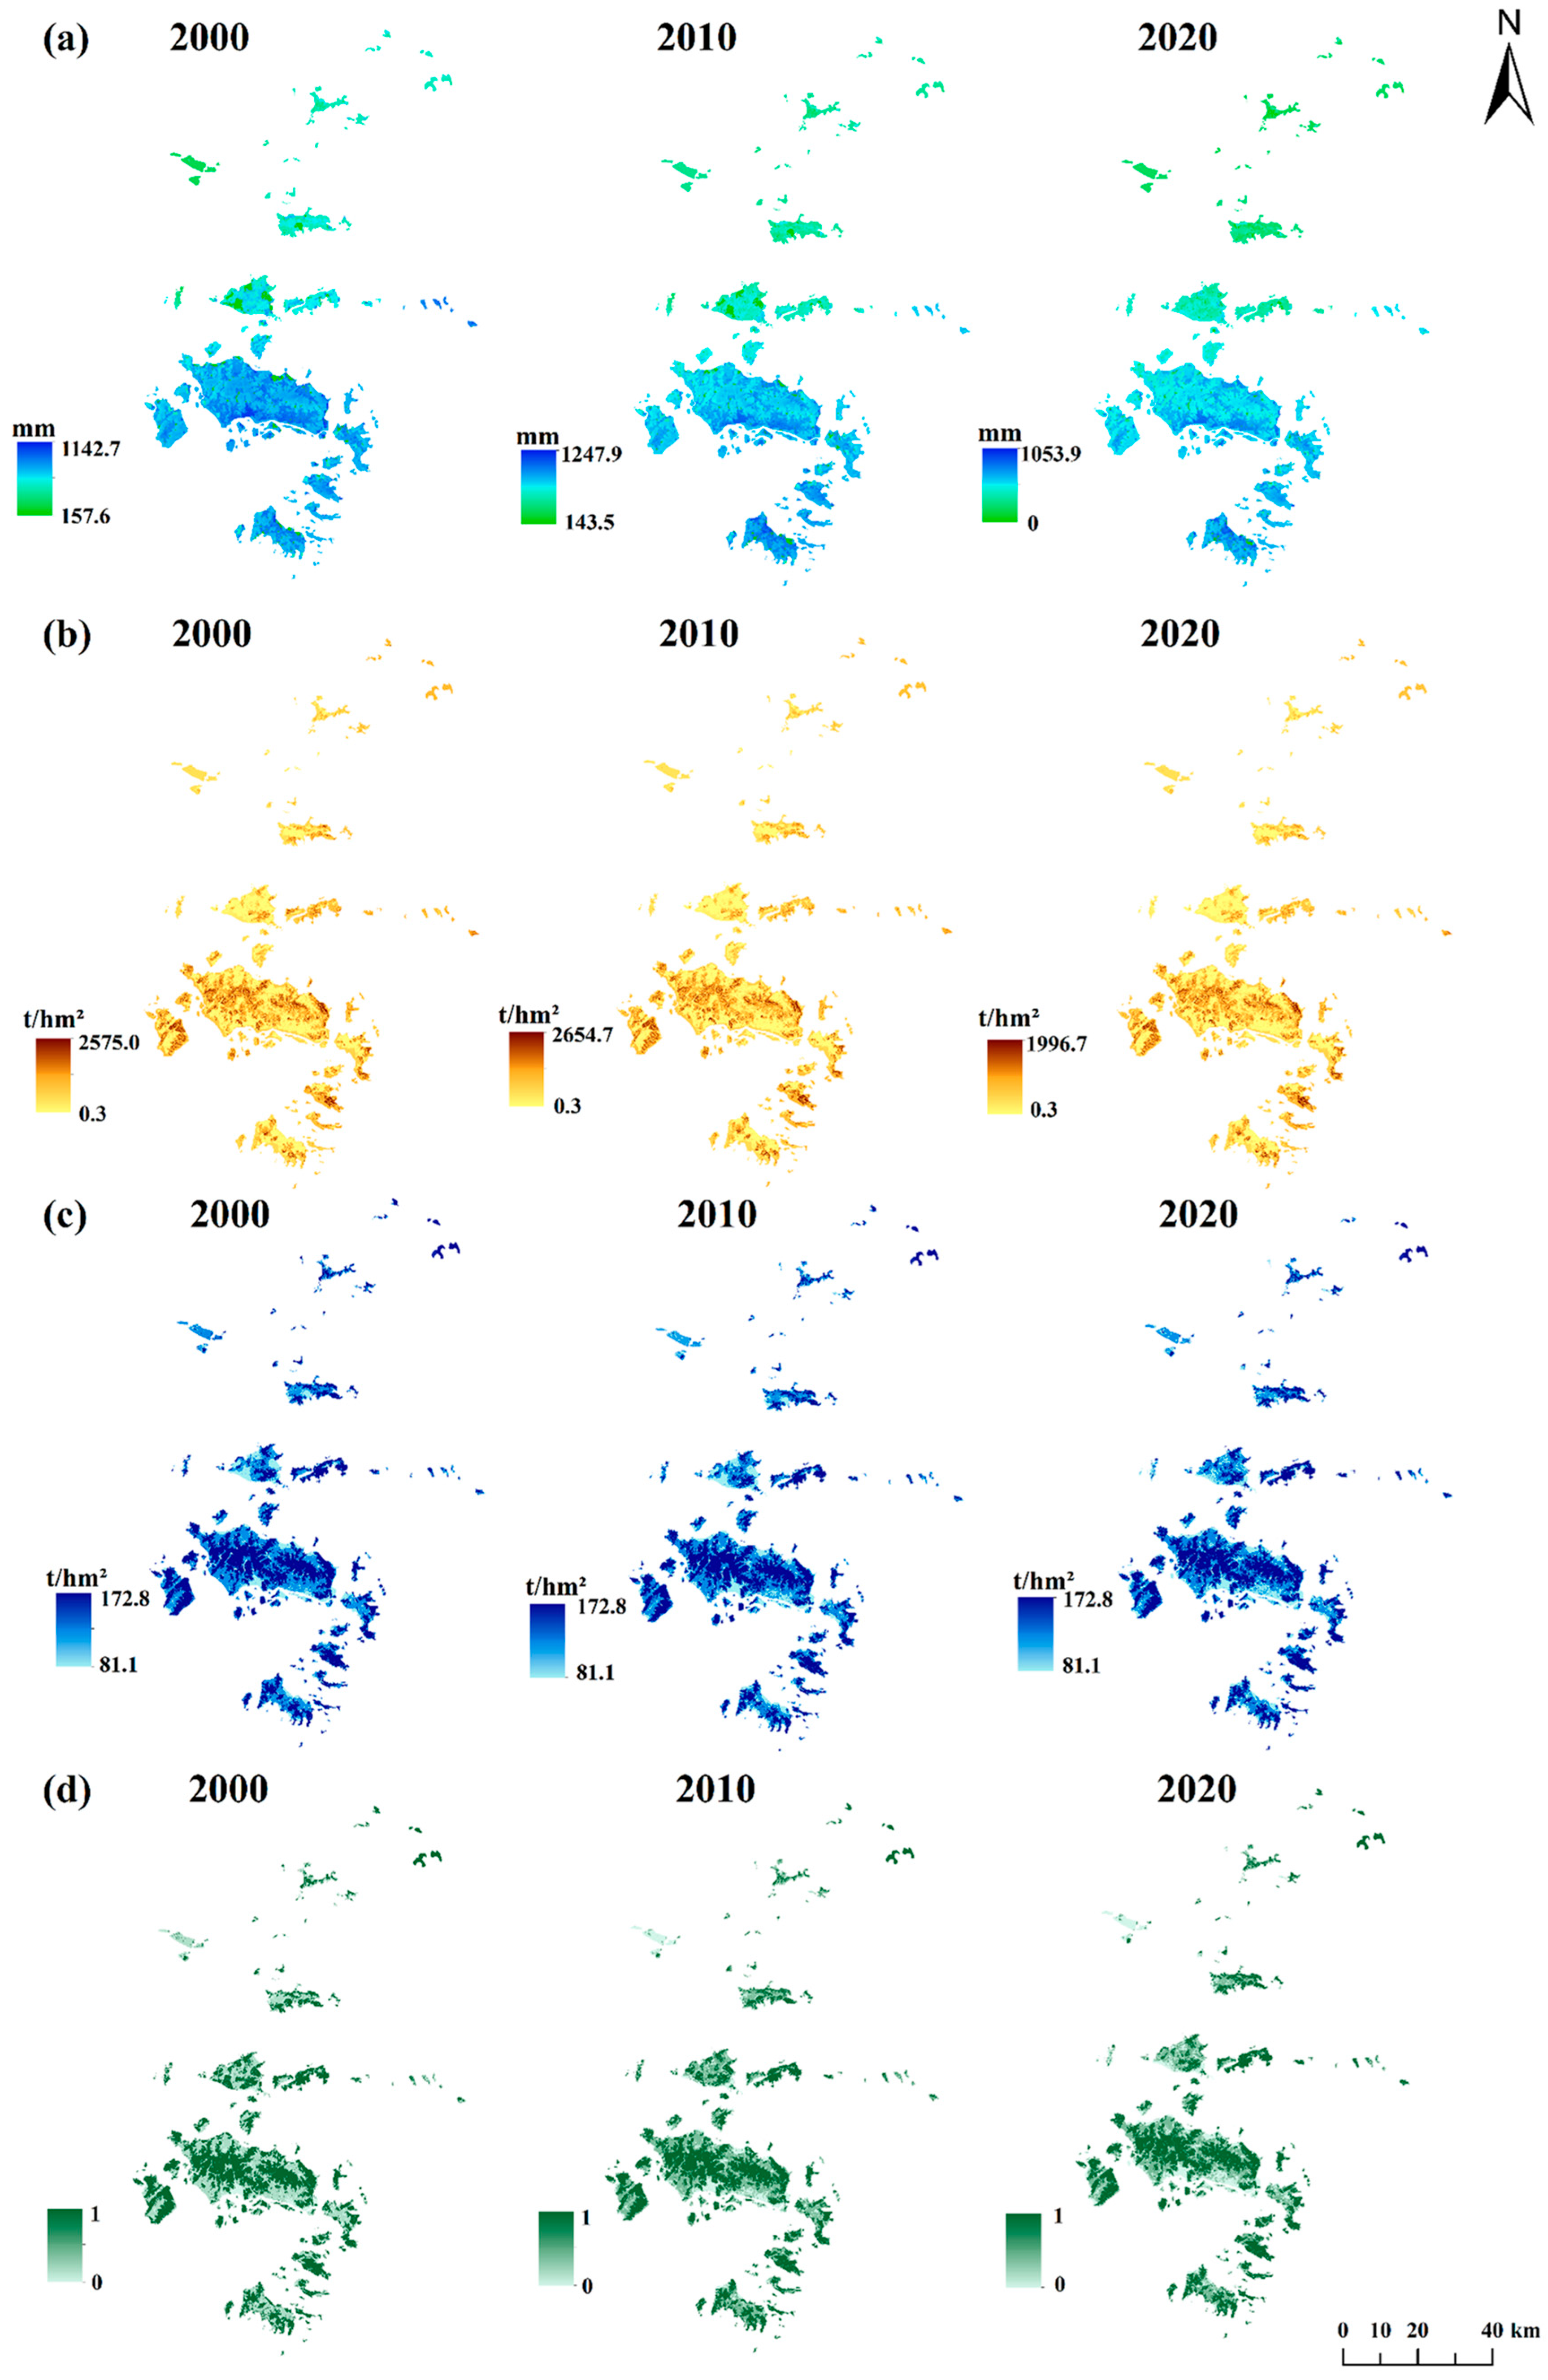
Figure 3 illustrates the spatial distribution of the four ESs in the Zhoushan Archipelago from 2000 to 2020. Overall, ESs in the region exhibited a “higher in the south, lower in the north” pattern during this period, though notable variations were observed across different islands. This spatial heterogeneity reflects the combined influence of topographic complexity and differential anthropogenic pressure across the archipelago.
As shown in Figure 3a, the spatial distribution of WY indicates that high-value areas are predominantly concentrated in the southern and eastern parts of the archipelago, including Zhoushan Island, Putuo Island, Zhujiadian Island, Taohua Island, Liuheng Island, and the Zhongjieshan Islands. These areas likely exhibit enhanced water retention capacity due to higher precipitation and greater forest cover. Among these, Zhoushan Island, Daishan Island, Putuo Island, and Jintang Island experienced the most pronounced decline in WY over the two decades. This decline is likely associated with rapid urban expansion. Urban expansion reduces natural infiltration zones, particularly in areas relatively close to the coastline. Low WY values were primarily distributed in the northwestern region of the archipelago, such as Sijiao Island, the Qiqu archipelago, and the Ma’an Archipelago. These islands exhibit flat topography and limited vegetation cover, resulting in reduced water retention and higher surface runoff coefficients.
The spatial distribution of SC is presented in Figure 3b. High-value areas are mainly located in the southern part of the archipelago, particularly in central Zhoushan Island and the eastern regions of Jintang Island, Zhujiajian Island, and Taohua Island. These areas likely exhibit steep slopes and dense vegetation cover, thereby enhancing soil stability. In contrast, SC capacity is generally low on islands to the north of Zhoushan Island. This likely reflects gentler slopes and higher agricultural intensification on northern islands, thereby reducing vegetation-mediated soil protection.
Figure 3c displays the spatial distribution of CS. Low-value areas are concentrated in coastal zones across various islands, with notable clusters on Daishan Island, the Qiqiu Islands, and Zhujiajian Island. The low CS in these coastal areas reflect more intensive urbanization in these regions. Between 2000 and 2020, changes in both high-value and low-value areas for SC and CS primarily occurred along their boundary regions. This spatial shift in distribution is likely driven by land use transitions (e.g., conversion from forest to construction land), which mediate the spatial relocation of service provision and create transition zones where service degradation is most active.
The spatial distribution of HQ is shown in Figure 3d. High-value zones remain stable on islands with favorable natural conditions, such as the Ma’an Archipelago, likely due to limited human access that has preserved habitat integrity and ecological connectivity. Low-value zones exhibit an expansion trend in areas with high development intensity, such as Jintang Island and the northeastern coastal areas of Zhoushan Island. At the end of the study period, CS exhibited a partial recovery trend, whereas HQ continued to decline. This asynchronous dynamic reveals the complexity of ecosystem service recovery. We hypothesize that this may be because the recovery of carbon storage is mainly driven by the planting of fast-growing economic forests. Although these tree species can rapidly accumulate biomass carbon, their simplified understory structure and the use of chemical inputs fail to effectively support the habitat requirements of native species, thereby leading to the continued deterioration of habitat quality.
Figure S1 shows the spatial changes in four ecosystem services in the Zhoushan Islands from 2000 to 2020. The changes in ecosystem services in the Zhoushan Islands during this period are characterized by an “overall trend of decrease with individual variations.” Over the two decades, WY exhibited a large-scale decreasing trend, with sporadic increases only in the central part of the Zhoushan Islands, specifically in the coastal areas of Daishan Island and the central part of Qushan Island. The changes in SC over the two decades were largely similar to those of WY, showing an overall trend of widespread decrease, indicating a certain correlation between SC and WY. Areas with no change were scattered sporadically across each island for SC. From 2000 to 2020, CS remained largely unchanged overall. Increased areas were only found in the central Zhoushan Islands, scattered in the coastal areas of Daishan Island and Zhoushan Island. Decreased areas were located on islands in the northwestern and northeastern parts of the Zhoushan Islands, mainly the Yangshan Islands, Huaniao Island, Gouqi Island, and Shengshan Island. For HQ, between 2000 and 2020, the central parts of the islands remained largely unchanged, while the island edges experienced increases, and the offshore areas near the islands experienced decreases.
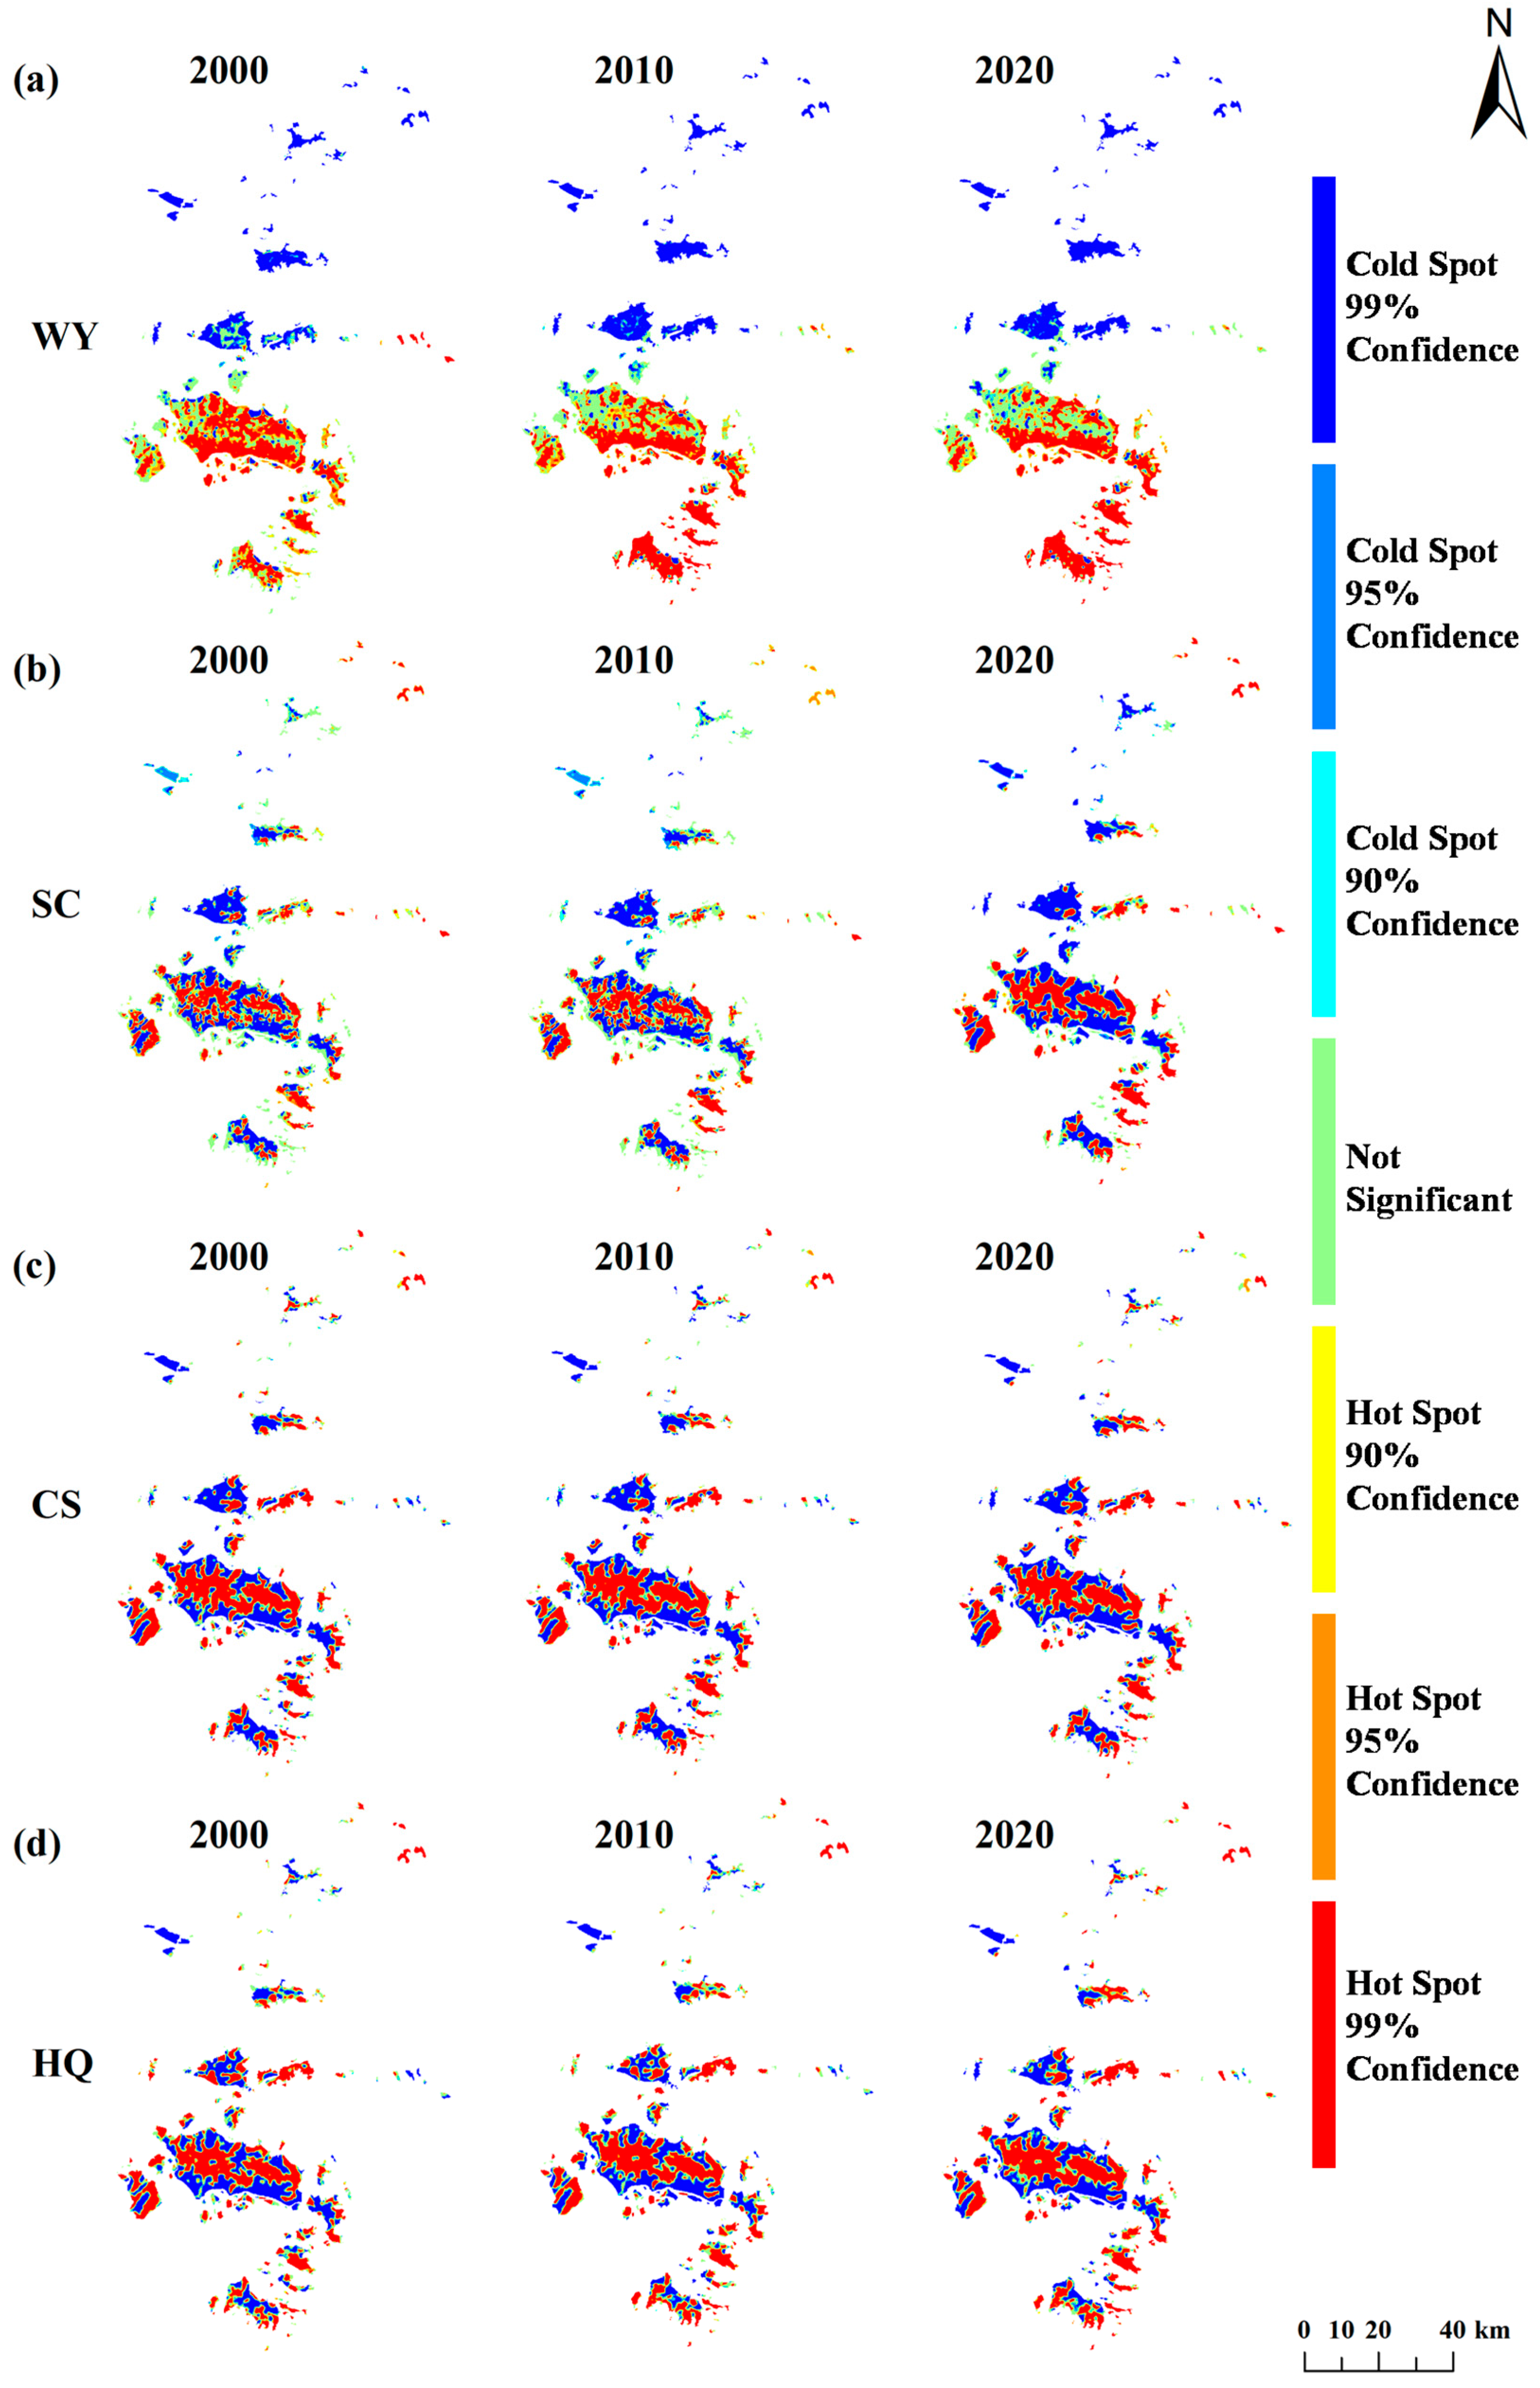
As shown in Tables S4–S7 and Figure 4, the analysis of cold and hot spots for the four ESs from 2000 to 2020 reveals critical spatial patterns for understanding regional sustainability. Overall, except for HQ, the areas of extreme hot spots and extreme cold spots for the other three services all exhibited an increasing trend from 2000 to 2020. Significant changes were concentrated in core development islands (Zhoushan Island, Daishan Island, and Liuheng Island), Sijiao Island, and the Qiqu archipelago, indicating a trend toward spatial polarization in the supply of these services.
Specifically, according to the cold–hot spot analysis results for WY (Table S4, Figure 4a), the area of cold spots for WY increased, with the proportion of extreme cold spots rising from 22.78% to 25.57%, while its hot spot area decreased but became more concentrated, with extreme hot spots growing from 32.63% to 35.38%. This indicates that both extreme low-value and high-value areas of WY have further spatially concentrated. Regarding SC (Table S5, Figure 4b), both extremes intensified markedly: extreme cold spots surged from 28.40% to 37.87%, and extreme hot spots rose from 25.46% to 34.29%. The simultaneous expansion of low-value and high-value clusters for WY and SC, with core development islands (e.g., Zhoushan Island) becoming hotspots of service supply while peripheral areas (e.g., Sijiao Island and Qiqu archipelago) increasingly becoming cold spots, may be related to divergent land use intensities. In terms of the cold and hot spot distributions of CS (Table S6, Figure 4c), both its cold spot area and hot spot area exhibited minimal fluctuations between 2000 and 2020. Changes were confined to localized transitions between cold and hot spots at the boundaries of existing clusters across the islands, indicating a relatively stable spatial pattern. Regarding HQ (Table S7, Figure 4d), it exhibited a distinct trend: its cold spot area slightly decreased, while its hot spot area expanded significantly, with the proportion of extreme hot spots rising from 39.28% to 44.25%. The most pronounced changes in extreme cold and hot spots were observed on Zhoushan Island, Daishan Island, and Liuheng Island.
From a sustainability perspective, the increasing spatial divergence in WY and SC highlights the need for targeted management strategies. The relative stability of CS and the expansion of HQ hot spots offer opportunities for synergistic planning. These spatial dynamics underscore the importance of balancing development and conservation in the Zhoushan Archipelago to achieve regional sustainability goals.
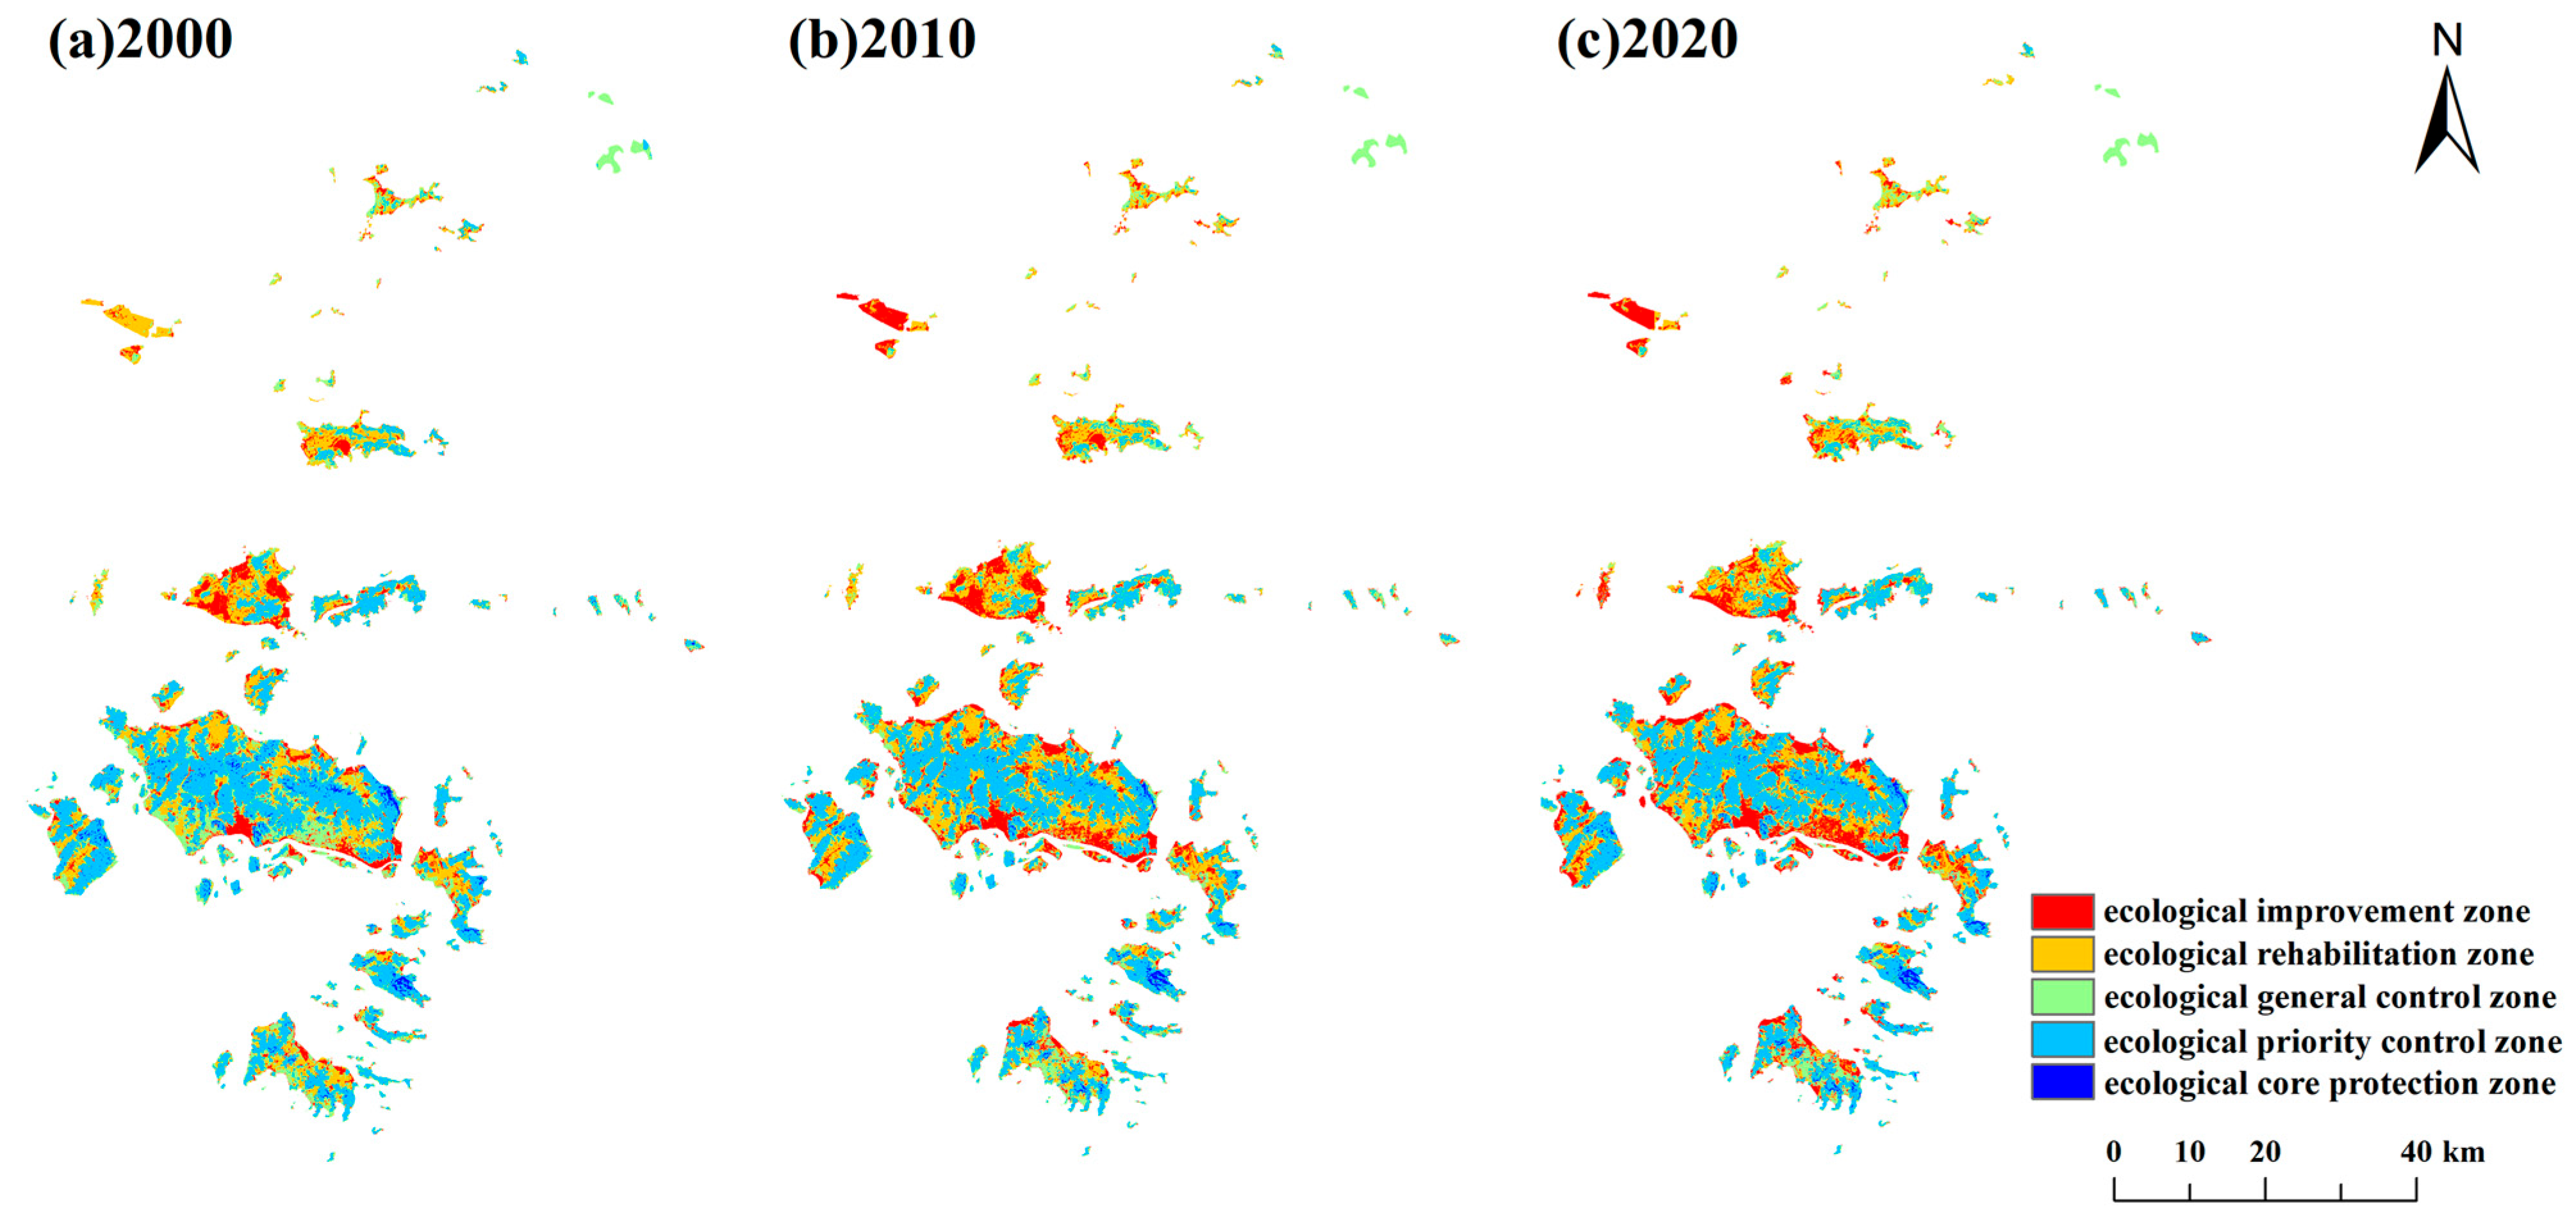
To develop more refined management strategies, regions were classified into five distinct sustainability-oriented functional zones based on the ESI in ascending order of ESI value. Areas with an ESI less than 1.30 are classified as ecological improvement zones. Areas with an ESI greater than 1.30 but less than 1.75 are designated as ecological rehabilitation zones. Areas with an ESI greater than 1.75 but less than 2.50 are defined as ecological general control zones. Areas with an ESI greater than 2.50 but less than 3.00 are categorized as ecological priority control zones, and areas with an ESI greater than 3.00 are identified as ecological core protection zones. As shown in Table S8, which presents the changes in the area of these five functional zones from 2000 to 2020, the area of ecological improvement zones increased by 129.20 km2 during this period, accounting for 9.14% of the total regional area. In contrast, the other four zones all exhibited a declining trend in area.
Figure 5 illustrates the detailed spatial zoning of the functional areas. Overall, the ecological core protection zones are primarily distributed in the coastal areas of Zhoushan Island and Taohua Island, with their area decreasing to 17.32 km2 by 2020. The ecological priority control zones are located in central Zhoushan Island, eastern Jintang Island, Putuo Island, Taohua Island, Liuheng Island, and Qushan Island. The ecological general control zones are mainly found in the Ma’an Archipelago and the southwestern part of Liuheng Island. The ecological rehabilitation zones are predominantly distributed in the Qiqu archipelago, Daishan Island, Zhoushan Island, and Qushan Island. The ecological improvement zones are situated in the coastal areas of the Qiqu archipelago, Daishan Island, and Zhoushan Island. Specifically, the most notable changes in functional zoning occurred in the Ma’an Archipelago and Zhoushan Island, where areas previously classified as ecological rehabilitation zones and ecological general control zones have shifted to ecological improvement zones. This indicates a degradation in the ecosystem service capacity of these regions. The above ESI-based hierarchical zoning is sustainability oriented, integrating the management of ecosystem spatial heterogeneity into the framework of sustainable development. This zoning system enables the precise identification of areas experiencing degradation in ecosystem service functions. In subsequent ecological restoration and spatial management efforts, these areas should be prioritized as key intervention targets to curb the degradation trend, foster positive ecological succession, and ultimately achieve sustainable development in these regions.

3.2. Results of the Driving Factor Analysis

Figure S2 presents an analysis of the driving factors influencing the spatial distribution of ESs in the Zhoushan Archipelago from 2000 to 2020. The results indicate that both natural and socio-economic driving factors collectively shape the spatial distribution of ESs in the region, with notable shifts in dominant drivers over time that reflect the region’s evolving human–nature interactions. These drivers represent critical leverage points for sustainability management. To identify the core drivers of ES spatial heterogeneity in the Zhoushan Archipelago, this study selected the three most influential driving factors as the primary determinants.
Across all three time periods, LULC, AP, and NDVI consistently emerged as primary drivers, though their relative importance varied by service and year. WY was persistently dominated by AP (q-values: 0.3096–0.3443), reflecting the hydrological dependence of island systems on atmospheric inputs. In contrast, SC, CS, and HQ were more strongly influenced by LULC and topographic factors (DEM and slope). Specifically, socio-economic influence emerged in 2010, with GDP becoming a detectable driver for WY (q-values: 0.0718), signaling the incipient role of economic development in hydrological processes. The driving structure for most services remained relatively stable between 2000 and 2010, with LULC and NDVI maintaining dominance for CS and HQ. And most strikingly, by 2020 all services except WY exhibited a pronounced shift toward “topography dominance”. DEM and slope became the primary drivers for SC (DEM: 0.2577; slope: 0.1808), CS (DEM: 0.3933; slope: 0.3268), and HQ (DEM: 0.3933; slope: 0.3268), while the relative influence of LULC declined. This increasing topographic control in later years suggests that as lowland areas become saturated with human activity, ES provision may become increasingly constrained to steeper, less accessible terrain where natural topographic gradients exert stronger relative control. In summary, the spatial distribution of ESs in the Zhoushan Archipelago is predominantly influenced by LULC, AP, DEM, slope, and NDVI.

3.3. Trade-Off/Synergy Analysis Results

3.3.1. Result of Global Spatial Autocorrelation Analysis

This study selected grid sizes of 30 m × 30 m, 100 m × 100 m, 300 m × 300 m, 500 m × 500 m, and 1000 m × 1000 m for the spatial characterization analysis of the four ESs in the Zhoushan Archipelago. As shown in Table S9, the 100 m × 100 m grid exhibited the strongest global spatial autocorrelation for ESs. Therefore, this study employed 100 m × 100 m grid data for Moran’s I index analysis. The results, presented in Table S10, show that from 2000 to 2020, the Moran’s I indices for WY, SC, CS, and HQ consistently remained above 0, ranging approximately from 0.28 to 0.65, and were statistically significant at the 0.001 level (p < 0.001). This indicates that all four ES categories exhibited significant positive spatial autocorrelation characteristics during the 2000–2020 period.

3.3.2. Result of Pearson Correlation Analysis

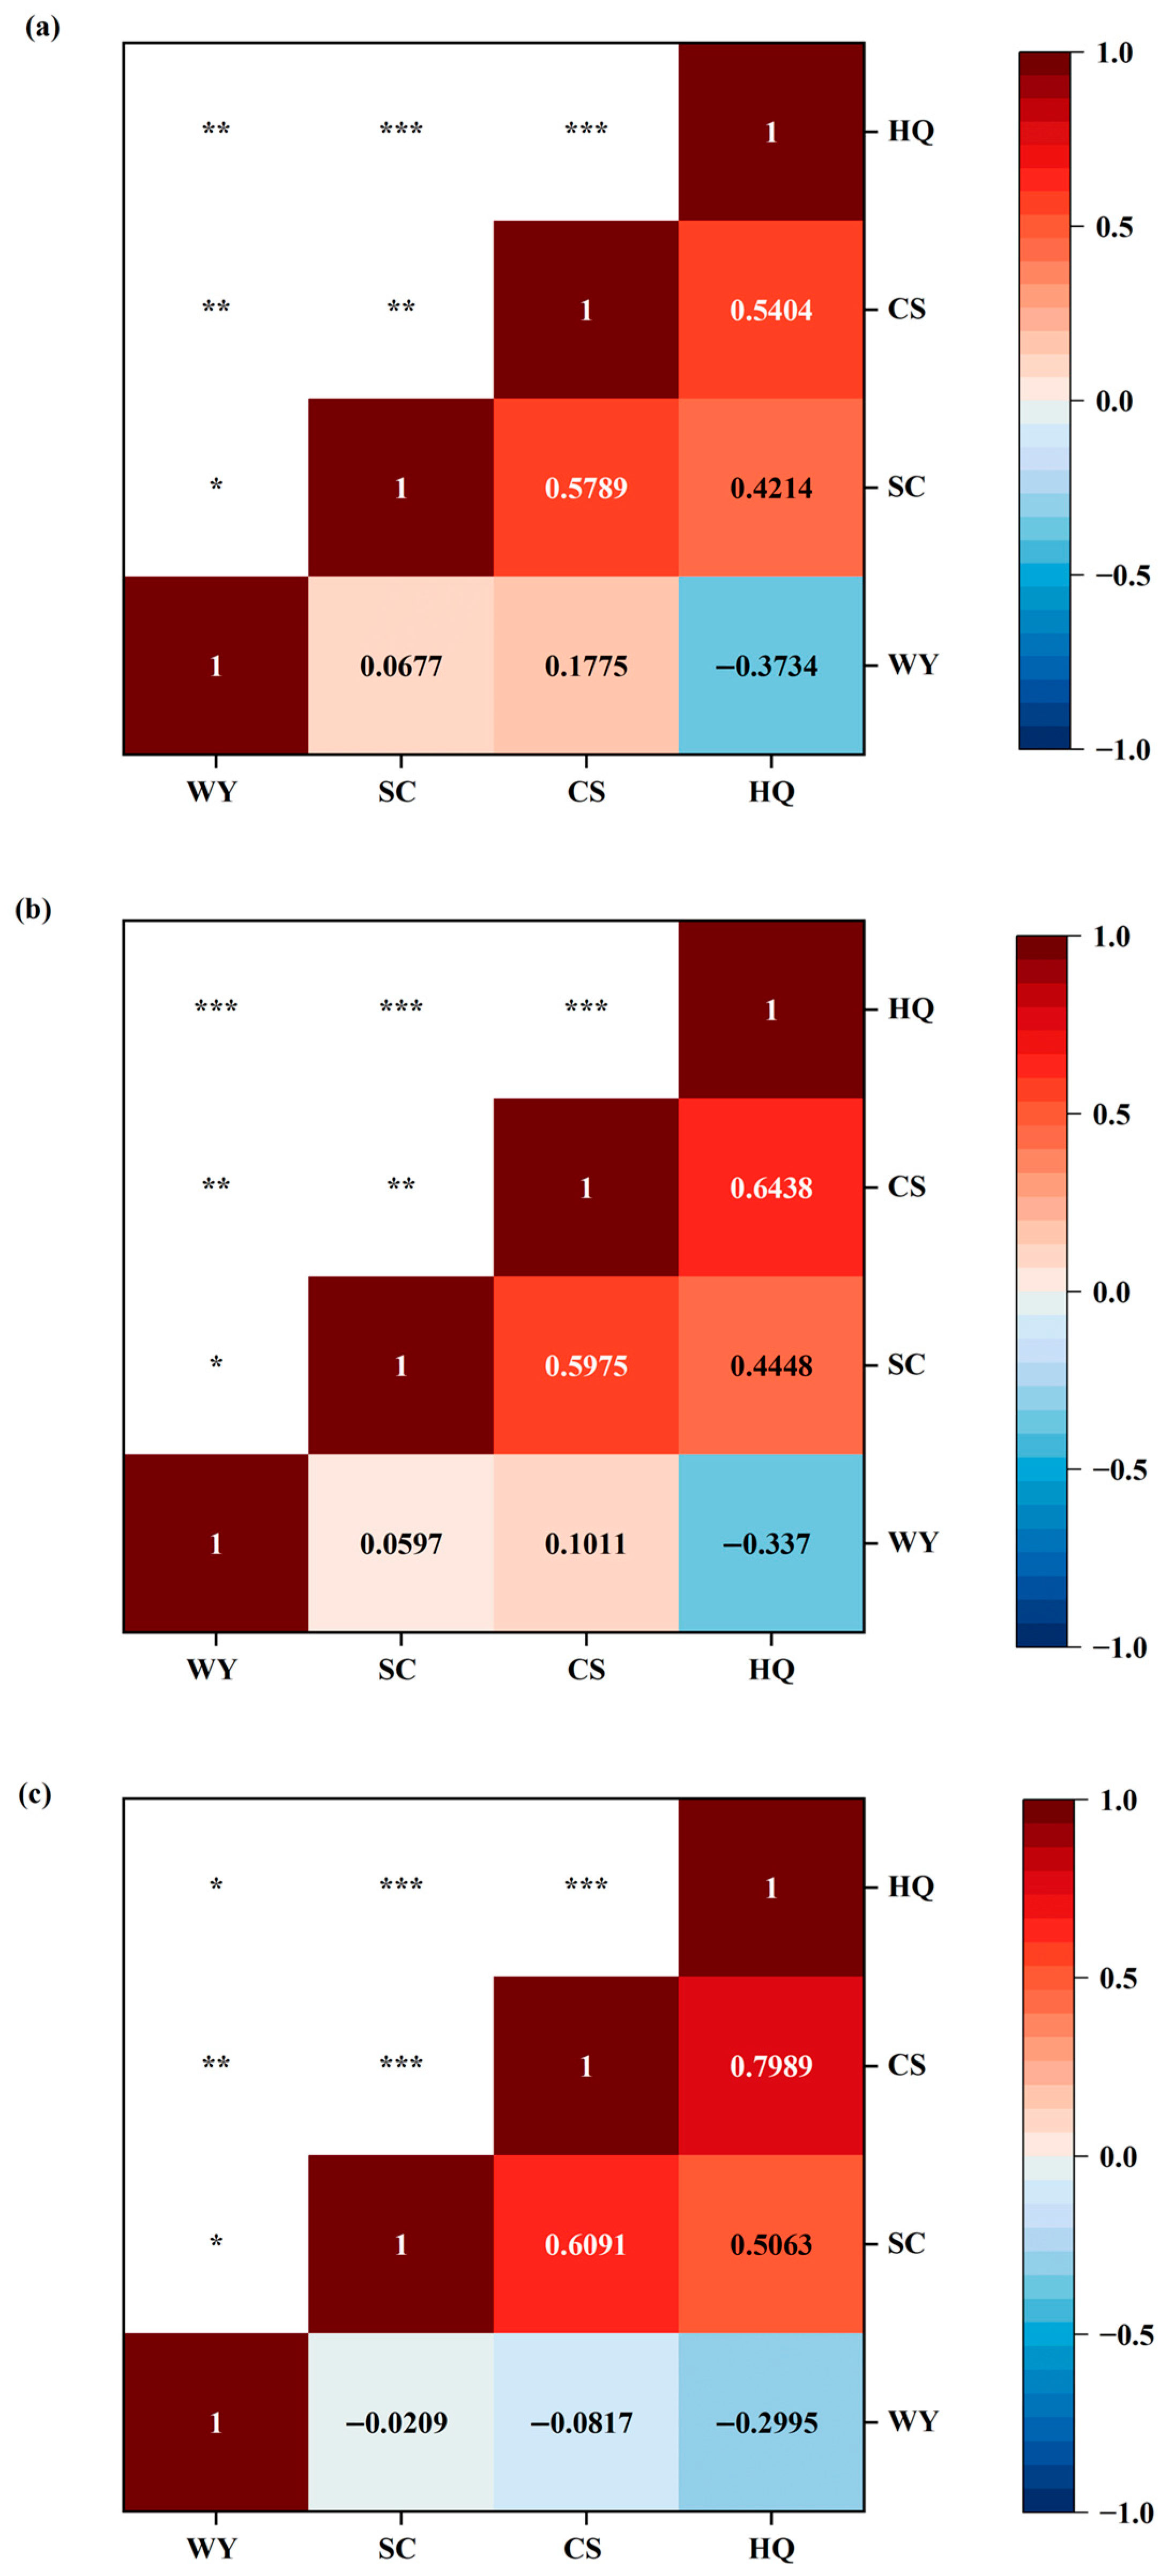
As illustrated in Figure 6, the overall trade-offs/synergies among different ESs are presented. From 2000 to 2020, a coexistence of trade-off/synergy relationships was observed among the four ESs, and these relationships underwent dynamic changes. Specifically, in 2000 and 2010, the relationships between WY and SC as well as between WY and CS were both weakly synergistic, though the synergies weakened over time. By 2020, these relationships had shifted to weak trade-offs. Throughout the 2000–2020 period, the relationship between WY and HQ remained trade-offs, albeit with a decreasing intensity over time. In contrast, the relationships between SC and CS, SC and HQ, and CS and HQ consistently exhibited synergies, with their strength increasing over time. This indicates that the balance among SC, CS, and HQ in the Zhoushan Archipelago is gradually optimizing.

3.3.3. Result of Geographically Weighted Regression

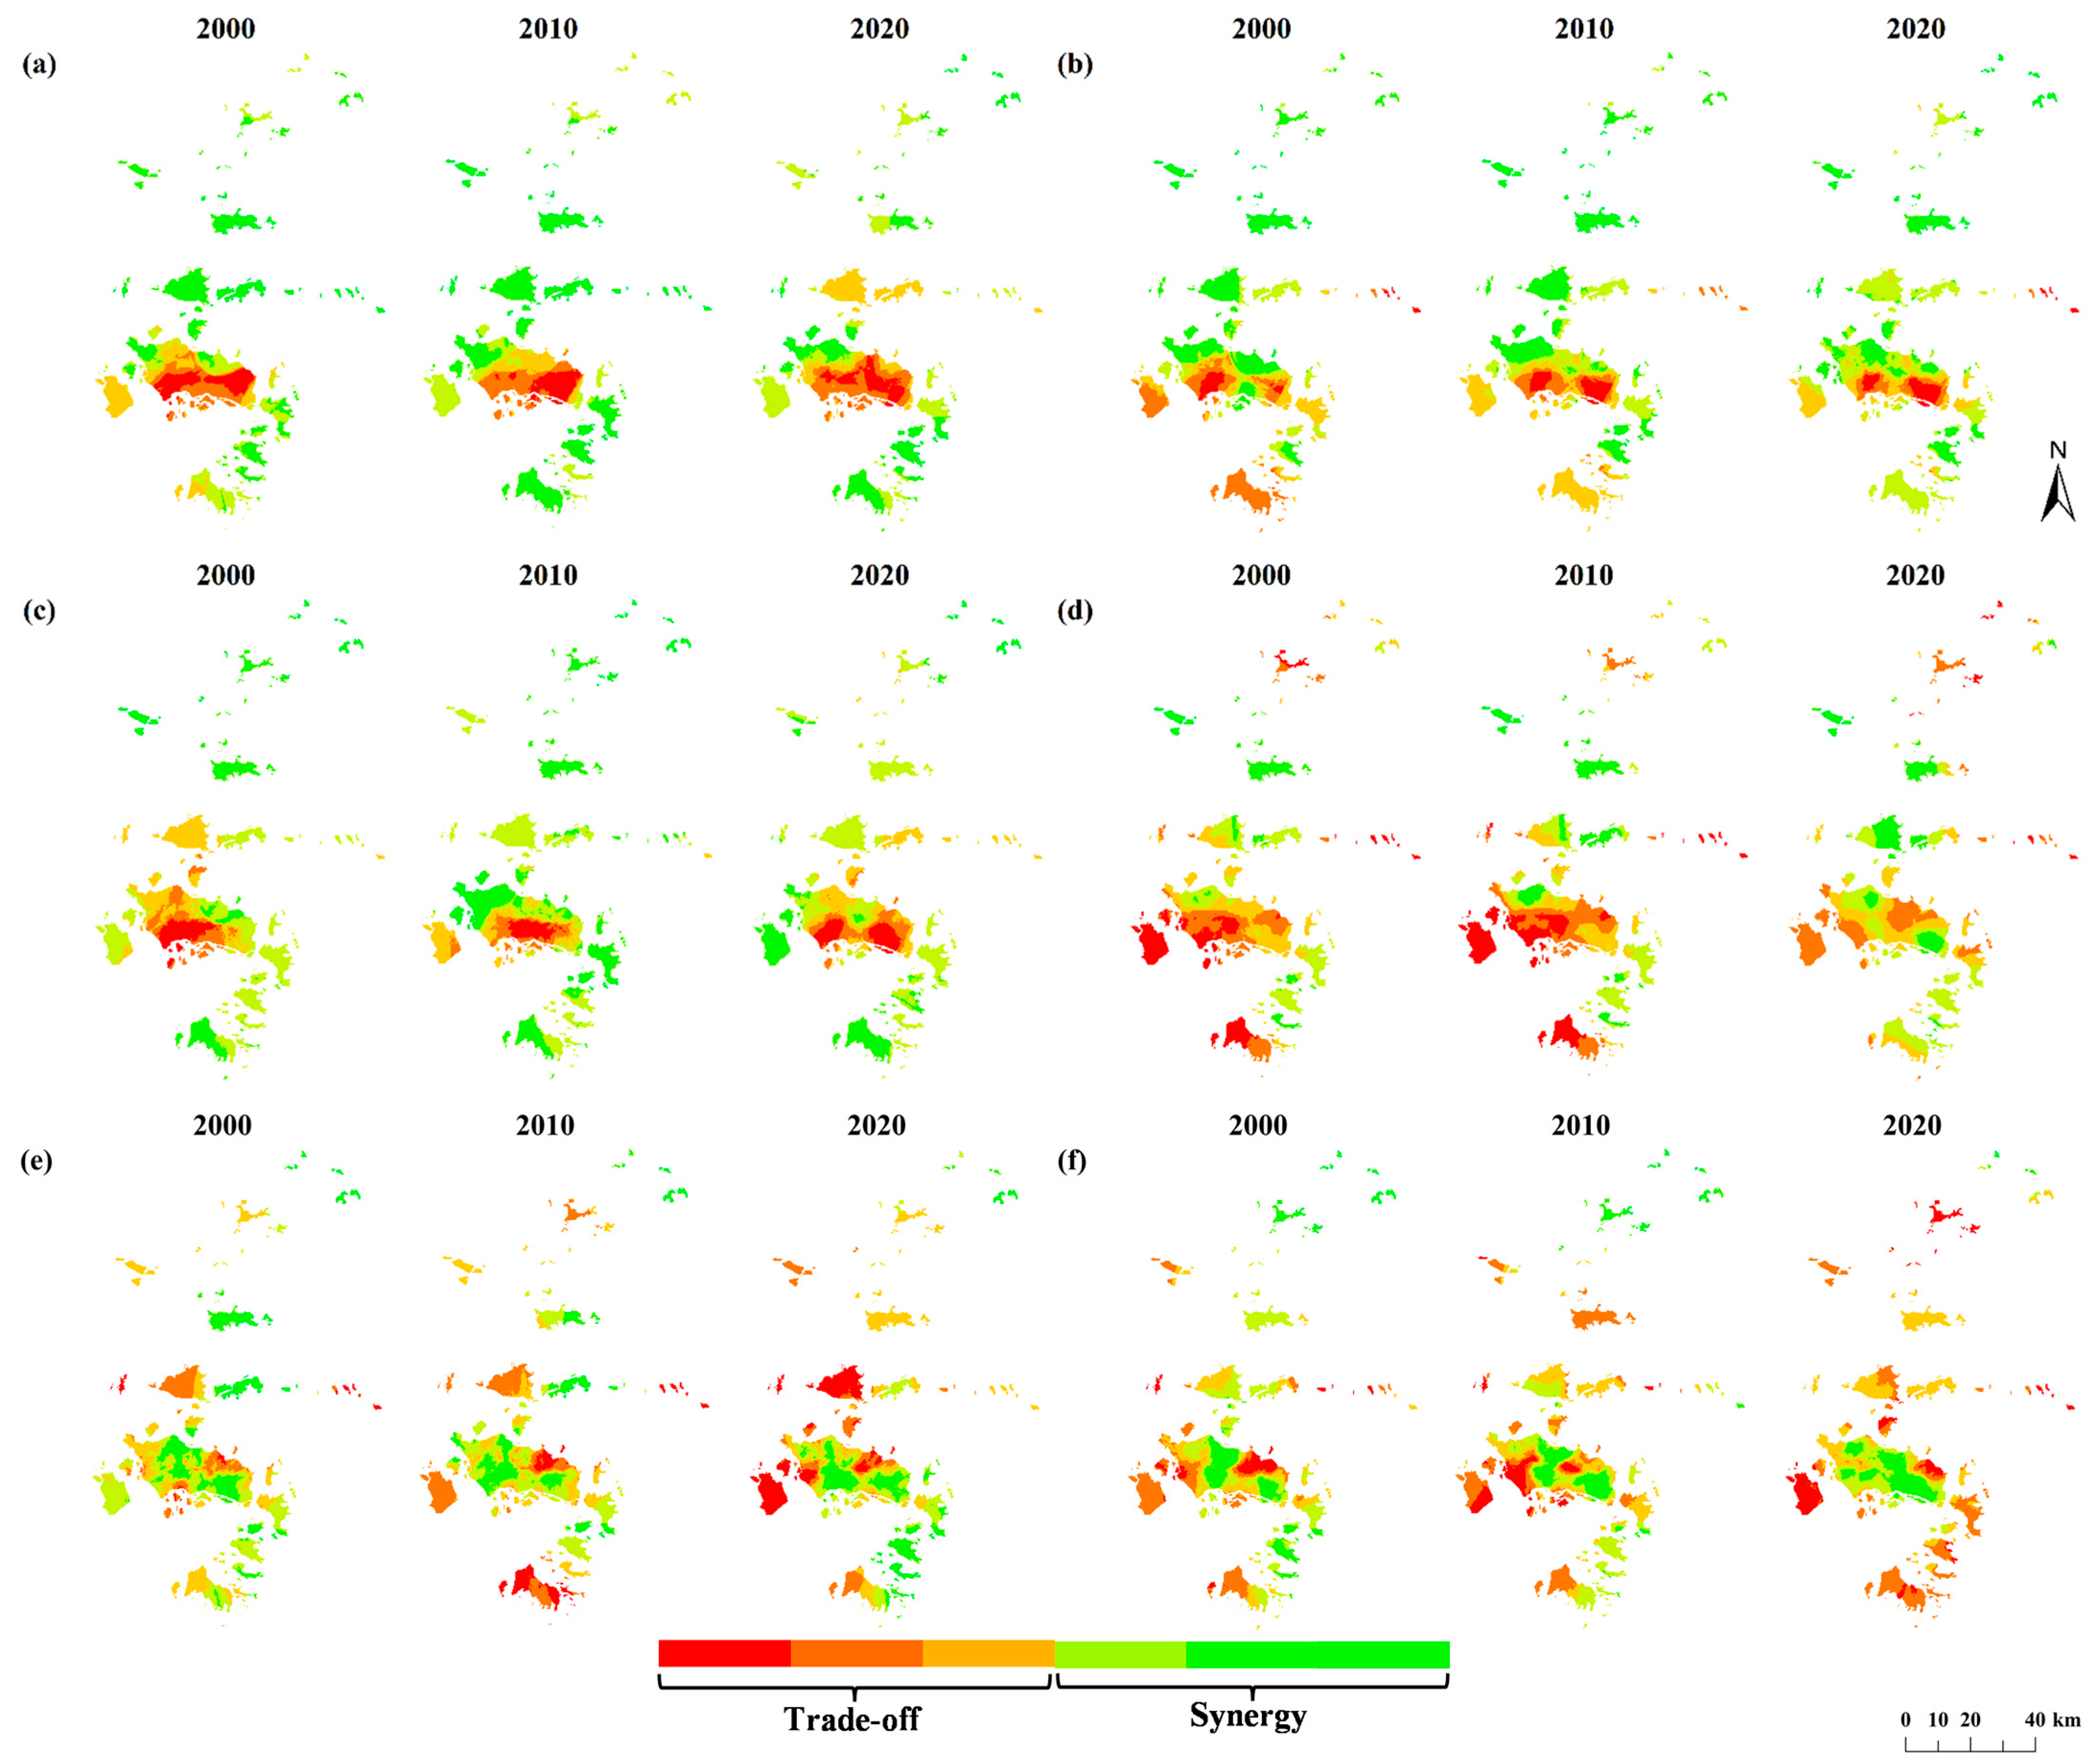
Figure 7 illustrates the spatial evolution patterns of trade-offs/synergies among ESs in the Zhoushan Archipelago from 2000 to 2020. Elucidating trade-off/synergy relationships constitutes a pivotal step that transforms sustainability from a concept into targeted action, providing an actionable, precautionary, and optimizable foundation for scientific management. Overall, the interactions between different ES pairs exhibited differentiated trends of change. High-trade-off areas were concentrated on specific islands with intensive human activities, such as central Zhoushan Island, Liuheng Island, Jintang Island, Daishan Island, and Sijiao Island. This suggests that the conversion of natural vegetation to impervious surfaces on these islands simultaneously disrupts hydrological regulation, carbon storage, and habitat connectivity, leading to intensifying service conflicts. High-synergy areas were mainly distributed in northern Zhoushan Island, Qushan Island, Taohua Island, and the Ma’an Archipelago. This spatial distribution suggests that high-synergy areas are predominantly located in regions that have experienced relatively lower human disturbance, where natural or semi-natural vegetation cover remains largely intact.
Specifically, the trade-off relationship between WY and SC strengthened overall during 2000–2020 (Figure 7a), with the most pronounced intensification observed on Zhoushan Island and Daishan Island. This reflects a gradual increase in spatial opposition between WY and SC on these islands. In the relationship between WY and CS (Figure 7b), trade-offs showed an increasing trend on Zhoushan Island, Daishan Island, and Sijiao Island. In contrast, Jintang Island and Liuheng Island exhibited a clear weakening trend in trade-offs. Comparatively, the interaction between WY and HQ demonstrated a moderating pattern (Figure 7c), with overall trade-offs weakening, most notably in Zhoushan Island, Daishan Island, and Jintang Island. The trade-offs between SC and CS also weakened (Figure 7d), with significant transformation observed on Zhoushan Island, Daishan Island, and Jintang Island. The trade-offs between SC and HQ continued to intensify on Zhoushan Island, Daishan Island, and Jintang Island (Figure 7e). The trade-offs between CS and HQ showed the most pronounced increase in spatial opposition on Zhujiajian Island, Taohua Island, Liuheng Island, and Jintang Island (Figure 7f). Identifying trade-off/synergy relationships among regions can optimize ES management decision making for the Zhoushan Archipelago.

4. Discussion

4.1. Analysis of Changes in ESs in the Zhoushan Archipelago

During the period from 2000 to 2020, the ESs of the Zhoushan Archipelago exhibited distinct evolutionary trends. Related studies indicate that both natural factors and human activities jointly influence the spatiotemporal variation of ESs [63,64,65]. The findings of this study also confirm that natural factors (topography and climate) and human activities (LULC) are key drivers affecting the spatiotemporal variation of ESs. The total WY showed an overall downward trend from 2000 to 2020, with a spatial distribution pattern characterized by higher values in the south and lower values in the north. This phenomenon is primarily attributed to two drivers. First, the significant expansion of construction land played a major role. Second, regional variations in precipitation also critically influenced the spatiotemporal changes in WY. The annual expansion of construction land diminished the regional water supply capacity, leading to a temporal decline in WY [66]. Spatial variations in precipitation, which were higher in the south and lower in the north, resulted in an uneven spatial distribution of WY [67].
Total SC showed an initial rise followed by a decline from 2000 to 2020, exhibiting an overall downward trend. Spatially, soil retention capacity has continuously declined in coastal island areas, most notably around Zhoushan Island and Daishan Island. This change stems primarily from shifts in land use patterns. Accelerated urbanization has led to the ongoing encroachment of coastal ecological land by construction land, resulting in natural vegetation degradation and directly weakening regional soil retention functions [68,69].
Total CS underwent a fluctuating pattern of decline followed by recovery from 2000 to 2020 yet remained in an overall downward trend. The decline from 2000 to 2010 was primarily attributed to significant spatial changes in coastal island areas. The expansion of construction land altered land use patterns, diminishing carbon absorption and storage capacity [70]. The increase from 2010 to 2020 resulted from urban greening initiatives and forest conservation measures [71]. These actions enhanced CS capacity, partially offsetting losses from urbanization and thereby increasing carbon reserves.
HQ exhibited a continuous deterioration trend from 2000 to 2020, with the most pronounced decline occurring in coastal areas. This change primarily resulted from habitat fragmentation caused by the expansion of construction land. The development of infrastructure such as ports and roads not only directly occupied ecological space but also fragmented existing forested and shrubland areas into isolated patches. This significantly amplified edge effects, leading to a consistent annual decline in HQ [72,73].
Furthermore, the island’s terrain, dominated by bedrock with steep and fragmented topography, leads to concentrated precipitation and short-lived runoff, resulting in weak soil and water conservation capacity. Combined with coastal urbanization, this creates significant spatial heterogeneity in the spatiotemporal evolution of ESs [74,75]. Notably, the spatiotemporal variations in ESs are not dominated by a single driver but result from the interaction and synergies of multiple factors [76]. Therefore, guided by the principle of sustainability, in the process of optimizing the ecosystem and managing risks in the Zhoushan Archipelago, it is necessary to take all driving factors into account, implement differentiated and precise spatial governance strategies, and effectively prevent the risk of habitat degradation.

4.2. Trade-Offs/Synergies in ESs of the Zhoushan Archipelago

The trade-offs/synergies among ESs in the Zhoushan Archipelago from 2000 to 2020 exhibit distinct temporal evolution patterns and spatial heterogeneity. During this period, WY-SC and WY-CS shifted from a weak synergy phase to a weak trade-off phase, with trade-offs intensifying in areas such as Zhoushan Island and Daishan Island. This also reflects a structural trade-off driven by biophysical constraints: as areas within the Zhoushan Archipelago characterized by high urbanization levels and concentrated population and economic activities, Zhoushan Island and Daishan Island experienced continuous expansion of construction land over the two decades. Construction land expansion, on one hand, increased impervious surfaces, reduced infiltration, and heightened surface runoff, thereby elevating WY. On the other hand, the destruction of original vegetation led to significant declines in SC and CS, forming a pronounced antagonistic pattern where one increases while the other decreases [77]. In contrast, the trade-offs between WY and HQ weakened from 2000 to 2020, with the most pronounced spatial reduction occurring on Zhoushan Island and Jintang Island. This mitigation is largely policy induced, likely attributable to the protection of ecological land. While the expansion of ecological land may slightly alter local WY patterns, it significantly enhances landscape connectivity and HQ, thereby mitigating the trade-offs between increased WY and habitat fragmentation [78]. The synergistic enhancement of the SC-CS, SC-HQ, and CS-HQ relationships was particularly pronounced on Zhoushan Island and Daishan Island during 2000–2020. This synergistic strengthening fundamentally reflects the gain effects of ecological restoration, demonstrating how policy-driven vegetation recovery can simultaneously enhances soil retention, biomass accumulation, and WY, ultimately driving synergistic interactions among ESs [79]. Compared to mainland regions, the Zhoushan Archipelago—as a geographically isolated island system—faces greater pressures in addressing global climate change and socio-economic development which severely constrains its ecological, social, and economic dimensions of sustainability. Frequent threats from natural disasters like typhoons and storm surges render its ESs more vulnerable [80,81]. Therefore, enhancing the sustainability of the Zhoushan Archipelago urgently requires coordinating ecological restoration with socio-economic development, building a more resilient island social–ecological system through the synergistic effects of ecosystem services, and achieving long-term sustainability.

4.3. Suggestions for the Sustainable Development of the Zhoushan Archipelago

The functional zoning results clarify the ecological roles of different areas, providing spatially explicit and actionable guidance that directly contributes to Target 2 of the Kunming-Montreal Global Biodiversity Framework, which calls for at least 30% of degraded ecosystems to be under effective restoration by 2030. Based on the differences in regional ecological functions, it is necessary to implement precise spatial governance strategies. The ecologically functional core zones, covering approximately 17.32 km2 in the coastal areas of Zhoushan Island and Taohua Island, should be strictly protected as ecological redlines where all developmental construction is prohibited. These areas represent irreplaceable natural assets that must be maintained at “no net loss.” This study’s management recommendations for the ecologically functional core zones confirm Zhao Hongzhuo’s view that it is necessary to protect extremely important ecological assets by delineating ecological red lines [82].
In ecologically important functional zones (e.g., central Zhoushan Island, eastern Jintang Island, Putuo Island, Taohua Island, Liuheng Island, and Qushan Island), where conservation is the priority, policy interventions should focus on guiding industrial transformation. Local governments can implement “positive lists” for green industries and invest in ecological corridors to enhance landscape connectivity. This approach is consistent with prevalent strategies that optimize landscape patterns through ecological network construction [83].
Ecologically moderate functional zones, including the Ma’an Archipelago and the southwestern part of Liuheng Island, should take measures to prevent degradation, strengthen non-point source pollution control, and improve environmental quality. Priority restoration efforts should be directed toward the Qiqu archipelago, Daishan Island, Qushan Island, and Zhoushan Island to curb further degradation. In response to the decline in water conservation capacity on Daishan Island, measures such as promoting sponge cities and wetland restoration are being implemented, which aligns with Cai et al.’s research conclusions on regulating water yield through the construction of sponge cities [84].
In ecologically fragile functional zones (e.g., Qiqu archipelago, Daishan Island, and Zhoushan Island), managers should establish ecological risk warning mechanisms to prevent sudden environmental incidents. To address SC vulnerabilities in the Qiqu archipelago, soil and water conservation projects should be implemented. Tourism development intensity in these areas should also be limited, with reservation and visitor flow management systems introduced. As priority restoration zones, these areas should receive allocated restoration funding to advance ecological rehabilitation across the archipelago [85].
The identification of high-trade-off zones reveals underlying systemic risks that require targeted management. In high-trade-off areas such as central Zhoushan Island, Liuheng Island, and Jintang Island, managers must establish development intensity thresholds (e.g., maximum impervious surface ratio) to prevent the degradation of the overall ecosystem due to the overutilization of single functions. This can be achieved by controlling the expansion of construction land to enhance ecological permeability, thereby alleviating conflicts among service trade-offs. This corresponds with the approach in existing research to mitigate systemic risks through spatial regulation [86,87]. Conversely, the identification of high-synergy areas provides a breakthrough for improving governance efficiency. Implementing ecological protection or restoration projects in high-synergy regions like Daishan Island, Qushan Island, and the Ma’an Archipelago often enables the simultaneous enhancement of multiple ESs. Similar studies confirm that such areas possess the governance potential for achieving “more with less” outcomes. The above management zoning is closely related to the unique geography, ecology, and socio-economic background of the Zhoushan Archipelago, but the management recommendations for ecological functional zones provide a practical approach that can be referenced by island regions facing similar tensions between development and conservation.

4.4. Limitations and Future Work

This study has several limitations that require further refinement and deepening in subsequent work. First, regarding the selection of ESs, this research evaluated four major ESs. It did not incorporate fishery resources from the Zhoushan fishing grounds into the ES framework. This limitation primarily stems from the limited availability of spatial distribution data for Zhoushan’s fishery resources, which to some extent affected the representation of regional characteristics. Second, the spatial resolution of foundational data remains improvable. The Zhoushan Archipelago’s numerous islands and fragmented terrain, particularly the scattered small islands, demand higher data precision. To address these shortcomings, future research could obtain fishery production and ecotourism data through field surveys and departmental statistics, expand the types of ESs assessed for islands, and enhance regional adaptability and management reference value. Additionally, integrating high-resolution multi-source remote sensing imagery, UAV aerial surveys, and long-term ground monitoring data can enhance the scientific rigor of assessment outcomes.

5. Conclusions

This study evaluates the spatiotemporal evolution characteristics of key ESs in the Zhoushan Archipelago from 2000 to 2020, conducting an analysis of driving factors and trade-off/synergy relationships. Based on this, ecological functional zones and areas of high trade-offs/high synergies were identified, leading to the formulation of differentiated management strategies. These findings provide a spatial management basis for the restoration of island ecosystems and their sustainable development. Key findings are as follows:
  • During 2000–2020, WY and SC in the Zhoushan Archipelago showed an initial increase followed by a decline, while CS exhibited a pattern of initial decrease followed by recovery. In contrast, HQ demonstrated a continuous downward trend overall. Spatially, the four ESs collectively presented a distribution pattern characterized by “higher values in the south and lower values in the north.” With the exception of HQ, both the areas of statistically significant cold spots and significant hot spots for the ESs gradually expanded, with notable changes observed on Zhoushan Island, Daishan Island, and Liuheng Island.
  • From 2000 to 2020, the ecological improvement zone in the Zhoushan Archipelago expanded, whereas other functional zones experienced a reduction in area. Among these zones, the ecological priority control zone covered the largest area, while the ecological core protection zone was the smallest. The most notable spatial changes occurred in the Ma’an Archipelago and Zhoushan Island, which shifted from the ecological general control zone and the ecological rehabilitation zone to the ecological improvement zone. This shift reflects a clear decline in local ESs. Therefore, these regions should be designated as priorities for ecological restoration and spatial management, with efforts focused on enhancing ecological resilience, halting degradation, and facilitating ecological recovery. By delineating functional zones, this study provides direct scientific support for the region’s ecological management, offering a spatial blueprint for navigating toward sustainability.
  • Natural drivers and socio-economic drivers jointly shape the spatial heterogeneity of island ESs. From 2000 to 2020, natural factors (AP) remained the primary driver across WY. However, the driving patterns for SC, CS, and HQ gradually shifted from socio-economic factors (LULC) to natural topography (DEM and slope). This evolution reflects that as urbanization stabilizes, the influence of natural conditions on ecosystem service patterns has become increasingly prominent, providing a critical pathway for achieving sustainable development in island regions, that is, placing greater emphasis on the conservation and restoration of natural capital during the urbanization stabilization phase and optimizing ecological management in accordance with natural geographical patterns.
  • Between 2000 and 2020, the trade-off and synergy relationships among ESs underwent shifts and exhibited dynamic changes. Specifically, the relationship between WY-SC and WY-CS transitioned from weak synergies to weak trade-offs. Meanwhile, the trade-offs between WY-HQ gradually weakened. In contrast, synergistic relationships were observed to strengthen between SC-CS, SC-HQ, and CS-HQ. Spatially, high-trade-off areas were primarily concentrated in central Zhoushan Island, Liuheng Island, and Jintang Island. In these regions, it is necessary to establish development intensity thresholds and control the expansion of construction land to mitigate conflicts among ESs. High-synergy areas were mainly distributed in Daishan Island, Qushan Island, and the Ma’an Archipelago. These areas should be prioritized for conservation and restoration efforts to promote a win–win outcome between synergistic optimization of ecosystem services and regional sustainable development.
This study provides direct scientific support for the ecological management of the Zhoushan Archipelago by delineating functional zones and identifying areas with high trade-offs and high synergies of ecosystem services. The findings also offer a scientific reference for coordinating socio-economic development with natural environmental protection in island regions.

Supplementary Materials

The following supporting information can be downloaded at: https://www.mdpi.com/article/10.3390/su18052297/s1, Figure S1: The map of spatial changes in four ecosystem services in the Zhoushan Islands from 2000 to 2020; Figure S2: The driving factor analysis of four ecosystem services (ESs); Table S1: Carbon density of the Zhoushan Archipelago; Table S2: Sensitivity of different land use types in the Zhoushan Archipelago to threat sources; Table S3: Impact of different land use types on habitat threats in the Zhoushan Archipelago; Table S4: Cold and hot spot analysis area of water yield (WY) in the Zhoushan Archipelago; Table S5: Cold and hot spot analysis area of soil conservation (SC) in the Zhoushan Archipelago; Table S6: Cold and hot spot analysis area of carbon storage (CS) in the Zhoushan Archipelago; Table S7: Cold and hot spot analysis area of habitat quality (HQ) in the Zhoushan Archipelago; Table S8: Statistical area of ES index zoning in the Zhoushan Archipelago region from 2000 to 2020; Table S9: Global spatial autocorrelation of main ESs in the Zhoushan Archipelago; Table S10: Global spatial autocorrelation of main ESs in the Zhoushan Archipelago from 2000 to 2020.

Author Contributions

Conceptualization, C.W.; methodology, L.Z. and C.W.; software, L.Z.; validation, L.Z. and C.W.; formal analysis, L.Z. and C.W.; resources, L.Z.; writing—original draft preparation, L.Z.; writing—review and editing, C.W., X.B., and Z.W.; visualization, L.Z.; supervision, C.W. All authors have read and agreed to the published version of the manuscript.

Funding

This study was supported by the National Key R&D Program of China (2023YFD2401903).

Institutional Review Board Statement

Not applicable.

Informed Consent Statement

Not applicable.

Data Availability Statement

Data will be made available on request.

Conflicts of Interest

The authors declare no conflicts of interest.

Abbreviations

The following abbreviations are used in this manuscript:
ESsEcosystem Services
WYWater Yield
SCSoil Conservation
CSCarbon Storage
HQHabitat Quality
ESIEcosystem Service Index
DEMDigital Elevation Model
APAverage Precipitation
ATAverage Temperature
NDVINormalized Difference Vegetation Index
LULCLand Use/Land Cover
STSoil Type
DTTCDistance To The Coastline
POPPopulation

References

  1. Li, S.; Yu, D.; Li, X. Exploring the impacts of ecosystem services on human well-being in Qinghai Province under the framework of the sustainable development goals. J. Environ. Manag. 2023, 345, 118880. [Google Scholar] [CrossRef] [Scilit]
  2. Zhao, Y.; Zhou, R.; Yu, Q.; Zhao, L. Revealing the contribution of mountain ecosystem services research to sustainable development goals: A systematic and grounded theory driven review. J. Environ. Manag. 2025, 373, 123452. [Google Scholar] [CrossRef] [Scilit]
  3. Zhang, T.; Zhang, S.; Cao, Q.; Wang, H.; Li, Y. The spatiotemporal dynamics of ecosystem services bundles and the social-economic-ecological drivers in the Yellow River Delta region. Ecol. Indic. 2022, 135, 108573. [Google Scholar] [CrossRef] [Scilit]
  4. Mir, K.; Brouwer, R. Testing the effect of ecosystem service and land classification on global values of forested watershed ecosystem services. For. Policy Econ. 2025, 181, 103667. [Google Scholar] [CrossRef] [Scilit]
  5. Ren, T.; Chen, C.; Liu, Z.; Ji, J.; Sun, W.; Yang, G. Development of island-specific land-use classification system and spatiotemporal pattern evolution analysis using Landsat time series for coastal zone management: A case study of Zhoushan Archipelago, China. Ecol. Indic. 2025, 179, 114158. [Google Scholar] [CrossRef] [Scilit]
  6. Moustakas, A.; Zemah-Shamir, S.; Tase, M.; Zotos, S.; Demirel, N.; Zoumides, C.; Christoforidi, I.; Dindaroglu, T.; Albayrak, T.; Ayhan, C.K.; et al. Climate land use and other drivers’ impacts on island ecosystem services: A global review. Sci. Total Environ. 2025, 973, 179147. [Google Scholar] [CrossRef] [Scilit] [PubMed]
  7. Balzan, M.V.; Potschin-Young, M.; Haines-Young, R. Island ecosystem services: Insights from a literature review on case-study island ecosystem services and future prospects. Int. J. Biodivers. Sci. Ecosyst. Serv. Manag. 2018, 14, 71–90. [Google Scholar] [CrossRef] [Scilit]
  8. Yao, X.; Fang, S. Exploring the coupling of ecosystem services and human well-being: Evidence from Chinese cities through interpretable machine learning. Ecol. Indic. 2025, 180, 114315. [Google Scholar] [CrossRef] [Scilit]
  9. Ruslan, N.F.N.; Goh, H.C.; Hattam, C.; Edwards-Jones, A.; Moh, H.H. Mangrove ecosystem services: Contribution to the well-being of the coastal communities in Klang Islands. Mar. Policy 2022, 144, 105222. [Google Scholar] [CrossRef] [Scilit]
  10. Liu, J.; Chen, F.; Xiao, L. China’s island management system based on qualitative content analysis: The choice between development and conservation. J. Sea Res. 2024, 202, 102553. [Google Scholar] [CrossRef] [Scilit]
  11. Li, F.; Qi, D.; He, Y. Analysis of the Decoupling Relationship between Environmental Pollution and Economic Development in Island Areas: A Case Study of Zhoushan Islands, China. Sustainability 2024, 16, 5567. [Google Scholar] [CrossRef] [Scilit]
  12. Zhao, W.; Wang, B.; Pan, T.; Chen, Y.; Tao, H.; Guo, B.; Varbanov, P.S.; Lu, J. Optimisation of island integrated energy system based on marine renewable energy. Fundam. Res. 2025, 5, 2161–2179. [Google Scholar] [CrossRef] [Scilit]
  13. Portz, L.; Murgas-Vargas, A.; Campos, P.T.; Villate-Daza, D.A.; Manzolli, R.P. How natural disasters affect the distribution of marine litter in protected island ecosystems (Seaflower Biosphere Reserve—Colombia). Mar. Pollut. Bull. 2025, 211, 117458. [Google Scholar] [CrossRef] [Scilit] [PubMed]
  14. Da, C.; Zhi, J.; Zhao, W.; Liu, W.; Xue, C.; Bao, S. Cultural service assessment of cultivated land ecosystem in the Yangtze River Delta region from a supply–demand-flow perspective. Ecol. Indic. 2025, 173, 113378. [Google Scholar] [CrossRef] [Scilit]
  15. Savo, V.; D’Amato, L.; Bartoli, F.; Zappitelli, I.; Caneva, G. Evaluation of main regulating, provisioning, and supporting ecosystem services of urban street trees: A literature review. Ecosyst. Serv. 2025, 71, 101690. [Google Scholar] [CrossRef] [Scilit]
  16. Chen, Z.; Yao, Y.; Zhang, H.; Xu, M. Exploring ecosystem services and interconnections in nearshore islands for spatial planning: Insights from China. J. Environ. Manag. 2025, 393, 127195. [Google Scholar] [CrossRef] [Scilit]
  17. Du, R.; Liu, B.; Xu, M. Current status and trends in island ecosystem services research: A bibliometric analysis from 2000 to 2023. Mar. Policy 2024, 163, 106098. [Google Scholar] [CrossRef] [Scilit]
  18. Zhang, L.; Lei, J.; Chen, Z.; Zhou, P.; Wu, T.; Chen, X.; Li, Y.; Pan, X. Spatiotemporal differentiation and trade-offs and synergies of ecosystem services in tropical island basins: A case study of three major basins of Hainan Island. J. Clean. Prod. 2025, 490, 144798. [Google Scholar] [CrossRef] [Scilit]
  19. Romadhon, A.; Jakfar, A.A.; Sugiarti, T. Assessing cultural ecosystem service status for small island tourism: (Case study Sapudi Island, Indonesia). Egypt. J. Aquat. Res. 2025, in press. [Google Scholar] [CrossRef] [Scilit]
  20. Xu, J.; Jiang, X.; Liu, H.; Yin, F.; Xu, Y.; Gao, C. Monitoring of spatiotemporal changes in ecosystem service functions and analysis of influencing factors in Pingtan Island. Ecol. Indic. 2024, 158, 111590. [Google Scholar] [CrossRef] [Scilit]
  21. Banela, M.; Kitsiou, D. Mapping cultural ecosystem services: A case study in Lesvos Island, Greece. Ocean Coast. Manag. 2023, 246, 106883. [Google Scholar] [CrossRef] [Scilit]
  22. Tajima, Y.; Hashimoto, S.; Dasgupta, R.; Takahashi, Y. Spatial characterization of cultural ecosystem services in the Ishigaki Island of Japan: A comparison between residents and tourists. Ecosyst. Serv. 2023, 60, 101520. [Google Scholar] [CrossRef] [Scilit]
  23. Ferrante, M.; Lamelas-López, L.; Nunes, R.; Monjardino, P.; Lopes, D.J.H.; Soares, A.O.; Lövei, G.L.; Borges, P.A.V. A simultaneous assessment of multiple ecosystem services and disservices in vineyards and orchards on Terceira Island, Azores. Agric. Ecosyst. Environ. 2022, 330, 107909. [Google Scholar] [CrossRef] [Scilit]
  24. van Haaren, B.; Andreoli, R.; Dumas, P.; Lille, D.; Géraux, H. Characterizing forest ecosystem services degradation within water catchments. An application to a South West Pacific tropical and semi-arid island (New Caledonia). Environ. Chall. 2021, 4, 100151. [Google Scholar] [CrossRef] [Scilit]
  25. Xu, C.; Jiang, W.; Huang, Q.; Wang, Y. Ecosystem services response to rural-urban transitions in coastal and island cities: A comparison between Shenzhen and Hong Kong, China. J. Clean. Prod. 2020, 260, 121033. [Google Scholar] [CrossRef] [Scilit]
  26. Zhang, Z.; Cao, D.; Ma, T.; Liu, H.; Mao, Z. International cooperation for a biodiverse future: Opportunities and challenges under the Kunming-Montreal Global Biodiversity Framework. Glob. Ecol. Conserv. 2025, 58, e03385. [Google Scholar] [CrossRef] [Scilit]
  27. Fernández-Palacios, J.M.; Kreft, H.; Irl, S.D.H.; Norder, S.; Ah-Peng, C.; Borges, P.A.V.; Burns, K.C.; de Nascimento, L.; Meyer, J.-Y.; Montes, E.; et al. Scientists’ warning—The outstanding biodiversity of islands is in peril. Glob. Ecol. Conserv. 2021, 31, e01847. [Google Scholar] [CrossRef] [Scilit]
  28. Deng, Y.; Randall, J.; Ye, F. Island ecological restoration and management practices based on nature: Conference report. Mar. Policy 2022, 143, 105188. [Google Scholar] [CrossRef] [Scilit]
  29. Zhang, H.; Xiao, Y.; Deng, Y. Island ecosystem evaluation and sustainable development strategies: A case study of the Zhoushan Archipelago. Glob. Ecol. Conserv. 2021, 28, e01603. [Google Scholar] [CrossRef] [Scilit]
  30. Deng, L. Community Characteristics of Evergreen Broad-Leaved Forests in the Zhoushan Archipelago. Master’s Thesis, Central South University of Forestry and Technology, Changsha, China, 2022. [Google Scholar]
  31. Gu, C.; Le, Q.; Wang, L.; Gui, F. Ecological security assessment of the Zhoushan Archipelago based on the PSR model. J. Zhejiang Ocean. Univ. (Nat. Sci.) 2023, 42, 173–179. [Google Scholar]
  32. Yang, J.; Huang, X. The 30 m Annual Land Cover Datasets and Its Dynamics in China from 1985 to 2023. Available online: https://zenodo.org/records/12779975 (accessed on 1 August 2024).
  33. National Tibetan Plateau Data Center. Available online: https://data.tpdc.ac.cn/ (accessed on 16 February 2026).
  34. Environmental Meteorological Data Service Plat-Form. Available online: http://eia-data.com (accessed on 16 February 2026).
  35. Harmonized World Soils Database Version 2.0. Available online: https://gaez.fao.org/pages/hwsd (accessed on 16 February 2026).
  36. Geospatial Data Cloud. Available online: https://www.gscloud.cn/ (accessed on 16 February 2026).
  37. Resource and Environmental Science Data Platform. Available online: https://www.resdc.cn/ (accessed on 16 February 2026).
  38. OpenStreetMap. Available online: https://osmdata.openstreetmap.de/data/coastlines.html (accessed on 16 February 2026).
  39. WorldPop Open Population Repository. Available online: https://hub.worldpop.org/ (accessed on 16 February 2026).
  40. Yang, H.; Zhang, H.; Wang, Y.; Jia, X.; Hao, L.; Jin, K.; Song, J. Urban bird diversity conservation plan based on the MaxEnt model and InVEST model: A case study of Jinan, China. Ecol. Indic. 2025, 174, 113463. [Google Scholar] [CrossRef] [Scilit]
  41. Yu, H.; Jiang, J.; Gu, X.; Cao, C.; Shen, C. Using dynamic Bayesian belief networks to infer the effects of climate change and human activities on changes in regional ecosystem services. Ecol. Indic. 2025, 170, 113023. [Google Scholar] [CrossRef] [Scilit]
  42. Haoran, D.; Ning, X. Assessing Social Values for Ecosystem Services in Rural Areas Based on the SolVES Model: A Case Study from Nanjing, China. Forests 2022, 13, 1877. [Google Scholar] [CrossRef] [Scilit]
  43. Bai, Y.; Wong, C.P.; Jiang, B.; Hughes, A.C.; Wang, M.; Wang, Q. Developing China’s Ecological Redline Policy using ecosystem services assessments for land use planning. Nat. Commun. 2018, 9, 3034. [Google Scholar] [CrossRef] [Scilit]
  44. Veisi Nabikandi, B.; Hami, A.; Valizadeh Kamran, K.; Russo, A. Evaluating urban ecosystem services and resilience using remote sensing and InVEST model: A case study of flood risk control and urban cooling in Tabriz. Sustain. Cities Soc. 2025, 130, 106654. [Google Scholar] [CrossRef] [Scilit]
  45. Caro, C.; Marques, J.C.; Cunha, P.P.; Teixeira, Z. Ecosystem services as a resilience descriptor in habitat risk assessment using the InVEST model. Ecol. Indic. 2020, 115, 106426. [Google Scholar] [CrossRef] [Scilit]
  46. Wu, L.; Luo, Y.; Pang, S.; Wang, G.; Ma, X. Factor analysis of hydrologic services in water-controlled grassland ecosystems by InVEST model and geodetector. Environ. Sci. Pollut. Res. Int. 2024, 31, 20409–20433. [Google Scholar] [CrossRef] [Scilit]
  47. Huang, J.; Yang, S.; Zhu, W.; Lin, J.; Zhu, Y.; Ren, J.; Dai, Y.; Zhang, A. Spatial and temporal characterization of critical ecosystem services in China’s terrestrial area, 2000–2020: Trade-off synergies, driving mechanisms and functional zoning. Front. Ecol. Evol. 2024, 12, 1443683. [Google Scholar] [CrossRef] [Scilit]
  48. Zhu, X.; Qie, R.; Luo, C.; Zhang, W. Assessment and Driving Factors of Wetland Ecosystem Service Function in Northeast China Based on InVEST-PLUS Model. Water 2024, 16, 2153. [Google Scholar] [CrossRef] [Scilit]
  49. Chen, Z.; Zhu, Z.; Zhang, X.; Jiao, Y.; Cheng, Y.; Wang, S.; Zhang, H. Study on spatio-temporal evolution of ecosystem services, spatio-temporal pattern of tradeoff/synergy relationship and its driving factors in Shendong mining area. Front. Environ. Sci. 2024, 12, 1445833. [Google Scholar] [CrossRef] [Scilit]
  50. Yohannes, H.; Soromessa, T.; Argaw, M.; Warkineh, B. Spatio-temporal changes in ecosystem service bundles and hotspots in Beressa watershed of the Ethiopian highlands: Implications for landscape management. Environ. Chall. 2021, 5, 100324. [Google Scholar] [CrossRef] [Scilit]
  51. Niu, Z.; He, H.; Zhang, M.; Ren, X.; Zhang, L.; Feng, L.; Qin, K. Assessment and attribution of terrestrial ecosystem quality in China from 2003 to 2020. Acta Geogr. Sin. 2025, 80, 1901–1919. [Google Scholar]
  52. Su, Y.; Wang, J.; Li, J.; Liu, J. Driving Mechanisms of High-Quality Urban Development: Evidence from Lianyungang City, China. Sustainability 2026, 18, 1220. [Google Scholar] [CrossRef] [Scilit]
  53. Xue, S.; Yao, L.; Xu, Y.; Li, C. Spatiotemporal Dynamics and Driving Factors of Ecosystem Services in the Yellow River Delta, China. Sustainability 2024, 16, 3466. [Google Scholar] [CrossRef] [Scilit]
  54. Zhou, Y.; Chen, T.; Wang, J.; Xu, X. Analyzing the Factors Driving the Changes of Ecosystem Service Value in the Liangzi Lake Basin—A GeoDetector-Based Application. Sustainability 2023, 15, 15763. [Google Scholar] [CrossRef] [Scilit]
  55. Wu, S.; Hu, S.; Frazier, A.E.; Xie, W.; Zang, Y. Cultivated Ecosystem Services in the Yangtze River Economic Belt: Distinguishing Characteristics and Underlying Drivers Over the Past 20 Years. Land Degrad. Dev. 2025, 36, 3827–3843. [Google Scholar] [CrossRef] [Scilit]
  56. Li, S.C.; Zhang, C.Y.; Liu, J.L.; Zhu, W.; Ma, C.; Wang, J. Research progress on ecosystem service trade-offs and synergies and related geographical themes. Geogr. Res. 2013, 32, 12. [Google Scholar]
  57. Ren, J.; Ma, R.; Huang, Y.; Wang, Q.; Guo, J.; Li, C.; Zhou, W. Identifying the trade-offs and synergies of land use functions and their influencing factors of Lanzhou-Xining urban agglomeration in the upper reaches of Yellow River Basin, China. Ecol. Indic. 2024, 158, 111279. [Google Scholar] [CrossRef] [Scilit]
  58. Aryal, K.; Maraseni, T.; Apan, A. How much do we know about trade-offs in ecosystem services? A systematic review of empirical research observations. Sci. Total Environ. 2022, 806, 151229. [Google Scholar] [CrossRef] [Scilit] [PubMed]
  59. Li, B.; Yang, G.; Wan, R.; Hamilton, D.P.; Wang, X. Unravelling the spatiotemporal trade-offs and synergies among hydrological ecosystem services in a large floodplain lake. Ecol. Indic. 2025, 172, 113255. [Google Scholar] [CrossRef] [Scilit]
  60. Chen, X.; Huang, L.; Zhang, C. Spatiotemporal evolution and trade-offs/synergies of ecosystem services in Hubei Province. Sci. Rep. 2025, 15, 35697. [Google Scholar] [CrossRef] [Scilit]
  61. Hao, X.; Shaofeng, Y.; Prishchepov, A.V. Spatial-temporal heterogeneity of ecosystem service interactions and their social-ecological drivers: Implications for spatial planning and management. Resour. Conserv. Recycl. 2023, 189, 106767. [Google Scholar]
  62. Liyuan, Z.; Jiangbo, G. Investigating the compounding effects of environmental factors on ecosystem services relationships for Ecological Conservation Red Line areas. Land Degrad. Dev. 2021, 32, 4609–4623. [Google Scholar] [CrossRef] [Scilit]
  63. Xu, Q.; Zhang, Z.; Liu, X.; Wang, Z.; Ren, C.; Xia, T.; Sun, G.; Han, L. Analysis of Ecosystem Service Value Trends and Drivers in the Yellow River Delta, China. Agriculture 2025, 15, 346. [Google Scholar] [CrossRef] [Scilit]
  64. Wei, Z.; Liang, X.; Chen, H.; Yang, M.; Shi, J.; Li, H.; Lui, R. Ecosystem vulnerability assessment based on ecosystem services and analysis of its drivers: A case of the Guanzhong region, China. Environ. Dev. Sustain. 2024, 1–24. [Google Scholar] [CrossRef] [Scilit]
  65. Galeazzi, A.M.; Foucat, V.S.A.; Perevochtchikova, M. Analysis of the watershed social-ecological system trajectory in Copalita-Huatulco, Mexico: The impact of drivers on hydrological ecosystem services. Ambio 2024, 53, 1797–1812. [Google Scholar] [CrossRef] [Scilit] [PubMed]
  66. Yushanjiang, A.; Zhou, W.; Wang, J.; Wang, J. Impact of urbanization on regional ecosystem services—A case study in Guangdong-Hong Kong-Macao Greater Bay Area. Ecol. Indic. 2024, 159, 111633. [Google Scholar] [CrossRef] [Scilit]
  67. Gong, H.; Hou, T. Trend and abrupt change analysis of annual precipitation series in the Zhoushan Archipelago, 1961–2021. Express Water Resour. Hydropower Inf. 2022, 43, 21–26. [Google Scholar]
  68. Zhao, P.; Wang, L.; Zheng, X.; Li, Y.; Lu, L.; Yang, Y.; Huang, J.; Du, Y.; Ling, F. Unveiling spatiotemporal patterns and key drivers of soil conservation from a “historical-future-intervention” perspective: A case study of the Danjiangkou Reservoir Area, China. J. Environ. Manag. 2025, 386, 125771. [Google Scholar] [CrossRef] [Scilit]
  69. Liu, X.; Li, X.; Liu, X.; Zhang, W.; Liu, S.; Xu, J.; Zeng, G. Soil Conservation and Influencing Factors in Xiangyang City, Hanjiang River Basin. Agronomy 2025, 15, 976. [Google Scholar] [CrossRef] [Scilit]
  70. He, C.; Zhang, D.; Huang, Q.; Zhao, Y. Assessing the potential impacts of urban expansion on regional carbon storage by linking the LUSD-urban and InVEST models. Environ. Model. Softw. 2016, 75, 44–58. [Google Scholar] [CrossRef] [Scilit]
  71. Standing Committee of Zhoushan Municipal People’s Congress, Explanation of the Zhoushan City Urban Greening Regulations. Zhejiang People’s Congress (Gazette Version) 2018, 2, 21–23. Available online: https://kns.cnki.net/kcms2/article/abstract?v=z8lpvlhA63FKts-7a7KO3pYBAHA5vcgLM3ZyCwTKbS-XpIpjVCZEIlbKuonZeZRROxfOw-950ajFhmSRbLf0NxjD015cVJTvOAPkgBXclVVjsPMFCEGU08Mbj1U0OIVHD-C5GsJCt6FLq98B3YFmE_1MHss4ELCdfg4Ld2uNvDnMZPJ48LAmxfPZskmnoYKX&uniplatform=NZKPT&language=CHS (accessed on 16 February 2026).
  72. Hou, W.; Zhang, J.; Peng, Z.; Walz, U. Assessing habitat fragmentation in highly urbanized area: Implications for mitigating landscape dissection and habitat restoration. Int. J. Appl. Earth Obs. Geoinf. 2025, 139, 104557. [Google Scholar] [CrossRef] [Scilit]
  73. Hong, H.J.; Kim, C.K.; Lee, H.W.; Lee, W.K. Conservation, Restoration, and Sustainable Use of Biodiversity Based on Habitat Quality Monitoring: A Case Study on Jeju Island, South Korea (1989–2019). Land 2021, 10, 774. [Google Scholar] [CrossRef] [Scilit]
  74. Pan, Y.; Zhai, M.; Lin, L.; Lin, Y.; Cai, J.; Deng, J.-s.; Wang, K. Characterizing the spatiotemporal evolutions and impact of rapid urbanization on island sustainable development. Habitat Int. 2016, 53, 215–227. [Google Scholar] [CrossRef] [Scilit]
  75. Li, S.; Wang, L.; Zhao, S.; Gui, F.; Le, Q. Landscape Ecological Risk Assessment of Zhoushan Island Based on LULC Change. Sustainability 2023, 15, 9507. [Google Scholar] [CrossRef] [Scilit]
  76. Li, L.; Feng, R.; Hou, G.; Xi, J. Identifying cultural ecosystem service flows and drivers in ecological functional zone. J. Environ. Manag. 2025, 392, 126914. [Google Scholar] [CrossRef] [Scilit]
  77. Mou, P. Exploring the development model of characteristic refined agriculture in island regions: A case study of the Zhoushan Archipelago. Rural Econ. Sci.-Technol. 2024, 35, 101–104. [Google Scholar]
  78. Zhao, H. Spatio-temporal evolution of habitat quality in the Erhai Lake Basin based on the InVEST model. J. Southwest For. Univ. (Nat. Sci.) 2025, 45, 121–130. [Google Scholar]
  79. Xu, X. Spatio-Temporal Trade-Offs of Ecological Service Functions and Their Driving Mechanisms in Zhejiang Province. Master’s Thesis, Zhejiang University, Hangzhou, China, 2022. [Google Scholar]
  80. Fang, X.; Wu, Y.; Xia, L.; Wang, Z.; Ni, W.; Zhang, Y.; Liu, Y. Vulnerability analysis of socio-ecological systems on small islands from the perspective of fisheries and tourism: A case study of Zhoushan Gouqi Island. J. Clean. Prod. 2024, 473, 143550. [Google Scholar] [CrossRef] [Scilit]
  81. Shifaw, E.; Sha, J.; Li, X.; Bao, Z.; Ji, J.; Ji, Z.; Kassaye, A.Y.; Lai, S.; Yang, Y. Ecosystem services dynamics and their influencing factors: Synergies/tradeoffs interactions and implications, the case of upper Blue Nile basin, Ethiopia. Sci. Total Environ. 2024, 938, 173524. [Google Scholar] [CrossRef] [Scilit]
  82. Zhao, H.; He, J.; Liu, D.; Chen, Z.; Jia, Q.; Zhang, M. Identification of ecological conservation priority areas considering the dynamic supply-demand balance of ecosystem services. J. Clean. Prod. 2025, 520, 146023. [Google Scholar] [CrossRef] [Scilit]
  83. Zhu, H. Understanding and optimizing Cultural-Ecological patterns in protection Zones: A case study from Qiang CEPZ. Ecol. Indic. 2025, 179, 114084. [Google Scholar] [CrossRef] [Scilit]
  84. Cai, Y.; Zhao, Y.; Wei, T.; Fu, W.; Tang, C.; Yuan, Y.; Yin, Q.; Wang, C. Utilization of constructed wetland technology in China’s sponge city scheme under carbon neutral vision. J. Water Process Eng. 2023, 53, 103828. [Google Scholar] [CrossRef] [Scilit]
  85. Kuiper, N.M.; van Duijn, M.; van der Vlist, A.J. Do urban redevelopment projects attract jobs? Evidence from the Dutch National Restoration Fund. Reg. Sci. Urban Econ. 2025, 114, 104130. [Google Scholar] [CrossRef] [Scilit]
  86. Ye, Y.; Li, Z.; Wu, Q.; Wang, J. Synergistic development of construction land expansion and efficiency: A Chinese multi scale study. J. Urban Manag. 2025, in press. [Google Scholar] [CrossRef] [Scilit]
  87. Wang, Z.; Zhang, Y.; Wu, Z.; Wei, J.; Wang, W.; Zhang, Y.; Wang, B. Multi-level ecological planning: Integrating conservation, trade-offs, and vegetation sensitivity for the Gansu NFPP. J. Clean. Prod. 2025, 529, 146769. [Google Scholar] [CrossRef] [Scilit]
Figure 1. Conceptual diagram.
Sustainability 18 02297 g001
Figure 2. Study area. (a) Location of the Zhoushan Archipelago. (b) DEM of the Zhoushan Archipelago. (c) The composition and distribution of the main islands of the Zhoushan Archipelago.
Sustainability 18 02297 g002
Figure 3. Spatial distribution of four ESs in the Zhoushan Archipelago from 2000 to 2020. (a) Spatial distribution of WY. (b) Spatial distribution of SC. (c) Spatial distribution of CS. (d) Spatial distribution of HQ.
Sustainability 18 02297 g003
Figure 4. Spatial distribution of cold spot and hot spot analysis for four ESs in the Zhoushan Archipelago from 2000 to 2020. (a) Spatial distribution of cold spot and hot spot analysis for WY. (b) Spatial distribution of cold spot and hot spot analysis for SC. (c) Spatial distribution of cold spot and hot spot analysis for CS. (d) Spatial distribution of cold spot and hot spot analysis for HQ.
Sustainability 18 02297 g004
Figure 5. Distribution of ecological functional zones in the Zhoushan Archipelago.
Sustainability 18 02297 g005
Figure 6. Pearson correlation analysis of four ESs in the Zhoushan Archipelago from 2000 to 2020. (a) Pearson correlation analysis in 2000. (b) Pearson correlation analysis in 2010. (c) Pearson correlation analysis in 2020. (Notes: * indicates a low-trade-off/synergy. ** indicates a moderate-trade-off/synergy. *** indicates a high-trade-off/synergy.)
Sustainability 18 02297 g006
Figure 7. Spatial distribution of trade-offs/synergies in the Zhoushan Archipelago from 2000 to 2020. (a) Spatial distribution of trade-offs/synergies of WY-SC. (b) Spatial distribution of trade-offs/synergies of WY-CS. (c) Spatial distribution of trade-offs/synergies of WY-HQ. (d) Spatial distribution of trade-offs/synergies of SC-CS. (e) Spatial distribution of trade-offs/synergies of SC-HQ. (f) Spatial distribution of trade-offs/synergies of CS-HQ.
Sustainability 18 02297 g007
Table 1. Data type and source.
Data TypeData NameData SourcesYear
Land Use DataLand use/land coverThe 30 m annual land cover datasets and its dynamics in China from 1985 to 2023 [32]2000, 2010, 2020
Climate and Vegetation DataAverage precipitationNational Tibetan Plateau data center [33]2000, 2010, 2020
Average temperatureEnvironmental Meteorological Data Service Platform [34] 2000, 2010, 2020
Reference evapotranspirationNational Tibetan Plateau data center [33]2020
Root restricting layer depthNational Tibetan Plateau data center [33]2020
Plant available water content Harmonized World Soils Database version 2.0 [35]2020
Driver DataDigital elevation modelGeospatial Data Cloud [36] 2024
Normalized difference vegetation indexResource and Environmental Science Data Platform [37]2000, 2010, 2020
Soil typeResource and Environmental Science Data Platform [37]1995
Distance to the coastlineOpenStreetMap [38]2025
PopulationWorldPop Open Population Repository [39]2000, 2010, 2020
Spatial distribution of GDPResource and Environmental Science Data Platform [37]2000, 2010, 2020
Table 2. Total and average value of ESs in the Zhoushan Archipelago from 2000 to 2020.
YearWY (m3)Average (mm)SC (t)Average (t/hm2)CS (t)Average (t/hm2)HQ
200011.83 × 108864.0429.93 × 106207.8516.62 × 106115.420.52
201012.31 × 108901.2530.69 × 106213.1316.27 × 106112.990.49
202010.09 × 108739.5224.05 × 106167.0116.35 × 106113.540.45
Disclaimer/Publisher’s Note: The statements, opinions and data contained in all publications are solely those of the individual author(s) and contributor(s) and not of MDPI and/or the editor(s). MDPI and/or the editor(s) disclaim responsibility for any injury to people or property resulting from any ideas, methods, instructions or products referred to in the content.