


Abstract
River basins are not merely geographical spaces but also cultural-historical ecosystems, where the spatial patterns of Intangible Cultural Heritage (ICH) profoundly reflect the long-term interaction between human and environment, as well as contemporary transformations. While international research on ICH has evolved from conceptual clarification to interdisciplinary theory-building, and spatial quantitative methods have been widely applied to cultural heritage analysis, the spatial patterns, multi-scale structures, and “natural-human” driving mechanisms of ICH in continental arid river basins—particularly in the Tarim River Basin (TRB, China’s largest inland river and a key corridor of the Silk Road)—remain underexplored. To address this gap, this study takes 313 ICH items in the TRB as the research object. It uses ArcGIS 10.8.1 to visualize their spatial distribution and employs an integrated methodology—including global Moran’s I, kernel density estimation (KDE), DBSCAN spatial clustering, and geographical detector (Geodetector)—to systematically reveal their spatial characteristics and influencing factors. The findings indicate that: (1) The distribution of ICH exhibits a multi-scale feature of “global randomness with local clustering”: spatial autocorrelation is not significant at the county level, while at the micro-geographical scale, a dendritic structure characterized by “one axis, three cores, denser in the north and sparser in the south” emerges, which is highly coupled with the river network. DBSCAN clustering further identifies a “mainstem axis–tributary node” cluster system and a relatively high proportion of peripheral “noise” heritage points. (2) Agglomeration patterns vary significantly across different ICH categories, with traditional craftsmanship showing high clustering, while traditional sports, entertainment, and acrobatics display highly fragmented distributions. (3) The study reveals and validates a ternary “Water–Tourism–Urbanization” driving framework that predominantly shapes the spatial heterogeneity of ICH: water resources constitute a fundamental ecological threshold, whereas tourism development and urbanization have emerged as more explanatory social driving forces, with widespread nonlinear enhancement interactions between natural and human factors. This research moves beyond the traditional view of river basins as static cultural “containers,” providing empirical evidence for their dynamic nature as “cultural-ecological co-evolutionary systems.” The proposed ternary framework not only offers a new perspective for understanding the spatial resilience of ICH in arid regions and the potential risks of “spectacularization” and “spatial polarization” amid rapid changes, but also provides a scientific basis for spatial governance, culture-tourism integration, and the formulation of conservation strategies for ICH at the basin scale.
1. Introduction
Under the dual contexts of grand globalization narratives and the increasing emphasis on the value of local knowledge, the spatial distribution patterns, transmission status, and evolution mechanisms of Intangible Cultural Heritage (ICH) have emerged as a cutting-edge interdisciplinary research topic spanning human geography, historical geography, anthropology, and cultural ecology. International scholarship on ICH has evolved from clarifying core concepts, assessing values, and exploring preservation methodologies (Munjeri, 2004; Kowalska, 2024; Córdoba-Cely et al., 2025) [1,2,3], to the in-depth development of interdisciplinary theoretical frameworks and practical reflections (Arizpe, 2004; Lombardo et al., 2016) [4,5]. Studies have also extensively focused on cases of ICH nomination, preservation, and tourism utilization in specific regions or categories (Viana, 2024; Chami et al., 2019) [6,7]. Meanwhile, tourism, as a crucial arena for the revitalization and transmission of ICH, presents challenges and impacts in its planning and management that cannot be overlooked (Esfehani & Albrecht, 2018) [8]. Correspondingly, the application of Geographic Information Systems (GIS) and spatial statistical methods to quantitatively analyze the spatial patterns of cultural heritage has become commonplace internationally. However, when applying spatial quantitative tools originating from natural and economic sciences to ICH—a cultural phenomenon highly dependent on “context” and emphasizing “process” and “practice”—it is essential to remain vigilant against the potential risk of “de-contextualization.” Beneath the surface of spatial aggregation lies the complex interplay of human-environment interactions and historical trajectories.
As a major country rich in ICH resources, China has also witnessed vigorous development in related research. Existing studies have predominantly focused on the national or provincial scales, analyzing the spatial differentiation characteristics of ICH and their influencing factors from single dimensions such as the natural environment (topography, climate) or socioeconomic conditions (population, transportation, policy) (Liang et al., 2018; Yan et al., 2021; Gu et al., 2026) [9,10,11]. Methodologically, techniques like the nearest neighbor index, geographical concentration index, and kernel density estimation have been widely applied (Zhang et al., 2016; Wang et al., 2023) [12,13]. In recent years, some studies have begun to employ more refined methods such as DBSCAN spatial clustering to reveal the micro-scale agglomeration structures of ICH (Wang et al., 2024) [14]. Notably, within both global and particularly Chinese contexts, cultural heritage conservation is increasingly being integrated into the broader blueprint of national governance and regional development. The trajectory and institutional priorities of heritage governance in China, as systematically outlined by Dang et al. (2025) [15], reveal a shift from mere “project listing” management towards a more comprehensive framework emphasizing “spatial governance,” “community participation,” and “sustainable development.” This macro-context necessitates that micro-scale spatial studies of ICH possess greater policy insight and practical orientation. Consequently, integrating spatial analysis of ICH with heritage governance policies and tourism development mechanisms constitutes a vital pathway for enhancing the practical relevance of research. However, overall, existing studies still exhibit significant limitations in theoretical perspective, analytical scale, and driving framework.
First, there is a singularization of theoretical perspectives. Most studies treat river basins merely as static administrative “containers” or geographical backdrops for ICH, failing to adequately draw upon theoretical lenses such as the “cultural-historical system” (Braudel, 1972) [16] to understand heritage formation and distribution from the dynamic process of “human-water-land” co-evolution (Worster, 1985) [17]. Second, there is an imbalance in regional case studies and superficiality in mechanism exploration. Existing research has predominantly concentrated on ICH in large river basins within humid or semi-humid regions (e.g., the Yellow River, Pearl River basins), while paying severe insufficient attention to ICH in continental arid climate zones, particularly in the Tarim River Basin (TRB)—a vital lifeline of the Silk Road. The ICH in this basin originated within the context of extremely arid oasis ecology and a multicultural corridor; its spatial patterns inevitably exhibit a unique “arid zone logic.” Yet, relevant empirical research and theoretical refinement remain virtually absent. Third, there is fragmentation in the analysis of influencing factors. Most existing studies remain at the level of describing single-factor effects, lacking in-depth investigation and empirical testing of the nonlinear interactive effects between natural foundations (e.g., river systems) and contemporary socioeconomic drivers (e.g., tourism, urbanization). Uncovering the coupling mechanisms of multiple driving forces at the basin scale is key to understanding the contemporary configuration of ICH and its future evolution.
The Tarim River Basin (TRB), as China’s largest inland river and a critical corridor of the Silk Road, serves as an ideal case for exploring the aforementioned issues. It is not a single river but rather a composite ecosystem encircling the Taklamakan Desert, consisting of multi-sourced oasis systems. Its ICH represents the living crystallization of oasis civilization in arid regions, embodying unique ecological adaptability and cultural diversity. In light of this, this study poses the following core research questions: Under the dual contexts of global arid-zone cultural heritage research and watershed-scale cultural heritage governance in China, what multi-scale characteristics does the spatial pattern of ICH in the Tarim River Basin exhibit? How is its formation and differentiation driven by “natural-human” factors, particularly how does the “water–tourism–urbanization” ternary driving framework operate and interact? To address these questions, this study focuses on 313 national and autonomous regional-level ICH items within the basin, uses geographic information system software (ArcGIS 10.8.1) to present the spatial distribution characteristics of intangible cultural heritage in the region, and comprehensively applies methods including global Moran’s I, kernel density estimation, Density-Based Spatial Clustering of Applications with Noise spatial clustering, and geodetector analysis.
The objectives are to: (1) systematically reveal the spatial distribution patterns and agglomeration structures of ICH at both county and micro-geographical scales; (2) examine how, in contrast to conventional perceptions, natural constraints and socioeconomic factors—especially tourism and urbanization—interact to jointly shape and dominate the spatial differentiation of ICH in an extreme arid region; and (3) ultimately construct and validate an explanatory framework for ICH spatial differentiation applicable to arid-zone river basins. This aims to transcend the traditional view of river basins as static containers, empirically demonstrate their dynamic nature as “cultural-ecological co-evolutionary systems,” and provide new theoretical perspectives and scientific foundations for refining arid-zone cultural heritage geography theory, optimizing the current “inventory + venue” oriented conservation model, and promoting heritage sustainability through culture-tourism integration and spatial governance.
This paper first examines the spatial distribution characteristics of intangible cultural heritage (ICH) in the Tarim River Basin (TRB), then analyzes the influencing factors, and finally discusses the findings while proposing relevant countermeasures.
2. Materials and Methods
2.1. Study Area
The Tarim River, often referred to as the “Mother River” of Xinjiang, China, is situated in the northern part of the Tarim Basin in the Xinjiang Uygur Autonomous Region and ranks as the world’s fifth-largest inland river. Its basin is not only one of China’s most critical watersheds but also served as a vital corridor along the ancient Silk Road. Measured from its longest headstream, the Yarkant River, the Tarim River stretches 2486 km, making it the longest inland river in China. It originates from the Tianshan Mountains and the Karakoram Mountains, flows along the northern edge of the Taklimakan Desert—the largest desert in China—passing through counties and cities such as Aksu, Xayar, Kuqa, Luntai, Korla, and Yuli, finally flows into Lake Taitema. The total basin area covers 1.02 million km2, accounting for 61.4% of the total area of Xinjiang [18]. The Tarim River system consists of 144 tributaries and is conventionally described as “Four Sources and One Mainstem” based on its hydrological composition and convergence relationships. The mainstem is primarily fed by four source rivers: the Aksu River, the Yarkant River, the Hotan River and the Kaidu-Kongque River system (Figure 1 and Figure 2a). The upper section of the mainstem is formed by the convergence of the Aksu, Yarkant and Hotan Rivers near Xiaojiake in Awat County, Aksu Prefecture, ultimately flowing toward the Taitema Lake section. The Tarim River Basin falls within a typical continental arid climate zone. The Tarim River Basin is home to China’s largest desert—the Taklimakan Desert (Figure 1 and Figure 2a). Administratively, it spans five prefectures—Kashgar, Hotan, Kizilsu Kirghiz Autonomous Prefecture (Abbreviated as “Kezhou”), Aksu and Bayingolin Mongol Autonomous Prefecture (Abbreviated as “Bazhou”)—encompassing a total of 42 counties or county-level cities (Figure 1). Figure 1 further illustrates the general distribution of nine categories of ICH within the TRB. These are color-coded as follows: purple for quyi; red for traditional music; green for folk literature; yellow for traditional medicine; light blue for traditional arts; black for traditional dance; brown for traditional skills; pink for folklore; and dark green for traditional sports, recreation, and acrobatics.
Figure 1.
Spatial Distribution of ICH in the TRB.
Figure 2.
The Main Physical Geographical Environment and Tourism Potential of the TRB. Note: (a) shows the river system, oases, deserts, elevation, and major cities of the Tarim River Basin (aiming to display the natural elements); (b) illustrates the distribution of mean annual temperature in the Tarim River Basin for 2024 (aiming to display the annual temperature element); (c) presents the distribution of mean annual precipitation in the Tarim River Basin for 2024 (aiming to display the annual precipitation element); (d) displays the distribution of nationally designated A-grade scenic areas and oases in the Tarim River Basin (aiming to showcase tourism potential).
Furthermore, Figure 2. depicting the main physical geographical environment and tourism potential of the TRB, provides essential geographical context for understanding the spatial distribution mechanisms of ICH within the basin.
Among these, Figure 2a–c illustrate the primary natural environment of the basin. Figure 2a presents the distribution of the Taklimakan Desert, oases, major cities, and elevation. Key geographical elements include: the Taklimakan Desert (white area), which occupies most of the basin; oases (green areas), predominantly distributed along rivers in a belt-like pattern; and the river system (blue lines), comprising the Tarim River and its tributaries (such as the Aksu, Yarkant, Hotan, and Kaidu-Kongque Rivers). The elevation ranges from 255 m (low, indicated by light yellow) to 8569 m (high, indicated by dark brown/purple). Major cities, including Kashgar, Artux, Aksu, Korla, and Hotan, are located within oases that exhibit a “bead-like” distribution along the riverbanks, forming a typical “oasis corridor” pattern.
Figure 2b shows the mean annual temperature distribution for 2024, ranging from −30 °C (low, dark blue) to 15.5 °C (high, red/orange). The spatial pattern reveals lower temperatures in the northern and western mountainous regions (blue hues), the highest temperatures in the central Taklimakan Desert (orange-red hues) with significant diurnal variation, and moderate temperatures along the northern foothills of the Kunlun Mountains. Urban areas are predominantly situated within transitional zones of relatively moderate temperature.
Figure 2c displays the mean annual precipitation distribution for 2024, with values ranging from 7.3 mm (low, light blue) to 959.7 mm (high, dark blue). The distribution is characterized by the highest precipitation in the western mountainous regions (Pamir Plateau, southern Tianshan foothills), exceeding 900 mm, and extreme aridity in the central desert area with less than 10 mm. A general decreasing trend from northwest to southeast is evident, highlighting the pronounced arid regional characteristics.
Figure 2d illustrates the distribution of nationally designated A-grade scenic areas and oases, demonstrating the relationship between oasis distribution and tourism potential. The scenic areas are classified by grade (from lowest 2A to highest 5A), with the majority being 3A and 4A sites, while 5A sites (deep pink) are relatively fewer. The distribution pattern shows a high concentration of scenic spots within oasis zones. All sites are located within green oasis areas, with higher density in the west (especially around Kashgar, Artux, and Aksu) and sparser distribution in the east. This distribution aligns closely with river courses, reflecting a “settlement along water sources” pattern characteristic of human adaptation.
In summary, the natural environment of the Tarim River Basin is defined by an extremely arid continental climate and a distinctive “mountain-oasis-desert” interlaced pattern. Human activity is entirely dependent on rivers and oases, resulting in a punctuated, linear settlement structure. The distribution of A-grade scenic areas completely overlaps with oasis zones, with the western region (Kashgar-Aksu) serving as the cultural core area. Tourism development is currently dominated by medium-grade (3A/4A) scenic sites, indicating potential for further development of high-grade (5A) resources.
2.2. Data Sources and Processing
As traditional drama within the Tarim River Basin has not yet been included in the national or autonomous regional-level intangible cultural heritage (ICH) inventories, it is excluded from this study. This research compiles and organizes the national and autonomous regional-level ICH lists (including expanded items) within the TRB. After statistical aggregation by county/city, a total of 313 ICH items are identified and classified into nine categories: Folk Literature; Traditional Music; Traditional Dance; Quyi; Traditional Sports, Recreation & Acrobatics; Traditional Art; traditional skills; Traditional Medicine; Folk custom.
The data were obtained through two primary approaches. First, the ICH inventory data were collected. The national-level ICH lists were sourced from the five batches officially released by the Central People’s Government of China (https://www.gov.cn) and the China Intangible Cultural Heritage Network (https://www.ihchina.cn), with a cutoff date of 24 May 2021. The autonomous regional-level ICH lists were obtained from the six batches published by the Department of Culture and Tourism of the Xinjiang Uygur Autonomous Region (https://wlt.xinjiang.gov.cn), with a cutoff date of 20 August 2025. The geographical coordinates of ICH items were primarily determined based on the location of the declaring institution or the corresponding county/city government. Latitude and longitude were obtained using the Baidu Maps API and subsequently converted to the WGS84 coordinate system. Notably, prefectural and county-level ICH inventories within the TRB are still under development and were therefore excluded from this study.
Second, the data on influencing factors for spatial distribution include 13 variables: temperature, precipitation, elevation, transportation, regional Gross Domestic Product (GDP), population size, urbanization rate, tourist arrivals, tourism revenue, nationally designated Class-A scenic areas, cultural centers, museums, and nationally protected key cultural relics units. Among these, natural factors such as elevation, temperature, and precipitation collectively constitute the natural geographic and land resource foundation on which intangible cultural heritage depends. Except for the urbanization rate, all data are for the year 2024. Official statistics on prefecture- and county-level urbanization rates are significantly delayed, and the 2024 data have not yet been released. To address this issue and following common practices in studies of river-basin intangible cultural heritage [19], this study adopts urbanization rate data from the 2020 Seventh National Population Census as the core proxy variable. This approach is based on the following considerations: urbanization is a structural process with strong inertia and relatively slow changes; over a short-to-medium timeframe of 4–5 years, the ranking pattern of urbanization rates at the county level remains highly stable. Furthermore, census data represent the most authoritative and detailed source of urbanization information currently available, thereby maximizing data reliability.
Specifically, temperature (1 km resolution), precipitation (1 km resolution), and elevation (30 m resolution) data were obtained from the National Tibetan Plateau/Third Pole Environment Data Center (https://data.tpdc.ac.cn/). Transportation data (road network density) were sourced from OpenStreetMap (http://mapapi.poloha.net). Population data come from the 2024 China County Statistical Yearbook (County and City Volume), and urbanization rate data are from the Major Data of the 2020 Seventh National Population Census. GDP, number of cultural centers, tourist arrivals, and tourism revenue were obtained from the 2024 Statistical Bulletins on National Economic and Social Development and the 2025 Government Work Reports published on the official websites of the five prefectures within the Tarim River Basin. The number of nationally designated Class-A scenic areas was collected from the official website of the Xinjiang Uygur Autonomous Region Department of Culture and Tourism, while data on museums and nationally protected key cultural relics units were obtained from the official website of the National Cultural Heritage Administration of China (http://www.ncha.gov.cn). The 30 m spatial resolution oasis data for China were obtained from the National Tibetan Plateau Data Center (https://data.tpdc.ac.cn/zh-hans, accessed on 1 January 2020). The 1:100,000 desert distribution data for China were sourced from the National Cryosphere Desert Data Center (https://www.ncdc.ac.cn, accessed on 1 January 2020). It is particularly emphasized that all maps used in this paper are based on China’s standard administrative division data [GS(2024)0650] from the National Platform for Common Geospatial Information Services (https://www.tianditu.gov.cn/), with the base maps unaltered.
2.2.1. Global Moran’s I
Global Moran’s I is a statistical measure used to assess the overall spatial autocorrelation of data. It reflects the degree to which attribute values of spatial units are correlated with those of neighboring units, as defined by a spatial weight matrix or spatial proximity. By quantifying whether the attributes of spatial units exhibit significant clustering or dispersion across space [20], this index helps identify underlying spatial patterns. In this study, Global Moran’s I is employed to analyze the spatial distribution pattern of ICH within the TRB. The formula is expressed as follows:
where I represents the Moran’s I statistic, n is the number of spatial units, Xi and Xj are the attribute values of units i and j, is the mean of the attribute values, and denotes the spatial weight matrix. An I > 0 indicates positive spatial autocorrelation, meaning that high values tend to be adjacent to high values (high-high clustering) and low values adjacent to low values (low-low clustering), resulting in a clustered pattern on the map. An I < 0 suggests negative spatial autocorrelation, where high values are surrounded by low values (or vice versa), typically displaying a dispersed or checkerboard distribution. When I = 0, no significant spatial correlation is observed, implying a random spatial arrangement.
2.2.2. Kernel Density Estimation (KDE)
Kernel Density Estimation is used to calculate the concentration degree of point or line features within their surrounding neighborhoods. It can visually reflect the spatial dispersion or agglomeration of intangible cultural heritage (ICH) and highlight hotspot areas of ICH concentration. The calculation model is as follows:
where f(x) represents the kernel density estimate at location x, n denotes the number of ICH points within the study area, h (h > 0) is the bandwidth determining the smoothness of the density estimation, K is the kernel function, x is the location to be estimated, and Xi is the actual data point. The term x − Xi indicates the distance from the estimated point x to the sample point Xi. A higher f(x) value indicates a denser distribution of ICH elements in that region.
2.2.3. Density-Based Spatial Clustering of Applications with Noise (DBSCAN)
DBSCAN is a representative density-based spatial clustering algorithm. It clusters points based on Euclidean distance, grouping core points and their density-reachable points into the same cluster, while labeling points that cannot be clustered as noise. The algorithm involves two key parameters: neighborhood radius (Eps) and minimum number of points (MinPts). The neighborhood radius defines the search range around a point, and the minimum number of points determines the density threshold for cluster formation. By setting Eps and MinPts, the cluster structure of spatial point sets can be identified. Points are categorized into three types: core points, border points, and noise points. A core point is defined as a point that has at least MinPts points within its Eps neighborhood. A border point has fewer than MinPts points within its Eps neighborhood but lies within the Eps neighborhood of a core point. Noise points are those that are neither core points nor border points. The Euclidean distance between two points is calculated as follows:
where A (x1, y1) and B (x2, y2) represent the coordinates of points A and B, respectively.
2.2.4. GeoDetector
The Geodetector is primarily employed to examine spatial heterogeneity in geographical phenomena and identify the underlying influencing factors. It encompasses interaction detection and factor detection to assess the spatial coupling between variables. To investigate the mechanisms through which human and geographical environments influence the spatial distribution of Intangible Cultural Heritage (ICH) in the Tarim River Basin (TRB), this study adopts the Geodetector model, expressed by the following formula:
In the formula, q denotes the degree to which the spatial differentiation of the target variable (dependent variable) is explained; L represents the number of strata obtained by stratifying the independent variable (classification or zoning); N refers to the total number of samples (or grid cells) in the study area; σ2 is the variance of the target variable over the entire region; Nh is the number of samples in stratum h; and σ h2 is the variance of the target variable within stratum h. A q value of 0 indicates no spatial association between the two variables, while q = 1 signifies a strong spatial association. Higher q values reflect a greater influence of the factor on the spatial distribution of ICH. Here, h = 1, 2, …, L denotes the number of strata for the independent or dependent variable; Nh and σh2 represent the unit count and variance within stratum h, whereas N and σ2 correspond to the unit count and variance for the entire region. In this study, the Geodetector model is applied to quantitatively examine the factors influencing the spatial distribution of ICH in the TRB. The dependent variable is the spatial kernel density of ICH items, while the independent variables comprise 13 indicators spanning natural, socio-economic, and cultural dimensions. By computing the q-statistic (indicating explanatory power) and p-value (significance level) for each factor, the Geodetector reveals the drivers of spatial heterogeneity in ICH. The q value ranges from 0 to 1, with higher values denoting stronger explanatory power. A p-value less than 0.05 indicates statistically significant influence.
3. Results
3.1. Overall Spatial Distribution Characteristics of ICH in the TRB
The Tarim River Basin contains a total of 313 ICH items at the national and autonomous regional levels, comprising 60 national-level and 253 autonomous regional-level items (Table 1). Excluding traditional drama, the basin encompasses nine ICH categories (including expanded items). Spatially, Kashgar Prefecture holds the highest concentration with 105 items (22 national and 83 regional), accounting for 33.5% of the basin’s total. It is followed by Bazhou (73 items: 14 national, 59 regional), Aksu Prefecture (50 items: 9 national, 41 regional), and Hotan Prefecture (48 items: 9 national, 39 regional), which together form a high-density belt. In contrast, Kizilsu Kirghiz Autonomous Prefecture has the fewest items (37 items: 6 national, 31 regional). Nationally designated ICH represents a relatively low proportion overall (19.2%). Notably, Kashgar’s share of national-level items (21.0%) is higher than that of other well-watered oasis prefectures such as Aksu (18.0%) and Hotan (18.8%). In terms of categorical composition, Traditional Craftsmanship dominates with 96 items (15 national, 81 regional), constituting 30.6% of all ICH items. Conversely, Quyi is represented by only three items, all at the autonomous regional level.
Table 1.
Distribution of National and Autonomous Regional-level ICH Items in the TRB.
This study employed Global Moran’s I to analyze the spatial autocorrelation of Intangible Cultural Heritage (ICH) at the county/city level in the Tarim River Basin (Figure 3). As shown in Figure 3 Moran’s I = −0.095, p-value = 0.4722, and z-score = −0.719, indicating statistically insignificant spatial autocorrelation. This suggests that the ICH is distributed randomly across space, with neither significant clustering nor dispersion. The scatter plot exhibits a fitted slope of −0.214, where the LL and HL quadrants dominate, HH quadrants are rare, and LH quadrants appear sporadically. This pattern reflects a coexistence of scattered “high-value outliers” and “low-value depressions” among a few counties/cities, without distinct hotspot or coldspot clusters. The weak spatial heterogeneity further indicates that the spatial distribution pattern of ICH is primarily driven by regional socio-economic and cultural factors rather than geographic adjacency effects.
Figure 3.
Scatter plot of Global Moran’s I for the spatial distribution of ICH in the TRB.
Based on Kernel Density Estimation (KDE), the results were classified into five categories using the Jenks Natural Breaks method. After multiple rounds of debugging, the following key parameters were ultimately selected: Output cell size = 1000, Search radius = 50,000 km2, Method = Planar. The density values, from highest to lowest, were labeled as Levels I to V: Level I (0.0066–0.0109), Level II (0.0033–0.0065), Level III (0.0013–0.0032), Level IV (0.0004–0.0012), and Level V (0.0000–0.0003).The results reveal a distinct spatial structure of ICH in the TRB, characterized by “one axis, three cores, and mosaic cold spots, ” which closely aligns with the hydrological network of the basin (Figure 4a). First, the “one axis” refers to the high-density cultural belt along the mainstem of the Tarim River (Level I, 0.0066–0.0109). This red-colored belt stretches approximately 1200 km from Kashgar—Awat—Xayar—Kuqa—Luntai—Korla, with a width of 30–50 km, coinciding precisely with the river valley and the adjacent oases. It contains about 58% of the basin’s ICH items, where traditions such as Xinjiang Muqam, copperware, pottery, and mulberry-bark paper have been passed down through generations, forming the cultural “main artery” of the basin. Second, the “three cores” correspond to three high-density clusters (Level II, 0.0033–0.0065) located at the outlets of the major tributaries:
- (1)
- Western Core: Kashgar–Atush Oasis (density values 0.0066–0.0109), formed by the alluvial fan where the Kizil, Gez, and Tuman Rivers converge.
- (2)
- Southern Core: Hotan–Moyu–Luopu Oasis (density around 0.0066), an elliptical high-density area formed by the outlets of the Yurungkash and Karakash Rivers.
- (3)
- Northern Core: Korla–Yuli Oasis (peak density 0.0109, the highest in the basin), a fan-shaped high-density zone at the outlet of the Kaidu–Kongque River.
Figure 4.
KDE and DBSCAN for the ICH in the TRB. (a) KDE results of the ICH in the TRB, (b) DBSCAN results of the ICH in the TRB.
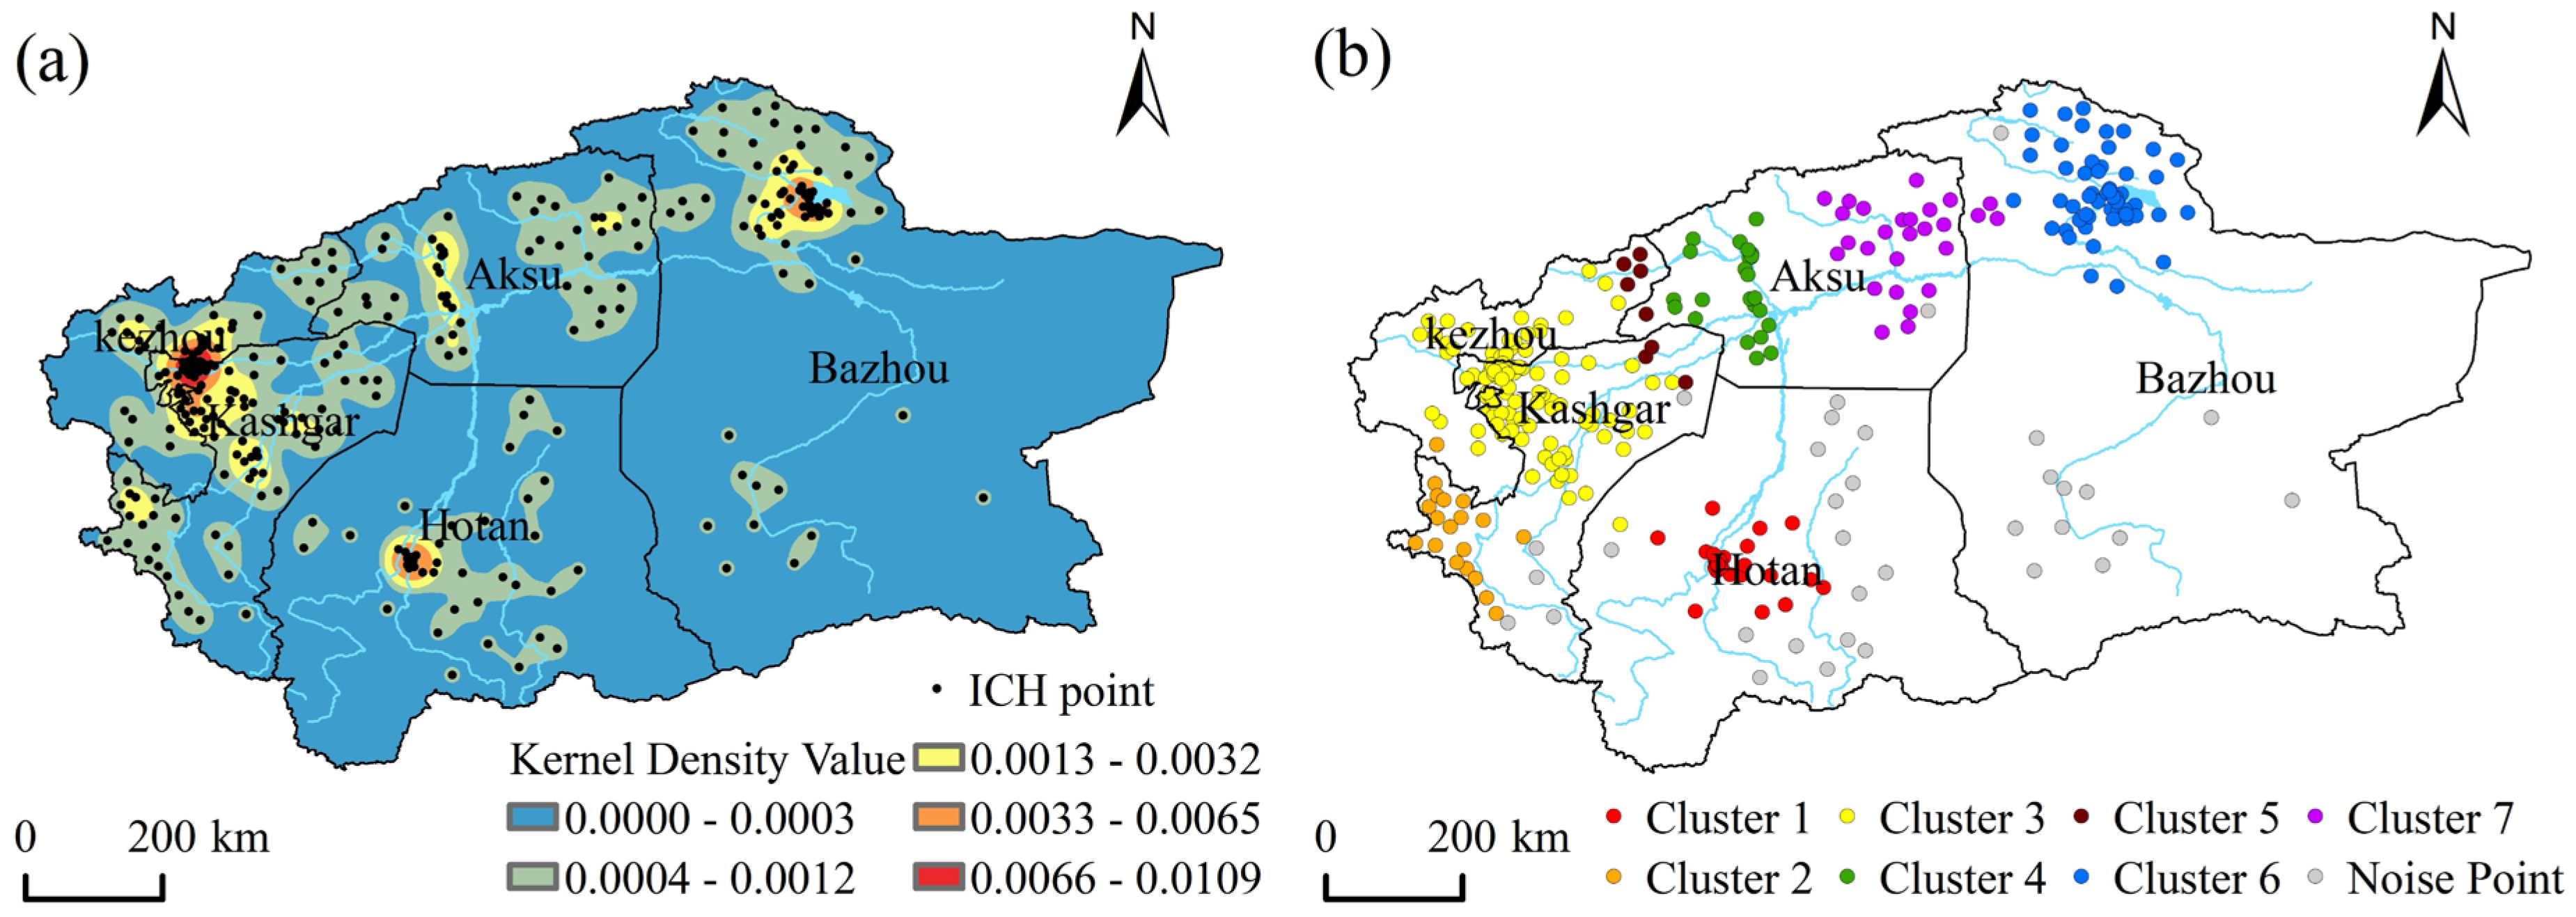
Overall, the distribution exhibits a pattern of “denser in the north and west, sparser in the south and east.” Oases along the southern foothills of the Tianshan Mountains (e.g., Korla, Luntai, Kuqa, Aksu) generally fall within the 0.0033–0.0065 range, while those along the northern foothills of the Kunlun Mountains (except Hotan) mostly show densities below 0.0013. The western Kashgar region is notably denser than the eastern Ruoqiang and Qiemo areas. The three cores are dominated by high-level performing arts (e.g., Twelve Muqam, Hotan Sanam, Lopnur Wedding) and refined handicrafts (e.g., Hotan carpets, Yengisar knives).Additionally, density peaks (Level I or II) appear at river confluences such as the Yarkant–Kashgar River junction (Kashgar City), the Hotan–Karakash River junction (Hotan City), and the Kongque–Weigan River junction (Korla City), highlighting the leveraging effect of hydrological nodes on cultural agglomeration. Finally, “mosaic cold spots” refer to low-density areas (Levels IV–V, density ≤ 0.0012) in desert regions beyond 50–80 km from the three cores. Covering about 73% of the basin—including the Taklimakan Desert, Lop Nur depression, and gravel gobi—their density drops sharply below 0.0003, appearing as extensive light-yellow to white cold patches. In the lower reaches of the Tarim mainstem (Taitema Lake section), river intermittency has led to a cultural “tail-off,” with ICH density falling to Level V. This creates a rare landscape of simultaneous “oasis–culture” discontinuity, starkly contrasting with the high-density oasis zones and underscoring the rigid constraint of river systems on ICH spatial differentiation. These areas contain only about 12% of ICH items, mostly low-frequency folk activities with large activity radii, such as the fishing-hunting customs of the Lop people in Ruoqiang.
The spatial distribution of intangible cultural heritage in the Tarim River Basin was analyzed using DBSCAN. Following the principles of high clustering stability, intra-cluster compactness, clear inter-cluster separation, and optimal clustering effectiveness, multiple parameter adjustments were conducted. The optimal parameter combination was ultimately determined as MinPts = 10 and Eps = 80 km, achieving the best clustering result with a total of seven clusters. The results reveal a dendritic spatial structure characterized by “one main trunk + three major tributary nodes + several T-shaped confluence peaks.” The hierarchy and type of clusters are determined by the river network (main streams and tributaries) and the scale of oases. Notably, the 80 km threshold corresponds precisely to the spatial transition zone between oasis and desert, serving as a demarcation line between cultural continuity and fragmentation (Figure 4b). Cluster 3 is the largest cluster, containing 112 ICH items distributed across Kashgar Prefecture and the Kezhou, including cities and counties such as Kashgar City, Shule County, Shufu County, Artux City, and Wuqia County. This area represents the most concentrated region of ICH within the TRB, highlighting a pronounced clustered distribution pattern. Cluster 6 is the second-largest ICH agglomeration in the basin, comprising 58 ICH items. It is primarily located in the Bazhou, encompassing areas such as Korla City, Bohu County, Hejing County, and Heshuo County.
The spatial analysis reveals distinct patterns in the distribution of ICH across the Tarim River Basin. A primary “Mainstem Corridor” is formed by Cluster 1, 3, 5 and 7, which align linearly within the 200 km-wide “Green Corridor,” exhibiting over 85% coincidence with the main river course and spaced 80–120 km apart—matching the DBSCAN Eps parameter. This zone, containing about 62% of all heritage items, functions as a continuous core axis shaped by the mainstem’s role in transportation, irrigation and oasis sustenance. In contrast, a “Tributary Node-Enclave” pattern emerges from Cluster 2, 4 and 6, located 150–220 km from the mainstem at the mountain-exit and confluence zones of the Yarkant, Aksu and Kaidu-Kongque Rivers. These independent nodes, corresponding to key cultural centers like Shache, Aksu, and Korla, contain only 22% of ICH items but concentrate high-level artistic forms such as Muqam, Sanam and copperware, highlighting the tributaries’ role in filtering and preserving elevated heritage. Notably, “Peak Density Zones” appear at the three confluences of Clusters 1/2 (Kongque River mouth), 3/4 (Aksu River mouth) and 5/6 (Yarkant River mouth), where heritage density increases over 1.5 times, forming T-shaped high-density belts that combine the mainstem axis with tributary nodes. This indicates that river confluence deltas provide fertile ground for cultural interaction and regeneration.
The DBSCAN algorithm identified 34 noise points, accounting for 10.86% of the total (Table 2). These noise points, termed the “desert-boundary” type, are scattered primarily along the margins of the Taklamakan Desert, over 200 km beyond the periphery of the identified clusters, and include heritage elements such as the Lop Nur Uyghur wedding customs. Located more than 80 km from the nearest oasis, these points are classified by DBSCAN as low-density areas, reflecting the rigid constraints imposed by the environment on cultural activities. The spatial scale, distance from rivers, and cultural typology of the seven clusters all exhibit significant gradient coupling with the integrity of the river network, revealing a typical model of synergistic evolution among “rivers, oases, and culture” in arid regions. This spatial pattern provides a geographical perspective for understanding the conservation and transmission of intangible cultural heritage resources within the river basin.
Table 2.
DBSCAN Clustering Results of ICH in the TRB.
3.2. Spatial Distribution Characteristics of ICH in the TRB
3.2.1. Analysis Results Based on KDE
Using the results of kernel density analysis applied to the ICH of the TRB, and following the principle of maximizing inter-class differences while minimizing intra-class differences, the data were classified into five categories employing the Jenks natural breaks method. The kernel density estimation reveals that all ICH items exhibit multi-level core agglomeration areas across the basin. The quantitative distribution of high-density core areas (primary and secondary levels) for each ICH category is shown in Table 3. Regarding the high-density core areas (primary and secondary levels) of ICH in the TRB: First, an overview of the overall distribution. There are 90 items in primary density zones, accounting for 28.8% of the total, and 78 items in secondary density zones, accounting for 24.9%. Combined, the high-level zones contain 168 items, representing 53.7% of the total. Second, analysis of the quantity of high-level core areas by ICH category. Primary density zones include 21 items of Traditional Craftsmanship, 17 items of Folk custom and 9 items of Traditional Music. Secondary density zones include 17 items of Traditional Music, 19 items of Traditional Craftsmanship, and 15 items of Folk custom. Categories such as Quyi, Traditional Fine Arts, and Traditional Medicine show limited presence in high-level zones. Traditional Dance performs relatively well in primary zones with 11 items but decreases to 8 items in secondary zones. Spatial distribution characteristics: The high-density core areas exhibit a “dual-core” structure: Traditional Craftsmanship combined with Folk custom forms the core of primary zones, while Traditional Music combined with Traditional Craftsmanship forms the core of secondary zones. Finally, significant gradient differences exist among categories, primarily manifesting as: “Single-peak” type: Traditional Craftsmanship, Folk custom and Traditional Dance peak in either primary or secondary zones. “Double-peak” type: Traditional Music shows a distribution of 9 items (primary), 17 items (secondary), and 18 items (tertiary), forming a “high–higher–high” plateau, indicating its strongest spatial penetration. “Cliff-drop” type: Quyi has minimal presence in primary zones and drops to zero from secondary zones onward, indicating very few high-level core areas and failed spatial diffusion.” Absence” type: No category is completely absent across all levels (including the fifth level), meaning that under the current assessment framework, there are no “ICH deserts” or completely blank grid cells; the lowest density still falls within the fourth level.
Table 3.
Number of High-Density Core Areas for Each Category of ICH in the TRB.
The kernel density surfaces of the nine categories of ICH in the TRB reveal a pronounced “dense in the north, sparse in the south” stepwise pattern (Figure 5). Spatially, primary core zones—encompassing less than 1% of the basin’s area—concentrate 28.8% of all ICH items and are entirely confined north of 39.5°N latitude: the Kongque River–Yuli Delta in Bazhou forms the largest contiguous patch (480 km2) containing all nine categories with the basin’s highest density peak of 0.0013 (Figure 4a); the Weigan–Kuche River alluvial fan in Aksu forms a 210 km2 sector hosting seven categories with a secondary peak of 0.00041; while the Jiashi–Bachu Oasis in the lower Kashgar River displays a 95 km2 primary patch covering only five categories and a reduced peak of 0.00034. Notably, no primary zones occur in Hotan or Kizilsu, creating a sharp spatial contrast. Secondary core zones (0.00015–0.00025) serve as transitional corridors linking these nuclei into an east–west high-density belt: Bayingolin’s 890 km2 secondary zone along the upper Tarim mainstem still hosts all nine categories; Aksu’s 620 km2 zone lacks Quyi; Kashgar’s 310 km2 zone gains Folk Literature and Traditional Fine Arts; Hotan appears for the first time with a 120 km2 patch containing three categories (Dance, Fine Arts, and Craftsmanship); and Kizilsu presents only 60 km2 enclaves of Folklore and Music. Tertiary zones (0.00010–0.00015) form the outermost tier with expanded area but further fragmented completeness: Bazhou, with a 1600 km2 buffer, is the only prefecture maintaining a complete gradient (primary–secondary–tertiary) for all nine categories; Aksu lacks tertiary nodes for Quyi and Traditional Medicine; Kashgar, while adding tertiary presence for Traditional Medicine, still misses primary zones for four categories; and Hotan and Kizilsu sustain tertiary gradients for only three and two categories, respectively, failing to establish continuous hierarchical structures. In terms of categories, Traditional Skills forms the longest density gradient with an extreme peak of 0.00130, its tertiary extensions reaching the Hotan River outlet and Kizilsu valleys; Folklore and Traditional Music follow with peaks of 0.00041 and 0.00034, spanning five prefectures; Traditional Dance, Fine Arts, Folk Literature, and Medicine exhibit successively lower peaks, with primary zones limited to 2–3 prefectures and shorter gradients; whereas Traditional Sports, Entertainment & Acrobatics and Quyi—with peaks below 0.00008 and no primary zones anywhere—display the shortest gradients, their spatial influence compressed into a narrow Bayingolin–Kashgar corridor, representing the “depressed endmembers” within the density hierarchy.
Figure 5.
KDE Results for Different Categories of ICH in the TRB. Note: given the significant quantitative disparities among different categories of intangible cultural heritage, it is necessary to set differentiated parameters for each category during clustering.
3.2.2. Analysis Results Based on DBSCAN
This study employed the DBSCAN algorithm to analyze the spatial clustering of ICH items in the Tarim River Basin. Given that the Quyi category contains only three items, distributed in Kashgar City (Kashgar Prefecture), Wuqia County (Kizilsu Kirghiz Autonomous Prefecture), and Hotan City (Hotan Prefecture) with mutual distances ranging approximately from 95 km to 600 km—indicating an evident absence of spatial clustering—this category was excluded from comparative cluster analysis and is described separately. Under the condition of maintaining a consistent search radius (Eps), the relative strength of spatial clustering intensity can be evaluated by comparing the sizes of the minimum number of samples (MinPts). With the search radius (Eps) uniformly set to 120 km, the optimal MinPts parameter for each ICH category was determined through iterative optimization (see Table 4). The clustering results (presented in Table 5 and Figure 6) show that the number of clusters formed by different types of intangible cultural heritage ranges from 1 to 4.
Table 4.
DBSCAN Clustering Parameters for ICH in the TRB.
Table 5.
DBSCAN Clustering Results for ICH in the TRB.
Figure 6.
DBSCAN Clustering Results of 8 Categories of ICH in the TRB. Note: distinct differences in the MinPts parameter settings are evident among different ICH categories.
From the DBSCAN clustering results reveal the “cluster–noise” structure in the spatial point sets of the eight ICH categories in the Tarim River Basin, which can be interpreted across three dimensions: “intra-cluster purity,” “inter-cluster differentiation,” and “noise escape.” First, intra-cluster purity: Traditional Skills exhibit a “single-cluster dominance,” with 51 items (53.13%) concentrated in Cluster 2, forming an absolute majority. This indicates that their spatial points are highly cohesive, demonstrating a significant “aggregation inertia.” In contrast, while Folk Custom and Traditional Music have 25 and 24 items falling into Cluster 1 and Cluster 3, respectively, their proportions do not exceed 50%, indicating a clear decline in intra-cluster purity and presenting a “multi-core parallel” pattern. Second, inter-cluster differentiation: Folk Custom and Traditional Music show a “dual-cluster standoff.” For Folk Custom, 25 items (48.08%) are in Cluster 1 and 7 items (13.46%) in Cluster 2, creating a spatial pattern of “large cluster vs. small cluster.” Traditional Music presents 24 items (47.06%) in the spatially distant Cluster 3, juxtaposed against 10 items in Cluster 1, forming an east–west standoff corresponding to the lower reaches of the Kashgar River and the Kongque River Delta, respectively. The distribution of music-related heritage shows a greater preference for linear corridors along “river valleys + oasis edges, ” leading DBSCAN to partition them into two spatially separated, yet density-reachable, clusters. Third, noise escape: Traditional Sports, Recreation and Acrobatics exhibit “fragmented dispersion, ” with a noise ratio as high as 46.15%. Its 12 noise points are scattered across fragmented oasis zones such as the lower Tarim River and the terminal reaches of the Keriya River. This category demands the highest flexibility in venue and has a relatively small audience scale, allowing it to easily “migrate following water and pasture” among micro-oasis patches, thus demonstrating the strongest spatial escape behavior. Similarly, Traditional Arts (27.78%) and Traditional Dance (27.78%) also show relatively high noise ratios due to the temporary and episodic nature of their “square–festival” venues. Conversely, Traditional Skills (7.29%) and Traditional Medicine (21.43%) have the lowest noise ratios, indicating that their reliance on fixed material bases for transmission effectively suppresses spatial drift. Finally, absent clusters: Traditional Medicine and Folk Literature are characterized by “isolated cases outside clusters.” Traditional Medicine is completely absent from Cluster 3, and Folk Literature has zero items in both Cluster 3 and Cluster 4. This forces their proportions of the largest cluster to rise to 42.86% and 47.06%, respectively, which is not a result of high spatial aggregation but rather due to their small total sample sizes (14 and 17 items) and their points being “crowded out” by other categories. Although their noise points are few, they exhibit characteristics of “distant isolated points,” reflecting that traditional activities like herb gathering and oral narration often extend into the oasis–desert transition zone, resulting in low single-point accessibility that is easily marked as noise by the algorithm.
In summary, by appropriately setting the MinPts parameter, the DBSCAN method effectively identifies typological differences in the spatial aggregation patterns of intangible cultural heritage within the TRB, thereby offering a scientific basis for the systematic conservation and spatial planning of local cultural resources.
3.3. Driving Factors of the Spatial Distribution of ICH in the TRB
ICH in the TRB exhibits a high-density spatial clustering pattern, with notable dispersion across different regions. Based on the current distribution of ICH and drawing on previous research, this study investigates the driving factors behind its spatial distribution by analyzing three dimensions—geographical environment, socio-economic conditions, and tourism and cultural resources—using the differentiation detection and interaction detection methods of the Geodetector. The analysis takes the number of ICH items at the county (city) level as the dependent variable and selects 13 indicator variables (Table 6) as factor variables for geographical detection, aiming to reveal the influence of each factor.
Table 6.
Evaluation Indicators and Detection Results of Influencing Factors.
It should be noted that cultural value is a core evaluation criterion in the rating of National A-grade tourist attractions in China. ICH serves as an important indicator in the assessment of such attractions, particularly for higher-level ones (e.g., 4A, 5A). The 2024 issued Classification and Rating of Tourist Attractions explicitly specifies “exhibition and performance projects of intangible cultural heritage” [21] as a key component under the “integration of culture and tourism.” Therefore, this study incorporates National A-grade tourist attractions as an indicator within the tourism and cultural resources dimension.
3.4. Differentiation Detection of Influencing Factors
This study employed the GeoDetector to quantify the driving factors influencing the spatial distribution of ICH in the TRB. Among them, X1: Mean Annual Temperature, X2: Annual Precipitation, X3: Elevation, X4: Transportation, X5: GDP, X6: Population Size, X7: Urbanization Rate, X8: Tourist Arrivals, X9: Tourism Revenue, X10: National A-grade Attractions, X11: Cultural Centers, X12: Museums, X13: Major Historical & Cultural Sites. The results indicate that socio-economic factors constitute the dominant force shaping the spatial differentiation of ICH, followed by tourism and cultural resource factors, while geographical environmental factors exert the weakest influence. This finding reaffirms the conclusions of existing academic research—geographical factors exert the weakest effect [22]. This finding reveals that in the formation of the spatial distribution pattern of ICH in the Tarim River Basin, the impact of human activities significantly surpasses that of the geographical environment. Specifically, within the geographical environment dimension, the explanatory power of annual precipitation (q = 0.294) far exceeds that of factors such as mean annual temperature (q = 0.128) and elevation (q = 0.134). In the socio-economic dimension, the urbanization rate (q = 0.210) demonstrates a greater influence than other factors. Among tourism and cultural resources, tourist arrivals (q = 0.283) exhibit a stronger impact.
3.4.1. Geographical Environment
All cultural practices of humankind are inseparable from the geographical spaces they rely on. Specific resource endowments and spatial carriers are prerequisites for the emergence and development of culture. From the perspective of geographical environmental factors, the Tarim River Basin is deeply inland, characterized by alternating mountains and basins, where the extreme arid environment imposes rigid constraints on the “survival threshold” of ICH in the region. The detection results indicate that annual precipitation ranks first among all influencing factors and has the strongest explanatory power for the spatial distribution of ICH in the basin. Although its p-value (0.064) slightly exceeds the significance threshold of 0.05, it holds marginal significance within the context of arid regions, suggesting that water accessibility remains a fundamental constraint determining the sustainability of ICH in such environments. Water availability directly determines the scale of oases, population concentration, and the mix of farming and pastoral practices, thereby influencing whether folk festivals (such as Meshrep and Eid al-Adha) and production crafts (such as mulberry bark papermaking and carpet dyeing) can be maintained locally. In contrast, mean annual temperature (q = 0.128) and elevation (q = 0.134) are not statistically significant, with p-values greater than 0.35, indicating limited explanatory power. This suggests that extreme temperatures or altitudinal differences are not key natural barriers to ICH differentiation, and extreme diurnal temperature variations or elevation contrasts between mountains and deserts have limited independent explanatory power for spatial variation in ICH. Instead, they indirectly affect oasis carrying capacity through the combined effects of “temperature–precipitation–vegetation.” In other words, within the geographical environment factors, it is “water” rather than “heat” or “topography” that plays the filtering role. Precipitation gradients along the southern slopes of the Tianshan Mountains and the northern slopes of the Kunlun Mountains form belt-like “wet islands,” providing beaded survival spaces for ICH, while the vast desert areas serve as a blank background for cultural distribution.
3.4.2. Socio-Economic Factors
As a living cultural practice created by humanity, ICH embodies the essence of different historical periods and serves as a cultural gene that perpetuates collective memory. The detection results indicate that the influence of socio-economic factors on the spatial distribution of ICH in the Tarim River Basin, ranked by q-statistic (explanatory power) from highest to lowest, is as follows: Tourist Arrivals (X8) (q = 0.283) > Tourism Revenue (X9) (q = 0.238) > Urbanization Rate (X7) (q = 0.210) > GDP (X5) (q = 0.175) > Population Size (X6) (q = 0.085) > Transportation (X4) (q = 0.057). Tourism development and urbanization are the most significant factors influencing the spatial distribution of ICH. Specifically, Tourist Arrivals (X8) has the highest q-statistic and passes the test of statistical significance (p = 0.018), indicating that the scale of tourist flow holds the strongest explanatory power for ICH agglomeration. This reflects the spatial response of ICH resources driven by the tourism market. The Urbanization Rate (X7) is also statistically significant (p = 0.030), suggesting that increased urbanization significantly promotes the spatial clustering of ICH, likely associated with rising cultural consumption demand, improved conditions for transmission, and policy support during the urbanization process. Additionally, Tourism Revenue (X9) shows a significant influence (p = 0.044), further corroborating the positive correlation between tourism economic benefits and the preservation and living transmission of ICH. Although GDP (X5) does not pass the significance test (p = 0.149), its relatively high q-statistic implies a certain potential influence of overall regional economic development level on ICH distribution. However, its effect may be overshadowed by more direct factors such as tourism and urbanization. Population Size (X6) has a low q-statistic and is not significant (p = 0.382), indicating that population size itself is not a key explanatory variable for the spatial differentiation of ICH. ICH agglomeration relies more on structural socio-economic conditions rather than sheer population numbers. Notably, Transportation (X4) has the lowest q-statistic and shows no statistical significance (p = 0.392). This result suggests that transportation infrastructure has a relatively weak direct impact on the spatial pattern of ICH at the basin scale. The distribution of ICH is likely more concentrated in historical-cultural nodes or tourist destinations, rather than simply extending along major transportation corridors. This implies that the locational selection of ICH resources exhibits distinct cultural-ecological and socio-economic orientations, with relatively limited dependence on transportation accessibility.
3.4.3. Tourism and Cultural Resources
The formation and evolution of ICH in the TRB are closely intertwined with the specific tourism and cultural resources in its context. The study reveals significant differences in the degree of influence of various factors on the spatial distribution pattern of ICH, ranked in descending order of explanatory power (q-statistic) as follows: National A-grade Tourist Attractions (X10) (0.189) > Museums (X12) (0.015) > Major Historical and Cultural Sites Protected at the National Level (X13) (0.014) > Cultural Centers (X11) (0.000). National A-grade tourist attractions, museums, and cultural heritage sites serve as important carriers for the protection and transmission of ICH. Among these, National A-grade attractions show marginal significance, while cultural centers and museums exhibit almost zero explanatory power. This indicates that static cultural facilities have little explanatory power for ICH distribution. The truly influential factor is the “living exhibition context” provided by National A-grade tourist attractions, meaning there is a significant positive spatial correlation between ICH distribution and the locations of these attractions. The revitalization and transmission of ICH commonly rely on the display platforms within National A-grade attractions. Through tourist observation and market mechanisms, these platforms selectively shape and reshape the spatial expression of ICH. This reflects that “living contexts” are key mediators in the spatial differentiation of ICH. As a “gaze-consumption” complex, National A-grade attractions extract, condense, and standardize folk customs originally embedded in daily life through interpretive systems, performance programs, and cultural creative products, causing ICH to spatially align with the hierarchical gradient of attraction ratings: areas concentrated with 5A and 4A attractions, such as the southern slopes of the Tianshan Mountains, the Kashgar-Hotan oases, and the Lop Nur Villages in the lower reaches of the Tarim River mainstream, have become high-density clusters of ICH landscape transformation. In contrast, regions with only cultural centers or township cultural stations, lacking sustained attention and consumer markets, often see ICH projects—even if officially listed—succumb to an “archival fate,” manifesting as random scattered points in space. This spatial coupling is rooted in the interactive mechanism of culture-tourism integration: tourist attractions provide markets and contexts for the living transmission and innovative utilization of ICH, while ICH enhances the cultural connotation and core appeal of destinations through its uniqueness and experiential value. In culturally rich regions like the TRB, this symbiotic relationship between ICH and tourism has become a hallmark of high-quality regional cultural and tourism development.
In summary, the spatial pattern of ICH in the TRB is driven by a dual-axis dynamic of “precipitation–tourism demand.” This framework is operationalized through urbanization and National A-grade tourist attractions, which provide the key implementation contexts, while traditional static cultural facilities and macroeconomic scale serve only as background conditions. This reveals a hierarchical influence logic characterized by “natural marginal constraint—tourism market traction—urban and scenic site contextualization.”
3.5. Interaction Detection of Influencing Factors
The quantitative analysis using the GeoDetector reveals significant interaction effects among geographical environmental factors (mean annual temperature, annual precipitation, and elevation), GDP, and tourist arrivals. This interaction collectively strengthens the explanatory power regarding the spatial distribution pattern of intangible cultural heritage.
This study employed the Geodetector method to analyze 13 driving factors across three dimensions—geographical environment, socio-economic conditions, and tourism and cultural resources—focusing on their interaction effects to reveal how these factors couple and jointly shape the spatial pattern of ICH in the Tarim River Basin. Among them, X1: Mean Annual Temperature, X2: Annual Precipitation, X3: Elevation, X4: Transportation, X5: GDP, X6: Population Size, X7: Urbanization Rate, X8: Tourist Arrivals, X9: Tourism Revenue, X10: National A-grade Tourist Attractions, X11: Cultural Centers, X12: Museums, X13: Major Historical and Cultural Sites Protected at the National Level.The interaction detection results (Figure 7) indicate that the ICH spatial pattern is not determined by any single condition but is the outcome of long-term interactions among human activities, specific geographical environments, socio-economic dynamics, and tourism culture. The top six factor combinations in terms of explanatory power include: mean annual temperature (X1) ∩ annual precipitation (X2) (0.67), mean annual temperature (X1) ∩ tourist arrivals (X8) (0.64), mean annual temperature (X1) ∩ GDP (X5) (0.63), elevation (X3) ∩ GDP (X5) (0.62), and elevation (X3) ∩ tourist arrivals (X8) (0.60), demonstrating strong interactions among climatic, topographic, economic, and tourism factors. In contrast, interactions involving static cultural facilities, such as museums (X12) ∩ cultural centers (X11) (0.01) and cultural centers (X11) ∩ major historical and cultural sites (X13) (0.01), are extremely weak, and their interactions with other factors are generally minimal.
Figure 7.
Interaction Detection Results of Influencing Factors on the Spatial Distribution of ICH.Note:X1: Mean Annual Temperature, X2: Annual Precipitation, X3: Elevation, X4: Transportation, X5: GDP, X6: Population Size, X7: Urbanization Rate, X8: Tourist Arrivals, X9: Tourism Revenue, X10: National A-grade Tourist Attractions, X11: Cultural Centers, X12: Museums, X13: Major Historical and Cultural Sites Protected at the National Level.
4. Discussion
Through a multi-method spatial analysis of the Intangible Cultural Heritage (ICH) in the Tarim River Basin, this study reveals a series of profound findings that transcend mere spatial description and touch upon the formation mechanisms of cultural heritage as well as its contemporary fate. These findings not only delineate the unique spatiality of ICH in extreme arid regions but also compel a re-examination of the complex relationship between natural and human elements in shaping cultural landscapes. Furthermore, they prompt a critical reflection on the ethics and effectiveness of heritage conservation under current development models centered on tourism and urbanization.
4.1. The “Water–Tourism–Urbanization” Ternary Driving Framework: A New Cognitive Lens on ICH Spatiality in Arid Regions
This study confirms that while the distribution of ICH in the Tarim River Basin does not exhibit global spatial autocorrelation, its internally highly structured “one-axis, three-core” pattern is evident. However, the quantitative results from the Geodetector propel us beyond this conventional understanding. Although annual precipitation (q = 0.294) demonstrates the strongest explanatory power among natural factors, its statistical significance is limited (p = 0.064), whereas tourist numbers and urbanization rate emerge as the dominant human-activity factors that pass stringent significance tests (p < 0.05). More importantly, interaction detection reveals that combinations such as “precipitation ∩ tourist numbers” produce an enhancement effect (q > 0.55) where the combined explanatory power exceeds the sum of individual parts (“1 + 1 > 2”). This indicates that in the contemporary TRB, water resources primarily serve the roles of an “ecological threshold” and “stage substrate, ” delineating the boundary of possibility for ICH survival; meanwhile, the “consumption pull” and “gaze demand” generated by the tourism market, alongside the “transmission context” and “innovation environment” shaped by urbanization processes, collectively determine whether ICH can be activated, performed, and flourish on the limited oasis “stage.” Quantifying the chain relationship of “river network structure—cultural clustering—driving factor coupling” at the basin scale reveals that 80 km constitutes the spatial threshold for the continuity and fragmentation of ICH in arid zones, corresponding to the oasis-desert transition zone. This profoundly corroborates the arid-region ecological logic that “water determines the oasis, and the oasis sustains culture.” This “Water-Tourism-Urbanization” ternary driving framework positions precipitation as providing the ecological niche foundation, while tourism and urbanization determine the intensity of cultural utilization, with transportation and infrastructure acting as amplifiers. This deepens our understanding of the spatiality of cultural heritage in arid regions: natural constraints are a necessary but insufficient condition for cultural existence, and contemporary socioeconomic vitality is the key engine driving its spatial differentiation and morphological evolution. This conclusion stands in complete contrast to findings from studies in humid, river-network-dense, and coastal developed regions. For instance, in the Jiangsu-Zhejiang-Shanghai (JZH) area [11], river systems function more as “channels” or “corridors” for cultural heritage distribution rather than “survival thresholds.”
4.2. The Tourist Gaze and the Ethical Reflection on Heritage Spectaclization and Spatial Polarization
Tourist volume and revenue have emerged as the most explanatory individual factors, with their effects closely dependent on the spatial vehicle of “National A-Grade Scenic Areas.” This finding aligns with Tian Yuxia et al. [23]. regarding the association between Xinjiang’s national-level ICH and tourism. Compared to previous studies, this research further reveals that the correlation between ICH and tourist attractions varies depending on the spatial clustering of the heritage items. DBSCAN analysis further indicates that clusters of traditional craftsmanship and traditional music with high agglomeration demonstrate a significant spatial overlap with high-grade (4A/5A) scenic areas, forming a “scenic area–heritage cluster” locking effect. Kernel density analysis shows that less than 1% of the basin area (primary core zones) concentrates 28.8% of all heritage projects. These findings collectively point to the potential for “spectacularization” and “spatial polarization” of ICH driven by tourism development: the Kashgar River Delta and the Kongque River Delta have become “dual cores, ” while areas along the middle reaches of the Hotan and Yarkand Rivers, due to their lower-grade scenic areas, form only secondary zones.
This finding significantly differs from the perspective of Gu [11], which emphasizes revitalizing ICH through “cultural-tourism integration” and “urban-rural coordination.” This “graded spectacularization” is particularly pronounced in arid regions, where scenic areas not only provide markets but also reconfigure the microenvironments of oases through landscaping, lighting, and staging, enabling ICH performances to persist on the fringes of deserts. Evidently, heritage types that are easily staged and commoditized are extracted from their original community-based living contexts, becoming recoded, condensed, and standardized within tourism hotspots. They are transformed into cultural consumer goods under the tourist gaze, creating “peaks” of display. Conversely, heritage that relies more on daily practice, is difficult to stage, or is located in tourism cold spots faces risks of marginalization, archivalization, or even disappearance. As Esfehani and Albrecht [8] note, utilizing ICH in tourism planning often faces challenges of authenticity dilution and community benefit imbalance. The spatial polarization revealed in this study is a direct geographical manifestation of this challenge. Therefore, future cultural-tourism integration policies must be wary of a simplistic “scenic-area-centric” approach. Instead, efforts should focus on building multi-level, networked display systems grounded in communities—such as developing cultural heritage corridors and community-based tourism routes—to promote spatial equity in heritage resources and diversity in their transmission.
4.3. Urbanization as a “Structural Juncture”: Policy Implications for Heritage Governance
This study finds that within the urbanization rate range of 45–65%, corresponding to the three oasis-centered cities of Kashgar, Aksu, and Korla, urbanization exerts a significant positive influence on the agglomeration of ICH. This conclusion not only identifies the impact of urbanization on the spatial distribution of ICH but also clarifies the specific range within which this influence operates. This finding diverges from the perspective of Kang et al. [24]. which suggested that urbanization has a limited effect on the spatial distribution of ICH. This discovery offers a new perspective for understanding the relationship between urbanization and cultural transmission. It may be because this urbanization level range corresponds to regional central cities within the TRB, such as Kashgar and Korla, which are in a “structural window period” where traditional community networks have not yet completely dissolved, while modern cultural services and consumer markets are initially forming. During this period, cities can provide relatively well-developed facilities, policy support, and market access while still retaining relatively rich traditional cultural foundations and social capital. This creates a unique social space for the “innovative transformation” of ICH. Dang [15] emphasized the importance of “community participation” and “living transmission” in China’s heritage governance. Therefore, heritage conservation policies during the urbanization process should accurately leverage this “window period,” avoiding large-scale demolition and construction that could disrupt traditional cultural fabrics. Instead, policies should promote community-based “micro-regeneration,” embedding ICH workshops, transmission centers, and thematic markets in older urban areas, while reserving low-cost cultural transmission spaces in the planning of new urban districts. This approach would ensure that urbanization becomes a process that nourishes rather than severs cultural roots.
4.4. The “Weak Independence–Strong Coupling” Paradox of Transport and Static Facilities
An intriguing finding is that the single-factor explanatory power of transportation density (road network) is the weakest and statistically insignificant. This stands in stark contrast to the conclusion of Zhang Shuying et al. [25]. in their Grand Canal study, which asserted that “road network density has the most significant impact.” This highlights the unique characteristic of ICH distribution in arid regions regarding its dependence on major transportation corridors. However, its interactive effects with factors such as precipitation and tourism are significantly enhanced, indicating that transportation in the TRB primarily functions as an “effect amplifier” or “connector,” rather than a “determinant” of spatial layout. Similarly, the single-factor explanatory power of static cultural facilities like museums and cultural centers is nearly zero, yet their interaction with tourism factors can also enhance their influence. This insight suggests that in the planning of heritage conservation and cultural-tourism integration in arid regions, we should not construct transportation arteries or cultural venues in isolation. Instead, an integrated, systemic planning approach of “facility-scenic spot-road-community” should be adopted. For example, initiatives such as tourist scenic byways, oasis greenways, and scenic area shuttle routes can be used to network dispersed heritage sites, static cultural facilities, and core scenic areas. Transforming isolated county-level cultural centers into “ICH waystations” along tourism routes can maximize the network effects and synergistic value of infrastructure.
4.5. Limitations and Future Research Directions
This study has certain limitations, which also point the way for future research. Firstly, there is an inconsistency in the temporal window of influencing factors. One challenge encountered during data collection was the relative lag in the official release of data for the key influencing factor “urbanization rate.” Due to data availability constraints, the 2020 census data were used for urbanization rate, resulting in a temporal discrepancy with other 2024 indicators. Although sensitivity analyses support the robustness of the main conclusions, future research should construct panel data to more accurately capture the temporal effects of dynamic factors such as urbanization. Secondly, while this study focuses on macro-spatial patterns and driving factor analysis, future work could integrate big data from social media, tourist trajectory data, and others to microscopically delineate how the tourist “gaze” specifically influences the practical content, transmission modes, and meaning reconstruction of ICH. Thirdly, drawing on the macro-governance perspective of Dang [15], the spatial findings of this study could be linked with heritage policy texts and funding inputs at different levels (national, autonomous region, local) for correlational analysis, revealing the interaction mechanisms between “policy space” and “cultural space.” Finally, incorporating land-use change data and long-term climate data series would deepen the understanding of ICH’s “ecological dependency” and vulnerability to climate change. Building on this paper, future research could collect multi-year panel data to construct a system dynamics model or a coupling coordination degree model of “economic growth-tourism development-urbanization-ICH vitality.” This would enable a quantitative assessment of the long-term sustainability of ICH transmission under different development pathways, thereby providing a scientific basis for formulating forward-looking regional development plans that are coordinated with cultural conservation.
5. Conclusions
Utilizing the global Moran’s I, kernel density estimation, DBSCAN spatial clustering, and geodetector methods within ArcGIS10.8.1, this study analyzes the spatial distribution characteristics of intangible cultural heritage in the Tarim River Basin. It reveals how geographical environmental factors, socioeconomic factors, and tourism-cultural resource factors exert influence and interact with one another. The research objectively reflects the uniqueness of intangible cultural heritage distribution in continental arid climate zones and suggests directions for future policy adjustments. The main findings are summarized as follows:
- (1)
- The Dual Nature of Spatial Patterns. The ICH in the Tarim River Basin exhibits a multi-scale characteristic of “globally random yet locally highly clustered” at the macro scale, challenging simplistic assumptions of spatial diffusion or aggregation. However, at the micro-geographical scale, it demonstrates a highly structured, dendritic agglomeration pattern described as “one axis, three cores, denser in the north and sparser in the south,” which is profoundly coupled with the river network-oasis system and closely aligns with the distribution of watercourses and oases. This reveals a spatially nested characteristic shaped by the combined effects of local ecological constraints and broader social complexity.
- (2)
- Marked Differences in Category-Specific Agglomeration. Traditional craftsmanship, folklore, and traditional music constitute the core categories of spatial agglomeration, while categories such as traditional sports, entertainment, and acrobatics exhibit more fragmented distributions. The “cluster-noise” structures across different categories reflect fundamental differences in the spatial dependencies inherent to their transmission and practice patterns.
- (3)
- The “Water–Tourism–Urbanization” ternary driving framework is proposed, which transcends previous studies’ singular explanatory approaches that predominantly emphasized either natural or social factors. By highlighting the hierarchical constraints and interactive enhancement relationships among these three dimensions, it offers a new analytical lens for understanding the spatiality of cultural heritage in global arid zones and other ecologically vulnerable regions.
In summary, the spatial pattern of intangible cultural heritage in the Tarim River Basin is the product of mutual shaping between its unique natural foundation and prolonged human activities. In contemporary times, the driving roles of tourism and urbanization have become increasingly prominent, while it is also crucial to guard against the risks of spatial polarization and the “spectacularization” of heritage. Only by deeply understanding the complex mechanism of this “water-tourism-urbanization” synergistic drive can strategies for protection and utilization be formulated that truly align with local realities and contribute to the long-term sustainable development of cultural diversity. This holds significant reference value not only for the Tarim River Basin but also for the conservation of cultural heritage in arid regions worldwide facing similar challenges.
Author Contributions
Conceptualization: Y.Z. and Y.Y.; Methodology: Y.Z., Y.Y., and W.W.; Validation: Y.Z., Y.Y., and W.W.; Data Curation: Y.Z. and W.W.; Investigation: Y.Z.; Formal Analysis: Y.Z. and Y.Y.; Writing—Original Draft: Y.Z.; Writing—Review & Editing: Y.Z. and Y.Y. All authors have read and agreed to the published version of the manuscript.
Funding
This research was supported by the Key Project of the National Social Science Fund of China (Grant No. 24AZS013). The funder played no role in the study design, data collection, analysis or interpretation, or in the writing of the manuscript.
Institutional Review Board Statement
Not applicable.
Informed Consent Statement
Not applicable.
Data Availability Statement
The datasets presented in this article are not readily available because portions of the data have not yet been publicly released by the relevant government authorities. Requests to access the datasets should be directed to the respective government departments.
Conflicts of Interest
The authors declare no conflicts of interest.
References
- Munjeri, D. Tangible and intangible heritage: From difference to convergence (Revisiting our understanding of the concept of ‘Heritage’). Mus. Int. 2004, 56, 12–19. [Google Scholar] [CrossRef] [Scilit]
- Kowalska, S. Intangible Cultural Heritage: Social Memory and the Axiology of Protection. Muzeol. A Kult. Dedicstvo Museol. Cult. Herit. 2024, 12, 63–75. [Google Scholar] [CrossRef] [Scilit]
- Córdoba-Cely, C.; De La Cruz, A. Pasto Varnish: 3d Virtualization of an Intangible Cultural Heritage. Virtual Archaeol. Rev. 2025, 16, 100–115. [Google Scholar] [CrossRef] [Scilit]
- Arizpe, L. Intangible cultural heritage, diversity and coherence. Mus. Int. 2004, 56, 130–136. [Google Scholar] [CrossRef] [Scilit]
- Lombardo, V.; Pizzo, A.; Damiano, R. Safeguarding and accessing drama as intangible cultural heritage. ACM J. Comput. Cult. Herit. 2016, 9, 1–26. [Google Scholar] [CrossRef] [Scilit]
- Viana, L.D. Beyond the confines of orality: The value of memory in the recording of intangible cultural heritage. Bol. Lit. Oral. 2024, 7, 358–369. [Google Scholar] [CrossRef] [Scilit]
- Chami, M.F.; Kajiru, E.J. Assessment of 12 years (2011–2023) implementation of the 2003 UNESCO convention on safeguarding Intangible Cultural Heritage (ICH) in Tanzania. Cogent Arts Humanit. 2023, 10, 2254044. [Google Scholar] [CrossRef] [Scilit]
- Esfehani, M.H.; Albrecht, J.N. Roles of Intangible Cultural Heritage in Tourism in Natural Protected Areas. J. Herit. Tour. 2018, 13, 15–29. [Google Scholar] [CrossRef] [Scilit]
- Liang, J.; Wang, H.M. Spatial Distribution Characteristics and Influencing Factors of Intangible Cultural Heritage in the Pearl River–Xijiang River Economic Belt. J. Soc. Sci. 2018, 12, 39–49. (In Chinese) [Google Scholar]
- Yan, H.L.; Wang, Y.Q.; Xiong, H. Spatial Distribution Characteristics and Influencing Factors of National-Level Folk Intangible Cultural Heritage. J. Northwest Norm. Univ. 2021, 4, 101–109. (In Chinese) [Google Scholar]
- Gu, Y.; Zhang, Y.W.; Hou, Y.F.; Yu, S.Y.; Li, G.L.; Huang, H.; Su, D. The Spatio-Temporal Characteristics and Influencing Factors of Intangible Cultural Heritage in Jiang-Zhe-Hu Region, China. Sustainability 2026, 18, 35. [Google Scholar] [CrossRef] [Scilit]
- Zhang, J.Y.; Gao, M.H. Spatial Distribution and Regional Zoning of Xinjiang Uygur Autonomous Region-Level Intangible Cultural Heritage. Arid. Land Geogr. 2016, 5, 1128–1134. (In Chinese) [Google Scholar]
- Wang, L.; Zhang, Y. Tourism Response and Influencing Factors of Intangible Cultural Heritage in Xinjiang. Tour. Sci. 2023, 2, 263–274. (In Chinese) [Google Scholar]
- Wang, X.R.; Zhang, T.J.; Duan, L.R.; Liritzis, I.; Li, J.S. Spatial distribution characteristics and influencing factors of intangible cultural heritage in the Yellow River Basin. J. Cult. Herit. 2024, 66, 254–264. [Google Scholar] [CrossRef] [Scilit]
- Dang, X.; Hong, Q.; Liu, W.; Wang, Y. China’s heritage governance blueprint: Revisiting evolutionary trajectories, reframing institutional priorities and mapping the national registry. Habitat Int. 2025, 165, 103541. [Google Scholar] [CrossRef] [Scilit]
- Braudel, F. The Mediterranean and the Mediterranean World in the Age of Philip II; Harper & Row: New York, NY, USA, 1972; pp. 17–22. [Google Scholar]
- Worster, D. Rivers of Empire: Water, Aridity, and the Growth of the American West; Pantheon Books: New York, NY, USA, 1985; pp. 28–35. [Google Scholar]
- Great Rivers Roaring. Large-Scale Media Reporting Campaign on the Tarim River Basin Launched. Xinjiang Daily, 26 July 2022; p. 1. (In Chinese)
- Nie, X.; Xie, Y.; Xie, X.X.; Zheng, L.X. The characteristics and influencing factors of the spatial distribution of intangible cultural heritage in the Yellow River Basin of China. Herit. Sci. 2022, 10, 121–137. [Google Scholar] [CrossRef] [Scilit]
- Getis, A.; Ord, J.K. The Analysis of Spatial Association by Use of Distance Statistics. Geogr. Anal. 1992, 24, 189–206. [Google Scholar] [CrossRef] [Scilit]
- National Standard: Classification and Grading of Tourist Attractions [EB/OL]. Available online: https://wlt.hlj.gov.cn/wlt/c115779/202409/c00_31771155.shtml (accessed on 24 September 2024).
- Liu, C.C.; Kang, L. How Do Geographical Factors Affect the Distribution of Intangible Cultural Heritage: A Case Study of Xinjiang, China. Sustainability 2023, 15, 9. [Google Scholar] [CrossRef] [Scilit]
- Tian, Y.X.; Xie, X. Spatial Distribution Characteristics and Influencing Factors of National-Level Intangible Cultural Heritage in Xinjiang. J. Xinjiang Univ. 2020, 3, 362–369. (In Chinese) [Google Scholar]
- Kang, L.; Yang, Z.; Han, F. Spatial Distribution and Influencing Factors of Intangible Cultural Heritage in Xinjiang. J. Desert Res. 2022, 1, 158–166. (In Chinese) [Google Scholar]
- Zhang, S.Y.; Zhang, X.; Liu, J.M. Spatial distribution and pedigree age of intangible cultural heritage along the Grand Canal of China. Herit. Sci. 2024, 12, 246. [Google Scholar] [CrossRef] [Scilit]
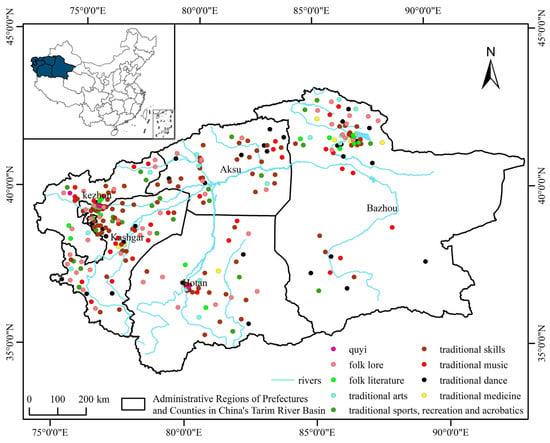
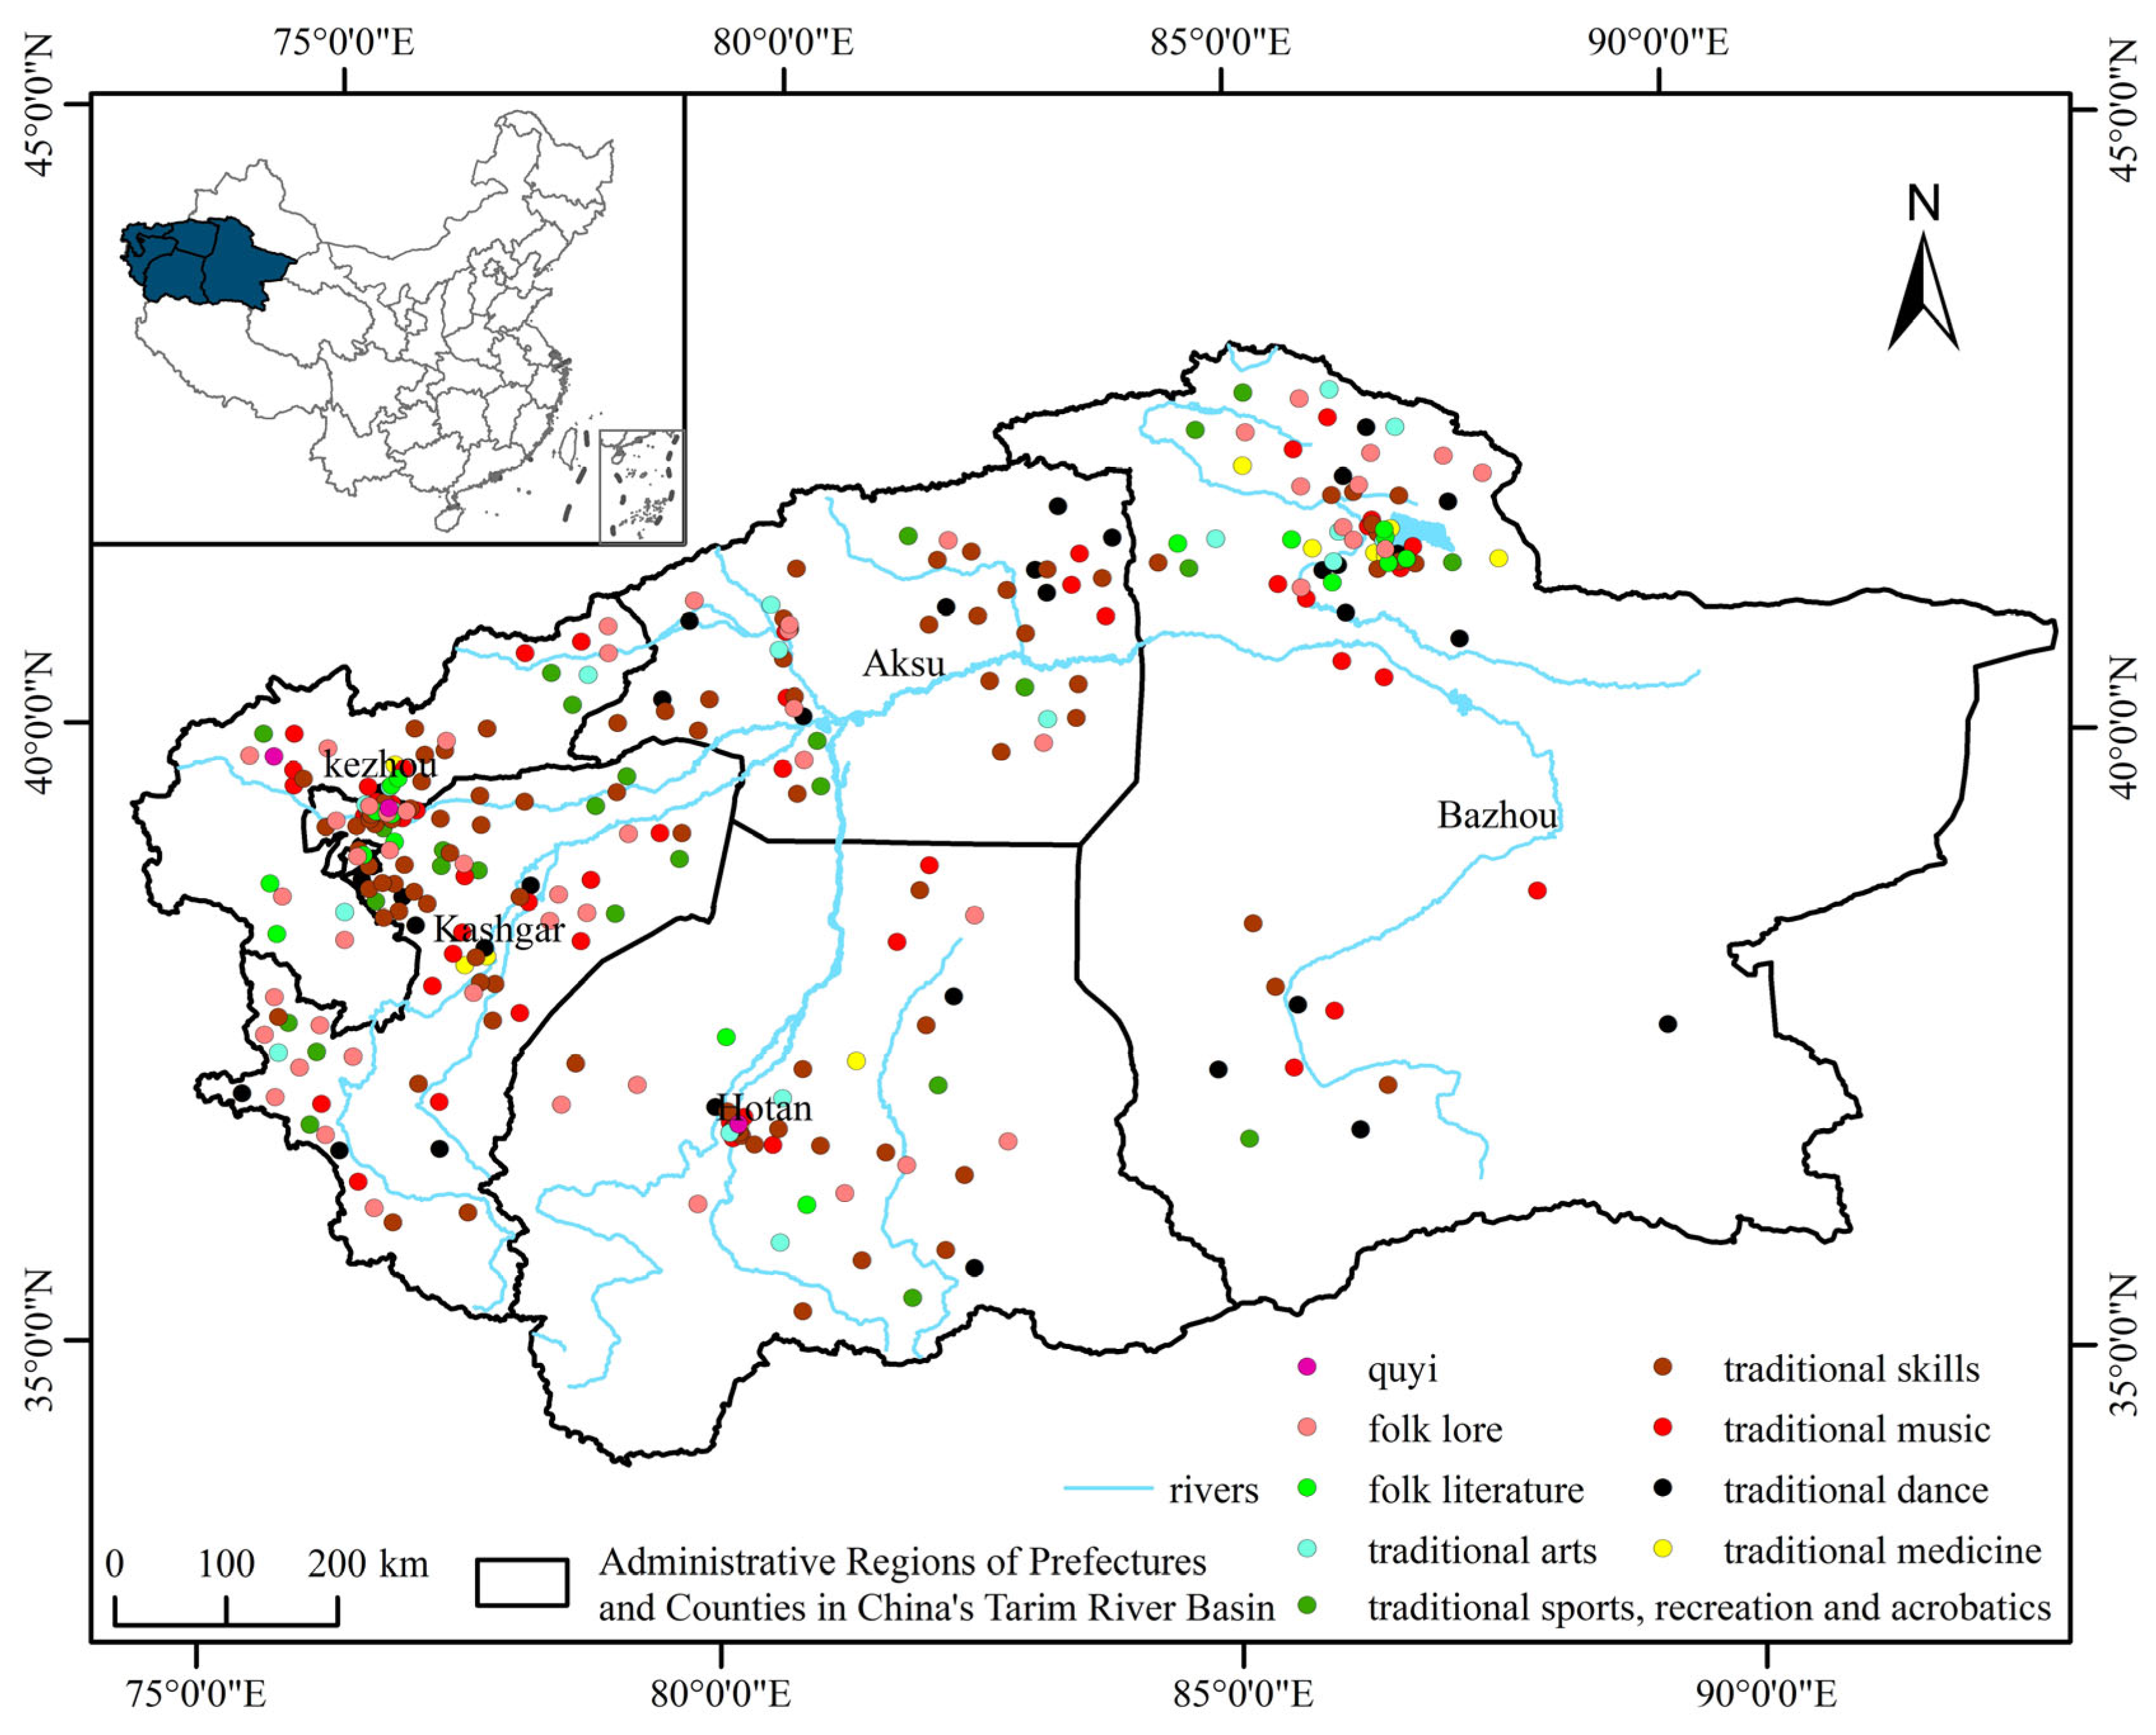
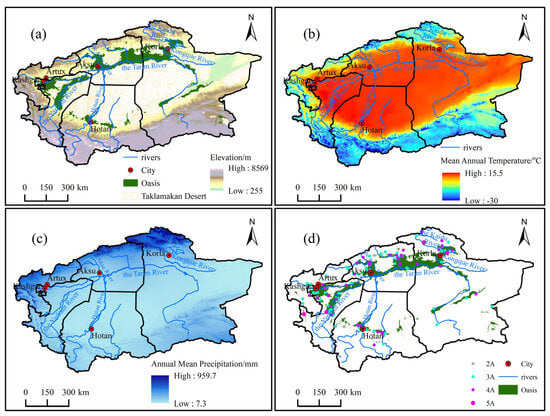
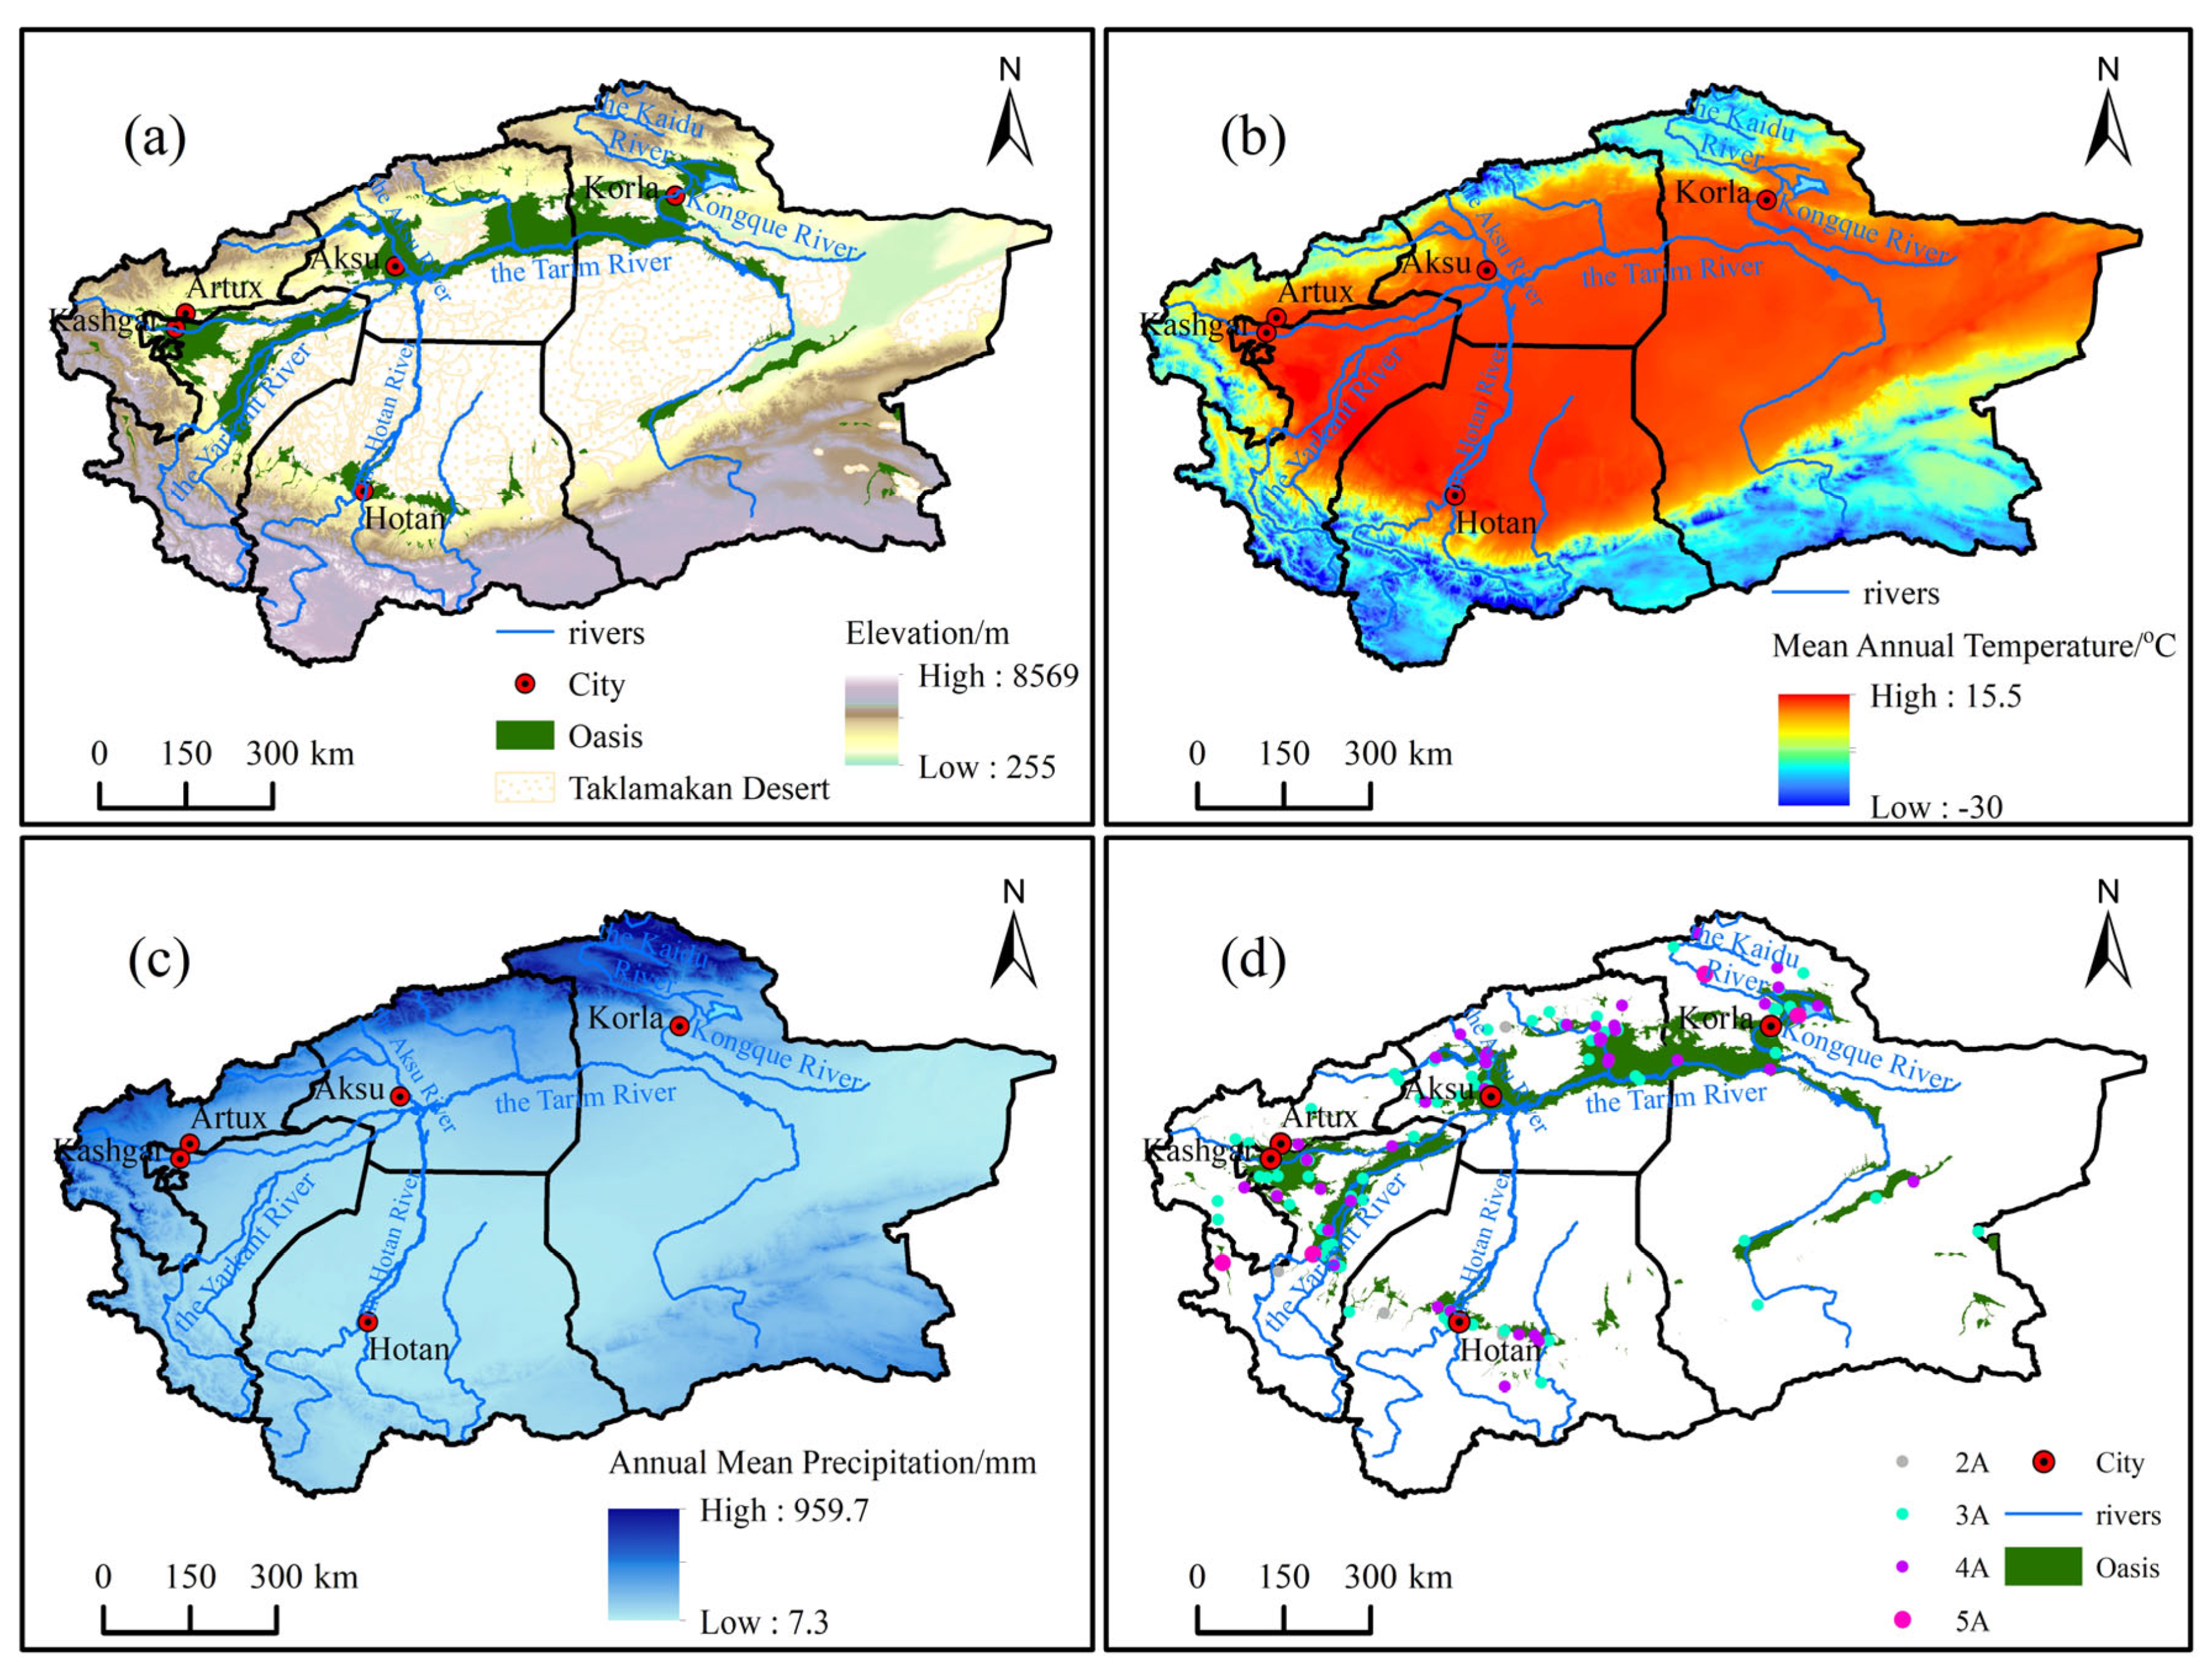
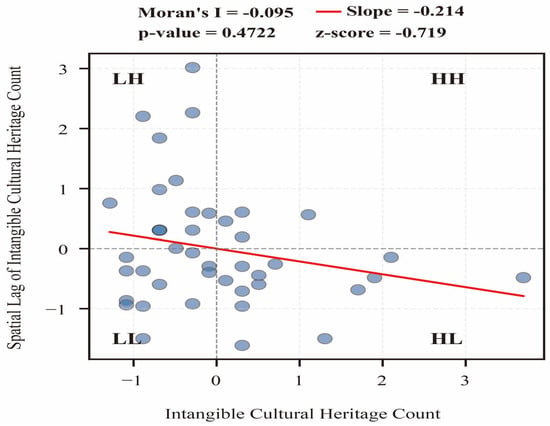
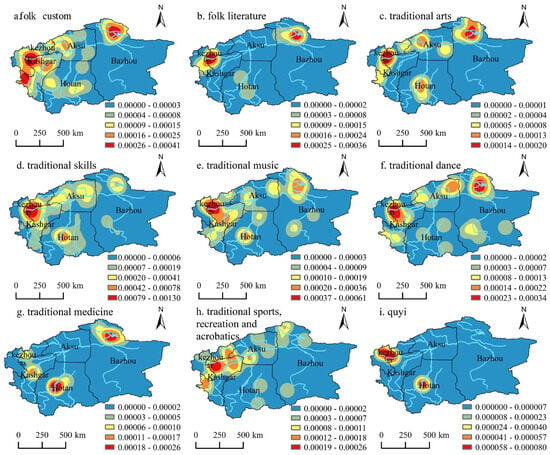
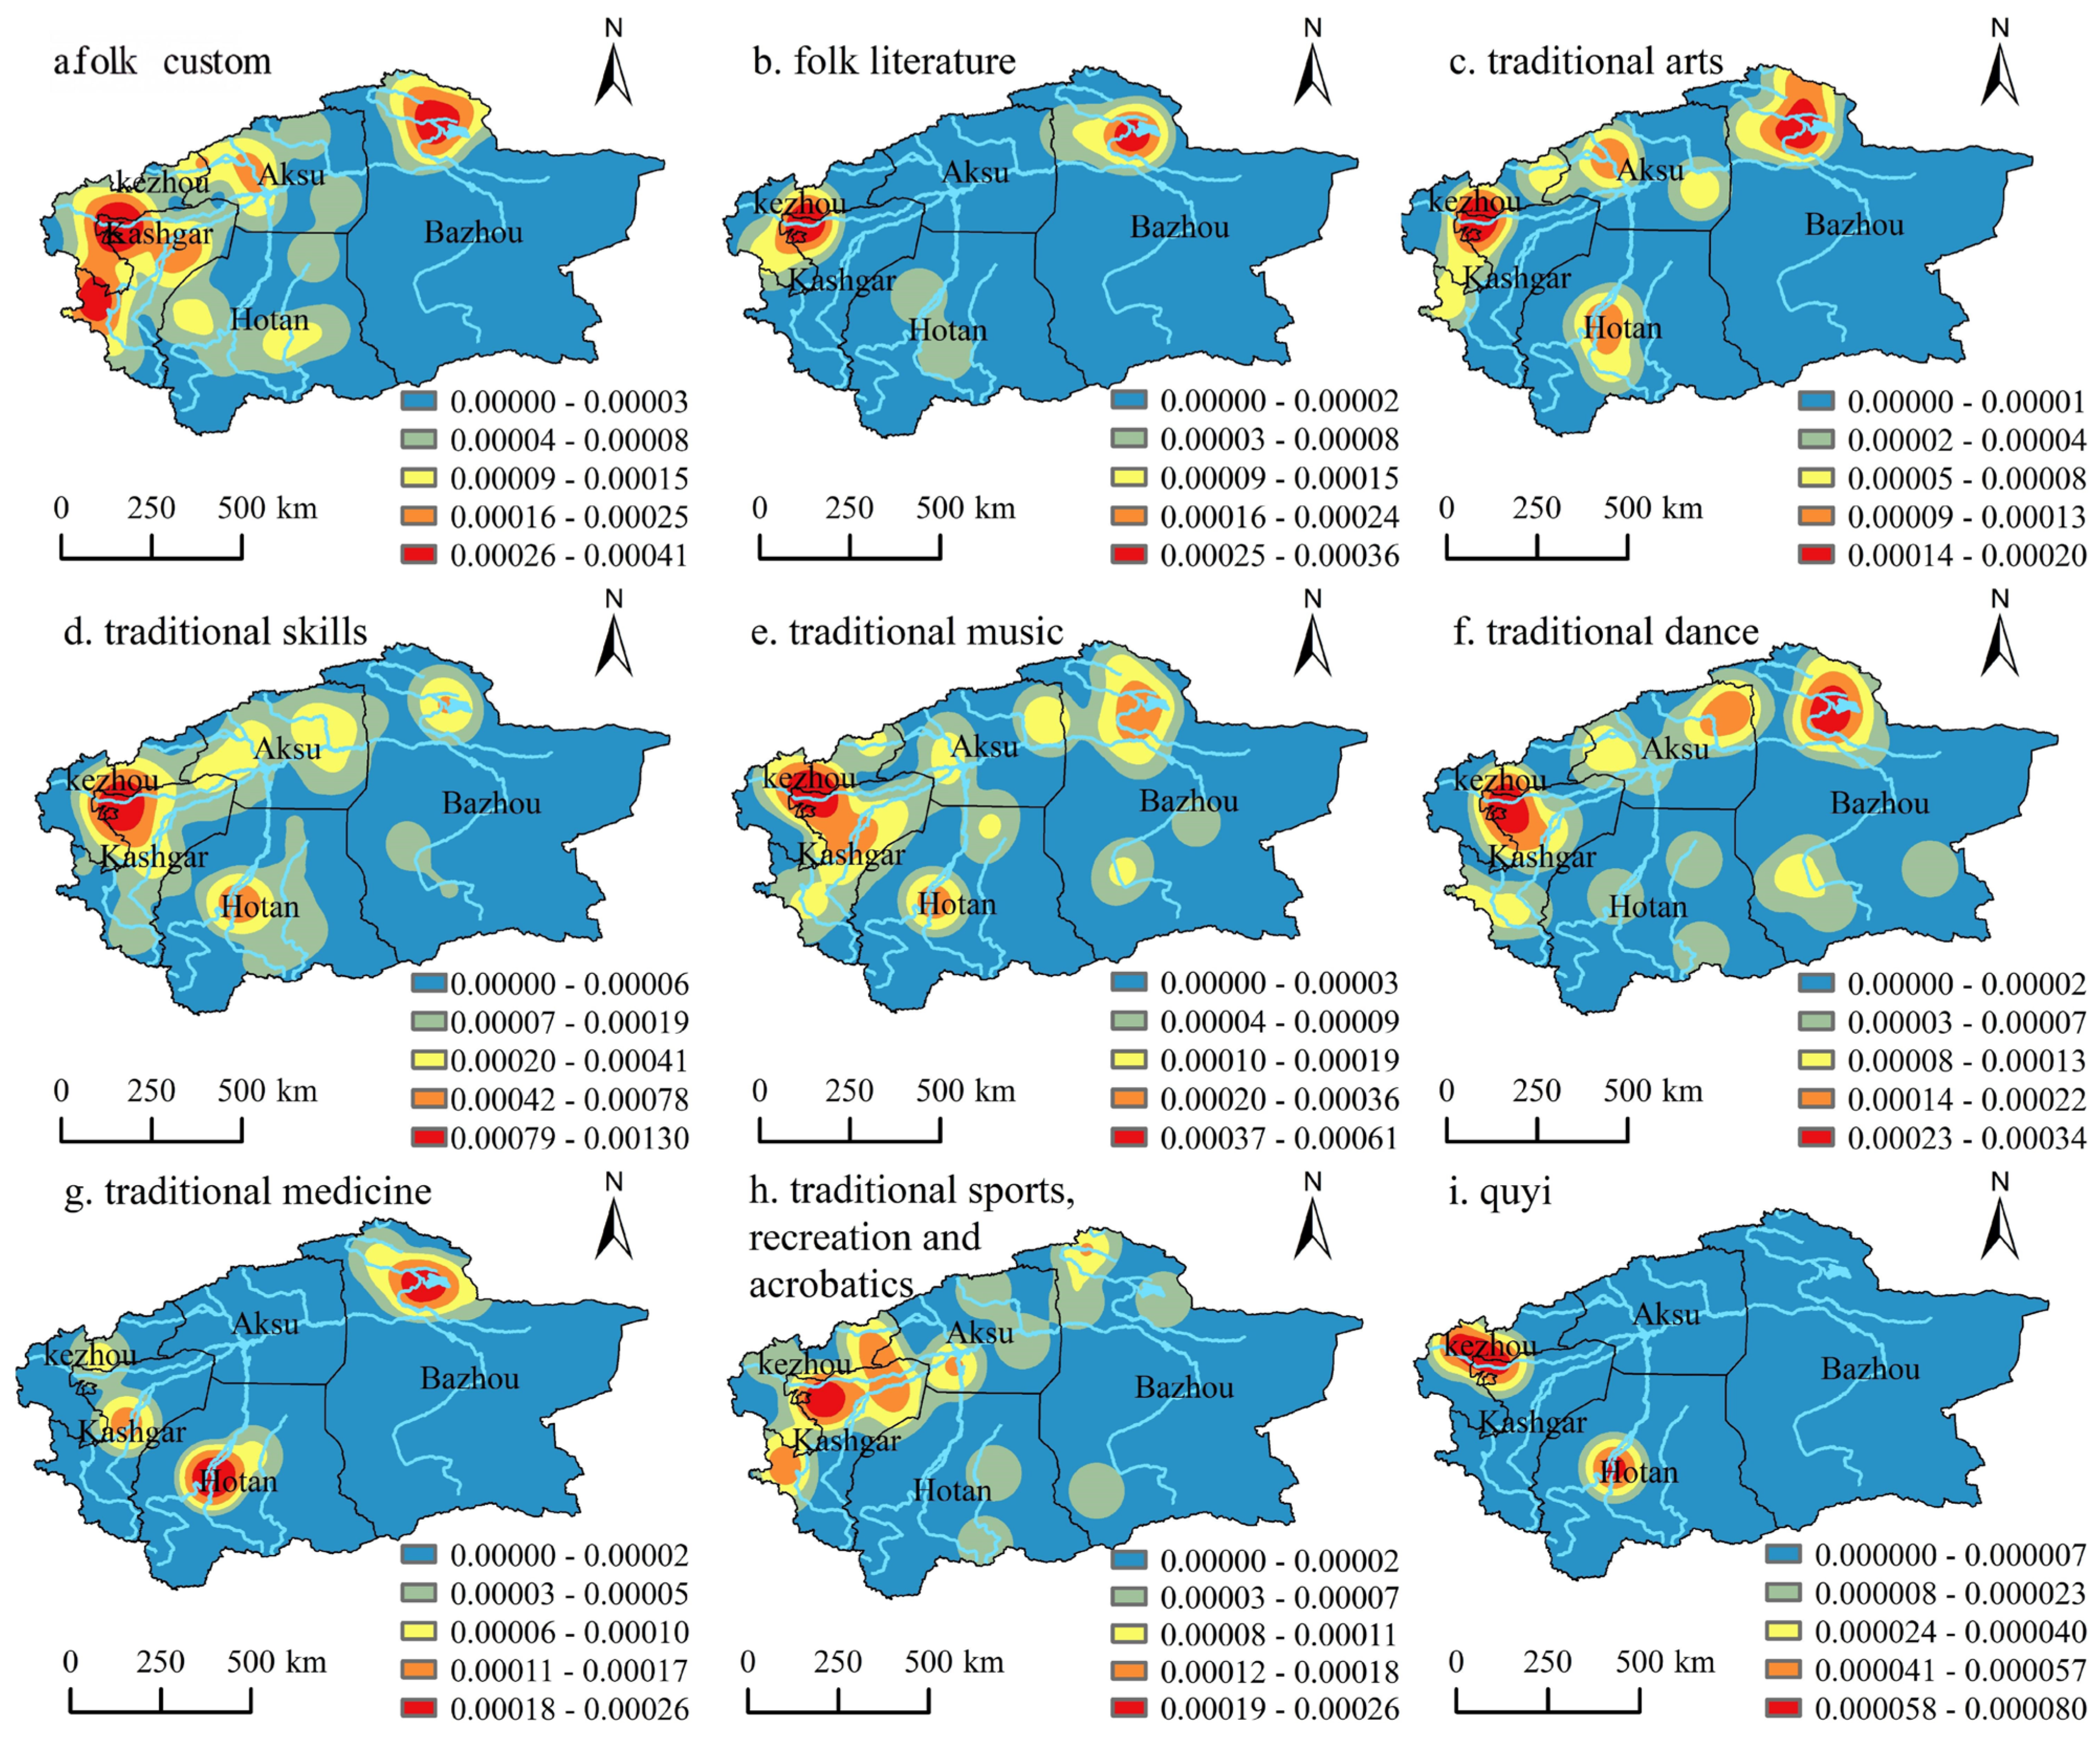
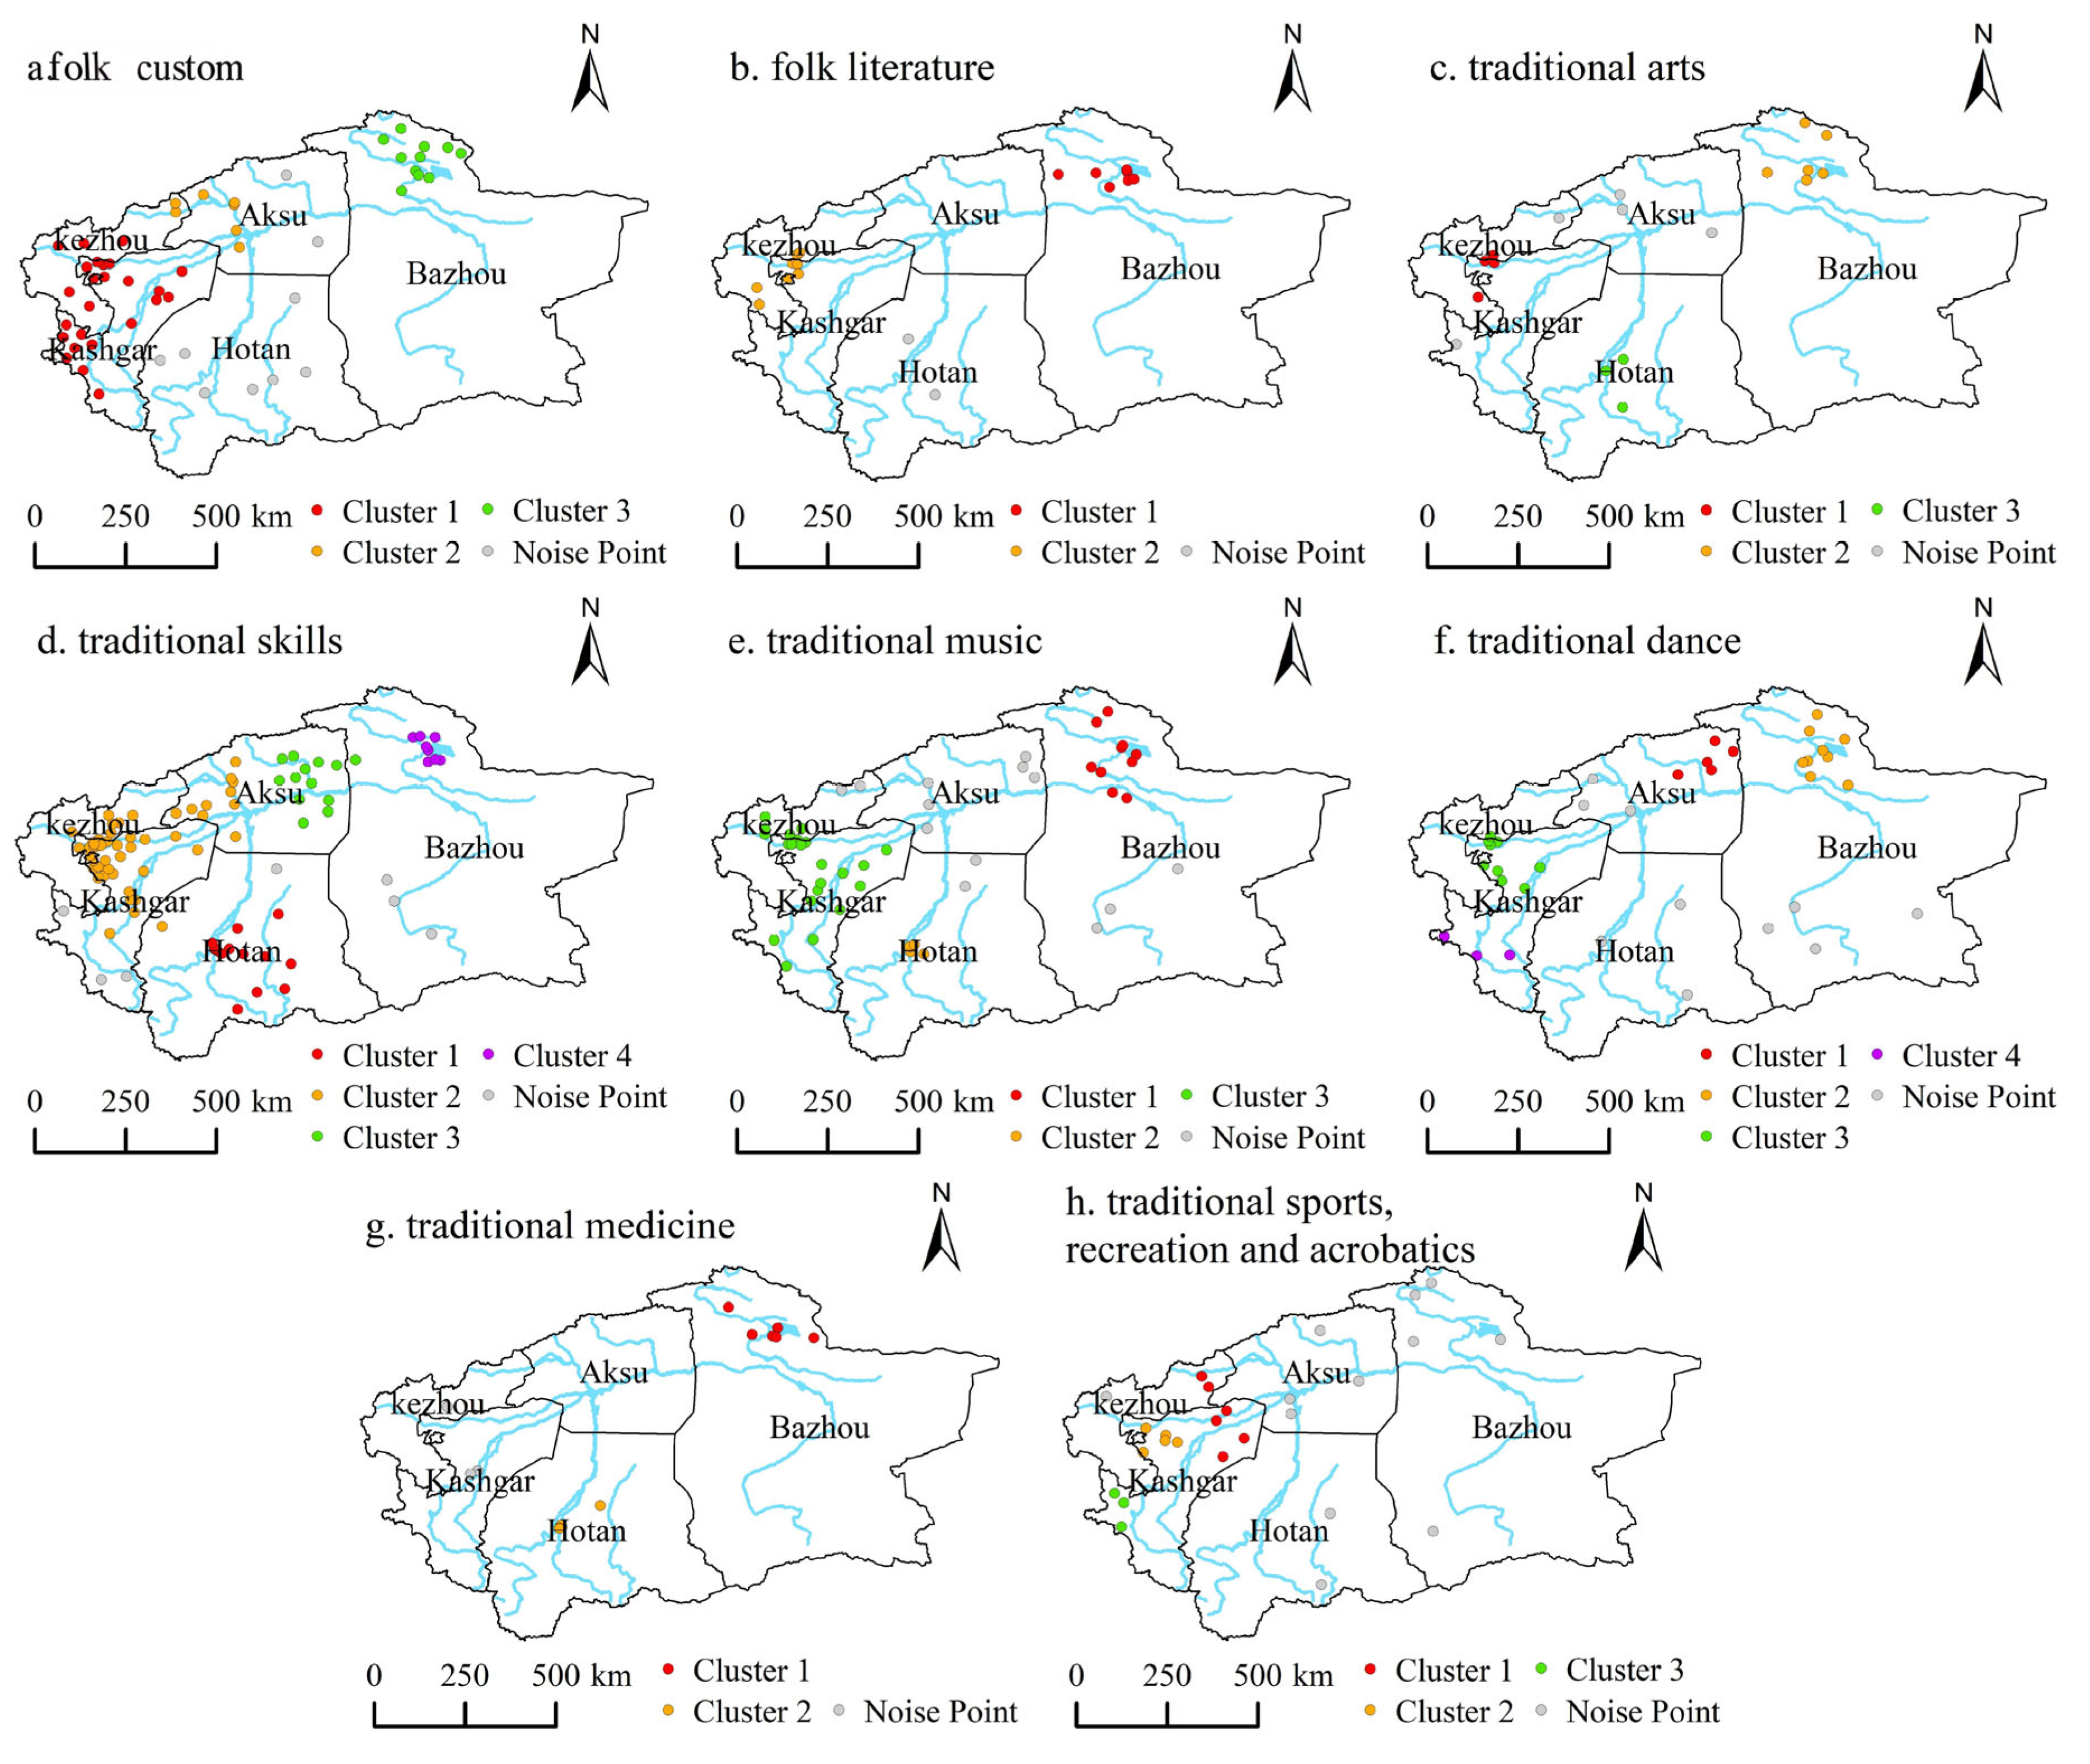
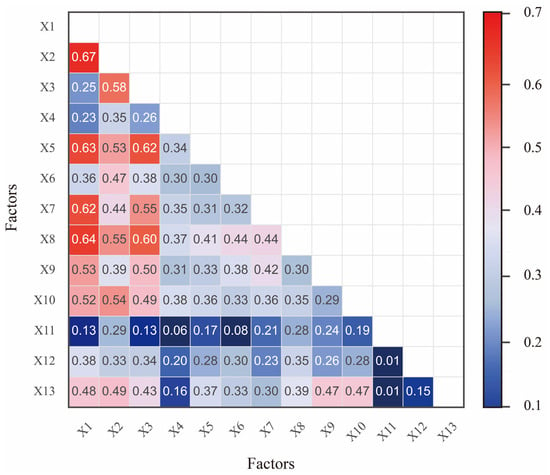
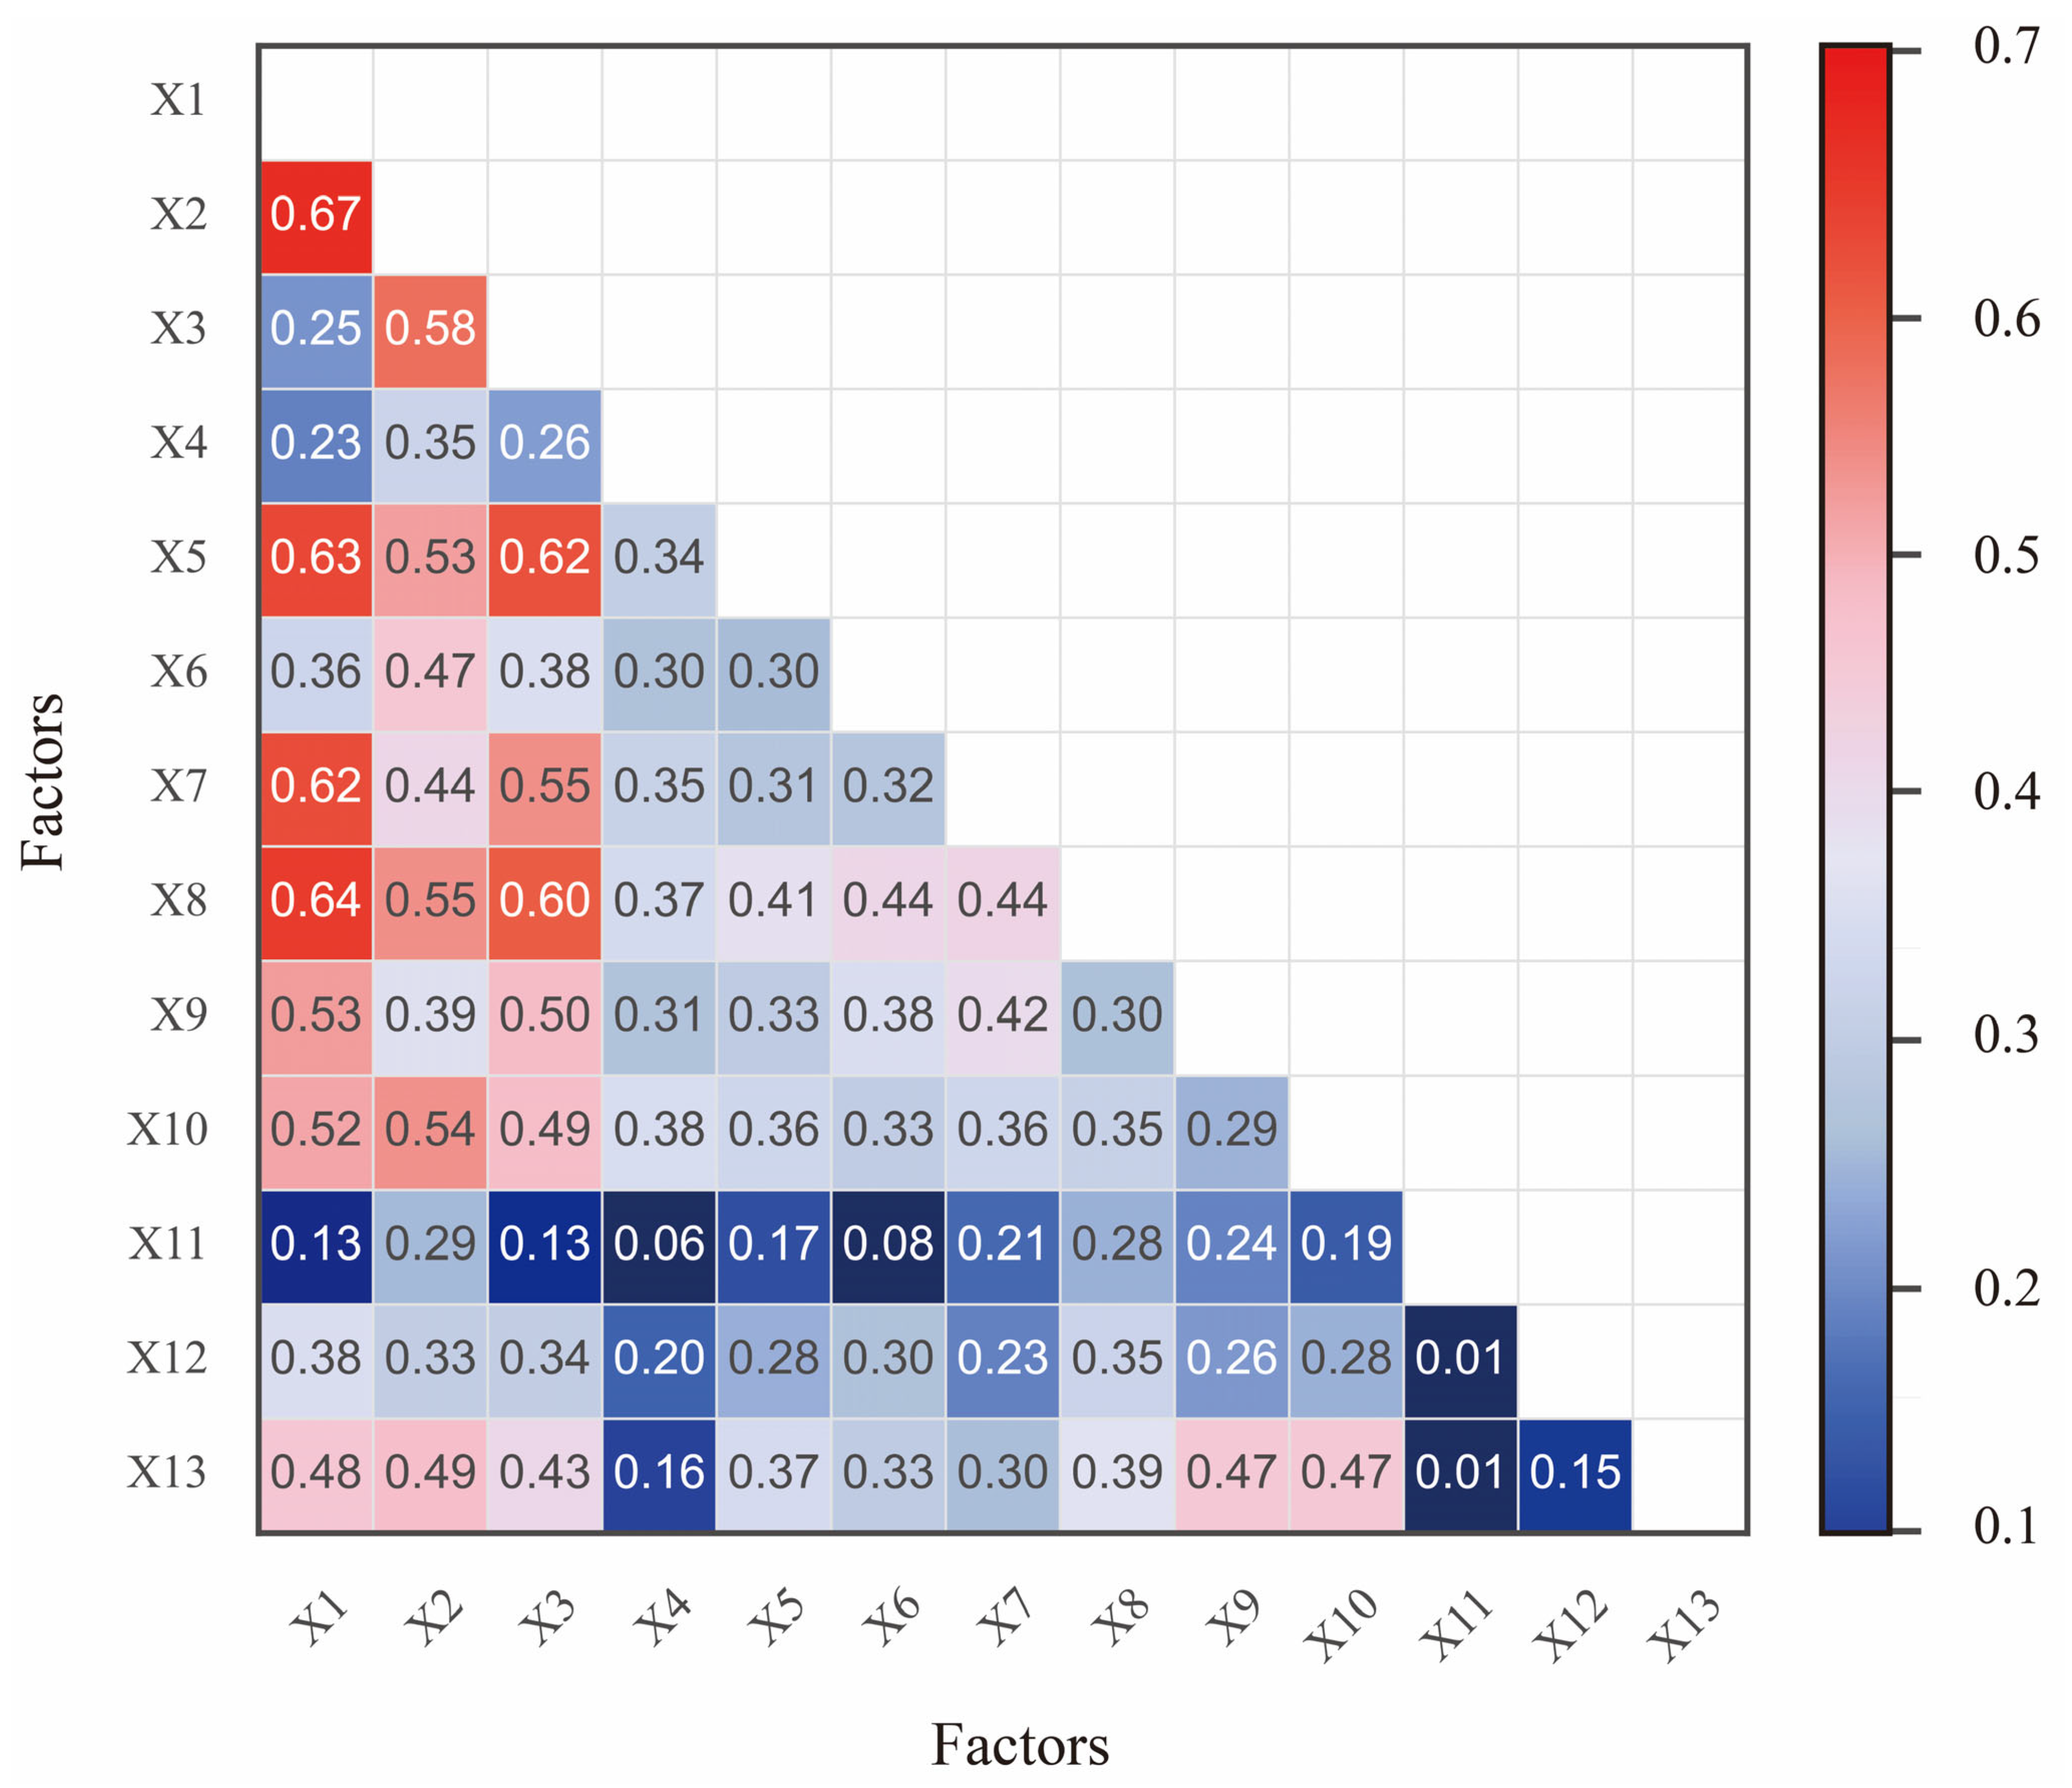

Disclaimer/Publisher’s Note: The statements, opinions and data contained in all publications are solely those of the individual author(s) and contributor(s) and not of MDPI and/or the editor(s). MDPI and/or the editor(s) disclaim responsibility for any injury to people or property resulting from any ideas, methods, instructions or products referred to in the content. |
© 2026 by the authors. Licensee MDPI, Basel, Switzerland. This article is an open access article distributed under the terms and conditions of the Creative Commons Attribution (CC BY) license.