Article

Differential Efficacy of Citrus limon Residue Extract on the Bacterial Load and Selected Physicochemical Properties of Contaminated Water

by
Luis Cabanillas-Chirinos
1,*,
Moisés Gallozzo-Cárdenas
1,
Magaly De La Cruz-Noriega
1,
Víctor Sánchez-Araujo
2 and
Pedro Palomino-Pastrana
2
1
Centros e Institutos de Investigación, Universidad Cesar Vallejo, Trujillo 13001, Peru
2
Facultad de Ciencias de Ingeniería, Universidad Nacional de Huancavelica, Huancavelica 09001, Peru
*
Author to whom correspondence should be addressed.
Sustainability 2026, 18(19), 10120; https://doi.org/10.3390/su181910120
Submission received: 19 August 2026 / Revised: 25 September 2026 / Accepted: 30 September 2026 / Published: 3 October 2026
(This article belongs to the Special Issue Circular Economy and Sustainable Water Treatment)

Abstract

The growing deterioration of water quality, driven by water scarcity and microbiological contamination, demands the development of sustainable and low-environmental-impact technological alternatives. Against this background, the present study assessed the differential efficacy of an ethanolic extract obtained from Citrus limon residues (peel and residual pulp) on the bacterial load of Staphylococcus spp. and Escherichia coli, as well as its effect on pH, turbidity, and total dissolved solids (TDS) of two aqueous matrices with different initial contamination levels: one with turbidity of 100–150 NTU, bacterial load of 103–104 CFU/mL and TDS of 150 mg/L (low contamination), and another with turbidity ≥200 NTU, bacterial load ≥105 CFU/mL and TDS of 600 mg/L (high contamination). The extract was obtained by sonication (40 kHz, 480 W) and characterized by FTIR and UV-Vis spectroscopy, while its antimicrobial activity was evaluated through MIC and MBC determinations using the broth macrodilution method. Remediation assays were performed with doses of 3.12 and 6.25 mg/mL over 24 h. In the low-contamination matrix, logarithmic reductions of up to 4.28 log CFU/mL and removal percentages of ≥99.97% were achieved; in contrast, in the highly contaminated matrix, the reduction was approximately 0.9 to 1.1 log CFU/mL (82–92%). However, the addition of the extract caused a marked increase in turbidity and TDS, together with a pronounced acidification of pH. In conclusion, while the valorization of C. limon residues constitutes a promising raw material with selective antimicrobial potential, its direct application in complex waters presents substantial physicochemical limitations. This highlights the need to implement subsequent purification strategies (e.g., neutralization, filtration) or hybrid treatments to ensure successful and feasible remediation within the framework of the circular economy and sustainable water treatment.

1. Introduction

The growing scarcity and deterioration of water quality worldwide, driven by climate change and population growth, place wastewater and agro-industrial effluents as critical sources of sanitary and environmental risk that require sustainable solutions [1,2,3,4]. Water reuse framed in circular economy principles contributes to reducing resource demand and associated environmental impacts, but poses the challenge of ensuring the physicochemical and microbiological safety of treated water to avoid risks to public health [5,6,7]. This approach directly contributes to Sustainable Development Goal (SDG) 6: Clean water and sanitation, which seeks to improve water quality by reducing discharges and pollution [1].
Conventional disinfection and treatment methods, such as the use of chlorine and physicochemical processes like coagulation-flocculation and filtration, are effective for reducing microbial load and suspended matter; however, they have significant disadvantages, such as the formation of potentially toxic disinfection by-products [8,9], sludge generation, and high operating costs that limit their sustainability in small- and medium-scale contexts or in communities with restricted resources [10]. In this scenario, interest in natural and low-cost alternatives has increased, mainly in coagulants and antimicrobial agents derived from plants that can be integrated into remote treatment systems with lower technological complexity [11,12,13].
The citrus agro-industry produces large quantities of residues (peels, pulp, and process water) that are often inadequately managed, representing a waste management challenge but also an opportunity for the circular economy through their valorization as a source of bioactive compounds (essential oils, flavonoids, pectins, and organic acids) with coagulant, chelating, and antimicrobial potential [14,15]. Obtaining aqueous or ethanolic extracts from these residues offers a pathway to convert them into functional inputs for the experimental treatment of contaminated water, providing environmental benefits (waste reduction) and economic benefits (low toxicity and use of local by-products) [16,17]. Furthermore, the choice of extraction solvent (water vs. ethanol) modulates the phytochemical profile and, consequently, the efficacy on physicochemical parameters such as pH, turbidity, total dissolved solids (TDS), and microbiological load in aqueous matrices [18].
Previous studies have shown that plant extracts and by-products can significantly reduce turbidity in aqueous matrices, generating lower sludge volumes and lower toxicity than conventional synthetic coagulants [19,20,21,22,23]. In particular, Citrus limon extracts exhibit a broad spectrum of antibacterial activity, attributable to the different fractions of the fruit. The essential oil of the peel inhibits pathogens such as Salmonella enterica, Pseudomonas spp., and Staphylococcus aureus [24,25,26,27]; the juice shows concentration-dependent activity against enteric and cutaneous bacteria (Escherichia coli, Proteus spp., Propionibacterium acnes) [28,29]; and peel extracts reduce the growth of Listeria monocytogenes in food models [30,31]. Likewise, commercial citrus-based products such as Biosecur® and Citrox© have achieved reductions of 2 to 6 logarithmic units in pathogens such as Vibrio vulnificus, E. coli O157:H7, and Listeria monocytogenes on surfaces and foods [32,33].
Although numerous studies have investigated the antimicrobial properties of extracts, essential oils, and materials derived from C. limon peel, several critical gaps remain. First, most previous studies have employed synthetic media, food matrices, or clinical isolates, and have rarely assessed these extracts in real contaminated waters with contrasting organic and microbial loads. Second, the few studies conducted in aqueous matrices have focused almost exclusively on antimicrobial efficacy, without simultaneously quantifying the associated changes in minimal physicochemical parameters such as pH, turbidity, or total dissolved solids. Consequently, the specific scientific contribution of this study lies in offering a realistic and dual evaluation of an extract derived from C. limon waste in real contaminated waters, revealing not only its antimicrobial potential but also the physicochemical implications within sustainable water treatment systems. This contribution is especially relevant as it represents the initial step in scaling up solutions based on the use of natural extracts in the context of the circular economy. The main objective of this study was to evaluate the differential efficacy of the ethanolic extract of C. limon residues on the bacterial load (Staphylococcus spp. and E. coli) and on the physicochemical properties (pH, turbidity, and TDS) in two aqueous matrices with different initial contamination levels (low and high). To address this objective, the following research questions were formulated: (i) Does the ethanolic extract of C. limon residues reduce the load of Staphylococcus spp. and E. coli, and modify pH, turbidity, and TDS in contaminated waters? (ii) Does this efficacy differ according to the initial contamination level (low vs. high) and according to the type of bacteria (Gram-positive vs. Gram-negative)? The central hypothesis of the study postulates that the ethanolic extract will significantly reduce the microbial load and notable modifies modify the physicochemical parameters, but that this efficacy will be modulated by the aqueous matrix, being more effective under conditions of low initial contamination and against Gram-positive bacteria (Staphylococcus spp.), due to the absence of the outer membrane characteristic of Gram-negative bacteria.

2. Materials and Methods

2.1. Collection and Preparation of Plant Material

C. limon residues (peel, pulp remains, and discarded fruit) were collected from markets and restaurants in the district of Trujillo, La Libertad, Peru.
The collected material was transported to the laboratory in plastic bags, washed with distilled water to remove adhering impurities, and oven-dried at 40 °C for 3 to 4 days until a residual moisture content of 5 to 10% was reached. Moisture content was determined gravimetrically by constant weight. The dried material was ground, sieved through a No. 60 ASTM E-11 mesh [34], and stored as a homogeneous powder in opaque containers at room temperature (22 ± 2 °C) until use [35].

2.2. Obtaining the Extract by Sonication

The ethanolic extract was obtained by sonication at controlled temperature (50 °C) for 90 min, using a BOECO Ultrasonic Cleaner at a frequency of 40 kHz and a power of 480 W. Extraction was carried out with a solid:solvent ratio of 1:4 (w/v), using 50 g of plant powder and 200 mL of 99% ethanol. After sonication, the material was clarified by sedimentation and vacuum filtration with Whatman No. 1 paper. The filtrate was concentrated in an ISOLAB rotary evaporator at 50 °C and approx. 400 mbar absolute pressure [36,37]. The concentrated extract was sterilized by vacuum filtration through 0.22 µm membrane filters. The sterile product was considered as concentrated stock extract, stored in sterile amber glass containers and kept at 4 °C until subsequent spectrophotometric characterization and use in microbiological assays.

2.3. Extraction Yield, Concentration, and Spectrophotometric Characterization of the Extract

The extraction efficiency was calculated via Equation (1) by gravimetrically comparing the mass of the rotary-evaporated dry extract against the starting dry plant mass:
Extraction Yield % =   We Wd × 100
where We is the weight of the dry extract obtained, and Wd is the initial weight of the dry plant material.
The concentration of the C. limon extract was evaluated by gravimetry, using a digital electronic balance under controlled environmental conditions of 20.0 ± 0.1 °C. “A 31.25 mg/mL working solution was prepared from the stock solution using DMSO as the diluent (62.5% v/v stock solution and 37.5% v/v DMSO). This working solution was subsequently used to prepare the treatment doses.”
Spectrophotometric characterization was performed on the solution (50 mg/mL) using two techniques [38]: (i) UV-Vis spectroscopy (300–1100 nm) on a ThermoFisher Scientific spectrophotometer (GENESYS model; ThermoFisher Scientific, Waltham, MA, USA), and (ii) Fourier-transform infrared spectroscopy (FTIR) (4000–400 cm−1) on a ThermoFisher Scientific iS50 FT-IR equipment (ThermoFisher Scientific, Waltham, MA, USA), in order to identify functional groups (OH, C=O, C–O, and aromatic).

2.4. Antimicrobial Evaluation Using the Broth Macro-Dilution Method

The reference strains used were Staphylococcus aureus NCTC 12493 (Gram-positive; equivalent to DSM 27146 and MQCL 113) and Escherichia coli ATCC 33876 (Gram-negative; K-12 JM101 strain, equivalent to DSM 3948). Both strains were obtained from certified culture collections, and the antimicrobial activity of the extract was evaluated using the broth macrodilution method [39] in accordance with CLSI-M07 guidelines [40]. Mueller-Hinton broth (MH) and a standardized bacterial suspension of 5 × 10⁵ Colony Forming Units per milliliter (CFU/mL) were used. MIC and MBC values were determined using serial dilutions of the extract prepared from an initial concentration of 50 mg/mL. Ampicillin (10 µg/mL) and 99% ethanol were used as positive and solvent controls, respectively. The inoculated tubes were incubated at 37 °C for 24 h, and all assays were performed in triplicate.

2.5. Experimental Laboratory Remediation Assays

Two natural aqueous matrices with different contamination levels were used, collected from natural streams in the city of Trujillo, La Libertad, Peru. Matrix 1 (low-contamination water) had turbidity of 100–150 Nephelometric Turbidity Units (NTU) and bacterial load of 103–104 CFU/mL and was collected from the Mochica channel (coordinates 8°05′27″ S, 79°02′58″ W). Matrix 2 (highly contaminated water) had turbidity ≥200 NTU and bacterial load ≥105 CFU/mL and was collected from a channel contaminated with municipal sewage that flows into Buenos Aires Norte beach (coordinates 8°07′54″ S, 79°04′03″ W).
Experiments were conducted in 250 mL beakers with a working volume of 200 mL. For the 3.12 mg/mL treatment, 10% (v/v) of the 31.25 mg/mL working solution was added to the water samples, resulting in a final extract concentration of 3.12 mg/mL. For the 6.25 mg/mL treatment, 20% (v/v) of the same working solution was added, resulting in a final extract concentration of 6.25 mg/mL. In addition, distilled water was used as the negative control, and 99% ethanol was used as the solvent control. Samples were manually homogenized and kept at room temperature (25 ± 2 °C) for 24 h. Based on the dilution factor used, the residual ethanol concentration in the treated samples was theoretically calculated to be 9.9% (v/v), as the extract was prepared in 99% ethanol and added to the water matrix at 10% (v/v). Final concentrations of ethanol and DMSO in the treatment solutions were calculated based on dilution factors. The working solution (31.25 mg/mL) contained 61.875% (v/v) ethanol and 37.5% (v/v) DMSO. For the 3.12 mg/mL treatment (10% v/v of working solution), the final concentrations in water were 6.19% (v/v) ethanol and 3.75% (v/v) DMSO. For the 6.25 mg/mL treatment (20% v/v of working solution), the final concentrations were 12.38% (v/v) ethanol and 7.50% (v/v) DMSO. According to the literature, ethanol concentrations below 10% have negligible to no antimicrobial effect [39], and DMSO concentrations below 5% generally lack antimicrobial activity [38,39]. Therefore, the solvents used in this study are not expected to have contributed significantly to the observed bacterial inactivation.
For each water matrix and treatment, independent beakers (biological replicates) were prepared for each sampling time (0, 6, 12, and 24 h). Thus, the five replicates obtained at each time point were independent experimental units, and no repeated measurements were taken from the same beaker. This design ensures the statistical independence of the observations within each time point, thereby justifying the use of Kruskal–Wallis tests to compare treatments at each specific time.
Bactericidal effects were evaluated by microbiological counts at 0, 6, 12, and 24 h (time 0 corresponded to the analysis of untreated water samples). Microbiological counts focused on the quantification of presumptive pathogenic bacteria, namely presumptive Staphylococcus spp. on Mannitol Salt Agar (MSA) and presumptive E. coli on Eosin Methylene Blue (EMB) agar [41,42]. It is important to note that the samples were not neutralized before microbiological plating. For microbiological counts, the smallest plated volume was 1 mL of undiluted sample; therefore, the limit of detection (LOD) was calculated as 1 CFU divided by the plated volume (1 mL), resulting in an LOD of 1 CFU/mL. The limit of quantification (LOQ) was set at 3 CFU/mL.
Each procedure was repeated five times per water matrix to obtain statistically relevant data. For the evaluation of physicochemical parameters pH, turbidity, and total dissolved solids (TDS), measurements were taken at 0, 6, 12, 18, and 24 h using the following equipment: Multiparameter Waterproof Meter HI98194 (HANNA Instruments Inc., Woonsocket, RI, USA) and Turbidity Meter TU-2016 (Lutron Electronic Enterprise Co., Ltd., Taipei, Taiwan).
Antimicrobial performance was assessed by calculating both the percentage removal and the logarithmic reduction (log10) of bacterial counts. Percentage removal and log reduction (log10) were determined using Equations (2) and (3), respectively, to facilitate comparison with previous studies reporting results in either format.
Removal   ( % ) = No − Nt No × 100
where No is the initial bacterial concentration (CFU/mL), and Nt is the bacterial concentration at the sampling time.
Log Reduction log 10 = log 10   No Nt  
where No and Nt represent the initial and final bacterial concentrations (CFU/mL), respectively.

2.6. Statistical Analysis

The results were expressed as mean ± standard deviation (SD) of five independent replicates (n = 5). For each independent replicate, technical measurements were performed in triplicate and averaged prior to statistical analysis. The sample size used for all statistical analyses was n = 5 per group. The percentage reduction and logarithmic reduction (log10) of bacterial load were calculated using Microsoft Excel (Microsoft Corp., Redmond, WA, USA; v2408). Graphs were prepared using OriginPro software version 2021 (OriginLab Corp., Northampton, MA, USA; v2021).
Data normality and homogeneity of variances were assessed using the Shapiro–Wilk and Levene’s tests, respectively. Comparisons among the six experimental treatments were performed using the Kruskal–Wallis test, followed by Dunn’s post hoc test with Holm adjustment when appropriate. Statistical analyses were conducted using IBM SPSS Statistics v.26 (IBM Corp., Armonk, NY, USA).

3. Results

Table 1 presents the extraction yield of the extract obtained from the peels and residual pulp of Citrus limon, using 99% ethanol as the extraction solvent. An initial weight of 50.00 g of dry plant material was used, from which a dry extract weight of 7.12 g was obtained. As a result, an extraction yield of 14.24 ± 0.45% (w/w) was achieved.
In Table 1, the extraction yield of the ethanolic extract obtained from C. limon residues (peels and residual pulp) is shown. 50.00 g of dry and sieved plant material were processed, obtaining 7.12 g of dry extract, which represented an extraction yield of 14.24 ± 0.45% (mean ± standard deviation, n = 3).
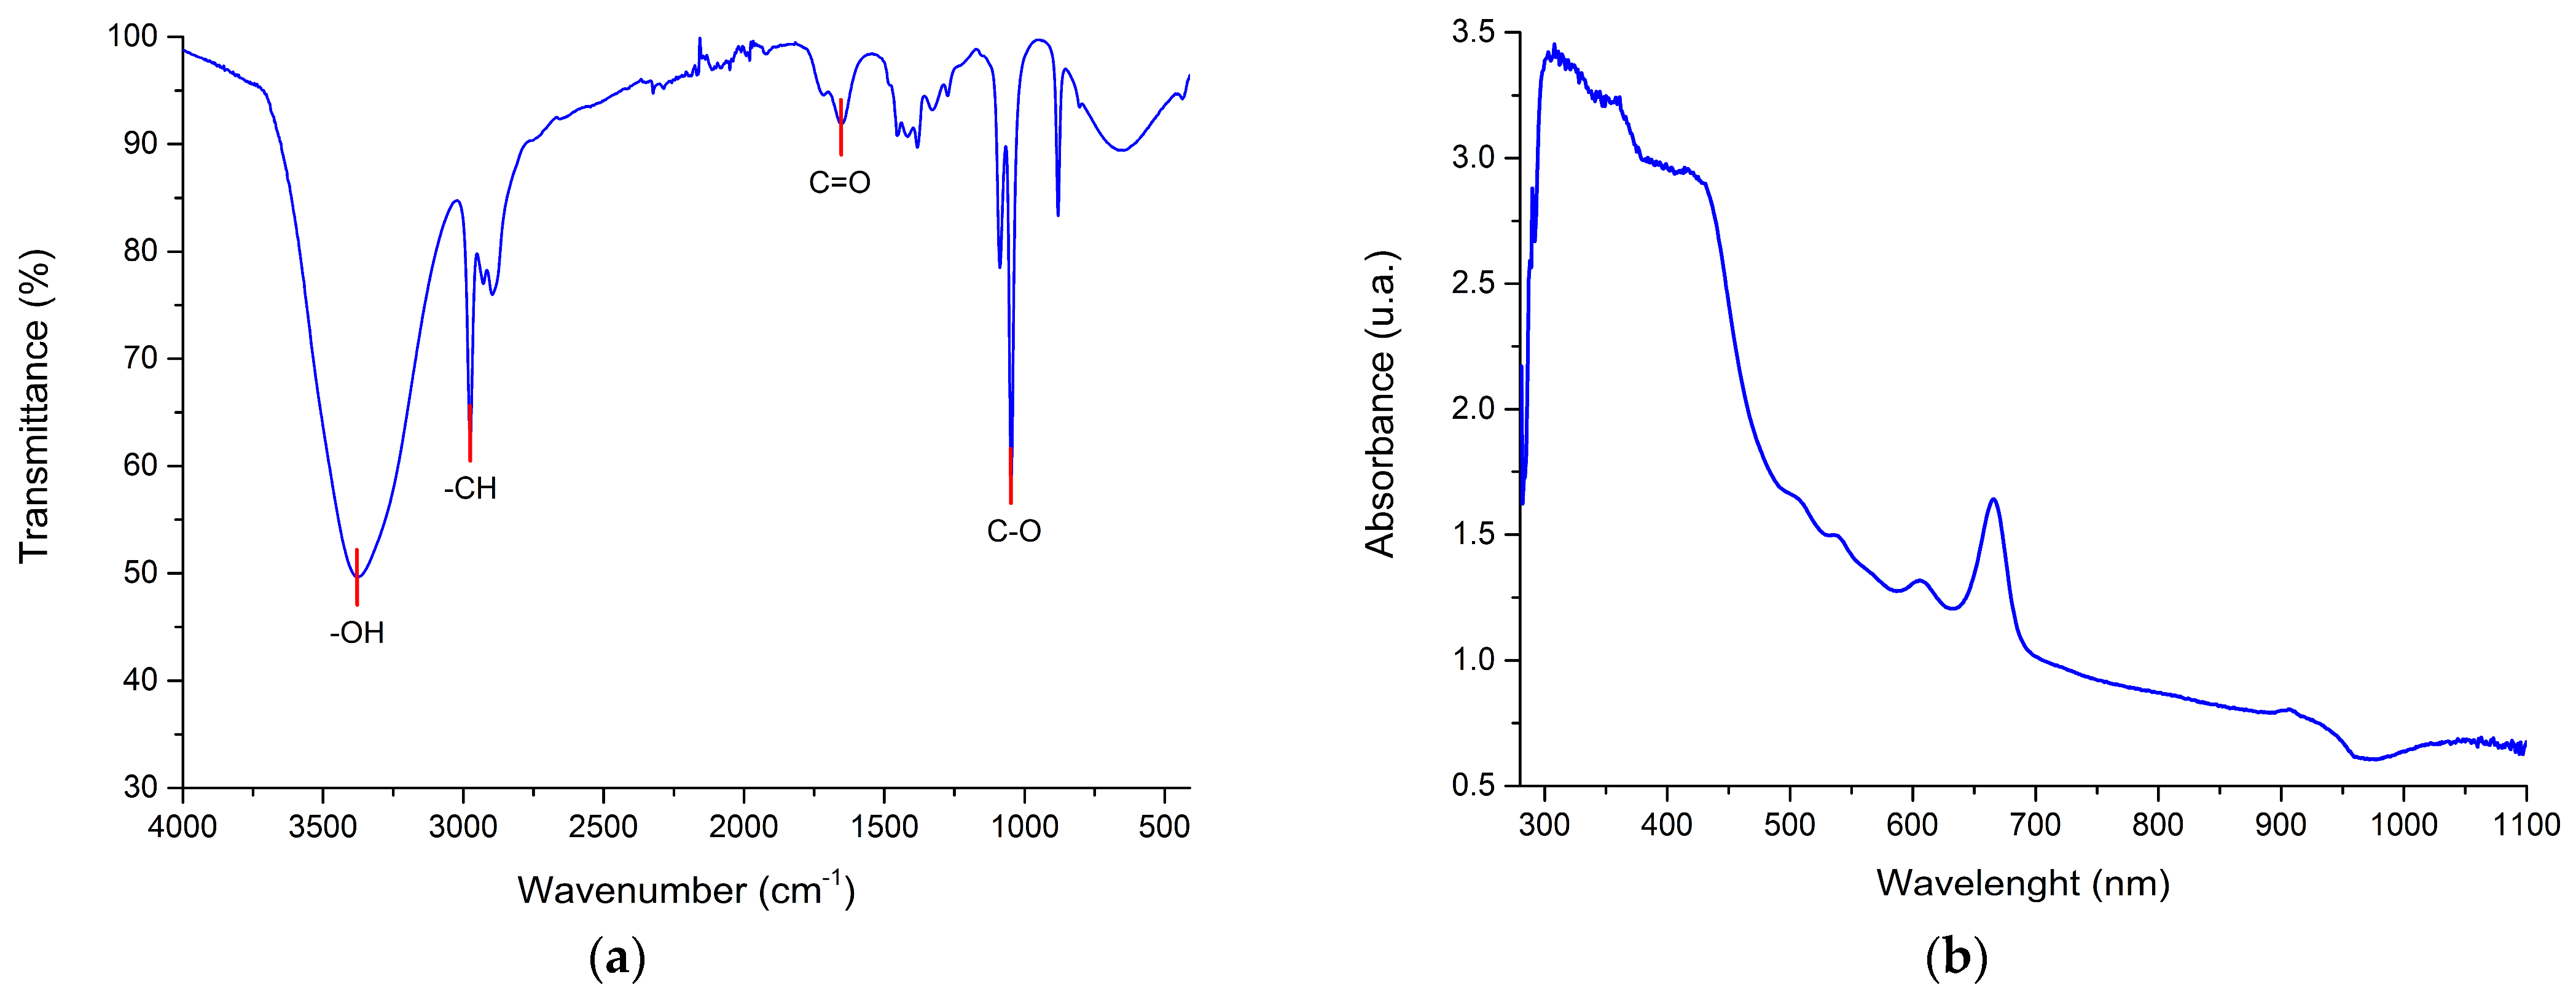
Figure 1 shows the spectrophotometric characterization of the ethanolic extract of C. limon residues. Figure 1a shows the Fourier-transform infrared (FTIR) spectrum, which allows the identification of characteristic bands associated with functional groups, and upon analysis of the sample, multiple characteristic absorption bands are observed [43,44]. In this Figure 1a, a broad and deep band in the region of 3600–3200 cm−1 is distinguished, attributable to O–H stretches characteristic of alcohols and phenols, together with signals in the range of 3000–2850 cm−1 corresponding to aliphatic C–H stretches. The intense band around 1700 cm−1 suggests the presence of carbonyl groups (C=O), while signals in the region of 1600–1500 cm−1 and between 1300–1000 cm−1 are compatible with the presence of phenolic and flavonoid-type structures, as well as esters and glycosides. It should be noted that these assignments are preliminary and are based on comparison with spectra reported in the literature [43,44,45,46,47]. For its part, Figure 1b shows the UV-Vis spectrum in the range of 300–1100 nm, in which strong absorption in the near-ultraviolet region (300–400 nm) is observed, characteristic of conjugated chromophores present in aromatic structures and flavonoids [48,49]. Peaks and shoulders around 284 nm are observed, consistent with π→π* electronic transitions of conjugated chromophores. This spectral region has been associated in the literature with flavonoid-type compounds, such as those predominant in citrus [50,51], although chromatographic analysis is required for unequivocal identification.
Table 2 presents a hypothesis on a systematic correlation between the wavenumber ranges (cm−1) obtained by FTIR spectroscopy, the identified functional groups, and the possible associated antimicrobial mechanisms of action. The broad O–H band (3600–3200 cm−1) associated with phenols and alcohols stands out, whose high intensity suggests an abundance of polar compounds, related to mechanisms such as protein denaturation and generation of oxidative stress. Other key bands, such as C=O stretching (1750–1700 cm−1) and aromatic C=C (1680–1500 cm−1), are linked to flavonoids and esters, with actions including enzymatic inhibition and alteration of membrane permeability [45,46,47,48,49]. In this table, each entry links the presence and relative intensity of the bands with plausible biological effects, such as membrane damage, enzymatic inhibition, aglycone release, and anti-biofilm activity.
As shown in Table 3, the Citrus limon extract exhibited antimicrobial activity against both reference strains, with greater effectiveness against the Gram-positive bacterium. For S. aureus NCTC 12493, the MIC and MBC values were 3.12 mg/mL and 6.25 mg/mL, respectively, whereas higher concentrations were required for E. coli ATCC 33876, with MIC and MBC values of 6.25 mg/mL and 12.5 mg/mL. These findings indicate that E. coli required approximately twofold higher concentrations for growth inhibition and bacterial inactivation than S. aureus, suggesting a lower susceptibility of the Gram-negative strain to the extract.
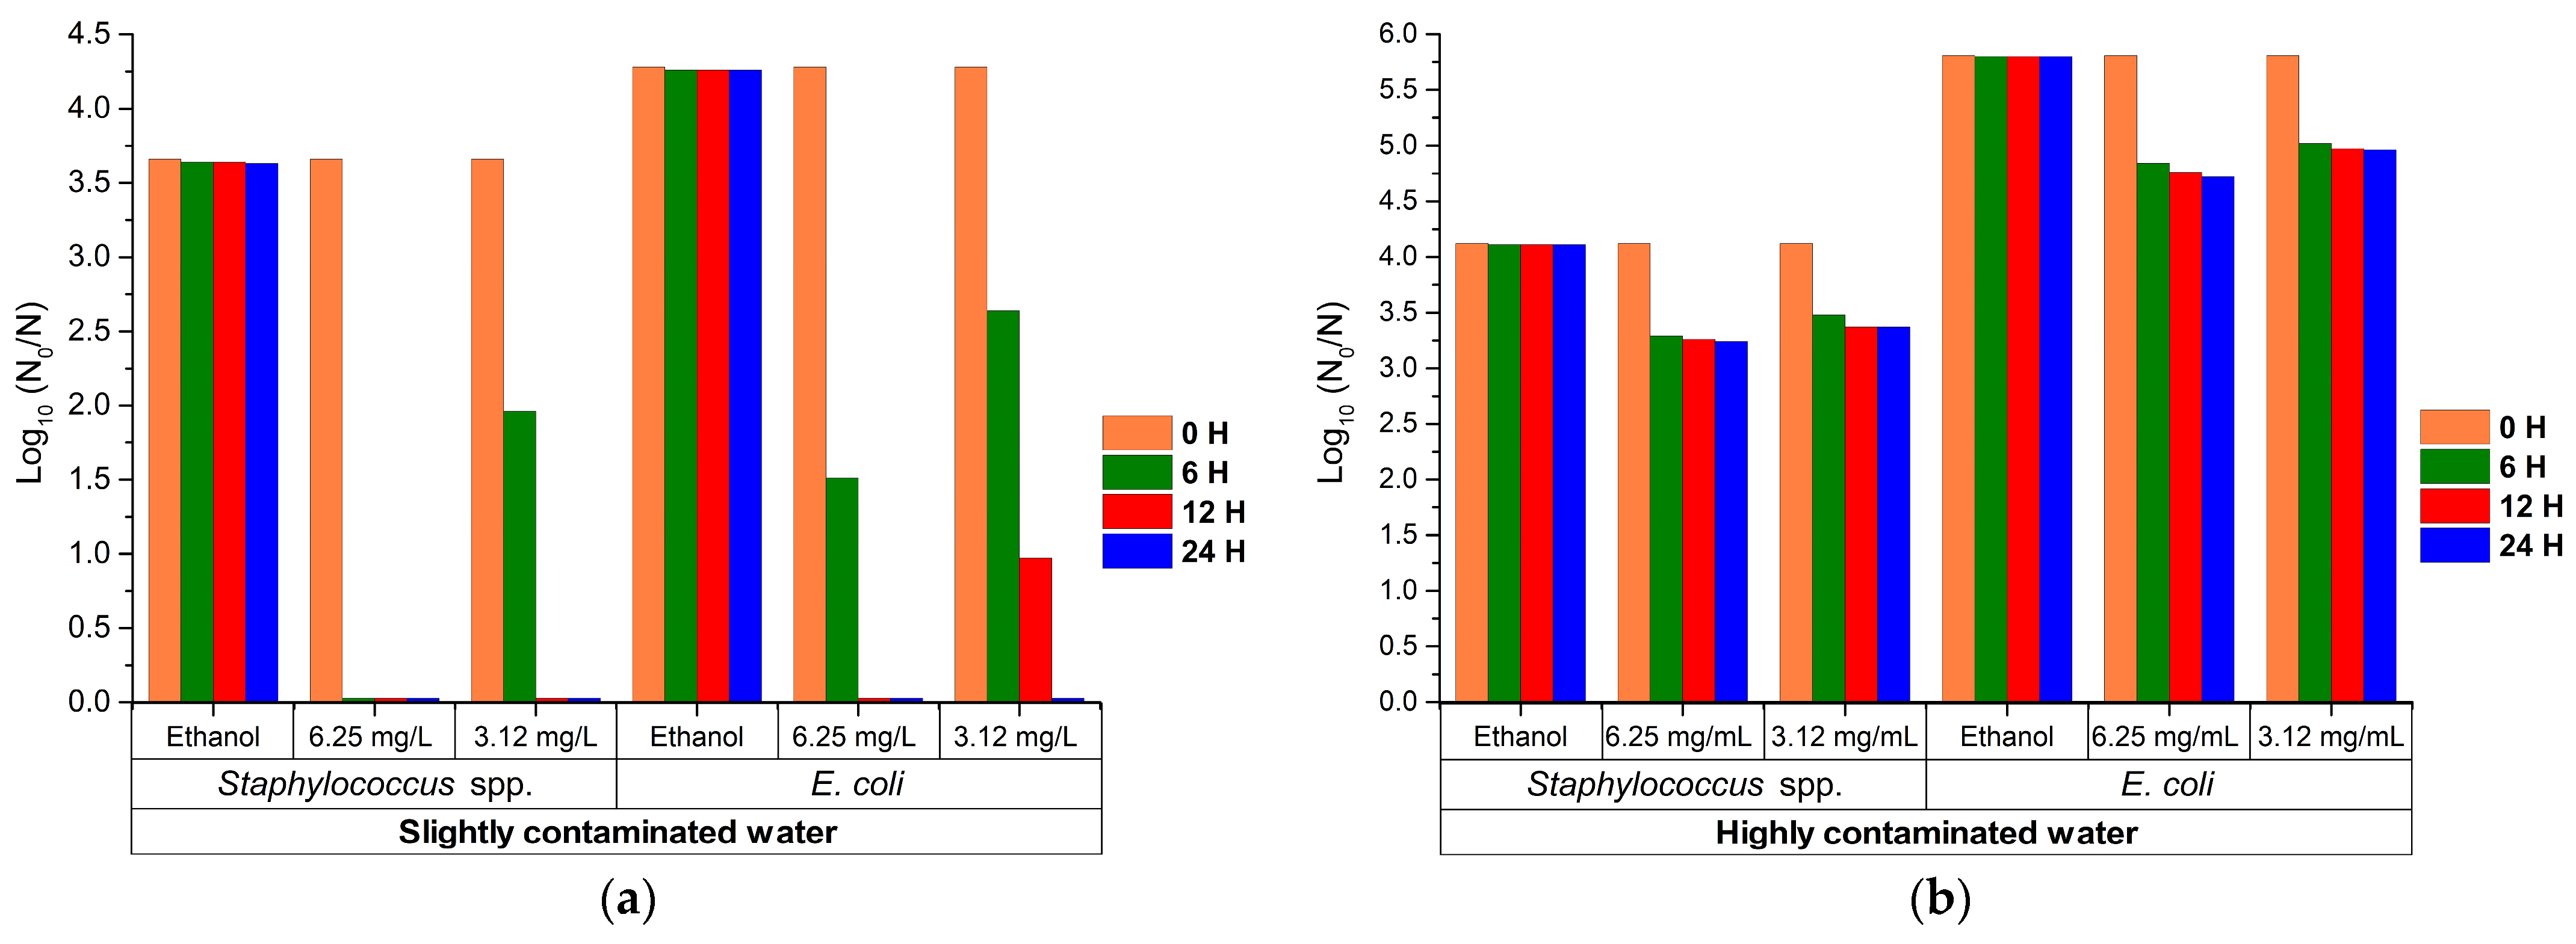
Figure 2 shows the logarithmic reduction (log10) of Staphylococcus spp. and E. coli in contaminated waters treated with ethanol (control) and two concentrations of the ethanolic extract of C. limon residues (3.12 and 6.25 mg/mL), evaluated over 24 h. In Figure 2a, corresponding to low-contamination water, a marked logarithmic reduction (log10) is observed in both treatments (3.12 and 6.25 mg/mL), reaching values of 3.6 log CFU/mL for Staphylococcus spp. and 4.28 log CFU/mL for E. coli at 24 h. In Figure 2b, corresponding to highly contaminated water, the efficacy of the extract decreased significantly for both concentrations (3.12 and 6.25 mg/mL); with the 6.25 mg/mL treatment, reductions of 0.88 and 1.09 log CFU/mL were achieved for Staphylococcus spp. and E. coli, respectively, while for the 3.12 mg/mL treatment the reduction was slightly lower. The ethanol control showed no significant variation in any of the matrices, ruling out an antimicrobial effect attributable to the solvent. These results confirm that the activity of the extract is differential and depends on both the type of bacteria and the initial contamination level of the water.
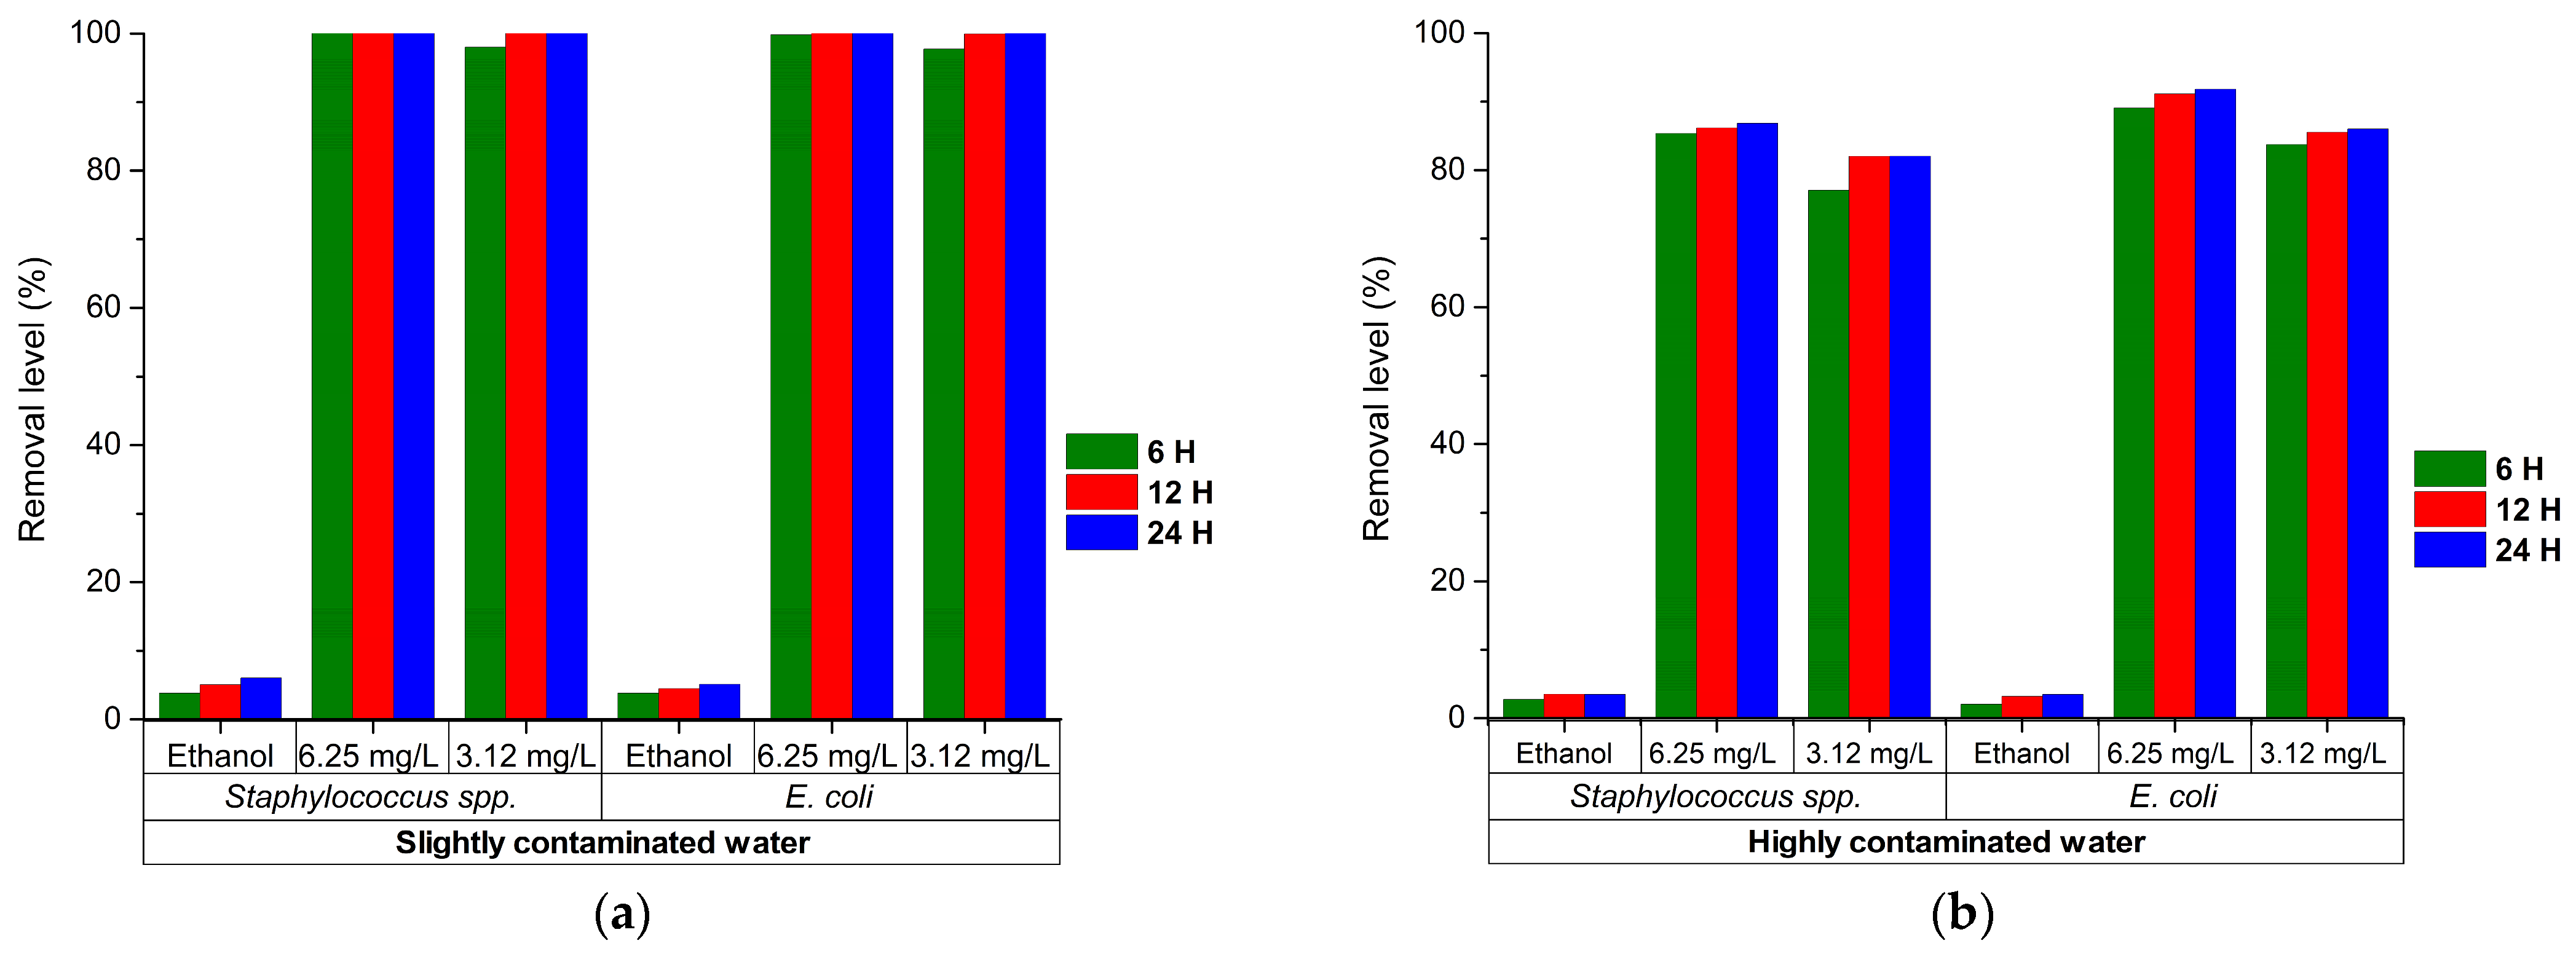
Figure 3 presents the percentage reduction in Staphylococcus spp. and E. coli in contaminated waters treated with ethanol (control) and two concentrations of the ethanolic extract of C. limon residues (3.12 and 6.25 mg/mL), evaluated over 24 h. In Figure 3a, corresponding to low-contamination water, it is observed that treatment with the extract at concentrations of 3.12 and 6.25 mg/mL achieves ≥99.97% reduction for both microorganisms at 24 h. In Figure 3b, corresponding to highly contaminated water, at 24 h, the efficacy of the extract is lower for both concentrations (3.12 and 6.25 mg/mL); with the 6.25 mg/mL treatment, reductions of 86.8% and 91.8% were achieved for Staphylococcus spp. and E. coli, respectively; while for the 3.12 mg/mL treatment the reduction obtained was slightly lower, 82.0% and 86.0% for Staphylococcus spp. and E. coli, respectively. The ethanol control showed no bacterial reduction in any of the matrices, ruling out an antimicrobial effect attributable to the solvent. Overall, these results show that the antimicrobial activity of the extract is dependent on concentration, bacterial type, and initial contamination level of the water.
For the statistical analysis of the percentages of bacterial reduction obtained in the remediation assays, the assumptions of normality and homogeneity of variances were initially evaluated. Although the data met the normality assumption according to the Shapiro–Wilk test (see Appendix A.1), Levene’s test revealed that variances were not homogeneous at any of the evaluated times (p < 0.05) (see Appendix A.2), which ruled out the use of classical Fisher’s ANOVA. As an alternative, Welch’s robust ANOVA was attempted, which is recommended when homogeneity of variances is violated; however, this test could not be performed because at least one of the experimental groups had zero variance (all its replicates showed exactly the same removal value of ≥99.97% in that treatment). Given this limitation, the non-parametric Kruskal–Wallis test was chosen, which does not require normality or homogeneity of variances and is robust to zero variances (see Appendix A.3).
To identify the specific differences between treatments, Dunn’s post-hoc test with Holm correction was applied to control type I error in multiple comparisons, establishing a significance level of p < 0.05 (see Appendix A.4: Table A4 and Table A5). This methodological approach allowed a valid and reliable statistical analysis, despite the restrictions imposed by the nature of the data. The results revealed differential patterns of antimicrobial activity according to the initial contamination level. In low-contamination water, all extract concentrations (3.12 and 6.25 mg/mL) showed significant differences compared to ethanol controls at all evaluated times (p < 0.001). At 6 h, the 6.25 mg/mL dose was significantly more effective than 3.12 mg/mL for both microorganisms (p < 0.001), evidencing greater resistance of E. coli. However, at 12 h, differences between doses were attenuated for Staphylococcus spp. (p ≈ 1.000), while for E. coli they remained (p < 0.001). At 24 h, all differences between doses and between microorganisms disappeared (p = 1.000), achieving complete removal (≥99.97%) with both concentrations. In contrast, in highly contaminated water, the 6.25 mg/mL dose was consistently superior to 3.12 mg/mL at all times for both microorganisms (p < 0.001), evidencing a sustained dose–response effect. But at 24 h, although the difference between doses remained significant for Staphylococcus spp. (p < 0.05), differences between microorganisms disappeared (p = 1.000). These results confirm that, in low-contamination waters, the 3.12 mg/mL dose is sufficient to achieve total elimination at 24 h, while in highly contaminated waters the 6.25 mg/mL concentration is required to obtain the highest efficacy, underscoring the critical influence of the aqueous matrix on the bioavailability of the active compounds of the C. limon extract.
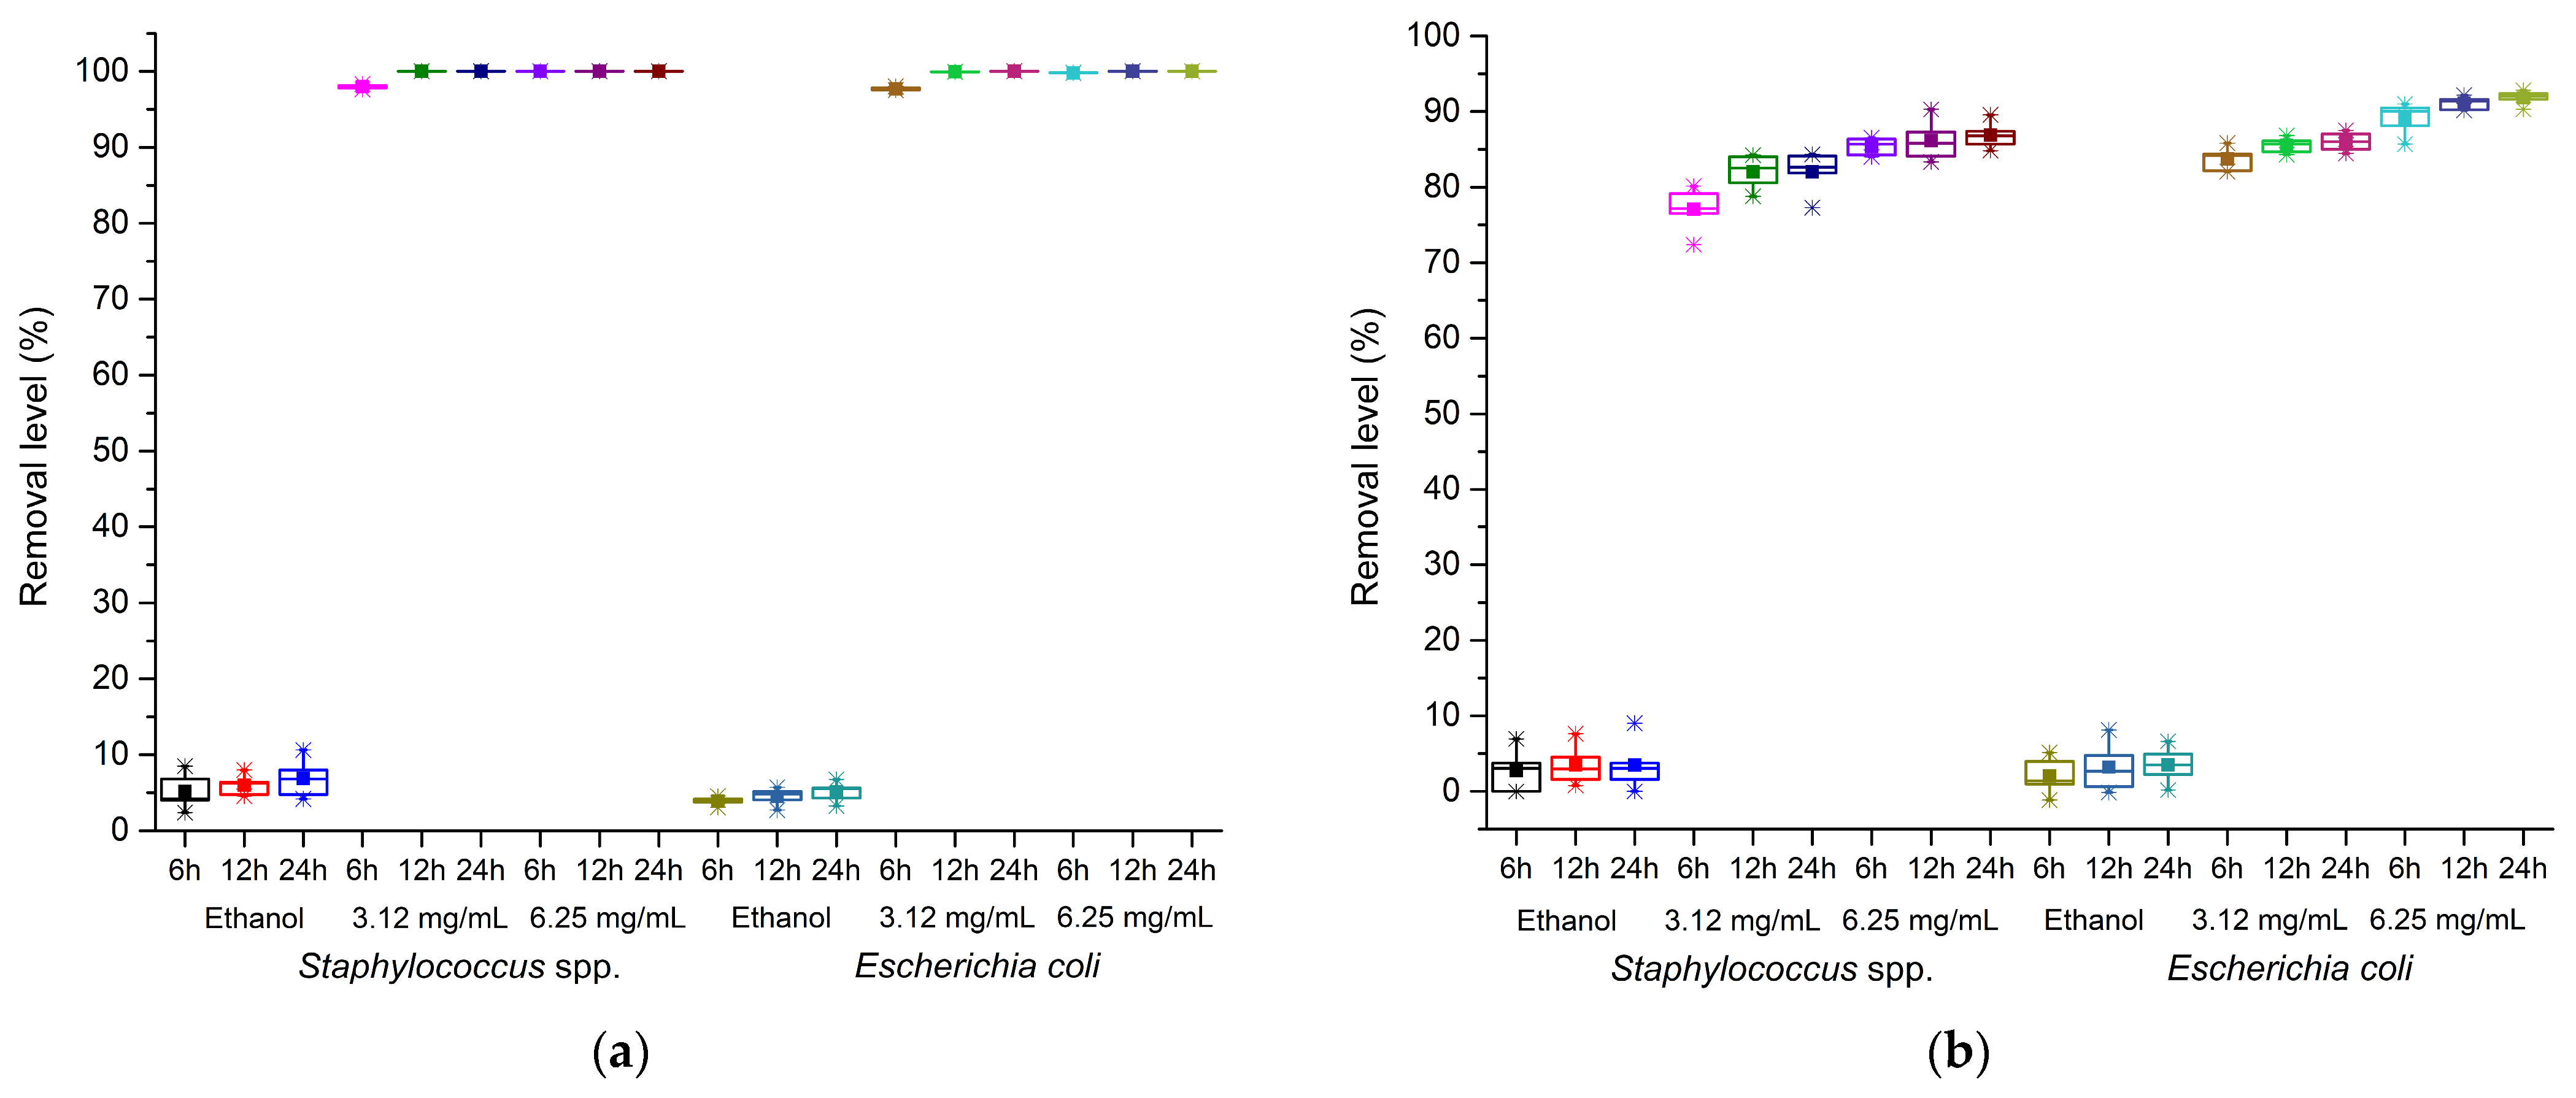
Figure 4 shows box-and-whisker plots corresponding to the percentages of removal of Staphylococcus spp. and E. coli in waters with different contamination levels, evaluated after 6, 12, and 24 h of exposure to ethanol (control) and two concentrations of the ethanolic extract of C. limon residues (3.12 and 6.25 mg/mL). In both types of water, the ethanol control did not exceed 10% removal and showed virtually no variability, confirming the absence of antimicrobial activity attributable to the solvent. Figure 4a (low-contamination water) shows dose- and time-dependent activity; with 3.12 mg/mL, removal was 97.99% at 6 h and 100% at 12 and 24 h, although with moderate dispersion and presence of outliers, while with 6.25 mg/mL the highest efficacies were obtained, with medians above 90% from 12 h and close to ≥99.97% at 24 h, accompanied by a marked reduction in interquartile variability, indicating greater consistency. For its part, Figure 4b (highly contaminated water) showed an analogous trend, although with slightly lower maximum percentages; at 3.12 mg/mL, removal ranged between 77–82% for Staphylococcus spp. and 83–86% for E. coli, while at 6.25 mg/mL values increased, reaching 85–87% and 89–92%, respectively, at 24 h. Overall, the results confirm that the 6.25 mg/mL extract offers the greatest consistency and effectiveness in the removal of both microorganisms, regardless of the initial bacterial load.
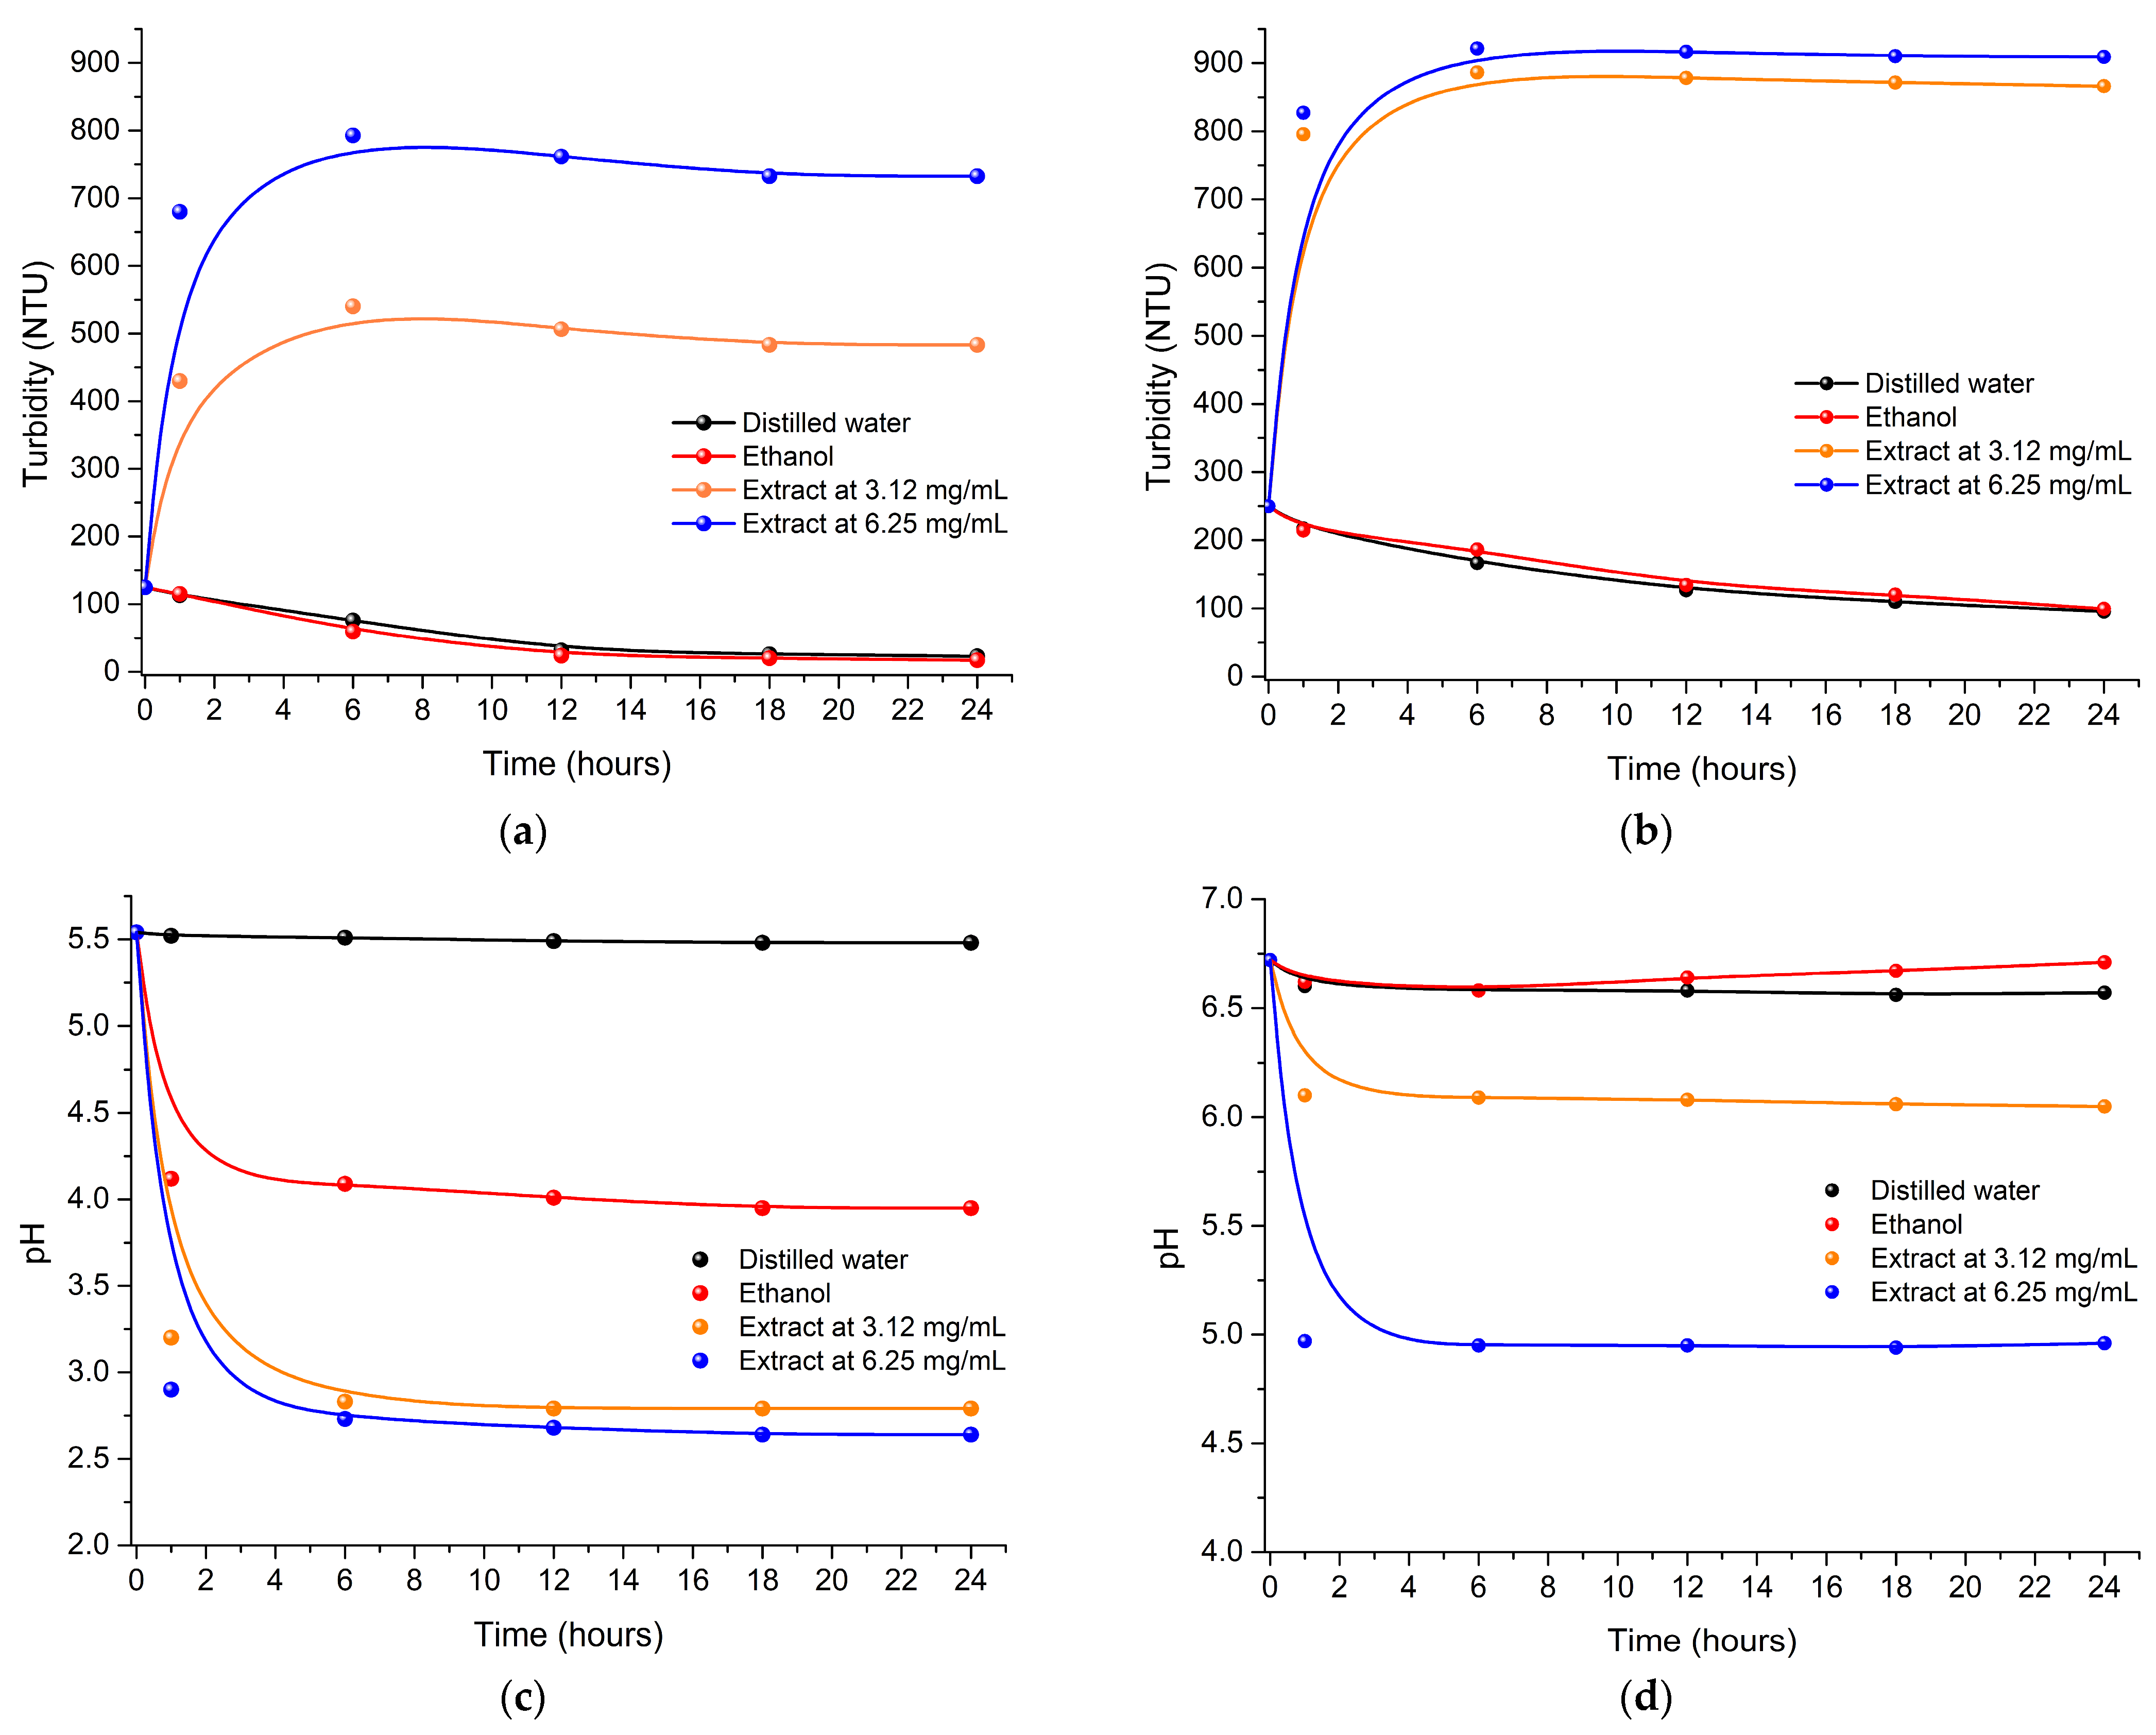
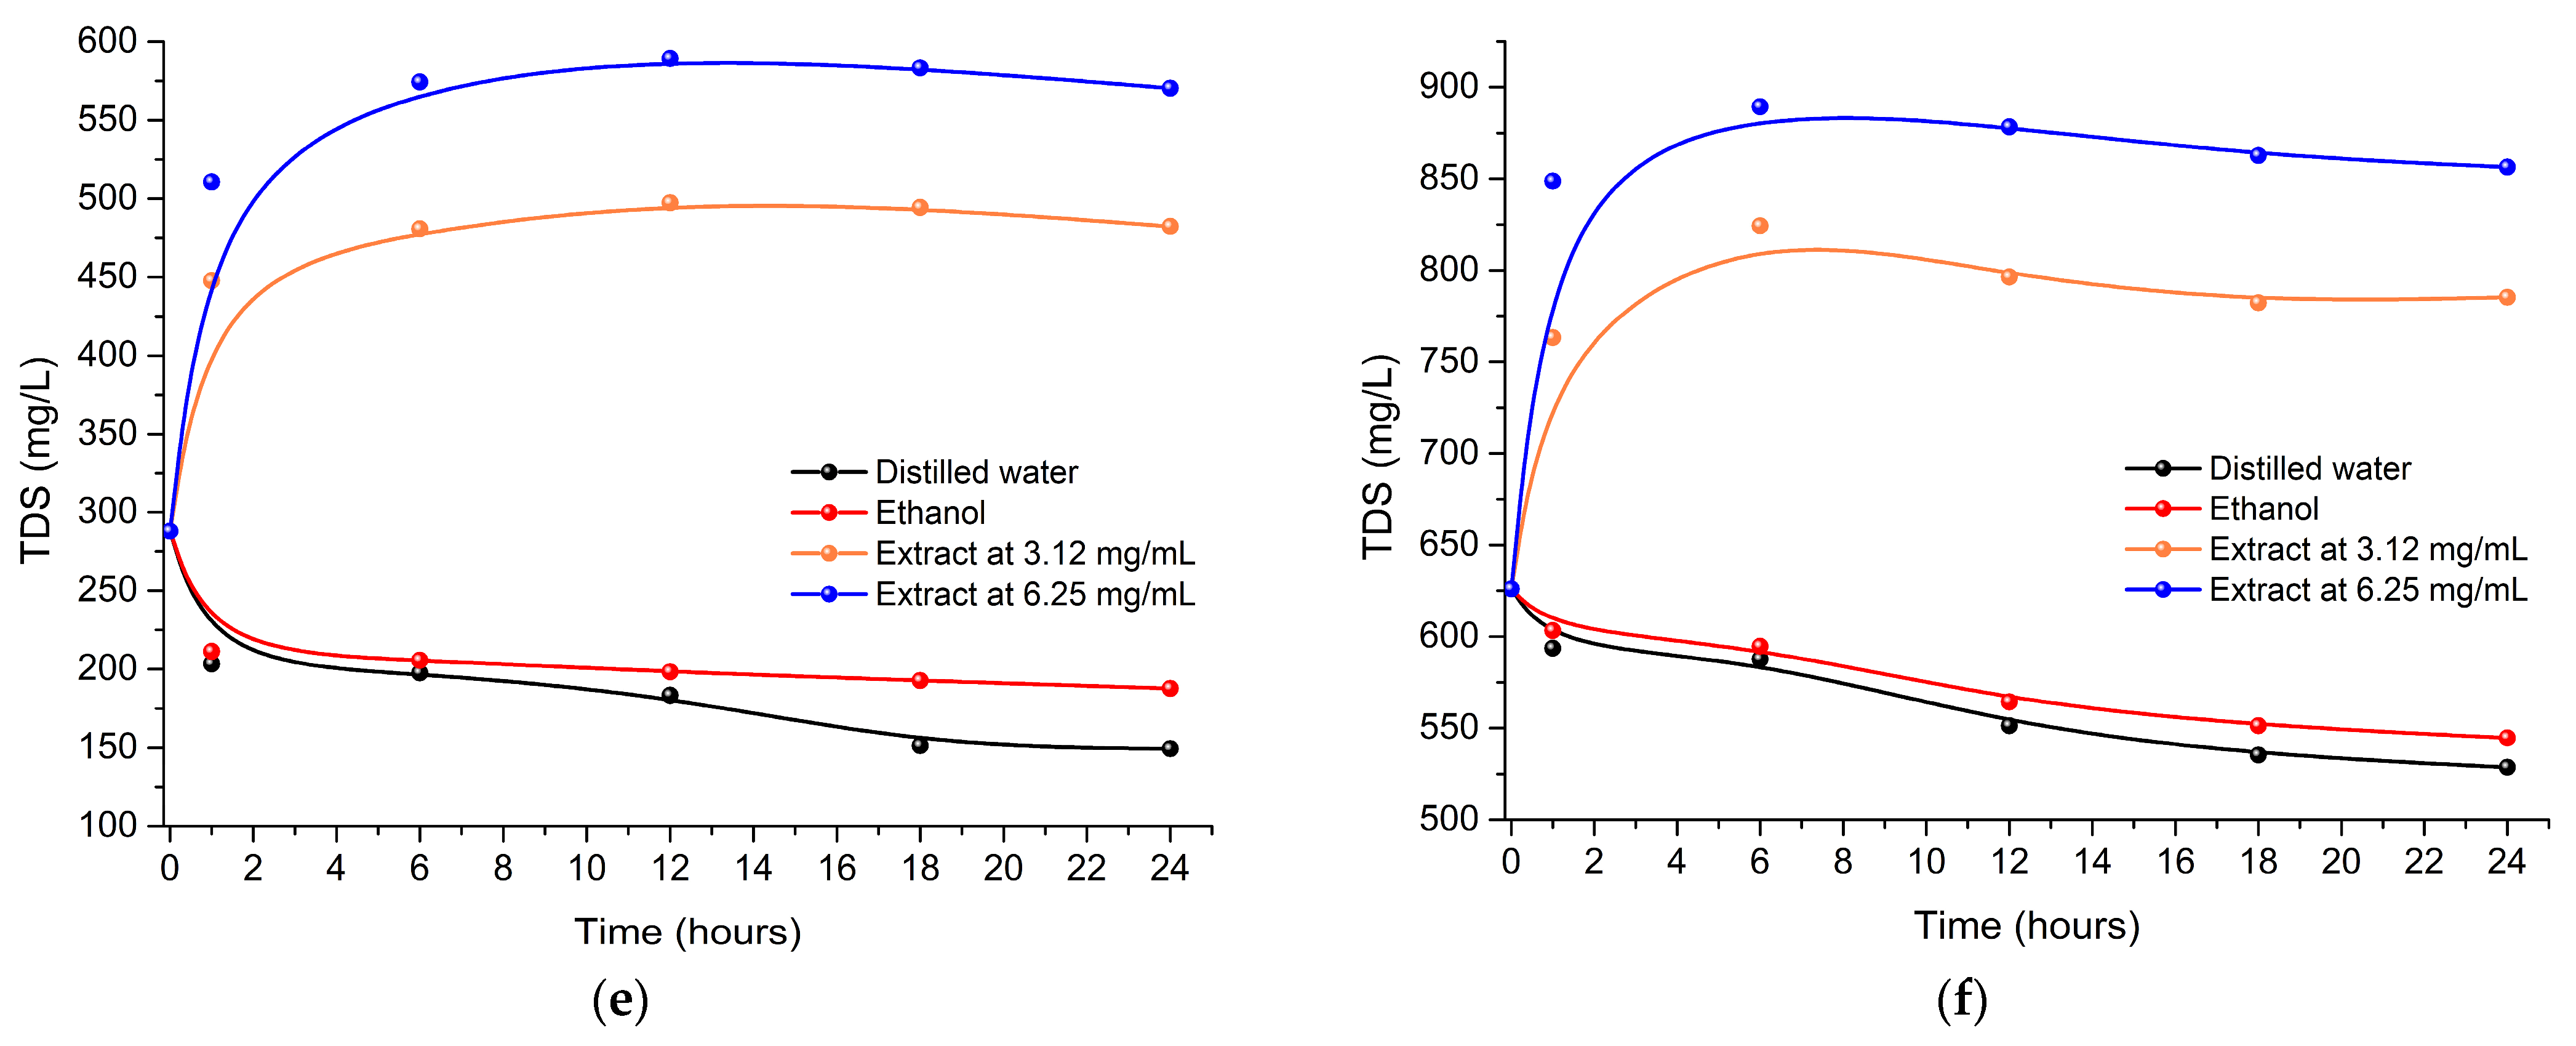
Figure 5 illustrates the evolution of turbidity, pH, and total dissolved solids (TDS) during the 24-h experiment in waters with two contamination levels (low and high), after the addition of controls (distilled water and ethanol) and Citrus limon extracts. Regarding turbidity (Figure 5a,b), an abrupt and sustained increase was observed in both water qualities treated with the extracts, reaching steady-state values close to 900 NTU from the first 6 h, in contrast to the controls, which remained at considerably lower levels (between 100 and 200 NTU). Regarding pH (Figure 5c,d), the addition of the extracts generated a marked acidification of the medium. In low-contamination water, pH dropped drastically to stabilize at values of 2.8 and 2.6 for treatments with extract at 3.12 and 6.25 mg/mL, respectively; while in highly contaminated water, the drop was more moderate, settling around 6.0 and 5.0 for treatments with extract at 3.12 and 6.25 mg/mL, respectively. Finally, TDS analysis (Figure 5e,f) revealed that treatment with extracts markedly increased the dissolved solids content in both matrices. In low-contamination water, TDS rose from baseline values of 150 mg/L to 500 and 580 mg/L for treatments with extract at 3.12 and 6.25 mg/mL, respectively; while in highly contaminated water, values increased from 600 mg/L to 800 and 900 mg/L for treatments with extract at 3.12 and 6.25 mg/mL, respectively. Overall, the results demonstrate that the application of extracts markedly modifies the physicochemical properties of water, causing an increase in turbidity and TDS, as well as a decrease in pH, with the 6.25 mg/mL extract treatment inducing the most pronounced alterations in the evaluated parameters. It is important to note that the physicochemical alterations induced by the extract—particularly the increase in turbidity to ~900 NTU, the rise in total dissolved solids (TDS), and the decrease in pH to values between 2.6 and 2.8 in low-contamination water—exceed the acceptable limits for treated water according to international standards.

4. Discussion

The extraction yield obtained in the present study (14.24 ± 0.45%) falls within the ranges commonly documented in the scientific literature for ethanolic extracts of citrus residues, although a marked influence of the solvent and the technique used is evident. Various investigations report that maceration with 96% ethanol for 24 h in lemon peel can reach yields of up to 19.10%; likewise, studies that optimize ultrasound-assisted extraction (UAE) using hydroalcoholic mixtures (with ethanol concentrations close to 63–70% v/v) usually achieve considerably higher gravimetric yields. The main reason for this difference lies in the nature of the solvent: as established by Razali et al. [60], ethanol concentrations between 50% and 70% in mixture with water maximize the extraction of phenolic compounds and glycosylated flavonoids, because the presence of water raises the dielectric constant of the medium, facilitating the rupture of solute–matrix interactions and the solubilization of polar metabolites. In contrast, the use of 99% ethanol (used in our study) shifts the equilibrium towards the extraction of less polar compounds such as terpenes and flavonoid aglycones, which explains the slightly lower yield compared to the reported hydroalcoholic extractions. Regarding the extraction method, despite the lower gravimetric yield, the 90-min sonication time proved to be much more efficient than the 24 h required by conventional maceration. The acoustic cavitation generated by ultrasound, as noted by Khan et al. [37], promotes cell rupture and accelerates the diffusion of active principles, offering the additional advantage of minimizing thermal degradation of thermosensitive compounds. This balance between speed and preservation of bioactivity is key in valorization processes. The low standard deviation (±0.45%) observed in our protocol confirms a high reproducibility of the sonication technique, a fundamental aspect for eventual transfer to pilot scale. Therefore, future research should focus on optimizing the ethanol:water ratio (e.g., 70–80% v/v) and adjusting the power and frequency parameters of the ultrasonic bath, in order to maximize both yield and biological activity of the extract, as suggested by Šafranko et al. and M’hiri et al. in their reviews and optimizations on citrus peels [61,62].
To contextualize the results of the spectroscopic characterization (Figure 1) with the available scientific evidence, a review of indexed studies in academic databases on ethanolic extracts of Citrus spp. residues was carried out. The spectral profile obtained in our C. limon extract shows agreement with reports in the specialized literature for citrus extracts. In the FTIR analysis, the broad band in the region of 3200–3600 cm−1, attributable to O–H stretches, is consistent with the presence of polar compounds such as phenols and glycosylated flavonoids, as documented in previous studies [45,46]. However, it is important to note that FTIR and UV-Vis techniques provide preliminary information on functional groups and chromophores, but do not allow the identification or quantification of specific compounds. Therefore, the assignments made should be interpreted with caution, and chromatographic analyses (HPLC, LC-MS) are required to confirm the identity and abundance of the metabolites present. However, comparative studies show that the intensity and exact position of this band can vary according to the solvent; while aqueous extracts usually present a broader signal due to the high presence of sugars and pectins, ethanolic extracts such as ours tend to show sharper bands in the range of 2850–2950 cm−1 (aliphatic C–H). This difference has been pointed out in previous publications, which highlight that ethanol favors the selective extraction of lipophilic compounds (terpenes and flavonoid aglycones) compared to water [47,48]. Likewise, the signal observed at 1700 cm−1 (C=O) and the bands between 1600–1500 cm−1 (aromatic C=C) are consistent with the typical spectra of flavonoid-type compounds. In the literature, flavonoids such as hesperidin and naringin, major compounds in citrus, have conjugated ketone carbonyls and benzene rings that absorb at those frequencies [63,64]. However, we cannot affirm that these specific compounds are present in our extract without confirmatory chromatographic analysis. The region of 1300–1000 cm−1, associated with C–O stretches, has been previously linked in the literature to the presence of glycosides and esters of phenolic acids, supporting the assignment of functional groups made in our analysis and is consistent with profiles reported for citrus peels [42,43].
Regarding UV-Vis spectroscopy characterization (Figure 1b), the strong absorbance observed in the interval of 300 to 400 nm is a recurrent finding in Citrus phytochemistry and is based on the π→π* electronic transitions of the conjugated aromatic rings present in flavonoids and phenolic acids [48,50]. Specific publications on ethanolic extracts of C. limon report absorption maxima around 280–330 nm, attributed in the literature to flavonoid-type compounds and other low molecular weight phenolic compounds [51,65]. Our results, with absorption in the region of 300–400 nm and a shoulder at 284 nm, are consistent with these reports. However, it is important to highlight that UV-Vis spectroscopy does not allow the identification of specific compounds such as hesperidin or naringin, and such identification would require chromatographic techniques (HPLC, LC-MS). A differential point that arises when contrasting our findings with other studies is the virtual absence of absorption signals in the visible spectrum (>400 nm). In the literature, it has been documented that, unlike aqueous extracts or those obtained with hexane, ethanolic extraction minimizes the co-extraction of liposoluble pigments such as carotenoids, which usually present absorbance in the range of 450–500 nm [66]. This characteristic confirms the relative purity of our sample in terms of polyphenols and flavonoids. Overall, the high correspondence of our spectra with the patterns established in the scientific literature validates the phytochemical integrity of the obtained extract and supports the correlation between the richness of these metabolites and the antimicrobial activity demonstrated in subsequent assays, as has been suggested in previous investigations addressing the bioactive potential of citrus residues [37,63].
The correlation between the FTIR spectral bands and the proposed antimicrobial mechanisms for the C. limon extract (Table 2) finds solid support in the specialized literature on citrus phytochemistry. The intense O–H band in the region of 3600–3200 cm−1, associated with phenols and alcohols, has been extensively documented in lemon peel extracts by Wongsa et al. and Yilmaz et al., who suggest that the high density of hydroxyl groups in polyphenols could contribute to the denaturation of bacterial proteins and the generation of reactive oxygen species (ROS) in the intracellular medium [52,53]. This possible oxidative stress mechanism, proposed in various citrus extracts, could act as an adjuvant in the elimination of Gram-positive bacteria, due to the absence of an external barrier that limits the access of these polar compounds [37]. However, it is important to note that these mechanisms of action have been reported in the literature for similar compounds, but were not experimentally evaluated in the present study. Therefore, the attribution of antimicrobial activity to these specific mechanisms is hypothetical and requires additional investigation for confirmation. For their part, the aliphatic C–H signals (3000–2850 cm−1), typical of terpenes and lipophilic components, have been linked by Trombetta et al. and Stasiuk & Kozubek with the ability of monoterpenes to insert into the lipid bilayer of the bacterial membrane [54,55]. When comparing our results with these precedents, the presence of this band in our ethanolic extract suggests that the co-extracted lipophilic fraction may contribute to the destabilization of the cell envelope, leading to increased permeability and leakage of essential ions and metabolites, a mechanism that has been consistently reported in studies on essential oils and organic extracts of Citrus spp. [54,55]. However, this interpretation is hypothetical and based on the literature, as no direct membrane permeability assays were conducted in this study.
As for the C=O (1750–1700 cm−1) and aromatic C=C (1680–1500 cm−1) bands, characteristic of flavonoids and esters, their correlation with enzymatic inhibition and alteration of membrane permeability has been exhaustively addressed in the literature. Almutairy and Ciriminna et al. attribute the antibacterial activity of citrus flavonoids to the inhibition of key enzymes such as DNA gyrase and ATPase, as well as the blockade of cell wall synthesis. These mechanisms, although not directly evaluated in the present study, could contribute to the observed antimicrobial activity [58,64,67,68]. Nevertheless, this attribution is speculative and relies on analogies with the literature rather than on direct evidence obtained in this work. A particularly relevant finding when comparing with other studies is that the anti-biofilm activity of citrus extracts is associated with the presence of aromatic functional groups, as indicated in the literature [59,62]. Although our extract shows signals compatible with these groups, fractionation or bioactivity-guided analysis studies were not performed that would allow establishing a direct causal relationship between the detected compounds and the observed antimicrobial activity. Consequently, the attribution of this activity to specific flavonoids or terpenes should be considered hypothetical.
Finally, unlike previous investigations that tend to focus on a single mechanism of action [55,67], the integration of all spectral signals in our study leads us to hypothesize a synergistic and multifactorial mode of action that combines membrane damage, oxidative stress, and enzymatic inhibition. This multi-target nature is consistent with the hypothesis that the antimicrobial efficacy of the C. limon extract is not attributable to a single compound, but rather to the combination of its various phytochemical fractions (phenols, terpenes, and flavonoids), as has been suggested in recent reviews on the valorization of agro-industrial residues and their potential in water treatment [68].
The evaluation of the in vitro antimicrobial activity of the ethanolic extract of C. limon residues (Table 3) revealed a marked selectivity in its action, evidenced by Minimum Inhibitory Concentration (MIC) and Minimum Bactericidal Concentration (MBC) values that were approximately double for E. coli (MIC: 6.25 mg/mL; MBC: 12.5 mg/mL) compared to S. aureus (MIC: 3.12 mg/mL; MBC: 6.25 mg/mL). This disparity is based on the structural differences in the bacterial cell envelope [69,70]; the presence of an outer membrane composed of lipopolysaccharides (LPS) in Gram-negative bacteria acts as a highly selective permeability barrier that limits the diffusion of bioactive compounds, while the cell wall of Gram-positive cocci, lacking such a membrane, allows more direct penetration of antimicrobial agents [22,71]. When contrasting these findings with the indexed scientific literature, a high concordance is observed with the ranges reported for ethanolic extracts of Citrus spp. peels, where MICs against S. aureus usually range between 1.0 and 4.0 mg/mL and against E. coli between 2.0 and 8.0 mg/mL [68,69,72]. Nevertheless, the inhibitory potency achieved in our study suggests that the sonication technique employed in the extraction favored greater preservation and release of phenolic and flavonoid compounds compared to conventional methods [68]. The literature also warns that, although these extracts possess high intrinsic activity, their efficacy in complex aqueous matrices may be attenuated by the presence of dissolved organic matter that sequesters or adsorbs the active principles [73]. It is important to emphasize that the determination of these MIC and MBC values not only allowed us to characterize the antimicrobial potential of the extract against reference strains. These concentrations were also used as guiding references for selecting the doses applied in the remediation assays (3.12 and 6.25 mg/mL). However, it should be noted that the MIC and MBC values obtained for reference strains cannot be directly extrapolated to the uncharacterized microorganisms present in natural waters, whose composition, physiological state, and membrane structure may differ significantly. Therefore, the doses applied in the remediation assays should be regarded as a starting point based on the target strains, rather than as optimal concentrations for complex environmental matrices. The solvent control used in this study was 99% ethanol, which does not contain DMSO. Since the extract treatments contained a mixture of ethanol and DMSO (final concentrations: 6.19% ethanol + 3.75% DMSO for 3.12 mg/mL; 12.38% ethanol + 7.50% DMSO for 6.25 mg/mL), the solvent control did not fully reproduce the solvent composition of the extract treatments. However, based on literature data, the final concentrations of both solvents (below 10% for ethanol and below 8% for DMSO) are not expected to exert significant antimicrobial activity [38,39,69]. Therefore, the contribution of the solvents to the observed bacterial inactivation is considered minimal, although it cannot be entirely excluded. Future studies should include a DMSO-only control at equivalent concentrations to fully disentangle solvent effects from those of the extract.
The logarithmic reduction (log10) (Figure 2) and removal percentage (Figure 3) results confirm that the ethanolic extract of C. limon residues possesses potent antimicrobial activity, but this is highly dependent on the initial microbial load and the complexity of the aqueous matrix. The ethanol control did not generate a significant reduction in any of the treatments, with removal percentages below 5%, thus ruling out an antimicrobial effect attributable to the solvent. In low-contamination water (Figure 2a and Figure 3a), efficacy was notable and dose-dependent. The 6.25 mg/mL concentration achieved reduction below the detection limit to < 1 CFU/mL (below LOD) and ≥99.97% removal for Staphylococcus spp. and E. coli in just 6 h. With the 3.12 mg/mL dose, ≥99.97% removal was achieved at 12 h for Staphylococcus spp. and at 24 h for E. coli, reflecting a greater resistance of the Gram-negative bacterium. In contrast, in highly contaminated water (Figure 2b and Figure 3b), activity was drastically attenuated; both treatments (6.25 and 3.12 mg/mL) achieved reductions in the order of 0.8 to 1.1 logarithmic units and removal percentages ranging between 78% and 92% at 24 h. When contrasting these findings with the indexed literature, it is observed that the logarithmic reductions of 3.6 units (in low-contamination water) fall within the range reported for citrus-based disinfectants such as Biosecur® (3–6 log against Vibrio vulnificus) [32] and Citrox® (2.8–4.8 log against E. coli O157:H7) [33]. Likewise, removal percentages close to ≥99.97% in the low-load matrix exceed or equal those reported with natural coagulants such as bread yeast (95–99%) [74] and Plantago ovata extract (almost complete removal in low-contamination waters) [75]. The drastic decrease in efficacy in highly contaminated water is attributed to the “matrix demand” effect [68,73], where the elevated concentration of dissolved organic matter and suspended solids generates sequestration or adsorption of the phenolic and flavonoid compounds of the extract, reducing their bioavailability to interact with bacterial cells. Finally, the difference in inactivation kinetics observed in low-contamination water (where S. aureus is eliminated in 12 h and E. coli in 24 h with the same 3.12 mg/mL dose) is aligned with the structural differences in the cell envelope; the outer lipopolysaccharide (LPS) membrane in Gram-negative bacteria acts as a restrictive permeability barrier for active metabolites [69,70,76], while the peptidoglycan layer of Gram-positive cocci is more porous and facilitates direct penetration of the extract [22,71]. These results show that, although the extract possesses excellent intrinsic capacity for the disinfection of waters with moderate microbial loads, its direct application in highly contaminated matrices will require complementary or combined strategies to overcome medium interferences.
The statistical analysis using Dunn’s post-hoc test with Holm correction revealed significant differences in the antimicrobial efficacy of the ethanolic C. limon extract depending on the initial contamination level, the applied dose, and the exposure time. In low-contamination water, all extract concentrations (3.12 and 6.25 mg/mL) showed significantly higher activity than the ethanol control (p < 0.001) at all evaluated times. Although at 6 h the 6.25 mg/mL dose was significantly more effective than 3.12 mg/mL for both microorganisms (p < 0.001), this difference disappeared at 24 h (p ≈ 1.000), achieving total removal (≥99.97%) with both concentrations. This behavior suggests that, in matrices with low organic and microbial load, the lower dose is sufficient to achieve complete disinfection, as long as adequate contact time is available. In contrast, in highly contaminated water, the 6.25 mg/mL dose maintained significantly higher efficacy than 3.12 mg/mL at all evaluated times (p < 0.001), evidencing a sustained dose–response effect. The persistence of these differences is attributed to the so-called “matrix demand effect”, where the high concentration of dissolved organic matter and suspended solids present in the more complex matrix interacts with the phenolic and flavonoid compounds of the extract, sequestering or adsorbing them and thus reducing their bioavailability to act on bacterial cells, as described by Gómez-Llorente et al. [77]. This phenomenon would explain why a higher concentration of extract is required to compensate for medium interferences and reach removal levels comparable to those obtained in low-contamination waters. Likewise, the significant differences observed between the elimination of E. coli and Staphylococcus spp. at the initial time points (p < 0.05), especially in highly contaminated water, support the hypothesis of a greater intrinsic resistance of Gram-negative bacteria, attributable to the presence of the outer lipopolysaccharide membrane that acts as a selective permeability barrier, similar to that observed in research carried out with essential oils of C. limon [78,79]. Nevertheless, the disappearance of these differences at 24 h suggests that, with sufficient exposure time, the extract manages to overcome said barrier, probably through synergistic mechanisms that combine the action of flavonoids, terpenes, and organic acids present in the extract. Overall, these statistical findings confirm that the efficacy of the C. limon extract is highly dependent on the characteristics of the aqueous matrix, underscoring the need to optimize the dose and contact time according to the initial contamination level, as well as to consider complementary strategies to mitigate the interferences of dissolved organic matter in practical wastewater treatment applications.
Figure 5 illustrates the effect of the C. limon extracts (3.12 and 6.25 mg/mL) on the evolution of turbidity, pH, and total dissolved solids (TDS) in waters with different contamination levels, contrasted with distilled water and ethanol controls. Regarding turbidity (Figure 5a,b), an abrupt and sustained increase was observed in samples treated with both extracts, reaching steady-state values close to 500–580 NTU in low-contamination water and between 850–900 NTU in the highly contaminated matrix, while the controls remained stable and below 200 NTU. This behavior is contrary to the clarifying effect typical of natural coagulants such as Moringa oleifera [69], and although some investigations describe transient increases in turbidity after the addition of extracts due to the release of soluble compounds that later sediment [70,71,72], in our study the elevation of turbidity was persistent over time. This phenomenon is attributed to the chemical nature of the ethanolic extract, which provides a significant load of organic compounds (pectins, flavonoids, and other metabolites) that remain in colloidal or finely dissolved suspension, highlighting that coagulant efficacy critically depends on formulation, solvent type (ethanol vs. aqueous), and the applied dose [73], showing that the C. limon extract does not act as a conventional primary coagulant under these conditions.
On the other hand, the consistent acidification of pH in both matrices (Figure 5c,d) constitutes a direct and predictable effect, attributable to the high content of low molecular weight organic acids (mainly citric and ascorbic acid) present in the peels of C. limon [80,81]. The dissociation of these acids releases protons (H+) into the aqueous medium [82]. However, a marked difference was observed in the magnitude of the decrease; in low-contamination water, pH fell to values close to 2.6, while in highly contaminated water the reduction was less pronounced (pH between 5.0 and 6.0), suggesting a buffering effect exerted by the high load of organic matter and dissolved solids present in the more complex matrix. The literature supports that acidic pH is a co-adjuvant factor of antimicrobial activity, since it alters bacterial intracellular ionic homeostasis, affects enzymatic activity, and potentiates the lipophilicity of flavonoids, creating a synergistic hostile environment for pathogens [69,83]. An important limitation of the study is that the extract caused strong acidification (pH 2.6–2.8 in low-contamination water), a factor that by itself can inactivate bacteria. The absence of pH controls and the lack of sample neutralization before plating may have led to an overestimation of bactericidal activity. Consequently, the antimicrobial effects cannot be conclusively attributed to the phytochemicals (e.g., flavonoids, terpenes) rather than to low pH or carryover effects. The proposed mechanisms therefore remain hypothetical. Future studies should include pH-adjusted controls, neutralized extract treatments, and validated neutralization to distinguish the effects of pH from those of the phytochemicals.
Regarding total dissolved solids (Figure 5e,f), the results showed a notable increase after the addition of extracts in both matrices. Contrary to the initial expectation of a reduction due to coagulation processes, TDS content increased steadily over time, indicating that the net input of organic solutes (polar metabolites of the extract) exceeded any inorganic ion removal process. However, the slight tendency towards stabilization and eventual decrease observed in the graphs, especially in the highly contaminated matrix (Figure 5f), suggests that a secondary physicochemical interaction mechanism could exist. Previous investigations indicate that polyfunctional organic acids or polyphenols present in citrus extracts can act as chelating agents of inorganic ions such as Ca2+, Mg2+, and phosphates, or even promote the co-precipitation of dissolved organic matter through the formation of hybrid organic-inorganic flocs [80,81,82]. However, in our study, the net effect demonstrates that the crude ethanolic extract adds a considerable amount of solutes to the water, increasing TDS. This constitutes a significant practical limitation that must be addressed through dose optimization or purification of specific active fractions to minimize the negative impact on the physicochemical quality of the treated water.
The results of this study show that, although the extract achieves significant bacterial elimination, it simultaneously causes an increase in turbidity (up to about 900 NTU), a rise in TDS, and a decrease in pH (2.6 to 2.8) in waters with low contamination. These values fall outside the ranges considered acceptable for treated water (for example, the WHO recommends turbidity below 5 NTU for drinking water and a pH between 6.5 and 8.5). Consequently, the treated water would require subsequent treatment such as neutralization with an alkaline agent, filtration or sedimentation to remove suspended solids, and possibly adsorption or membrane processes to reduce TDS before it can be considered suitable for any practical use. Therefore, this study demonstrates that the extract should be regarded as a potential disinfection step within a multiple-barrier treatment system rather than as an independent remediation solution. Future research should focus on integrating this extract with complementary processes (such as filtration, UV radiation, or neutralization) to achieve the appropriate levels of both microbiological and physicochemical quality.
It is important to recognize the following limitations of the present study. First, the phytochemical characterization was performed exclusively by FTIR and UV-Vis spectroscopy, techniques that provide preliminary information on functional groups and chromophores, but do not allow the identification or quantification of specific compounds. Therefore, the assignments made and the attribution of antimicrobial activity to particular metabolites (such as flavonoids or terpenes) are hypothetical and based on comparisons with the literature. Chromatographic analyses (HPLC, LC-MS) and bioactivity-guided fractionation studies are required to confirm the identity of the compounds responsible for the observed activity. Second, the proposed mechanisms of action (membrane destabilization, generation of reactive oxygen species, enzymatic inhibition) were not experimentally evaluated; the hypotheses presented are based on previous reports for similar compounds and must be confirmed in future studies. Third, the antimicrobial evaluation was limited to two indicator bacteria (Staphylococcus spp. and E. coli), so the efficacy of the extract against other microorganisms present in natural waters (other bacteria, fungi, viruses) was not determined. Likewise, additional water quality parameters such as electrical conductivity or specific organic matter content (COD, BOD) were not measured, which could influence the bioavailability and efficacy of the active compounds. This represents a significant limitation for the interpretation of the matrix demand effect, since it was not possible to quantify the specific contribution of dissolved organic matter and inorganic ions to the reduction in antimicrobial efficacy. Future research should include these parameters to better understand the interactions between the extract and the aqueous matrix, as well as their influence on the effectiveness of the active compounds, with the aim of optimizing their application. It is also important to acknowledge that this study did not conduct a life cycle assessment (LCA), nor did it quantify energy consumption, solvent recovery, or the environmental burdens associated with extract production. Therefore, the sustainability of the process should be considered as a potential context rather than as a demonstrated outcome. This is because the primary objective of this study was to evaluate the antimicrobial efficacy and physicochemical effects of the extract in real contaminated waters, rather than to perform a comprehensive sustainability assessment. Future investigations should include a full LCA to quantify the environmental footprint of the extract and compare it with conventional water treatment options. Finally, the study was conducted at laboratory scale with exposure times of up to 24 h, so larger-scale trials and more realistic conditions are needed to evaluate the practical viability of the extract as a disinfecting agent. Despite these limitations, the findings presented constitute a solid basis for future research aimed at the identification of active principles, elucidation of mechanisms of action, and optimization of their application in sustainable water treatment.


5. Conclusions

The ethanolic extracts obtained from C. limon residues demonstrated significant antimicrobial activity against Staphylococcus spp. and E. coli, dependent on the dose and the initial contamination level of the aqueous matrix. Preliminary spectroscopic characterization by FTIR and UV-Vis revealed the presence of functional groups (O–H, C=O, aromatic C=C) consistent with phenolic and flavonoid-type structures, which have been associated in the literature with antimicrobial activity. However, it is important to note that the identification of specific compounds and the attribution of activity to particular metabolites are hypothetical, since chromatographic analyses (HPLC, LC-MS) or fractionation studies were not performed. Therefore, conclusions about the chemical basis of the activity should be interpreted with caution. Additional research, including the identification and quantification of active compounds, as well as the evaluation of their toxicity and stability, is required to determine the viability of this extract as an antimicrobial agent in sustainable water treatment.
The microbiological evaluation confirmed the hypothesis of a differential and selective efficacy. The extract demonstrated greater activity against S. aureus (Gram-positive) compared to E. coli (Gram-negative), supported by lower MIC and MBC values, which is attributed to the additional permeability barrier represented by the outer membrane of Gram-negative bacteria. However, antimicrobial efficacy was highly dependent on the contaminant load. While in low-load water ≥99.97% removal and reductions of up to 4 logarithmic units were achieved in 24 h, in high-load water the reduction was close to 1 log unit (0.8–1.1 log), with removal percentages between 80 and 92%. This confirms that the presence of dissolved organic matter and suspended solids generates a “matrix demand” effect that reduces the bioavailability of the active compounds.
Regarding physicochemical parameters, the extract did not act as a conventional clarifying coagulant. On the contrary, it induced a sustained increase in turbidity and a substantial increase in total dissolved solids (TDS) in both matrices analyzed, attributable to the addition of the extract’s own soluble organic compounds. In parallel, acidification of pH was a consistent effect, directly linked to the organic acids present in the citrus residue. Overall, the net increase in TDS and turbidity, together with the antimicrobial attenuation in complex waters, constitute the main practical limitations for its isolated application in conventional clarification treatments.
In conclusion, the results validate the principle of valorizing C. limon residues under a circular economy approach, transforming them into an input with selective antimicrobial properties. However, their direct application cannot be regarded as an autonomous remediation solution, as the treatment induces a notable deterioration in the physicochemical quality of water (increased turbidity and TDS, and a decrease in pH to 2.6 to 2.8). This underscores the need for future research to evaluate their synergy with post-treatment processes (e.g., neutralization, filtration) so that treated water may be considered suitable for use. Moreover, the environmental sustainability of the process cannot be assumed solely on the basis of using a residue; it requires assessment of energy consumption, solvent recovery, and associated environmental burdens through a comprehensive life cycle analysis. Therefore, the extract should be positioned as a potential disinfection step within a multibarrier treatment train rather than as a stand-alone solution, while future studies should incorporate full LCA evaluations to quantify its environmental footprint and compare it with conventional water treatment options.

Author Contributions

Conceptualization, L.C.-C. and M.G.-C.; methodology, M.D.L.C.-N. and V.S.-A.; software, P.P.-P.; validation, L.C.-C., M.G.-C. and M.D.L.C.-N.; formal analysis, V.S.-A.; investigation, M.D.L.C.-N. and P.P.-P.; resources, L.C.-C.; data curation, M.G.-C.; writing—original draft preparation, L.C.-C. and M.D.L.C.-N.; writing—review and editing, M.G.-C. and V.S.-A.; visualization, P.P.-P.; supervision, L.C.-C.; project administration, M.G.-C.; funding acquisition, L.C.-C. All authors have read and agreed to the published version of the manuscript.

Funding

This research received no external funding.

Institutional Review Board Statement

Not applicable.

Informed Consent Statement

Not applicable.

Data Availability Statement

The original contributions presented in this study are included in the article. Further inquiries can be directed to the corresponding author.

Acknowledgments

The authors acknowledge the Research Centers and Institutes of Universidad César Vallejo for providing the facilities and institutional support for this study.

Conflicts of Interest

The authors declare no conflicts of interest.

Appendix A

Appendix A.1

As summarized in Table A1, the bacterial removal data generally satisfied the assumption of normality across the evaluated treatments. For the ethanol controls, all Shapiro–Wilk test p values exceeded 0.05 for both Staphylococcus spp. and E. coli under low and high contamination conditions, indicating consistency with a normal distribution and supporting the use of parametric statistical approaches. Likewise, for the extract treatments (3.12 and 6.25 mg/mL) in highly contaminated water, p values remained above 0.05, further confirming data normality. In contrast, normality testing could not be performed for the extract treatments in low-contamination water that achieved removals of ≥99.97%, as the absence of variability among replicates precluded calculation of the Shapiro–Wilk statistic. Rather than indicating a statistical limitation, this result reflects the highly consistent antimicrobial performance of the extract, particularly at the highest concentration tested.
Table A1. Normality testing of bacterial removal percentages for Staphylococcus spp. and E. coli under ethanol and Citrus limon extract treatments (3.12 and 6.25 mg/mL) in processed water matrices.
Extract Dosage% Removal of Staphylococcus spp. (Mean ± SD) in Low-Contamination Water
6 hp-Value12 hp-Value24 hp-Value
Ethanol5.17 ± 1.090.6685.98 ± 9.240.5256.87 ± 1.160.731
3.12 mg/mL97.99 ± 0.110.992≥99.97 ± 0.00N.A.≥99.97 ± 0.00N.A.
6.25 mg/mL≥99.97 ± 0.00N.A.≥99.97 ± 0.00N.A.≥99.97 ± 0.00N.A.
Extract Dosage% Removal of E. coli (Mean ± SD) in Low-Contamination Water
6 hp-Value12 hp-Value24 hp-Value
Ethanol3.85 ± 0.240.8844.47 ± 0.520.7325.09 ± 0.600.837
3.12 mg/mL97.71 ± 0.090.12299.94 ± 0.010.421≥99.97 ± 0.00N.A.
6.25 mg/mL99.82 ± 0.090.747≥99.97 ± 0.00N.A.≥99.97 ± 0.00N.A.
Extract Dosage% Removal of Staphylococcus spp. (Mean ± SD) in Highly Contaminated Water
6 hp-Value12 hp-Value24 hp-Value
Ethanol2.74 ± 1.290.4173.50 ± 1.210.6713.47 ± 1.520.462
3.12 mg/mL77.07 ± 1.340.60582.03 ± 1.040.49882.04 ± 1.270.156
6.25 mg/mL85.38 ± 0.520.24386.16 ± 1.240.72386.86 ± 0.800.862
Extract Dosage% Removal of E. coli (Mean ± SD) in Highly Contaminated Water
6 hp-Value12 hp-Value24 hp-Value
Ethanol2.05 ± 1.120.8023.20 ± 1.490.6853.48 ± 1.100.997
3.12 mg/Ml83.72 ± 0.710.42385.53 ± 0.460.79086.02 ± 0.580.728
6.25 mg/Ml89.08 ± 0.970.34091.12 ± 0.390.32391.83 ± 0.430.548
Note: N.A. = Not applicable, since results reported ≥99.97% removal due to absence of bacterial growth on plates.

Appendix A.2

Table A2 shows the results obtained in the homogeneity of variances test (Levene’s test). This test was applied to evaluate the assumption of homogeneity of variances in the percentages of bacterial removal, both in low-contamination and highly contaminated water, at the three exposure times evaluated (6, 12, and 24 h). The results revealed that in both aqueous matrices and at all evaluated times, the assumption of homoscedasticity was not met, with p-values < 0.05 in all cases. In low-contamination water, F-statistics ranged between 5.231 and 7.145 (p = 0.009 to 0.002), while in highly contaminated water, F-values fluctuated between 4.872 and 6.154 (p = 0.011 to 0.005). This violation of the homogeneity of variances assumption is mainly attributed to the marked difference in variability among the experimental groups; the extract treatments that achieved removal percentages close to ≥99.97% (especially in low-contamination water) presented extremely low or zero variances, in contrast to the ethanol controls that showed moderate but consistent variability. These findings confirm that a classical parametric ANOVA is not appropriate for the analysis of these data, fully justifying the use of non-parametric methods such as the Kruskal–Wallis test, followed by Dunn’s post-hoc test with Holm correction for multiple comparisons, as implemented in the present study.
Table A2. Results of Levene’s test for homogeneity of variances of bacterial removal percentages in waters with different contamination levels.
Aqueous MatrixTime (h)F-Statisticgl1gl2p-ValueConclusion
Low-contamination water65.2315240.009Heterogeneous variances (p < 0.05)
126.8725240.003Heterogeneous variances (p < 0.05)
247.1455240.002Heterogeneous variances (p < 0.05)
Highly contaminated water64.8725240.011Heterogeneous variances (p < 0.05)
126.1545240.005Heterogeneous variances (p < 0.05)
245.9235240.006Heterogeneous variances (p < 0.05)

Appendix A.3

Table A3 presents the results of the non-parametric Kruskal–Wallis test. This non-parametric test was applied to compare the efficacy of the six experimental treatments (ethanol controls and ethanolic extract of C. limon at 3.12 and 6.25 mg/mL, evaluated against Staphylococcus spp. and E. coli) in waters with different contamination levels, evaluated at 6, 12, and 24 h. The results revealed statistically significant differences between treatments in all evaluated conditions (p < 0.001), with H-statistic values ranging between 27.165 and 27.893 for low-contamination water, and between 25.10 and 28.39 for highly contaminated water. In low-contamination water, the average ranks showed a clear separation between ethanol controls (ranks from 4.20 to 6.80) and extract treatments (ranks from 13.00 to 28.00). At 24 h, all extract treatments reached the same average rank (20.50), reflecting the complete removal (≥99.97%) in all cases. In highly contaminated water, the rank hierarchy was consistent at all times: ethanol controls presented the lowest ranks. The magnitude of the H-values and the observed statistical significance (p < 0.001) confirm that the extract exerts a differential and dose- and time-dependent antimicrobial activity, justifying the application of Dunn’s post-hoc test to identify the pairs of treatments that differ significantly from each other.
Table A3. Results of the Kruskal–Wallis test for the comparison of treatments in waters with different contamination levels, including the average ranks of each experimental group.
Aqueous MatrixTimeTreatmentAverage RankglH-Statisticp-Value
Low-contamination water6 HStaphylococcus spp.—Ethanol6.30527.16<0.001
Staphylococcus spp.—3.12 mg/mL17.10
Staphylococcus spp.—6.25 mg/mL28.00
E. coli—Ethanol4.70
E. coli—3.12 mg/mL13.90
E. coli—6.25 mg/mL23.00
12 HStaphylococcus spp.—Ethanol6.80527.89<0.001
Staphylococcus spp.—3.12 mg/mL23.00
Staphylococcus spp.—6.25 mg/mL23.00
E. coli—Ethanol4.20
E. coli—3.12 mg/mL13.00
E. coli—6.25 mg/mL23.00
24 HStaphylococcus spp.—Ethanol6.60527.71<0.001
Staphylococcus spp.—3.12 mg/mL20.50
Staphylococcus spp.—6.25 mg/mL20.50
E. coli—Ethanol4.40
E. coli—3.12 mg/mL20.50
E. coli—6.25 mg/mL20.50
Highly contaminated water6 HStaphylococcus spp.—Ethanol5.20527.64<0.001
Staphylococcus spp.—3.12 mg/mL12.80
Staphylococcus spp.—6.25 mg/mL18.80
E. coli—Ethanol4.60
E. coli—3.12 mg/mL16.30
E. coli—6.25 mg/mL23.30
12 HStaphylococcus spp.—Ethanol5.10528.39<0.001
Staphylococcus spp.—3.12 mg/mL12.60
Staphylococcus spp.—6.25 mg/mL18.40
E. coli—Ethanol4.30
E. coli—3.12 mg/mL16.90
E. coli—6.25 mg/mL23.70
24 HStaphylococcus spp.—Ethanol4.90525.10<0.001
Staphylococcus spp.—3.12 mg/mL13.10
Staphylococcus spp.—6.25 mg/mL20.00
E. coli—Ethanol5.30
E. coli—3.12 mg/mL17.20
E. coli—6.25 mg/mL22.50

Appendix A.4

Table A4 presents the results of the post-hoc Dunn’s test with Holm correction for low-contamination water samples, which revealed clear patterns of antimicrobial activity of the ethanolic extract of C. limon, dependent on dose and exposure time. At 6 h of treatment, all extract concentrations (3.12 and 6.25 mg/mL) showed statistically significant differences (p < 0.001) compared to ethanol controls, confirming the intrinsic bactericidal activity of the extract. The 6.25 mg/mL dose was significantly more effective than 3.12 mg/mL (p < 0.001), achieving ≥99.97% removal for Staphylococcus spp., while the lower dose reached 97.99% removal for the same microorganism. For E. coli, differences between doses were also significant (p < 0.001), evidencing a greater resistance of this Gram-negative bacterium. At 12 h, differences between both concentrations were attenuated for Staphylococcus spp. (p = 1.000), reaching complete removal, while for E. coli a significant difference remained (p < 0.001), with the 6.25 mg/mL dose achieving ≥99.97% removal and the 3.12 mg/mL dose reaching 99.94%. At 24 h, all differences between doses and between microorganisms disappeared (p = 1.000), achieving total ≥99.97% removal in all extract treatments. These findings demonstrate that, although the 6.25 mg/mL concentration accelerates the disinfection process in the initial times, both doses are equally effective in achieving complete elimination of the bacterial load in low-contamination waters after 24 h of exposure, suggesting that the 3.12 mg/mL dose could be sufficient in matrices with low microbial load, thus optimizing the use of the extract in terms of cost-effectiveness.
Table A4. Results of Dunn’s post-hoc test with Holm correction for low-contamination water samples.
TimeComparisonRank DifferenceZ-Statisticp-Valuep-Adjusted (Holm)Significant
6 HEthanol (Staphylococcus spp.) vs. Ethanol (E. coli)0.500.290.7721.000No
Ethanol (Staphylococcus spp.) vs. 3.12 mg/mL (Staphylococcus spp.)10.806.24<0.001<0.001Yes
Ethanol (Staphylococcus spp.) vs. 6.25 mg/mL (Staphylococcus spp.)21.7012.54<0.001<0.001Yes
Ethanol (Staphylococcus spp.) vs. 3.12 mg/mL (E. coli)8.304.80<0.001<0.001Yes
Ethanol (Staphylococcus spp.) vs. 6.25 mg/mL (E. coli)17.3010.00<0.001<0.001Yes
3.12 mg/mL (Staphylococcus spp.) vs. 6.25 mg/mL (Staphylococcus spp.)10.906.30<0.001<0.001Yes
3.12 mg/mL (Staphylococcus spp.) vs. 3.12 mg/mL (E. coli)2.501.440.1500.300No
3.12 mg/mL (Staphylococcus spp.) vs. 6.25 mg/mL (E. coli)6.503.76<0.0010.001Yes
6.25 mg/mL (Staphylococcus spp.) vs. 3.12 mg/mL (E. coli)13.407.74<0.001<0.001Yes
6.25 mg/mL (Staphylococcus spp.) vs. 6.25 mg/mL (E. coli)4.402.540.0110.033Yes
Ethanol (E. coli) vs. 3.12 mg/mL (E. coli)7.804.51<0.001<0.001Yes
Ethanol (E. coli) vs. 6.25 mg/mL (E. coli)16.809.71<0.001<0.001Yes
3.12 mg/mL (E. coli) vs. 6.25 mg/mL (E. coli)9.005.20<0.001<0.001Yes
12 HEthanol (Staphylococcus spp.) vs. Ethanol (E. coli)0.300.170.8621.000No
Ethanol (Staphylococcus spp.) vs. 3.12 mg/mL (Staphylococcus spp.)16.209.36<0.001<0.001Yes
Ethanol (Staphylococcus spp.) vs. 6.25 mg/mL (Staphylococcus spp.)16.209.36<0.001<0.001Yes
Ethanol (Staphylococcus spp.) vs. 3.12 mg/mL (E. coli)5.403.120.0020.006Yes
Ethanol (Staphylococcus spp.) vs. 6.25 mg/mL (E. coli)16.209.36<0.001<0.001Yes
3.12 mg/mL (Staphylococcus spp.) vs. 6.25 mg/mL (Staphylococcus spp.)0.000.001.0001.000No
3.12 mg/mL (Staphylococcus spp.) vs. 3.12 mg/mL (E. coli)10.806.24<0.001<0.001Yes
3.12 mg/mL (Staphylococcus spp.) vs. 6.25 mg/mL (E. coli)0.000.001.0001.000No
6.25 mg/mL (Staphylococcus spp.) vs. 3.12 mg/mL (E. coli)10.806.24<0.001<0.001Yes
6.25 mg/mL (Staphylococcus spp.) vs. 6.25 mg/mL (E. coli)0.000.001.0001.000No
Ethanol (E. coli) vs. 3.12 mg/mL (E. coli)4.302.480.0130.039Yes
Ethanol (E. coli) vs. 6.25 mg/mL (E. coli)16.209.36<0.001<0.001Yes
3.12 mg/mL (E. coli) vs. 6.25 mg/mL (E. coli)10.806.24<0.001<0.001Yes
24 HEthanol (Staphylococcus spp.) vs. Ethanol (E. coli)1.801.040.2980.596No
Ethanol (Staphylococcus spp.) vs. 3.12 mg/mL (Staphylococcus spp.)13.908.03<0.001<0.001Yes
Ethanol (Staphylococcus spp.) vs. 6.25 mg/mL (Staphylococcus spp.)13.908.03<0.001<0.001Yes
Ethanol (Staphylococcus spp.) vs. 3.12 mg/mL (E. coli)13.908.03<0.001<0.001Yes
Ethanol (Staphylococcus spp.) vs. 6.25 mg/mL (E. coli)13.908.03<0.001<0.001Yes
3.12 mg/mL (Staphylococcus spp.) vs. 6.25 mg/mL (Staphylococcus spp.)0.000.001.0001.000No
3.12 mg/mL (Staphylococcus spp.) vs. 3.12 mg/mL (E. coli)0.000.001.0001.000No
3.12 mg/mL (Staphylococcus spp.) vs. 6.25 mg/mL (E. coli)0.000.001.0001.000No
6.25 mg/mL (Staphylococcus spp.) vs. 3.12 mg/mL (E. coli)0.000.001.0001.000No
6.25 mg/mL (Staphylococcus spp.) vs. 6.25 mg/mL (E. coli)0.000.001.0001.000No
Ethanol (E. coli) vs. 3.12 mg/mL (E. coli)13.908.03<0.001<0.001Yes
Ethanol (E. coli) vs. 6.25 mg/mL (E. coli)13.908.03<0.001<0.001Yes
3.12 mg/mL (E. coli) vs. 6.25 mg/mL (E. coli)0.000.001.0001.000No
The post-hoc Dunn’s test with Holm correction applied to the bacterial removal percentages in highly contaminated water revealed a pattern of antimicrobial activity of the ethanolic extract of C. limon clearly dependent on dose and exposure time. At 6 h of treatment, all extract concentrations (3.12 and 6.25 mg/mL) showed statistically significant differences compared to the ethanol control (p < 0.001), confirming the intrinsic bactericidal activity of the extract even under high contaminant load conditions. The 6.25 mg/mL dose was significantly more effective than 3.12 mg/mL for both microorganisms (p < 0.001), achieving removals of 85.38% for Staphylococcus spp. and 89.08% for E. coli, while the lower dose achieved 77.07% and 83.72%, respectively. Likewise, significant differences were observed between the elimination of E. coli and Staphylococcus spp. with the same dose (p < 0.05), evidencing a greater susceptibility of the Gram-negative bacterium in this matrix, a finding contrary to that expected by the MIC. At 12 h, the pattern remained: the 6.25 mg/mL dose continued to be superior to 3.12 mg/mL for both microorganisms (p < 0.001), and differences between bacteria persisted (p < 0.001). At 24 h, although the difference between doses remained significant for Staphylococcus spp. (p < 0.05), differences between microorganisms for the same dose disappeared (p = 1.000), reaching removals of 86.86% and 91.83% for Staphylococcus spp. and E. coli with 6.25 mg/mL, and 82.04% and 86.02% with 3.12 mg/mL. These results confirm that, in matrices with high microbial load and dissolved organic matter, the 6.25 mg/mL concentration is significantly more effective than the lower dose, evidencing a consistent dose–response effect that does not dilute over time, unlike what was observed in low-contamination waters.
Table A5. Results of Dunn’s post-hoc test with Holm correction for highly contaminated water samples.
TimeComparisonRank DifferenceZ-Statisticp-Valuep-Adjusted (Holm)Significant
6 HEthanol (Staphylococcus spp.) vs. Ethanol (E. coli)1.600.920.3570.714No
Ethanol (Staphylococcus spp.) vs. 3.12 mg/mL (Staphylococcus spp.)10.806.24<0.001<0.001Yes
Ethanol (Staphylococcus spp.) vs. 6.25 mg/mL (Staphylococcus spp.)16.609.59<0.001<0.001Yes
Ethanol (Staphylococcus spp.) vs. 3.12 mg/mL (E. coli)15.008.67<0.001<0.001Yes
Ethanol (Staphylococcus spp.) vs. 6.25 mg/mL (E. coli)21.7012.54<0.001<0.001Yes
3.12 mg/mL (Staphylococcus spp.) vs. 6.25 mg/mL (Staphylococcus spp.)5.803.35<0.0010.001Yes
3.12 mg/mL (Staphylococcus spp.) vs. 3.12 mg/mL (E. coli)4.202.430.0150.045Yes
3.12 mg/mL (Staphylococcus spp.) vs. 6.25 mg/mL (E. coli)10.906.30<0.001<0.001Yes
6.25 mg/mL (Staphylococcus spp.) vs. 3.12 mg/mL (E. coli)1.600.920.3570.714No
6.25 mg/mL (Staphylococcus spp.) vs. 6.25 mg/mL (E. coli)5.102.950.0030.009Yes
Ethanol (E. coli) vs. 3.12 mg/mL (E. coli)12.707.34<0.001<0.001Yes
Ethanol (E. coli) vs. 6.25 mg/mL (E. coli)19.4011.21<0.001<0.001Yes
3.12 mg/mL (E. coli) vs. 6.25 mg/mL (E. coli)6.703.87<0.001<0.001Yes
12 HEthanol (Staphylococcus spp.) vs. Ethanol (E. coli)0.600.350.7281.000No
Ethanol (Staphylococcus spp.) vs. 3.12 mg/mL (Staphylococcus spp.)10.105.84<0.001<0.001Yes
Ethanol (Staphylococcus spp.) vs. 6.25 mg/mL (Staphylococcus spp.)16.209.36<0.001<0.001Yes
Ethanol (Staphylococcus spp.) vs. 3.12 mg/mL (E. coli)16.309.42<0.001<0.001Yes
Ethanol (Staphylococcus spp.) vs. 6.25 mg/mL (E. coli)21.7012.54<0.001<0.001Yes
3.12 mg/mL (Staphylococcus spp.) vs. 6.25 mg/mL (Staphylococcus spp.)6.103.52<0.0010.001Yes
3.12 mg/mL (Staphylococcus spp.) vs. 3.12 mg/mL (E. coli)6.203.58<0.0010.001Yes
3.12 mg/mL (Staphylococcus spp.) vs. 6.25 mg/mL (E. coli)11.606.70<0.001<0.001Yes
6.25 mg/mL (Staphylococcus spp.) vs. 3.12 mg/mL (E. coli)0.100.060.9541.000No
6.25 mg/mL (Staphylococcus spp.) vs. 6.25 mg/mL (E. coli)5.503.180.0020.006Yes
Ethanol (E. coli) vs. 3.12 mg/mL (E. coli)10.105.84<0.001<0.001Yes
Ethanol (E. coli) vs. 6.25 mg/mL (E. coli)16.209.36<0.001<0.001Yes
3.12 mg/mL (E. coli) vs. 6.25 mg/mL (E. coli)5.403.120.0020.006Yes
24 HEthanol (Staphylococcus spp.) vs. Ethanol (E. coli)2.201.270.2040.408No
Ethanol (Staphylococcus spp.) vs. 3.12 mg/mL (Staphylococcus spp.)11.406.59<0.001<0.001Yes
Ethanol (Staphylococcus spp.) vs. 6.25 mg/mL (Staphylococcus spp.)13.908.03<0.001<0.001Yes
Ethanol (Staphylococcus spp.) vs. 3.12 mg/mL (E. coli)13.908.03<0.001<0.001Yes
Ethanol (Staphylococcus spp.) vs. 6.25 mg/mL (E. coli)13.908.03<0.001<0.001Yes
3.12 mg/mL (Staphylococcus spp.) vs. 6.25 mg/mL (Staphylococcus spp.)2.501.440.1500.300No
3.12 mg/mL (Staphylococcus spp.) vs. 3.12 mg/mL (E. coli)2.501.440.1500.300No
3.12 mg/mL (Staphylococcus spp.) vs. 6.25 mg/mL (E. coli)2.501.440.1500.300No
6.25 mg/mL (Staphylococcus spp.) vs. 3.12 mg/mL (E. coli)0.000.001.0001.000No
6.25 mg/mL (Staphylococcus spp.) vs. 6.25 mg/mL (E. coli)0.000.001.0001.000No
Ethanol (E. coli) vs. 3.12 mg/mL (E. coli)11.406.59<0.001<0.001Yes
Ethanol (E. coli) vs. 6.25 mg/mL (E. coli)13.908.03<0.001<0.001Yes
3.12 mg/mL (E. coli) vs. 6.25 mg/mL (E. coli)2.501.440.1500.300No

References

  1. United Nations. Goal 6: Water and Sanitation. Available online: https://www.un.org/sustainabledevelopment/water-and-sanitation/ (accessed on 10 May 2026).
  2. UNESCO; World Water Assessment Programme (WWAP); Connor, R.; Uhlenbrook, S.; Koncagül, E.; Cordeiro Ortiara, A.R. Informe Mundial sobre el Desarrollo de los Recursos Hídricos de las Naciones Unidas 2017. Available online: https://sswm.info/sites/default/files/reference_attachments/UNESCO%202017.%20Informe%20Mundial%20sobre%20el%20Desarrollo.PDF (accessed on 10 May 2026).
  3. World Health Organization (WHO). Drinking-Water. Available online: https://www.who.int/news-room/fact-sheets/detail/drinking-water (accessed on 10 May 2026).
  4. UNESCO. The United Nations World Water Development Report 2019: Leaving No One Behind; United Nations Educational, Scientific and Cultural Organization: Paris, France, 2019. [Google Scholar]
  5. Paucar Aedo, F.G.; Real Ferrer, G. Reutilización de aguas en España y el Perú: Avances y desafíos. Sostenibilidad Econ. Soc. Ambient. 2022, 75–100. [Google Scholar] [CrossRef]
  6. García Ccahuana, S.L. Economía circular aplicada al agua: Perspectivas para el reciclaje y reutilización. Sciencevolution 2025, 1, 29–38. [Google Scholar] [CrossRef] [Scilit]
  7. Alegría, L.A.R.; Santillán, C.S.R.; Hinojosa, J.S.S.; Pilco, C.R.J.; Muñoz, I.M.G. Biorremediación de aguas residuales agroindustriales mediante el cultivo de Spirulina sp. y biomasa utilizada como suplemento alimenticio para animales. Stud. Environ. Anim. Sci. 2022, 3, 1424–1443. [Google Scholar] [CrossRef] [Scilit]
  8. Wang, L.; Fang, Z.; Zhou, X.; Cheng, K.; Ren, Y.; Li, C.; Gao, B.; Lv, Y.; Xu, S.; Xu, H. Health Risk Assessment via Ingestion of Disinfection By-Products in Drinking Water. Sci. Rep. 2025, 15, 1793. [Google Scholar] [CrossRef] [Scilit] [PubMed]
  9. Anderson, B.N.; Black, G.P.; Young, T.M. Disinfection Byproducts in Drinking Water from the Tap: Variability in Household Calculated Additive Toxicity (CAT). ACS ES T Water 2024, 4, 3532–3539. [Google Scholar] [CrossRef] [Scilit] [PubMed]
  10. Ali, S.K.; Abdou, M.M.; Emara, M.M.; Farag, R.S.; Mubarak, M.F. Eco-Friendly Solutions: A Comprehensive Review of Natural Coagulants for Sustainable Water Treatment. Environ. Geochem. Health 2025, 47, 535. [Google Scholar] [CrossRef] [Scilit] [PubMed]
  11. Kumar, J.; Choudhary, M.; Dikshit, P.K.; Kumar, S. Recent Advancements in Utilizing Plant-Based Approaches for Water and Wastewater Treatment Technologies. Clean. Water 2024, 2, 100030. [Google Scholar] [CrossRef] [Scilit]
  12. Azghar, A.; Dalli, M.; Azizi, S.; Benaissa, E.M.; Ben Lahlou, Y.; Elouennass, M.; Maleb, A. Chemical Composition and Antibacterial Activity of Citrus Peels Essential Oils against Multidrug-Resistant Bacteria: A Comparative Study. J. Herb. Med. 2023, 42, 100799. [Google Scholar] [CrossRef] [Scilit]
  13. Namane, P.I.; Letshwenyo, M.W.; Yahya, A. Evaluation of Plant-Based Coagulants for Turbidity Removal and Coagulant Dosage Prediction Using Machine Learning. Environ. Technol. 2025, 46, 2570–2585. [Google Scholar] [CrossRef] [Scilit] [PubMed]
  14. Bacca Narvaez, A.J.; Vásquez García, A.; Rodríguez, I.; España Muñoz, J. Potencial de los compuestos bioactivos de residuos de frutas y verduras en la industria alimentaria: Una revisión. Rev. Cienc. 2025, 27, 14046. [Google Scholar] [CrossRef] [Scilit]
  15. Soto Toloza, E.P.; Caballero Pérez, L.A.; Abril Florez, J.L. Obtención de compuestos bioactivos a partir de residuos agroindustriales: Una revisión. Rev. Ambient. Agua Aire Suelo 2025, 16, 1–30. [Google Scholar] [CrossRef] [Scilit]
  16. Manrique, A.G.G. Visión general del aprovechamiento de residuos cítricos como materia prima de biorrefinerías. Cuad. Tomás 2018, 153–168. Available online: https://dialnet.unirioja.es/servlet/articulo?codigo=6573031 (accessed on 10 May 2026).
  17. Negrea, M.; Cocan, I.; Jianu, C.; Alexa, E.; Berbecea, A.; Poiana, M.-A.; Silivasan, M. Valorization of Citrus Peel Byproducts: A Sustainable Approach to Nutrient-Rich Jam Production. Foods 2025, 14, 1339. [Google Scholar] [CrossRef] [Scilit] [PubMed]
  18. Alonso-Vázquez, P. Recuperación y Concentración de Compuestos Bioactivos de Elevado Valor a Partir de Residuos Generados en la Industria de Cítricos Mediante Tecnologías Emergentes de Membrana. Available online: https://riunet.upv.es/handle/10251/229296 (accessed on 10 May 2026).
  19. El Bouaidi, W.; Libralato, G.; Tazart, Z.; Enaime, G.; Douma, M.; Ounas, A.; Yaacoubi, A.; Lofrano, G.; Carotenuto, M.; Saviano, L.; et al. Nature-Based Coagulants for Drinking Water Treatment: An Ecotoxicological Overview. Water Environ. Res. 2022, 94, e10782. [Google Scholar] [CrossRef] [Scilit] [PubMed]
  20. Sherif, A.E.; Amen, Y.; Rizk, D.E.; Abdelwahab, G. Chemical Compositions and Antimicrobial Activities of Three Lemon Odor Essential Oils of Cupressus macrocarpa, Cymbopogon citratus and Citrus limon. Egypt. J. Basic Appl. Sci. 2023, 10, 894–905. [Google Scholar] [CrossRef] [Scilit]
  21. Castañeda Olivera, C.A.; Rojas Cavero, Y.; Cabello Torres, R.J. Bibliometric analysis on the use of natural coagulants in the treatment of water for human use. In Proceedings of the 22nd LACCEI International Multi-Conference for Engineering, Education and Technology (LACCEI 2024); Latin American and Caribbean Consortium of Engineering Institutions: Boca Raton, FL, USA, 2024. [Google Scholar]
  22. Mahjaf, G.M.; Mohammed, M.A.A.; Ahmed, H.A.E.; Abdelgader, L.M.A. In vitro assessment of antimicrobial activity of Citrus lemon against selected clinical isolates from Shendi city, Sudan. J. Bacteriol. Mycol. Open Access 2024, 12, 83–87. [Google Scholar] [CrossRef] [Scilit]
  23. Abu Amr, S.S.; Abujazar, M.S.S.; Karaağaç, S.U.; Mahfud, R.; Alazaiza, M.Y.D.; Hamad, R.J.A. Application of Plant-Based Natural Coagulant for Sustainable Treatment of Steel and Iron Industrial Wastewater, Karabuk, Turkey. Desalin. Water Treat. 2023, 287, 39–45. [Google Scholar] [CrossRef] [Scilit]
  24. Kačániová, M.; Čmiková, N.; Vukovic, N.L.; Verešová, A.; Bianchi, A.; Garzoli, S.; Ben Saad, R.; Ben Hsouna, A.; Ban, Z.; Vukic, M.D. Citrus limon Essential Oil: Chemical Composition and Selected Biological Properties Focusing on the Antimicrobial (in Vitro, in Situ), Antibiofilm, Insecticidal Activity and Preservative Effect against Salmonella enterica Inoculated in Carrot. Plants 2024, 13, 524. [Google Scholar] [CrossRef] [Scilit] [PubMed]
  25. Katuromunda, M.; Ssekatawa, K.; Niwagaba, S. A Preliminary Evaluation of the Antibacterial Activity of Lemon Fruit Juice, Mondia Whitei Ethanolic Extract, and Their Combination against Streptococcus mutans. Infect. Drug Resist. 2024, 17, 4291–4299. [Google Scholar] [CrossRef] [Scilit] [PubMed]
  26. Kehal, F.; Chemache, L.; Himed, L.; Barkat, M. Antimicrobial and Antioxidant Activities of Citrus limon Peel Essential Oils and Their Application as a Natural Preservative in Fresh Cream: Effects on Oxidative and Sensory Properties. Acta Univ. Cibiniensis Ser. Food Technol. 2023, 27, 1–14. [Google Scholar] [CrossRef] [Scilit]
  27. Fida, Z.; Tanoli, M.A.; Mahmood, Q.; Alamgir, M.S.; Sajjad, D. Evaluation of Plant-Based Natural Extracts as Coagulants for Surface Water Treatment. Environ. Eng. Geosci. 2024, 30, 77–90. [Google Scholar] [CrossRef] [Scilit]
  28. Atallah, A.H.; Al-Saedi, S.R.; Khudaier, A.M. Study the Effect of Healthy Biological Extracts Compared with Antibiotics on Some Bacteria Isolated from Infected Patients with Urinary Tract Infection. Indian J. Public Health Res. Dev. 2019, 10, 890. [Google Scholar] [CrossRef] [Scilit]
  29. Ahmed, M.E. The study of Bacteriocin of Pseudomonas fluorescens and Citrus limon effects against Propionibacterium acnes and Staphylococcus epidermidis in acne patients. J. Phys. Conf. Ser. 2018, 1003, 012004. [Google Scholar] [CrossRef] [Scilit]
  30. Kodad, H.; Chauiyakh, O.; Soufiani, A.; El Farissi, H.; El Aammouri, S.; Mokhtari, N.; Tiskar, M.; Mouniane, Y.; Aouane, E.M. Antimicrobial potential of Citrus limon peel essential oil from Morocco: A sustainable approach to citrus waste valorization. Res. Ecol. 2025, 7, 302–317. [Google Scholar] [CrossRef] [Scilit]
  31. Mkadem, W.; Belguith, K.; Indio, V.; Oussaief, O.; Guluzade, G.; ElHatmi, H.; Serraino, A.; De Cesare, A.; Boudhrioua, N. Assessment of the Anti-Listeria Effect of Citrus limon Peel Extract in Silico, in Vitro, and in Fermented Cow Milk during Cold Storage. Foods 2025, 14, 661. [Google Scholar] [CrossRef] [Scilit] [PubMed]
  32. Cormier, J.; Scott, R.; Janes, M. Antibacterial Activity of Biosecur(®) Citrus Extract Surface Cleaner against Vibrio vulnificus. Open Microbiol. J. 2013, 7, 130–134. [Google Scholar] [CrossRef] [Scilit] [PubMed]
  33. Tsiraki, M.I.; Yehia, H.M.; Elobeid, T.; Osaili, T.; Sakkas, H.; Savvaidis, I.N. Viability of and Escherichia coli O157:H7 and Listeria monocytogenes in a Delicatessen Appetizer (Yogurt-Based) Salad as Affected by Citrus Extract (Citrox©) and Storage Temperature. Food Microbiol. 2018, 69, 11–17. [Google Scholar] [CrossRef] [Scilit] [PubMed]
  34. ASTM E11-24; Standard Specification for Woven Wire Test Sieve Cloth and Test Sieves. ASTM International: West Conshohocken, PA, USA, 2024.
  35. Mahato, N.; Sharma, K.; Sinha, M.; Cho, M.H. Citrus Waste Derived Nutra-/Pharmaceuticals for Health Benefits: Current Trends and Future Perspectives. J. Funct. Foods 2018, 40, 307–316. [Google Scholar] [CrossRef] [Scilit]
  36. Chemat, F.; Rombaut, N.; Sicaire, A.-G.; Meullemiestre, A.; Fabiano-Tixier, A.-S.; Abert-Vian, M. Ultrasound Assisted Extraction of Food and Natural Products. Mechanisms, Techniques, Combinations, Protocols and Applications. A Review. Ultrason. Sonochem. 2017, 34, 540–560. [Google Scholar] [CrossRef] [Scilit] [PubMed]
  37. Khan, M.K.; Abert-Vian, M.; Fabiano-Tixier, A.-S.; Dangles, O.; Chemat, F. Ultrasound-Assisted Extraction of Polyphenols (Flavanone glycosides) from Orange (Citrus sinensis L.) Peel. Food Chem. 2010, 119, 851–858. [Google Scholar] [CrossRef] [Scilit]
  38. Altemimi, A.; Lakhssassi, N.; Baharlouei, A.; Watson, D.G.; Lightfoot, D.A. Phytochemicals: Extraction, Isolation, and Identification of Bioactive Compounds from Plant Extracts. Plants 2017, 6, 42. [Google Scholar] [CrossRef] [Scilit] [PubMed]
  39. Balouiri, M.; Sadiki, M.; Ibnsouda, S.K. Methods for in Vitro Evaluating Antimicrobial Activity: A Review. J. Pharm. Anal. 2016, 6, 71–79. [Google Scholar] [CrossRef] [Scilit] [PubMed]
  40. Clinical and Laboratory Standards Institute (CLSI). Methods for Dilution Antimicrobial Susceptibility Tests for Bacteria That Grow Aerobically, 12th ed.; CLSI Standard M07; Clinical and Laboratory Standards Institute: Wayne, PA, USA, 2024. [Google Scholar]
  41. Gómez, P.; Lozano, C.; Benito, D.; Estepa, V.; Tenorio, C.; Zarazaga, M.; Torres, C. Characterization of Staphylococci in Urban Wastewater Treatment Plants in Spain, with Detection of Methicillin Resistant Staphylococcus aureus ST398. Environ. Pollut. 2016, 212, 71–76. [Google Scholar] [CrossRef] [Scilit] [PubMed]
  42. Ghimire, B.; Pokherel, M.K.; Banjara, M.R.; Rijal, K.R.; Ghimire, P. Extended spectrum beta lactamase Escherichia coli in Bagmati River, Kathmandu valley. J. Nepal Health Res. Counc. 2024, 21, 672–679. [Google Scholar] [CrossRef] [Scilit] [PubMed]
  43. Coates, J. Interpretation of infrared spectra, A practical approach. Encycl. Anal. Chem. 2006, 12, 10815–10837. [Google Scholar]
  44. Movasaghi, Z.; Rehman, S.; ur Rehman, D.I. Fourier Transform Infrared (FTIR) Spectroscopy of Biological Tissues. Appl. Spectrosc. Rev. 2008, 43, 134–179. [Google Scholar] [CrossRef] [Scilit]
  45. González-Molina, E.; Domínguez-Perles, R.; Moreno, D.A.; García-Viguera, C. Natural Bioactive Compounds of Citrus limon for Food and Health. J. Pharm. Biomed. Anal. 2010, 51, 327–345. [Google Scholar] [CrossRef] [Scilit] [PubMed]
  46. Guimarães, R.; Barros, L.; Barreira, J.C.M.; Sousa, M.J.; Carvalho, A.M.; Ferreira, I.C.F.R. Targeting Excessive Free Radicals with Peels and Juices of Citrus Fruits: Grapefruit, Lemon, Lime and Orange. Food Chem. Toxicol. 2010, 48, 99–106. [Google Scholar] [CrossRef] [Scilit] [PubMed]
  47. Aouant, K.; Christodoulou, P.; Tsiaka, T.; Strati, I.F.; Cavouras, D.; Sinanoglou, V.J. Implementation of Instrumental Analytical Methods, Image Analysis and Chemometrics for the Comparative Evaluation of Citrus Fruit Peels. Foods 2025, 14, 4115. [Google Scholar] [CrossRef] [Scilit] [PubMed]
  48. Mare, R.; Pujia, R.; Maurotti, S.; Greco, S.; Cardamone, A.; Coppoletta, A.R.; Bonacci, S.; Procopio, A.; Pujia, A. Assessment of Mediterranean Citrus Peel Flavonoids and Their Antioxidant Capacity Using an Innovative UV-Vis Spectrophotometric Approach. Plants 2023, 12, 4046. [Google Scholar] [CrossRef] [Scilit] [PubMed]
  49. Sanches, V.L.; Cunha, T.A.; Viganó, J.; de Souza Mesquita, L.M.; Faccioli, L.H.; Breitkreitz, M.C.; Rostagno, M.A. Comprehensive Analysis of Phenolics Compounds in Citrus Fruits Peels by UPLC-PDA and UPLC-Q/TOF MS Using a Fused-Core Column. Food Chem. X 2022, 14, 100262. [Google Scholar] [CrossRef] [Scilit] [PubMed]
  50. Sykuła, A.; Nowak, A.; Garribba, E.; Dzeikala, A.; Rowińska-Żyrek, M.; Czerwińska, J.; Maniukiewicz, W.; Łodyga-Chruścińska, E. Spectroscopic Characterization and Biological Activity of Hesperetin Schiff Bases and Their Cu(II) Complexes. Int. J. Mol. Sci. 2023, 24, 761. [Google Scholar] [CrossRef] [Scilit] [PubMed]
  51. Mustafayeva, X.N. Sitrus Qabiqlarinda Flavonoidlərin Ub-Spektrofotometriya Üsulu İlə Müqayisəli Miqdar Təyini. ATU J. 2025, 5, 1–3. [Google Scholar] [CrossRef] [Scilit]
  52. Wongsa, P.; Phatikulrungsun, P.; Prathumthong, S. FT-IR Characteristics, Phenolic Profiles and Inhibitory Potential against Digestive Enzymes of 25 Herbal Infusions. Sci. Rep. 2022, 12, 6631. [Google Scholar] [CrossRef] [Scilit] [PubMed]
  53. Yilmaz, H.; Gultekin Subasi, B.; Celebioglu, H.U.; Ozdal, T.; Capanoglu, E. Chemistry of Protein-Phenolic Interactions toward the Microbiota and Microbial Infections. Front. Nutr. 2022, 9, 914118. [Google Scholar] [CrossRef] [Scilit] [PubMed]
  54. Stasiuk, M.; Kozubek, A. Biological Activity of Phenolic Lipids. Cell. Mol. Life Sci. 2010, 67, 841–860. [Google Scholar] [CrossRef] [Scilit] [PubMed]
  55. Trombetta, D.; Castelli, F.; Sarpietro, M.G.; Venuti, V.; Cristani, M.; Daniele, C.; Saija, A.; Mazzanti, G.; Bisignano, G. Mechanisms of Antibacterial Action of Three Monoterpenes. Antimicrob. Agents Chemother. 2005, 49, 2474–2478. [Google Scholar] [CrossRef] [Scilit] [PubMed]
  56. Shonekan, O.O.; Otuka, A.C.; Adeyemi, D.K.; Fatunsin, O.T. A Comparison of Antioxidant and Fourier Transform Infrared Spectroscopy (FTIR) Analysis on Extracts of Syzygium guineenses (Myrtaceae). Available online: https://api-ir.unilag.edu.ng/server/api/core/bitstreams/581aacbe-5f40-4526-b7dd-fcea5b29c416/content (accessed on 10 May 2026).
  57. Hamdan, I.A.A.-H.; Tomma, J.H. Synthesis, characterization and antimicrobial evaluation for new esters derivatives containing two 1, 3, 4-oxadiazole units. Iraqi J. Sci. 2024, 65, 1800–1812. [Google Scholar] [CrossRef] [Scilit]
  58. Almutairy, B. Flavonoid-Mediated Biofilm Inhibition and Toxicological Evaluation of Atriplex laciniata against Multidrug-Resistant MRSA. Front. Pharmacol. 2025, 16, 1577052. [Google Scholar] [CrossRef] [Scilit] [PubMed]
  59. Trendafilova, A.; Raykova, D.; Ivanova, V.; Novakovic, M.; Nedialkov, P.; Paunova-Krasteva, T.; Veleva, R.; Topouzova-Hristova, T. Phytochemical Characterization and Anti-Biofilm Activity of Primula Veris L. Roots. Molecules 2025, 30, 1702. [Google Scholar] [CrossRef] [Scilit] [PubMed]
  60. Razali, N.; Sani, A.; Sani, S.; Abdul-Hamid, A. Effects of various solvents on the extraction of antioxidant phenolics from the leaves, seeds, veins and skins of Tamarindus indica L. Food Chem. 2012, 131, 441–448. [Google Scholar] [CrossRef] [Scilit]
  61. Šafranko, S.; Ćorković, I.; Jerković, I.; Jakovljević, M.; Aladić, K.; Šubarić, D.; Jokić, S. Green Extraction Techniques for Obtaining Bioactive Compounds from Mandarin Peel (Citrus unshiu var. Kuno): Phytochemical Analysis and Process Optimization. Foods 2021, 10, 1043. [Google Scholar] [CrossRef] [Scilit] [PubMed]
  62. M’hiri, N.; Ioannou, I.; Mihoubi Boudhrioua, N.; Ghoul, M. Effect of different operating conditions on the extraction of phenolic compounds in orange peel. Food Bioprod. Process. 2015, 96, 161–177. [Google Scholar] [CrossRef] [Scilit]
  63. Skoko, S.; Ambrosetti, M.; Giovannini, T.; Cappelli, C. Simulating Absorption Spectra of Flavonoids in Aqueous Solution: A Polarizable QM/MM Study. Molecules 2020, 25, 5853. [Google Scholar] [CrossRef] [Scilit] [PubMed]
  64. Zapata, R.; Martínez-Zamora, L.; Artés-Hernández, F. Diversity of color, infrared spectra, and phenolic profile correlation in citrus fruit peels. In Biology and Life Sciences Forum; MDPI: Basel, Switzerland, 2025; p. 26. [Google Scholar]
  65. Ionescu, C.; Samide, A.; Tigae, C. Trend in Detection of Anthocyanins from Fresh Fruits and the Influence of Some Factors on Their Stability Impacting Human Health: Kinetic Study Assisted by UV-Vis Spectrophotometry. Antioxidants 2025, 14, 227. [Google Scholar] [CrossRef] [Scilit] [PubMed]
  66. Thenarasan, D.; Deepak Muthu, S.; Nithyapriya, R.; Mohamed Nowfal, A.; Prabhu, T.; Sasikala, S. Quantitative analysis of phenolic compounds in citrus peels using UV-visible spectrophotometry. Int. J. Pharm. Sci. 2025, 3, 4138–4143. [Google Scholar] [CrossRef]
  67. Ciriminna, R.; Petri, G.L.; Angellotti, G.; Luque, R.; Fabiano Tixier, A.-S.; Meneguzzo, F.; Pagliaro, M. Citrus Flavonoids as Antimicrobials. Chem. Biodivers. 2025, 22, e202403210. [Google Scholar] [CrossRef] [Scilit] [PubMed]
  68. Caputo, L.; Quintieri, L.; Cavalluzzi, M.M.; Lentini, G.; Habtemariam, S. Antimicrobial and Antibiofilm Activities of Citrus Water-Extracts Obtained by Microwave-Assisted and Conventional Methods. Biomedicines 2018, 6, 70. [Google Scholar] [CrossRef] [Scilit] [PubMed]
  69. Gurusiddappa, L.H.; Varghese, C.; Gowda, B.; Kalikeri, S. Antimicrobial activity and phytochemical analysis of solvent extraction of Citrus limon peels. World J. Environ. Biosci. 2023, 12, 1–6. [Google Scholar] [CrossRef] [Scilit]
  70. Saeb, S.; Amin, M.; Seyfi Gooybari, R.; Aghel, N. Evaluation of Antibacterial Activities of Citrus limon, Citrus reticulata, and Citrus grandis Against Pathogenic Bacteria. Int. J. Enteric Pathog. 2016, 4, 11–15. [Google Scholar] [CrossRef] [Scilit]
  71. Macêdo, N.S.; Silveira, Z.D.S.; Bezerra, A.H.; Costa, J.G.M.d.; Coutinho, H.D.M.; Romano, B.; Capasso, R.; Cunha, F.A.B.d.; da Silva, M.V. Caesalpinia ferrea C. Mart. (Fabaceae) Phytochemistry, Ethnobotany, and Bioactivities: A Review. Molecules 2020, 25, 3831. [Google Scholar] [CrossRef] [Scilit] [PubMed]
  72. Rathour, S.; Rawat, P.; Tyagi, S.; Ghosh, K.; Gupta, A. Phytochemical analysis, antioxidant and antimicrobial activity of Raphanus sativus and Citrus limon Peel. Int. J. Bot. Stud. 2020, 5, 452–456. [Google Scholar]
  73. Okoro, B.U.; Sharifi, S.; Jesson, M.A.; Bridgeman, J. Natural Organic Matter (NOM) and Turbidity Removal by Plant-Based Coagulants: A Review. J. Environ. Chem. Eng. 2021, 9, 106588. [Google Scholar] [CrossRef] [Scilit]
  74. Neisi, A.; Esteresh, A.; Takdastan, A.; Orooji, N. Removal of turbidity and coliform bacteria from karoon river water by natural coagulants aid (bread yeast) with PAC. In Proceedings of the International Conference on Chemical, Environmental and Biological Sciences (CEBS-2015), Dubai, United Arab Emirates, 18–19 March 2015; International Institute of Chemical, Biological & Environmental Engineering: Johannesburg, South Africa, 2025. [Google Scholar]
  75. Ramavandi, B. Treatment of Water Turbidity and Bacteria by Using a Coagulant Extracted from Plantago ovata. Water Resour. Ind. 2014, 6, 36–50. [Google Scholar] [CrossRef] [Scilit]
  76. Uwumuremyi, F.; Ndikumana, F.G.; Mutijima, J.B.; Mpinganzima, L.; Habyarimana, T.; Niyonzima, F.N.N. Antimicrobial activities of Citrus seed and leaf extracts against selected bacterial and fungal pathogens linked to human diseases: In vitro experimental study in musanze, Rwanda. J. Drug Deliv. Ther. 2025, 15, 28–33. [Google Scholar] [CrossRef] [Scilit]
  77. Gómez-Llorente, H.; Pérez-Esteve, É.; Barat, J.M.; Jiménez, M.C.; González-Bello, C.; Fernández-Segovia, I. Antimicrobial activity of essential oil components against Escherichia coli depends on the food components present in a food matrix. Food Microbiol. 2025, 125, 104638. [Google Scholar] [CrossRef] [Scilit] [PubMed]
  78. Akarca, G.; Sevik, R. Biological Activities of Citrus limon L. and Citrus sinensis L. Peel Essential Oils. J. Essent. Oil-Bear. Plants 2021, 24, 1415–1427. [Google Scholar] [CrossRef] [Scilit]
  79. Ambrosio, C.M.S.; Ikeda, N.Y.; Miano, A.C.; Saldaña, E.; Moreno, A.M.; Stashenko, E.; Contreras-Castillo, C.J.; Da Gloria, E.M. Unraveling the selective antibacterial activity and chemical composition of citrus essential oils. Sci. Rep. 2019, 9, 17719. [Google Scholar] [CrossRef] [Scilit] [PubMed]
  80. Olazabal, S.; Enrique, C. pH Óptimo Para la Remoción de Plomo con la Cáscara de Limón (Citrus aurantifolia) en Aguas Contaminadas a Nivel de Laboratorio. 2016. Available online: https://alicia.concytec.gob.pe/vufind/Record/UCVV_598865445debc3902f9294fa63ef67f7 (accessed on 10 May 2026).
  81. Vega, M.; Abraham, P. Eficiencia de la Cáscara de Naranja Citrus cinensis para la Biosorción del Plomo en Aguas Contaminadas a Nivel Laboratorio. 2017. Available online: https://alicia.concytec.gob.pe/vufind/Record/UCVV_27240d1bfa74194dba110aca9836a364/Details (accessed on 10 May 2026).
  82. Avalos Jaime, M.D. Eficiencia de la Cáscara de Naranja “Citrus sinensis” Frente al Sulfato de Aluminio para la Remoción de la Materia Orgánica en Aguas Residuales Domésticas de la PTAR Taboada, Callao; Universidad Nacional Federico Villareal: Lima, Peru, 2023. [Google Scholar]
  83. Ioppolo, A.; Laudicina, V.A.; Badalucco, L.; Saiano, F.; Palazzolo, E. Wastewaters from Citrus Processing Industry as Natural Biostimulants for Soil Microbial Community. J. Environ. Manag. 2020, 273, 111137. [Google Scholar] [CrossRef] [Scilit] [PubMed]
Figure 1. Spectrophotometric characterization of the Citrus limon extract. (a) FTIR spectra and (b) UV-Vis spectrum (300–1100 nm).
Sustainability 18 10120 g001
Figure 2. Logarithmic reduction (log10) of Staphylococcus spp. and E. coli in contaminated waters treated with ethanol and ethanolic extract of C. limon residues (3.12 and 6.25 mg/mL). (a) Effect on low-contamination water; (b) Effect on highly contaminated water.
Sustainability 18 10120 g002
Figure 3. Percentage reduction in Staphylococcus spp. and E. coli in contaminated waters treated with ethanol and ethanolic extract of C. limon residues (3.12 and 6.25 mg/mL). (a) Low-contamination water; (b) highly contaminated water. Data points at 100% removal indicate counts below the limit of detection (<1 CFU/mL) and should be interpreted as ≥99.97% removal, not as exact 100%.
Sustainability 18 10120 g003
Figure 4. Comparative box plot representation of bacterial removal percentages for Staphylococcus spp. and E. coli in (a) low contamination water and (b) highly contaminated water. Data points at 100% removal indicate counts below the limit of detection (<1 CFU/mL) and should be interpreted as ≥99.97% removal, not as exact 100%.
Sustainability 18 10120 g004
Figure 5. Effect of the C. limon extract on some physicochemical properties of contaminated waters. (a) Effect on turbidity of low-contamination water; (b) Effect on turbidity of highly contaminated water; (c) Effect on pH of low-contamination water; (d) Effect on pH of highly contaminated water; (e) Effect on TDS amount in low-contamination water; and (f) Effect on TDS amount in highly contaminated water.
Sustainability 18 10120 g005aSustainability 18 10120 g005b
Table 1. Extraction yield and physical characteristics of the Citrus limon extracts.
Extraction SolventPlant PartInitial Weight (g)Dry Extract Weight (g)Extraction Yield (% w/w) *
99% EthanolPeels and residual pulp50.007.1214.24 ± 0.45
* Values represent mean ± standard deviation.
Table 2. Correlation of FTIR spectral bands with identified functional groups and presumptive antimicrobial mechanisms in the Citrus limon extract.
Range (cm−1)Vibrational AssignmentPossible Functional GroupQualitative/Quantitative InterpretationProposed Antimicrobial Mechanism
3600–3200O–H stretch; broad bands due to H-bondingO–H (phenols, alcohols)Presence of polar compounds; broader band = greater H-bonding; intensity correlates with relative abundanceThese functional groups could contribute to protein denaturation, membrane interaction, and generation of oxidative stress [52,53].
3000–2850C–H sp3 stretchesAliphatic C–H (terpenes, aliphatic chains)Signal of hydrocarbons and terpenes; higher intensity suggests higher lipophilic contentTerpenes may insert into the lipid bilayer and modulate membrane permeability [54,55].
1750–1700C=O stretchC=O (esters, ketones, carboxylic acids)Sharp and strong peak suggests esters or ketones; shifts indicate conjugation or H-bondingCarbonyl groups have been associated with interference in metabolic pathways and alteration of permeability [55,56,57].
1680–1500Aromatic C=C stretches; amide I/IIAromatic C=C (flavonoids, phenols); amide (if N present)Typical signal of phenols and flavonoids; multiplet pattern indicates substitutionsPrevious reports suggest that aromatic compounds may inhibit enzymes and block cell wall synthesis [58,59].
Note: The mechanisms listed are purely hypothetical and based on literature reports for compounds with similar functional groups. No direct assays (e.g., membrane permeability, ROS generation, enzyme inhibition) were performed in this study to confirm them. Therefore, these mechanisms should be considered as possible explanations, not as demonstrated facts.
Table 3. Antimicrobial activity of the Citrus limon extract.
MicroorganismMICMBC
Staphylococcus aureus NCTC 124933.12 mg/mL6.25 mg/mL
Escherichia coli ATCC 33876 (K-12 JM101) 6.25 mg/mL12.5 mg/mL
MIC = Concentrations minima inhibitory; MBC = Concentrations minima bactericide.
Disclaimer/Publisher’s Note: The statements, opinions and data contained in all publications are solely those of the individual author(s) and contributor(s) and not of MDPI and/or the editor(s). MDPI and/or the editor(s) disclaim responsibility for any injury to people or property resulting from any ideas, methods, instructions or products referred to in the content.