


Abstract
In 2023, 95.5 million Europeans were aged over 65, falling within the definition of the “elderly population”. According to statistics, this number will rise to 129.8 million by 2050, making Europe the oldest continent in the world. One of the consequences of such growth is a sharp increase in the number of elderly drivers. Although they have more experience, which can positively impact road safety, their performance and health generally decline, limiting some of the physical and mental abilities required for safe vehicle control. The main objective of this research was to shed light on the behavior of elderly drivers by comparing three different drivers’ age groups: young, middle-aged and elderly drivers. Based on analysis of road accidents involving elderly drivers, the road safety situation for elderly drivers in Slovenia was highlighted, a questionnaire was developed to understand how elderly drivers perceive traffic, and an experiment was conducted where 30 volunteers were tested using a driving simulator and eye-tracking glasses. Objective driving and gaze behavior data were obtained, and very different performance was found among the three age groups, with elderly drivers having poorer reaction times and overlooking many elements compared to younger drivers.
1. Introduction
Mobility is a primary need for all people in today’s society, allowing them to reach all their necessary services and additional activities. Nevertheless, to meet these needs, the road system should be safe. This is the concept on which the Sustainable Safety Approach is built, a systematic approach to road safety, based on five pillars: road functionality, (bio)mechanics, psychology, responsibility and innovation [1]. The last report of the Sustainable Safety Approach [1] placed particular emphasis on human factors, which define people as vulnerable and fallible. These facts are even more true for elderly people, who, on the one hand, often have daily habits to which they are highly committed, and for which they need to be mobile. On the other hand, due to their decreasing physical abilities, they are even more vulnerable and fallible than the “average” road user. To worsen the situation, the number of elderly people worldwide is growing, which means there is an increasing number of elderly drivers: as a matter of fact, although there are many different means of transportation today, private cars are still the most common and preferred one, by elderly people, being seen by many people as the most independent way of getting from door to door. This is even more true in Slovenia, where—probably due to the geographical dispersion of urban agglomerations in the country—people are still mostly dependent on their cars despite the wide range of other available means of transport.
According to recent data from the European Commission, 28% of elderly people in Europe died in car accidents, and 37% of them had single-car accidents [2]. The latest available data from Australia also show a similar trend, with adults aged over 65 accounting for 17% of the total population and 21% of all reported deaths, highlighting the growing importance of this demographic group to public health, including the context of road safety [3]. Even in the United States, traffic fatalities among older adults have reached very high levels. A total of 7971 individuals aged over 65 died in traffic crashes in 2022, accounting for 19% of all traffic fatalities that year. This represents the highest number of fatalities for this age group since the Fatality Analysis Reporting System (FARS) began collecting data in 1975. Between 2021 and 2022, fatalities among older adults increased by 6%. In terms of the U.S. driving population, older drivers made up 22% of all licensed drivers in 2022 and were involved in 14% of all fatal crashes. Long-term trends also show a worrying increase: from 2013 to 2022, the traffic fatality rate per 100,000 elderly residents increased from 12.81 to 13.79. Over the same period, the number of fatalities in crashes involving elderly drivers increased by 42%, from 6057 in 2013 to 8572 in 2022. Comparing only the last two years, 2021 and 2022, the number of fatalities in this group increased by 4% [4]. From the driver’s perspective, age means a decline in vital forces and cognitive functions, which are very important for safe driving. Injuries and illnesses exacerbate this condition and cause an individual’s physical and mental health to deteriorate further. The decline in abilities such as vision, hearing, memory, attention, judgment, reasoning and mobility significantly affects the ability of elderly people to drive. Studies conducted to date have focused intensively on the cognitive functions of elderly drivers. Thorslund et al. [5] found that drivers with hearing problems tend to drive more cautiously and generally look and check in the rearview mirror more often than other drivers, indicating a compensatory behavior due to their reduced safety. Hakamies-Blomqvist and Peters [6] found that elderly drivers have problems with alertness, speed, distance and orientation. As cognitive functions are impaired, this is usually the main reason for traffic accidents. Various research studies [5,6,7] have shown that reduced cognitive functions are generally the main cause of traffic accidents. In addition, the aspect of recovery should also be considered: in general, elderly drivers are not only more prone to traffic accidents due to their reduced abilities, but the consequences of these accidents are also more severe, if not fatal. All this evidence shows the need to deepen our knowledge of elderly drivers’ performance, and it is in this context that the present study is set. The aim of the study is to explore the problem of elderly drivers’ behavior in traffic, and, to achieve this, three specific goals have been set. These are:
- To recognize driving patterns that lead to traffic accidents involving elderly drivers;
- To research the perception of safety of elderly drivers;
- To investigate the driving and gaze behavior of elderly drivers.
- In line with these goals, three hypotheses were formulated:
- Older drivers exhibit slower driving speeds and longer reaction times compared to younger drivers. This hypothesis is based on the assumption that age-related cognitive and motor decline may negatively impact driving performance.
- Drivers’ knowledge of traffic rules and regulations lowers with increasing age.
- Older drivers shift their visual scanning behavior, allocating less visual attention to important elements of the driving task (e.g., vehicle mirrors).
In order to achieve the above goals and to confirm or reject the set hypotheses, an analysis of traffic accidents was first carried out over a period of 10 years. This was followed by a driving simulator experiment in which 30 participating volunteers first answered a questionnaire and then drove in a simulated environment wearing eye-tracking glasses to record eye movements.
2. Related Works
The problem of the aging of the driving population emerged several decades ago, and many studies have already been carried out on the subject. Nevertheless, several divergences can be noticed in the literature on this topic: firstly, there is no common definition of the term “elderly driver”. While in Europe drivers aged over 65 are considered elderly drivers, in the U.S. this age group is defined as drivers older than 55—a difference of 10 years that can have a significant impact on the driving skills of the subjects [6]. A second aspect that should be considered is the approach used to study the performance of elderly drivers. Many approaches have been used over the years, also depending on the evolving technology: these include studies using questionnaires, analysis of databases, video recordings, driving simulator trials and naturalistic driving trials [6,7,8,9,10,11,12].
An example of a questionnaire study is the work published in [13]. The authors focused on 1989 drivers over the age of 50 who completed a 24-question Driver Behavior Questionnaire (DBQ) including three factors: errors, omissions and lapses. Elderly drivers were most likely to report lapses, which are associated with cognitive decline and attention problems. They most frequently reported misreading signs, making wrong turns at roundabouts and moving into the wrong lane when approaching a roundabout or regular intersection. Aggressive violations by elderly drivers were the least frequently reported. The questionnaire also revealed that people who drive more are at a higher risk of a traffic accident and that the ratio of active to passive traffic accidents increases with age, with people over 75 being 44% more likely to collide with another vehicle than to be hit by a vehicle. The results of [13] confirmed that self-reported behavior can be a possible source for predicting accident rates, as there is a strong relationship between the behavior itself and traffic accidents. The fact that this type of questionnaire is a good basis for traffic safety research is also confirmed by L. M. Martinussen et al. [14], who compared different DBQ models and found that the DBQ model was reliable and valid. The study presented in [10] used the Everyday Behavior Questionnaire (EBQ) instead of the DQB and showed that it was just as reliable as the DBQ. Recently, a comparative analysis between young and elderly drivers was carried out by [15] to understand the drivers’ mental workload and the consequences it could have on road safety. The authors shared a DALI questionnaire with 20 male drivers (10 young and 10 elderly participants) and tested them using three tests, i.e., stroop test, a continuous performance test and a focused attention test, to measure their cognitive performance. They found that the driving task was more complex for the elderly participants and that they had lower adaptability [15]. Also, consistently with previous research, they found that elderly people had lower visual demand, confirming their restricted visual field. Similar questionnaires are often used in research together with other research devices, such as a driving simulator [5,14,16].
An interesting work is the one by Y. Wang et al. [16], who investigated the driving characteristics of elderly drivers by comparing them with young drivers. They also investigated the effectiveness of cognitive behavioral therapy (CBT) in driving training in a randomized controlled trial (RCT). A total of 17 young drivers (22–26 years) and 16 elderly drivers (55–70 years) were tested on a driving simulator with eye-tracking glasses. It was found that elderly drivers tended to drive more slowly (almost 25 km/h slower) and cautiously and were more likely to obey traffic signs than younger drivers. The average fixation duration was higher for the elderly drivers. After CBT, speed increased in all groups. Emotions also improved among all participants. The average fixation duration decreased and the flexibility of visual search increased [16]. Similar research equipment has also been used by other researchers [17], who investigated the driving behavior of elderly drivers in an intersection driving scenario compared to young drivers. Elderly drivers were found to have a longer crossing time, while young drivers approached the intersection much faster. It was also found that elderly drivers steered more frequently than younger drivers [17]. Similar results were obtained by Y. Kajiwara and E. Murata [9] in their study, in which they focused on elderly drivers preparing to brake at intersections. They found that elderly drivers were cognitively stressed and felt nervous and impatient when driving near an intersection. Compared to younger drivers, elderly drivers made both more cognitive and action errors, with action errors being, according to the authors, the main factor causing mistakes in braking. Like previous findings, this study also confirms that elderly drivers drive slower, with an average speed of 9.89 m/s in comparison to younger drivers, who drive on average at 10.86 m/s [9]. Yonekawa et al. [18] also studied elderly people at intersections using a driving simulator. In the simulation, two real-life stop sign intersections with poor visibility were simulated. Some of the elderly drivers did not stop or braked later because they had overlooked the stop sign or saw it too late. In this context, it was also found that elderly drivers do not pay enough attention to safety, e.g., not checking their left/right sides. This poor safety control of elderly drivers could increase the risk of causing a traffic accident to twice that of other drivers [9]. Using a driving simulator, a questionnaire and visual attention assessment tests, Milleville-Pennel and Marquez [7] studied the behavior of 18 young and 12 elderly drivers. It was found that elderly drivers are mentally less flexible, that their field of vision is restricted, that they have a slower reaction time, drive more slowly and keep a greater distance than younger drivers. Due to the restricted field of vision, elderly drivers may perceive events later. However, they behave less riskily than younger drivers and are more likely to perceive problems rather than to be really aware of them. An interesting finding was that elderly drivers’ self-assessments of their behavior matched the results of the driving simulator [7], demonstrating that a driving simulator may be an optimal research tool as it provides a safe and comfortable environment for the test participants [19]. Chen et al. [20] used a driving simulator to analyze the responses of young and elderly drivers to a sudden lane-change by a vehicle ahead. Among other results, they found that elderly people have longer reaction times (0.84 s longer than young drivers’) and lower braking speed (40 km/h before braking). In [21], both a driving simulator and real driving trials were utilized to assess elderly driving performance. To do so, authors used the Record of Driving Errors (RODE) and Relative Weights Analysis (RWA) between the results of the two trials. They found that simulator operational errors were linked to real driving strategic errors, these two types of error being related to executive function [21]. Also, total errors and tactical errors made in the simulated environment were related to dangerous actions retained during real driving. In [22], elderly driving behavior was assessed in relation to a human–machine interface (HMI) to alert them to the presence of pedestrians. Authors tested 16 elderly people in a driving simulator environment, and recorded various parameters, such the closest distance, time to collision and, thanks to the use of eye-tracking, the gaze rate of drivers compared to the HMI. Results indicated that the use of an HMI had a positive effect on elderly participants’ performance, increasing the closest distance (which fluctuated between 7.4 m and 10.8 m in different simulated scenarios) and the time to collision. Finally, the work by Wynne et al. [21] confirms the validity of driving simulator studies, though critically relating it to their fidelity. Specifically, the authors carried out a systematic review of driving simulator validation studies. They highlighted the concepts of absolute validity and relative validity: the first refers to the values of the driving simulator trials matching those collected in the field, driving a real vehicle; the second refers to the simulator outcomes having the same patterns as those in the field [23]. In their findings, they reported that half of the reviewed studies stated a correspondence between the simulator and real driving results, meaning they were either absolutely or relatively valid.
Much research has also been conducted using video recordings. Keskinen et al. [24] conducted a study at a particular T-junction without traffic lights in Japan, where young, middle-aged and elderly drivers were observed using video recordings. The normal behavior of elderly drivers was reported, with attention patterns, driving habits and interactions with younger drivers. The study showed that there was no difference between the drivers in terms of attention; nevertheless, elderly drivers were found to take longer than other drivers. In addition, a dangerous combination was identified: elderly drivers turning and young drivers approaching. This situation represents a potentially dangerous combination with a low safety margin [24]. A similar method with video recordings was also used in Japan [11], where the behavior of vehicles and drivers was recorded on videotape. The aim was to analyze data on the reaction behavior of 10 elderly drivers (60–70 years) and young drivers (20–30 years) to determine the driving characteristics of elderly drivers. Speed, space headway, reaction time, braking time, time headway and surplus acceleration were recorded and analyzed. The study concluded that elderly drivers have a longer average reaction time (average time for 0.5 s), drive slower (average time for 2.6 km/h) and have a slightly higher average space headway than younger drivers (on average 0.6 m higher than younger drivers) [11]. More advanced and accurate studies use naturalistic driving [19], which allow the observation of driver behavior under natural driving conditions. Like the results of previously mentioned research works, naturalistic driving studies show that driving experience and driver education have a positive effect on driving behavior, while health conditions and negative emotions are associated with a greater number of errors and violations [12]. Naturalistic data collection was also used by Zhu et al. [25], who analyzed the personality, functional performance and travel patterns elderly drivers. Their findings provided further evidence regarding the relationship between personality and risky driving of elderly drivers. The connection between driving route, driving exposure and driving outcome suggests that elderly drivers who drive less are often more likely to face complex situations, like turns at intersections, which can rise their driving risk [25].
However, there are also studies that rely only on the analysis of traffic accidents, such as that by D.D. Clarke et al. [8], which aims to examine samples of police reports of traffic accidents involving elderly drivers to gain insight into their causes and contributing factors. It was found that the proportion of drivers at fault in causing traffic accidents decreases with age. There were also notable differences in the type of traffic accident and driver culpability among different age groups of elderly drivers [8]. A similar study was also conducted in Sweden, where Skyving et al. [26] analyzed traffic accidents in which deceased drivers were aged 65+. The analysis found that older drivers in Sweden cause the most accidents overall in the summer, during the week and when the road is dry. The highest number of fatalities occur at intersections, at 34.7%. It has been also stated that there is a greater chance of elderly drivers dying before any accident event in which they are involved (of 167 fatalities, a total of 31–18.6% of drivers died of natural causes before the crash happened) [26].
From the literature review, it can be noticed that little effort has been spent on quantifying the attention/inattention of elderly drivers in traffic and their related driving behavior. The present study aims to deepen this aspect by comparing the gaze behavior of elderly drivers with that of young and adult drivers. The research starts by analyzing the patterns in the data of traffic accidents caused by elderly drivers, then it develops by developing an experiment which, using a questionnaire, a driving simulator and eye-tracking glasses, seeks to gain insights into the driving and gaze behavior of these road users.
3. Methodology
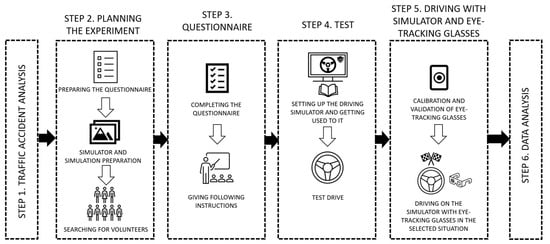
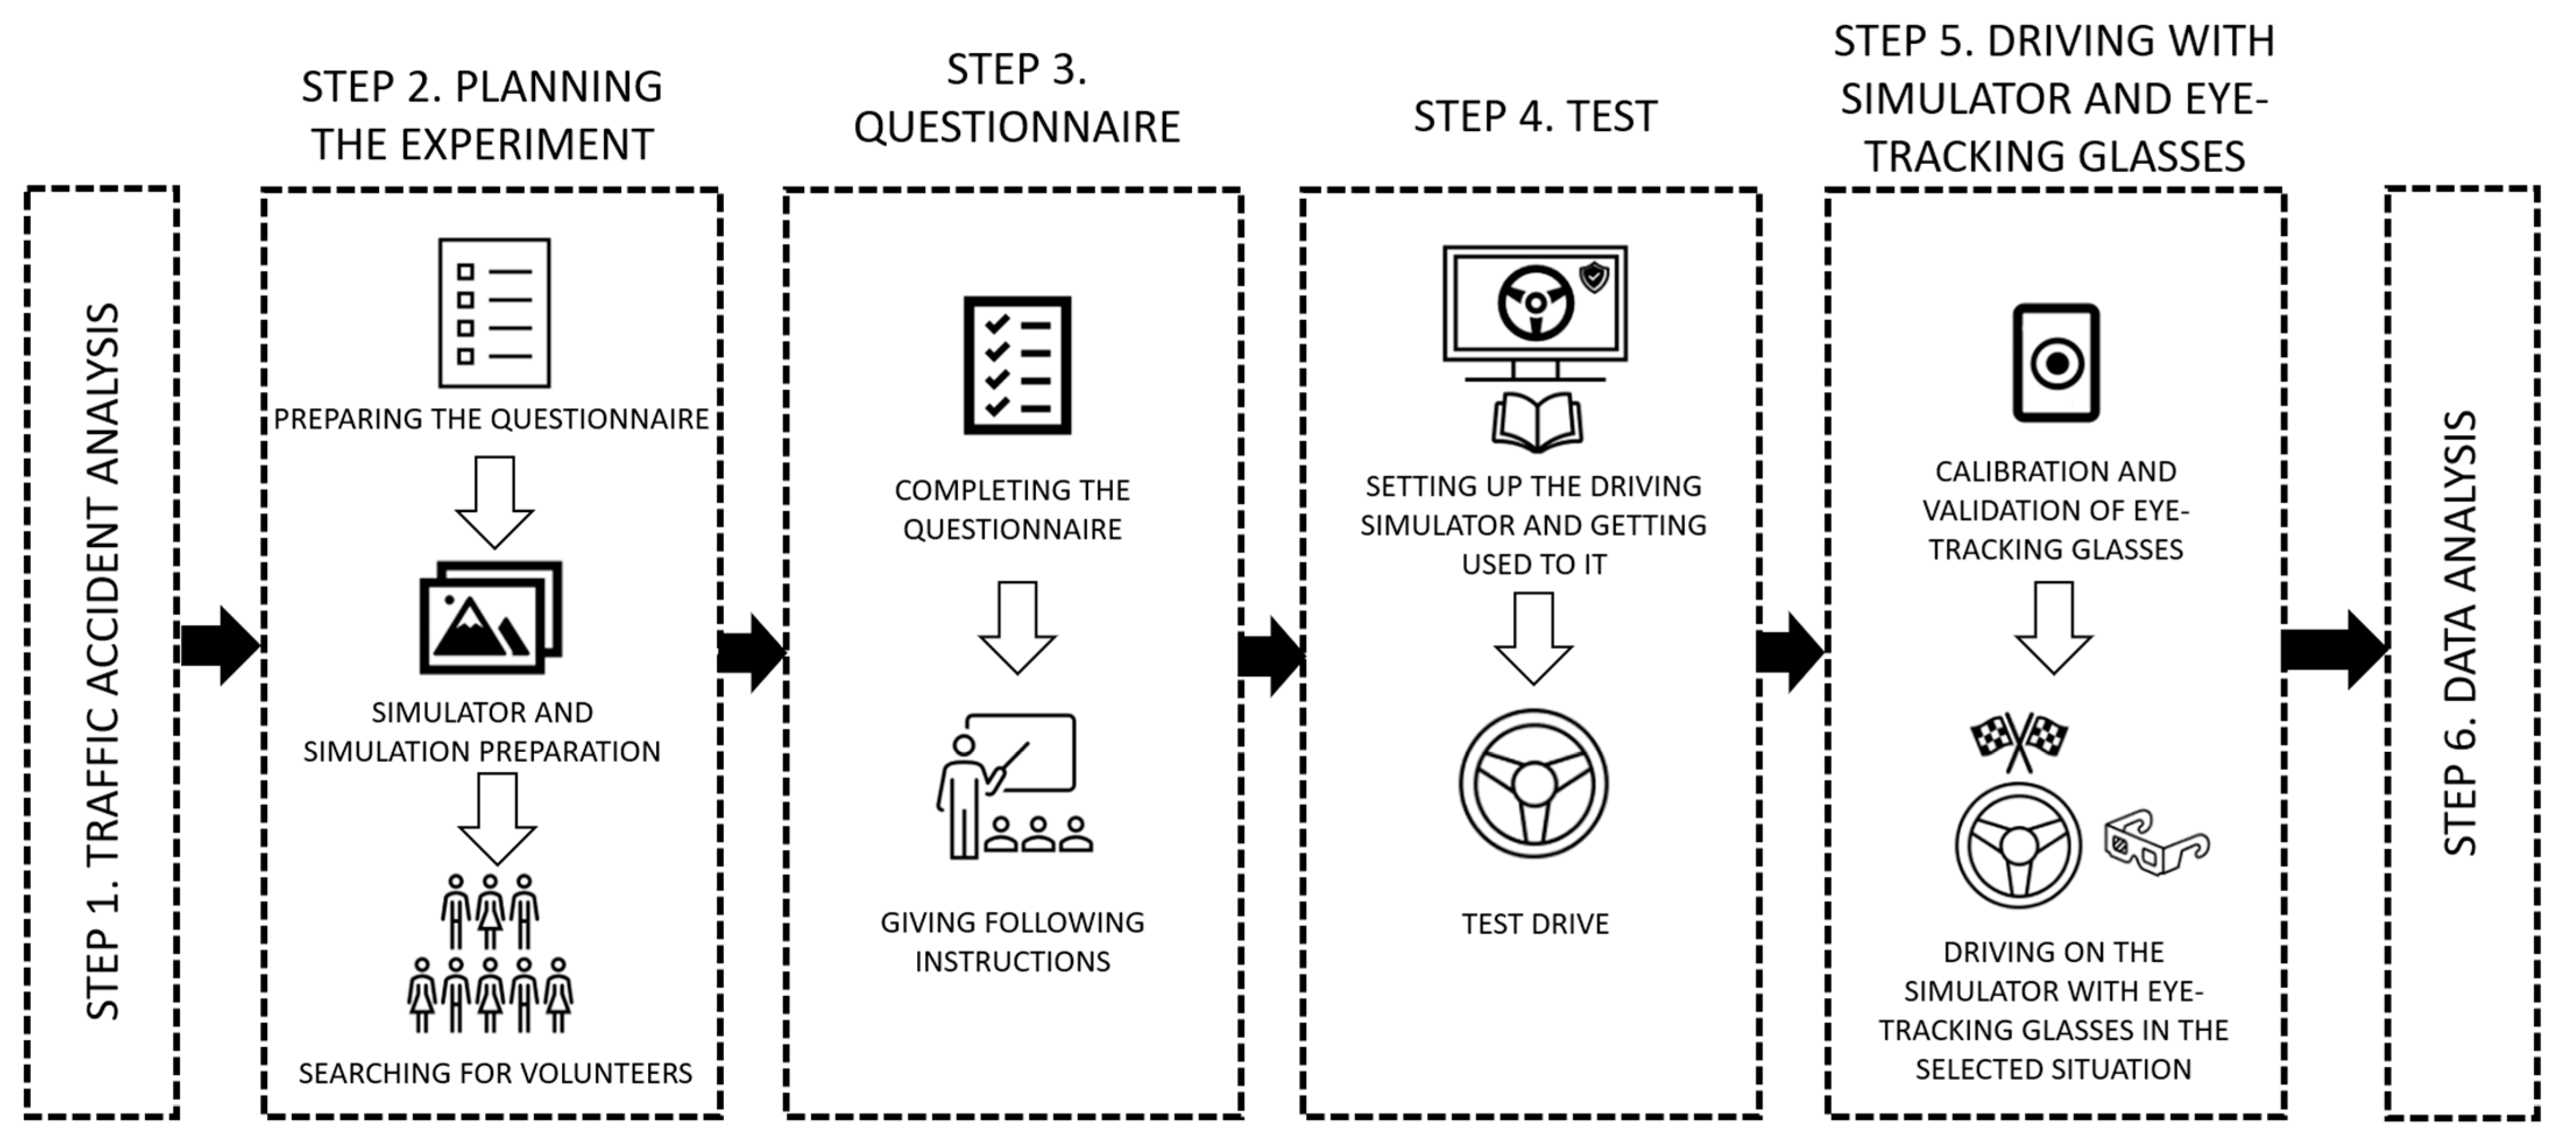
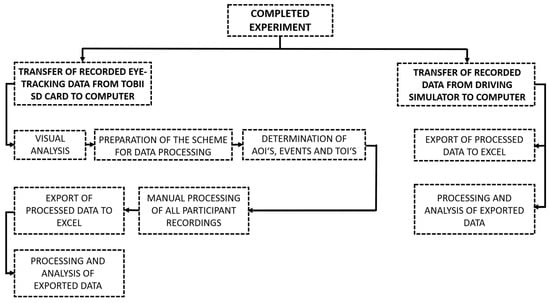
The research presented in this paper consisted of six steps (Figure 1): firstly, traffic accidents involving elderly drivers were analyzed to identify common patterns leading to these events (see 3.4.1 Traffic Accident Analysis). Secondly, the experimental part was planned: a questionnaire was developed which aimed to understand how driving experience, personal traits and knowledge affect the elderly’s driving performance. This was followed by the design of the driving simulator trial, which consisted of a test drive and an experimental drive, when eye-tracking equipment was also used. Finally, all the data obtained were analyzed.
Figure 1.
Scheme of the process followed during the research.
3.1. Participant Recruiment
Part of the experimental design was the recruitment of suitable participants: a total of 30 volunteers, who were divided according to their age, were involved in the experiment. Ten of them were young adults (25–44 years old), ten were adults (45–65 years old) and ten were elderly (65 years+).
Each group was additionally divided by gender (five female and five male drivers for each group), obtaining a total of 15 women and 15 men in the entire study population.
Three main criteria were followed when selecting participants: they should have a valid driving license (category B according to European legislation—private car); they should be in a normal healthy condition and have normal sight (no eye disease or poor vision). These criteria allowed us to consider the participants as representative of most of the driving population, and at the same time meeting to the needs of the research equipment used; indeed, sight corrections could have biased the results obtained via eye-tracking technology.
3.2. Research Equipment
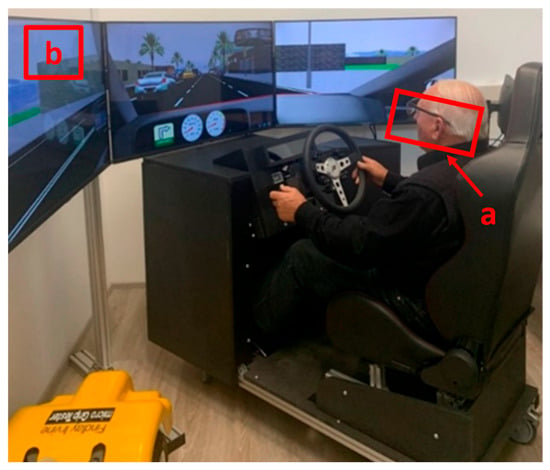
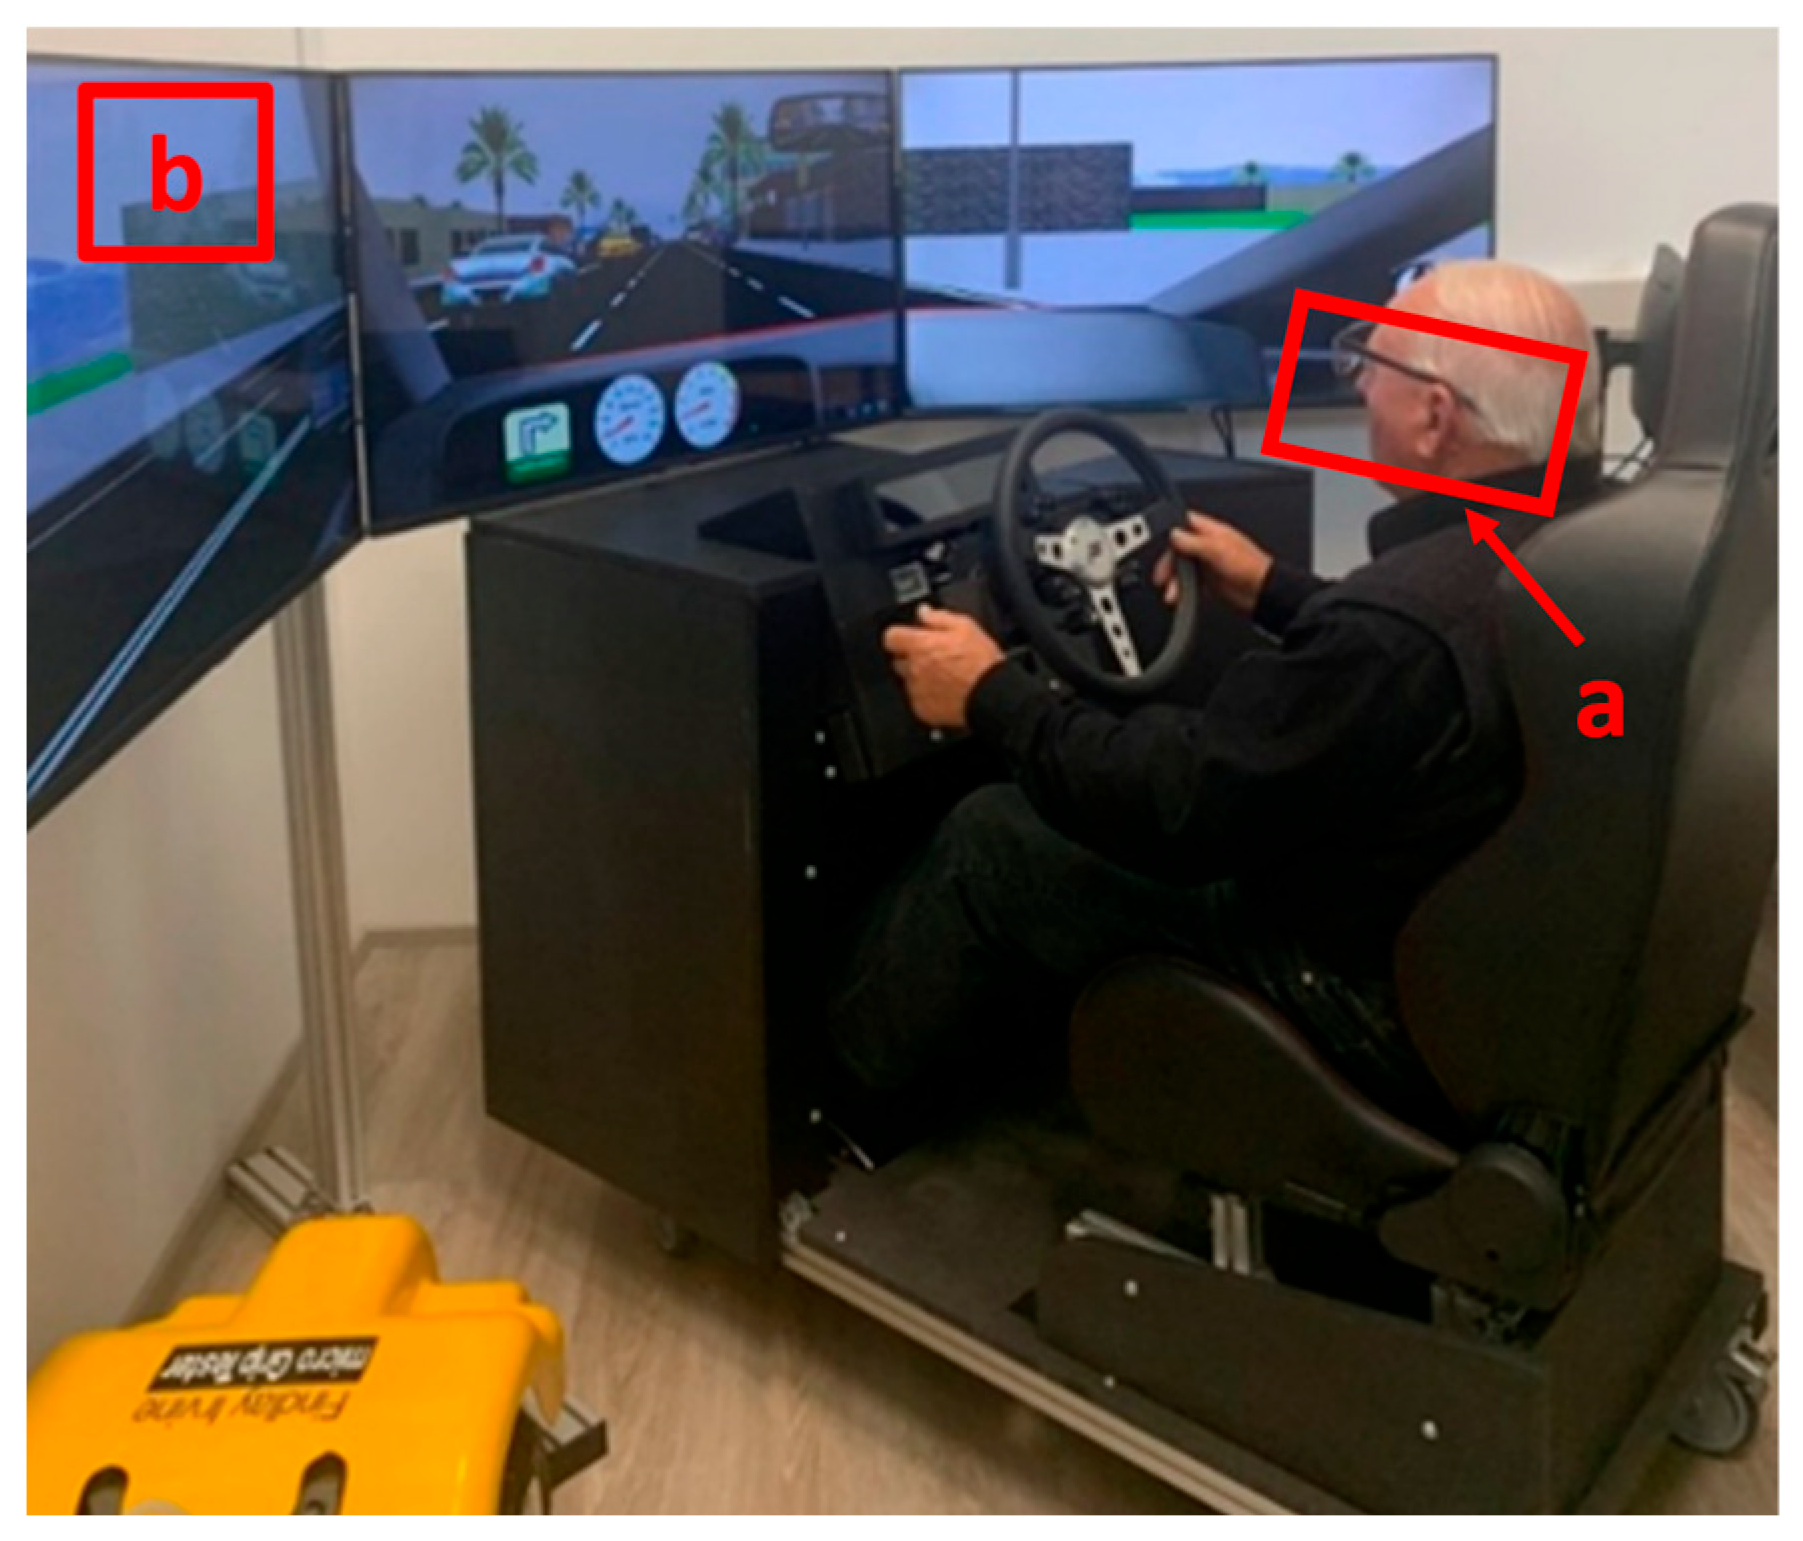
Two pieces of research equipment were used in this research: a driving simulator and eye-tracking glasses. Their setup can be seen in Figure 2. The driving simulator TouringSim [27] was used to allow all participants to drive in the same conditions and encounter the same events. It consists of three main parts: the three 135 Field-Of-View LCD displays, on which participants can follow the simulation; the seat with the controls, where the participants drive; and the monitoring station, where the researcher can follow the experiment in real time. The three displays represent the windshield and side front windows of a car, to allow the user to immerse themselves in the simulation. The seat with the controls includes a steering wheel with various controls (turn signals, horn, lights, etc.); an adjustable seat with pedals for the clutch, brake and gas; the manual transmission; and the dashboard.
Figure 2.
Setup of the driving simulator and eye-tracking glasses in the Laboratory of Traffic Engineering at the Faculty of Civil Eng., Transportation Eng. and Architecture of the University of Maribor. Example of an elderly driver participating in the experiment. In the figure, both eye-tracking glasses (a) and the driving simulator (b) can be seen.
The driving simulator offers several different driving scenarios, where the conditions the user encounters while driving can be fully determined.
The outputs provided by the driving simulator encompass all three components of the human–vehicle–infrastructure system and can be thoroughly divided into three major categories: data on the user’s behavior—e.g., use of pedals, acceleration, speeding, driving errors—data on the reactions and state of the driver—e.g., reaction time and attention—and data on the conditions in which the test subject was driving–both external and vehicular conditions.
Regarding the eye-tracking system, Tobii PRO 2 eye-tracking glasses [28] were applied in this study. This uninvasive technology allows us to collect data on the gaze behavior of the participants without limiting their eye or head movements. Eye movements that can be monitored include fixations and saccades. A fixation is a time period when the eye is stationary and focused on a point, while saccades are rapid, jerky movements of the eyes from one point to another [29]. In this study, only fixations were considered. The system consists of two main parts: the glasses themselves, which each participant should wear, and which follow their eye-movement, and the recorder unit, which is connected to the glasses and automatically stores the recorded data. Two pieces of software are available as well: Tobii Pro 2 controller 1.11420033, which serves to collect and store data, and Tobii Pro lab, which serves for data processing.
The eye-tracking glasses incorporate various sensors: on the front, a high-resolution camera records Full HD video of the scene participants see; a microphone captures the sounds of the participant and of the surroundings; eye-tracking sensors in the internal part of the glasses record eye orientation and movements; IR illuminators illuminate the eyes, facilitating the tracking of the gaze; and a connector cable connects the glasses to the recorder unit.
3.3. Development of the Experiment
The experiment took place in the Laboratory of Transportation Engineering at the Faculty of Civil Engineering, Transportation Engineering and Architecture (FGPA), University of Maribor, 2000 Maribor, Slovenia, on various days, according to the availability of participants. Since it took place entirely indoors, external conditions did not affect the development of the experiment. When they arrived, volunteers were welcomed by the researchers and they were acquainted with the experimental process. Firstly, they needed to undersign all the documentation in line with GDPR regulations; after that, they had to fill in the developed questionnaire (see Supplementary Materials). This consisted of 25 questions, divided into four sections: in the first section there were five questions about personal data (i.e., gender, age, category of driving test passed, years of driving experience and status); the second section focused on driving experience, asking three questions on the amount of kilometers driven per year; personal driving style was researched in the eight questions of the third section, which included detail of involvement in traffic accidents in the last three years, receipt of traffic tickets in the last three years and a self-assessment of their driving style; finally, section four examined knowledge of road traffic regulations through nine questions.
After completing the questionnaire, each participant individually entered the laboratory where the driving simulator is located. There, they were introduced to the equipment used, and they were provided once more with instructions on how the experiment would be carried out. They were also informed about the general aim of the study, but not many details were given, in order not to influence their driving performance. Before starting the effective drive, each participant was requested to complete a test scenario, so that they could become confident with the driving simulator. This stage also helped notice any kind of simulator sickness in time, and, in the event of this, exclude the participants from the following part of the experiment. Luckily, in the considered sample of participants, no one suffered this sickness, resulting in a 0% dropout rate. After the test drive, participants were also equipped with eye-tracking glasses. These were calibrated and validated on each participant before they were allowed drive. These procedures were followed by the experimental drive, i.e., the driving scenario, whose results are the focus of the analysis presented in this study. The experimental drive, which was the same for all participants, lasted on average 6 min and consisted of 13 different traffic situations. These were the beginning and end of the urban settlement, the presence of road works, six signalized intersections, a pedestrian jumping into the road, a pedestrian waiting on the sidewalk and two unexpected right-of-way losses. The most critical events in the driven simulation were the two unexpected right-of-way losses, which could possibly cause a traffic accident.
3.4. Data Analysis
3.4.1. Traffic Accident Analysis
This section contains analysis of the traffic accidents that occurred in Slovenia in the ten-year period 2012–2022, which involved car drivers. Data were obtained from the publicly available database of the Slovenian Road Safety Agency [30], which since 1994 has been gathering Tall geo-localized traffic accident data reported by the Police. In this database, four information categories are available: time and location of the road accident, characteristics of the accident, characteristics of the road and involved road users. The specific data provided by the database are listed in Table 1, divided by category.
Table 1.
Data available in the database of the Slovenian Road Safety Agency.
Data were exported in a .xls file, through which they were further analyzed. After a first general evaluation of the traffic accidents involving car drivers of all age groups, the analysis focused on elderly car drivers. In this analysis, all traffic accidents with elderly drivers involved were considered first; after that, those caused by them were analyzed. The main purpose was to understand the causes and patterns common to road accidents caused by elderly people. Therefore, the analysis was divided into four parts: firstly, traffic accidents were analyzed by their classification, i.e., by their consequences; after that, the influence of weather and of the location was considered; lastly, the cause and type of traffic accidents were taken into account.
3.4.2. Driving Simulator and Eye-Tracking Data Analysis
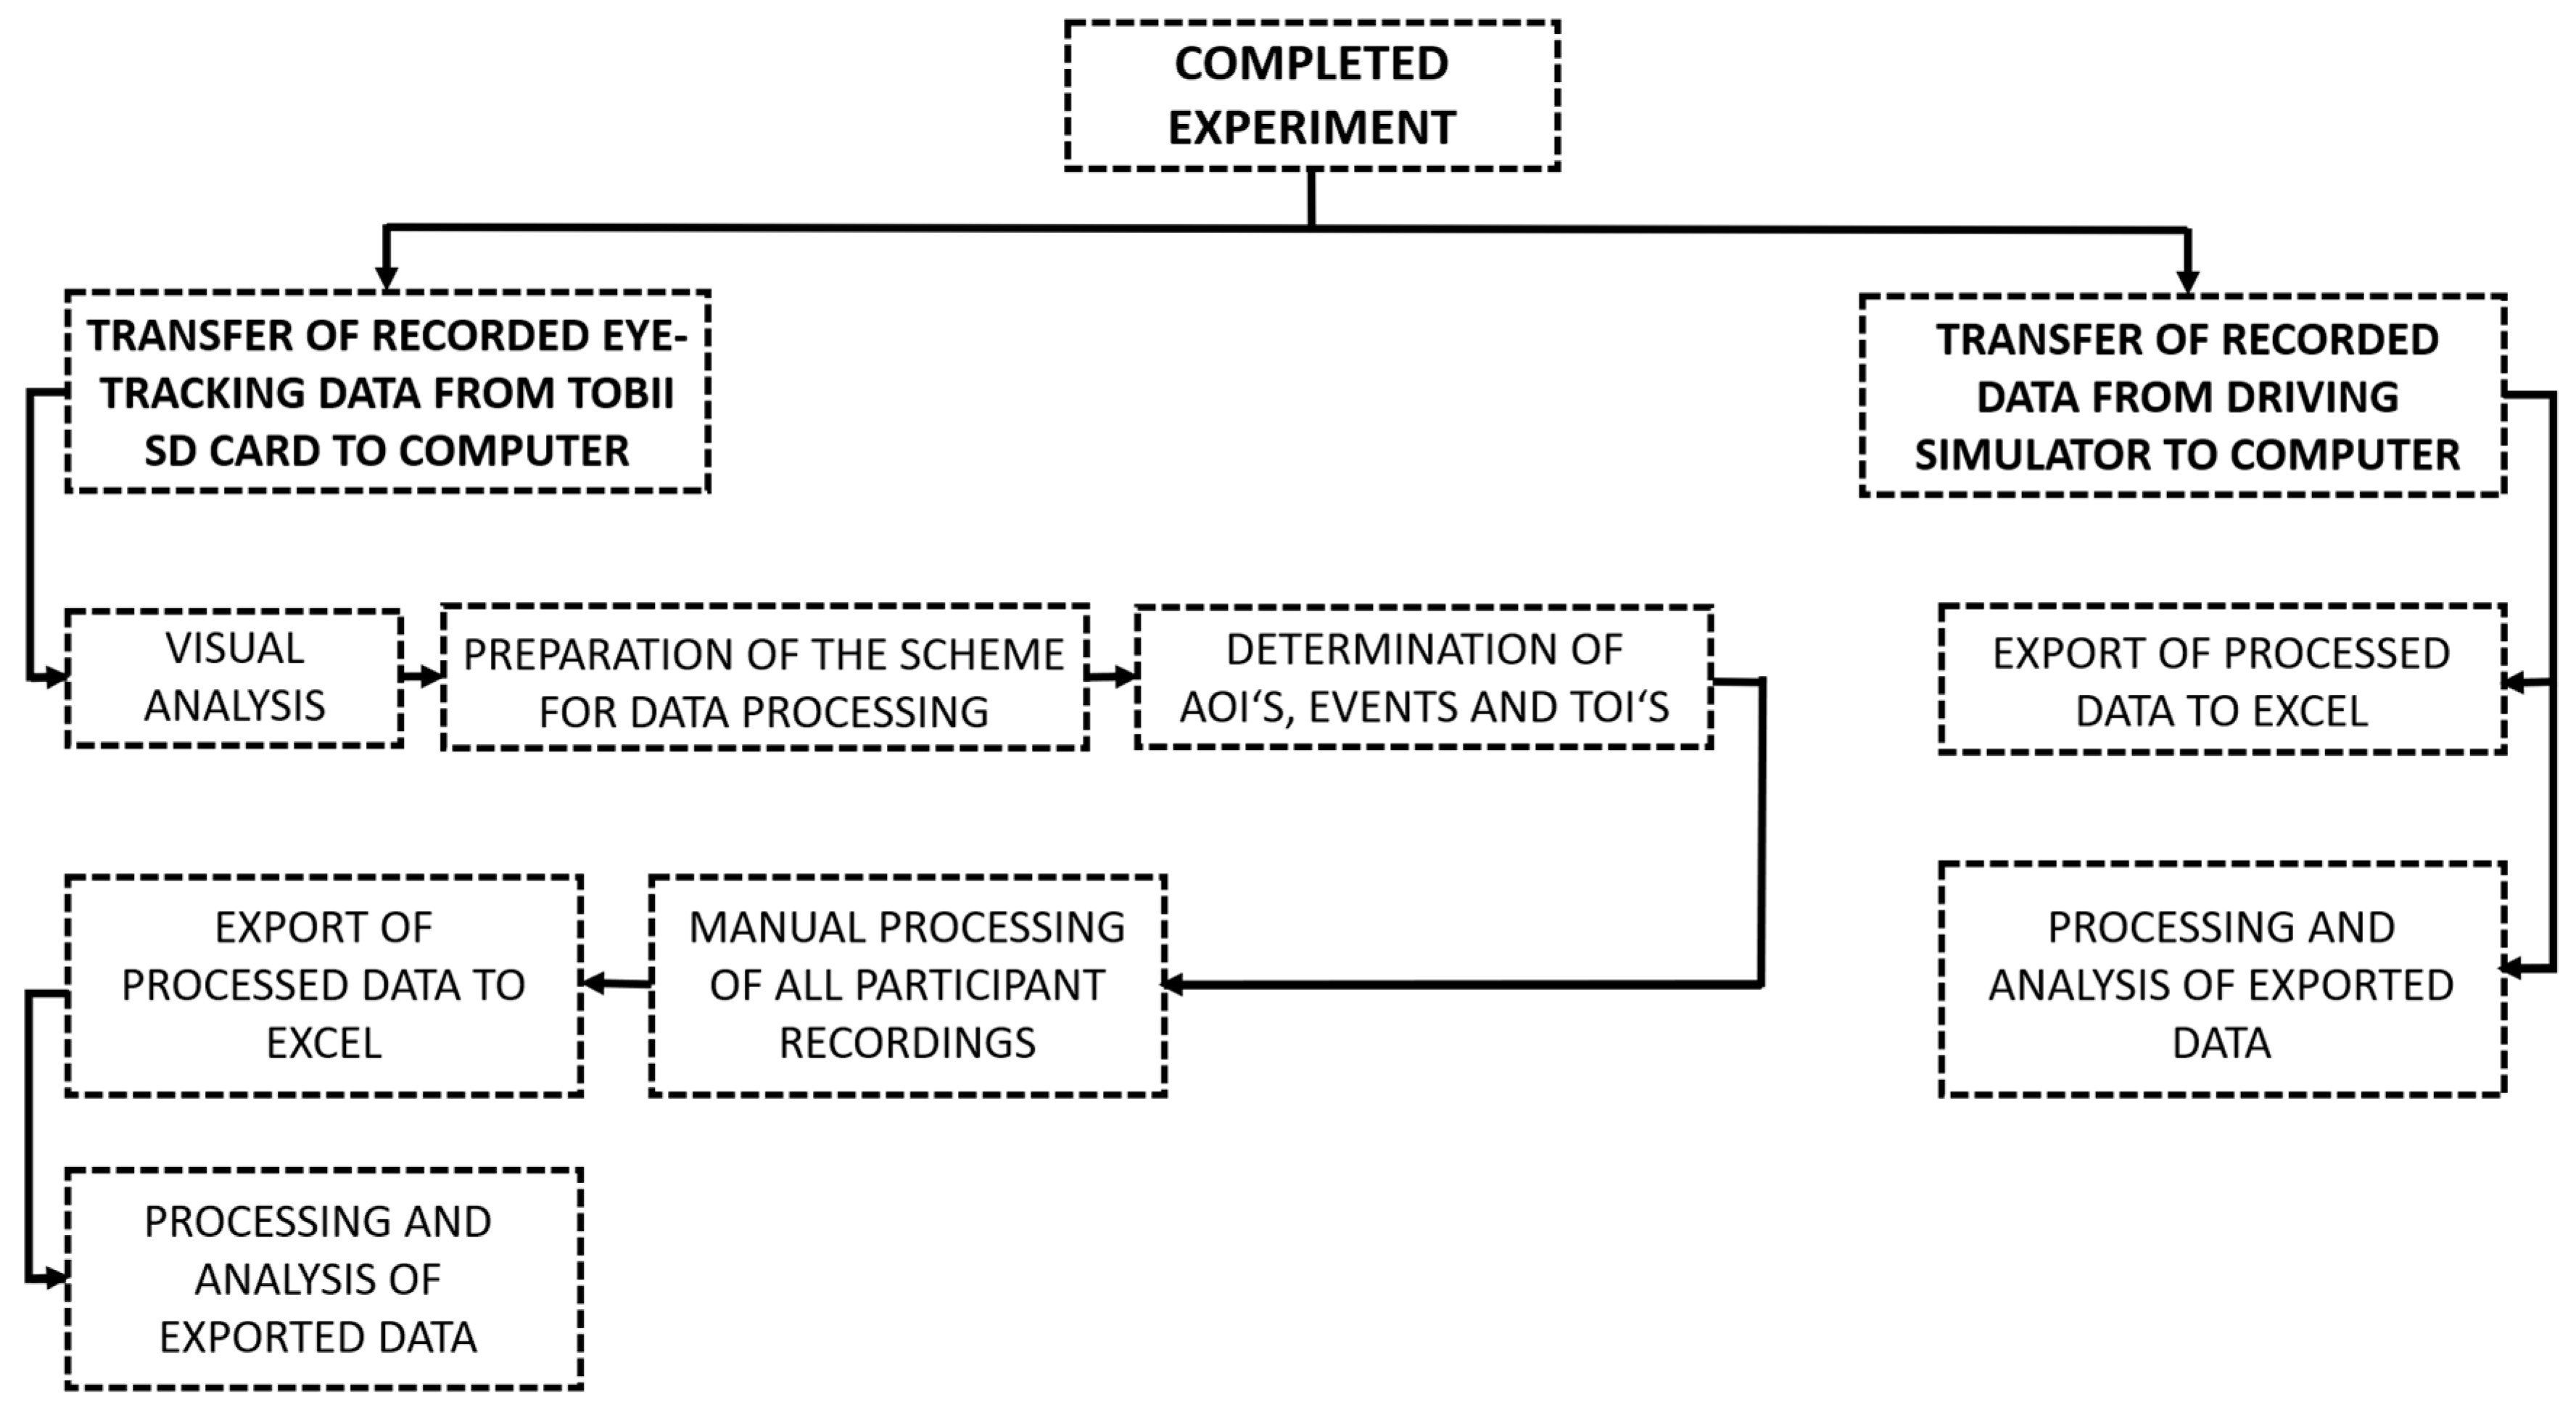
After the completed driving simulator trials, both eye-tracking and driving simulator data were obtained for each driver; they were separately exported to a data file, and converted to excel for further elaboration. The steps followed during their processing, before obtaining data suitable for analysis, are visible in Figure 3.
Figure 3.
Steps followed for driving simulator and eye-tracking data processing and elaboration.
From the driving simulator longitudinal acceleration and speed, lateral acceleration and speed, lateral lane position and pressure on the brake, we were able to compare the longitudinal and lateral behavior of different age groups while driving.
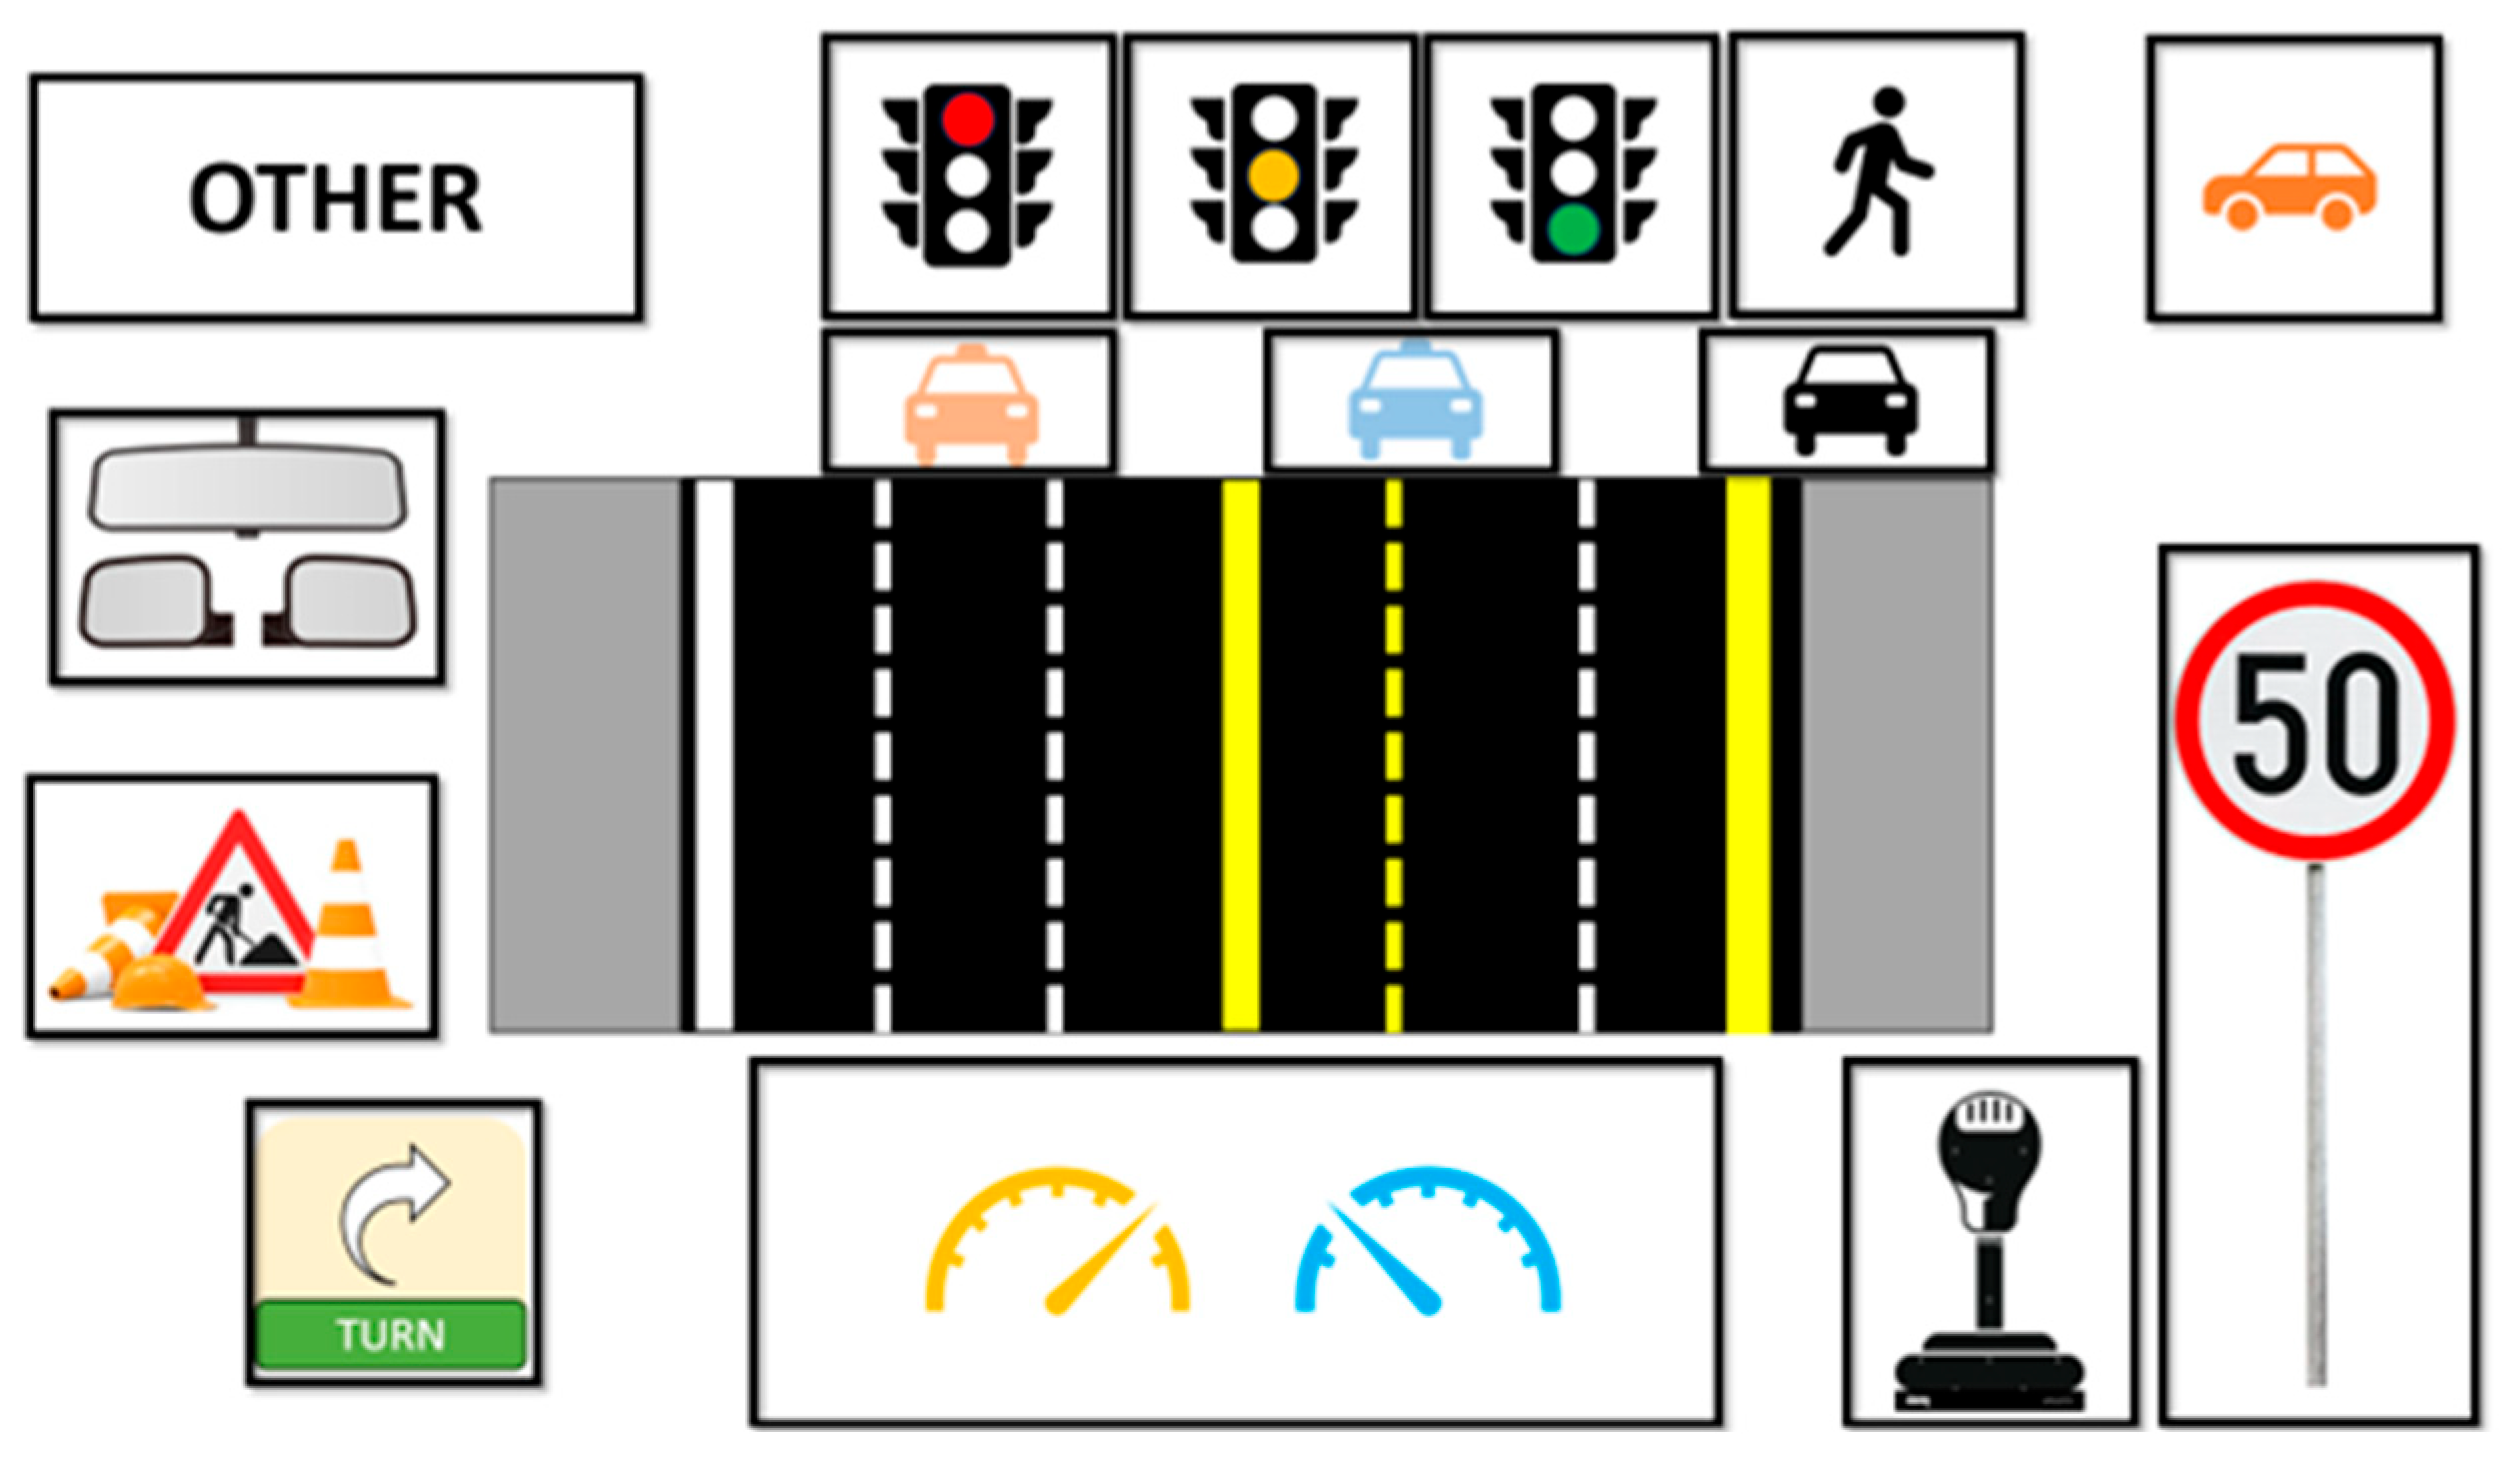
Of all the videos obtained by the eye-tracking equipment, only those with more than 75% of recorded data were considered further. These were then visually analyzed to identify the elements observed the most by the drivers. This allowed us to determine 14 areas of interest (AoIs), which are summarized in Table 2. Based on this selection, a labelling image was created (Figure 4), on which the manual mapping of the gaze was developed.
Table 2.
Areas of interest obtained by the first visual observation of eye-tracking footage.
Figure 4.
Labelling image used to manually track drivers’ fixations.
To work out manual mapping, “Times of interest” (ToI) had to be defined for the videos: these can be defined as parts of the videos when a specific traffic event happened that could have induced specific driving behavior and reaction in the participants. ToIs, which are identified in the eye-tracking videos by marking an initial and final event, which are the same for all drivers, are reported in Table 3.
Table 3.
Times of interest (ToI), used together with Area of Interest (AoI), to manually map eye-tracking footage.
After the definition of appropriate AoIs and ToIs, manual mapping was carried out by manually selecting the AoI on which participants fixated. This step provided the raw participants’ gaze data that was used in further elaborations. In this research, the following fixation data were analyzed:
- Fixation count (FC)—absolute number: shows the number of fixations of an individual driver on an individual element in a certain ToI, i.e., how many times the driver looked at an individual element in an individual ToI;
- Average fixation duration (AFD)—seconds: expresses how long on the average the driver looked at a certain element in a certain ToI;
- Total fixation duration (TFD)—seconds: indicates how long the driver looked at an element;
- First fixation duration (FFD)—seconds: identifies how long the driver looked at the element the first time they noticed it.
FC, AFD and TFD were used to infer attention/inattention patterns, while FFD was the starting point for the calculation of reaction time.
4. Results
4.1. Road Accident Analysis Results
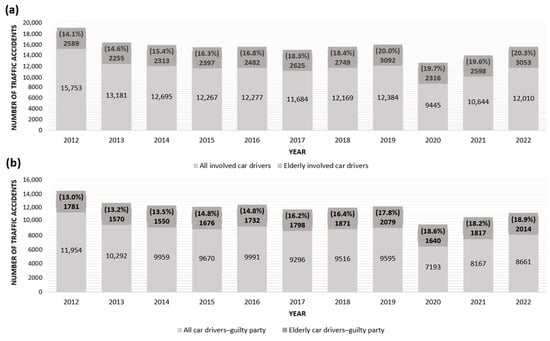
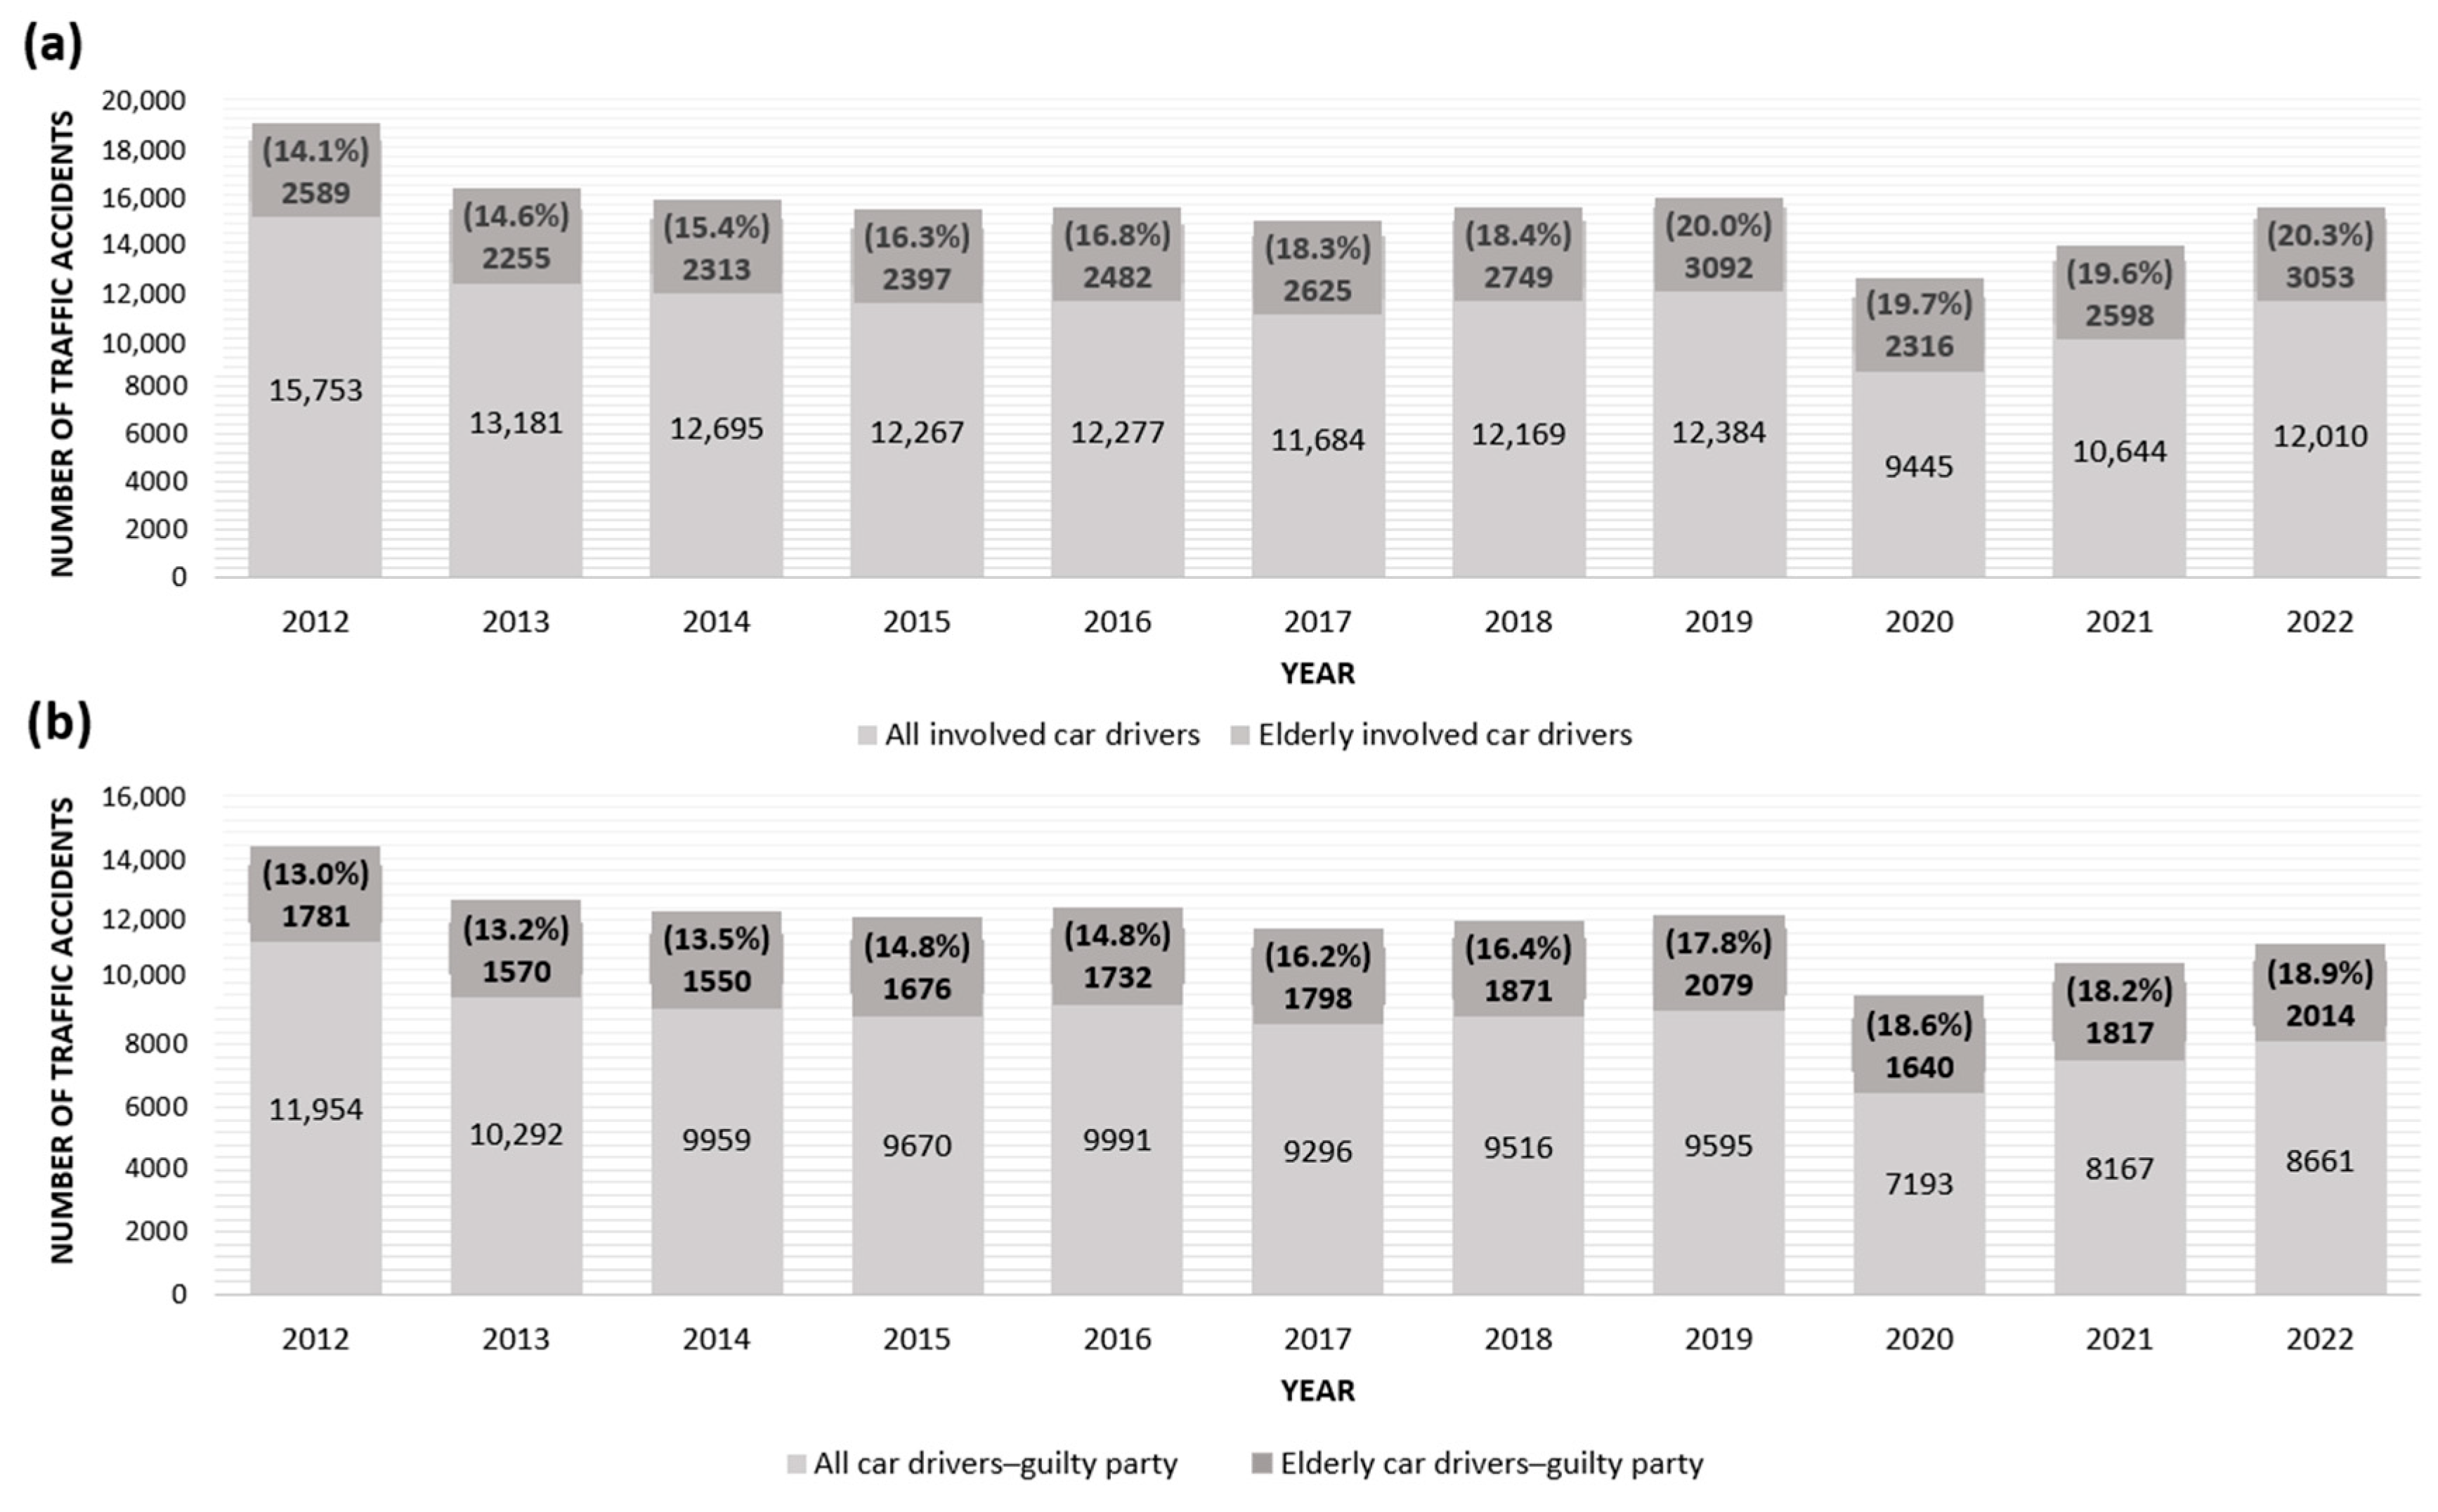
The first aim of this analysis was to understand to what extent elderly drivers are involved in road accidents and to what extent they cause them. The graphs in Figure 5 show their general involvement in road accidents (Figure 5a) and their involvement as the guilty party (Figure 5b). It can be noticed that on average, over a ten-year period, 17.6% of road accidents involved elderly drivers (Figure 5) and 15.9% were caused by them (Figure 5b), showing that most elderly drivers who were involved in traffic accidents also caused the accidents. Also, both graphs highlight that, despite the decreasing number of all traffic accidents since 2012, the number and percentage of elderly car drivers involved in traffic accidents has the opposite trend, increasing in the last few years.
Figure 5.
(a) Number of traffic accidents involving car drivers, 2012–2022; (b) number of traffic accidents caused by car drivers, 2012–2022. The columns show the total number of traffic accidents where car drivers were involved or caused them, respectively, but are divided by color into two parts: the light-gray section of the columns (the lower part) represents all other passenger car drivers and the dark-gray part of the columns (the upper part) represents older passenger car drivers.
According to the data from the Slovenian national accident database, 19,528 traffic accidents were caused by elderly drivers in Slovenia in the period 2012–2022. Of these, 107 were fatalities and 672 traffic accidents resulted in serious injuries.
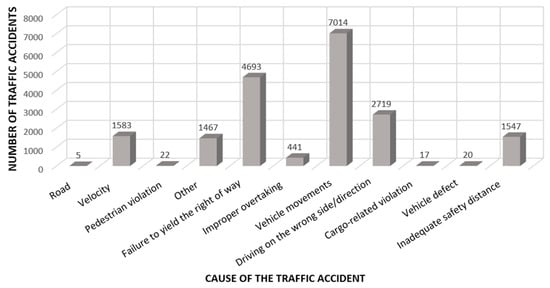
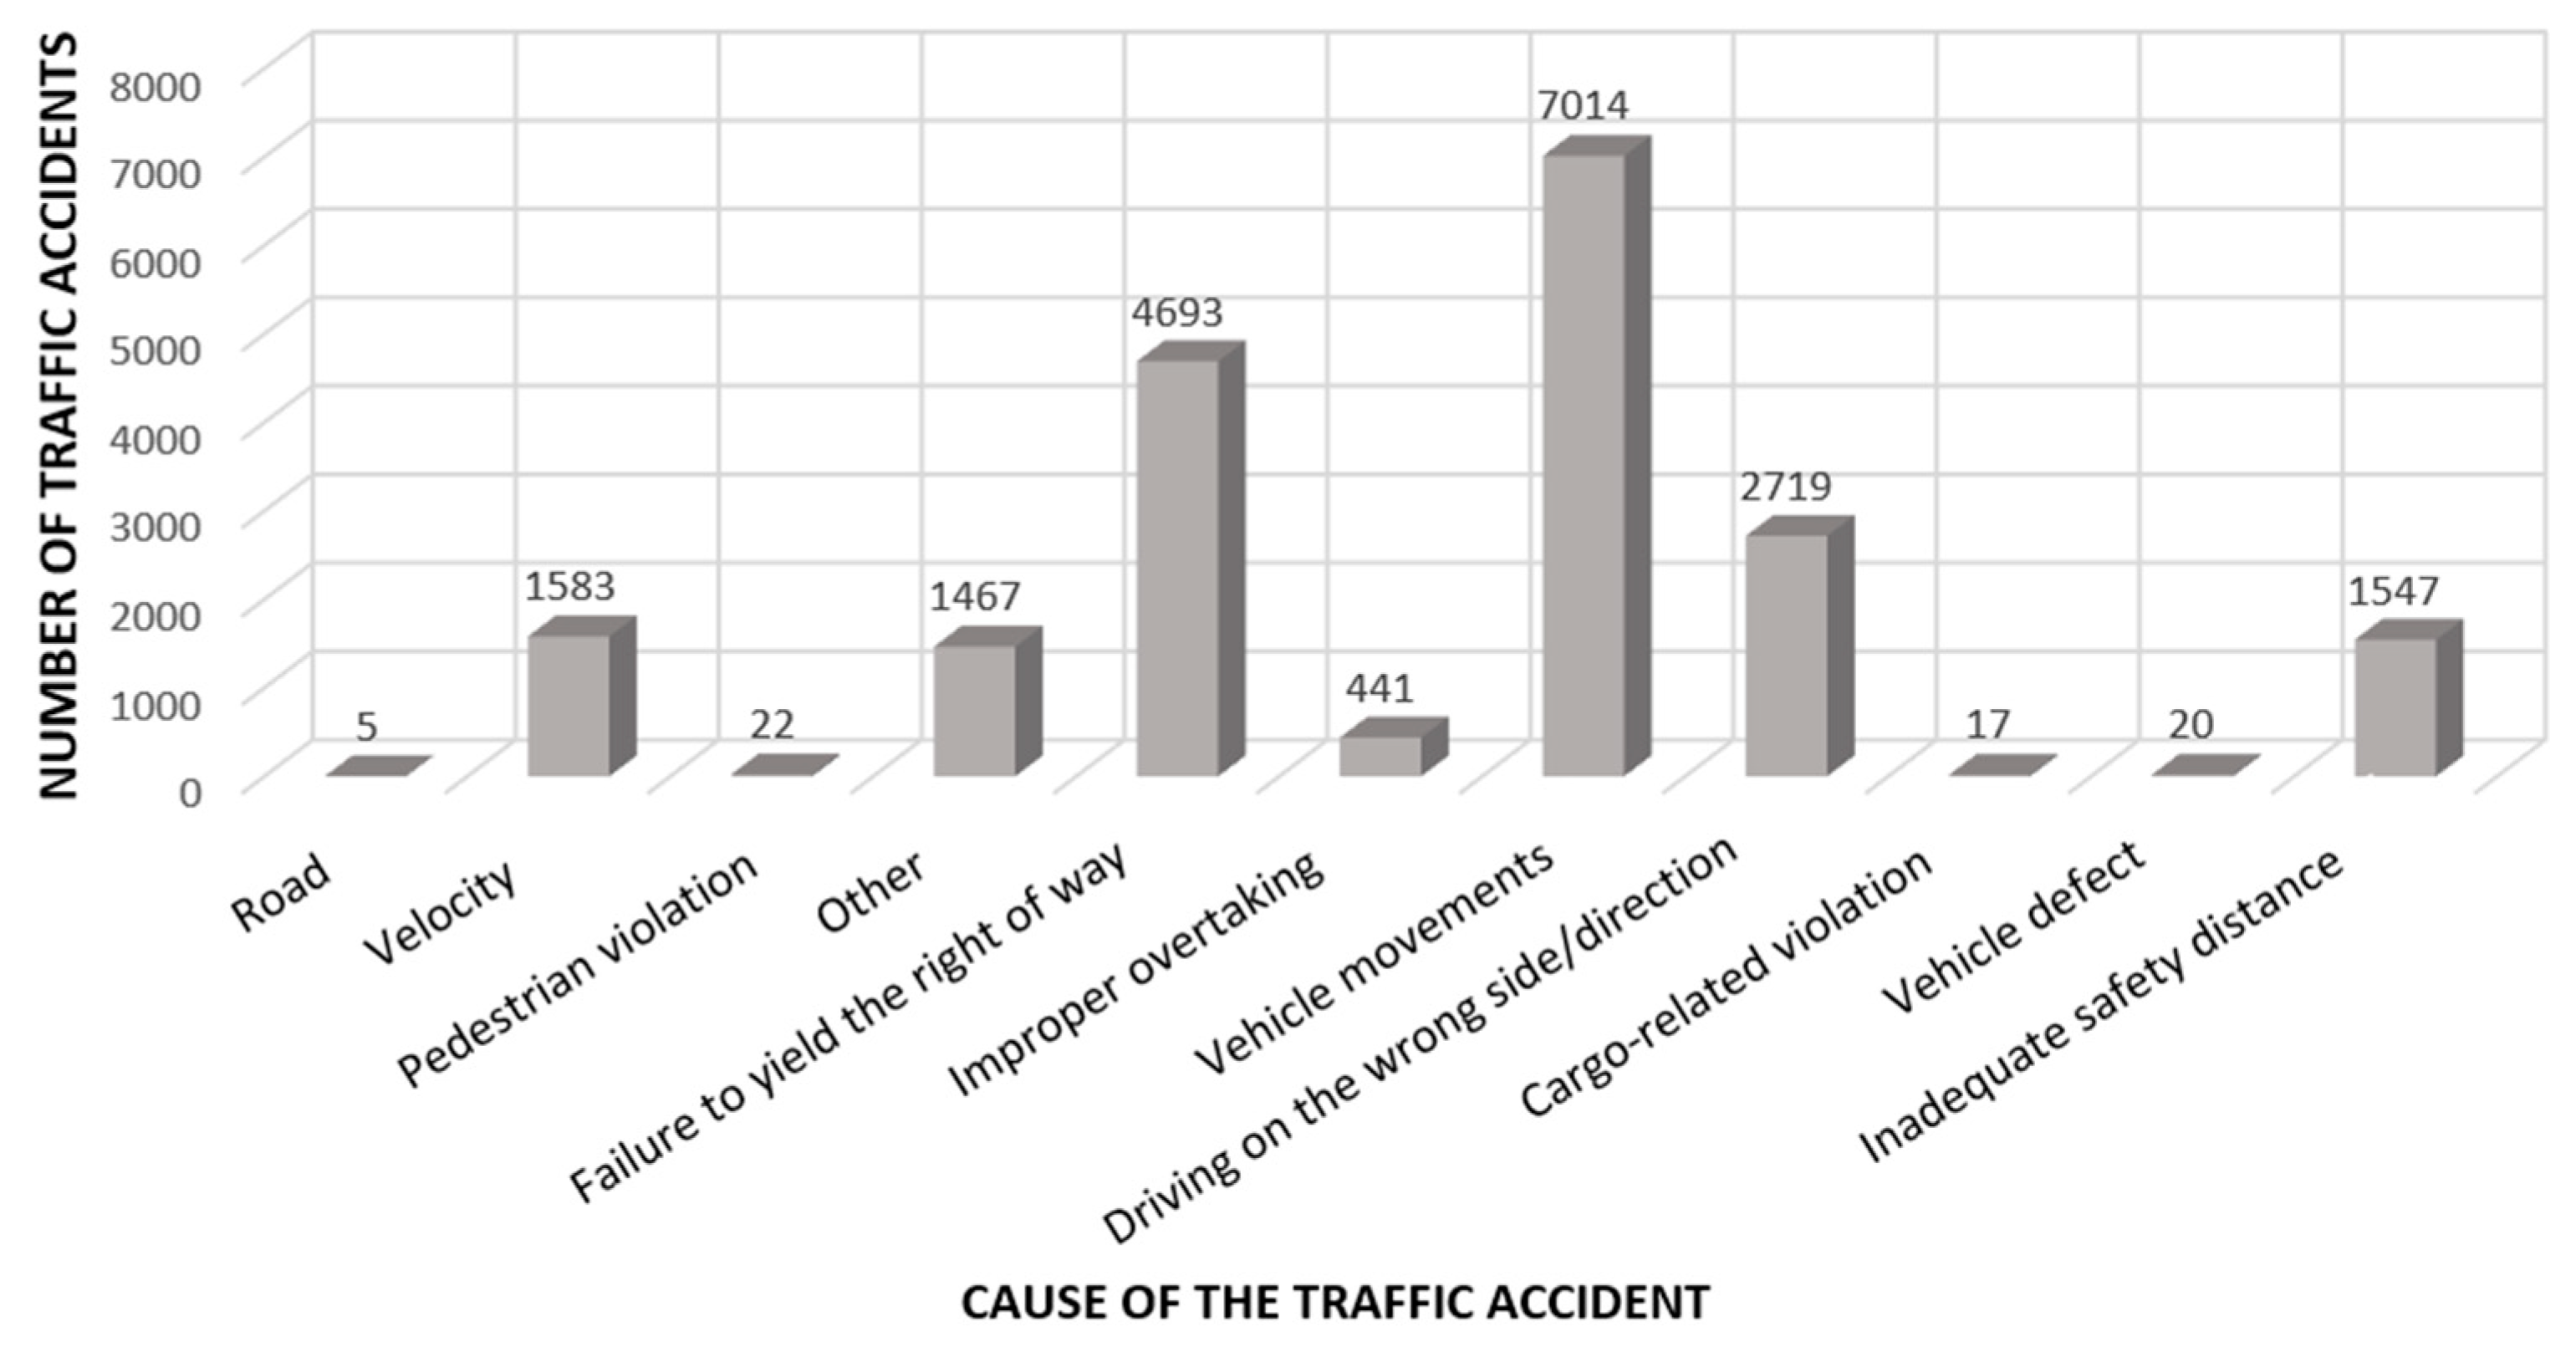
Most of the traffic accidents caused by elderly drivers happened during weekdays of warm months, specifically, in the late morning hours (from 9 am to 1 pm) of Fridays, in the months of May and June. These results also match the fact that, usually, accidents caused by elderly drivers are recorded during nice, sunny weather (62%), on a dry road surface (78%). Similar results were obtained by Skyving et al., who found that most traffic accidents happened in summer, on weekdays and on dry surfaces [26]. The three most common locations where traffic accidents caused by the elderly happened were the road itself (66%), parking lots (19%) and intersections (12%). In the majority of cases, elderly drivers caused accidents in urban areas (71%). Figure 6 shows the number of traffic accidents that occurred in Slovenia and were caused by elderly drivers during the observed period.
Figure 6.
Number of traffic accidents caused by elderly drivers in the period 2012–2022, in relation to their cause.
Most traffic accidents were caused by elderly people not respecting priority rules (24%), movements with a vehicle (34%) and ghost-driving (14%). This is in accordance with the type of accidents mostly recorded, i.e., side collisions (25%), and collisions with stationary or parked vehicles (22%). Finally, only 5% of all elderly drivers causing traffic accidents were under the influence of alcohol.
4.2. Questionnaire Results
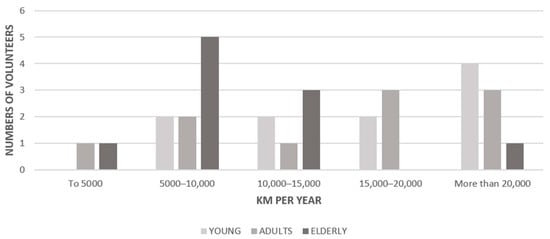
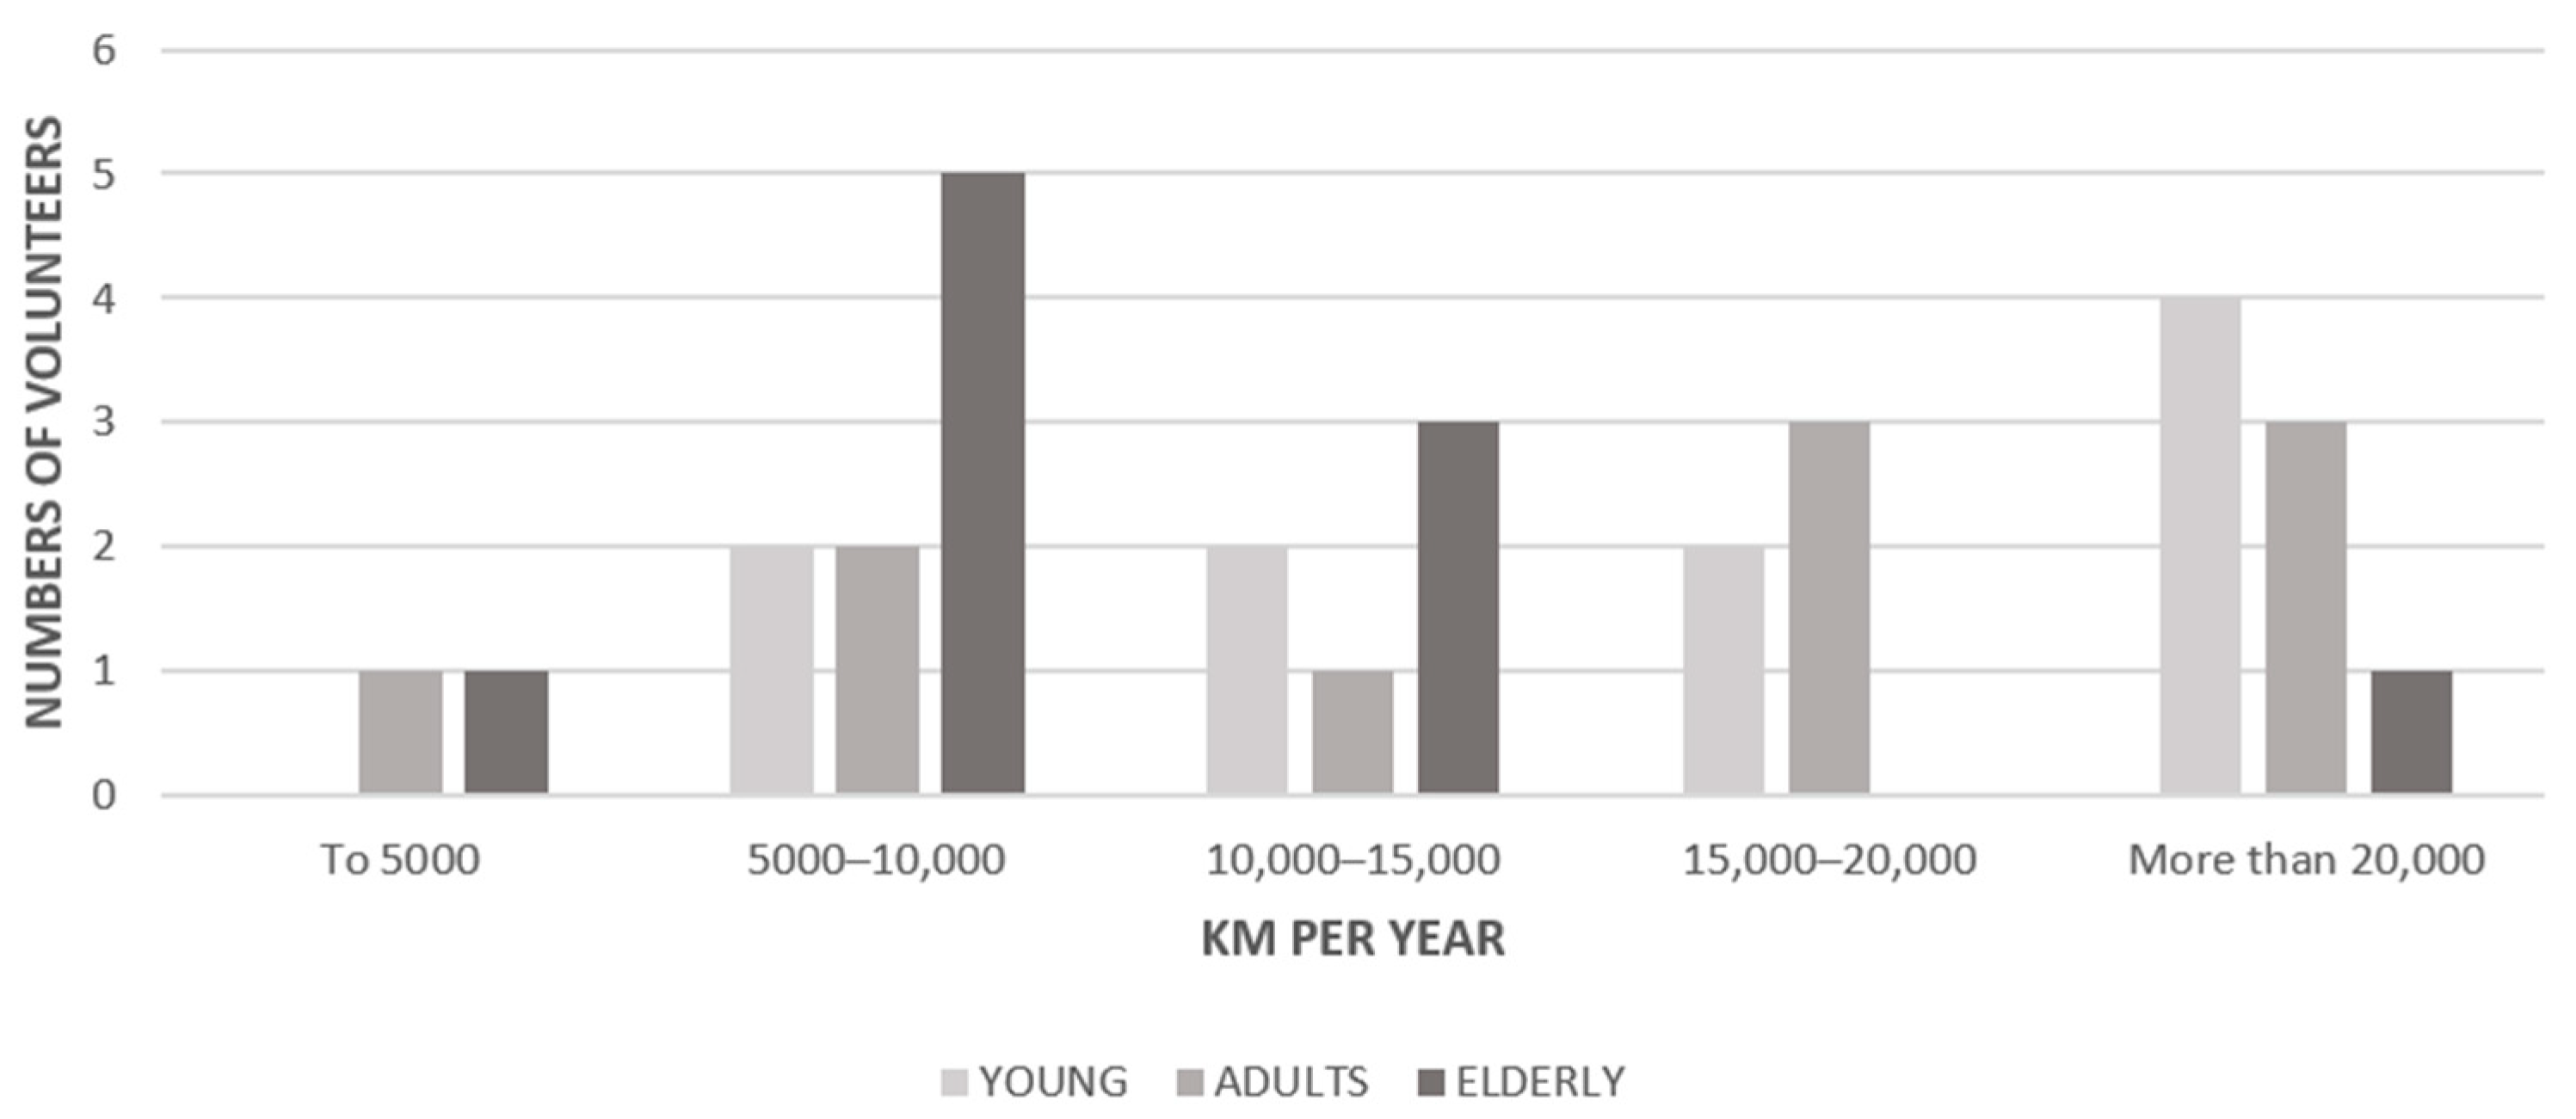
Since all participants responded to the questionnaire, 30 responses were collected and divided by age group. The responses related to driving experience show that half of the elderly drivers drove between 5000 and 10,000 km/year, in comparison to adults and young adults, who in most cases drove twice the mentioned amount (Figure 7).
Figure 7.
Annual kilometers driven by survey respondents.
The responses related to participants’ road safety history are available in Table 4. This is divided into two parts, namely fines and traffic accidents. In each part, daily and weekly drivers are shown separately. The table also shows the distribution of how many fines were received and how many traffic accidents were experienced by daily and weekly drivers by age. The responses show that, in the last three years, middle-aged drivers had the most traffic accidents and fines, while elderly drivers had the least and young drivers were in between, receiving five fines and causing two traffic accidents. This could be related to the amount of km driven yearly and, consequently, to the higher presence of middle-aged drivers on the road in comparison to the other age categories. In Table 4, the amounts of traffic accidents and fines are grouped according to the participants’ driving exposure. It can be seen that, the more time drivers spend on the road, the more infractions they commit. The same can be said for accidents.
Table 4.
Traffic violations and accidents reported by survey respondents in the last three years.
The results of the driving self-assessment section in the survey show that most elderly drivers use lower speeds when driving in urban areas, in comparison to other participants, who stated that, in urban areas, they did not drive slower than prescribed. Also, outside urban areas, according to the responses, young drivers and half of the middle-aged ones drove faster than allowed. Differently, 60% of elderly drivers self-assessed as rarely or never driving faster than the prescribed speed limit. A similar trend was found for the driving style on highways, with young drivers tending to speed, while middle-aged and elderly drivers stick to the prescribed speed limit.
Regarding observation of safety distances, elderly and young drivers confirmed that they do this, while middle-aged drivers stated they often do not keep a safety distance.
When analyzing the responses regarding use of turning signals, it was noticed that in all the categories, drivers make constant use of them, with only two exceptions among young drivers. Regarding pedestrians, elderly drivers are the most likely to stop for pedestrians at a crosswalk, although one individual stated that they rarely stop, while middle-aged and younger drivers assessed that they often stopped for pedestrians.
When analyzing their driving style, the majority of young and middle-aged drivers judged themselves as aggressive drivers (60% and 80%, respectively), while elderly drivers recognized themselves as non-aggressive drivers. Nevertheless, contrasting results were obtained when drivers were asked if they drive dangerously, with most drivers in each age group indicating that they do not drive dangerously. The survey also highlighted that most elderly drivers are somewhat afraid of driving in an unknown city (70%), while most young and middle-aged drivers are not. Also, for most of the participants, speed did not represent a sense of danger, and they did not find new traffic regulations stressful. Also, driving on the highway and expressway did not seem to be a fear for most of the participants.
In the last section of the survey, knowledge of road traffic regulations was checked: nine questions were asked, and each one was evaluated with one point. For questions with multiple correct answers, the point was divided by the number of correct answers.
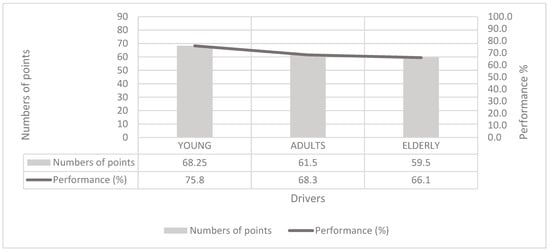
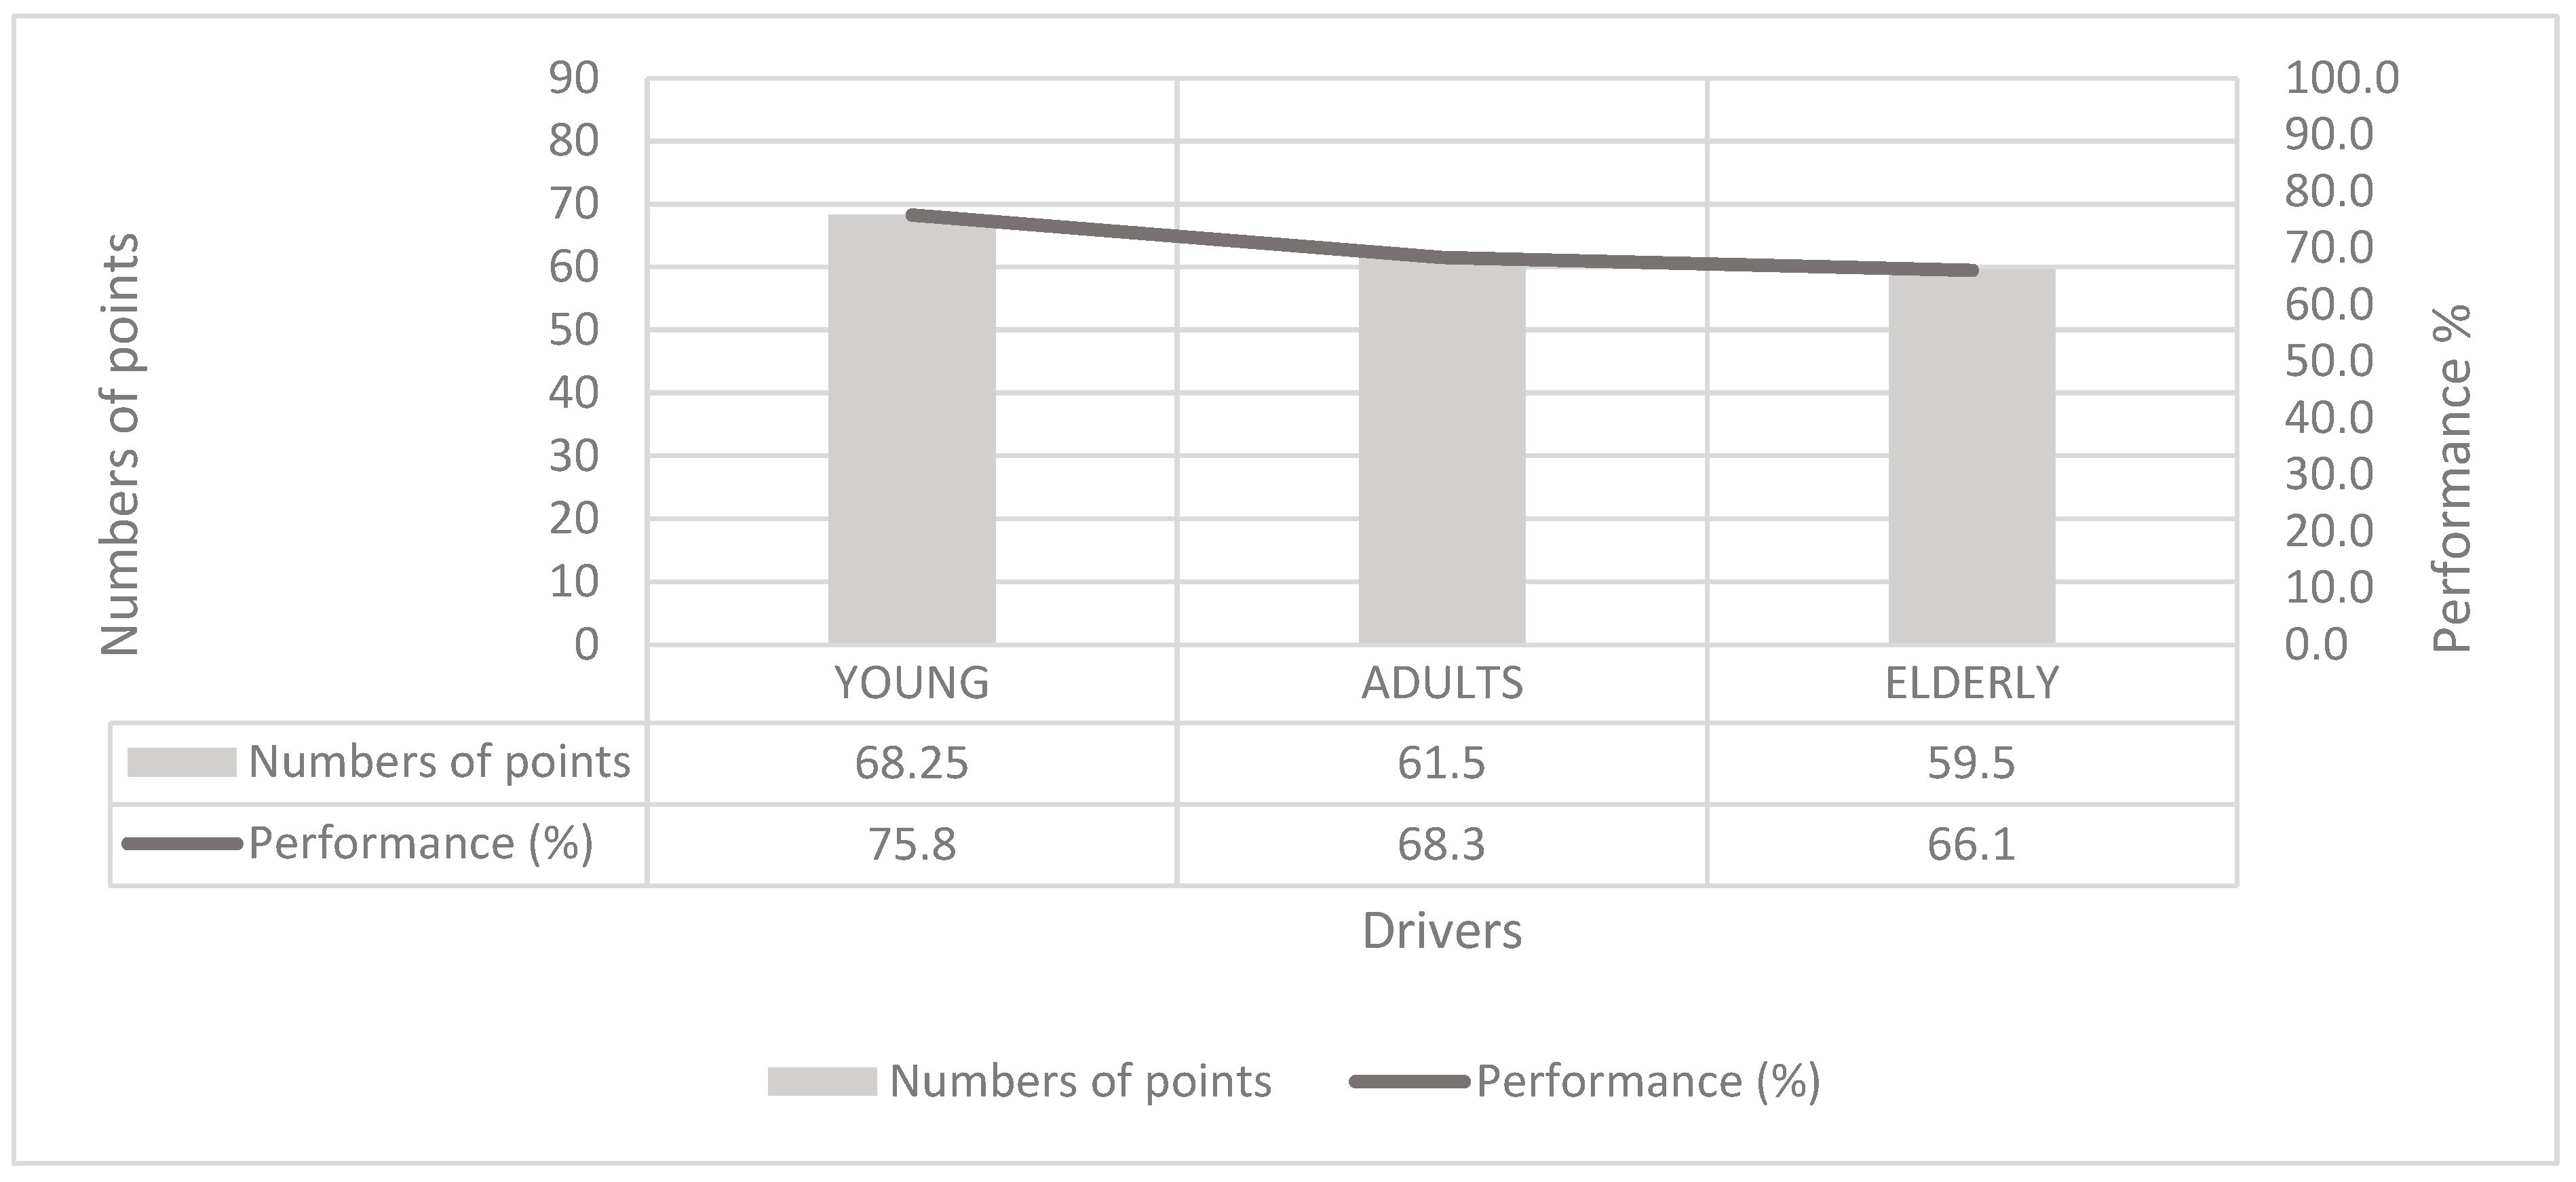
Figure 8 shows the results by points (a maximum of 90 points could be achieved) and by percentages for each age group. It can be observed that young drivers performed the best, scoring a total of 68.25 points (75.8%). They were followed by middle-aged drivers, who scored 61.5 points (68.3%). Elderly drivers did the worst, scoring a total of 59.5 points (66.1%). Of the elderly drivers, three scored less than half the points, representing 30% of all the answers. The most common mistakes made by elderly drivers when filling out the questionnaire concerned right of way at an intersection. They were quite confused about who has the right of way at a four-way intersection. Only two out of ten elderly drivers answered these questions correctly.
Figure 8.
Knowledge of traffic regulations among survey respondents.
These results confirm that, over the years, knowledge of road traffic regulations slowly deteriorates. This can be attributed to the fact that traffic rules are forgotten over time, especially those that are not encountered frequently. In addition, there are also new traffic regulations and changes to traffic signs and rules, which cause confusion, especially for elderly drivers.
4.3. Driving Simulator Results
Table 5 summarizes the mean values of the longitudinal driving parameters for each of the considered age groups: the longitudinal acceleration, speed and the pressure on the brake were considered to be parameters that were useful in understanding drivers’ longitudinal behavior. As can be noticed in the first row of Table 5, middle-aged drivers drove the fastest (vMIDDLE-AGED = 34.54 km/h) and elderly drivers drove the slowest (vELD = 27.65 km/h). When looking at these values, it should be considered that speeds were calculated along the whole simulation, also taking into account the waiting time at intersections. For this reason, they are lower than could be expected.
Table 5.
Longitudinal driving parameters measured in the driving simulator.
Interestingly, elderly drivers had the highest average acceleration, i.e., 0.17 m/s2 over the entire driven simulation, indicating a less stable control of the vehicle: this could be related to the fact that the majority of them forgot to shift the gear lever, driving under high revs.
Also interesting is the braking behavior of participants: despite their slower driving, elderly drivers, compared to the others, used the highest pressure on the brakes, indicating that they perceived the need for a fast vehicular response.
In Table 6, the lateral parameters are reported. When interpreting these results, it should be kept in mind that a positive value for lane position indicates that drivers stick to the right-hand lane. All three parameters, i.e., lateral acceleration, lane position and lateral speed, are interrelated and confirm the same result: that, unexpectedly, elderly drivers seem the most stable in the lane, though they tend to drive more towards the right-hand side, in comparison to the other participants.
Table 6.
Lateral driving parameters measured in the driving simulator.
4.4. Eye-Tracking Results
This section presents results on the participants’ gaze behavior, in terms of overlooked elements, fixations and reaction times. Table 7 reports the number of overlooked elements. The table is divided into three panes: the first pane, “Complete drive,” shows all the results over the entire trial; the second pane summarizes the elements missed due to peripheral vision and the occurrence of other technical problems (e.g., element did not appear due to driving too slowly); and the third pane reports the amount of realistically overlooked elements by driver age, considering the previously mentioned peripheral view and technical issues. It can be observed that a total of 11 elements were overlooked. Most of them were overlooked by elderly drivers (seven elements), young drivers missed three elements, and middle-aged drivers only missed one.
Table 7.
Number of overlooked elements during driving simulation.
4.4.1. Reaction Time
As discussed in Section 3.4.2, only 12 events allowed calculation of reaction time and were therefore further considered, and only the results of those people who actually perceived the elements—i.e., they effectively had a reaction time—were taken into account, leading to a total of 341 rows of data. Participants who missed or did not detect certain elements (Table 7) were considered individually and their results are presented later.
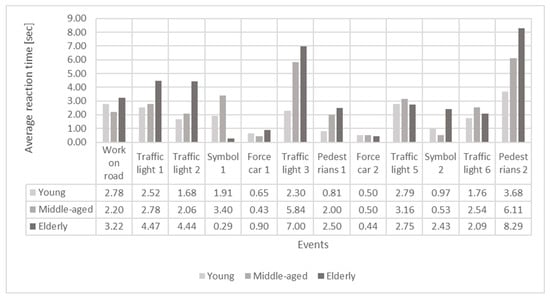
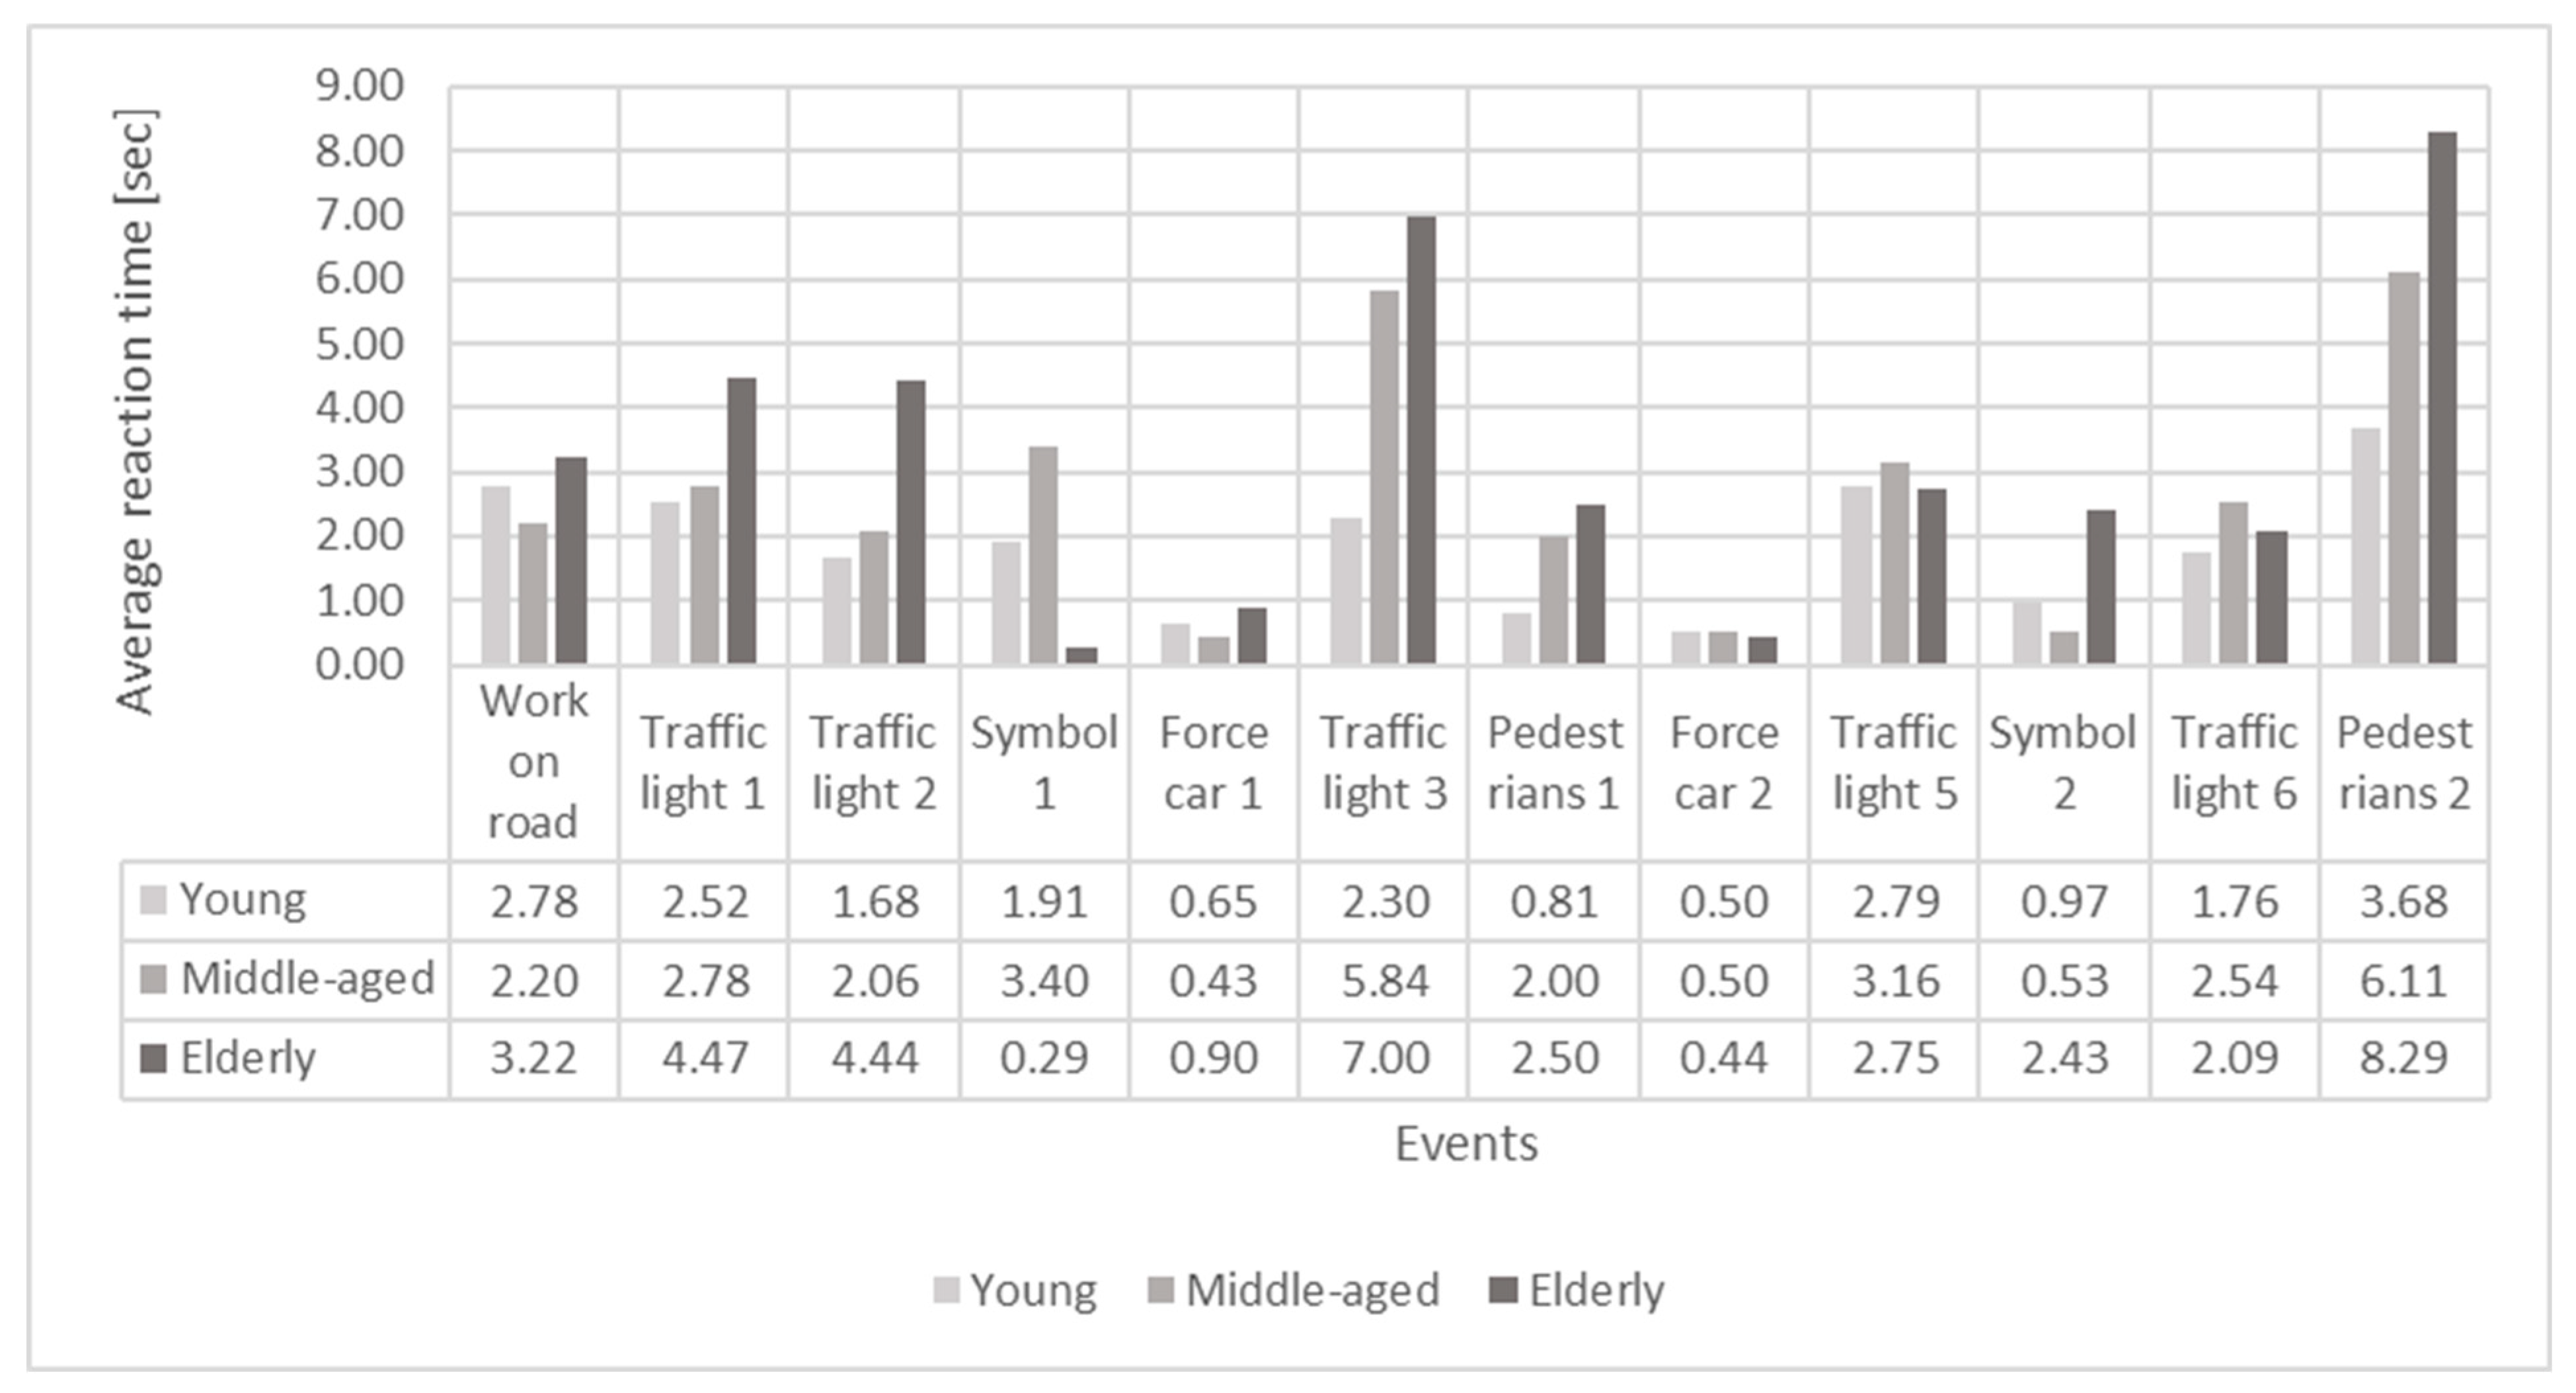
Figure 9 shows the average reaction times of young, middle-aged and elderly drivers. As can be seen, elderly drivers have a 67% longer reaction time than other drivers, and a 74% longer reaction time than young drivers. It is worth noting that, during the event when it would have been possible to cause a traffic accident (Force car 2), middle-aged and young drivers had the same reaction time, i.e., 0.50 s on average.
Figure 9.
Average reaction times [s] of young, middle-aged and elderly drivers. Events are listed on the x-axis.
Considering all participants, elderly people needed the longest reaction time to notice pedestrians that were not directly interacting with them (Pedestrian 2). During this event, elderly drivers recorded a reaction time of 8.29 s, middle-aged drivers 6.11 s, and young drivers an average of 3.68 s. All drivers had the shortest reaction times during the two “Force car 1” and “Force car 2” events, when they could have caused a road accident.
The shortest reaction time for elderly drivers was recorded at Symbol 1, namely 0.29 s on average. Next comes the reaction time of young drivers, 1.91 s, followed by the time for middle-aged drivers—3.40 s.
An interesting event in the analysis is “Traffic light 3”. In this time gap, many key moments occur: when approaching the intersection, a car forces the driver to slow down; after that, symbol 1 appears and pedestrians are approaching the road crossing. During this event, elderly drivers took a much longer time to notice the traffic light. Their reaction time reached 7.00 s. Middle-aged drivers noticed it on average after 5.84 s, and young drivers after 2.30 s.
4.4.2. First Fixation Duration
In the analysis of First Fixation Duration (FFD)—Table 8—ten events were considered: traffic lights 1, 2, 3, 5 and 6; symbols 1 and 2; pedestrians 1 and 2; and road work. The possibilities of causing traffic accidents were not considered in this analysis, since the car forcing the right of way suddenly appeared from the rest of the vehicular flow, belonging to the same AOI and therefore not permitting analysis.
Table 8.
First fixation duration of young, middle-aged and elderly drivers.
On average, the longest FFD was experienced by elderly drivers—60%. These were followed by middle-aged drivers, who had the longest FFD on the elements Road work and Traffic light 3, 0.56 s and 0.79 s, respectively. Middle-aged drivers and young drivers had the same FFD on two elements, both pedestrians. Compared to young drivers, who had the shortest first fixation duration overall, elderly drivers had a 2.17 s longer fixation duration.
It is also important to note how many times elderly drivers had the longest FFD. Table 8 shows that elderly people observed six out of the ten items the longest, accounting for 60% of the items. Traffic light 2 was the element observed the longest, with 1.57 s on average. Elderly drivers paid the least attention to pedestrians, on average only for 0.16 s.
Comparing FFD findings of elderly drivers with their reaction time (Figure 9), it can be noticed that pedestrians (Pedestrians 1 and Pedestrians 2) had the longest reaction time and the smallest first fixation duration, compared to the other drivers. This means that elderly drivers pay the least attention to pedestrians. Their smallest reaction time was for the Symbol 1 and Traffic lights 5 and 6 elements.
Considering Symbol 1, it can be said that, despite their fast reaction time, elderly drivers spent a long time on this element, namely 0.43 s: this is almost three times the time spent observing it by the other age groups. Similar observations were made for traffic lights 5 and 6. This could be explained by the general need of elderly drivers to concentrate longer on individual elements in traffic than other drivers.
4.4.3. Fixation Count
Table 9 shows how many times young, middle-aged and elderly drivers looked at the AoIs during the entire driving simulation. The first column shows the AoIs, and the second, third and fourth columns show the number of times each age group looked at each AoI. The fifth column shows the sum of all fixations on each AoI for all three age groups, i.e., how many times they all looked at a certain element in the entire simulation run. Finally, the last three columns show the percentages of fixations for which young, middle-aged and elderly drivers looked at the AoIs.
Table 9.
Fixation count of young, middle-aged and elderly drivers.
As can be seen, the most observed AoI was the right lane, i.e., the lane in which drivers themselves drive, for a total of 8065 times, which confirms findings in the literature [31] that drivers pay the most attention to the road in front of them. Young drivers looked at it the most, followed by elderly drivers and middle-aged drivers. The next-most fixated AoIs were all moving cars and parked cars. In both cases, elderly drivers paid the most attention to these elements (respectively, 43% and 47% of all fixations on these AoIs), followed by young drivers and middle-aged drivers.
The least observed AoI in the entire driven simulation was the left sidewalk, which was observed only six times, mostly by elderly drivers (five times). Young drivers did not look at the left side of the pavement once during the entire simulation. This follows the gearbox AoI, which was fixated on a total of 104 times, mostly by elderly drivers, 64 times.
Focusing on elderly drivers, Table 10 shows that they have the largest share of fixations on the left sidewalk, 83%, and the smallest share on the speedometer, 16%. For middle-aged drivers, it can be noted that the largest percentage of fixations is 39%, on road works and the left lane, while young drivers looked at the tachometer the most, accounting for 55% of all AoIs. In addition to the right lane, elderly drivers paid much attention to the gearbox, for a total of 64 times. In addition, they fixated the most on the gearbox, the right sidewalk (166 times), parked cars (828 times) and green traffic lights (682 times).
Table 10.
Total fixation duration of young, middle-aged and elderly drivers.
Middle-aged drivers also paid the most attention to the dividing island (49 times) and pedestrians (276 times).
Young drivers looked at the speedometer the most (482 times), followed by mirrors (398 times).
Finally, it can be noticed that elderly drivers have a higher number of fixations than the other age groups, on more than half of all the AoIs (12 on 19 AoIs).
4.4.4. Total Fixation Duration
Table 10 shows the total average times young, middle-aged and elderly drivers spent on each AoI. The maximum TFD was spent on the right lane, i.e., 295.7 s (approx. 5 min). The AoI with the next-largest TFD was moving cars with 73.8 s, followed by parked cars with 63.2 s. The minimum TFD was for the left sidewalk, 0.2 s, followed by the gearbox with 2.1 s. As expected, the average times fixating on AoIs are in accordance with the FC results.
4.4.5. Average Fixation Duration
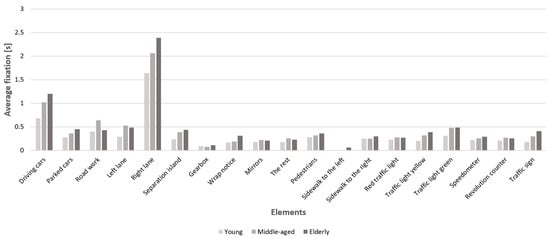
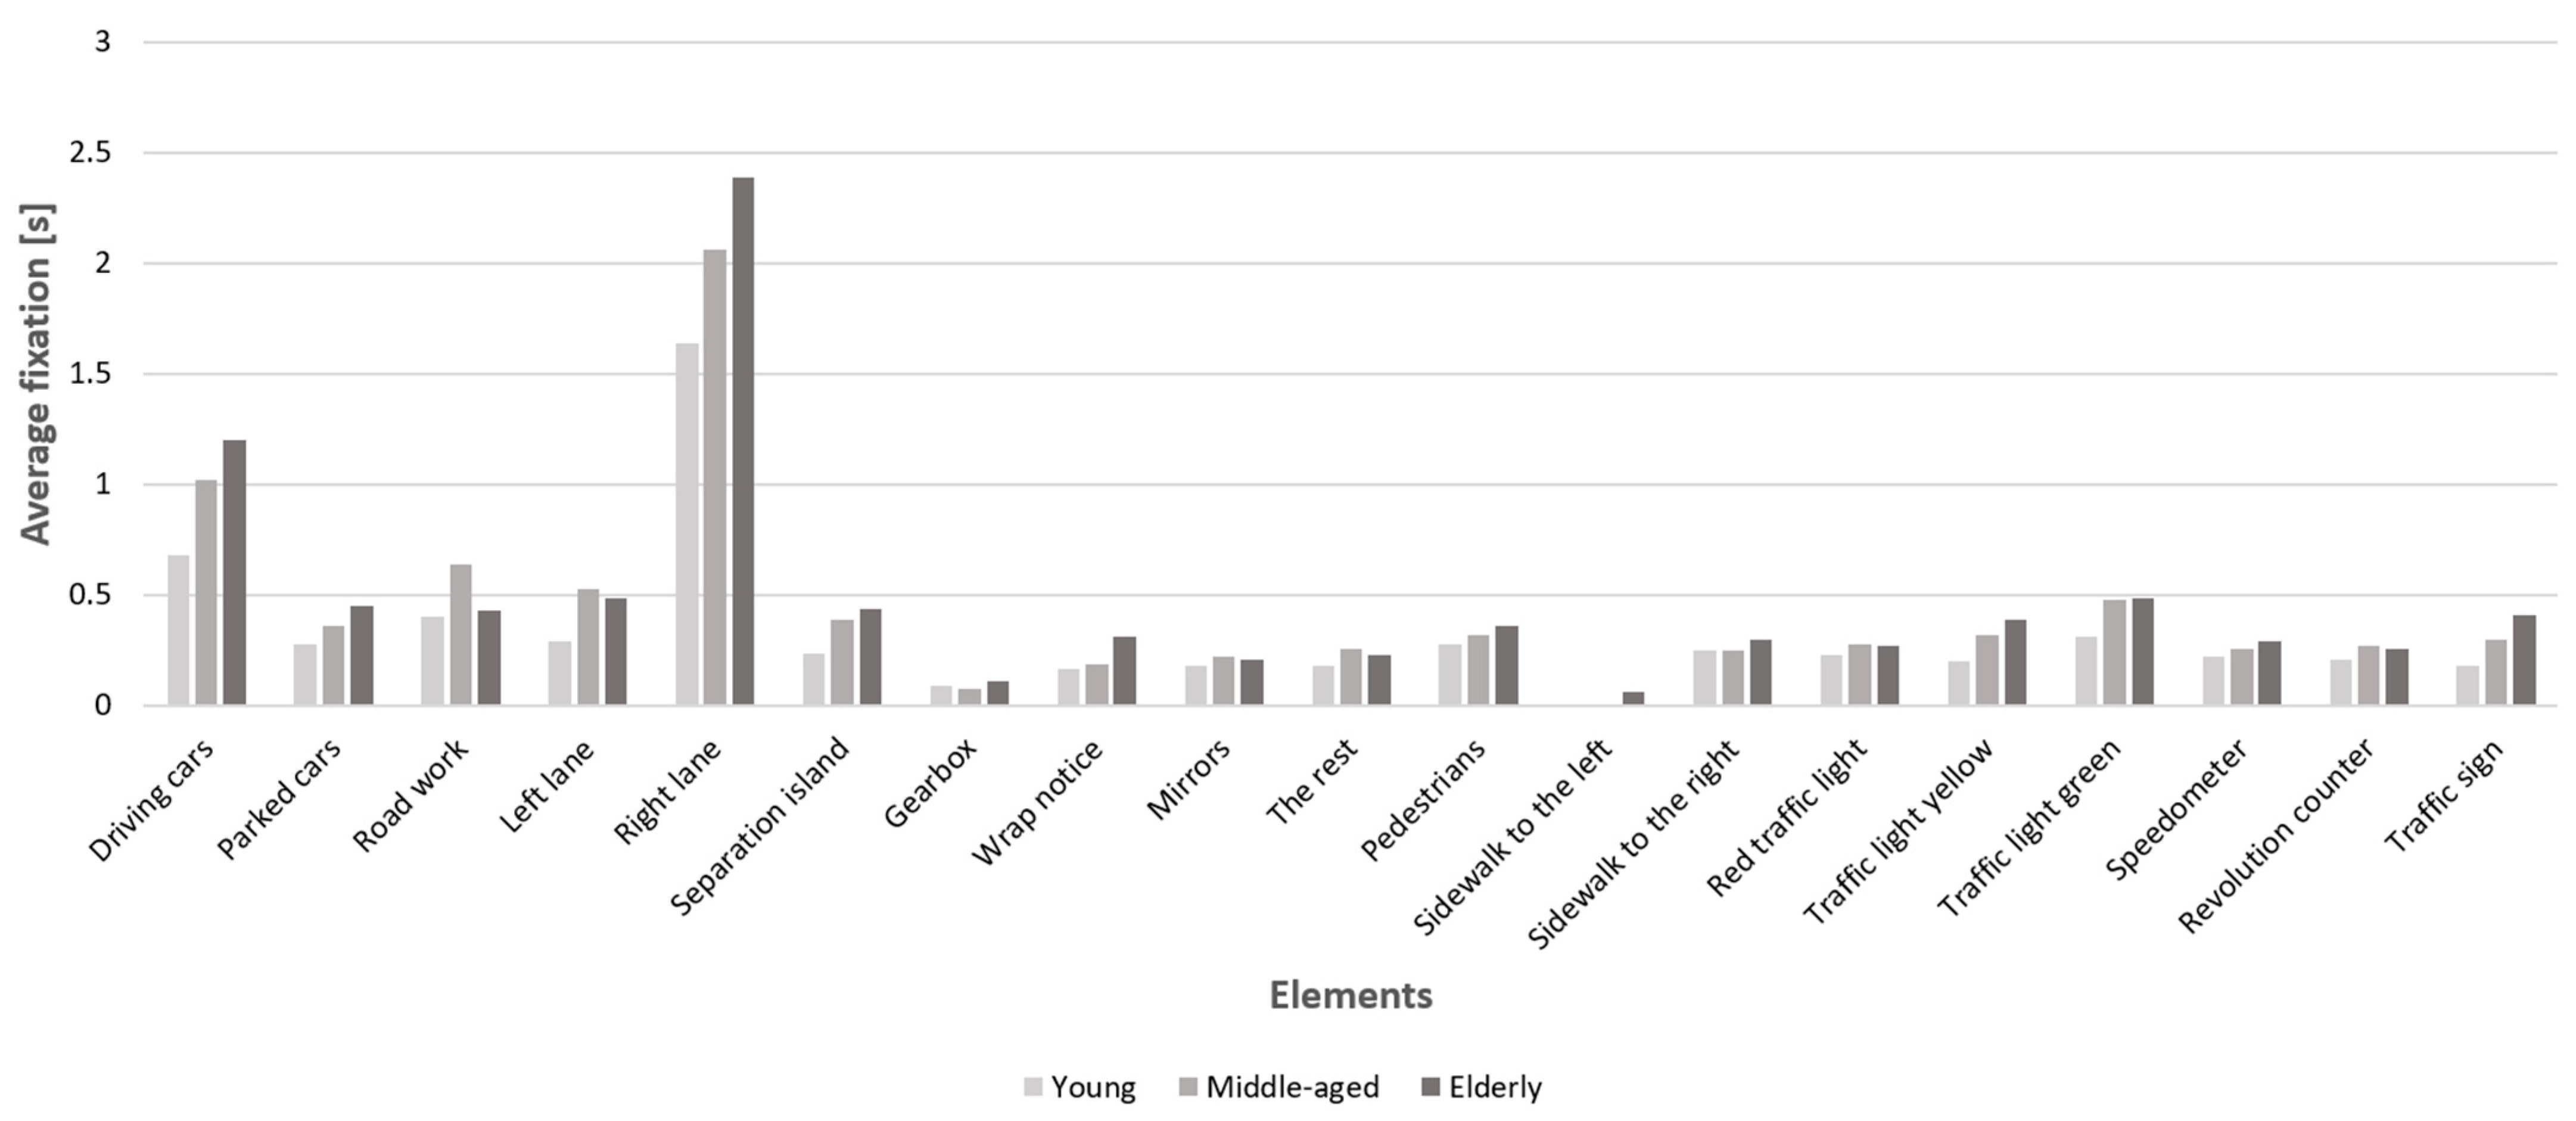
Figure 10 shows the average fixation times for the entire ride on the simulator. Young drivers had the shortest average fixation time, 6.04 s, while elderly drivers had the longest average fixation time, 9.07 s. Comparing average fixation time on all elements, it was found observed that elderly drivers had approximately 68% longer average fixation on elements than young drivers.
Figure 10.
Average fixation duration of young, middle-aged and elderly drivers.
All drivers dedicated the highest average fixation time to the right lane element. Young drivers had an average time of 1.64 s, middle-aged 2.06 s and elderly drivers 2.39 s. Conversely, the lowest average fixation time for all drivers was on the sidewalk to the left element. As was to be expected, all drivers spent most of their average fixation time on the closest element, paying less attention to those that were further away.
5. Discussion
Various observations can be made by comparing the main findings of each part of the presented research. The responses to the questionnaire highlighted that, although elderly drivers are the ones covering the lowest amount of km travelled per year, they are the most likely to cause an accident. This was also confirmed by the road accident analysis, which showed an increase in the accidents caused by elderly drivers in recent years. The road accident analysis also underlined that road accidents caused by elderly drivers usually happen during warm months, in sunny or cloudy weather conditions and during later morning hours. Similar patterns have also been identified in U.S.-based analyses, where it was found that the majority of fatal crashes involving older drivers in 2022 occurred during the daytime (72%), on weekdays (70%), and in multi-vehicle collisions (67%). These findings suggest distinct situational risk patterns associated with older drivers [4]. Similar results were also found by Clarke et al. [8], who found that most traffic accidents occur around 12–16 PM. Also, [2] shows that most elderly fatalities are from 9 to 11 AM, and in the late afternoon from 3 to 6 PM. This could be explained by elderly drivers potentially feeling safer during normal external conditions (i.e., no bad weather, slippery roads, etc.), and remembering the type of tasks they usually perform. These results were also confirmed by the elderly people surveyed, who indicated that they generally prefer to go out in the time slots mentioned.
An interesting finding is that, according to the questionnaire responses, elderly people prefer to drive in urban areas, while the road accident analysis showed that most of the accidents caused by elderly drivers happen in this environment. Similar data were reported by Thompson et al., who found that urban drivers have a higher number of crashes [32]. An explanation for this is given by the driving simulator trial, which highlighted the difficulty for elderly people to concentrate on multiple events and interactions when they are happening at the same time, which could lead to them missing some elements and, consequently, to a possible collision. Also, most of the accidents are caused by not respecting priority rules, indicating a possible lack of knowledge as well as lower cognitive skills, and by uncontrolled vehicular movements, leading to side collisions or collisions with parked vehicles, which could be related to restrained use of rear-view mirrors, which was also observed in the driving simulator trial. Similar results regarding lack of knowledge about road traffic regulations were reported by Payyanadan et al. [33], who found in their research that older drivers face challenges related to lack of knowledge about certain road traffic rules or safe execution of maneuvers. In addition, Kajiwara et al. [9] and Parker et al. [13] discovered that cognitive abilities deteriorate with aging, especially in complex tasks. Similar data regarding mirror checking were reported by Wang et al., who discovered that elderly drivers pay less attention to the rearview mirror. Such behavior increases the risk of a traffic accident [16]. These results confirm that, over the years, knowledge of road traffic regulations slowly deteriorates. This can be attributed to the fact that traffic rules are forgotten over time, especially those that are not used every day or that are not encountered often. In addition, there are also new traffic regulations, and changes to traffic signs and rules, which cause confusion, especially for elderly drivers.
Focusing on the results of the driving simulator trial, by comparing the longitudinal speed mean values and the responses to the survey, it can be stated that elderly drivers do not drive slower because they are afraid of speed: indeed, eight out of ten elderly respondents indicated that they were not afraid of high speed. Nevertheless, in simulator trials, they kept to significantly lower average speeds than the speed limit posed by the simulation (70 km/h), and even lower than the speeds of the other participants. Similar data were presented by Kajiwara, et al., who confirmed that elderly drivers drive slower, with an average speed of 9.89 m/s, in comparison to younger drivers, who drive in average 10.86 m/s [9]. In addition, similar findings were reported by Wang et al. [16], Nishida [11] and Milleville-Pennel et al. [7]. It could be supposed that elderly drivers tend to keep to such low speeds because, as mentioned, they are not able to process multiple important external inputs simultaneously. This fact was also confirmed by the number of elements that were overlooked by elderly drivers in the simulation. A further result that could confirm the need of elderly drivers to focus for longer on fewer elements is the number and duration of their fixations. These confirm that elderly drivers spend the longest time observing elements in traffic: 68% of all AoIs were observed for longer by elderly drivers than by other drivers. Compared to young drivers, who had the shortest total fixation time, elderly drivers had a 55% longer total fixation time. Also, it was found that the average fixation time on a single element increased with increasing age: young drivers had the fewest fixations on a single element for all 19 elements. Elderly drivers had the highest mean fixation time on more than half of the items, representing 63%. Related to this are the results for reaction time, which also increases with increasing age, with elderly drivers having the longest reaction time among all participants. Hand-in-hand with their reaction times are the durations of their first fixations, which are also the longest among all participants. This fact can be explained by the need of elderly people to focus deeply on an element as it appears, which keeps most of their attention, leading to them neglecting other important factors on the road. Also interesting is also the braking behavior of the participants: despite their slower driving, elderly drivers, compared to the others, used the highest pressure on the brakes, indicating that they perceived the need for a fast vehicular response. Finally, it was observed that, while paying much attention to the elements of the road, e.g., the lane, other vehicles, etc.), elderly drivers neglect to look at pedestrians and elements of the vehicle, especially the rear-view mirrors.
6. Conclusions
This research presented a driving simulator experiment aimed at understanding patterns in the driving behavior of elderly drivers by comparing them to the behavior of younger generations. The research, composed of several steps, i.e., an initial road accident analysis, a survey and a driving simulator trial with participants also equipped with eye-tracking glasses, highlighted various aspects of elderly driving and gaze behavior which are important for road safety. These can be summarized in three main findings:
- Lower knowledge of road traffic regulations. As the survey showed, elderly drivers have a poorer knowledge of road rules, especially of those rules that have changed over the years. They had the biggest problem in recognizing who has right of way at an intersection. This is also confirmed by the traffic accident analysis, which shows that a large number of traffic accidents occur when elderly drivers lose the right of way or do not follow the traffic rules.
- Slower reactions and the need to focus on one element at a time, overlooking many other road factors.
- Higher risk of road collisions caused by elderly drivers in parking lots and at intersections.
To avoid the first issue, it could be suggested to introduce mandatory training after a certain period (e.g., every five years after age 70) to refresh elderly people’s knowledge of traffic regulations. This could be partially subsidized by the State or by insurance companies as part of their road safety policies.
To reduce the number of road accidents at intersections, unsignalized intersections, where the need to judge when to give priority is higher, could be replaced by signalized intersections or roundabouts, and the latter could be gradually replaced by turbo-roundabouts, to reduce the number of conflict points. Similarly, since many accidents happen in parking lots, specific areas dedicated to elderly drivers could be introduced in the immediate vicinity of the entrances to buildings.
Finally, to improve the attention paid by elderly drivers to their surroundings, various countermeasures could be added, e.g., a greater number of raised and colored crosswalks would improve the attention paid to crossing pedestrians, and vertical signs with fluorescent backgrounds could improve the visibility of signalization for elderly drivers.
Of course, more transportation options, leading to a modal shift of elderly people from private cars to other vehicles, would be beneficial: to achieve this, better public transportation should be ensured, with a high coverage of the services needed by the elderly and with a suitably high frequency, as well as soft policies to encourage the use of all the existing public options.
While the findings of this study offer valuable insights into the behavior of elderly drivers, several limitations must be acknowledged. The experimental sample consisted of only 30 participants, with 10 individuals in each age group (balanced by gender: five males and five females). A larger and more diverse sample would allow generalization of the results and enable more robust conclusions regarding age-related differences in driving behavior.
Additionally, the entire experiment was conducted in a controlled laboratory setting. While this allowed a high degree of experimental control, it may not fully reflect real-world driving conditions. Future research could benefit from a hybrid approach, combining laboratory simulations with field-based studies in naturalistic driving environments to validate or contrast the findings.
A technological limitation that should be considered, especially when analyzing eye-tracking data, is the lack of data from peripheral vision and its influence on driving performance. Furthermore, while subjective self-reports gathered through questionnaires provided useful data, they may be susceptible to response bias and individual interpretation, which can affect the accuracy of self-assessed driving knowledge or habits.
A significant challenge in the presented traffic accident analysis was the limited availability of data regarding driver distraction. As a matter of fact, the Slovenian accident database, as with the majority of official accident databases, relies on Police reports, which do not usually include indicators of inattention such as mobile phone use or other cognitive distractions at the time of the incident. Future research should aim to integrate these data and other useful information from additional sources, such as insurance companies or hospital records, to obtain a more comprehensive picture of accident causality.
Lastly, in the driving simulator trial, participants were evaluated based on standard, uninterrupted driving tasks. While this provided a general overview of their driving performance, future studies should consider analyzing specific maneuvers, such as overtaking, merging or navigating intersections, in more detail. This would allow researchers to better understand the cognitive and perceptual demands associated with critical driving situations, especially among elderly drivers.
Supplementary Materials
The following supporting information can be downloaded at: https://www.mdpi.com/article/10.3390/su17177927/s1, English translation of the questionnaire. Ref. [34] is cited in Supplementary Materials.
Author Contributions
Conceptualization, C.G., T.T.; methodology, A.P., C.G., T.T.; formal analysis, A.P.; investigation, A.P., C.G.; data curation, A.P.; writing—original draft preparation, A.P.; writing—review and editing, A.P., C.G.; visualization, A.P.; supervision, C.G., T.T. All authors have read and agreed to the published version of the manuscript.
Funding
This research received no external funding.
Institutional Review Board Statement
The study was conducted in accordance with the Declaration of Helsinki and approved by the Institutional Ethics Committee of University of Maribor, Faculty of Civil Eng., Transportation Eng. and Architecture (5-275/2025, 14/8/2025).
Informed Consent Statement
Informed consent was obtained from all subjects involved in the study.
Data Availability Statement
Dataset available on request from the authors.
Conflicts of Interest
The authors declare no conflicts of interest.
References
- SWOV. Sustainable Safety 3rd Edition—The Advanced Vision for 2018–2030. Available online: https://swov.nl/system/files/publication-downloads/dv3_en_kort_rapport.pdf (accessed on 18 June 2025).
- European Road Safety Observatory Facts and Figures–Seniors–2023. Available online: https://road-safety.transport.ec.europa.eu/system/files/2023-02/ff_seniors_20230213.pdf (accessed on 24 February 2025).
- Road Trauma Australia 2022 Statistical Summary. Available online: https://www.bitre.gov.au/sites/default/files/documents/road_trauma_2022.pdf (accessed on 11 June 2025).
- 2022 Older Population Traffic Safety Facts. Available online: https://crashstats.nhtsa.dot.gov/Api/Public/ViewPublication/813616 (accessed on 11 June 2025).
- Thorslund, B.; Ahlström, C.; Peters, B.; Eriksson, O.; Lidestam, B.; Lyxell, B. Cognitive workload and visual behavior in elderly drivers with hearing loss. Eur. Transp. Res. Rev. 2014, 6, 377–385. [Google Scholar] [CrossRef] [Scilit]
- Hakamies-Blomqvist, L.; Peters, B. Recent European research on older drivers. Accid. Anal. Prev. 2000, 4, 604–607. [Google Scholar] [CrossRef] [Scilit]
- Milleville-Pennel, I.; Marquez, S. Comparison between elderly and young drivers’ performances on a driving simulator and self-assessment of their driving attitudes and mastery. Accid. Anal. Prev. 2020, 135, 105317. [Google Scholar] [CrossRef] [Scilit]
- Clarke, D.D.; Ward, P.; Bartle, C.; Truman, W. Older drivers’ road traffic crashes in the UK. Accid. Anal. Prev. 2010, 4, 1018–1024. [Google Scholar] [CrossRef] [Scilit]
- Kajiwara, Y.; Murata, E. Effect of Behavioral Precaution on Braking Operation of Elderly Drivers under Cognitive Workloads. Sensors 2022, 22, 5741. [Google Scholar] [CrossRef] [Scilit]
- Nakagawa, Y.; Park, K.; Kumagai, Y. Elderly drivers’ everyday behavior as a predictor of crash involvement-Questionnaire responses by drivers’ family members. Accid. Anal. Prev. 2013, 50, 397–404. [Google Scholar] [CrossRef] [Scilit] [PubMed]
- Nishida, Y. Driving characteristics of the elderly: Risk compensation of the elderly driver from the viewpoint of reaction behavior. JSAE Rev. 1999, 20, 375–380. [Google Scholar] [CrossRef] [Scilit]
- Singh, H.; Kathuria, A. Analyzing driver behavior under naturalistic driving conditions: A review. Accid. Anal. Prev. 2020, 150, 105908. [Google Scholar] [CrossRef] [Scilit]
- Parker, D.; McDonald, L.; Rabbitt, P.; Sutcliffe, P. Elderly drivers and their accidents: The Aging Driver Questionnaire. Accid. Anal. Prev. 2000, 32, 751–759. [Google Scholar] [CrossRef] [Scilit]
- Martinussen, L.M.; Hakamies-Blomqvist, L.; Møller, M.; Özkan, T.; Lajunen, T. Age, gender, mileage and the DBQ: The validity of the Driver Behavior Questionnaire in different driver groups. Accid. Anal. Prev. 2013, 52, 228–236. [Google Scholar] [CrossRef] [Scilit]
- Entezarizarch, E.; Zakerian, S.A.; Madreseh, E.; Abbasinia, M.; Abdi, H. Comparative analysis of mental workload and performance between young and elderly drivers: Implications for road safety and age-related driving challenges. Work A J. Prev. Assess. Rehabil. 2025, 81, 3088–3098. [Google Scholar] [CrossRef] [Scilit] [PubMed]
- Wang, Y.; Feng, R.; Bao, D. Effect of cognitive-behavioral therapy for the elderly on driving behavior and emotional state: A randomized controlled trial. CCF Trans. Pervasive Comput. Interact. 2023, 5, 139–156. [Google Scholar] [CrossRef] [Scilit]
- Kim, B.S.; Yi, Y.C.; Kim, H.W.; Lim, D.H.; Bak, M.S.; Ji, D.H.; Hong, S.H.; Kang, J.K.; Min, B.C.; Min, Y.K. The Characteristics of Elderly Drivers’ Driving Behavior on Intersection Using Graphic Driving Simulator. J. Ergon. Soc. Korea 2010, 29, 611–617. [Google Scholar] [CrossRef] [Scilit]
- Yonekawa, T.; Sasaki, K.; Iwazaki, K. Driving Behavior Analysis of Elderly Drivers Passing Through Stop Sign Intersection Using Driving Simulator. Int. J. Automot. Eng. 2014, 5, 137–144. [Google Scholar] [CrossRef] [Scilit]
- Biernacki, M.P.; Lewkowicz, R. How do older drivers perceive visual information under increasing cognitive load? Significance of personality on-road safety. Accid. Anal. Prev. 2021, 157, 106186. [Google Scholar] [CrossRef] [Scilit]
- Chen, B.; Zhao, X.; Li, Y.; Gong, J.; Liu, X. How does older and younger drivers’ risk cognition affect the safety performance: A driving simulator study of sudden lane-changing of the leading vehicle. J. Transp. Saf. Secur. 2024, 16, 633–654. [Google Scholar] [CrossRef] [Scilit]
- Costello, M.C.; Barco, P.P.; Manning, K.J.; O’Brien, K.E. Older adult driving performance assessed under simulated and on-road conditions. Appl. Neuropsychol. Adult 2024, 31, 742–753. [Google Scholar] [CrossRef] [Scilit]
- Kaneko, K.; Oikawaa, S.; Matsui, Y.; Kubota, N. Elderly drivers’ behaviour due to indication of pedestrian information by HMI. Int. J. Crashworthiness 2024, 29, 838–847. [Google Scholar] [CrossRef] [Scilit]
- Wynne, R.A.; Beanland, V.; Salmon, P.M. Systematic review of driving simulator validation studies. Saf. Sci. 2019, 117, 138–151. [Google Scholar] [CrossRef] [Scilit]
- Keskinen, E.; Hiro, O.; Katila, A. Older drivers fail in intersections: Speed discrepancies between older and younger male drivers. Accid. Anal. Prev. 1998, 30, 323–330. [Google Scholar] [CrossRef] [Scilit]
- Zhu, Y.; Jiang, M.; Yamamoto, T. Personality, functional performance, and travel patterns related to older drivers’ risky driving behavior: A naturalistic driving study. Accid. Anal. Prev. 2025, 209, 107833. [Google Scholar] [CrossRef] [Scilit]
- Skyving, M.; Berg, H.Y.; Laflamme, L. A pattern analysis of traffic crashes fatal to older drivers. Accid. Anal. Prev. 2009, 41, 253–258. [Google Scholar] [CrossRef] [Scilit] [PubMed]
- DriveSimSolutions. Driving Simulator. Available online: https://drivesimsolutions.com/driving-simulators/ (accessed on 10 July 2025).
- Tobii. Available online: https://www.tobii.com/products/discontinued/tobii-pro-glasses-2 (accessed on 17 July 2025).
- Carr, D.B.; Grover, P. The Role of Eye Tracking Technology in Assessing Older Driver Safety. Geriatrics 2020, 5, 36. [Google Scholar] [CrossRef] [Scilit]
- Javna Agencija Republike Slovenije za Varnost Prometa. Available online: http://nesrece.avp-rs.si/ (accessed on 15 December 2024).
- Deng, T.; Yang, K.; Li, Y.; Yan, H. Where does the driver Look? Top-Down-Based saliency detection in a traffic driving environment. IEE Trans. Intell. Transp. Syst. 2016, 17, 2051–2062. [Google Scholar] [CrossRef] [Scilit]
- Thompson, J.P.; Baldock, M.R.J.; Mathias, J.L.; Wundersitz, L.N. Older drivers in rural and urban areas: Comparisons of crash, serious injury, and fatality rates. In Proceedings of the Australasian Road Safety Research, Policing and Education Conference, Canberra, Australia, 31 August–3 September 2010. [Google Scholar]
- Payyanadan, R.P.; Lee, J.D.; Grepo, L.C. Challenges for older drivers in urban, suburban and rural settings. Geriatrics 2018, 3, 14. [Google Scholar] [CrossRef] [Scilit]
- Vozniski-Izpit.com. Portal Varnih Voznikov. Available online: https://vozniski-izpit.com/cpp/cpp-testi/kategorija-b/ (accessed on 5 February 2024).

Disclaimer/Publisher’s Note: The statements, opinions and data contained in all publications are solely those of the individual author(s) and contributor(s) and not of MDPI and/or the editor(s). MDPI and/or the editor(s) disclaim responsibility for any injury to people or property resulting from any ideas, methods, instructions or products referred to in the content. |
© 2025 by the authors. Licensee MDPI, Basel, Switzerland. This article is an open access article distributed under the terms and conditions of the Creative Commons Attribution (CC BY) license (https://creativecommons.org/licenses/by/4.0/).