Article

Experimental Investigation of the Effects of Moisture Levels on Geocomposite Drainage–Geomembrane Interface Shear Behavior


1
School of Mechanics and Engineering Science, Shanghai University, Shanghai 200444, China
2
School of Engineering, University of Virginia, Charlottesville, VA 22904, USA
*
Author to whom correspondence should be addressed.
Sustainability 2025, 17(17), 7850; https://doi.org/10.3390/su17177850
Submission received: 8 July 2025 / Revised: 4 August 2025 / Accepted: 27 August 2025 / Published: 31 August 2025

Abstract

Engineered landfill covers are vital for environmental sustainability. This study investigates the shear behaviors of geocomposite drainage (GCD) and geomembrane (GM) interfaces—smooth (GMS), impinged texture (GMTI), and embossed texture (GMTE)—under 10, 30, and 50 kPa of normal stress and 0%, 50%, and 100% moisture levels using large-scale direct shear tests. All interfaces showed strain-softening behavior. At 50 kPa and 0% moisture, GCD–GMTI had the highest peak strength (28 kPa), whereas GCD–GMS had the lowest (10 kPa) at 100% moisture. Moisture and normal stress showed a coupling effect, reducing strength and friction angle. At a 0% moisture level, the strength of the GCD–GMS and GCD–GMTI interfaces under 50 kPa of normal stress was 500% and 250% of that at 10 kPa, respectively; at a 100% moisture level, these proportions decreased to 310% and 230%, respectively. For GCD–GMTE, the ratio slightly increased from 3.0 to 3.2, indicating better wet performance. Texture significantly affected strength: peak strength at 50 kPa was reduced by 41% (GCD–GMS), 16% (GCD–GMTI), and 26% (GCD–GMTE) as moisture increased from 0% to 100%. Large displacement (LD)-to-peak ratios were 0.8–0.9 (GCD–GMS), 0.7–0.8 (GCD–GMTI), and up to 1.0 (GCD–GMTE). Friction angles were reduced from 18° to 9°, 23° to 18°, and 18° to 14° for GCD–GMS, GCD–GMTI, and GCD–GMTE, respectively. Vertical deformation was <0.6 mm. Shear mechanisms depended on texture and moisture. Microscopic and 3D scans revealed moisture-induced GMTI smoothing, reducing interlocking and strength.

1. Introduction

Sustainable solid waste management is a critical global challenge, and engineered landfill cover systems play an essential role in advancing environmental sustainability. These systems are designed to minimize water infiltration, control landfill gas emissions, and enhance the long-term structural stability of waste containment [1,2,3,4,5]. By preventing the release of leachates and gases into the surrounding environment, landfill covers contribute directly to the protection of groundwater, air quality, and ecosystem health [6,7].
Modern landfill covers typically incorporate a multilayered structure that combines geosynthetic materials, working synergistically to fulfill both environmental and engineering functions. Among these, geocomposite drainages (GCDs) provide a crucial drainage pathway to relieve pore water pressure and prevent fluid accumulation [8,9,10,11]. High-density polyethylene (HDPE) geomembranes (GMs) serve as the primary hydraulic barrier, effectively isolating waste from the surrounding environment [12]. The interaction between GCDs and GMs plays a decisive role in the mechanical performance and long-term reliability of the landfill cover system [13]. Therefore, ensuring the mechanical integrity and interfacial stability of the GCD–GM interface is essential to achieving durable and sustainable landfill operations [13,14,15,16].
A GCD is typically composed of a drainage core sandwiched between two geotextile layers. Although significant research has focused on the GM–geotextile (GM-GT) interface behavior [17,18,19,20,21], fewer studies have addressed the more complex GCD–GM interface, where the rigid drainage core can introduce additional mechanical interactions. Early work demonstrated that geonets can be embedded into textured geomembranes, significantly influencing the interfacial response [22]. Under high normal stress, mechanical abrasion by the drainage core against the textured geomembrane surface resulted in notable strength degradation, reducing the peak friction angle from 17.4° to 8.6° [23]. The dry GCD–GMT interface exhibits typical strain-softening behavior, with shear displacement inducing texture delamination and rolling-induced surface damage, thereby reducing shear resistance toward a residual large displacement strength [24].
One key factor affecting interface behavior and, by extension, long-term sustainability, is the moisture level of the GCD. Moisture can soften the geotextiles, reduce frictional resistance, and lubricate the interface, ultimately compromising the stability of the cover system [25,26,27,28]. Peak shear strength at the GCD–GMS interface decreased by 26% under wet conditions, highlighting the sensitivity of interface performance to moisture level [29]. In real-world applications, landfill covers are subjected to fluctuating moisture levels caused by rainfall, condensation, or leachate migration, underscoring the importance of designing systems that can maintain their integrity under varying environmental conditions. However, despite its relevance to system durability and sustainability, limited research has systematically examined the effects of the moisture level of GCD and the textured method of GM on the shear behavior of GCD–GM interfaces.
This study investigates the shear behavior of GCD-–GM interfaces under controlled typical moisture levels using large-scale direct shear testing. GCD specimens were conditioned to represent dry (0%), intermediate (50%), and high (100%) moisture levels. Three types of HDPE geomembranes—including smooth (GMS), impinged textured (GMTI), and embossed textured (GMTE)—were selected to assess the influence of surface texture. Three normal stresses (σn = 10, 30, and 50 kPa) were selected based on values commonly reported in the literature to represent typical stress conditions at geosynthetic interfaces within cover liner systems in landfill applications [16,19,30]. The results provide insights into how the moisture level of GCD and the surface texture of GM impact the interface shear strength, vertical displacement, and failure mechanisms, with implications for designing more resilient, long-lasting, and sustainable landfill cover systems.

2. Materials and Methods

2.1. Materials

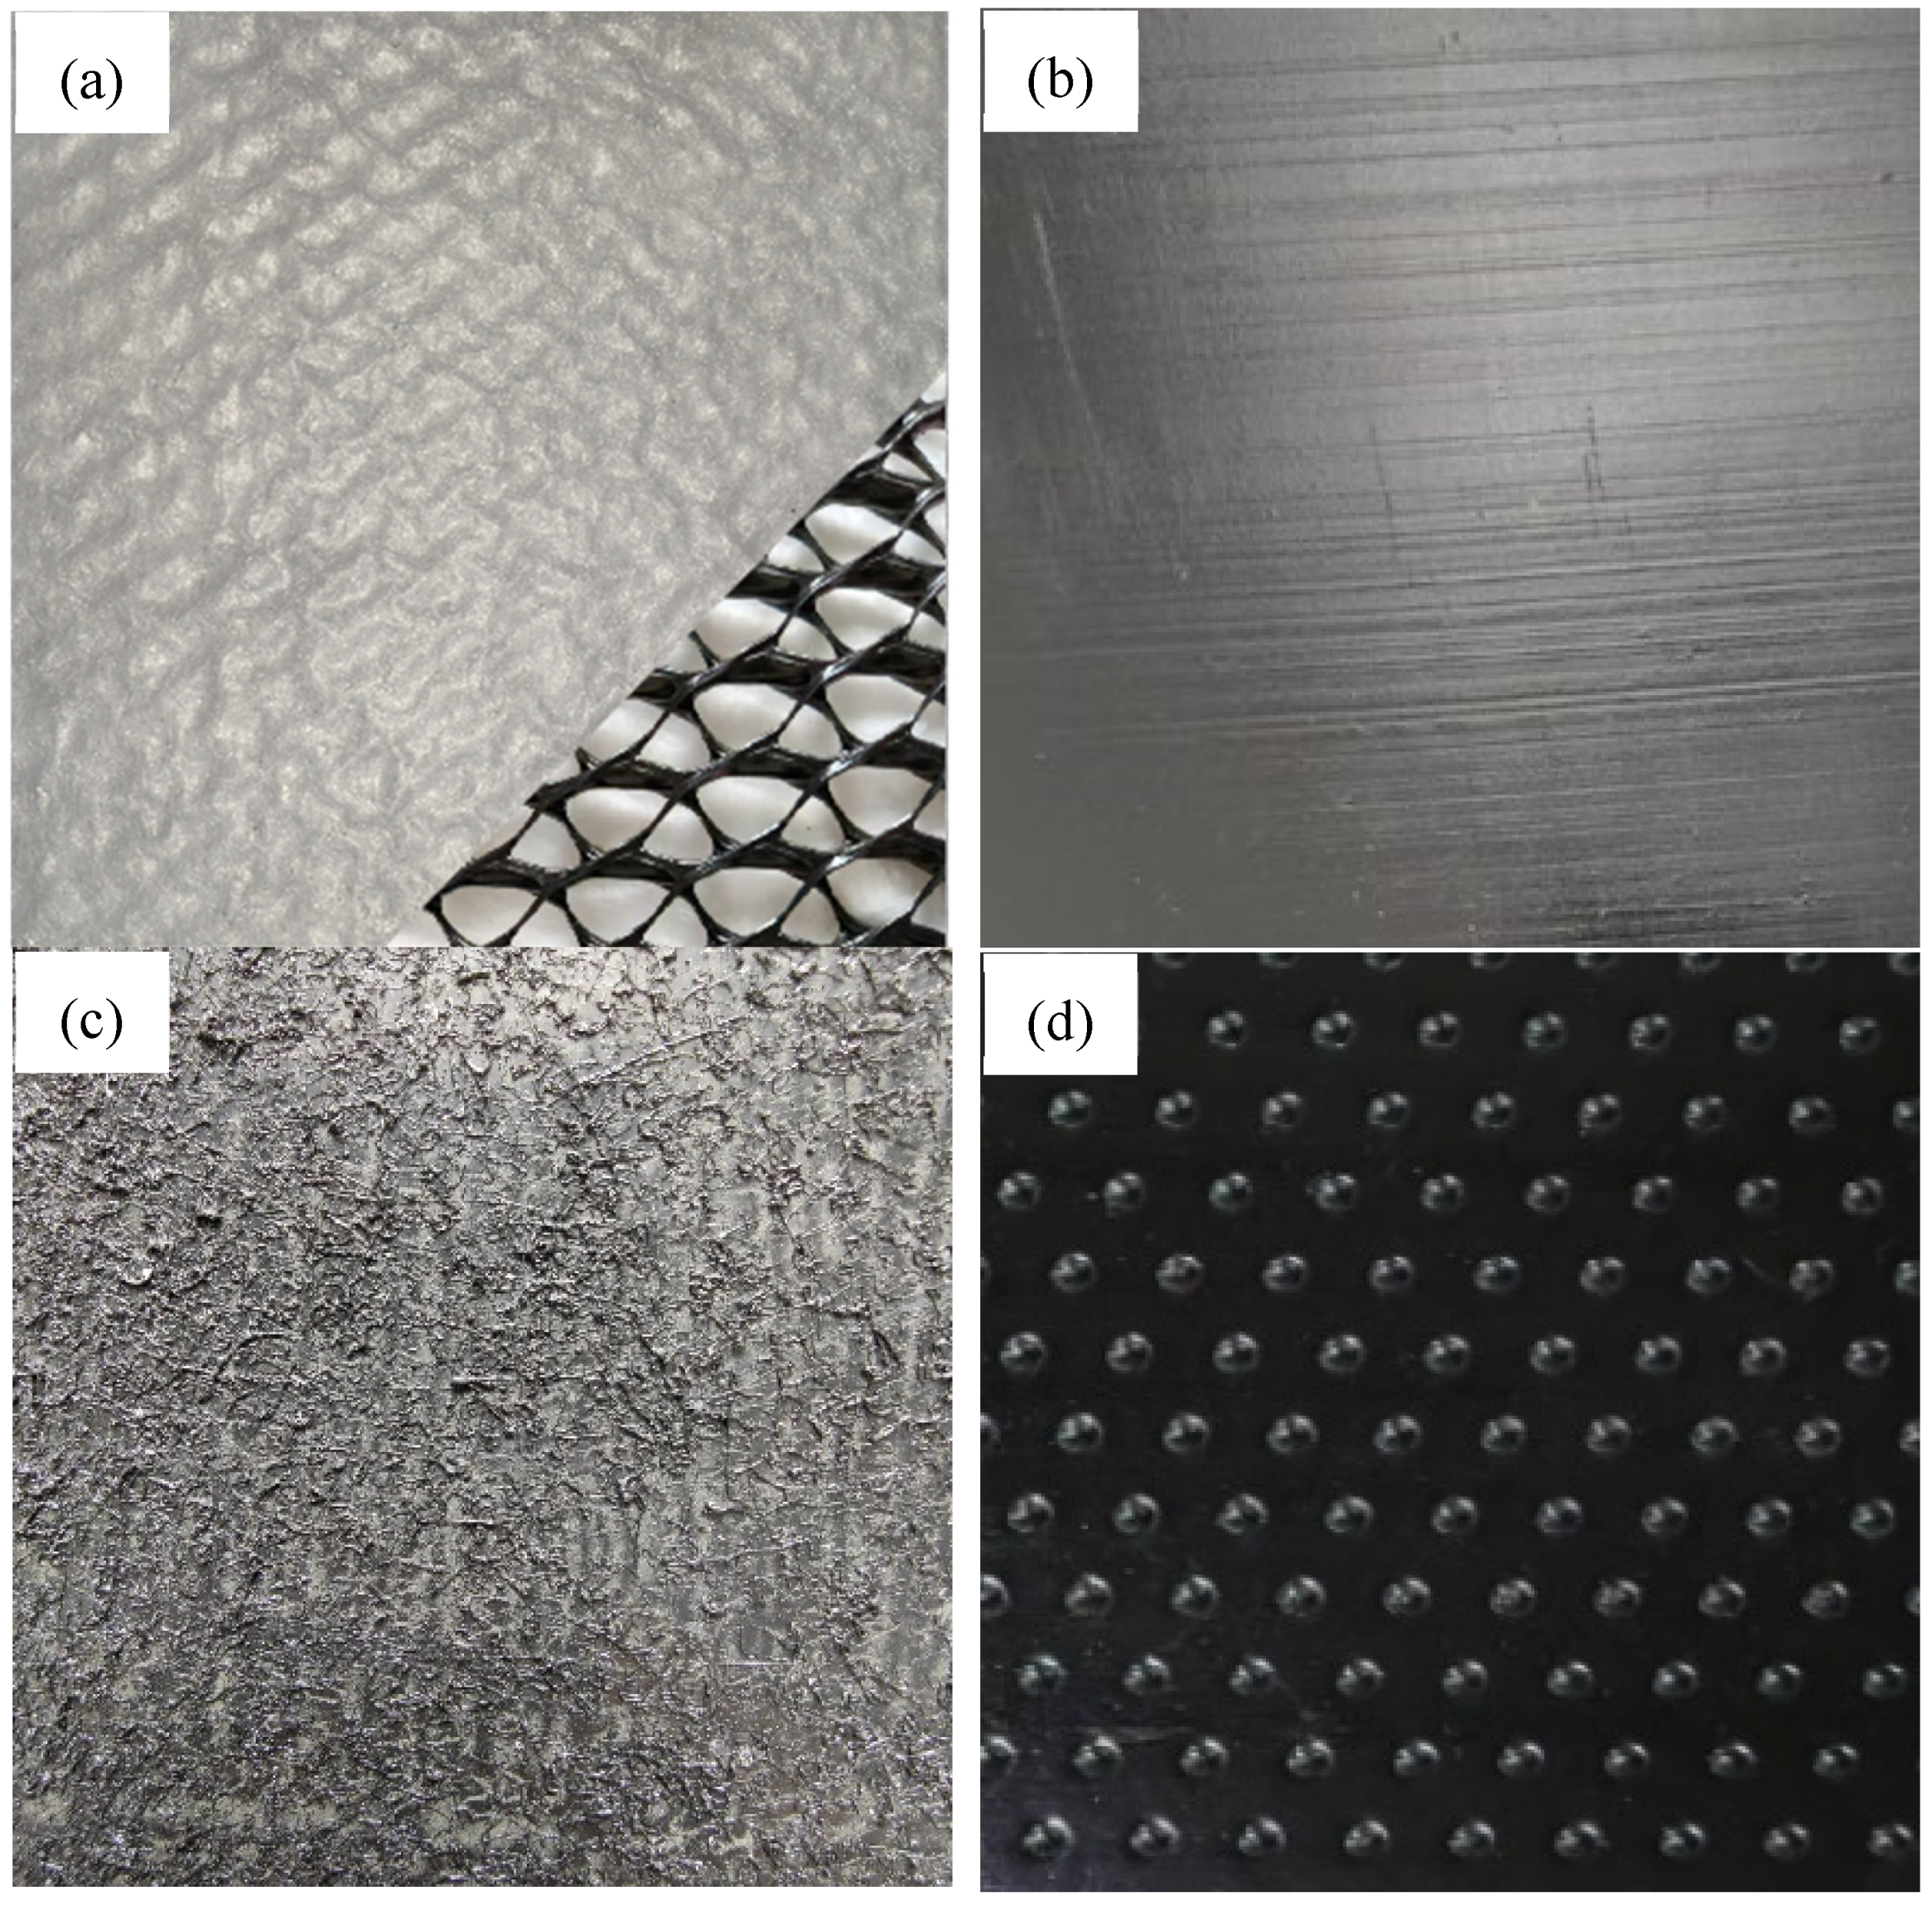
The GCD consists of a three-dimensional internal drainage core sandwiched between the upper and lower layers of nonwoven geotextiles made of polyester, with specific features such as bonding. Each geotextile layer has a mass per unit area of 200 g/m2, as shown in Figure 1a. The GCD has a dry thickness of 8 mm as determined by ASTM D5199 [31], a peel strength of 170 N/m according to ASTM D6496 [32], and a longitudinal tensile strength of 16 kN/m as specified in ASTM D4595 [33]. Three types of high-density polyethylene (HDPE) geomembranes (GMs) were employed: a smooth geomembrane (GMS, Figure 1b), an impinged textured geomembrane (GMTI, Figure 1c), and an embossed textured geomembrane (GMTE, Figure 1d). The GMTI (Figure 1c) is produced by spattering molten polymer onto a smooth surface, creating a highly irregular texture with variable asperities that may be prone to delamination. In contrast, the GMTE (Figure 1d) is formed by pressing a patterned die onto the surface, resulting in uniform, regularly spaced asperities [34]. The nominal thicknesses of GMS, GMTI, and GMTE are 2 mm, 2 mm, and 1.5 mm, respectively, whereas the texture heights of GMs are 0 mm, 0.25 mm, and 0.5 mm. Tensile strength at yield (N/mm) is the stress at which the material begins to deform plastically. It is measured as force per unit width and determined according to standard ASTM D6693 [35]. Tensile elongation at yield or break (%) indicates the material’s ductility and is calculated as the percentage increase in length at yield or break as specified by ASTM D6693 [35]. Asperity height (mm) refers to the average surface roughness measured using profilometry or microscopy, following standard ASTM D5994 [36]. These physical properties of the geomembranes are summarized in Table 1.

2.2. Test Apparatus

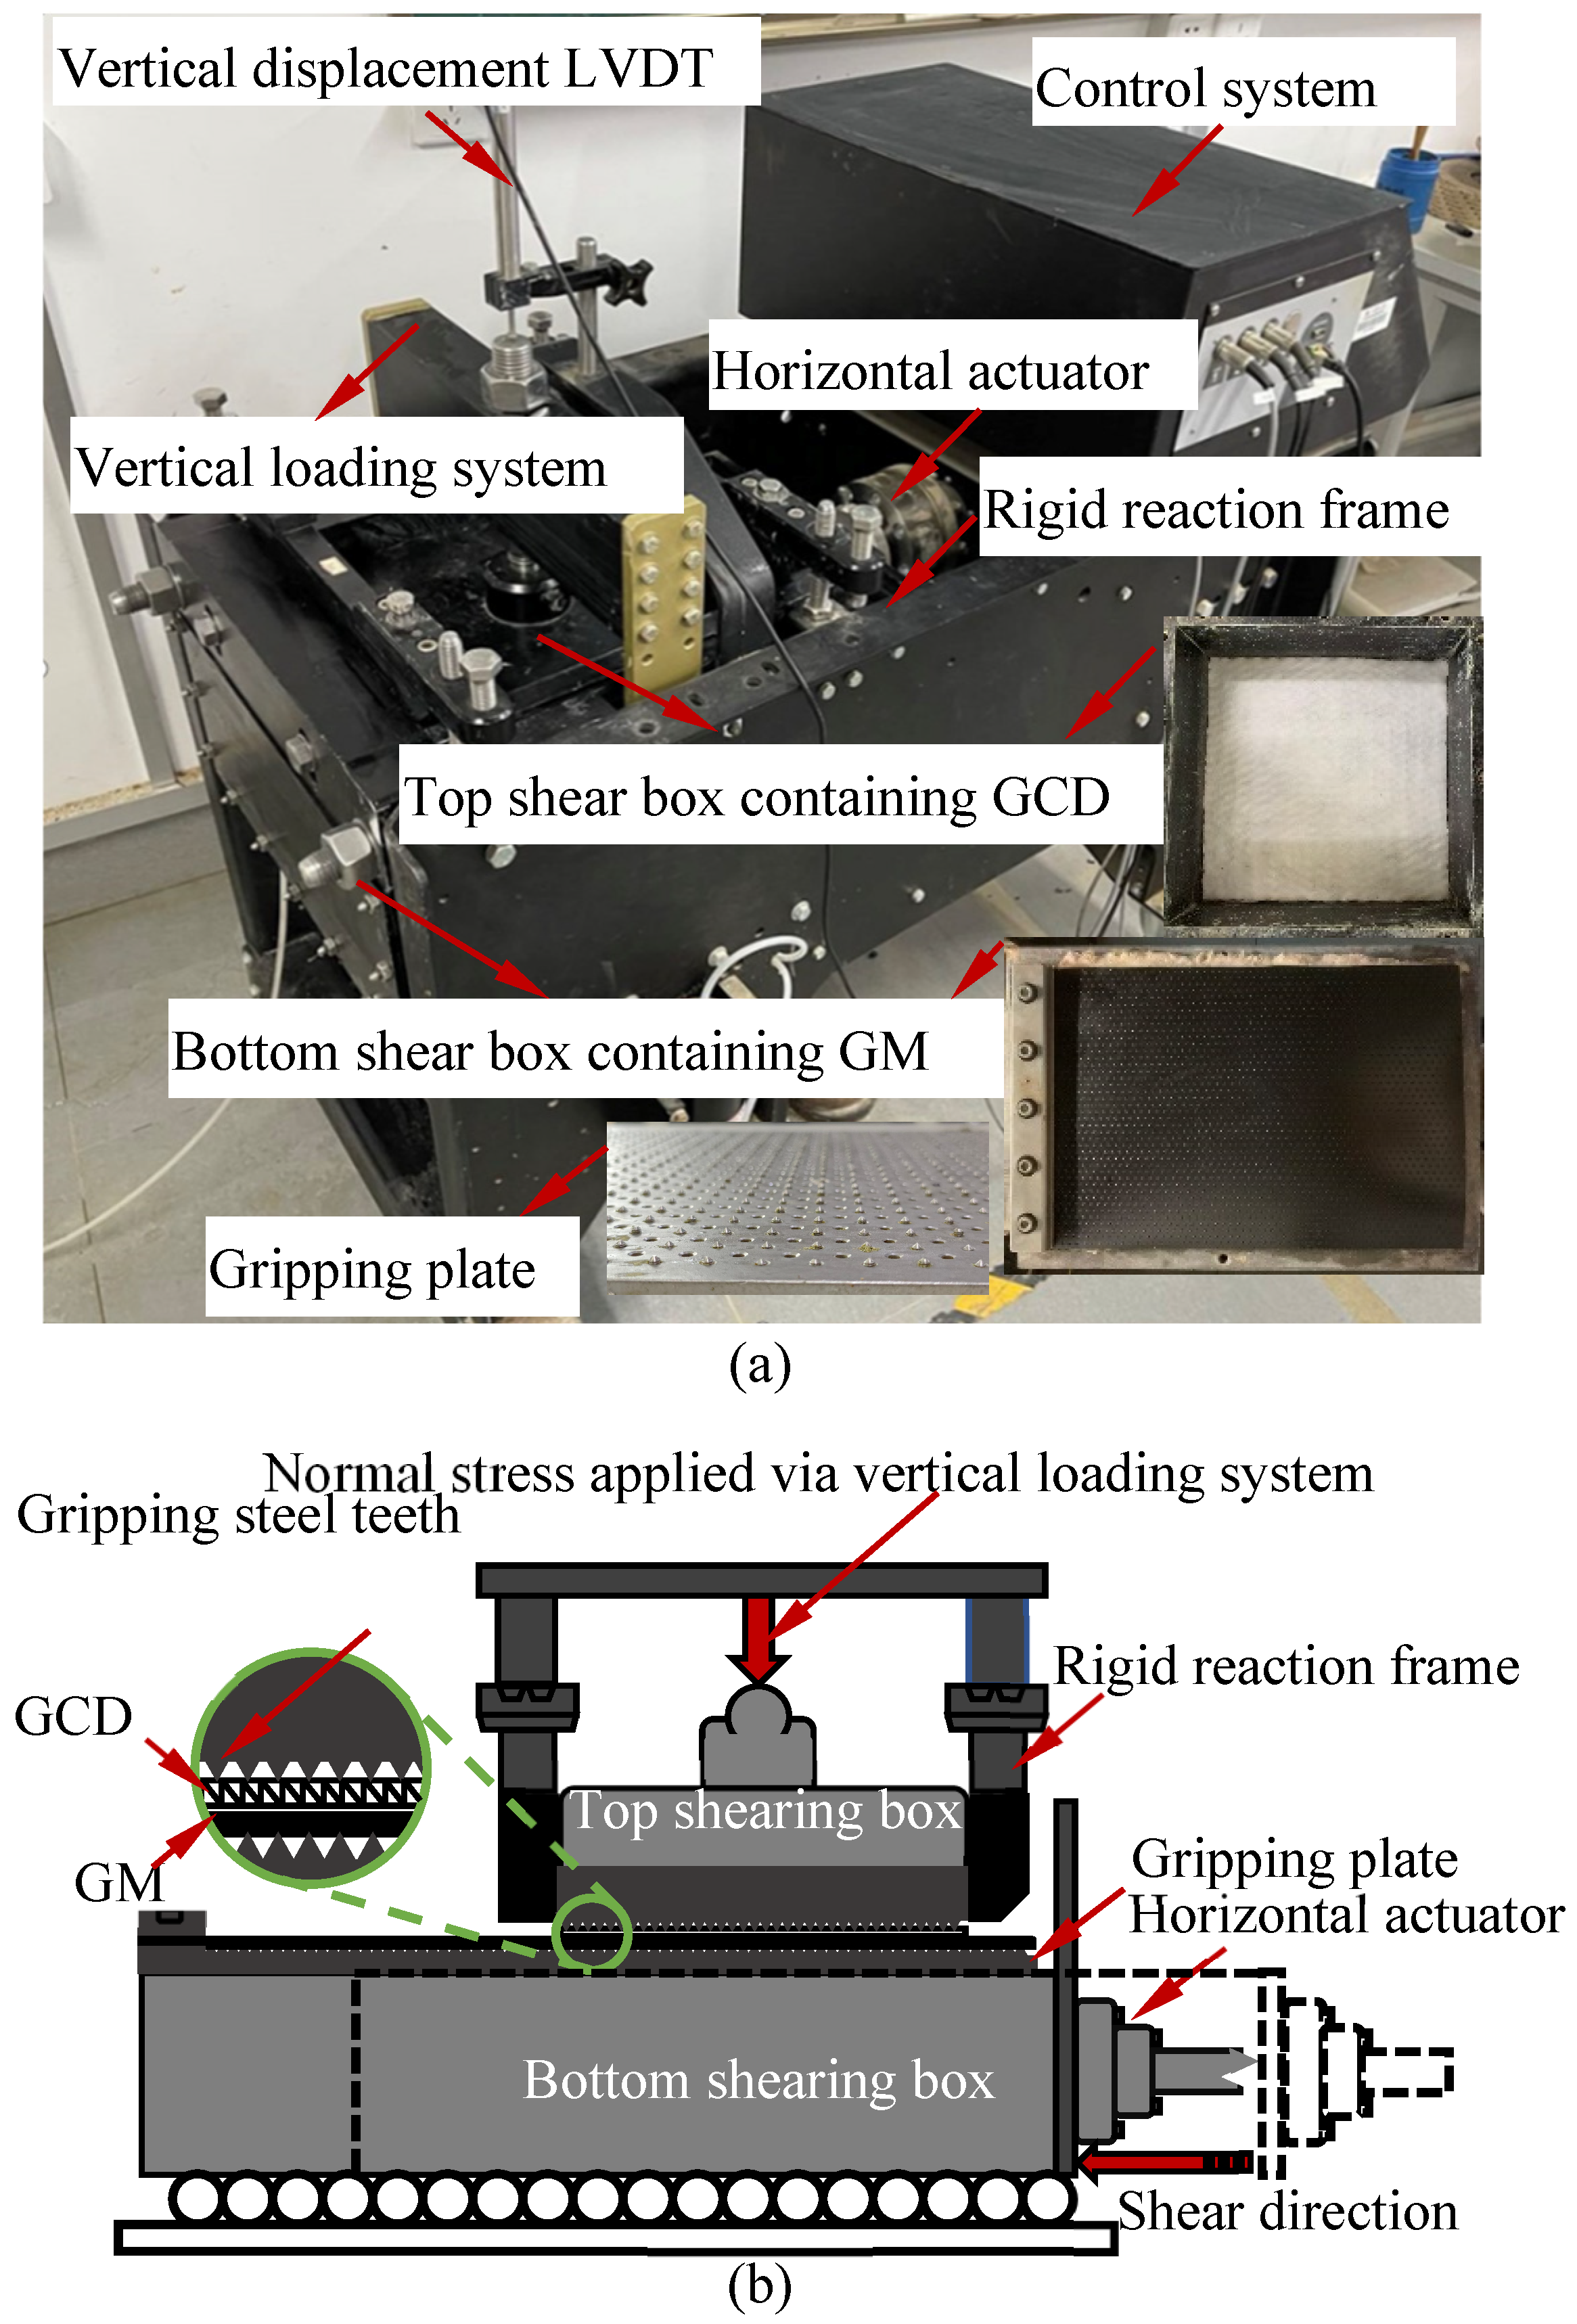
Interface shear tests were performed using an HM-5780 large-scale direct shear apparatus, as shown in Figure 2a. The upper shear box measured 305 mm × 305 mm × 102 mm, whereas the lower shear box measured 405 mm × 305 mm × 100 mm. Normal force was applied using a loading head mounted on a steel plate with a thickness of 30 mm and dimensions of 305 mm × 305 mm. Specimens were secured using sharp-toothed steel plates that mechanically interlock with the GCD and GM surfaces, eliminating the need for adhesives and preventing slippage. The GCD was fixed to the upper clamp, and the GM was fixed to the lower clamp, as shown in Figure 2b. During the direct shear test, shear force and normal force were measured using calibrated load cells, whereas normal and vertical displacements at the GCD–GM interface were monitored using linear variable displacement transducers (LVDTs). All data collected by the load cells and LVDTs were acquired in real time by a personal computer fitted with a data acquisition card.

2.3. Test Method

The interface shear tests were conducted following ASTM D5321-02 [37]. Shearing was conducted at a constant displacement rate of 2 mm/min [23,38], with horizontal actuators driving the lower shear box, while the upper box remained stationary. GCD specimens measuring 305 mm × 305 mm and GM specimens measuring 305 mm × 405 mm were prepared by cutting materials from rolls using a sharp razor blade. The GM specimens were intentionally sized larger than the GCD specimens to maintain a constant shear area throughout the test. During the test setup, the GCD specimens were secured to the upper clamping plate, whereas the GM specimens were affixed to the lower clamping plate as shown in Figure 2b.
A total of 27 direct shear tests were performed, covering dry (0%), intermediate (50%), and high moisture (100%) levels of GCD and three normal stresses (σn = 10, 30, and 50 kPa), as summarized in Table 2. To control moisture levels, the 100% moisture level was achieved by fully submerging the GCD and GM in deionized water within the shear box, ensuring complete saturation without air bubbles. For the intermediate (50%) moisture level, deionized water was precisely sprayed onto the dry GCD using a small sprayer to reach half the dry mass in water. The 50% saturated GCD was placed on the geomembrane with a gap to prevent oversaturation. Each test was continued until the horizontal displacement reached 60 mm [39,40,41]. Photographic documentation of the interface was conducted after each test to further investigate the failure mechanism.

3. Results

3.1. Shear Stress–Displacement Relationships

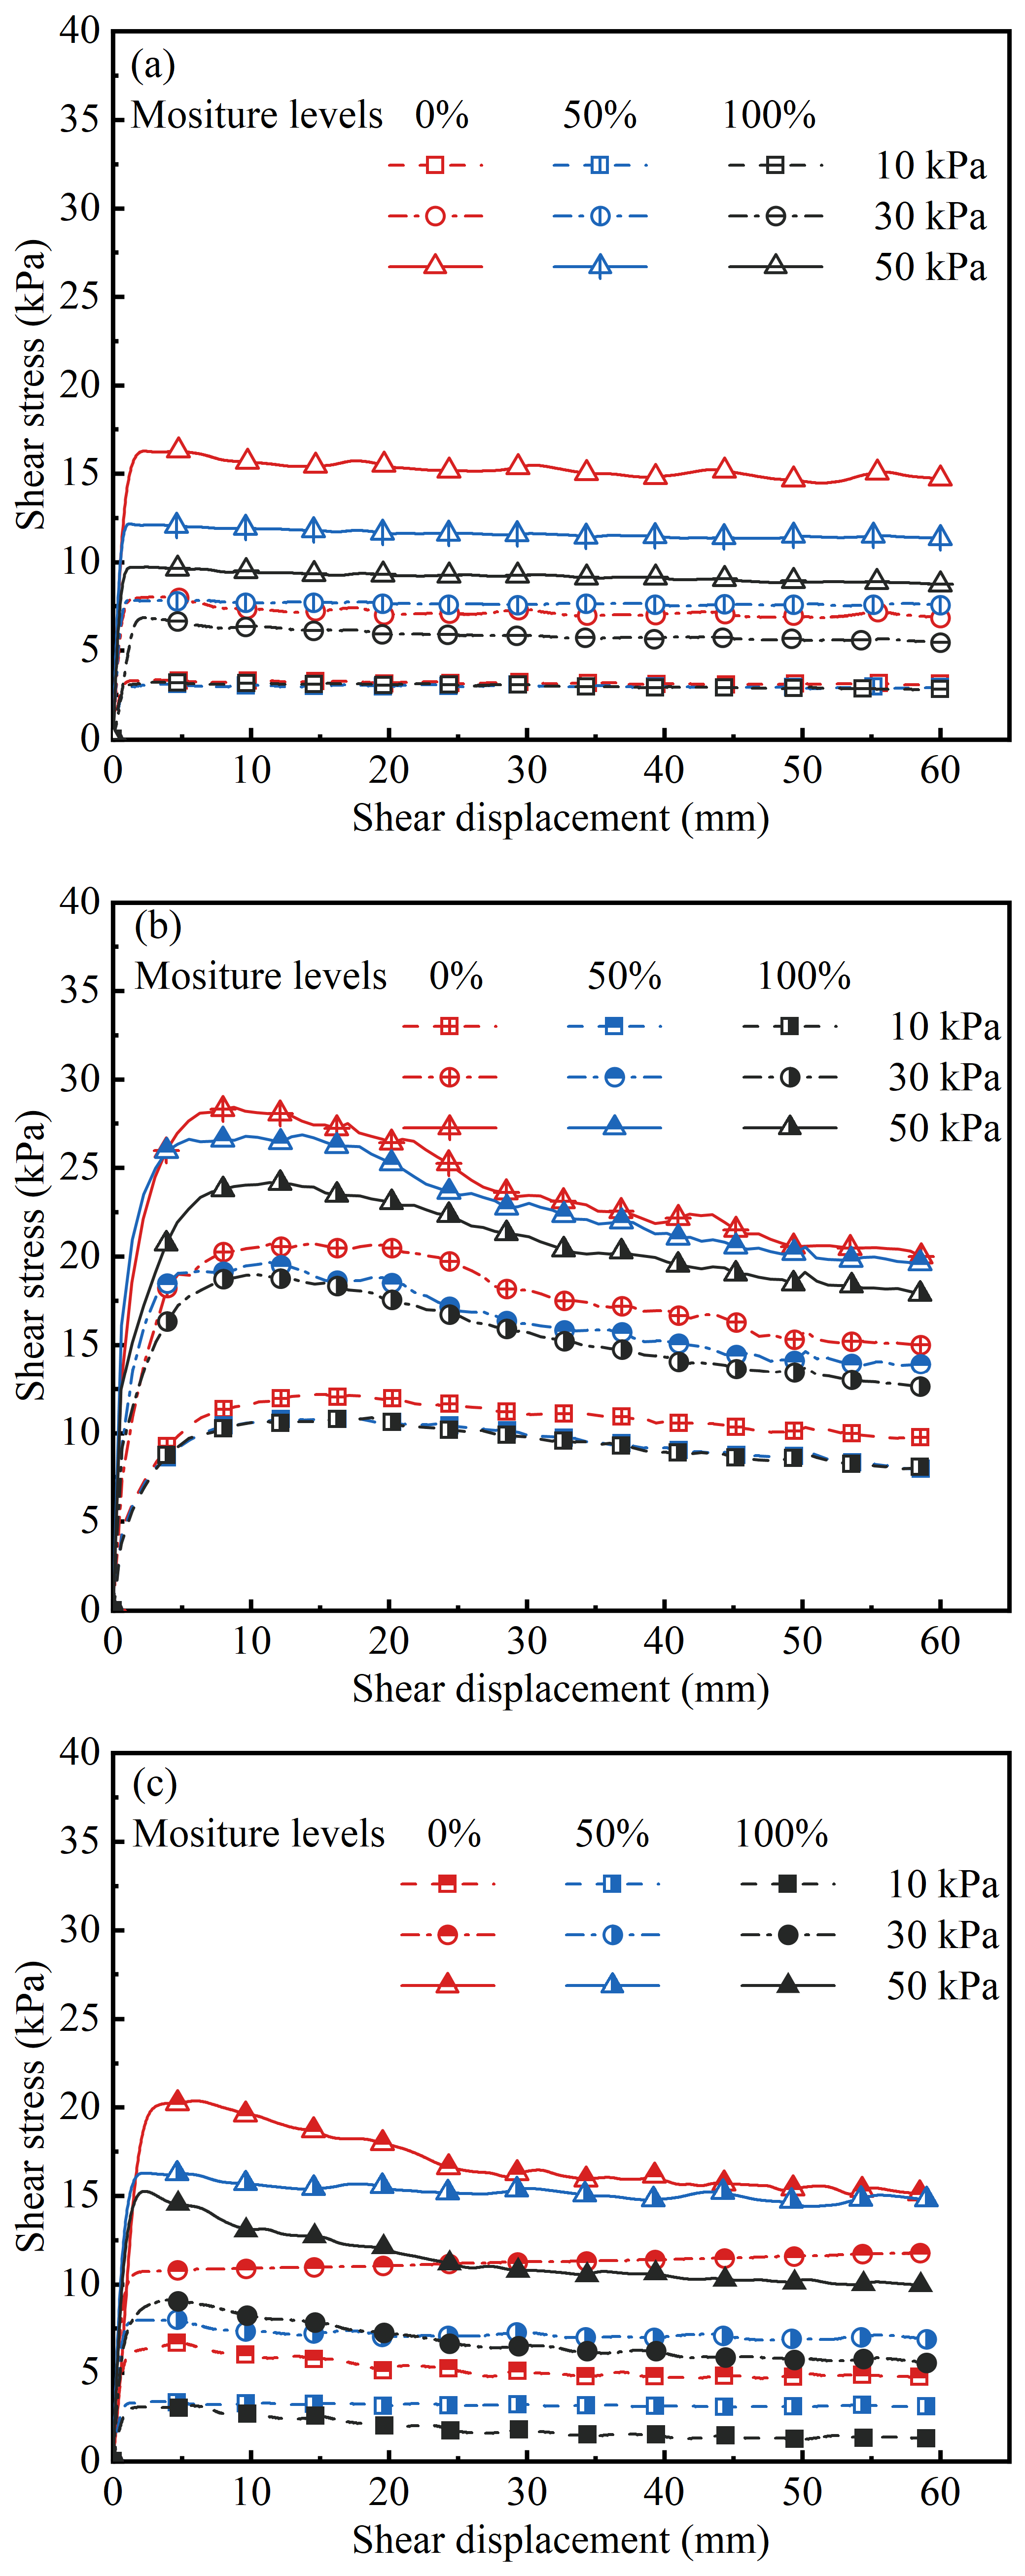
Figure 3 illustrates the shear stress–displacement responses of GCD–GM interfaces under varying moisture levels of dry (0%), intermediate (50%), and high (100%) and normal stresses of 10, 30, and 50 kPa. All GCD–GM interfaces exhibited a clear strain-softening behavior, characterized by a distinct peak in shear stress followed by a progressive decline with continued displacement (Figure 3a–c). This behavior is indicative of post-peak strength loss due to changes in interfacial contact conditions during shearing. Among the interfaces tested, the GCD–GMS interface (Figure 3a) consistently showed the lowest peak shear strength, the smallest peak displacement (typ. < 2 mm), and the most gradual post-peak reduction. However, the GCD–GMTI interface (Figure 3b) exhibited the highest peak shear strength, the most significant shear displacement at peak shear strength (up to 11 mm), and the most pronounced shear strength reduction after peak shear strength. The GCD–GMTE interface exhibited intermediate behavior in both strength magnitude and displacement response (Figure 3c). A comparative analysis under a high (100%) moisture level and 50 kPa of normal stress revealed the advantages of GMTI. The peak and large displacement (LD) strengths of the GCD–GMTI interface are 24 kPa and 18 kPa, which are 60% and 64% higher than those of the GCD–GMTE interface (15 kPa and 11 kPa), and 140% and 100% higher than those of the GCD–GMS interface (10 kPa and 9 kPa), respectively. These differences underscore the enhanced mechanical interlocking provided by impinged textures, which remain effective even under high (100%) moisture levels. Moisture levels also had an apparent weakening effect on interface shear behavior. As moisture levels increased from dry (0%) to high (100%), both peak and LD shear strengths declined across all GCD–GM interface types. For example, at 50 kPa of normal stress, the peak and LD shear strength of the GCD–GMS interface decreased from 16 kPa and 15 kPa (dry) to 12 kPa and 11 kPa (50% moisture level), and finally to 10 kPa and 9 kPa (100% moisture level). The reductions in peak and LD shear strength were 25% and 27% when the moisture level increased from dry (0%) to intermediate (50%), respectively, and 17% and 18%, respectively, when the moisture level increased from intermediate (50%) to high (100%) (Figure 3a).
Textured geomembranes demonstrated superior resistance to moisture-induced strength loss compared to smooth geomembranes. At a normal stress of 50 kPa, the GCD–GMTI interface showed a gradual decrease in peak and LD shear strength with increasing moisture level. Specifically, peak and LD shear strengths declined from 28 kPa and 20 kPa under dry (0%) moisture level to 27 kPa and 19 kPa at an intermediate (50%) moisture level, and further to 24 kPa and 18 kPa under a high (100%) moisture level. These represent reductions of 4% and 5% from dry (0%) to intermediate (50%) moisture levels and 11% and 5% from intermediate (50%) to high (100%) moisture levels, respectively (Figure 3b). For the GCD–GMTE interface under the same normal stress, the peak and LD strengths decreased from 20 kPa and 13 kPa (dry) to 15 kPa and 12 kPa at an intermediate (50%) moisture level and to 15 kPa and 11 kPa at a high (100%) moisture level (Figure 3c). This corresponds to strength reductions of 25% and 8% from dry (0%) to intermediate (50%) moisture levels and 0% and 8% from intermediate (50%) to high (100%) moisture levels, respectively. These results suggest that GMTI offers more effective mechanical interlocking to resist moisture-induced weakening compared to GMTE. Comparative analysis further underscores this difference. At a normal stress of 50 kPa, the reductions in peak shear strength and LD shear strength for the GCD–GMTI interface, when transitioning from a dry (0%) to an intermediate (50%) moisture level, were 4% and 5%, respectively. These values corresponded to only 16% and 63% of the respective strength loss compared with the GCD–GMTE interface (25% and 8%) and 16% and 19%, respectively, compared with the GCD–GMS interface (25% and 27%). From an intermediate (50%) to a high (100%) moisture level, the GCD–GMTI interface exhibited 10% and 9% reductions in peak shear strength and LD shear strength, respectively. These reductions corresponded to 500% and 82% of the respective reductions observed for the GCD–GMTE interface (2% and 11%) and 82% and 39% of those recorded for the GCD–GMS interface (20% and 23%). The comparative data on strength loss and reduction percentage of the GMTI interface are summarized in Table 3. These results confirm the superior performance of the GCD–GMTI interface in resisting moisture-induced degradation.
Increasing normal stress consistently enhanced shear strength across all GCD–GM interfaces, aligning with previous findings [22,23,24,42]. However, this strength gain was progressively attenuated with higher moisture levels. For the GCD–GMS interface, peak and LD strengths at 50 kPa under dry (0%) moisture level were 16 kPa and 15 kPa, respectively, showing a substantial ~2-fold increase compared to 8 kPa and 7 kPa at 30 kPa and a marked ~5-fold increase across the board relative to 3 kPa each at 10 kPa (Figure 3a). Under a high (100%) moisture level, the same interface exhibited notably lower amplification. The peak and LD shear strengths at 50 kPa were 10 kPa and 9 kPa, respectively, corresponding to only a moderate increase of 140% and 150% of the values at 30 kPa (7 kPa and 6 kPa) and a more modest rise (310%) relative to 10 kPa (3 kPa each). The GCD–GMTI interface followed a similar but more moderate trend. Under dry (0%) moisture level, the peak and LD shear strengths at 50 kPa reached 28 kPa and 20 kPa, respectively, corresponding to a moderate increase of 140% and 130% compared to the values at 30 kPa (20 kPa and 15 kPa), and a more substantial increase of 230% and 210% relative to those at 10 kPa (12 kPa and 10 kPa) (Figure 3b). At a high (100%) moisture level, these values decreased to 24 kPa and 18 kPa, respectively, at 50 kPa, corresponding to a moderate increase of 130% and 140% compared to the values at 30 kPa (19 kPa and 12 kPa), and a similar moderate increase of 230% and 220% relative to those at 10 kPa (10 kPa and 8 kPa). For the GCD–GMTE interface, under dry (0%) moisture conditions, the peak and LD shear strengths at 50 kPa reached 20 kPa and 13 kPa, respectively, corresponding to a substantial increase of 170% compared to the values at 30 kPa (12 kPa and 7 kPa), and a marked rise of 300% and 280% relative to those at 10 kPa (7 kPa and 5 kPa) (Figure 3c). Under a high (100%) moisture level, the peak and LD shear strengths of the GCD–GMTE interface were reduced to 15 kPa and 11 kPa, respectively. However, the amplification ratios remained comparable, corresponding to a substantial increase of 170% and 200% compared to those measured at 30 kPa (9 kPa and 6 kPa), and a pronounced rise of 320% and 380% relative to those recorded at 10 kPa (5 kPa and 3 kPa).
These results suggest that while increasing normal stress enhances interface strength, the effect is partially offset by elevated moisture levels. Notably, the strength gain under high stress is less pronounced under a high (100%) moisture level, indicating that overburden pressure alone cannot fully compensate for moisture-induced degradation. Therefore, in landfill cover applications—especially those exposed to high moisture environments—there remains a significant risk of interfacial sliding, even under substantial confining stress. This highlights the importance of selecting GMTIs that maintain over 90% of their dry-state shear strength at a 50% moisture level and exhibit more than 140% higher strength than GMS at a 50% moisture level, thereby significantly reducing sliding risk under field conditions.

3.2. Post-Peak Behavior

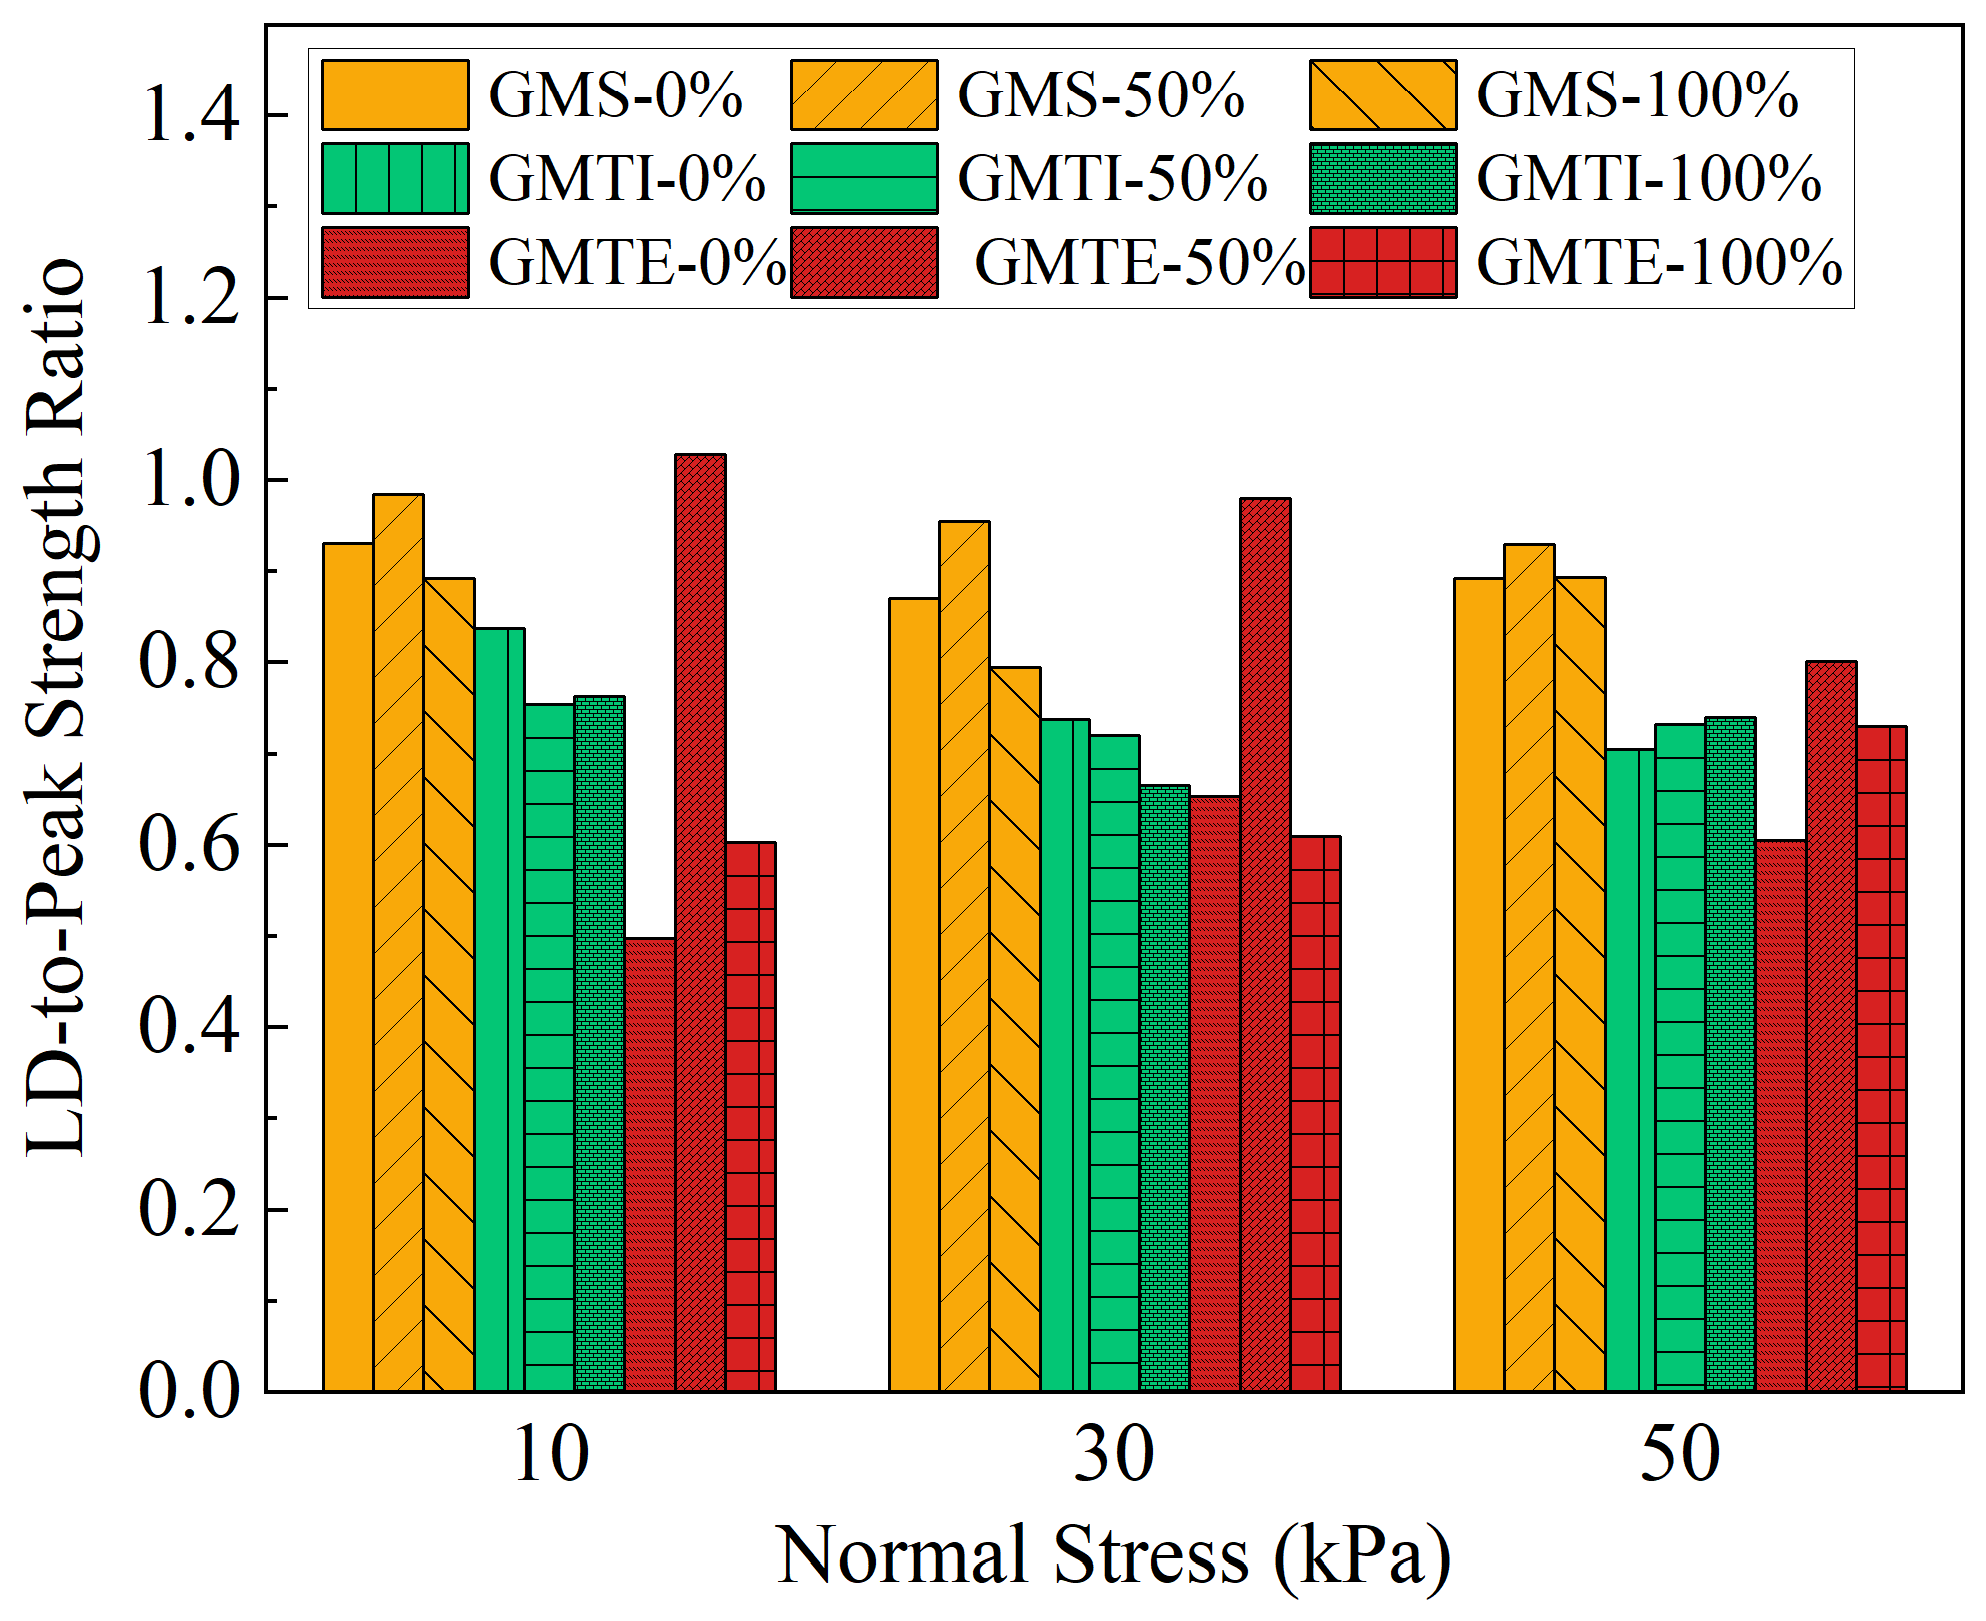
Figure 4 presents the ratios of large displacement (LD) to peak shear strength (LD-to-peak ratios) for all GCD–GM interfaces under varying normal stresses and moisture levels. The LD shear strength was defined as the shear stress measured at a horizontal displacement of 60 mm [39,40,41,43]. These ratios provide critical insight into post-peak shear behavior, indicating the extent to which each interface retains shear resistance after reaching peak shear strength. Among the three interface types, the GCD–GMS interface exhibited the most consistent LD-to-peak shear strength ratios, ranging from 0.8 to 0.9. This stability across all test conditions suggests that the smooth geomembrane interface undergoes minimal degradation in shear strength after peak and maintains relatively uniform post-peak performance. In contrast, the GCD–GMTI interface showed the lowest LD-to-peak strength ratios, ranging from 0.7 to 0.8, indicating significant post-peak strength loss. This is particularly evident under high normal stress and a dry (0%) moisture level, where sharp strength degradation follows the initial peak. These results highlight the pronounced strain-softening behavior induced by the aggressive impinged texture, which, while enhancing peak strength, also leads to greater loss of resistance beyond peak displacement. The GCD–GMTE interface demonstrated more variable behavior. Notably, a maximum LD-to-peak ratio of 1.0 was observed under 10 kPa of normal stress and intermediate (50%) moisture level, indicating no loss in shear strength after peak. This performance is attributed to the moderate interlocking provided by the low-height embossed texture, which appears most effective under conditions of intermediate (50%) moisture levels and low confining pressure. However, the LD-to-peak ratio for the GMTE interface declined significantly at higher moisture levels, decreasing from 1.0 at an intermediate (50%) moisture level to 0.8 at a high (100%) moisture level under 50 kPa stress. This trend suggests that GMTEs are more vulnerable to moisture-induced weakening, despite its texturing surface.
The influence of normal stress on LD-to-peak strength ratios revealed distinct trends across the interfaces. For the GCD–GMS interface, the ratio remained largely stable across all conditions, with a consistency of approximately 0.9 as normal stress increased, underscoring its independence from texture-driven mechanisms. For the GCD–GMTI interface under a dry (0%) moisture level, the ratio declined from 0.8 at 10 kPa to 0.7 at 50 kPa, indicating that increased normal stress exacerbates post-peak strength loss, likely due to deeper penetration and subsequent damage of the drainage core. Under a high (100%) moisture level, this ratio was almost consistent at 0.7. The GCD–GMTE interface exhibited increasing LD-to-peak ratios with rising normal stress. Under a dry (0%) moisture level, the ratio increased from 0.5 at 10 kPa to 0.6 at 50 kPa. At a high (100%) moisture level, it increased from 0.6 to 0.7. These results suggest that GMTE benefits from higher normal stresses, which may enhance texture engagement with the geotextile or drainage core, thereby improving post-peak strength retention. Furthermore, moisture levels had a complex effect on the LD-to-peak ratios. Although the GCD–GMS interface showed near-constant ratios (e.g., 0.9 at 50 kPa) regardless of hydration, the texturing interfaces displayed more pronounced changes. At 50 kPa, the GMTI interface ratio is almost a constant of 0.7 from dry (0%) to high (100%) moisture levels, suggesting that its more aggressive surface topography is resilient to moisture-induced degradation. However, the GMTE interface showed a 22% improvement in LD-to-peak ratio over the same moisture range (from 0.6 to 0.7), indicating a positive interaction between moisture and the embossed texture under confined conditions. These findings demonstrate that the presence and nature of surface texturing play critical roles in post-peak interface performance. Textured geomembranes, particularly those with higher roughness and asperities height, offer enhanced shear resistance at large displacements and maintain better performance under wet conditions. The underlying micro-mechanical processes responsible for these behaviors are explored further in Section 4 with detailed surface morphology analysis.

3.3. Shear Strength Envelopes

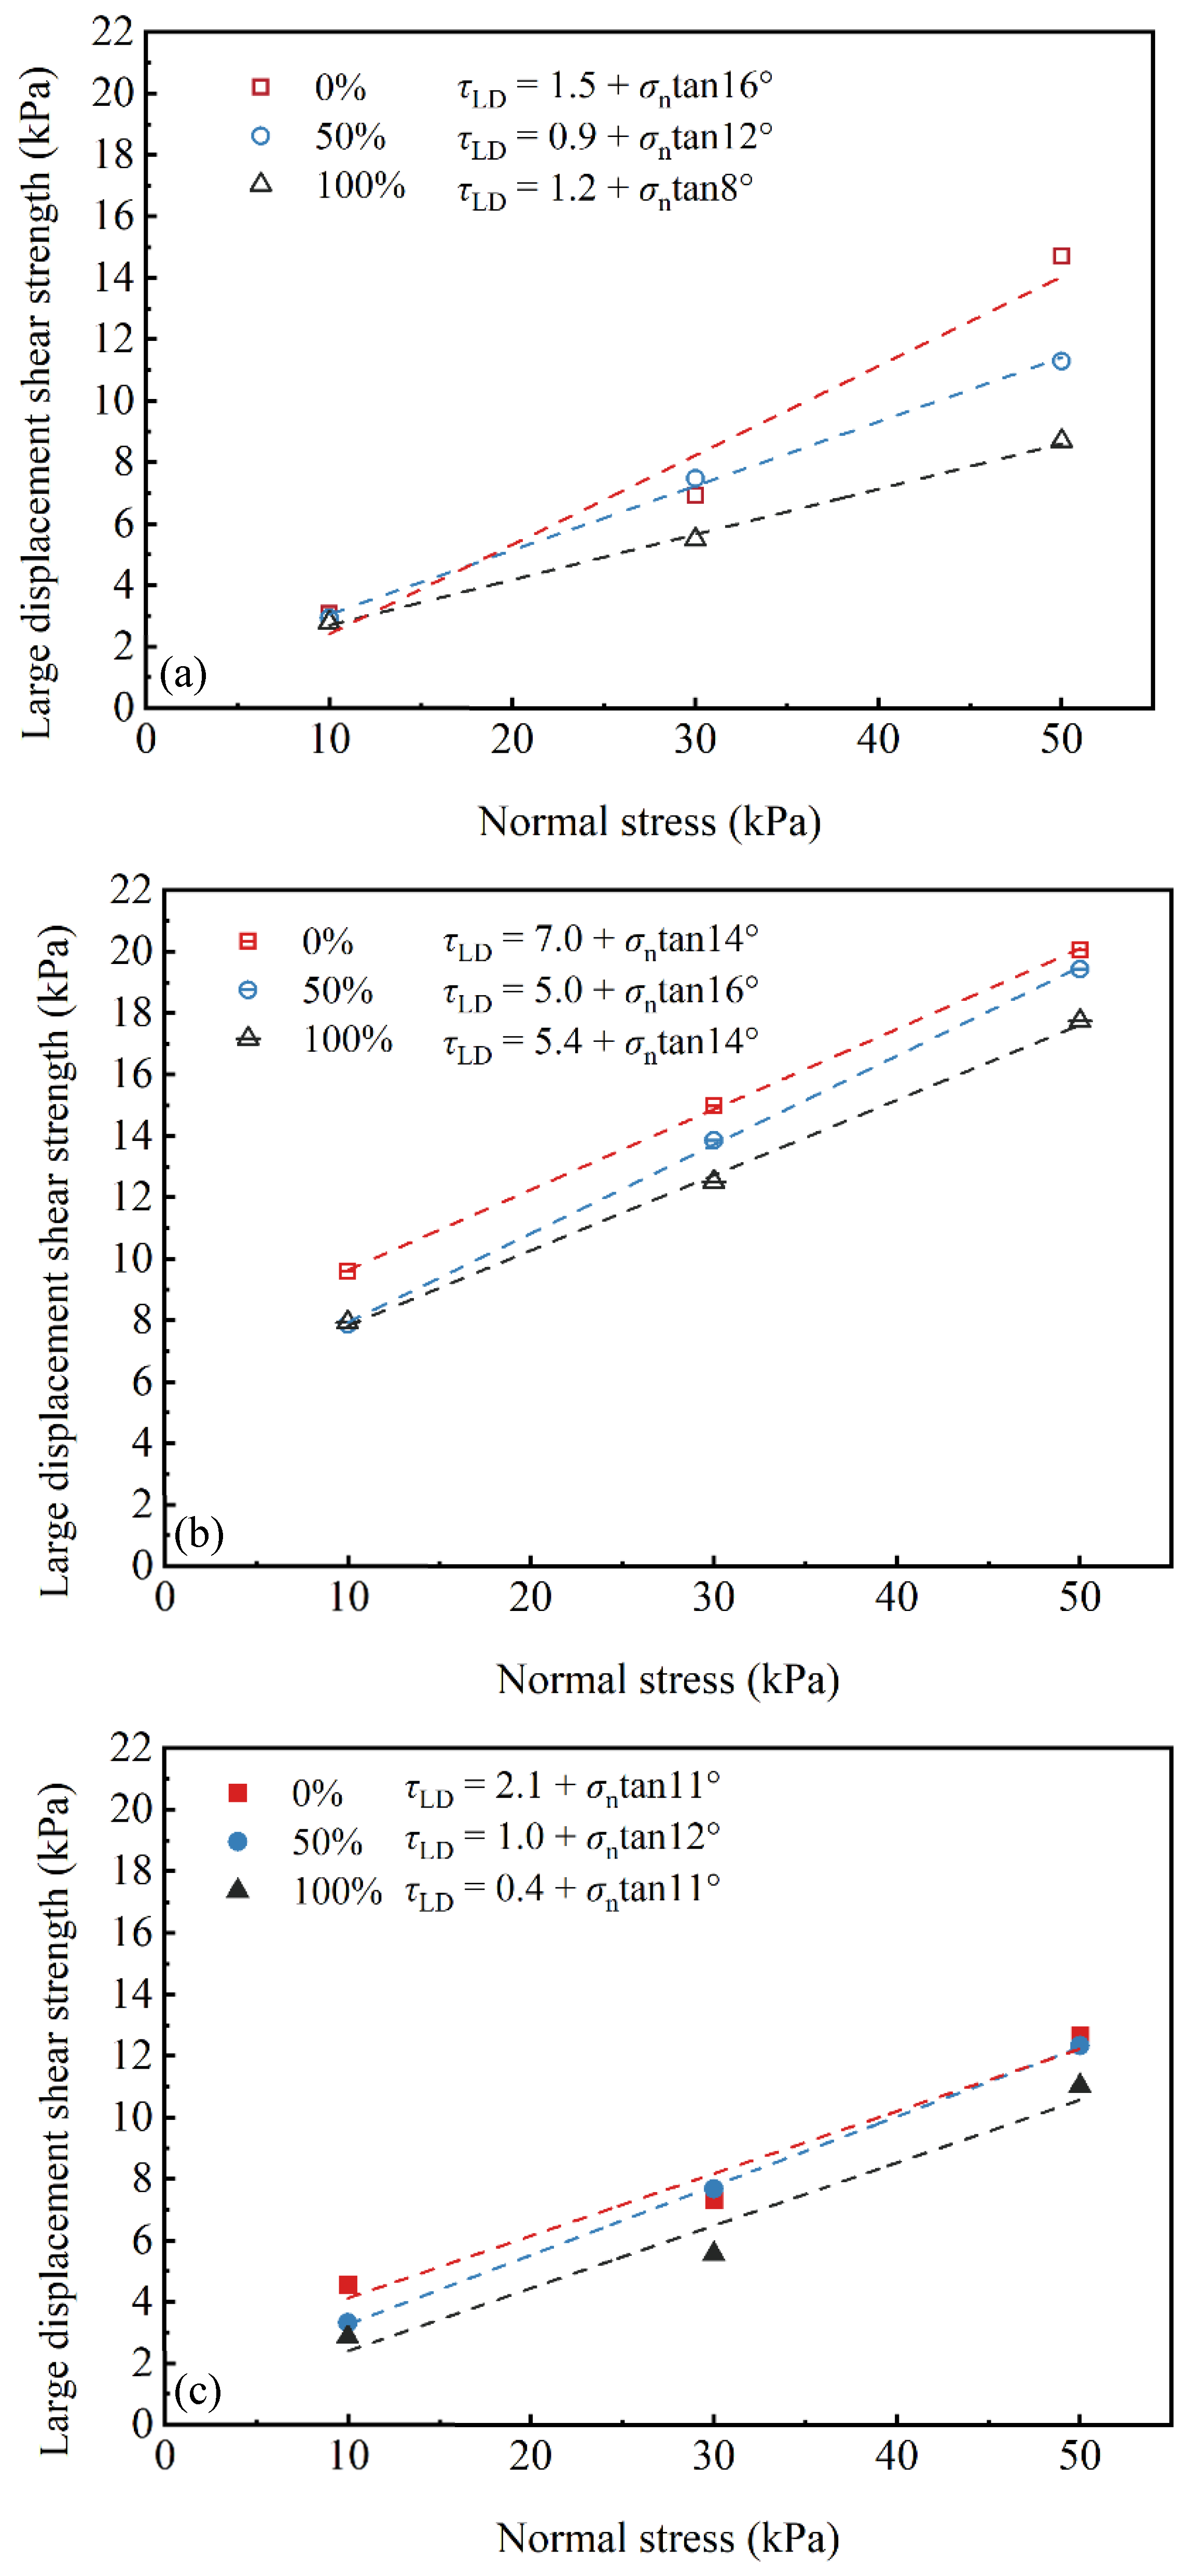
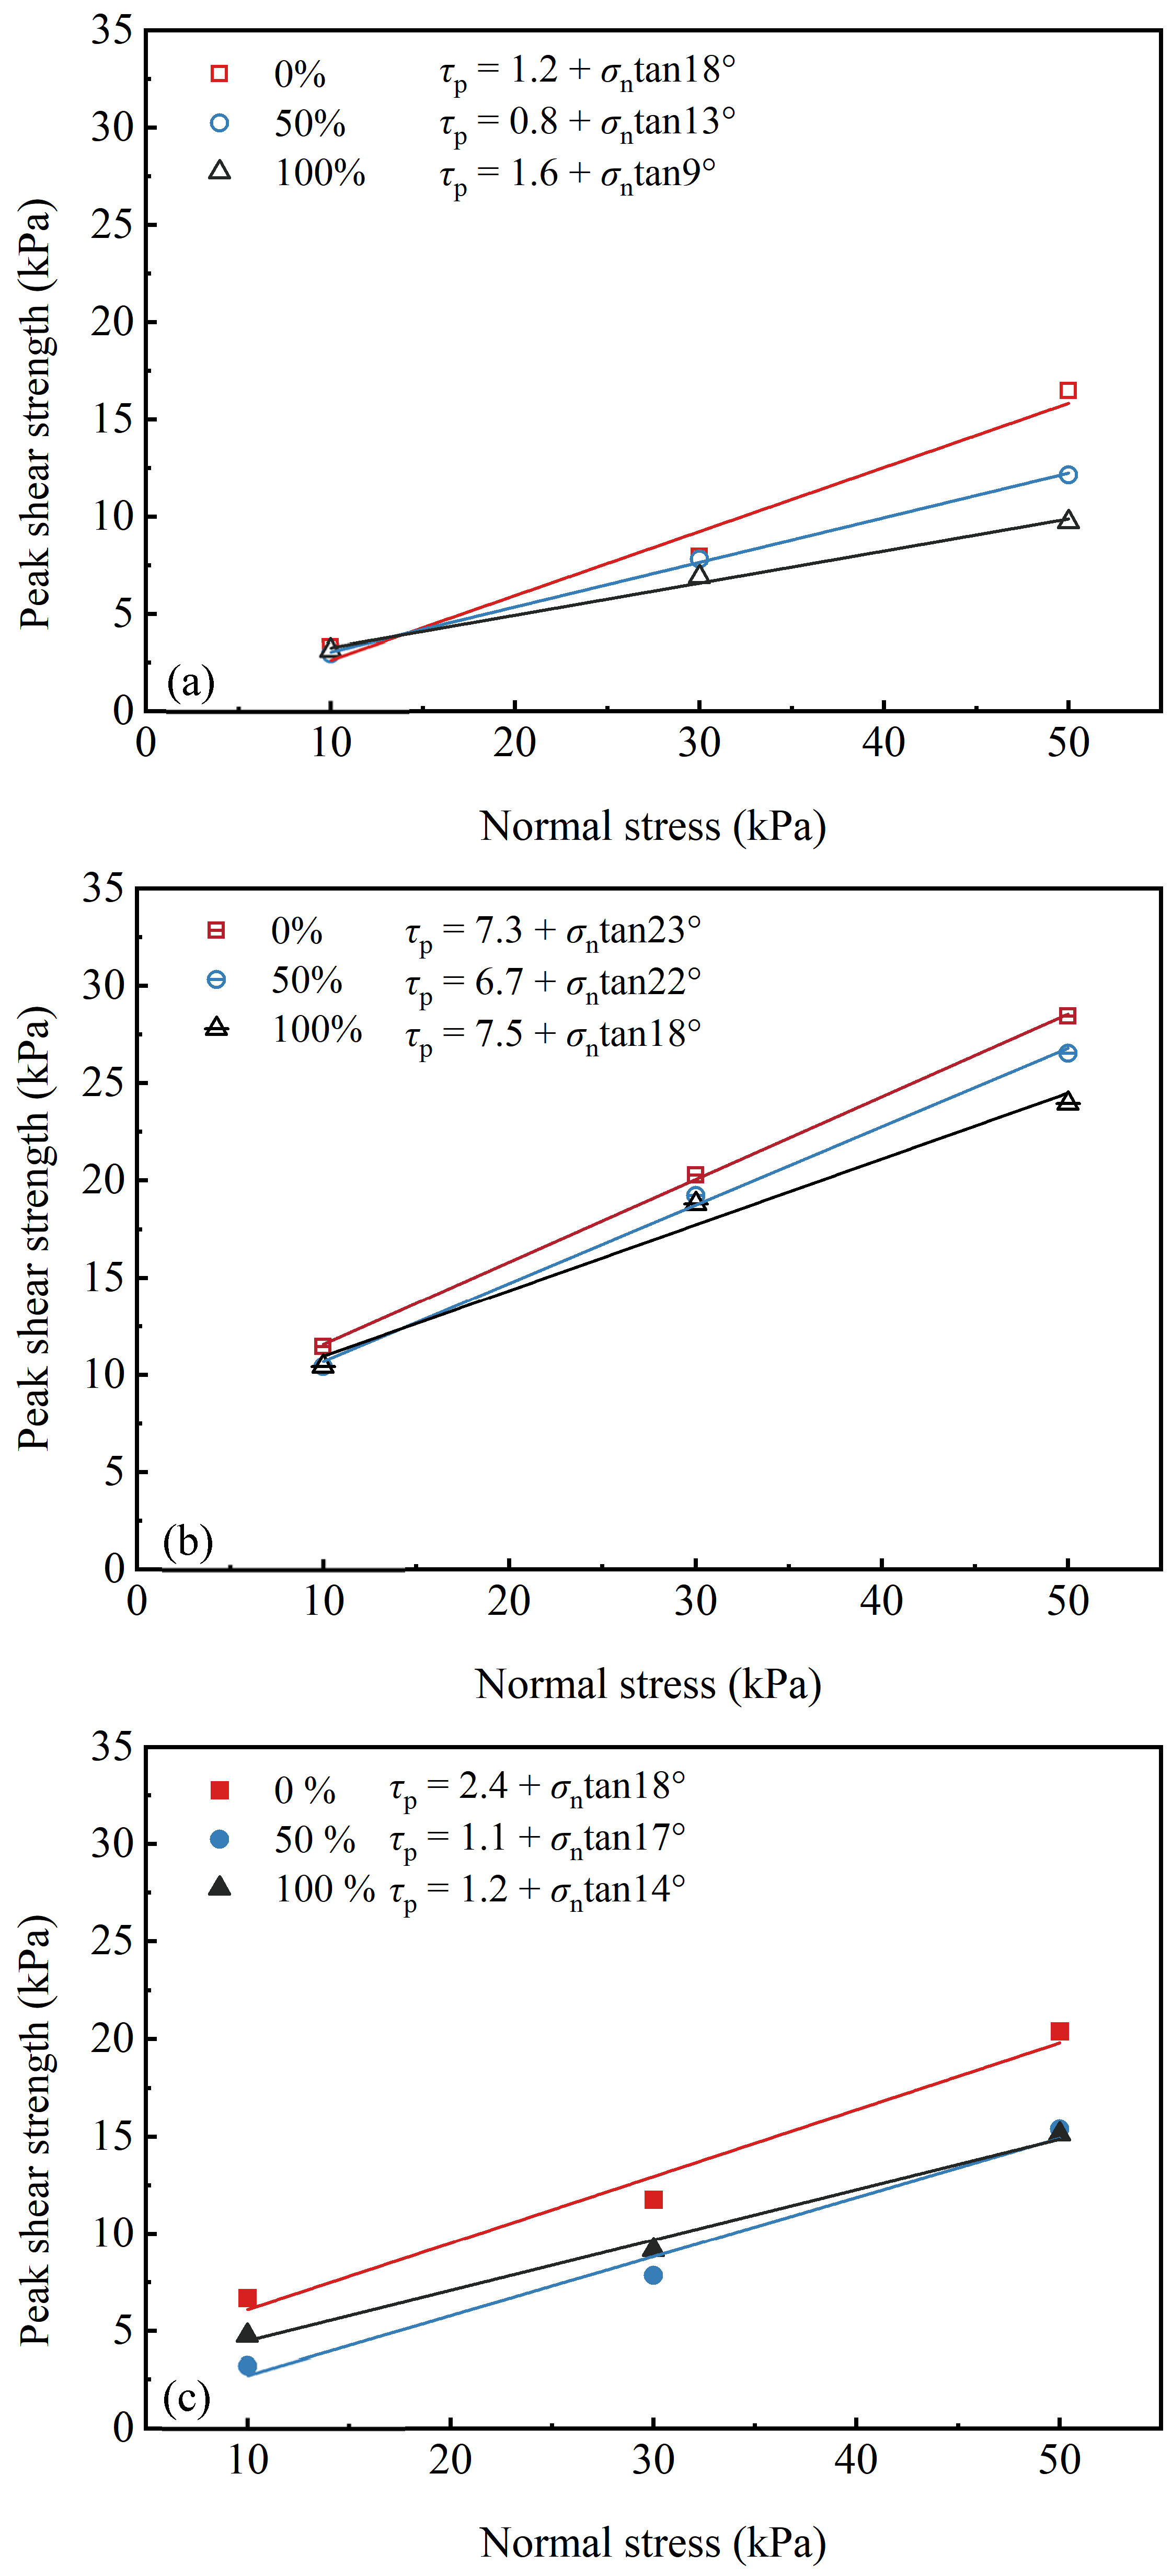
The peak and large displacement interface intensity envelopes for each interface are shown in Figure 5 and Figure 6. A Moore–Coulomb envelope was fitted to the data for each interface using linear least squares regression:
τp = ap + σntanδp
τLD = aLD + σntanδLD
where τp and τLD are the peak and large displacement interfacial shear strengths, respectively; σn is the normal stress; ap and aLD are the peak and large displacement interfacial adhesion values, respectively; and δp and δLD are the peak and large displacement interfacial friction angles, respectively. Table 4 summarizes the interfacial shear strength parameters derived from direct shear testing. For each GCD–GM interface, the peak and LD strength envelopes exhibit an approximately linear relationship with normal stress. The goodness of fit for the peak and large displacement shear strength parameters of all GCD–GM interfaces under different moisture conditions is generally high, as shown in Table 4. Most R2 values exceed 0.98, including the GCD–GMS interface at 50% and 100% moisture levels, indicating a high degree of agreement between the models and experimental data. A few R2 values range from 0.90 to 0.98, such as the GCD–GMS interface at 0% moisture level, which still exhibit strong linear correlations, verifying the reliability of the shear strength parameter models. In summary, all R2 values are ≥0.90, with high fitting quality, supporting the use of these parameters for engineering analysis of GCD–GM interfaces. An increase in moisture level leads to a general decrease in both peak and LD friction angles for all GCD–GM interfaces, though the extent of this effect varies by interface type. Table 5 presents the percentage variation (var.) of shear strength parameters for GCD–GM interfaces. As shown in Figure 5a and Figure 6a, the GCD–GMS interface exhibited the most significant decrease in both peak and LD friction angles with increasing moisture levels. The peak friction angle was reduced from 18° (0% moisture level) to 13° (50% moisture level), and further to 9° (100% moisture level). Concurrently, the LD friction angle decreased from 16° to 12°, then to 8° under the same moisture gradient. These results indicate that the interfacial strength of smooth geomembrane surfaces is highly susceptible to moisture-induced degradation, especially under large displacement conditions. Figure 5b and Figure 6b show that the GCD–GMTI interface had a peak friction angle of 23° under dry (0%) moisture conditions, decreasing to 22° at an intermediate (50%) moisture level and further to 18° at a high (100%) moisture level. This behavior is attributed to its pronounced surface texture, which enhances mechanical interlocking. The reduction to 18° at a high (100%) moisture level reflects diminished interfacial effectiveness due to increased moisture. The LD friction angle of this interface exhibited a non-monotonic trend: increasing from 14° (0% moisture level) to 16° (50% moisture level), then returning to 14° at a high (100%) moisture level, with the highest LD cohesion (7.5 kPa) observed under a dry (0%) moisture level. This fluctuation suggests that the post-peak strength of GCD–GMTI is more sensitive to an intermediate (50%) moisture level than to a high (100%) moisture level. For the GCD–GMTE interface (Figure 5c and Figure 6c), the peak friction angle decreased from 18° (0% moisture level) to 17° (50% moisture level) and 14° (100% moisture level). The LD friction angle followed a similar non-monotonic pattern as GMTI, increasing from 11° (0% moisture level) to 12° (50% moisture level) and then returning to 11° at a high (100%) moisture level, indicating relatively stable large displacement performance with minimal moisture influence. Meanwhile, this interface showed a higher LD cohesion (2.4 kPa), demonstrating that its embossed texture contributes to interfacial bonding even at elevated moisture levels. Therefore, the GCD–GMS interface, by contrast, exhibited the most incredible sensitivity to moisture, particularly in terms of post-peak performance. The GCD–GMTI interface exhibited the highest peak shear resistance under a dry (0%) moisture level due to enhanced texturing. However, its advantage diminished as the moisture level increased. The GCD–GMTE interface demonstrated more consistent LD performance and higher cohesion, resulting in greater stability in wet environments. These trends highlight the significance of surface texturing in maintaining shear resistance under diverse environmental conditions.

3.4. Vertical Deformation of GCD–GM Interfaces

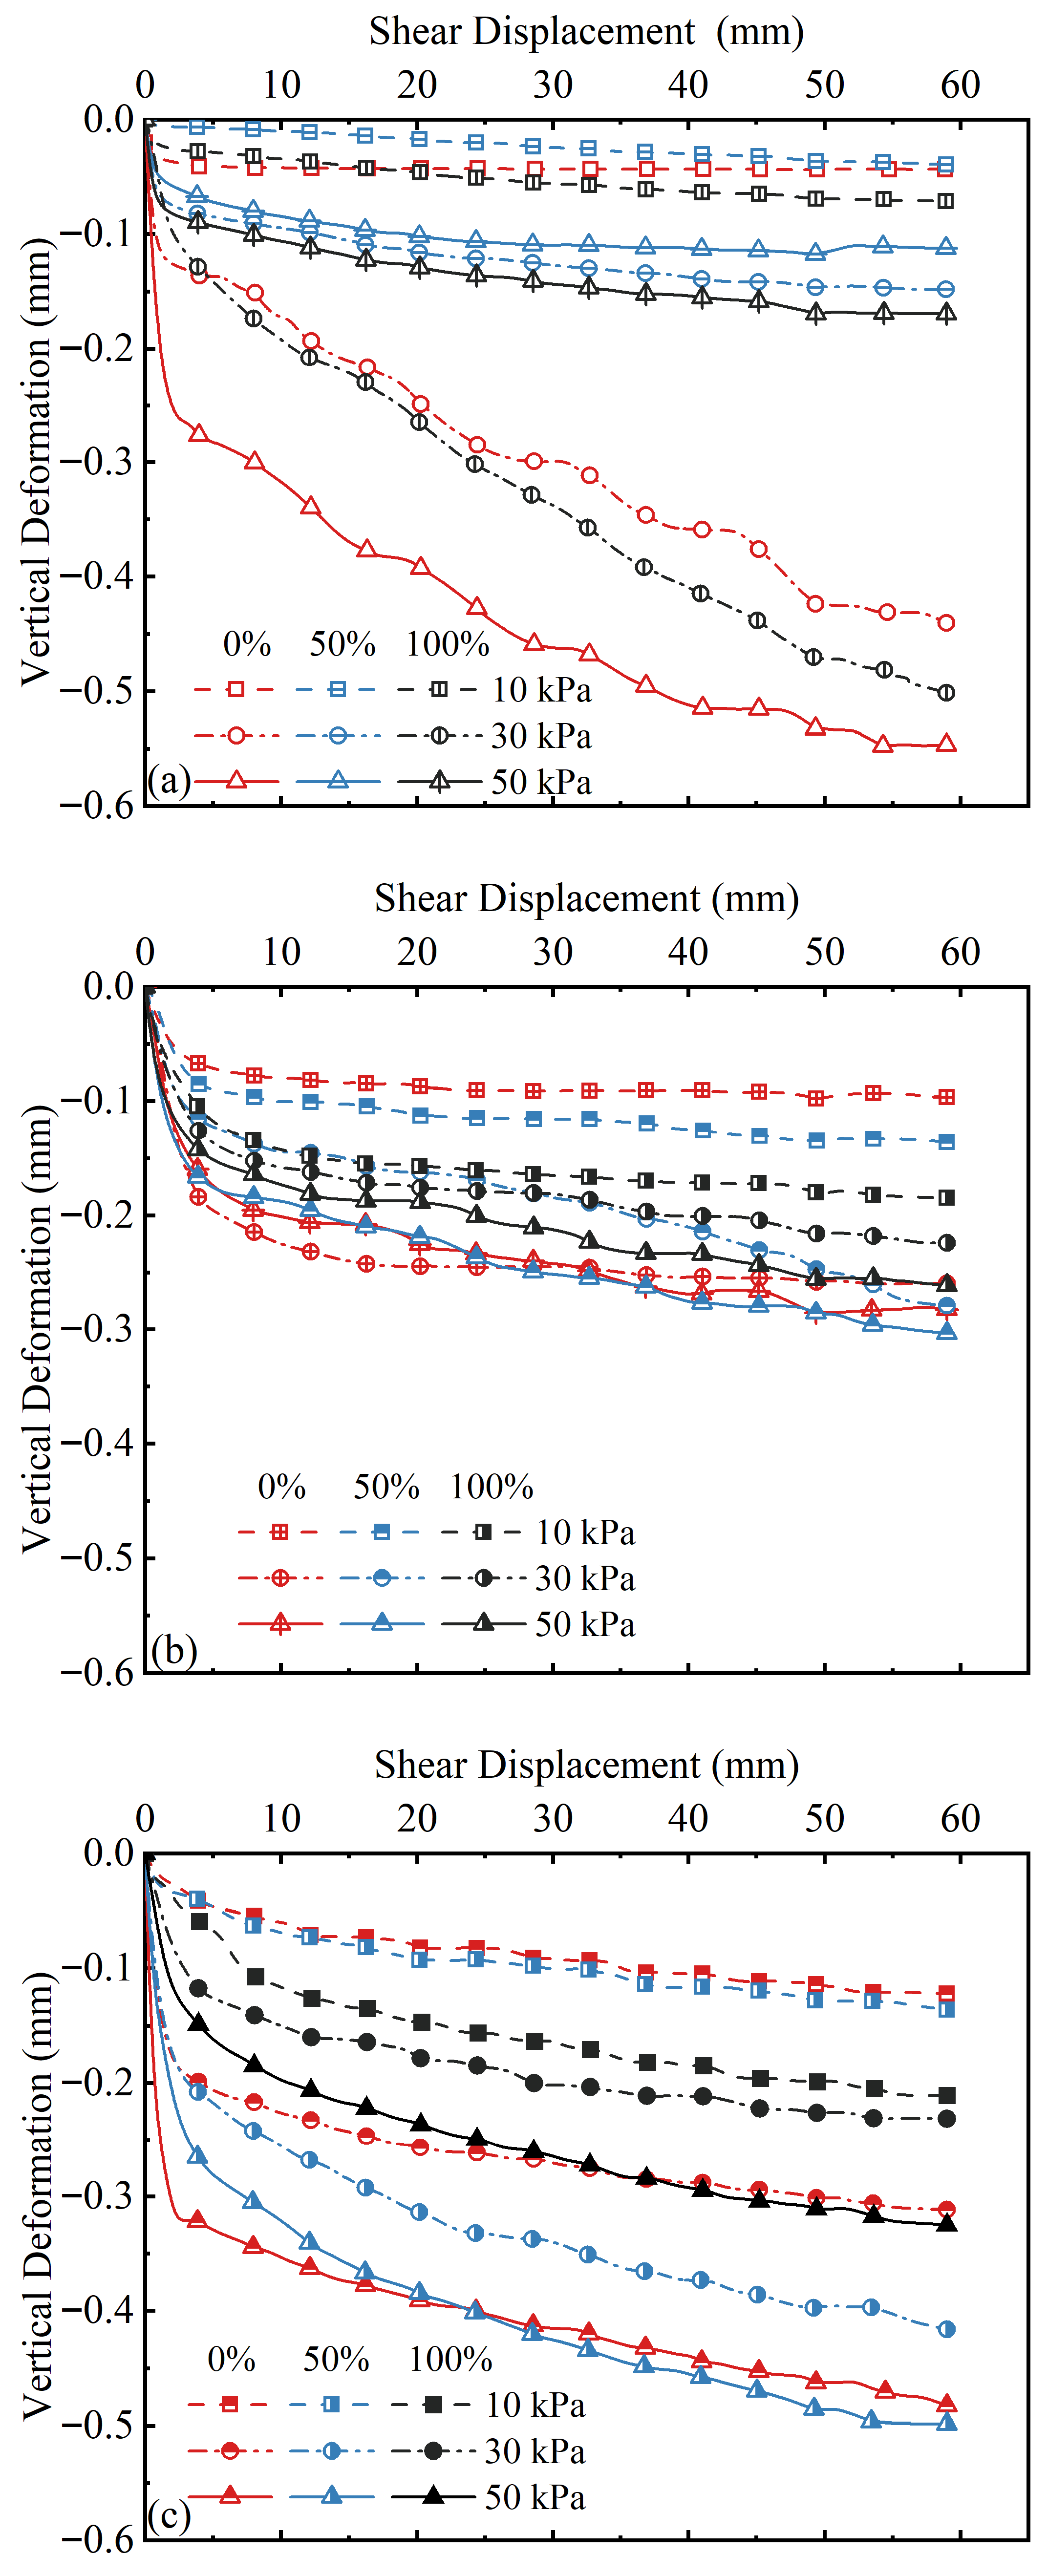
Figure 7 illustrates the relationship between vertical deformation and shear displacement for each GCD–GM interface under varying moisture levels, with positive values indicating compression. Across all conditions, vertical deformation remained less than 0.6 mm, indicating relatively limited volumetric response during interface shearing. For the GCD–GMS interface (Figure 7a), most of the vertical compression occurred within the initial 3 mm of displacement, followed by a plateau or minor incremental compression. Moisture level had a marked influence on the magnitude of vertical compression. Under dry (0% moisture level) conditions, the maximum vertical displacement reached 0.5 mm. When the moisture level increased to 100%, the maximum displacement decreased substantially to 0.2 mm. For the GCD–GMTI interface (Figure 7b), most vertical compression occurred within the initial 4 mm of displacement, followed by a plateau or minor incremental compression. Moisture level had a marked influence on the magnitude of vertical compression. At a dry (0%) moisture level, the maximum vertical displacement was 0.28 mm. When the moisture level increased to 100%, the displacement decreased to 0.26 mm, corresponding to a reduction of approximately 7%. Despite this quantitative change, the overall trend of vertical deformation remained relatively consistent across different moisture levels, especially under lower normal stresses, suggesting that the interfacial behavior was not extremely sensitive to moisture in this configuration. For the GCD–GMTE interface (Figure 7c), most vertical compression occurred within the initial 4 mm of displacement, followed by a plateau or minor incremental compression. The moisture level had a marked influence on the magnitude of vertical compression. Under dry (0% moisture level) conditions, the maximum vertical displacement reached 0.5 mm. When the moisture level increased to a high (100%) level, the maximum displacement decreased substantially to 0.3 mm, representing a reduction of approximately 33%. Despite this quantitative change, the overall trend of vertical deformation remained relatively consistent across different moisture levels, especially under lower normal stresses, suggesting that the interfacial behavior was not extremely sensitive to moisture in this configuration. The GCD–GMS interface is most affected by the moisture level; for example, under the normal stress of 50 kPa, when the moisture level increases from dry (0%) to high (100%) moisture levels, its maximum vertical displacement decreases significantly with the increase in moisture level, with a decrease of about 68%. The GCD–GMTI interface is least affected by the moisture level, and the maximum vertical displacement varies minimally under different moisture levels, with a decrease of approximately 7.1%. The GCD–GMTE interface reaches the maximum vertical deformation at the intermediate (50%) moisture level, and the vertical deformation decreases by 33.3% when the moisture level continues to increase. It is worth noting that the GCD–GMTE and GCD–GMTI interfaces (Figure 7b,c) showed that their final vertical deformation peaks at the intermediate (50%) moisture level, indicating high sensitivity to moisture. This non-monotonic response suggests that the intermediate (50%) moisture level may soften the GCD matrix, which enhances the interface embedding and interlocking. At this level, a strength reduction of approximately 33.3% is noted, thus promoting greater vertical displacement. To reinforce the rationale underlying this hypothesis, the relevant literature on water-induced deformation in polymeric and geosynthetic materials [44] has been referenced, with additional support from findings reported by Chai et al., 2016 [38]. When the moisture level increases to high (100%), the vertical deformation decreases, possibly due to the matrix hardening caused by saturation or the disappearance of the suction shrinkage effect. The above results confirm that the moisture level can significantly affect the vertical deformation characteristics of the GCD–GM interface, especially for the textured geomembrane interface.
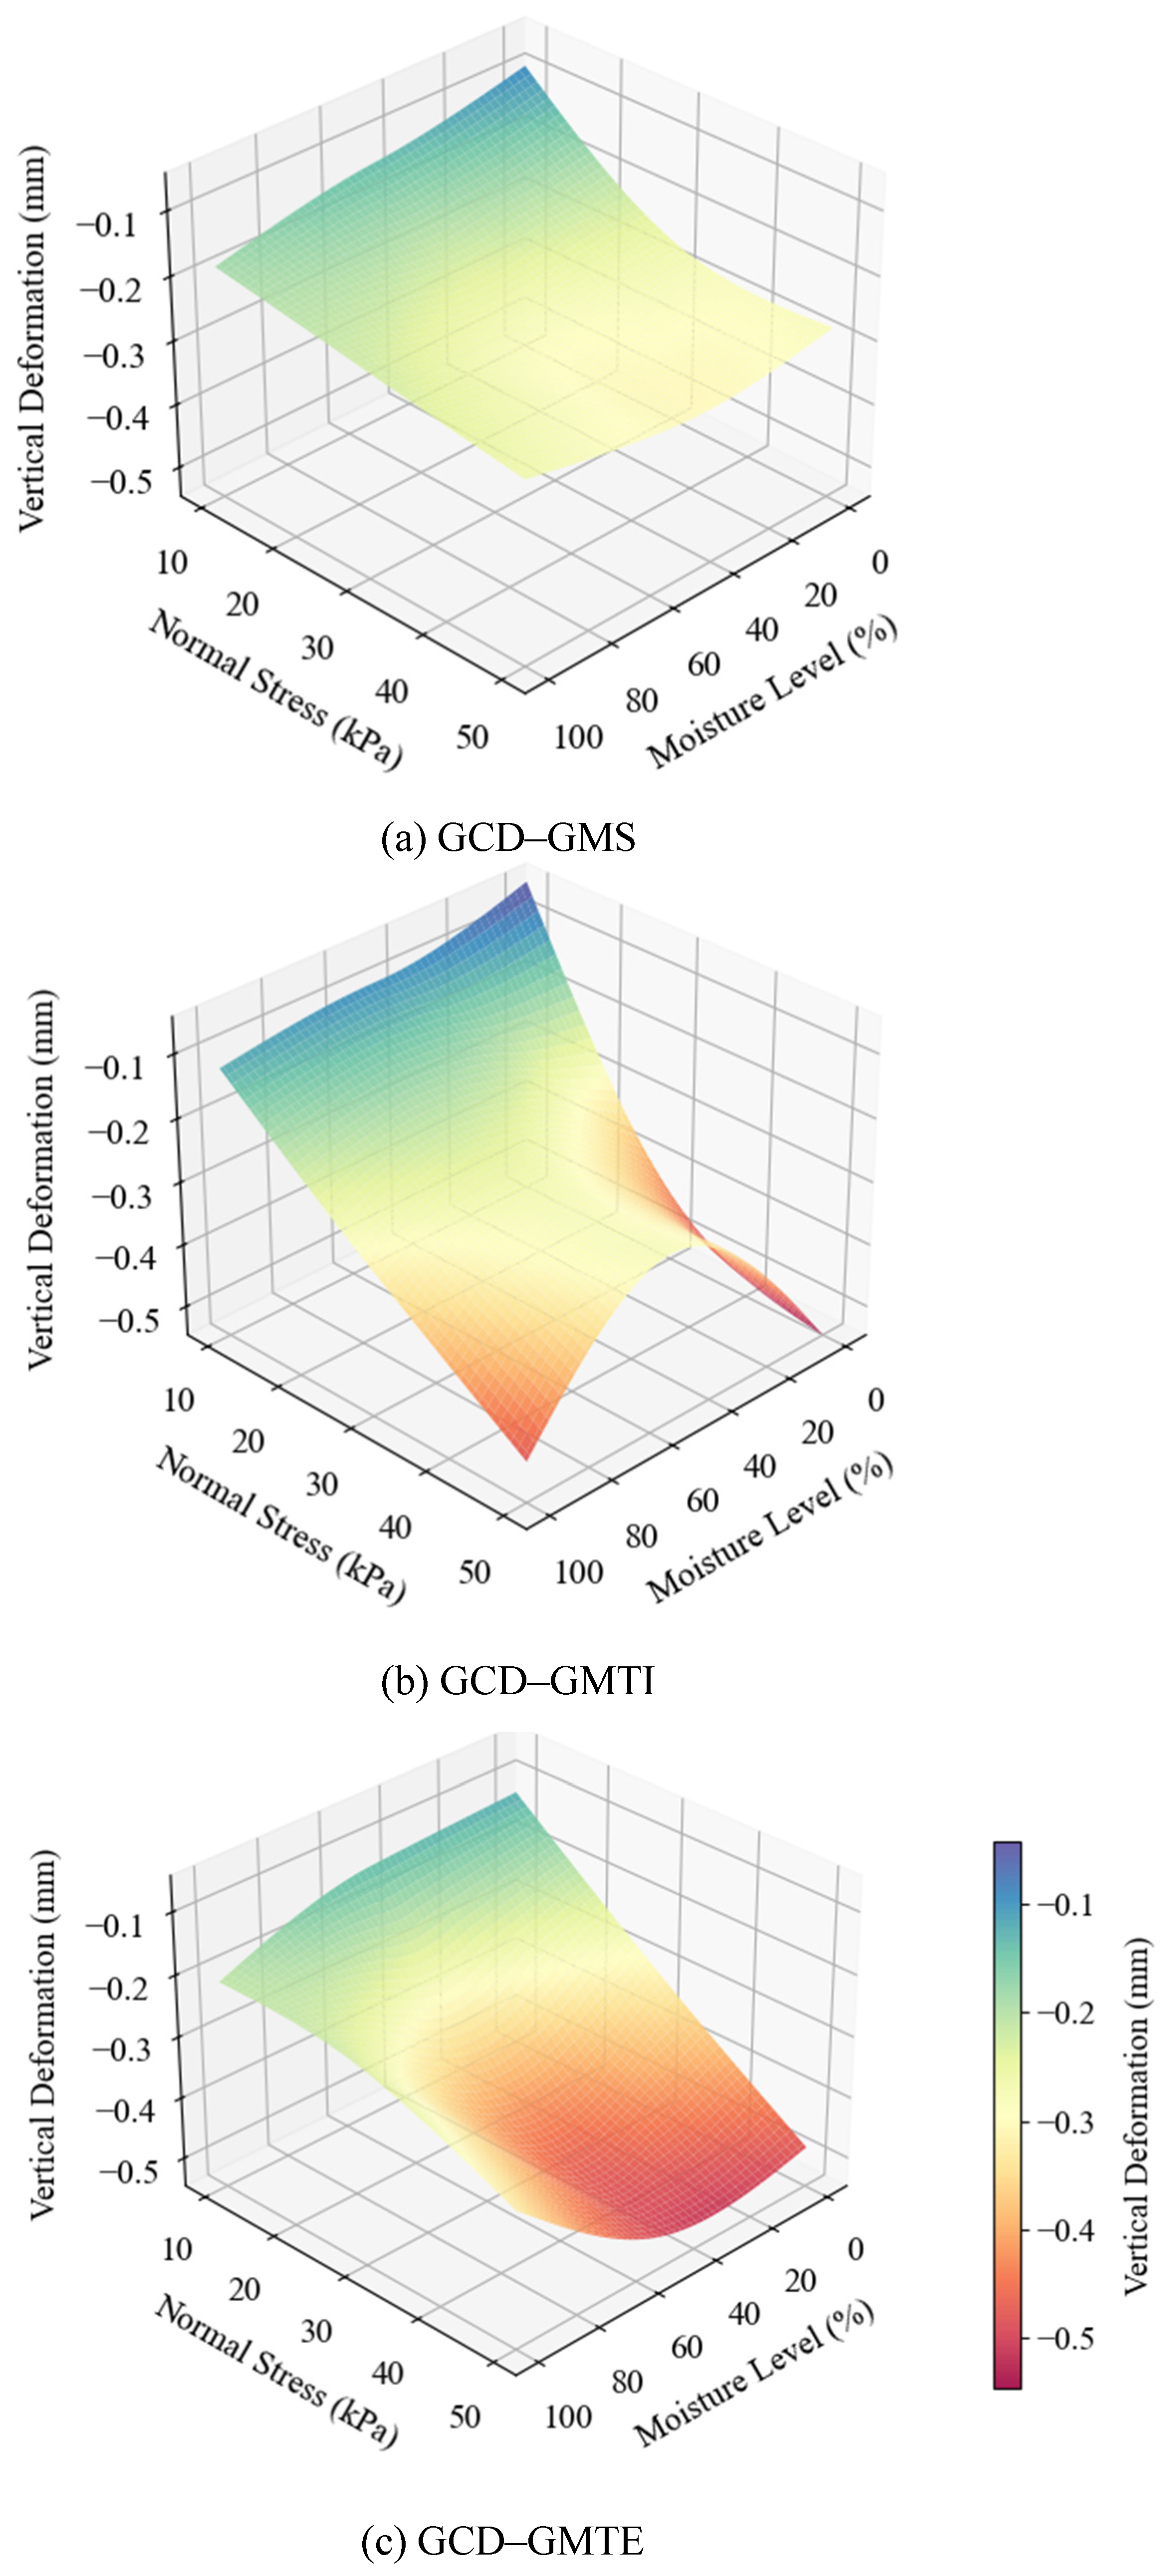
To establish the quantitative relationship between the vertical deformation in response to shear completion, normal stress, and moisture level, the spatial distribution characteristics of the three are constructed using a three-dimensional coordinate system, and a multivariate polynomial regression model is used for fitting. The expressions for GCD–GMS, GCD–GMTI, and GCD–GMTE are shown as follows:
Z = −0.0027X + −0.0078Y + 0.0000X2 + 0.0001XY + 0.0001Y2 + −0.0629 (R2 = 0.97)
Z = −0.0021X + −0.0126Y + −0.0000X2 + 0.0001XY + 0.0001Y2 + 0.0411 (R2 = 0.96)
Z = −0.0027X + −0.0086Y + −0.0000X2 + 0.0001XY + 0.0001Y2 + −0.0630 (R2 = 0.98)
Here, X denotes normal stress, with a value range of 10–50 kPa. Y represents moisture level, covering a range of 0–100%. Z refers to vertical deformation.
Figure 8a shows the predicted surface plot of the vertical deformation of the GMS interface. Normal stress (10–50 kPa) and moisture level (20–100%) significantly regulate displacement. Higher stress/moisture level intensifies negative displacement, with higher sensitivity noted in high moisture levels (60–100%). Moisture level has a mild effect under low stress (10–20 kPa), whereas deformation increases significantly when high stress (30–50 kPa) and moisture level changes synchronously, consistent with the fitting equation (R2 = 0.97). The surface color shows small deformation in the low-stress and low-moisture level area (light blue–green) and large deformation in the high-stress and high-moisture level area (yellow–orange).
Figure 8b shows the predicted surface plot of the vertical deformation of the GMTI interface. The pattern is similar to that noted for GMS. A higher stress/moisture level intensifies negative displacement, with sensitivity noted for a high moisture level. Moisture level has a mild effect under low stress, whereas deformation increases significantly when high stress and moisture level change synchronously, with the fitting equation yielding R2 = 0.96. The color distribution is the same as that noted for GMS.
Figure 8c shows the predicted surface plot of the vertical deformation of the GMTE interface. A higher stress/moisture level intensifies negative displacement, with sensitivity to high humidity. Deformation changes gently under low stress (10–20 kPa) and moisture level (20–60%), whereas it increases significantly when high stress and moisture level change synchronously. The “0.0001XY” term in the fitting equation confirms the synergistic effect (R2 = 0.98). The surface appears in light green–blue in the low-stress and low-moisture area and orange–dark red in the high-stress and high-moisture area.
In summary, all GCD–GM interfaces are regulated by the stress and moisture level. The fitting equations and color gradients provide tools for deformation prediction, facilitating engineering applications.

4. Surface Damage and Interfacial Failure Mechanisms

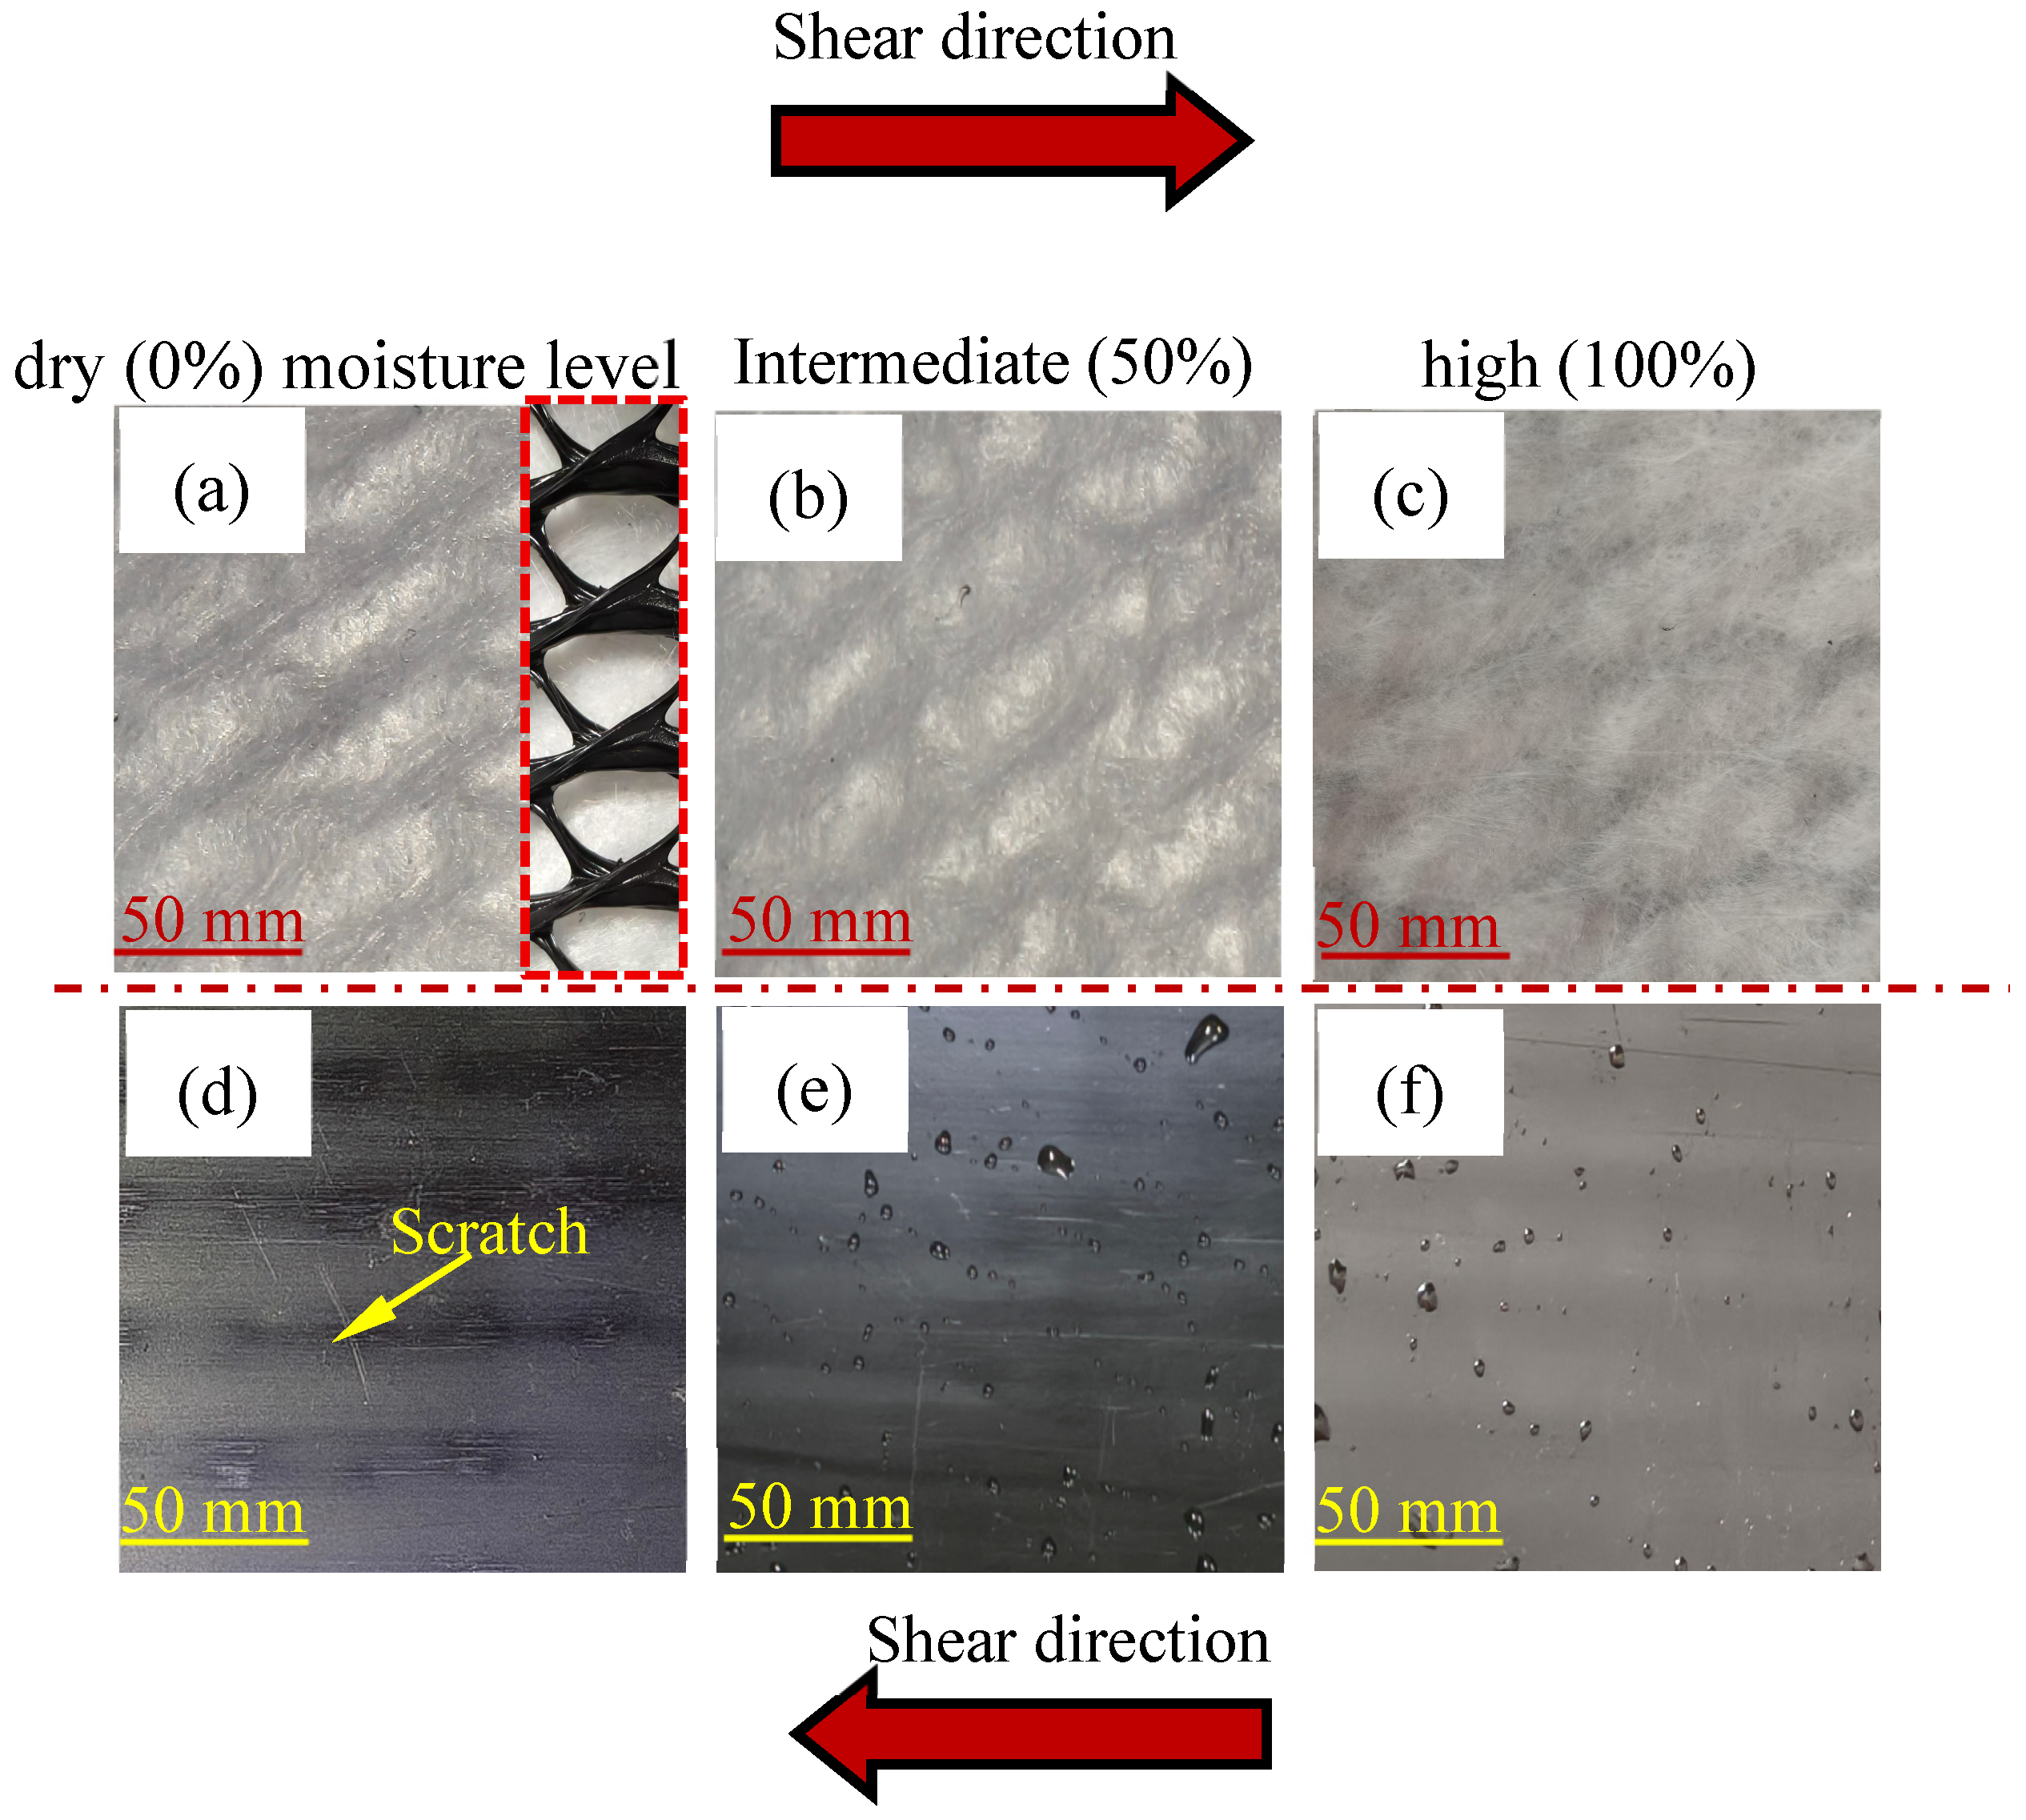
Photographs of the GCD–GMS interface under dry (0%), intermediate (50%), and high (100%) moisture levels at a normal stress of 50 kPa are shown in Figure 9. The surface of the GMS exhibited linear scratches aligned with the shear direction (see Figure 9d–f). These scratches were observed under all moisture conditions but were more pronounced, both in density and depth, under a dry (0%) moisture level (see the yellow arrows in Figure 9d), which suggests that the ribs of the drainage core (see the red dashed box in Figure 9a) abrade the GMS surface under shear stress. In contrast, the nonwoven geotextile of GCD showed minimal disturbance (see Figure 9a–c), with no visible combing, likely due to the absence of surface texture on the GMS. These observations indicate that surface friction mechanisms between the GMS and GCD primarily govern shear resistance at the GCD–GMS interface. As the moisture level increased, interfacial lubrication effects became more prominent, further reducing the shear strength. This moisture-dependent weakening, combined with the absence of mechanical interlock, contributed to the GCD–GMS interface exhibiting the lowest interfacial strength among all tested combinations, along with minimal post-peak strength loss, consistent with the trends shown in Figure 4.
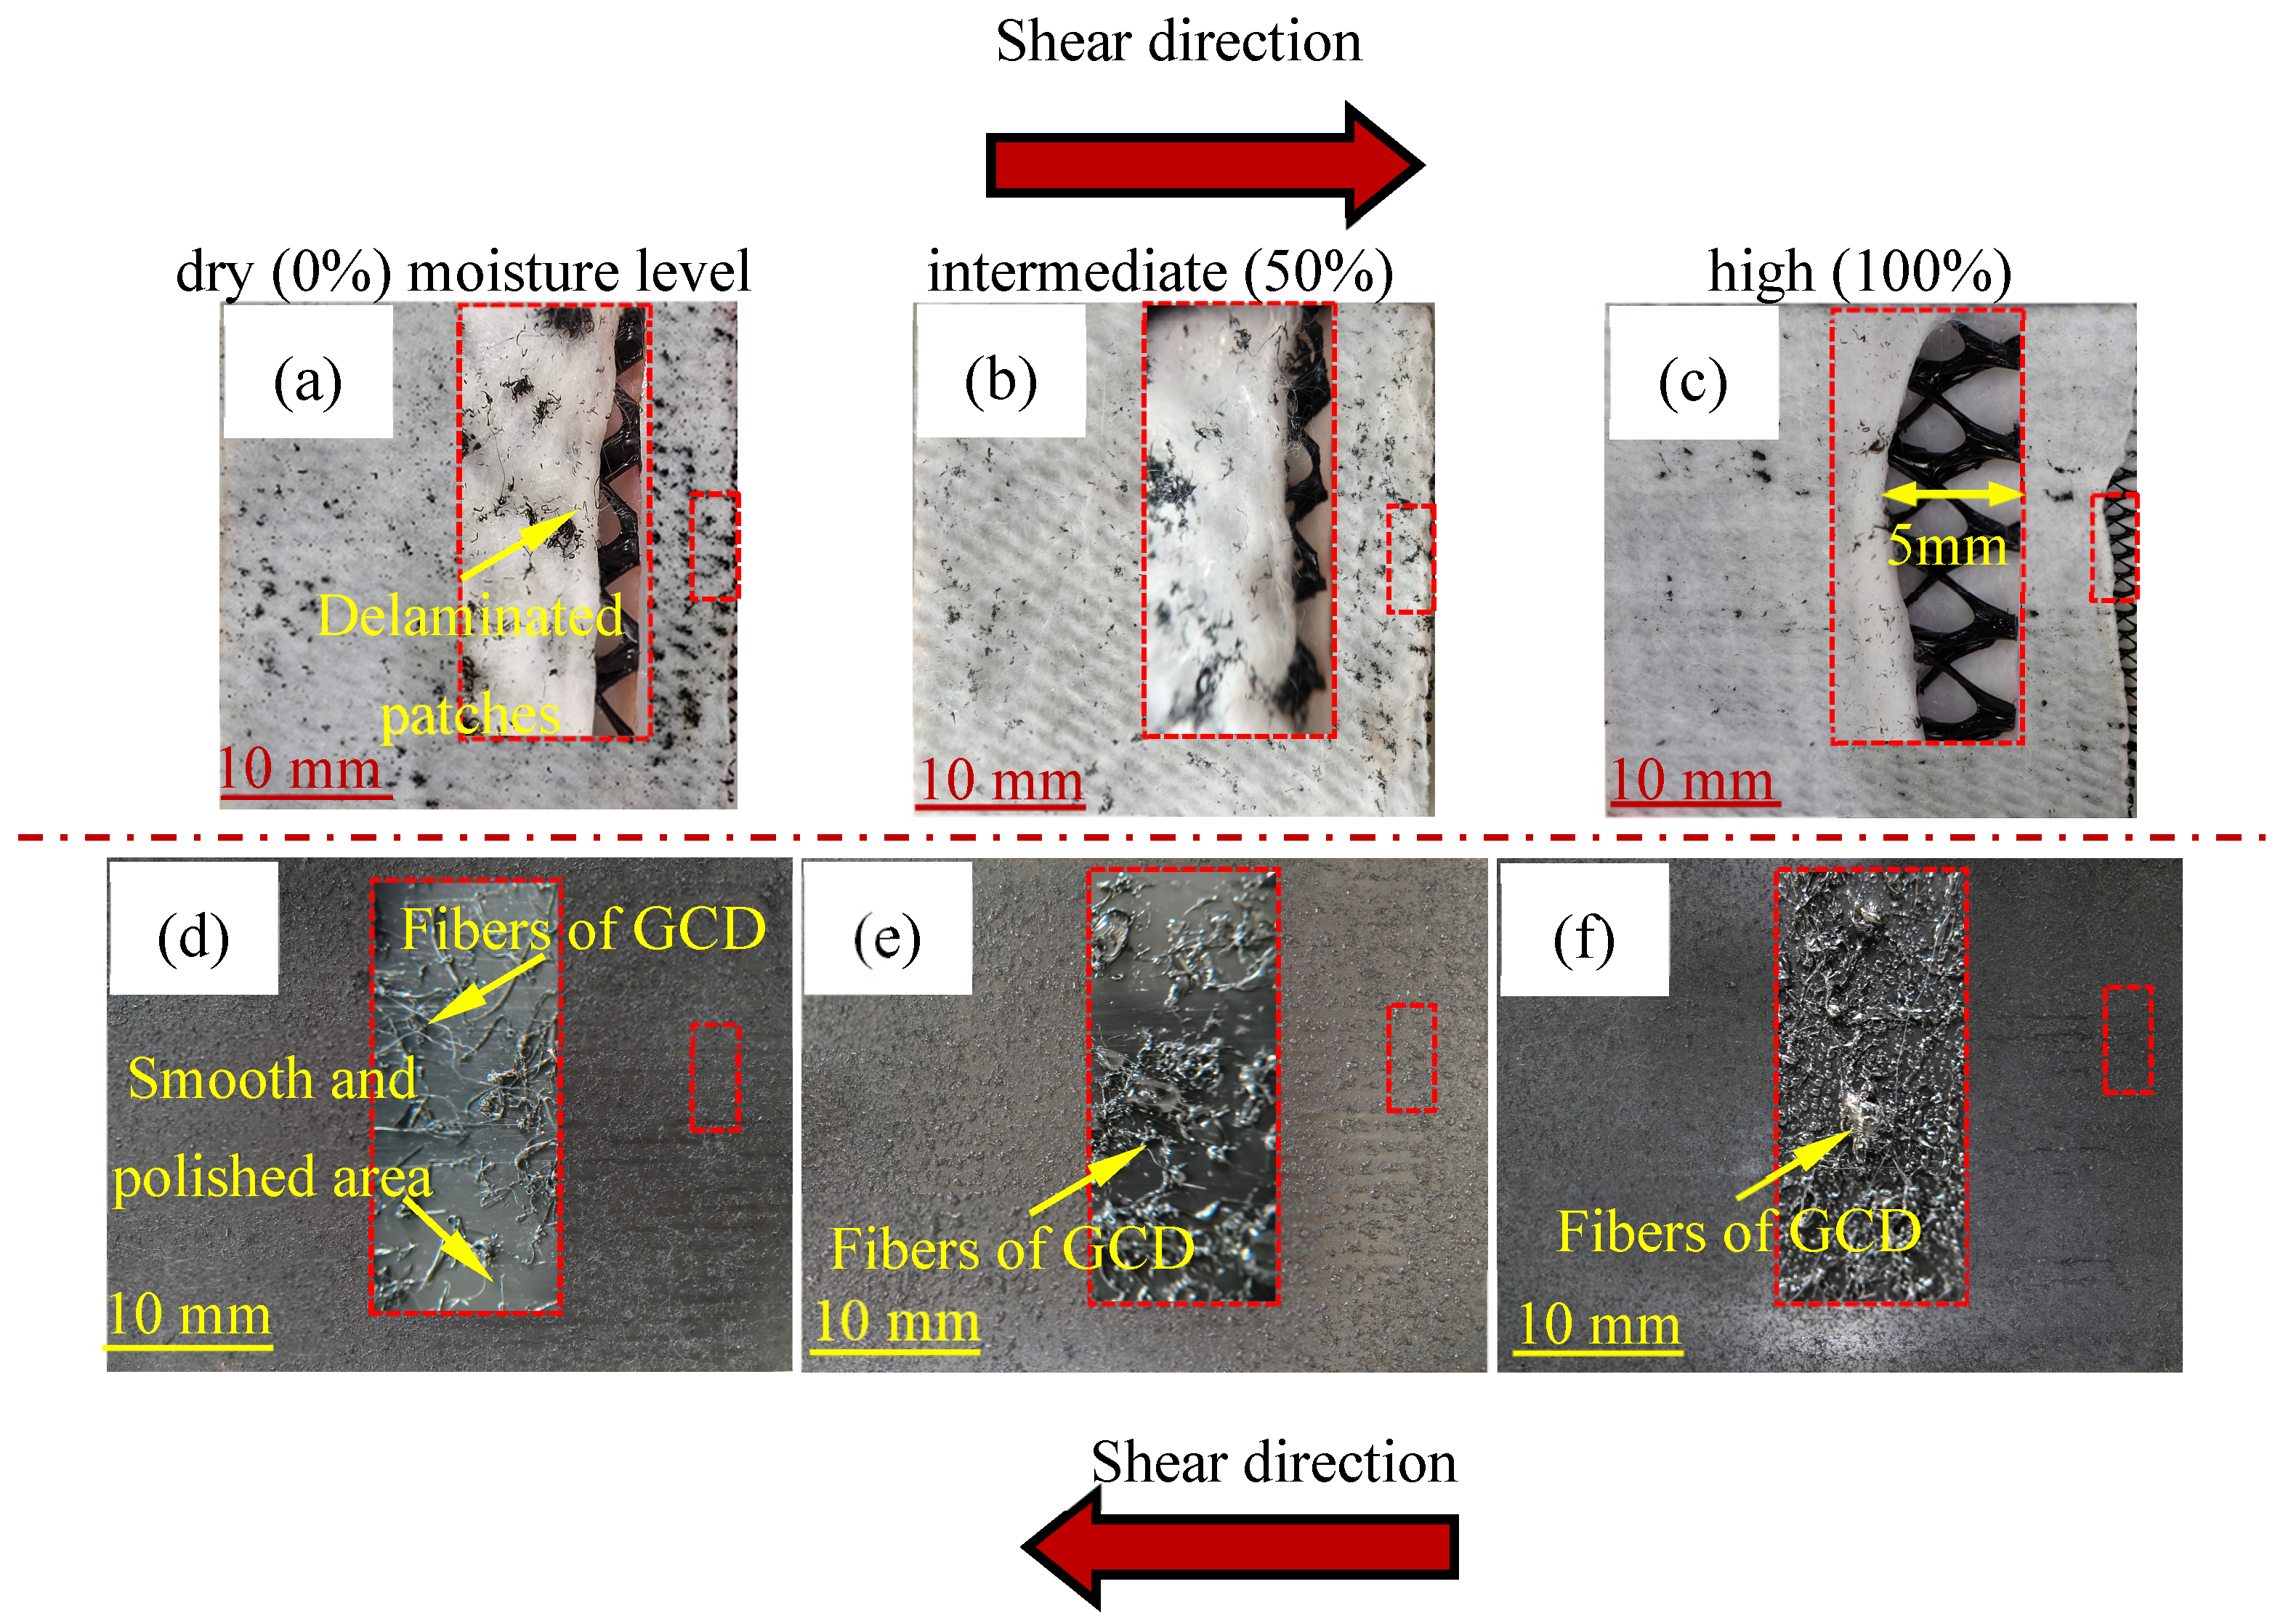
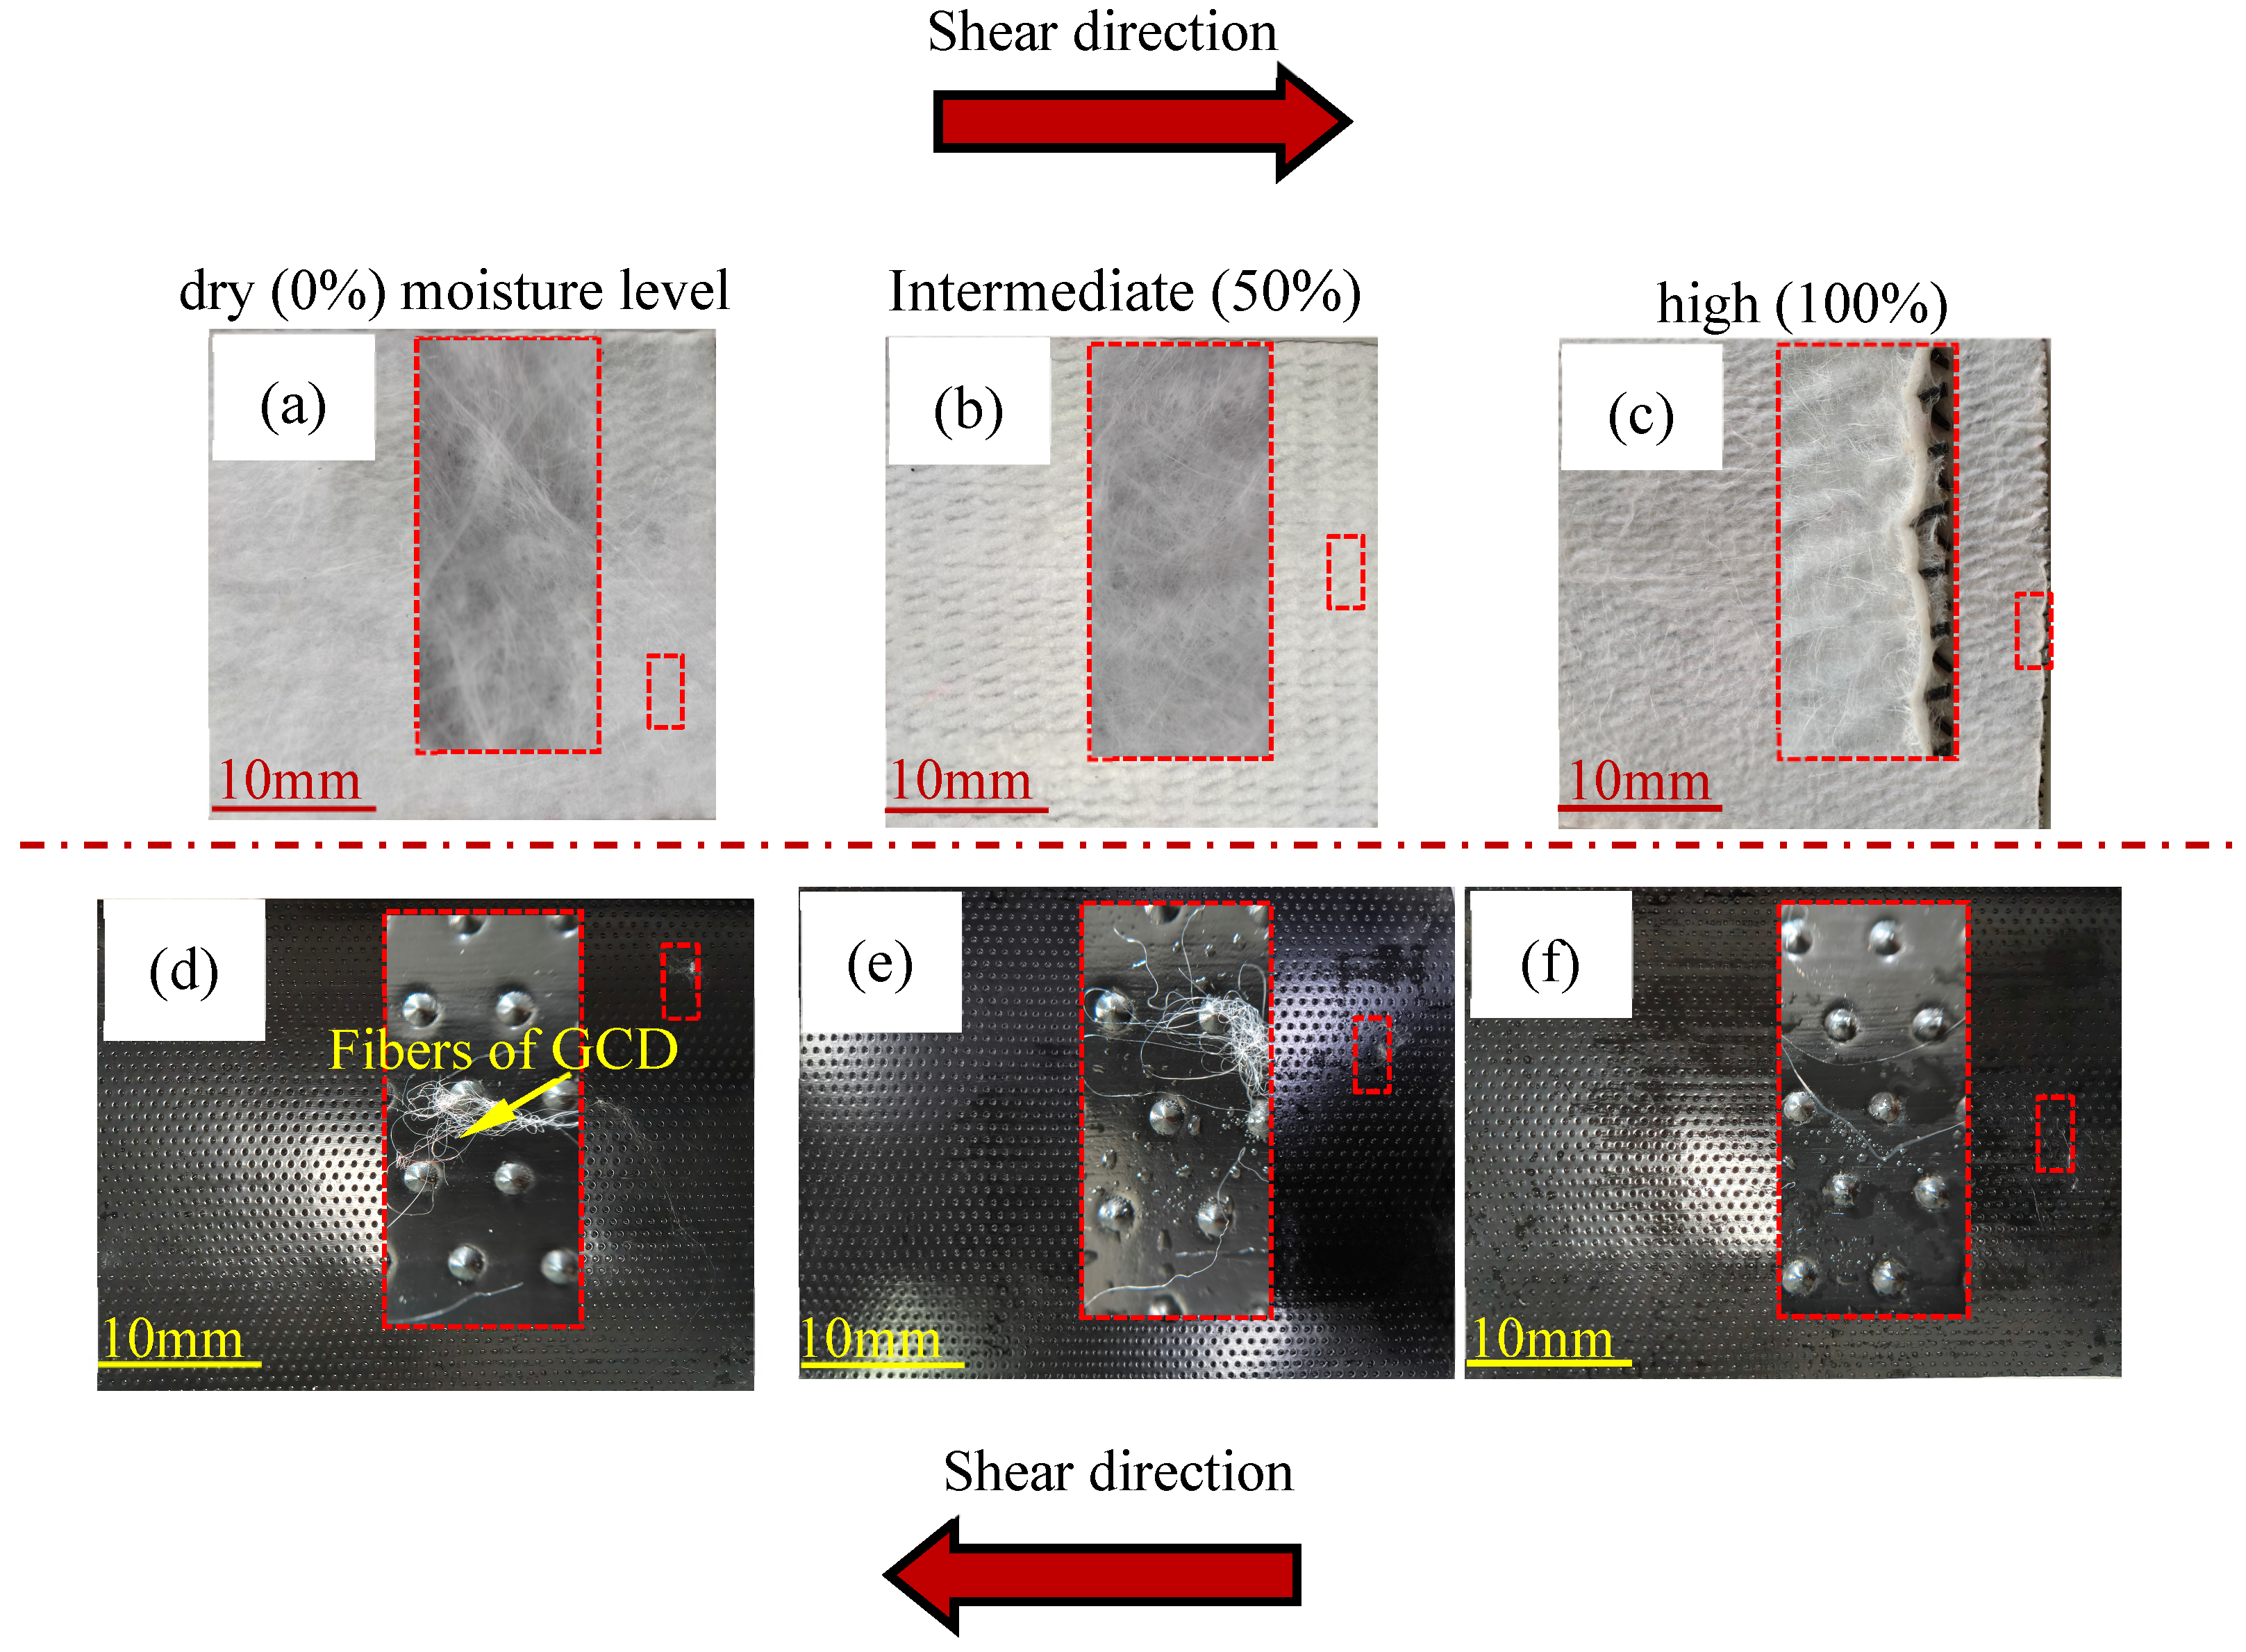
Figure 10 presents photographs of the sheared GCD and GMTI surfaces under varying moisture levels. Across all conditions, stratification and delamination of the texturing were observed (see the red dashed boxes in Figure 10a–c), indicating that shear loading was sufficient to separate portions of the texturing surface from the geomembrane base and embed them into the geotextile layer of the GCD. Particularly under dry (0% moisture level) conditions, large fragments of the delaminated texturing were visibly integrated into the geotextile matrix (Figure 10a). Extensive texture-polished zones were evident on the post-sheared GMTI surface (see the smooth polished area in the red dashed box and the shed fibers of GCD in Figure 10d). This behavior supports the presence of a “hook-and-loop” interaction mechanism at the interface [45,46]. The delamination phenomenon was accompanied by moderate fiber combing, suggesting that post-peak strength loss was primarily governed by detachment of the texturing rather than changes in fiber alignment (see Figure 10a,b). At an intermediate (50%) moisture level, similar texture embedding was observed, along with localized internal disruptions within the GCD (Figure 10b,e), indicating the onset of internal structural compromise. Under high (100%) moisture level, the degree of delamination diminished. However, more extensive internal damage was noted within the GCD layer, including dissected zones up to 5 mm in width (see the red dashed boxes in Figure 10c,f). These findings indicate that there is a transition in the dominant failure mechanism with increasing moisture levels from surface delamination at low moisture levels to internal degradation of the GCD at higher moisture levels.
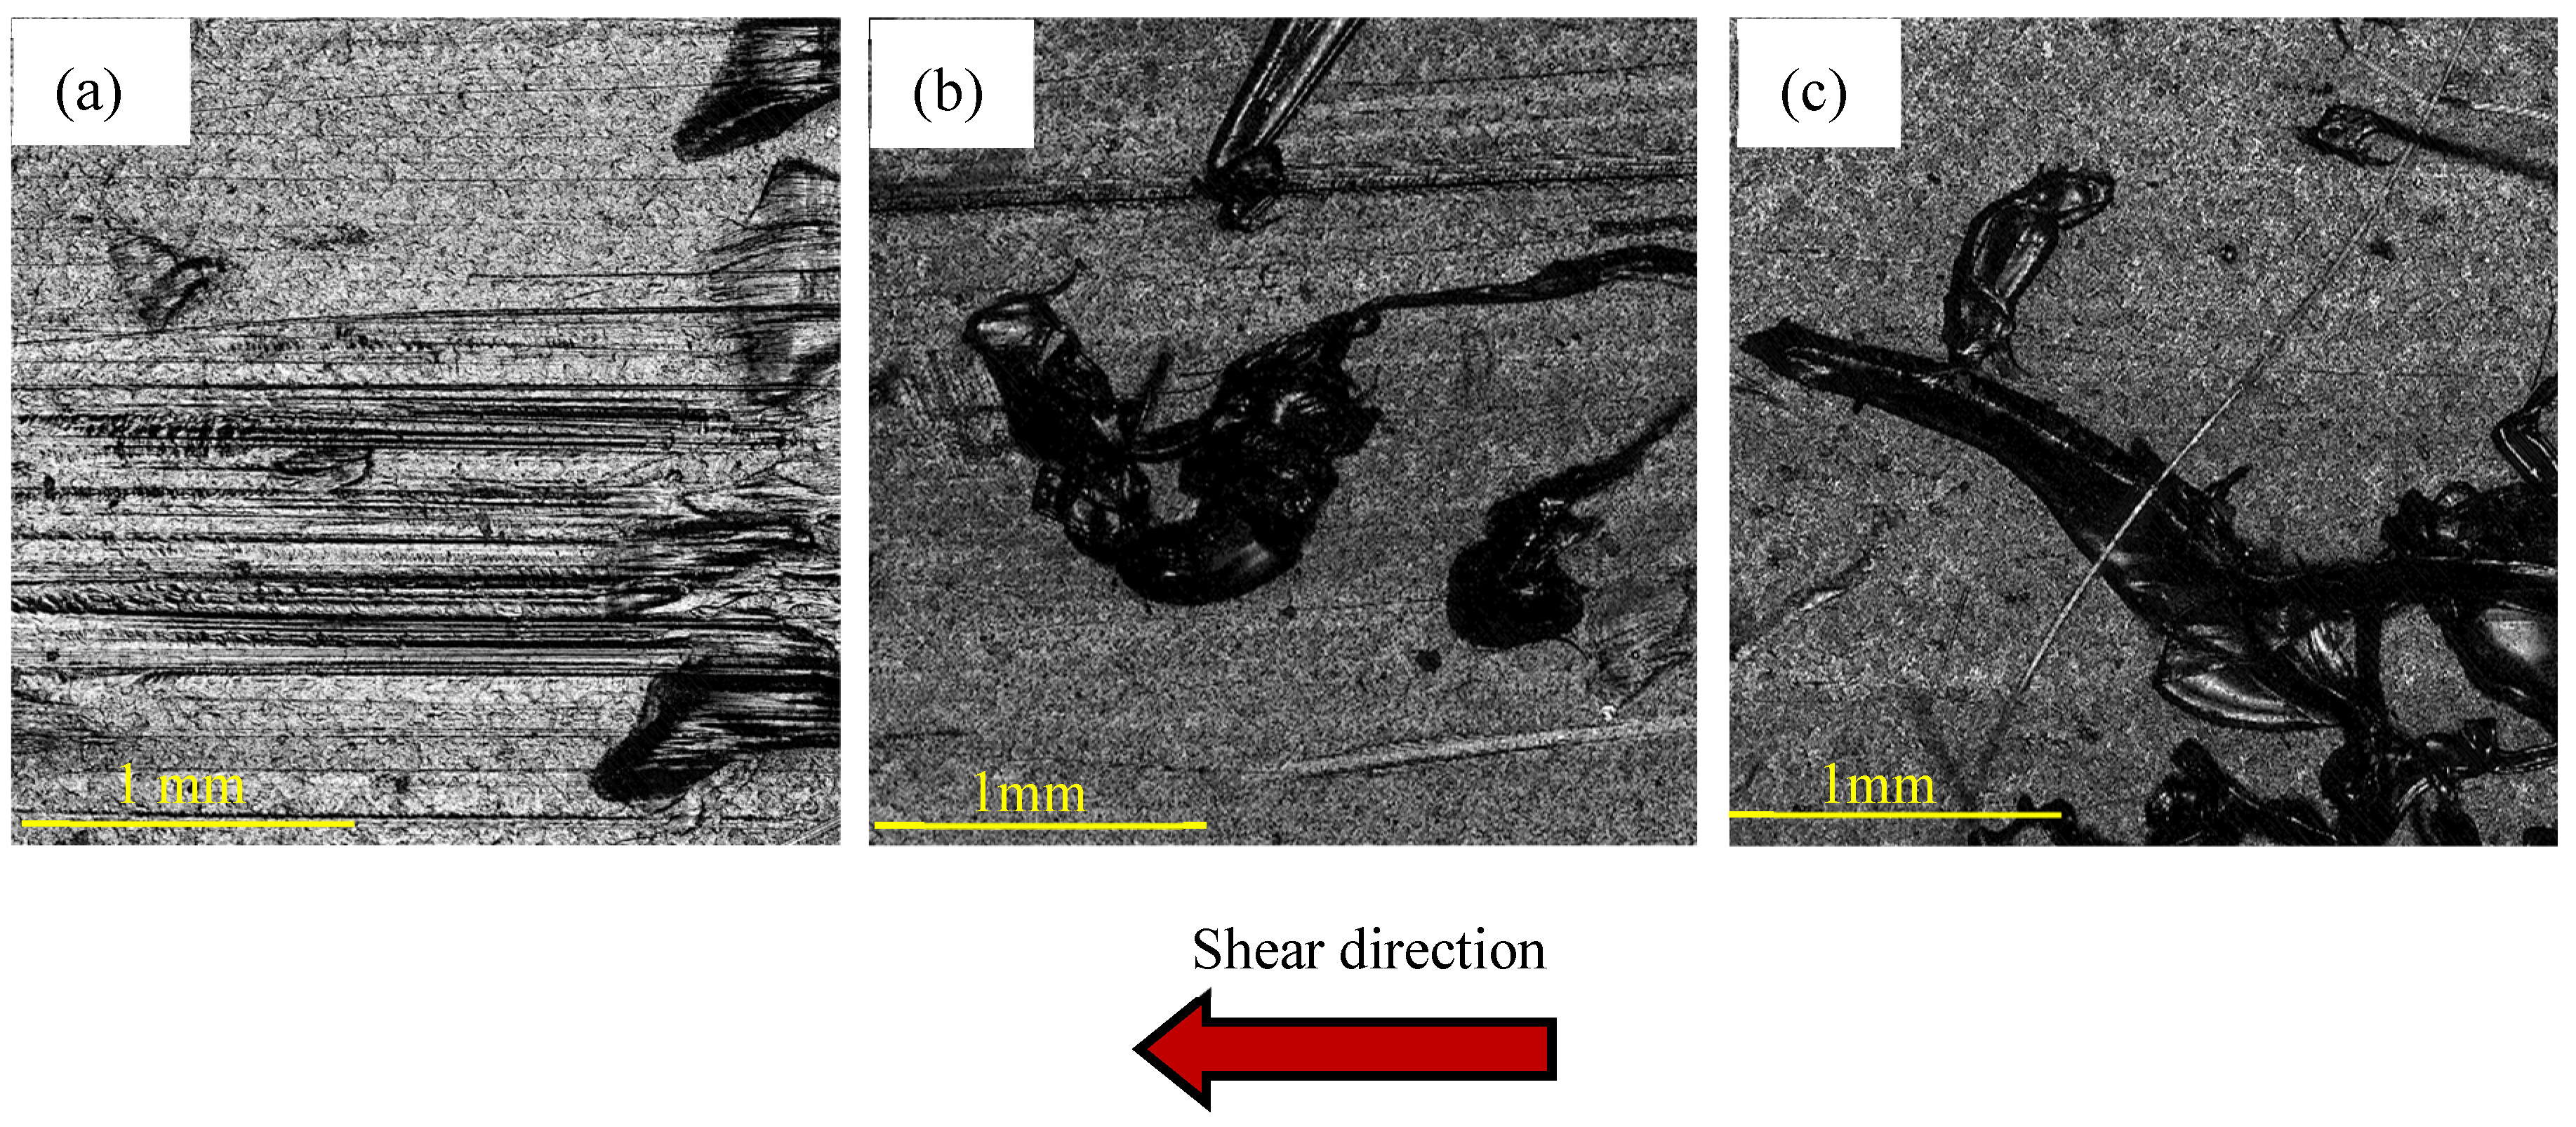
To further characterize the surface conditions of the GMTI interface following shear stress, three-dimensional contour scanning was conducted, as shown in Figure 11. The scans were performed on a 2.83 mm × 2.83 mm region at a resolution of 1.38 µm/pixel (2048 × 2048 pixels), captured at five times magnification. In the resulting topographic images, darker shades represent smoother, texture-free zones, whereas lighter and black regions correspond to intact texturing. As the moisture level increased, the scanned surfaces revealed progressively larger smooth regions, corroborating the visual evidence of texture removal and interfacial wear. These surface morphology results further validate the progression of failure modes as a function of moisture, highlighting the combined effects of texture delamination and GCD degradation in controlling interfacial behavior.
The surface roughness of the GMTI is quantified using the roughness parameter as follows [47]:
R s = A s A o
where As is the actual surface area of the profile, and Ao is the projected area of the profile. The values of As and Ao were calculated directly using the SensoView software.
According to Equation (6), the theoretical minimum surface roughness factor Rs is 1, corresponding to a perfectly smooth geomembrane surface where the actual surface area equals the projected area. The initial Rs value of the GMTI surface before shear was 1.425, reflecting its pronounced texture. Post-shear Rs values were calculated for GMTI surfaces under varying moisture levels at a normal stress of 50 kPa. The shear strength of GCD–GMTI reached its largest peak shear strength under this 50 kPa stress, concomitantly with the most pronounced surface damage to the GMTI. As shown in Figure 11, the roughness factor Rs decreased significantly after shear, with values of 1.046, 1.105, and 1.390 for dry (0%), intermediate (50%), and high (100%) moisture levels, respectively. These correspond to 73%, 78%, and 94%, respectively, of the original pre-shear roughness value of 1.425, indicating progressive surface wear and texture degradation. The most pronounced reduction occurred at a dry (0%) moisture level, where the Rs value was reduced to 1.046 (Figure 11a), suggesting substantial loss of surface texture due to delamination and embedment into the GCD layer. Under an intermediate (50%) moisture level, the Rs value was slightly higher at 1.105 (Figure 11b), indicating partial preservation of surface features. At a high (100%) moisture level, the post-shear surface retained more of its roughness, with an Rs of 1.390 (Figure 10c), representing only a 6% reduction from the pre-shear condition. The data on the Rs of GMTI after shearing are summarized in Table 6 under different moisture levels at a normal stress of 50 kPa. These observations are consistent with the shear strength trends presented in Figure 6b, where greater strength losses were recorded under a dry (0%) moisture level. Furthermore, the values align with the surface damage mechanisms illustrated in Figure 10c,f, suggesting a shift in failure mode with increasing moisture levels from interfacial delamination at low moisture levels to internal deformation and failure within the GCD at high moisture levels. This evolution highlights the moisture-dependent nature of interface degradation and the role of geomembrane texturing in post-peak mechanical response.
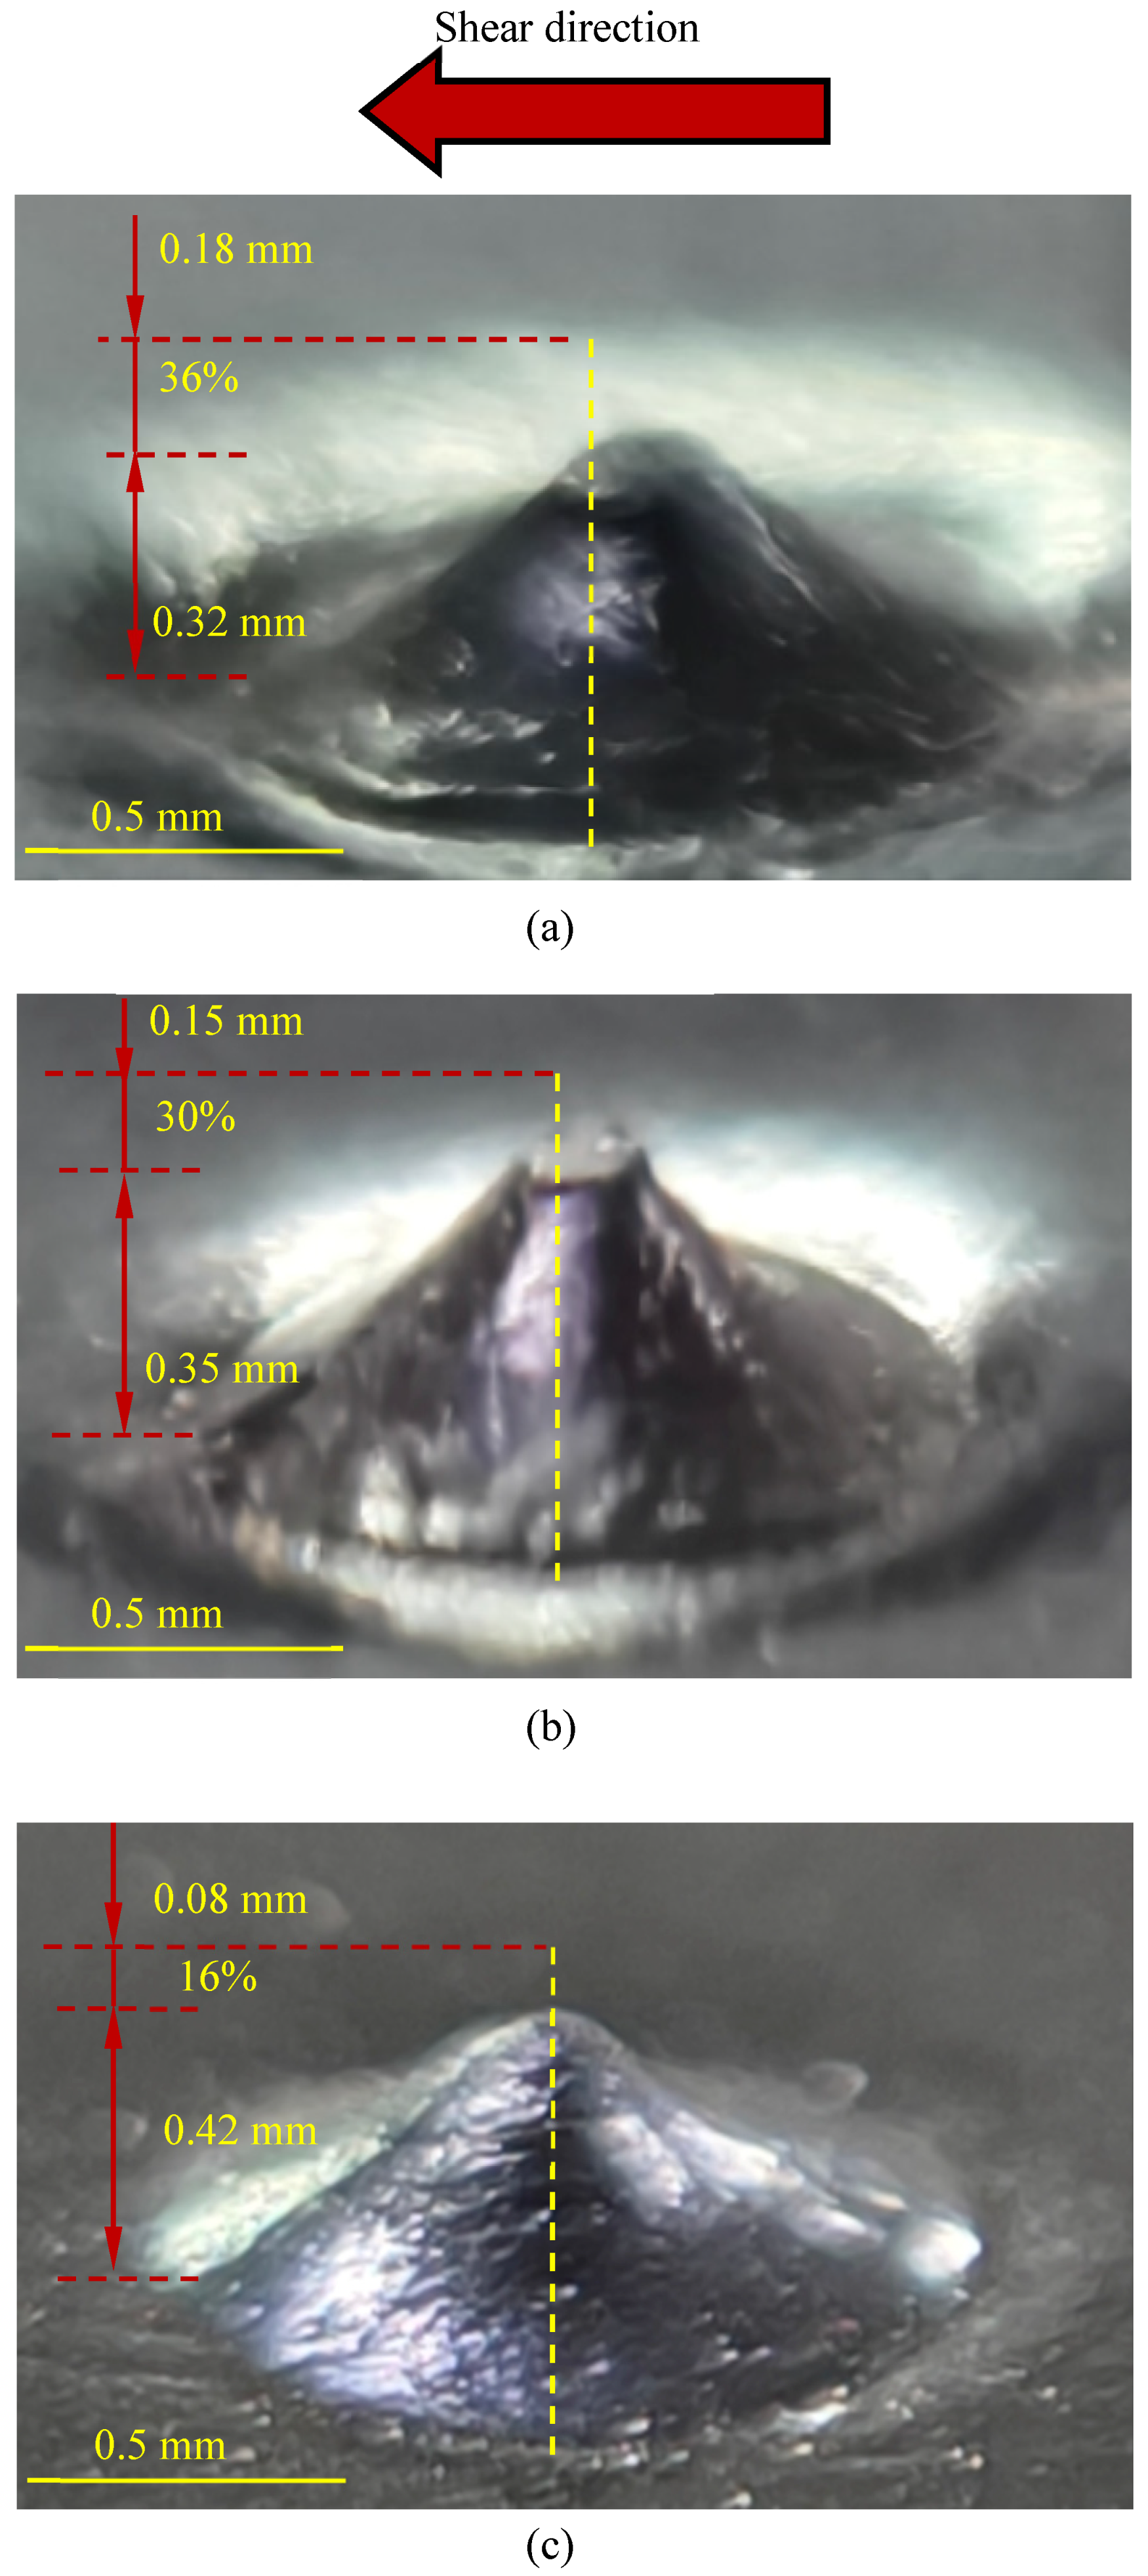
The GMTE exhibits a distinct surface morphology compared to the GMTI evaluated in previous tests. As illustrated in Figure 12, the photograph of the GCD–GMTE interface reveals direct contact between the convex embossed texture tips and the geotextile surface. Under dry (0%) and intermediate (50%) moisture levels, the embossed tips exhibit pronounced penetration into the geotextile, promoting mechanical interlocking with the drainage core of the GCD. The embossed tips effectively hook into the fibers of the geotextile, enhancing interfacial shear resistance through a combination of tip embedment and fiber entanglement (see the red dashed boxes in Figure 12a,b,e). However, under a high (100%) moisture level, the degree of penetration decreases and signs of localized internal damage within the GCD become evident (see the red dashed boxes in Figure 12c,f). This observation confirms a moisture-driven shift in the governing failure mechanism. Specifically, at 0% and 50% moisture levels, failure is dominated by interfacial failure characterized by pronounced fiber pull-out and surface abrasion, which are direct manifestations of texture-fiber interlocking. In contrast, at higher (100%) moisture levels, the failure mechanism transitions to a mixed mode involving both interface degradation (as evidenced by core delamination and reduced interfacial friction due to matrix softening) and internal GCD deformation. This refined characterization aligns with the typical damage patterns observed on the interface surface, further supporting the hypothesis of a moisture-induced transition in failure mechanisms. To quantify the extent of penetration, the heights of the embossed tips were measured before and after shear using precision calipers. The reduction in embossed tip height served as an indirect indicator of penetration depth into the GCD matrix. Under dry (0% moisture level) conditions, the penetration depth of the embossed tips was approximately 0.18 mm, anchoring deeper and more firmly in the GCD (see Figure 13a). During shear deformation, the embossed tips underwent significant rounding and smoothing, with the tip height reduced by up to 36% (Figure 13a) as they moved across the GCD surface. At an intermediate (50%) moisture level, the estimated penetration depth was approximately 0.15 mm, with the tip height reduced by up to 30% (Figure 13b). In contrast, the estimated penetration depth under saturated conditions was approximately 0.08 mm, with the tip height reduced by up to 16% (Figure 13c). The variations in the embossed tip data of GMTE following shearing under different moisture levels at a normal stress of 50 kPa are summarized in Table 7. This progressive deformation contributed to a relatively low post-peak strength loss and a high LD-to-peak strength ratio for the GCD–GMTE interface, as reported earlier in Section 3.2. Additionally, as shear displacement increased, the embossed tips shifted laterally relative to the geotextile plane, thereby increasing the effective contact area between the GMTE and the underlying nonwoven geotextile. Enhanced shear tracks increased pre-peak displacement by 13–104% comparing GMTE to GMS, indicating greater deformation before sliding, which is important for early warning. Stable resistance with post-peak strength ratios of 0.6–0.8 for GMTI and 0.5–1.0 for GMTE suggests more gradual stress release and reduced risk of sudden failure. Collectively, these findings underscore the role of texture geometry and deformation in governing the unique shear response of the GCD–GMTE interface across varying moisture levels.

5. Summary and Conclusions

This study evaluated the shear behavior of GCD–GM interfaces incorporating different GM surface textures under varying moisture levels and normal stresses. Some key findings are as follows:
(1)
All GCD–GM interfaces showed strain-softening with strength decreasing after peak displacement. Textured geomembranes—especially the impinged type—significantly improved peak and large displacement strengths and better resisted moisture-induced weakening. Although higher normal stress increased strength, its effect weakened under high moisture levels, indicating that surface texture is crucial for interface stability in moist landfill overs.
(2)
Post-peak strength retention varied by interface type, texture, moisture, and stress. The smooth interface had stable LD-to-peak ratios (0.8–0.9), showing minimal strength loss after peak. The impinged interface experienced a notable reduction in strength (0.7–0.8), especially under dry (0% moisture level) and high-stress conditions, due to aggressive texture damage. The embossed interface showed variable ratios, peaking under an intermediate (50%) moisture level and low stress but declining with moisture level. This highlights the importance of the texture method of GM and the environment on large displacement strength.
(3)
Shear strength followed linear Mohr–Coulomb trends (R2 > 0.90). Moisture reduced friction angles and cohesion, with smooth GM presenting the highest sensitivity. The GCD–GMTI interface exhibits the highest peak friction angle under the dry (0% moisture level) condition. However, when the moisture level increases to a high (100% moisture) level, its peak friction angle decreases to 18°. However, it still maintains the largest peak friction angle among the three interfaces. Meanwhile, the GCD–GMTE interface demonstrates relatively stable LD performance and higher cohesion in humid environments. An optimized surface texture enhances interface stability, particularly under moist conditions.
(4)
Vertical deformation was limited to 0.6 mm during shearing. Compression decreased with moisture for GMS but GMTI and GMTE showed maximum deformation at an intermediate (50%) moisture level, likely due to matrix softening and improved interlocking. Deformation declined again at a high (100%) moisture level, possibly from stiffening effects.
(5)
Microscopic observations showed that moisture influenced failure modes. GMS relied on friction with linear abrasion and fiber integrity loss, which were noted under moist conditions. GMTI exhibited strong mechanical interlock with texture delamination and embedding, while a high (100%) moisture level shifted failure toward internal deformation. GMTE exhibited intermediate behavior, with dry (0% moisture level) conditions promoting tip penetration and moist conditions enhancing lateral contact, resulting in more stable post-peak strength. Surface texture and moisture level critically affect long-term shear behavior. Although promising for landfill stability, these results need further field validation.

Author Contributions

J.H., writing—review and editing, writing—original draft, visualization, validation, supervision, resources, project administration, methodology, investigation, funding acquisition, data curation, and conceptualization. Y.Z. and X.X., writing—original draft, visualization, software, investigation, and data curation. All authors have read and agreed to the published version of the manuscript.

Funding

This research was funded by the National Natural Science Foundation of China, grant number [52478349, 51978390, 51778353], the Qinghai Provincial Department of Science and Technology International Cooperation Project, grant number [2025-HE-806], the 2023 Basic Research Program of Qinghai Province, [2023-ZJ-756], and the China Scholarship Council (CSC 202506890127). And the APC was funded by [51978390].

Institutional Review Board Statement

Not applicable.

Informed Consent Statement

Not applicable.

Data Availability Statement

The data presented in this study are available on request from the corresponding author.

Acknowledgments

This study has been supported by the National Natural Science Foundation of China (52478349, 51978390, 51778353), the Qinghai Provincial Department of Science and Technology International Cooperation Project (2025-HE-806), the 2023 Basic Research Program of Qinghai Province (2023-ZJ-756), and the China Scholarship Council (CSC 202506890127).

Conflicts of Interest

The authors declare no conflicts of interest.

References

  1. Arifuzzaman; Rahman, M.M.; Karim, M.R.; Hewa, G.A.; Rawlings, R.; Iqbal, A. Phytocapping for Municipal Solid Waste Landfills: A Sustainable Approach. Sustainability 2024, 16, 8230. [Google Scholar] [CrossRef] [Scilit]
  2. Li, J.; Liu, K. Sustainable Space Transformation Design Strategies for Post-Landfill Closure. Sustainability 2024, 16, 3463. [Google Scholar] [CrossRef] [Scilit]
  3. Ng, C.W.W.; Coo, J.L.; Chen, Z.K.; Chen, R. Water infiltration into a new three-layer landfill cover system. Waste Manag. 2015, 42, 121–131. [Google Scholar] [CrossRef] [Scilit]
  4. Fuller, J.M. Landfill cap designs using geosynthetic clay liners. In Proceedings of the International Symposium on Geo-Synthetic Clay Liners, Nuremberg, Germany, 16–17 April 2002; CRC Press: London, UK, 2020; p. 129. [Google Scholar]
  5. Zhang, D.; Wang, J.; Chen, C. Gas and liquid permeability in the variably saturated compacted loess used as an earthen final cover material in landfills. Waste Manag. 2020, 105, 49–60. [Google Scholar] [CrossRef] [Scilit]
  6. Teng, C.; Zhou, K.; Peng, C.; Chen, W. Characterisation and treatment of landfill leachate: A review. Chemosphere 2020, 248, 125–131. [Google Scholar]
  7. Albright, W.H.; Benson, C.H.; Gee, G.W.; Roesler, A.C.; Abichou, T.; Apiwantragoon, P.; Lyles, B.F.; Rock, S.A. Field water balance of landfill final covers. J. Environ. Qual. 2004, 33, 2317–2332. [Google Scholar] [CrossRef] [Scilit]
  8. Cortellazzo, G.; Russo, L.E.; Busana, S.; Carbone, L.; Favaretti, M.; Hangen, H. Field trial of a reinforced landfill cover system: Performance and failure. Geotext. Geomembr. 2022, 50, 655–667. [Google Scholar] [CrossRef] [Scilit]
  9. Eid, H.T. Shear strength of geosynthetic composite systems for design of landfill liner and cover slopes. Geotext. Geomembr. 2011, 29, 335–344. [Google Scholar] [CrossRef] [Scilit]
  10. Feng, S.-J.; Ai, S.-G.; Huang, R.-Q. Stability analysis of landfill cover systems considering reinforcement. Environ. Earth Sci. 2016, 75, 303. [Google Scholar] [CrossRef] [Scilit]
  11. Cossu, R.; Stegmann, R. Landfill covers: Principles and design. In Solid Waste Landfilling: Concepts, Processes, Technologies; Christensen, T.H., Cossu, R., Stegmann, R., Eds.; Elsevier: Amsterdam, The Netherlands, 2018; pp. 649–676. [Google Scholar]
  12. Cazzuffi, D.; Gioffrè, D. Geomembrane barrier systems for construction and rehabilitation of embankment dams. In Smart Geotechnics for Smart Societies; CRC Press: Boca Raton, FL, USA, 2023; pp. 164–179. [Google Scholar]
  13. Stark, T.D.; Newman, E.J. Design of a landfill final cover system. Geosynth. Int. 2010, 17, 124–131. [Google Scholar] [CrossRef] [Scilit]
  14. Chetri, J.K.; Reddy, K.R. Advancements in municipal solid waste landfill cover system: A review. J. Indian Inst. Sci. 2021, 101, 557–588. [Google Scholar] [CrossRef] [Scilit]
  15. Goldenberg, M.; Reddy, K.R. Sustainability assessment of conventional and alternate landfill cover systems. In Proceedings of the Geotechnical Frontiers 2017, Orlando, FL, USA, 12–15 March 2017; pp. 323–332. [Google Scholar]
  16. Quispe-Astete, E.R.; Huallanca, W.J.; Parra, D.A. Shear strength evaluation of soil-geosynthetic and geosynthetic interfaces of closure cover systems. Int. J. Geosynth. Ground Eng. 2023, 9, 87. [Google Scholar] [CrossRef] [Scilit]
  17. Lin, H.; Han, Z.W.; Shi, J.Y. Interface shear failure mechanisms and peak strength analysis of geosynthetics. J. Huazhong Univ. Sci. Technol. (Nat. Sci. Ed.) 2020, 48, 99–106. [Google Scholar]
  18. Hou, J.; Xing, X.; Xu, D.; Lu, X.Q. Experimental study on dynamic shear characteristics of geomembrane-geotextile interface. Rock Soil Mech. 2022, 43, 365–376. [Google Scholar]
  19. Shi, J.Y.; Qian, X.D.; Zhu, Y.B. Experimental methods for interface behaviors of geosynthetics in landfills. Chin. J. Geotech. Eng. 2010, 32, 688–692. [Google Scholar]
  20. Shi, J.; Shu, S.; Qian, X.; Wang, Y. Shear strength of landfill liner interface in the case of varying normal stress. Geotext. Geomembr. 2020, 48, 713–723. [Google Scholar] [CrossRef] [Scilit]
  21. Shi, J.Y.; Qian, X.D.; Zhu, Y.B. Direct shear test study on shear characteristics of composite liners in landfills. Rock Soil Mech. 2010, 31, 1112–1117. [Google Scholar]
  22. Stark, T.D.; Poeppel, A.R. Landfill liner interface shear strengths from torsional-ring-shear tests. J. Geotech. Eng. 1994, 120, 597–615. [Google Scholar] [CrossRef] [Scilit]
  23. Lin, W.A.; Zhan, L.T.; Chen, Y.M.; Wang, X.Z. Study on interface shear characteristics of liners with geocomposite drainage nets. Chin. J. Geotech. Eng. 2010, 32, 693–697. [Google Scholar]
  24. Lin, J.; Stark, T.D.; Idries, A. Extrapolating residual GMX/GDC interface strength from direct shear tests. Geosynth. Int. 2023, 31, 1011–1021. [Google Scholar] [CrossRef] [Scilit]
  25. Koerner, G.R.; Bowders, J.J.; Scranton, H.B. Instrumentation for monitoring field performance of the Cincinnati GCL test plots. Geotext. Geomembr. 1997, 15, 341–365. [Google Scholar] [CrossRef] [Scilit]
  26. Hu, Y. Field tests on landfill covers for evaluation of performance of mineral cover systems. Chin. J. Geotech. Eng. 2006, 28, 403–409. [Google Scholar]
  27. Hersey, D.; Power, C. Assessing the importance of drainage layers over geomembrane liners within engineered cover systems: Seven years of field monitoring at three mine waste rock piles. Geotext. Geomembr. 2023, 51, 381–389. [Google Scholar] [CrossRef] [Scilit]
  28. Shaikh, J.; Bordoloi, S.; Yamsani, S.K.; Sekharan, S.; Rakesh, R.R.; Sarmah, A.K. Long-term hydraulic performance of landfill cover system in extreme humid region: Field monitoring and numerical approach. Sci. Total Environ. 2019, 688, 409–423. [Google Scholar] [CrossRef] [Scilit] [PubMed]
  29. Chihi, F.; Varga, G. Evaluating the interface shear strength of geocomposite drain and HDPE geomembrane layers in landfill cover systems. In Geotechnical Engineering Challenges to Meet Current and Emerging Needs of Society; CRC Press: Boca Raton, FL, USA, 2024; pp. 1062–1065. [Google Scholar]
  30. Zhan, L.T.; Feng, S.; Li, G.Y.; Wu, T.; Feng, T. Working principle of ecological soil covers and its application in landfill sealing treatment. Environ. Sanit. Eng. 2022, 30, 1–20. [Google Scholar]
  31. ASTM D5199; American Society for Testing and Materials. Standard Test Method for Measuring the Nominal Thickness of Geosynthetics. ASTM International: West Conshohocken, PA, USA, 2019.
  32. ASTM D6496; American Society for Testing and Materials. Standard Test Method for Determining Average Bonding Peel Strength Between the Top and Bottom Layers of Needle-Punched Geosynthetic Clay Liners. ASTM International: West Conshohocken, PA, USA, 2009.
  33. ASTM D4595/D4595M-23; American Society for Testing and Materials. Standard Test Method for Tensile Properties of Geotextiles by the Wide-Width Method. ASTM International: West Conshohocken, PA, USA, 2023.
  34. Hou, J.; Xie, X.; Benson, H.C. Effect of geomembrane texturing method on geomembrane-dry GCL interface shear behavior. Geotext. Geomembr. 2025, 53, 1185–1199. [Google Scholar] [CrossRef] [Scilit]
  35. ASTM D6693; American Society for Testing and Materials. Standard Test Method for Determining Tensile Properties of Nonreinforced Polyethylene and Nonreinforced Flexible Polypropylene Geomembranes. ASTM International: West Conshohocken, PA, USA, 2020.
  36. ASTM D5994; American Society for Testing and Materials. Test Method for Measuring Core Thickness of Textured Geomembrane. ASTM International: West Conshohocken, PA, USA, 2021.
  37. ASTM D5321-02; American Society for Testing and Materials. Standard Test Method for Determining the Coefficient of Soil and Geosynthetic or Geosynthetic and Geosynthetic Friction by the Direct Shear Method. ASTM International: West Conshohocken, PA, USA, 2002.
  38. Chai, J.C.; Saito, A. Interface shear strengths between geosynthetics and clayey soils. Int. J. Geosynth. Ground Eng. 2016, 2, 19. [Google Scholar] [CrossRef] [Scilit]
  39. Stark, T.D.; Williamson, T.A.; Eid, H.T. HDPE geomembrane/geotextile interface shear strength. J. Geotech. Eng. 1996, 122, 197–203. [Google Scholar] [CrossRef] [Scilit]
  40. Gilbert, R.B.; Byrne, R.J. Strain-softening behavior of waste containment system interfaces. Geosynth. Int. 1996, 3, 181–202. [Google Scholar] [CrossRef] [Scilit]
  41. Ghazizadeh, S.; Bareither, C.A. Stress-controlled direct shear testing of geosynthetic clay liners I: Apparatus development. Geotext. Geomembr. 2018, 46, 656–666. [Google Scholar] [CrossRef] [Scilit]
  42. Lin, J.; Stark, T.D.; Idries, A.; Choi, S. GMX/GDC strength loss mechanisms. Geosynth. Int. 2023, 31, 824–834. [Google Scholar] [CrossRef] [Scilit]
  43. Ross, J.D.; Fox, P.J. Dynamic shear strength of GMX/GCL composite liner for monotonic loading. J. Geotech. Geoenviron. Eng. 2015, 141, 04015026. [Google Scholar] [CrossRef] [Scilit]
  44. Arabani, M.; Haghsheno, H. The effect of water content on shear and compressive behavior of polymeric fiber-reinforced clay. SN Appl. Sci. 2020, 2, 1661–1677. [Google Scholar] [CrossRef] [Scilit]
  45. Dixon, N. Soil-geosynthetic interaction: Interface behaviour. In Proceedings of the 9th International Conference on Geosynthetics, Guaruja, Brazil, 23–27 May 2010. [Google Scholar]
  46. Hebeler, G.L.; Frost, J.D.; Myers, A.T. Quantifying hook and loop interaction in textured geomembrane-geotextile systems. Geotext. Geomembr. 2005, 23, 77–105. [Google Scholar] [CrossRef] [Scilit]
  47. Dove, J.; Frost, J. A method for measuring geomembrane surface roughness. Geosynth. Int. 1996, 3, 369–392. [Google Scholar] [CrossRef] [Scilit]
Figure 1. Photographs of the surface of geocomposite drainages (GCDs) and geomembranes (GMs) used in large-scale shear tests: (a) GCD, (b) smooth geomembrane (GMS), (c) impinged textured geomembrane (GMTI), and (d) embossed textured geomembrane (GMTE).
Sustainability 17 07850 g001
Figure 2. Large-scale direct shear apparatus used in the testing program: (a) photograph and (b) GCD–GM interface schematic diagram.
Sustainability 17 07850 g002
Figure 3. Shear stress–displacement curves of GCD–GMS interfaces under different moisture contents: (a) GCD–GMS interface, (b) GCD–GMTI interface, and (c) GCD–GMTE interface.
Sustainability 17 07850 g003
Figure 4. Large displacement (LD)-to-peak strength ratio for different moisture contents of GCD–GM interfaces under each level of normal stress.
Sustainability 17 07850 g004
Figure 5. Peak interface strength envelopes for each GCD–GM interface under different moisture contents: (a) GCD–GMS interface, (b) GCD–GMTI interface, and (c) GCD–GMTE interface.
Sustainability 17 07850 g005
Figure 6. Large displacement strength envelopes for each GCD–GM interface under different moisture contents: (a) GCD–GMS interface, (b) GCD–GMTI interface, and (c) GCD–GMTE interface.
Sustainability 17 07850 g006
Figure 7. Vertical deformation vs. shear displacement curves for different moisture contents of the GCD–GM interfaces under normal stress: (a) GCD–GMS interface, (b) GCD–GMTI interface, and (c) GCD–GMTE interface.
Sustainability 17 07850 g007
Figure 8. Predicted surface plot of the vertical deformation of the GCD–GM interface.
Sustainability 17 07850 g008
Figure 9. Photographs of interfacial surface of GCD and GMS after shearing at 50 kPa: (a) GCD surface at a dry (0%) moisture level, (b) GCD surface at an intermediate (50%) moisture level, (c) GCD surface at a high (100%) moisture level, (d) GMS surface at a dry (0%) moisture level, (e) GMS surface at an intermediate (50%) moisture level, and (f) GMS surface at a high (100%) moisture level.
Sustainability 17 07850 g009
Figure 10. Photographs of interfacial surfaces of GCDs and GMTIs after shearing at 50 kPa: (a) GCD surface at a dry (0%) moisture level with inset showing internal deformation of the GCD, (b) GCD surface at an intermediate (50%) moisture level with inset showing internal deformation of the GCD, (c) GCD surface at a high (100%) moisture level with inset showing internal deformation of the GCD, (d) GMTI surface at a dry (0%) moisture level, (e) GMTI surface at an intermediate (50%) moisture level, and (f) GMTI surface at a high (100%) moisture level.
Sustainability 17 07850 g010
Figure 11. Three-dimensional contour scanning photograph of post-shear specimens of GMTI surface from shear tests under different moisture contents at 50 kPa: (a) dry (0%) moisture level, (b) intermediate (50%) moisture level, and (c) high (100%) moisture level.
Sustainability 17 07850 g011
Figure 12. Photographs of interfacial surfaces of GCD and GMTE after shearing at 50 kPa: (a) GCD surface at a dry (0%) moisture level, (b) GCD surface at an intermediate (50%) moisture level, (c) GCD surface at a high (100%) moisture level with inset showing internal deformation of the GCD, (d) GMTE surface at a dry (0%) moisture level, (e) GMTE surface at an intermediate (50%) moisture level, and (f) GMTE surface at a high (100%) moisture level.
Sustainability 17 07850 g012
Figure 13. Photographs of interfacial surface of GMTE after shearing: (a) GMTE surface at a dry (0%) moisture level, (b) GMTE surface at an intermediate (50%) moisture level, and (c) GMTE surface at a high (100%) moisture level.
Sustainability 17 07850 g013
Table 1. Physical properties of HDPE geomembranes.
TypeThickness
(mm)
Density
(kg/m3)
Tensile Strength at Yield
(N/mm)
Tensile Elongation
at Yield or Break (%)
Asperity Height (mm)
GMS294232100
GMTI294933120.25
GMTE1.594222100.5
Table 2. Summary of test schemes.
TypeMoisture Levels (%)Normal Stress (kPa) Shear Velocity (mm/min)
GCD–GMS0102
GCD–GMTI5030
GCD–GMTE10050
Table 3. Comparison of strength loss and reduction percentage of the GMTI interface.
GCD–GMTIMoisture LevelPeak Strength LossLD Strength LossPercentage of Peak Loss vs. GMTEPercentage of Peak Loss vs. GMSPercentage of LD Loss vs. GMTEPercentage of LD Loss vs. GMS
0–50%4%5%16%16%63%19%
50–100%10%9%500%50%82%39%
Table 4. Peak and large displacement shear strength parameters.
TypeMoisture Levels,
(%)
Peak Friction Angle,
δp (°)
Peak Adhesion,
ap (kPa)
Peak Shear Strength
R2
Large Displacement Friction Angle,
δLD (°)
Large Displacement Adhesion,
aLD (kPa)
Large Displacement
Shear Strength
R2
GCD–GMS0181.20.94161.50.93
50130.80.99120.90.99
10091.60.9881.20.99
GCD–GMTI0237.30.99147.50.99
50226.70.99165.00.99
100187.50.96145.40.96
GCD–GMTE0182.40.99112.10.99
50171.10.96121.00.99
100141.20.98110.40.92
Table 5. Percentage variation in shear strength parameters.
TypeMoisture Levels (%)% Var. in Peak Friction Angle (δp)% Var. in Peak Adhesion (ap)% Var. in Large Displacement Friction Angle (δLD)% Var. in Large Displacement Adhesion (aLD)
GCD–GMS50−27.8%−33.3%−25.0%−40.0%
100−50.0%33.33%−50.0%−20.0%
GCD–GMTI50−4.4%−8.22%14.3%−33.3%
100−21.7%2.74%0.0%−28.0%
GCD–GMTE50−5.6%−54.2%9.1%−52.4%
100−22.2%−50.0%0.0%−80.9%
Table 6. Rs values of GMTI surfaces after shearing under different moisture levels at 50 kPa of normal stress (↓ represents the average decrease).
Moisture LevelPre-Shear Rs ValuePost-Shear Rs ValueAmount of Change (Pre → Post)Percentage of Original Pre-Shear Rs Value
0%1.4251.0460.379↓73%
50%1.4251.1050.320↓78%
100%1.4251.3900.035↓94%
Table 7. Variations in GMTE embossed tips after shearing under different moisture levels at 50 kPa of normal stress.
Moisture LevelPenetration Depth of Embossed Tips (mm)Tip Height Reduction
0%~0.18Up to 36%
50%~0.15Up to 30%
100%~0.08Up to 16%
Disclaimer/Publisher’s Note: The statements, opinions and data contained in all publications are solely those of the individual author(s) and contributor(s) and not of MDPI and/or the editor(s). MDPI and/or the editor(s) disclaim responsibility for any injury to people or property resulting from any ideas, methods, instructions or products referred to in the content.