


Abstract
Historically, traditional transportation planning has promoted public policies focused on building and maintaining infrastructure for private cars to improve travel efficiency. This approach presents a significant challenge for cities in the Global South due to their unique socioeconomic conditions and urban development patterns. Dedicated public transport infrastructure can make better use of the road network by moving more people and reducing congestion. Beyond its environmental benefits, it also provides the population with greater accessibility, creating new development opportunities. This study uses Mexicali, Mexico, a medium-sized city with dispersed urban growth and a high dependence on cars, as a case study. The goal is to identify the relationship between the supply of public bus routes and actual work-related commuting patterns. The methodology considers that, given the scarcity of economic resources and prior studies in the Global South, using Geographic Information Systems (GIS) for the spatial analysis of travel is a key tool for redesigning more inclusive and sustainable public transport systems. Specifically, this study utilized origin–destination survey data from 14 urban areas to assess modal coverage, work-related commuting patterns, and the spatial distribution of employment centres. The findings reveal a marked misalignment between the existing public transport network and the population’s travel needs, particularly in marginalized areas. Users face long travel times, multiple transfers, low service frequency, and limited connectivity to key employment areas. This configuration reinforces an exclusionary urban structure, with negative impacts on equity, modal efficiency, and sustainability. The study concludes that GIS-based spatial analysis generates sufficient evidence to redesign the public transport system and reorient urban mobility policy toward sustainability and social inclusion.
1. Introduction
Urban mobility is one of the main challenges for the sustainable development of cities, particularly in developing countries where territorial dynamics are characterized by urban sprawl, automobile dependence, and unequal access to public transport. In such contexts, public transport systems often fail to function as tools of integration and instead mirror socio-spatial inequalities by not adequately addressing the actual commuting patterns of the economically active population. Within this context, the study of commuting (i.e., daily work-related travel) gains importance as a key indicator of socio-spatial inequality. Its analysis enables a better understanding of how planning and transportation decisions differentially impact various social groups. These commuting flows are the most intense and regular within the urban structure, and their adequate accommodation through public transport is crucial for reducing emissions, promoting equity, and improving quality of life. Despite its importance, many Mexican cities lack systematic information on these flows, hindering the design of equitable and sustainable mobility policies.
In many cities of developing countries, the limited availability of data on work-related travel significantly constrains the planning of public transport routes that meet the real needs of the population. This lack of information contributes to inefficient system design, thereby reinforcing private cars as the dominant mode of transport. In response to this scenario, since the 1990s, various studies have promoted strategies to mitigate the negative effects of motorization, such as greenhouse gas emissions and traffic congestion. One of the most prominent proposals has been the promotion of compact and mixed-use urban areas [1,2,3], as numerous studies have shown that these environments foster a higher share of walking, cycling, and public transport trips, in contrast to low-density residential zones where car use predominates [1,4,5,6].
When urban planning policies prioritize automobile-oriented mobility and encourage dispersed territorial growth, social groups that rely on alternative modes of transportation—such as public transport, cycling, or walking—are disproportionately affected. In Mexico, motorization has shown a steady upward trend over recent decades. Between 1980 and 2019, the average annual vehicle growth rate was 5.38%, reflecting a structural inclination toward car dependency [7]. However, this trend has not been uniform; it has been influenced by factors such as the COVID-19 pandemic and various mobility policies, which together have led to an 11% increase in private car use [8]. These data suggest that Mexico’s transportation and land-use policies have consolidated an urban model heavily reliant on private cars, with insufficient focus on promoting more sustainable and equitable modes of mobility [9].
Within this context, the city of Mexicali—the capital of Baja California, located along Mexico’s northwestern border—emerges as a particularly relevant case study. It is part of the second-most densely populated metropolitan area in the state [10], with an urban footprint that concentrates 80% of the municipal population within just 113.7 km2. In 2020, Mexicali’s population reached 1,049,792 inhabitants—a 12.1% increase compared to 2010—reflecting both demographic and spatial expansion [11]. This growth has been accompanied by a significant increase in the motorization rate, positioning Mexicali as one of the cities with the highest number of vehicles per capita nationwide. Likewise, the vehicle occupancy rate is low, with an average of only 2.3 passengers per automobile [12].
In parallel, the use of public transport has declined from 25% in 2010 to 17% in 2020 [12,13]. This trend has led to an increasing dependence on private transport, despite the existence of a relatively extensive public transport network. However, this network exhibits a misalignment with the commuting patterns of the economically active population, leading to long travel times, low modal efficiency, and increased externalities that negatively impact the environment, social equity, and the overall quality of urban life.
According to Mexicali’s Sustainable Urban Mobility Program, 83% of daily trips are made by private car, while only 6.8% rely on public transport [13]. It is primarily residents of peripheral and low-income areas who depend most heavily on collective transport, yet they experience significantly lower service conditions. This reveals a strong correlation between social marginalization and limited accessibility.
Eibenschutz [14] states that various studies have shown how deficiencies in the supply and quality of urban transport disproportionately affect low-income groups, particularly those living in peripheral settlements far from employment centres and essential services. These groups—who are also the most dependent on public transport—face greater barriers in exercising their right to mobility, thereby deepening their social and economic exclusion.
It is important to highlight the problems or realities that cities in the Global South often face, which include limited financial resources to conduct periodic studies that characterize transport supply and demand. These cities often face significant challenges regarding the availability and quality of geospatial and operational data, such as the continuous collection of vehicle location data (GPS), passenger validation records, or even accurate information on public transport stops, as well as complete details on the routes that comprise the system, especially in contexts where informality prevails in transport services. In some cases, data exists but remains fragmented, or there is a lack of coordination between public transport operators and government agencies responsible for regulation. Additional current challenges involve analyses and proposals for public transport optimization that do not consider the impacts of land use or focus primarily on horizontal equity (spatial coverage) rather than vertical equity (service provision to different socioeconomic groups).
Considering these challenges, the present study aims to analyze the spatial correspondence between public transport routes and the commuting patterns of the economically active population in the city of Mexicali. The objective is to identify areas characterized by low connectivity, territorial exclusion, and limited accessibility, which hinder equitable urban mobility. To this end, the study applies tools such as Geographic Information Systems (GIS), origin–destination (O–D) surveys, and a multiscale territorial analysis approach. The goal is to generate evidence that supports the development of more integrated, inclusive, and sustainable public policies, applicable not only to Mexicali but also to other cities with similar urban dynamics and challenges.
Recent approaches to sustainable urban mobility emphasize the importance of integrating spatial analysis tools—such as Geographic Information Systems (GIS)—with origin–destination survey data to accurately assess the coverage, efficiency, and territorial relevance of public transport systems concerning actual work-related mobility patterns [15,16]. Furthermore, post-COVID-19 studies have underscored the need to redesign urban transport infrastructure to accommodate new mobility dynamics, promote active modes such as walking and cycling, and strengthen the resilience of mobility systems in the face of future crises [17].
However, in intermediate cities such as Mexicali, the lack of systematic data on commuting continues to hinder evidence-based spatial decision-making and limits the capacity to formulate public policies aimed at optimizing the urban transport system and progressing toward a more efficient and sustainable model. Considering this gap, the development of multiscale methodologies becomes imperative to identify the degree of congruence —or lack thereof —between the public transport network and work-related travel patterns, providing a fundamental basis for designing inclusive solutions oriented toward urban well-being.
2. Literature Review
Urban mobility is a multidimensional phenomenon with unique challenges in cities of the Global South. The literature highlights that urban expansion has historically fostered a dependence on private automobiles, leading to the construction of infrastructure that prioritizes this mode of transportation. This has resulted in longer commutes, which limit access to employment or educational opportunities, especially for those who cannot afford a private vehicle. Furthermore, transportation planning in these cities faces a significant challenge: limited data on actual population mobility and a failure to account for informal transportation modes. It is therefore essential to align the transportation system with the real needs of the population, and analyzing these travel patterns is the crucial first step. Socio-spatial segregation forces low-income populations to live on the outskirts, where public transport services are often inadequate. These areas may lack service within a 1000 m radius or suffer from a shortage of direct routes and adequate frequencies. This situation amplifies social exclusion for the user group that needs public transit most, as they cannot afford a car. To diagnose and address these problems, spatial analysis is an essential tool. It allows for the identification of the “spatial mismatch” between housing and employment locations. This type of analysis should utilize existing technology and information and conduct origin–destination surveys to update mobility patterns. The resulting public policies should address these needs and prioritize public transport and active modes, to improve accessibility in peripheral neighbourhoods and integrate the network with the economic vocations of the territory. The goal is to align efficiency with spatial justice, so that transportation systems not only reduce travel time and distance but also function as platforms for social inclusion, promoting more just and sustainable cities.
2.1. Urban Mobility and Sustainability in the Global Context
Urban mobility is no longer understood solely as the physical movement of people but rather as a multidimensional phenomenon encompassing territorial, social, economic, and environmental dimensions. In cities of developing countries—particularly in intermediate or peripheral urban areas such as Mexicali—daily mobility patterns both reflect and reinforce existing urban inequalities. Urban sprawl and low-density expansion have fostered dependence on private cars and led to longer compulsory trips between peripheral residential areas and employment centres, thereby reducing equity in access to urban opportunities.
This pattern, documented in various studies, shows how the spatial distribution of activities strongly conditions the volume and length of urban trips [18]. Consequently, a comprehensive understanding of mobility requires addressing two complementary dimensions: the spatial—how urban structure influences travel flows—and the social—who can travel and under what conditions—as originally proposed by Valero [19] and supported by recent analyses focused on mobility justice.
Urban mobility is now recognized as a fundamental social right, rather than merely a logistical or infrastructure issue. This perspective calls for transport policies to be oriented toward ensuring equitable and sustainable access to goods, services, and urban spaces for all social groups. Studies have shown that historical infrastructure investments have tended to favour cars and higher-income populations, while lower-income groups—those who rely on public transport or non-motorized modes—are burdened with longer, more expensive, and less comfortable commutes [20].
In Latin America, for example, there is a growing emphasis on acknowledging the social and territorial inequalities that influence people’s actual mobility, and on ensuring that public transport is regarded as a true public service accessible to all [21]. In this sense, urban mobility is strongly shaped by the material conditions of the urban environment and prevailing policy orientations. It is not merely the result of individual travel choices but also a consequence of how cities distribute opportunities, and which types of transport are prioritized through public investment.
The landscape of mobility has changed substantially in recent decades. There has been a shift from a relatively homogeneous “mass mobility”—characterized by uniform schedules, flows, and travel purposes—toward a more diversified and individualized mobility, where travel motives, flow directions, and schedules have become significantly more heterogeneous [22]. This diversification calls for more flexible planning approaches and for public transport systems that can adapt to the specific needs of different user groups.
Moreover, contemporary phenomena such as the digital economy, new forms of employment, and more flexible lifestyles have fragmented traditional travel patterns, an aspect already highlighted in classical studies and confirmed by recent analyses on “new mobilities.” As a result, urban travel has become a subject of widespread debate: on the one hand, it poses significant challenges due to its impacts (e.g., congestion, pollution, inequity); on the other, it remains essential for daily life across all urban scales, from large metropolitan areas to medium-sized cities [23].
In response to these challenges, socio-spatial sustainability emerges as an essential framework for analyzing contemporary urban mobility. This approach involves incorporating principles of equity, territorial efficiency, and environmental resilience into both analysis and planning. In contexts where transportation investment is limited and mobility patterns are highly unequal, as is often the case in Latin American cities, it becomes essential to reconceptualize urban transport systems, not merely as infrastructures for movement, but as platforms for social inclusion.
In practice, this means prioritizing collective and active transport modes over private cars, improving accessibility in peripheral neighbourhoods, and integrating transport policy with urban planning. Only by adopting this integrated vision can urban mobility contribute to the development of fairer and more sustainable cities in the long term, in alignment with the global Sustainable Development Goals agenda.
Finally, it is worth highlighting the role of technological innovation in shaping contemporary mobility. As noted by Castells & Himanen [24], digitalization and information technologies have become integrated into travel behaviour, streamlining and reorganizing the way people move—from route-planning applications to shared bicycle and scooter systems. When combined with traditional physical infrastructure, these innovations can significantly enhance the efficiency of urban transport and improve quality of life [25], as long as they are implemented with a focus on equity and public benefit.
Assessing mobility through this new technological and sustainability-focused lens also helps evaluate the performance of transport systems. Indicators such as service quality, travel time, and user satisfaction complement traditional metrics like capacity and speed [26].
2.2. Compulsory Mobility (Commuting) and Its Social and Environmental Impact
Compulsory mobility, those daily trips that are essential for working or studying, constitutes one of the most decisive aspects of urban mobility. As cities expand and offer more transportation infrastructure, average commuting distances tend to increase [27]. However, various studies have shown that even with improvements in transport speed, the total time people dedicate to commuting does not necessarily decrease. When travel times are reduced through faster roads or vehicles, the time saved is often reinvested in making additional trips or travelling longer distances [28].
This reflects the notion of a relatively constant “travel time budget”: faster travel allows people to live farther away or make more trips but, in the end, they continue to spend a similar amount of time in transit. Consequently, although technological improvements may reduce the duration of specific trips, total commuting time has continued to grow in many cities due to increasing distances and traffic congestion [29,30]. This phenomenon has been observed in both developed metropolises and in emerging cities, indicating that building more roads alone does not solve the problems associated with long daily commutes.
Commuting is rarely a voluntary choice; rather, it is a necessity imposed by urban geography. The separation between affordable residential areas and employment centres gives rise to what is known as spatial mismatch: low-income populations are often forced to live on the urban periphery, far from areas of opportunity, and must endure long and costly daily commutes to access formal employment [31]. This situation places disproportionate burdens on already-vulnerable groups. For instance, low-income households spend a larger share of their time and income on transportation. Recent studies confirm that long or uncomfortable commutes negatively impact subjective well-being, being associated with lower life satisfaction, reduced leisure time, increased stress, and poorer mental health, factors that may also affect worker productivity [32].
In summary, the unequal organization of urban space, where only some can afford to live near their workplaces, turns commuting into a mechanism that amplifies socio-spatial exclusion. The effective right to the city (to employment, services, and a dignified life) is limited for those who must endure exhausting daily travel.
The case of Mexicali, with a dispersed urbanization pattern typical of many Latin American cities, exemplifies these tensions. Long distances and travel times to work impose not only a significant financial burden on families but also cause physical and emotional fatigue. This problem is exacerbated when the public transport system is inefficient or insufficient, as is common in many intermediate cities: in the absence of a robust network connecting peripheral areas with employment centres, many people are left with no viable alternatives to private cars.
Thus, compulsory mobility reveals a fundamental contradiction in urban development: on one hand, cities offer opportunities for jobs, education, and services but, on the other, not all citizens can access them under equal conditions due to barriers related to distance, time, and cost. Addressing commuting from an urban equity perspective is therefore essential for reclaiming the right to the city.
Commuting dynamics have also evolved alongside the transformation of metropolitan areas. In several regions—notably in the United States—the classic travel pattern from the periphery to the centre has given way to more complex flows. Many central cities have lost their monopoly as employment destinations, giving rise to multiple peripheral subcentres that attract workers. This phenomenon, known as inverse commuting, has increased both intra-peripheral travel and reverse commutes from the urban core to outlying areas.
As documented by Giuliano & Gillespie [33], during the 1990s, subcentres around San Francisco absorbed a large share of work-related travel. By the early part of that decade, it was estimated that 78% of commuting trips destined for San Francisco’s subcentres were made by private car, compared to only 36% of car trips headed to the central downtown area [34]. These historical data illustrate the preference for private cars in dispersed environments, where public transport has traditionally struggled to compete.
Similar trends are now observed in rapidly growing Latin American cities, where urban expansion has led to the emergence of multiple employment hubs beyond the historic city centre. For cities like Mexicali, this means that mobility policies must address not only centre–periphery connections, but also tangential and inter-peripheral movements, adapting transport supply to an emerging polycentric urban structure.
Compulsory mobility also has critical impacts on environmental sustainability. Daily commutes by private car contribute significantly to CO2 emissions, local air pollution, and non-renewable energy consumption. Long-distance commuting, often carried out in single-occupancy vehicles, has a disproportionately large ecological footprint. A study in California found that long-distance work trips accounted for only 2% of all trips, yet generated approximately 33% of total vehicle miles travelled, underscoring their substantial contribution to congestion and emissions. This highlights the environmental benefits of reducing (or eliminating the need for) long automobile commutes [31].
Reducing car dependence in commuting is therefore critical to sustainable transport planning. This involves promoting cleaner alternatives such as public transport, carpooling, cycling, and bringing jobs closer to housing through more balanced urban development. Additionally, policies such as teleworking represent contemporary opportunities to reduce compulsory travel and its negative impacts on both people and the environment.
In conclusion, the study of commuting is essential for understanding structural inequalities in access to the city. Insights on travel time, the spatial distribution of employment, and individual well-being must inform public policy. Only through comprehensive interventions that combine improvements in transport efficiency, along with considerations of social equity and urban planning, can the challenges of compulsory mobility be effectively addressed in cities like Mexicali.
Ultimately, the goal is to align efficiency with spatial justice: to ensure that urban transport systems reduce time and distance without marginalizing those with the fewest resources. This would pave the way toward a model of mobility that is both environmentally sustainable and socially inclusive.
2.3. Public Transport, Active Modes, and Modal Inequality
Urban transport and population travel are closely related phenomena but not identical. The study of human mobility goes beyond the analysis of the transport system itself. As Gutiérrez [16] notes, examining daily mobility requires understanding the interaction between society and territory, something that a narrow focus on transport supply alone cannot fully capture. In other words, while transport infrastructure, including vehicles and routes, is essential for enabling mobility, understanding how, why, and who moves requires incorporating broader social and spatial dimensions.
This theoretical distinction underscores the relevance of investigating actual travel behaviours (in this case, work-related mobility), rather than merely evaluating transport infrastructure or services in isolation. In line with this approach, authors such as Modenes [35] suggest analyzing the impact of transport infrastructure on territorial dynamics, for example, how the presence (or absence) of a bus line influences the integration of a peripheral neighbourhood.
In our research, we adopt this perspective by directly linking the compulsory mobility of workers with the functioning of the urban public transport system. It is worth noting that road and transport connectivity supports urban flows: a well-structured road network can maintain a continuous flow between multiple origins and destinations, adapting over time to shifting mobility patterns [36]. However, this adaptability has limits when structural imbalances exist within the city.
Public transport is a central pillar of urban life, as it ensures access to services, employment, and social networks for a large segment of the population. Its use is not solely the result of individual preferences but also reflects and reinforces socio-spatial inequalities. In many cities in developing countries, it constitutes the primary—and often only—mobility option for low-income households. However, public transit systems face serious limitations: inadequate coverage, low frequency, and poor-quality standards. These issues lead to long journeys, multiple transfers, and daily physical and emotional strain—conditions that disproportionately affect women, older adults, and informal workers.
Additionally, the lack of modal integration and the historical prioritization of private cars in urban planning have resulted in modal inequality. This is reflected in the unequal distribution of space, travel time, and costs depending on the mode of transport. While car users benefit from greater investment and shorter travel times, pedestrians and public transport users must contend with indirect routes, unsafe conditions, and inadequate infrastructure. This disparity is particularly unjust considering that these users contribute far less to traffic congestion and environmental pollution. Addressing this inequality requires reordering the hierarchy of transport modes, prioritizing public and active transportation to achieve a more equitable and sustainable urban mobility model.
At this point, active modes of mobility—namely walking and cycling—gain relevance. In recent years, they have become central elements in sustainable mobility agendas for multiple reasons: they are economically accessible, have virtually no environmental impact, and provide significant health benefits by incorporating physical activity into daily routines. However, the widespread adoption of walking or cycling in urban environments depends on multiple factors. These include individual aspects such as age, gender, health status, and socioeconomic level, as well as contextual ones such as travel distance, local climate, road safety, the availability of quality footpaths or bike lanes, and the overall attractiveness of the urban environment.
A study conducted in five European metropolitan regions confirmed that both personal characteristics and features of the built environment significantly influence mode choice, for both compulsory trips (e.g., work, school) and discretionary travel (e.g., leisure, shopping) [37]. For instance, higher residential density, nearby urban amenities, and pleasant streetscape were found to encourage walking and cycling, while long distances or unsafe environments discouraged their use.
Moreover, individuals’ motivations vary by mode: those who walk or cycle often mention a desire to stay physically active and enjoy the journey itself, while public transport users tend to value proximity to stops, service frequency, and total travel time. These findings underscore that modal decisions are complex and influenced by multiple scales, from the micro level of personal experience to the macro level of urban planning.
Therefore, sustainable mobility policies must be comprehensive: It is not enough to build bike lanes or expand bus services. It is also essential to promote cultural change, elevate the value of sustainable modes, and improve the urban environment, road safety conditions, and the pedestrian infrastructure to positively influence user behaviour.
2.4. Spatial Analysis of Mobility: Employment Centres, Urban Structure, and Accessibility
Another crucial area of urban mobility analysis is spatial accessibility and its inherent inequalities. An ongoing debate centres on how to guarantee that low-income populations have adequate access to public transport, especially considering that the spatial distribution of activities in many cities tends to exclude them [38]. In practice, formal employment, commerce, and urban services are often concentrated in central districts or affluent neighbourhoods, while lower-income populations predominantly reside in peripheral areas. As a result, vulnerable groups face longer and lower-quality commutes, leading to deficient accessibility. Under these conditions, transport equity is compromised, as low-income residents bear higher “accessibility costs” in terms of time, money, and effort required to carry out their daily activities [38].
As noted by Alegría [39], public transport routes typically serve dispersed peripheral areas with much less efficiency than central zones that are dense in employment. In other words, the system favours trips to and from the city’s main hubs, while connections to secondary peripheral sectors are limited or indirect. Empirical evidence shows that public transport demand is highest during “inbound” trips from the periphery to the centre and significantly lower during “outbound” trips from the centre to the outskirts. Put differently, conventional public transport systems have specialized in channelling the peripheral labour force toward central urban areas but are less effective at connecting peripheral zones or even in facilitating travel from central neighbourhoods to peripheral jobs [40,41]. This territorially unbalanced mobility pattern contributes to the perpetuation of exclusion, as residents of distant peripheries remain captive to longer, lower-quality commutes.
Understanding these phenomena requires incorporating the territorial dimension into the study of mobility. It is not possible to analyze travel patterns independently of urban structure, since decisions about the location of jobs, housing, and services profoundly shape who moves within the city, and how, and how much, they do it. For this reason, spatial analysis is a fundamental tool for diagnosing accessibility inequalities and for planning more efficient and equitable mobility strategies.
A paradigmatic example of this is the well-known spatial mismatch, that is, the geographic gap between the neighbourhoods where workers (especially low-income earners) live and the areas where jobs are concentrated. When public transport is insufficient or inefficient, this mismatch becomes more severe, as many people are forced to make long and costly commutes or are effectively excluded from certain employment opportunities due to a lack of access.
In cities that have undergone rapid peripheral expansion, such as Mexicali, this pattern results in forced mobility that reinforces segregation dynamics. In other words, extensive urbanization without a coherent transport network means that those living in distant housing developments must travel long distances to participate in the urban economy, incurring significant physical, temporal, and financial costs. From the perspective of the right to the city, this constitutes a structural barrier. The city may offer opportunities but these are distributed in ways that not everyone can access or benefit from.
International research has explored possible solutions to this dilemma. One approach is the co-location hypothesis, proposed by Cervero & Wu [34], which examines how employment decentralization affects travel distances and times. Theoretically, if jobs are dispersed and located closer to residential areas, travel distances and times would decrease. Some authors have found evidence that employment decentralization can reduce the average length of commutes in certain cities [42].
However, other studies report the opposite. When decentralization is unplanned, travel distances may increase due to the emergence of multiple cross-flows within a sprawling metropolis [43]. In summary, if a city evolves into a well-connected polycentric structure, more people may live closer to at least one employment centre, reducing average commute times. But if it expands without proper planning, it may generate an even more extensive and complex web of travel.
Polycentric models can improve transport system efficiency as long as integration exists; that is, mass transit networks must connect the various centres with surrounding neighbourhoods. By contrast, a rigid monocentric city may generate bottlenecks in the central core, while a poorly connected polycentric city may create multiple peripheral bottlenecks [44]. Thus, the optimal urban form, from the standpoint of sustainable mobility, depends on achieving a balance between the spatial distribution of activities and the connectivity provided by the transport system.
2.5. Toward Inclusive and Sustainable Solutions in Intermediate Cities
The construction of sustainable urban mobility systems must comprehensively consider the territorial, institutional, and social contexts in which they are developed. In intermediate cities of developing countries, challenges such as limited infrastructure, high dependence on private cars, constrained public transport supply, and dispersed urbanization patterns require context-specific responses adapted to their scale and institutional capacities [45].
Inclusive mobility means ensuring that all social groups—especially the most vulnerable—can travel safely, affordably, efficiently, and with dignity. In this sense, mobility should not be understood as an end but as a means to exercise fundamental rights such as access to employment, education, healthcare, and public space. Inclusion is not limited to expanding public transport coverage; it also requires improving travel quality and reducing modal and territorial inequalities that restrict the effective right to the city [21].
Sustainable mobility, in turn, demands a model with low environmental impact, reduced energy consumption, and efficient use of urban space. Achieving this goal requires the implementation of integrated strategies: discouraging private car use, strengthening public transport systems, promoting active modes such as walking and cycling, and integrating land-use planning with transport policy. This approach aligns with Sustainable Development Goal 11 of the 2030 Agenda, which aims to foster “inclusive, safe, resilient and sustainable cities” [46]. Furthermore, strengthening collective transport not only helps reduce congestion and emissions but also provides real mobility alternatives for those without access to a private car [47].
Some studies have proposed models of sustainable urban infrastructure that integrate technology, governance, and urban design to address contemporary mobility challenges. This approach involves participatory governance processes, adequate funding, the use of open data, and cross-sectoral policies that recognise mobility as a transversal axis of urban policy [48].
The COVID-19 pandemic marked a turning point. Lockdown measures and teleworking led to a significant reduction in daily travel. In Australia, for instance, the percentage of people working from home at least one day a week increased from 30% to 60%, while those working from home five days a week rose from 7% to 30% [49]. This shift reduced congestion and emissions, freeing up road capacity. However, access to telework was not equitable: it depended on job type, educational level, and digital access, which, in some cases, exacerbated existing inequalities. A temporary decline in public transport use was also observed due to fear of contagion, accompanied by an increase in private car use and active modes, depending on the context. Many cities responded with emergency measures such as temporary bike lanes, traffic-calmed zones, and subsidies for micromobility, revealing the potential to reconfigure urban space according to health and sustainability principles [20].
This context offers key lessons for post-COVID urbanism. The challenge lies in avoiding a return to an unsustainable model and instead leveraging the moment to consolidate resilient public transport systems, active mobility infrastructure, and work arrangements that reduce the need for daily commuting, particularly in intermediate cities. As emphasized by Son et al. [50], investing in digital infrastructure and intelligent transportation systems is essential to enhance the efficiency of public transport and promote equitable, data-driven mobility.
Finally, recent studies reinforce these conclusions. In their analysis of mobility in Recife, Brazil, Meira et al. applied the concept of “social effective speed” and concluded that non-motorized modes such as walking or cycling may be socially more efficient than private cars when external costs such as congestion, emissions, and health impacts are considered [51]. In Lusaka, Zambia, researchers found that modal choice is strongly influenced by urban density, travel time, fare, and perceived safety [52]. Their findings reaffirm that improving public transport infrastructure and strengthening pedestrian accessibility are key strategies for developing cities with characteristics like those of Mexicali.
3. Materials and Methods
The analytical methodology employed to achieve the objective of this study comprises three stages: (1) the georeferencing of existing public transport routes using Geographic Information Systems (GIS); (2) the spatial characterization of work-related travel, based on the location of employment and the application of origin–destination (O-D) surveys; and (3) the integration of both datasets through spatial analysis using GIS, to identify areas with low modal coverage and opportunities for route redesign.
Tools such as PTV Visum are more accurate than spatial analysis using GIS, but they also require a greater amount of information to operate. In this sense, the proposed method is particularly suitable for intermediate cities in the Global South, where budgetary constraints often prevent an initial assessment of the level of service provided by public transport routes to meet the urban population’s mobility needs. The methodology (Figure 1) is appropriate because a large part of the requirements comes from publicly available information and can be conducted at low cost using GIS. The representative sample of the origin–destination survey can be adjusted according to the available budget. With these inputs, a first approximation can be made to assess the current mobility needs of the population, leading to adjustments to reconfigure public transport routes.
Figure 1.
Diagram of the methodology for assessing urban mobility for employment purposes in intermediate cities, using GIS. Source: prepared by the authors.
3.1. Georeferencing of Public Transport Routes
This stage involved the collection, structuring, and digitization of public transport routes operating in the city of Mexicali, excluding taxi services, as these are not considered part of the formal collective transport system. The data were obtained from official sources, including the Government of the State of Baja California [11] and the Municipal Institute for Research and Planning (IMIP) [12]. A database was then generated within a GIS, specifically on the ArcMap 10.1 platform, in which all existing routes were mapped and georeferenced. This database enables spatial analysis and comparison with work-related mobility patterns.
3.2. Characterization of Work-Related Commuting and O-D Survey Collection
This stage focused on characterizing work-related travel using two primary sources: institutional databases and fieldwork. Initially, the National Statistical Directory of Economic Units (DENUE) from INEGI was used. This data set provides information on the location, economic activity, and size of active economic units. The database was processed using GIS to identify the main employment concentration centres by sector: industrial–manufacturing, services, commerce, government, and construction.
Given the lack of detailed information on work-related commuting in Mexicali, an origin–destination (O–D) survey was designed and administered to a representative sample of inhabited private households, considered the origin points of commuting flows. To ensure adequate representativeness, the sample size was calculated with a 90% confidence level and a 2% margin of error. Simple random sampling was then applied, and the households to be surveyed were selected using IBM SPSS Statistics 20 software.
where:
- n = Sample size
- N = Population size
- z = Confidence level
- p q = Maximum assigned variance
- e = Sampling error
The survey was designed to collect comprehensive information on daily mobility characteristics. It included 47 variables, among which the following are essential: origin and destination of the trip, trip purpose, occupation and type of employment, frequency and mode of transport used, travel time, and socioeconomic characteristics of the respondent and their household. This approach enables the linking of commuting patterns with urban and social factors, thereby improving the understanding of the spatial dynamics of the economically active population [16,19,53,54].
To facilitate territorial analysis, the urban area of Mexicali was divided into 14 statistical sections (Figure 2), each with a balanced population and boundaries defined by existing road infrastructure. This segmentation allowed for the identification of origin and destination zones with sufficient precision to support a multiscale analysis of work-related mobility.
Figure 2.
Territorial division for mobility analysis in Mexicali. Source: authors’ own elaboration.
Finally, the collected data were processed through univariate and cross-tabulation analyses. This enabled the identification of which urban sections concentrate the highest proportion of economically active population, which areas function as employment attraction centres, and how different socioeconomic factors relate to mobility patterns.
3.3. Spatial Integration and Multivariable Analysis Using GIS
In the final stage, the data obtained from public transport routes and work-related travel patterns were integrated into a GIS environment (ArcMap 10.1), enabling multivariable spatial analysis. Thematic layers were overlaid to identify zones of modal mismatch, that is, areas with a high density of work-related travel but limited coverage by public transport.
This process allowed for the analysis of the territorial correspondence between existing transport infrastructure and the actual mobility patterns of the economically active population. Furthermore, the GIS platform facilitated data storage, querying, and visualization of results, supporting the continuous updating and integration of new variables. As noted by Feria [55], this tool enables complex georeferencing without restrictions on the number of variables or dimensions analysed.
The outcome of this stage serves as a key input for identifying opportunity areas in public transport route planning, based on criteria of accessibility, modal efficiency, and territorial equity.
4. Results
This section presents the findings derived from the geospatial and statistical analysis of collective transport routes, work-related travel patterns, and their spatial relationship in the city of Mexicali. The discussion is organized into three sections, consistent with the methodology. The first examines the coverage of public transport routes; the second examines the characteristics of work-related travel through the application of the O-D survey, thereby obtaining information on public transport users’ perceptions, frequency and mode choice, travel distance, and type of employment, as well as identifying the main employment centres and their relationship with public transport routes. Finally, the third integrates the results of the association between public transport routes and work-related travel.
4.1. Georeferencing of Public Transport Routes
The analysis of the 40 public transport routes reveals substantial coverage across Mexicali’s urban area (Figure 3), with a higher concentration of lines in the central zone. However, peripheral areas—particularly in the east, south, and northwest—show reduced connectivity, indicating an uneven distribution of transport infrastructure. While the routes formally span a large portion of the territory, gaps in transversal connectivity and modal fragmentation between peripheral zones were identified.
Figure 3.
Distribution of Mexicali’s road and public transport network. Source: authors’ elaboration based on [11].
Currently, the city operates a public transport system that offers direct, non-integrated services. It is worth noting that the network accounts for a total of 935.6 km in the urban area; however, 75% of this length is overlapping, indicating service saturation in certain zones. These redundant segments could be redistributed to poorly connected areas through a strategic redesign of existing routes. Furthermore, the network has an average sinuosity index of 1.77, reflecting routes that significantly deviate from a straight line, resulting in longer travel times and increased operating costs.
4.2. Characterization of Work-Related Commuting and OD Survey Collection
This section outlines key characteristics of work-related commuting in Mexicali, including the frequency and mode of transport, travel distance, and type of employment. These findings were derived from the origin–destination (O-D) survey and users’ perceptions of public transport. Additionally, the analysis identified areas with the highest concentration of employment in the city and examined their relationship with the availability of public transport routes.
4.2.1. O-D Survey and Perception of Public Transport Among Users
Based on the corresponding calculations, a representative sample size of 1820 surveys was determined for the city of Mexicali, allocating approximately 130 surveys to each of the 14 statistical sections.
The O-D survey revealed that perceptions of public transport vary across territorial sections. In general, peripheral areas such as section 8 reported a more favourable perception of system availability (13%) than more central areas like section 3 (3%). This may reflect a greater reliance on the public system in areas with low motorization rates or a positive adaptation due to frequent use. However, it also suggests that unequal access translates into differentiated user experiences in terms of service satisfaction and functionality.
Regarding perceptions of service quality, 24% of respondents considered the quality of public transport to be good, 45% rated it as average, and 31% regarded it as poor. To better understand these perceptions, users’ reasons for classifying the service as either good or poor were categorized.
Among those who perceived the service to be good, 42% attributed this to comfort, 33% to overall service quality, 15% to the modernity of the buses, 8% to safety, and 2% to other factors. In contrast, among users with a negative perception, 48% cite poor service quality, 27% low frequency, 12% lack of safety, 11% inadequate routes, and 2% other reasons (Figure 4).
Figure 4.
Perception of public transport service. Source: authors’ elaboration.
Based on these findings, it can be concluded that the primary reason users perceive public transport to be a good mobility alternative is the comfort it offers. Conversely, negative perceptions are mainly associated with poor service quality and low frequency.
4.2.2. Characterization of Work-Related Commuting
Commuting Frequency and Mode Choice
Sixty-six percent of surveyed individuals reported completing the full residence-to-work (R–T) commuting cycle daily, underscoring the central role of work-related mobility in the city’s overall travel dynamics. In terms of transport mode, 58% commute by private car, while only 16% rely on public transport, 11% travel as pedestrians, 6% by bicycle, 5% as a passenger in a car, 2% by taxi, and another 2% by motorcycle. This indicates a high dependence on private vehicles, despite their negative environmental and social externalities.
The share of public transport use varies across different zones of the city. sections 2, 8, 10, and 14—located in peripheral areas with lower motorization rates—show the highest usage levels, ranging from 20% to 25% (Table 1). This suggests that public transport plays a vital role in promoting territorial inclusion for vulnerable groups. In contrast, private car use is predominant in central sections, reinforcing a pattern of modal inequality.
Table 1.
Mode of transportation by section.
It is important to highlight that the application of perception surveys, such as the one implemented by Macioszek et al. [56], together with the use of the LOGIT model, allows the identification of the variables that have the greatest weight in the choice of mode. Further, we point out that they found that the use of public transport decreases with older age, level of education, and professional status, although the above does not apply if the traveller is female. Findings like these represent a valuable input to improve the offer of the transport service focused on the most frequent users.
4.2.3. Travel Distance and Employment Type
Travel distances were grouped into three categories: short (<3 km), medium (3–7 km), and long (>7 km) (Table 2). This classification is associated with the interaction of travels made either within the same section, with another section immediately, or even with a more distant one. The analysis shows that long-distance commutes are primarily undertaken by private cars, while short-distance trips exhibit higher shares of public transport and active modes. Additionally, employment in the industrial and service sectors tends to concentrate in peripheral areas, while government and commercial jobs are primarily located in the urban centre.
Table 2.
Concentration of origins and destinations by section.
The predominance of car use for long-distance commutes supports the hypothesis that spatial friction influences modal choice, reducing the likelihood of public transport use as travel distance increases. Regarding the individual sections, the following patterns were observed. Peripheral areas such as section 1 are characterized by a higher proportion of short-distance trips to service-related jobs. In section 2, long-distance commuting predominates, primarily for industrial employment. Section 3 is associated with medium-distance travel to both industrial and service sector jobs. Section 4 displays a predominance of short-distance trips to service-related employment. Similarly, section 8 is characterized by short trips, mainly to service-oriented destinations. Section 9 shows a higher frequency of long-distance trips related to industrial employment, while section 11 is dominated by short-distance commutes to industrial jobs. In section 12, long-distance travel to service-oriented jobs prevails, whereas section 14 is distinguished by short trips to commercial employment.
In contrast, central city sections reveal the following patterns. Section 5 exhibits long-distance travel primarily to commercial jobs. Similarly, section 6 is associated with long commutes to service-related employment. Section 7 also shows a similar pattern, though medium-distance commutes are more common. Section 10 is characterized by long-distance travel to commercial activities. Finally, section 13 displays a predominance of long-distance commuting to industrial jobs.
4.2.4. Relationship Between Transport Routes and Employment Centres
As part of the spatial analysis, five employment concentration zones were identified and named according to their geographic location: northeast, east, west, south, and central (Figure 5). The analysis revealed that the employment centres located in the central, western, and eastern zones of Mexicali benefit from good public transport coverage. In contrast, the southern and northeast zones exhibit connectivity deficits, despite hosting significant employment hubs. This situation limits effective accessibility for residents of outlying areas and reduces job opportunities for those who depend on public transport.
Figure 5.
Public transport routes in areas of the employer centre (EC) concentration. Source: authors’ elaboration.
Overall, public transport usage is highest among individuals employed in the industrial sector. However, this same sector also generates the longest commuting distances and exhibits the greatest reliance on private vehicles. Additionally, public transport is used more frequently for inter-sectional trips. This suggests that for intra-sectional commutes, public transport is not the predominant mode; rather, walking and cycling are more commonly used, helping to reduce the use of private cars.
4.3. Association Between Routes and Work-Related Commuting Based on Multivariable Analysis
Following the analysis of user perceptions of public transport services, commuting patterns, and the relationship between transport routes and major employment centres, an association was established between commuting flows and the existing route network. The number of routes serving each section was identified, with central city ones—specifically 5, 6, and 10—standing out for having the highest concentration. In contrast, peripheral southern sections, such as 8 and 9, had the lowest route availability (Figure 6).
Figure 6.
Number of public transport routes by section. Source: authors’ elaboration.
The information layers were superimposed in the GIS environment, revealing a structural disconnect between the existing public transport routes and actual commuting flows. In this regard, Figure 7 presents the overlay of routes and work-related commuting flows by section, allowing for the visual identification of mismatches between these two dimensions.
Figure 7.
Association between public transport routes and work-related travel patterns. Source: authors’ elaboration.
Sections 1 and 3 exhibit the highest levels of intra-sectional interaction and generally have public transport routes covering their main destinations. Section 2 shows commuting flows towards the central and eastern parts of the city; however, it lacks routes to the eastern zone. Section 4 displays significant interaction with the eastern zone but does not have direct routes to that area. Sections 5 and 6, located in the city centre, are well connected with routes to all other sections.
Sections 7 and 9 generate commuting flows towards adjacent sections and the eastern zone yet lack routes to the latter. Section 8, which has the strongest intra-sectional interaction and significant flows to the central zone, also has connections to the eastern and western zones, though no direct routes currently serve these flows. Sections 10 and 11, both in the eastern area, direct most of their travel flows within that same zone and are served by internal routes.
Section 12 generates flows towards the opposite side of the city—the western zone—but lacks direct connecting routes. Finally, sections 13 and 14 show higher commuting activity towards the central and eastern zones of the city, with public transport routes available to meet these mobility needs.
Although all public transport routes are distributed relatively uniformly across the territory, they fail to cover the main origin–destination interactions of work-related commuting. For instance, section 11 lacks sufficient routes that directly link it with the western, southern, and southeastern areas of the city. Even within the section itself, internal routes are insufficient, despite the predominance of intra-sectional commuting flows.
Similarly, section 8 lacks an adequate supply of routes to connect directly with the eastern and western zones. Its only direct connections are with the city centre, which—aside from its section—concentrates the highest commuting demand. In contrast, areas with good transport availability, such as section 6, exhibit only moderate commuting patterns.
This mismatch reveals that the current public transport system has not been designed in alignment with actual patterns of work-related mobility, thereby undermining both its operational efficiency and redistributive potential. Integrating these findings allows for the identification of priority areas where route layouts should be reconfigured based on criteria of spatial equity, coverage, and modal efficiency.
These results, together with the previously identified gaps in coverage, reinforce theoretical arguments on the need to redesign urban transport around patterns of compulsory mobility. As Litman [9] points out, the disconnection between public transport services and actual travel patterns diminishes modal efficiency and reinforces structural inequalities in access.
In summary, the findings of this study reveal a significant misalignment between public transport provision and the real spatial dynamics of work-related mobility in Mexicali. This gap reflects a lack of coordination between modal planning and territorial needs, particularly in peripheral areas with high levels of modal dependence. The evidence highlights the urgent need to rethink route design from a perspective of spatial justice, operational efficiency, and equity in access to employment.
4.4. Contextualization Within International Research
To situate the findings of this study within the broader field, a comparison was made to understand how this work relates to and differs from existing research on spatial analysis of public transport and urban mobility. The focus is on methodological approaches, geographic contexts, as well as the challenges and policy recommendations addressed in other studies. Several recent peer-reviewed articles were considered to provide context. Table 3 presents the key points of comparison, illustrating where this study complements existing knowledge and where it offers a distinct perspective, particularly about intermediate cities and mobility-related inequalities.
Table 3.
Comparison of key points on the differences between this work and other research presented in the literature on urban mobility.
As shown in Table 3, while various studies address issues of spatial equity, service coverage, and public transport efficiency, this research focuses on the challenges faced by intermediate cities with dispersed growth, such as Mexicali. It contributes to the field by identifying spatial mismatches between commuting needs and transport supply, emphasizing the importance of territorial integration and social inclusion in mobility planning.
5. Conclusions
This study confirms the existence of a structural disconnect between Mexicali’s public transport network and the actual patterns of work-related mobility. Using a multiscale approach that combined spatial analysis tools and O–D surveys, the research identified significant gaps in connectivity, excessive travel times, and deficiencies in service quality—conditions that disproportionately affect the most vulnerable social groups. These factors reinforce a model of territorial exclusion and modal inequality, limiting equitable access to urban opportunities.
The analysis of public transport routes, user perceptions, travel characteristics, and the location of employment centres revealed that, although routes are relatively evenly distributed across the territory, they fail to cover the main O–D interactions associated with work-related travel. This demonstrates that the public transport system has not been designed according to actual commuting patterns, thereby undermining its efficiency and accessibility. Consequently, route layouts must be reconfigured to support a more sustainable mobility model, based on three key principles: socio-spatial equity, modal efficiency, and territorial integration. This is not merely a matter of expanding public transport coverage but of ensuring quality, accessibility, and territorial relevance. Transport and urban planning must be closely coordinated to respond to actual mobility patterns and reduce private car dependency, particularly in cities characterised by peripheral and dispersed urban growth, such as Mexicali.
Currently, the city has extensive public transport coverage, with 40 routes serving the urban area. However, service density and connectivity are greatest in the central and western areas of the city, while the eastern, southern, and northeastern areas show lower levels of connectivity. This imbalance can limit access to employment, education, and services for residents in these peripheral areas, increasing both travel times and costs.
It is important to note that the current public transport system in Mexicali operates on a direct, non-integrated basis. Although it covers a large part of the city, it lacks network accessibility. Unlike cities with integrated trunk–feeder systems, this structure poses logistical and organisational challenges. However, it also presents an opportunity for urban policy aimed at improving service standards and promoting sustainable mobility. Implementing such a system would entail lower economic costs and shorter timelines than for other infrastructure projects.
The O–D survey suggests that perceptions of public transport and service quality differ between residents of central and peripheral areas. In peripheral zones, users tend to have a more favourable view of the service, despite its limited availability and the lack of alternative mobility options. Overall, 69% of users rated the service as fair or good, mainly due to comfort. In contrast, 31% rated the service as poor, primarily citing low service quality and infrequent routes. Therefore, improving the quality, frequency, and coverage of the public transport system is essential to enhance user satisfaction and promote equitable access.
The study also found that the most common daily travel purpose is work-related, accounting for 66% of trips in the case study. Most of these trips are made by private car, with only 16% using public transport; the remainder use other modes. Commuters in peripheral areas are more likely to use public transport and have limited access to private vehicles, while those living in central areas are more likely to travel by car.
This mobility pattern also reveals limited modal diversity, with only 17% of trips made using sustainable modes such as walking or cycling. Despite their potential to reduce congestion and environmental impacts, these modes remain underutilized, underscoring the need for public policies that promote more sustainable and equitable mobility.
In addition, long trips—particularly those between different sections of the city—are predominantly made by car, whereas short and medium-distance trips show higher use of public transport and non-motorized modes. Industrial and service employment tends to be concentrated in peripheral areas, while commercial and government jobs are mainly located in the city centre. This pattern confirms that greater travel distances are associated with lower public transport use, highlighting spatial friction as a key factor influencing modal choice.
Some important employment centres were found to lack adequate public transport coverage, which can limit access to job opportunities for residents of peripheral areas. Industrial activity relies heavily on public transport and often requires long commutes, pushing users toward private vehicle use. Public transport is more frequently used for inter-sectional trips, while intra-sectional commutes are typically made on foot or by bicycle.
Based on the study’s findings, the following priority actions are proposed:
- Improve the public transport network in terms of coverage, frequency, accessibility, and connectivity.
- Redesign routes based on spatial analysis of work-related commuting patterns.
- Promote the implementation of an integrated trunk-feeder public transport system.
- Develop programs to improve user perception and increase public transport usage.
- Implement policies to reduce car dependency and expand sustainable mobility options, particularly mass and non-motorized transport.
- Encourage employment and housing location policies to reduce forced commuting.
- Incorporate technologies for route optimization and digital accessibility.
- Strengthen active mobility modes as a strategy for inclusion and urban resilience.
Moreover, the findings underscore that building more roads or increasing the number of routes without an integrated strategy do not address the structural problems of urban mobility. Transportation must be conceived as a functional network that articulates the territory, rather than as a mere sum of infrastructures. The effectiveness of public transport ultimately depends on its capacity to meet actual urban mobility needs and encourage a more rational use of space.
From a methodological perspective, the study demonstrates the practical value of spatial analysis in informing public policy. This approach facilitates the optimization of route layouts, the identification of priority areas for multimodal infrastructure, and the development of territorial strategies to reduce travel times and costs.
In summary, strengthening public transport and promoting active mobility not only addresses environmental concerns but also represents a strategic pathway toward a more inclusive, healthy, and equitable city. Guiding urban mobility under these principles can transform not only traffic flows but also the spatial configuration and quality of life in urban areas. For intermediate cities like Mexicali, the decisions made today about mobility will be critical to shaping a more just and sustainable urban future.
Among the limitations of this study are the informal offer, or that it is not part of the official public transport system; on the other hand, due to budgetary limitations, the confidence level for the representative sample of the survey was set at 90%. Scenarios like this are understandable for cities in the Global South, although the findings are a valuable iteration to have a magnitude of the problem or phenomenon studied. As for future research, we intend to conduct an analysis using the LOGIT model, as well as an evaluation of the level of attention of the public transport system in relation to urban marginalization in the case study.
Author Contributions
Conceptualization, J.C.-R.; Methodology, J.C.-R. and M.G.-M.; Software, J.C.-R. and I.N.-L.; Validation, J.C.-R., M.G.-M., A.M.-M., A.S.-A., L.G.-G. and M.M.-A.; Formal analysis, J.C.-R. and I.N.-L.; Investigation, J.C.-R., M.G.-M., A.M.-M., A.S.-A., L.G.-G. and M.M.-A.; Resources, J.C.-R., M.G.-M., A.M.-M., A.S.-A., L.G.-G., M.M.-A. and I.N.-L.; Data curation, J.C.-R., M.G.-M., A.M.-M., A.S.-A., L.G.-G., M.M.-A. and I.N.-L.; Writing–original draft preparation, J.C.-R.; Writing—review and editing, I.N.-L.; Visualization, M.G.-M., A.M.-M., A.S.-A., L.G.-G., M.M.-A. and I.N.-L.; Supervision, A.M.-M.; Project administration, A.M.-M.; Funding acquisition, J.C.-R., M.G.-M., A.M.-M., A.S.-A., L.G.-G., M.M.-A. and I.N.-L. All authors have read and agreed to the published version of the manuscript.
Funding
This research received no external funding.
Institutional Review Board Statement
Not applicable.
Informed Consent Statement
Not applicable.
Data Availability Statement
Data are contained within the article.
Conflicts of Interest
The authors declare no conflicts of interest.
References
- Cervero, R. Traditional neighborhoods and commuting in the San Francisco Bay area. Transportation 1996, 23, 373–394. [Google Scholar] [CrossRef] [Scilit]
- De Vos, J.; Derudder, B.; Van Acker, V.; Witlox, F. Reducing car use: Changing attitudes or relocating? The influence of residential dissonance on travel behaviour. J. Transp. Geogr. 2012, 22, 1–9. [Google Scholar] [CrossRef] [Scilit]
- Schwanen, T.; Mokhtarian, P.L. What affects commute mode choice, neighbourhood physical structure or preferences toward neighborhoods? J. Transp. Geogr. 2005, 13, 83–99. [Google Scholar] [CrossRef] [Scilit]
- Cao, X.; Mokhtarian, P.L.; Handy, S.L. Examining the impacts of residential self-selection on travel behaviour: A focus on empirical findings. Transp. Res. Part Policy Pract. 2009, 29, 359–395. [Google Scholar] [CrossRef] [Scilit]
- Ewing, R.; Cervero, R. Travel and the built environment. A meta-analysis. J. Am. Plann. Assoc. 2010, 76, 265–294. [Google Scholar] [CrossRef] [Scilit]
- Mokhtarian, P.L.; Cao, X. Examining the impacts of residential self-selection on travel behavior: A focus on methodologies. Transp. Res. Part B Methodol. 2008, 42, 204–228. [Google Scholar] [CrossRef] [Scilit]
- Yañez-Orozco, H.; Bravo-Peña, L.C. Índice de motorización, vehículos legales e ilegales: El caso de la ciudad Cuauhtémoc, Chihuahua. Acta Univ. 2022, 32, e3207. [Google Scholar] [CrossRef] [Scilit]
- Latamobility. Uso del Automóvil Particular en México Aumentó un 11% Desde la Pandemia, Según Reporte de Moovit. 2022. [En Línea]. Available online: https://latamobility.com/uso-del-automovil-particular-en-mexico-aumento-un-11-desde-la-pandemia-segun-reporte-de-moovit/ (accessed on 5 April 2025).
- Alegria, G. Gestión de la Movilidad para México Beneficios para su Desarrollo Económico. 2012. [En Línea]. Available online: https://www.academia.edu/35922565/Gesti%C3%B3n_de_la_movilidad_para_M%C3%A9xico_Beneficios_para_su_desarrollo_econ%C3%B3mico (accessed on 28 February 2025).
- Instituto Nacional de Estadística, Geografía e Informática (INEGI) de México. Censo de Población y Vivienda 2020. [En Línea]. INEGI. Available online: https://www.inegi.org.mx/programas/ccpv/2020/ (accessed on 10 February 2025).
- Mexicali: Economía, Empleo, Equidad, Calidad de Vida, Educación, Salud y Seguridad Pública|Data México. [En Línea]. Available online: https://www.economia.gob.mx/datamexico/es/profile/geo/mexicali (accessed on 20 March 2025).
- Instituto Municipal de Investigación y Planeación Urbana de Mexicali. Plan Maestro de Vialidades y Transporte de Mexicali; IMIP: De Mexicali, Mexico, 2011.
- Instituto Municipal de Investigación y Planeación Urbana de Mexicali (IMIP). Programa Integral Movilidad Urbana Sustentable; PIMUS: De Mexicali, Mexico, 2021. Available online: https://www.mexicali.gob.mx/sitioimip/?seccion=Servicios&serv=PLANES%20Y%20PROGRAMAS (accessed on 4 March 2025).
- Garza, G. Eibenschutz Hartman, Roberto y Pablo Benlliure (coords.) Mercado formal e informal de suelo. Análisis de ocho ciudades, México, Cámara de Diputados/Sedesol/UAM-X/Miguel Ángel Porrúa. Estud. Demogr. Y Urbanos 2012, 27, 853. [Google Scholar] [CrossRef] [Scilit]
- Acheampong, R.A. Managing urban spatial structure for sustainable development. Cities 2020, 98, 102573. [Google Scholar]
- Gutierrez, J. ¿Qué es la movilidad? Elementos para construir definiciones básicas del campo del transporte. Bitácora Urbano Territ. 2012, 22, 61–74. [Google Scholar]
- Hensher, D.A.; Wei, E.; Beck, M.; Balbontin, C. Balbontin The impact of COVID-19 on cost outlays for car and public transport commuting. Transp. Policy 2021, 101, 71–80. [Google Scholar] [CrossRef] [Scilit]
- Gutiérrez-Puebla, J. Aplicación de Técnicas de Ordenación del Territorio al Área Metropolitana de Madrid: El Análisis Del Comportamiento Espacial de la Población; Editorial de la Universidad Complutense de Madrid: Madrid, Spain, 1983. [Google Scholar]
- Valero, A. Movilidad espacial en Madrid. An. Geogr. Univ. Complut. 1984, 4, 207–225. [Google Scholar]
- Koehl, A. Urban transport and COVID-19: Challenges and prospects in low- and middle-income countries. Cities Health 2021, 5, S185–S190. [Google Scholar] [CrossRef] [Scilit]
- Gutiérrez, A. Transporte, movilidad y territorio: Perspectivas a partir de la pandemia COVID-19. Rev. Transp. Territ. 2021, 25, 1–9. [Google Scholar] [CrossRef] [Scilit]
- Pons, J.M.S.; Reynès, M.R.M. Geografía de los Transportes; Universitat de les Illes Balears: Palma de Mallorca, Spain, 2004. [Google Scholar]
- García Palomares, J.C.; Gutiérrez Puebla, J. Pautas de la Movilidad en el área Metropolitana de Madrid. Cuadernos De Geografía De La Universitat De València. Núm. 81–82, 2007. Available online: https://turia.uv.es//index.php/CGUV/article/view/14371 (accessed on 15 June 2025).
- Castell, M.; Himanen, P. El Estado del Bienestar y la Sociedad de la Información. In La Sociedad Red; Alianza Editorial: Madrid, Spain, 2002. [Google Scholar]
- Aschauer, D. Why Is Infrastructure Important? Conference Series; [Proceedings], Federal Reserve Bank of Boston, Volume 34, Pages 21–68, 1990. Available online: https://econpapers.repec.org/article/fipfedbcp/y_3a1990_3ap_3a21-68_3an_3a34.htm (accessed on 16 January 2025).
- De la Hoz Sánchez, D. Factores Sociales en las Pautas de Desplazamiento y uso del Coche de la Movilidad Obligada en Madrid. Ph.D. Thesis, Universidad Politécnica de Madrid, Madrid, Spain, 2001. [Google Scholar]
- Godenau, D.; Arteaga, S. La Movilidad en los Mercados Locales de Tenerife; Cabildo Insular de Tenerife: Santa Cruz de Tenerife, Spain, 2003. [Google Scholar]
- Monzón, A.; López, M.E. La planificación conjunta de usos de suelo y transporte al servicio del desarrollo urbano sostenible: Una guía de buenas prácticas. In Proceedings of the VI Congreso de Ingeniería del Transporte, Zaragoza, Spain, 23–25 June 2004; Available online: https://scholar.google.com/scholar?cluster=348844606431858233&hl=es&as_sdt=2005&sciodt=0,5 (accessed on 4 March 2025).
- Dupuy, G. L’auto et la Ville; Dominos-Flammarion: Paris, France, 1995. [Google Scholar]
- Cebollada, À. Aproximación a los procesos de exclusión social a partir de la relación entre el territorio y la movilidad cotidiana. Doc. D’Anàlisi Geogr. 2006, 48, 105–121. [Google Scholar]
- Mitra, S.K.; Saphores, J.-D.M. Why do they live so far from work? Determinants of long-distance commuting in California. J. Transp. Geogr. 2019, 79, 102489. [Google Scholar] [CrossRef] [Scilit]
- Liu, Z.; Wang, H. Measuring Spatial Equity of Urban Public Transport with Big Data: A Case Study of Beijing. Sustainability 2020, 12, 2345. [Google Scholar] [CrossRef] [Scilit]
- Giuliano, G.; Gillespie, A. Research issues regarding societal change and transport. J. Transp. Geogr. 1997, 5, 165–176. [Google Scholar] [CrossRef] [Scilit]
- Cervero, R.; Wu, K.-L. Sub-centring and Commuting: Evidence from the San Francisco Bay Area, 1980-90. Urban Stud. 1998, 35, 1059–1076. [Google Scholar] [CrossRef] [Scilit]
- Modenes, J. Movilidad Espacial: Uso Temporal del Territorio y Poblaciones Vinculadas. In Proceedings of the X Congreso de la Población Española: “Migraciones, Movilidad y Territorio”, Pamplona, Spain, 29 June–1 July 2007. [Google Scholar]
- Dupuy, G. El Urbanismo de las Redes. Teorías y Métodos; Libro de Colección Redes y Territorios del Colegio de Ingenieros de Caminos, Canales y Puertos; Oikos-Tau: Barcelona, Spain, 1998; ISBN 84-281-0937-0. Available online: https://dialnet.unirioja.es/servlet/libro?codigo=48046 (accessed on 15 January 2025).
- Charreire, H.; Roda, C.; Feuillet, T.; Piombini, A.; Bardos, H.; Rutter, H.; Compernolle, S.; Mackenbach, J.; Lakerveld, J.; Oppert, J. Walking, cycling, and public transport for commuting and non-commuting travels across 5 European urban regions: Modal choice correlates and motivations. J. Transp. Geogr. 2021, 96, 103196. [Google Scholar] [CrossRef] [Scilit]
- Manaugh, K.; El-Geneidy, A. Who benefits from new transportation infrastructure? Using accessibility measures to evaluate social equity in public transport provision. In Accessibility and Transport Planning: Challenges for Europe and North America; Geurs, K., Krizek, K., Reggiani, Y.A., Eds.; Edward Elgar: London, UK, 2012; pp. 211–227. [Google Scholar]
- Alegría, T. Modelo Estructural del Trabajo Transfronterizo. In Fronteras en América del Norte. Estudios Multidisciplinarios; Mercado, A., Gutiérrez, Y.E., Eds.; Centro de Investigaciones sobre América del Norte, Universidad Nacional Autónoma de México: Mexico City, Mexico, 2004; pp. 417–438. [Google Scholar]
- Puebla, J.G.; Palomares, J.C.G. Cambios en la movilidad en el área metropolitana de Madrid: El creciente uso del transporte privado. An. Geogr. Univ. Complut. Madr. 2005, 25, 331–351. [Google Scholar]
- López, A.L.; Márquez, J.M.M. Forma urbana y movilidad sostenible: El caso de Madrid. Rev. Inst. Estud. Econ. 2006, 1–2, 158–189. [Google Scholar]
- Gordon, P.; Richardson, H.W. Critiquing Sprawl’s Critics; Cato Institute, Cato Policy Analysis: Washington, DC, USA, 2000; p. 365. [Google Scholar]
- Levinson, D.M.; Kumar, A. The Rational Locator: Why Travel Times Have Remained Stable. J. Am. Plan. Assoc. 1994, 60, 319–332. [Google Scholar] [CrossRef] [Scilit]
- Nam, S.; Hong, S. The Effects of Employment Center Characteristics on Commuting Time: A Case Study of the Seoul Metropolitan Area. ISPRS Int. J. Geo-Inf. 2025, 14, 116. [Google Scholar] [CrossRef] [Scilit]
- Pojani, D.; Stead, D. Sustainable Urban Transport in the Developing World: Beyond Megacities. Sustainability 2015, 7, 7784–7805. [Google Scholar] [CrossRef] [Scilit]
- United Nations. Transforming Our World: The 2030 Agenda for Sustainable Development; United Nations: New York, NY, USA, 2015; Available online: https://sdgs.un.org/2030agenda (accessed on 21 December 2022).
- Ince, E.C. Mapping the Path to Sustainable Urban Mobility: A Bibliometric Analysis of Global Trends and Innovations in Transportation Research. Sustainability 2025, 17, 1480. [Google Scholar] [CrossRef] [Scilit]
- Santos, V.; Almeida, N. Ethical Marketing Model for Luxury Hotel Chains: Development and Validation of a Performance Evaluation Tool. Sustainability 2022, 14, 7382. [Google Scholar] [CrossRef] [Scilit]
- Ensher, D.A.; Beck, M.J.; Wei, E. Working from home and its implications for strategic transport modelling based on the early days of the COVID-19 pandemic. Transp. Res. Part A Policy Pract. 2021, 148, 64–78. [Google Scholar] [CrossRef] [Scilit]
- Son, H.; Jang, J.; Park, J.; Balog, A.; Ballantyne, P.; Kwon, H.R.; Singleton, A.; Hwang, J. Leveraging Advanced Technologies for (Smart) Transportation Planning: A Systematic Review. Sustainability 2025, 17, 2245. [Google Scholar] [CrossRef] [Scilit]
- Meira, L.H.; de Mello, C.A.; Castro, Y.M.; Oliveira, L.K.; Nascimento, C.d.O.L. Measuring Social Effective Speed to Improve Sustainable Mobility Policies in Developing Countries. Transp. Res. Part D Transp. Environ. 2020, 78, 102200. [Google Scholar] [CrossRef] [Scilit]
- Mwale, M.; Pisa, N.; Luke, R. Travel mode choices of residents in developing cities: A case study of Lusaka, Zambia. J. Transp. Supply Chain Manag. 2024, 18, a1005. [Google Scholar] [CrossRef] [Scilit]
- Izquierdo, J.M.C.; María, J. Estudios sobre movilidad cotidiana en México. Scr. Nova Rev. Electrón. Geogr. Cienc. Soc. 2008, XII, 273. [Google Scholar]
- Mungaray, A. Análisis de la Movilidad Laboral Poblacional en la Región Metropolitana—Transfronteriza Tijuana—San Diego y su Incidencia en los Procesos de Estructuración Urbana. Ph.D. Thesis, University Castilla-La Mancha (UCLM), Ciudad Real, Spain, 2011. [Google Scholar]
- Feria, J.M. Un ensayo metodológico de definición de las áreas metropolitanas en España a partir de la variable residencia-trabajo. Investig. Geogr. 2009, 46, 49–68. [Google Scholar]
- Macioszek, E.; Swierk, P.; Sobota, A. Application of a logit model to identify sociodemographic factors influencing the choice of public transport for daily trips—A case study based on the example of the Górnośląska-Zagłębiowska metropolis (Poland). Transp. Probl. 2024, 19, 131–142. [Google Scholar] [CrossRef] [Scilit]
- Sun, W.; Liu, Y.; Zhang, M. Evaluation of Spatial Fairness of Urban Public Transport Service in Wuhan, China. Sustainability 2022, 14, 9584. [Google Scholar] [CrossRef] [Scilit]
- Oviedo, D.; Guzman, L.; Dávila, J. Accessibility and the Reproduction of Urban Inequality in Latin America: A Multiscalar Analysis. Urban Stud. 2017, 54, 2210–2230. [Google Scholar] [CrossRef]
- Gutiérrez, J.; Cardozo, O.D.; García-Palomares, J.C. Transit Ridership Forecasting at Station Level: An Approach Based on Distance-Decay Weighted Regression. J. Transp. Geogr. 2011, 19, 1081–1092. [Google Scholar] [CrossRef] [Scilit]
- Páez, A.; Scott, D.M.; Morency, C. Measuring Accessibility: Positive and Normative Implementations of Various Accessibility Indicators. J. Transp. Geogr. 2012, 25, 141–153. [Google Scholar] [CrossRef] [Scilit]
- O’Sullivan, D.; Morrison, A.; Shearer, J. Using Desktop GIS for the Investigation of Accessibility by Public Transport: An Isochrone Approach. Int. J. Geogr. Inf. Sci. 2000, 14, 85–104. [Google Scholar] [CrossRef] [Scilit]
- Delbosc, A.; Currie, G. Exploring the Relative Influences of Transport Disadvantage and Social Exclusion on Well-Being. Transp. Policy 2011, 18, 555–562. [Google Scholar] [CrossRef] [Scilit]
- Hidalgo, D.; Huizenga, C. Implementation of Sustainable Urban Transport in Latin America. Res. Transp. Econ. 2013, 40, 66–77. [Google Scholar] [CrossRef] [Scilit]
- Cervero, R. Transport Infrastructure and the Environment in Developing Countries: A Review of Impacts and Policy Options. World Bank Policy Research Working Paper 2013, No. 6201. Available online: https://openknowledge.worldbank.org/handle/10986/12044 (accessed on 4 March 2025).
- Geurs, K.T.; van Wee, B. Accessibility Evaluation of Land-Use and Transport Strategies: Review and Research Directions. J. Transp. Geogr. 2004, 12, 127–140. [Google Scholar] [CrossRef] [Scilit]
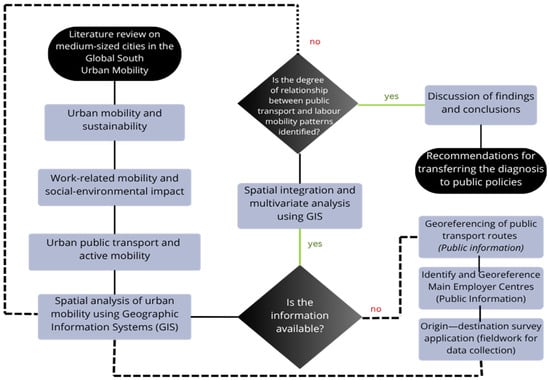
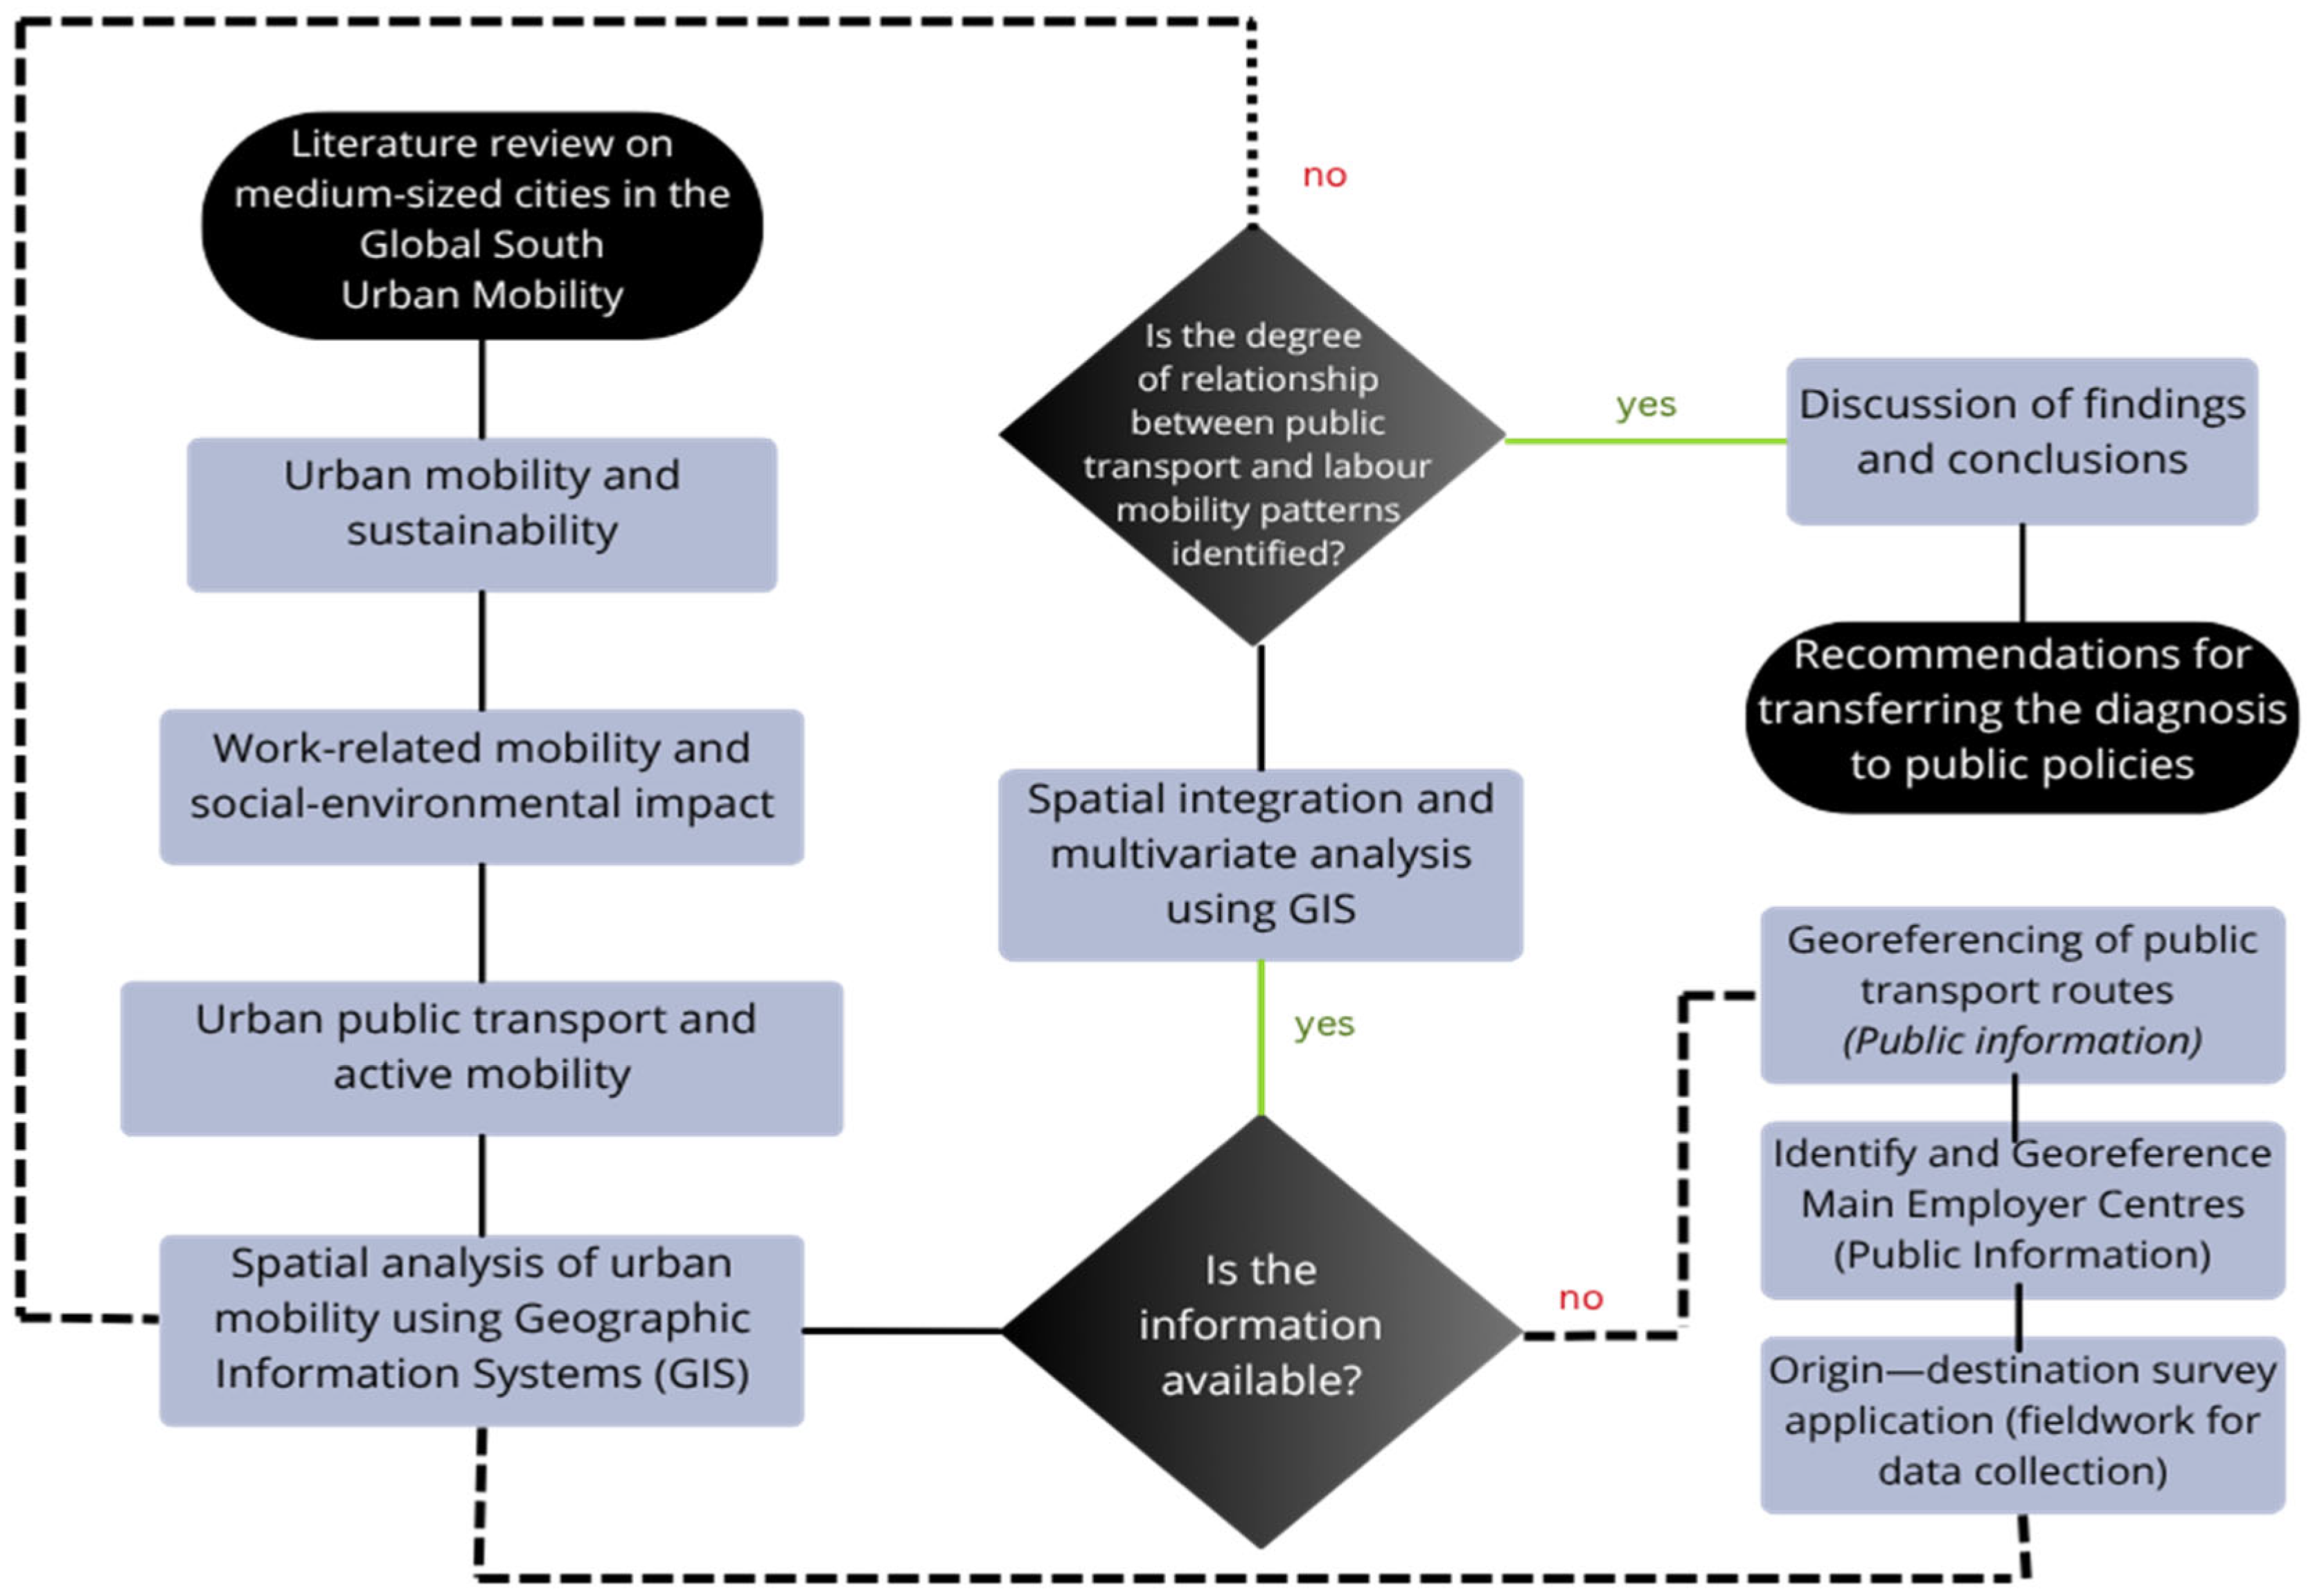
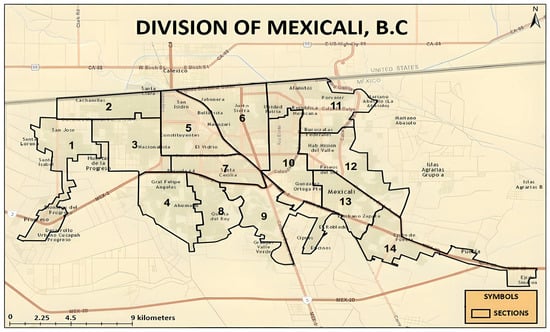
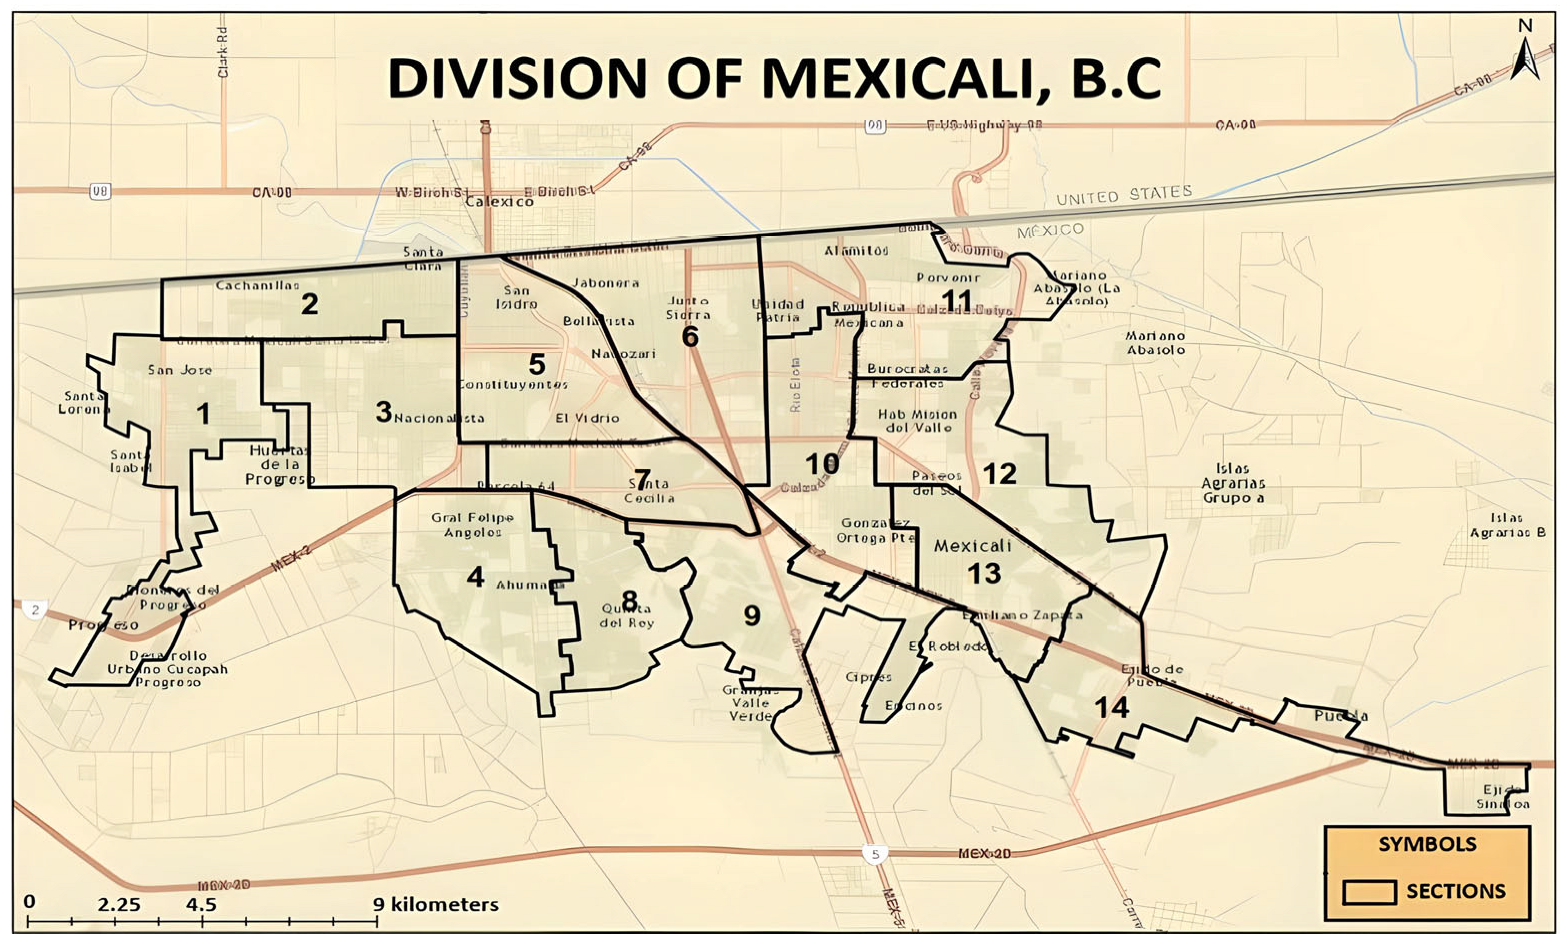
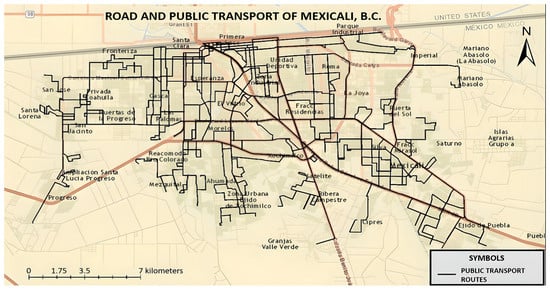
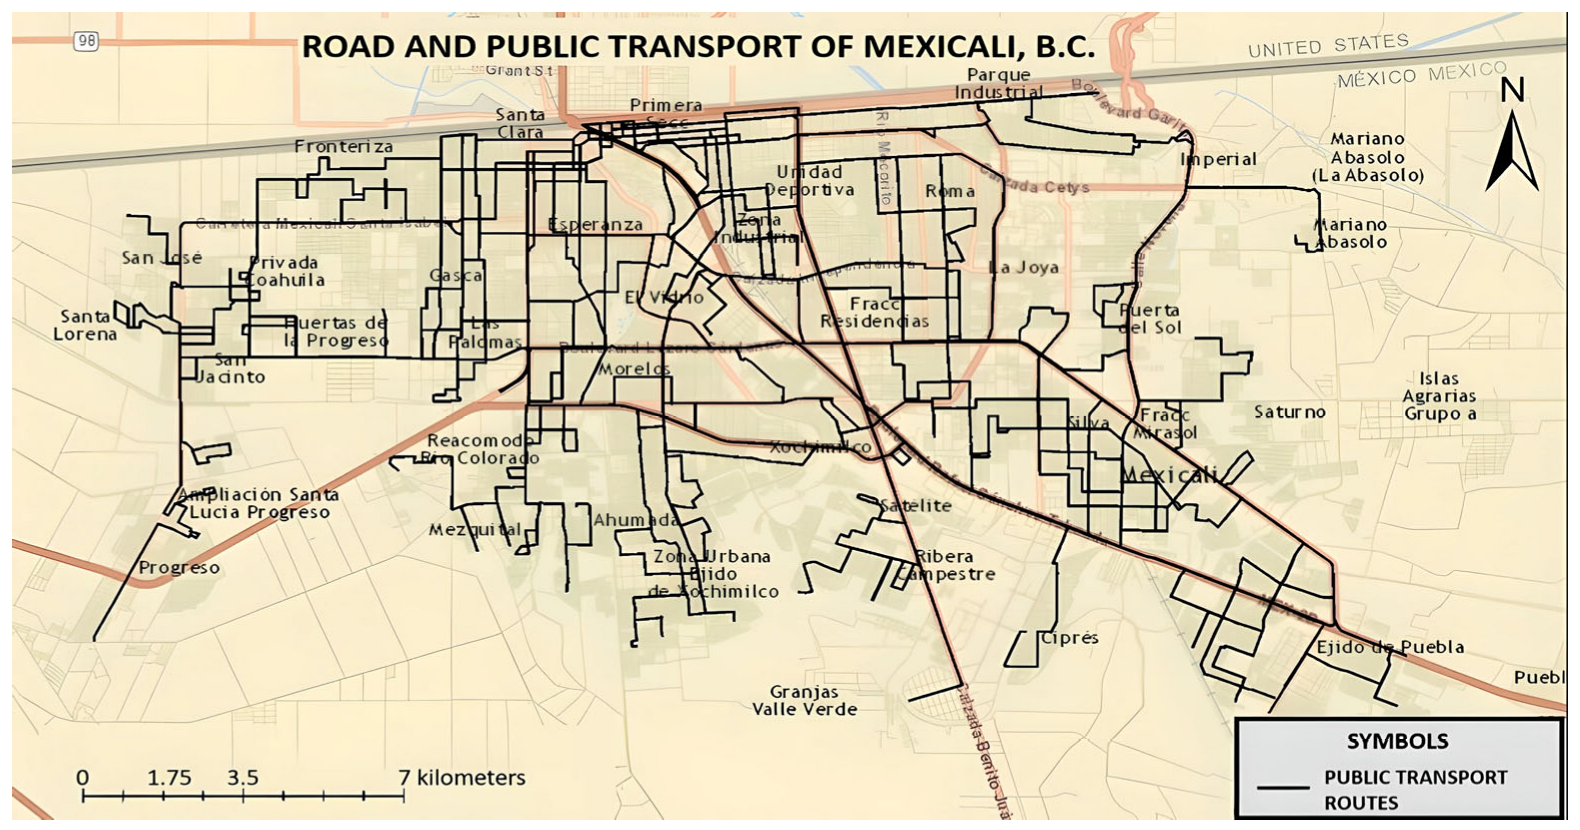
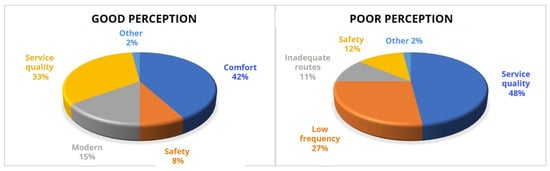
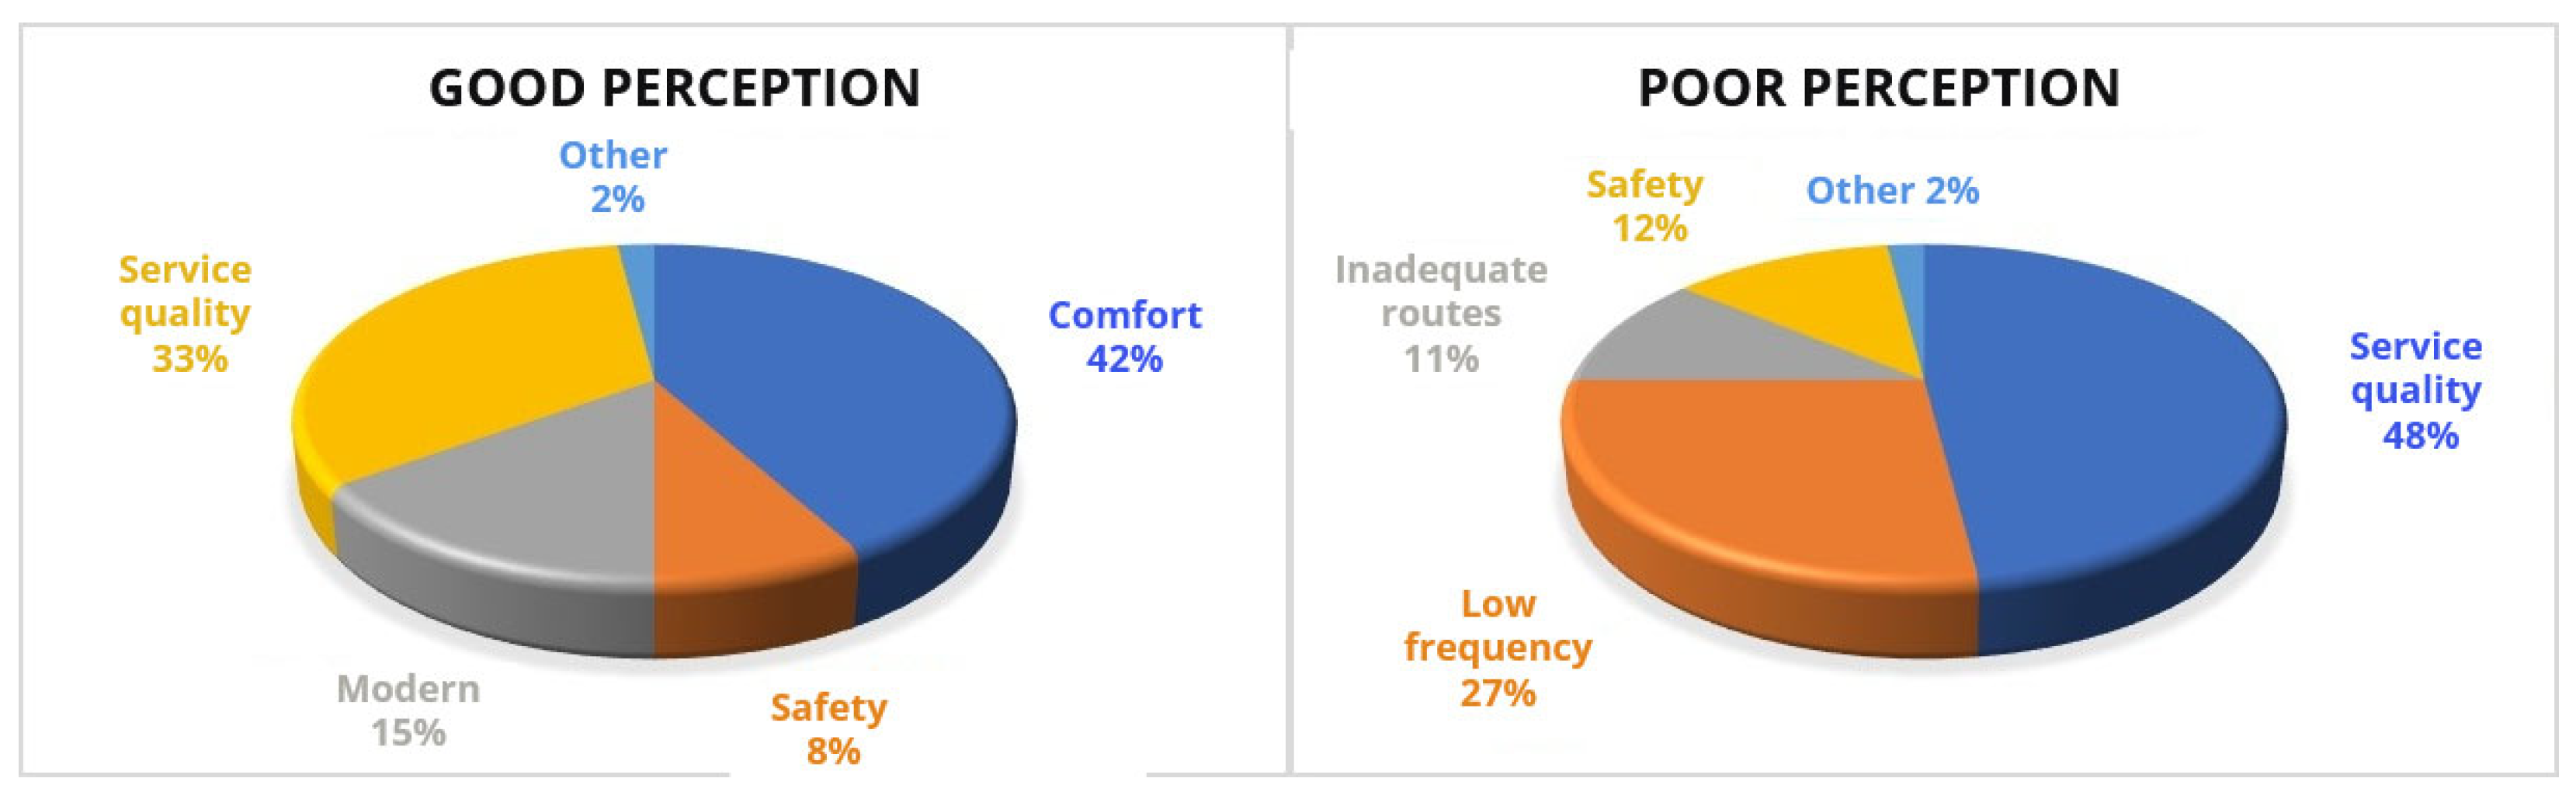
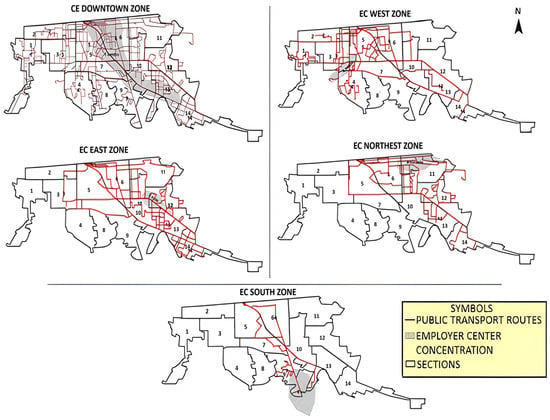
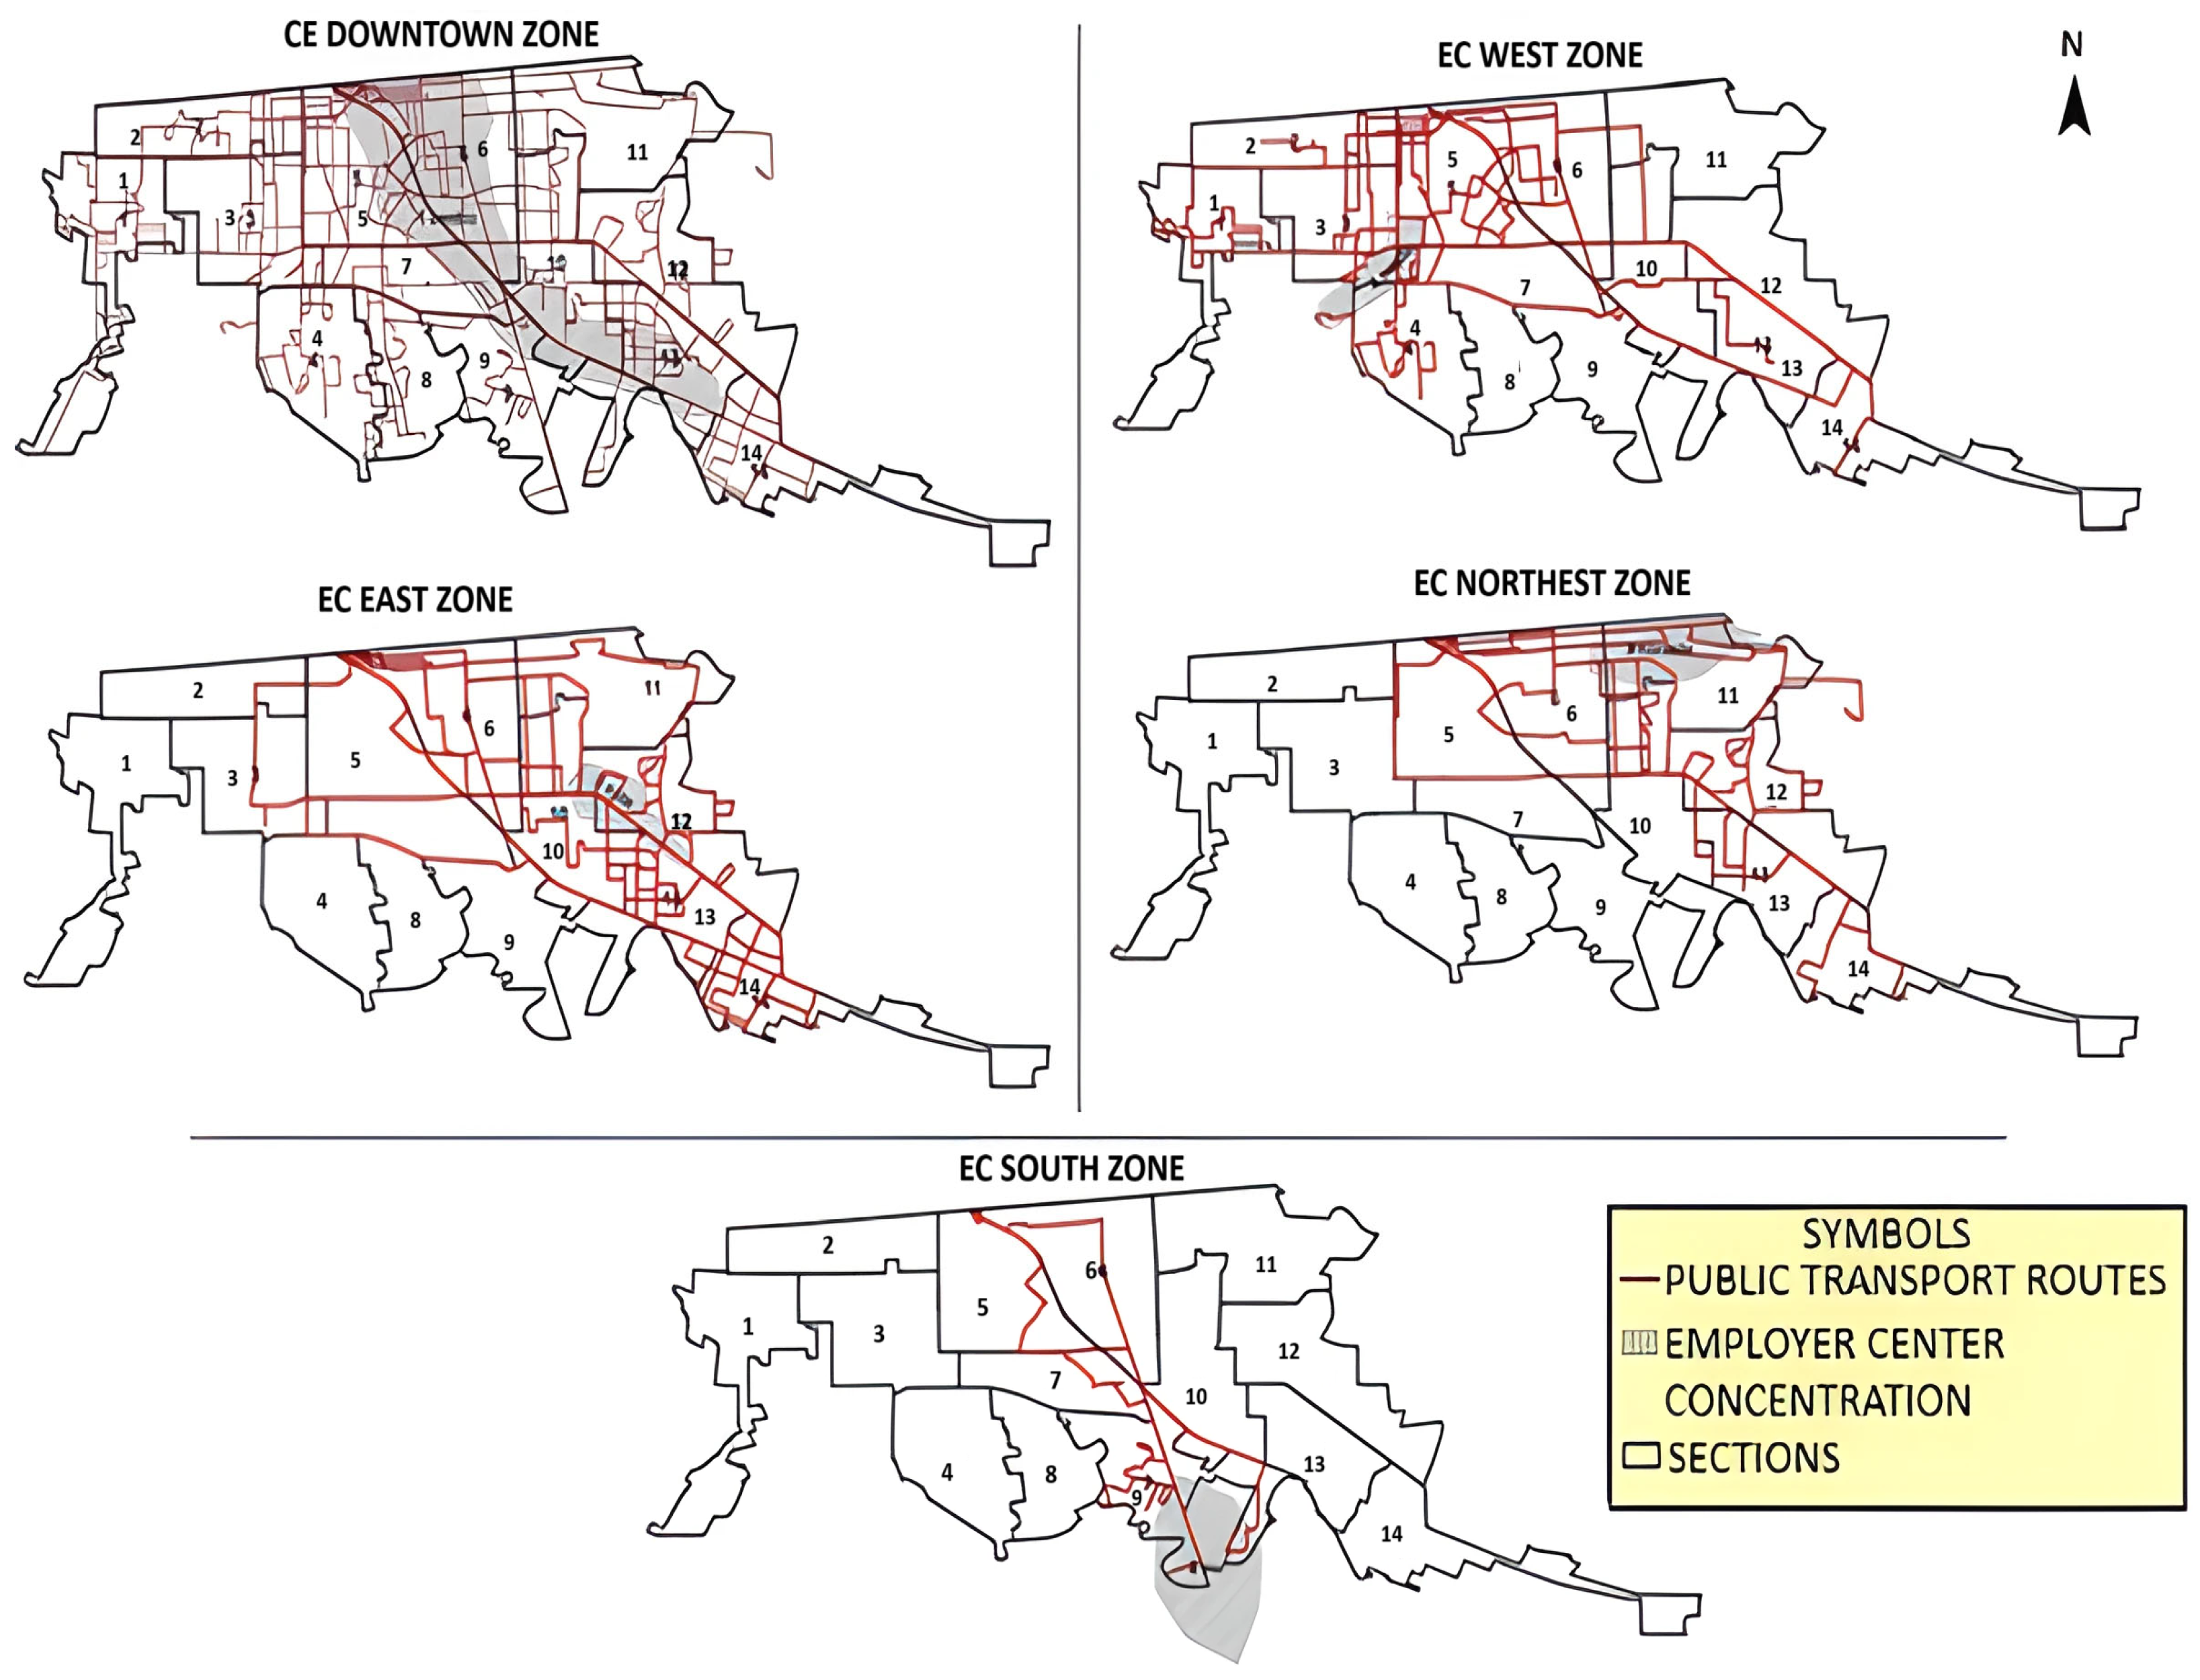
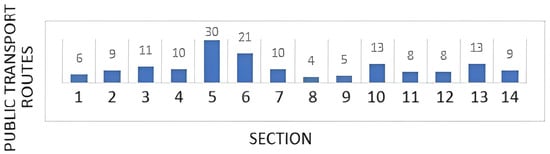
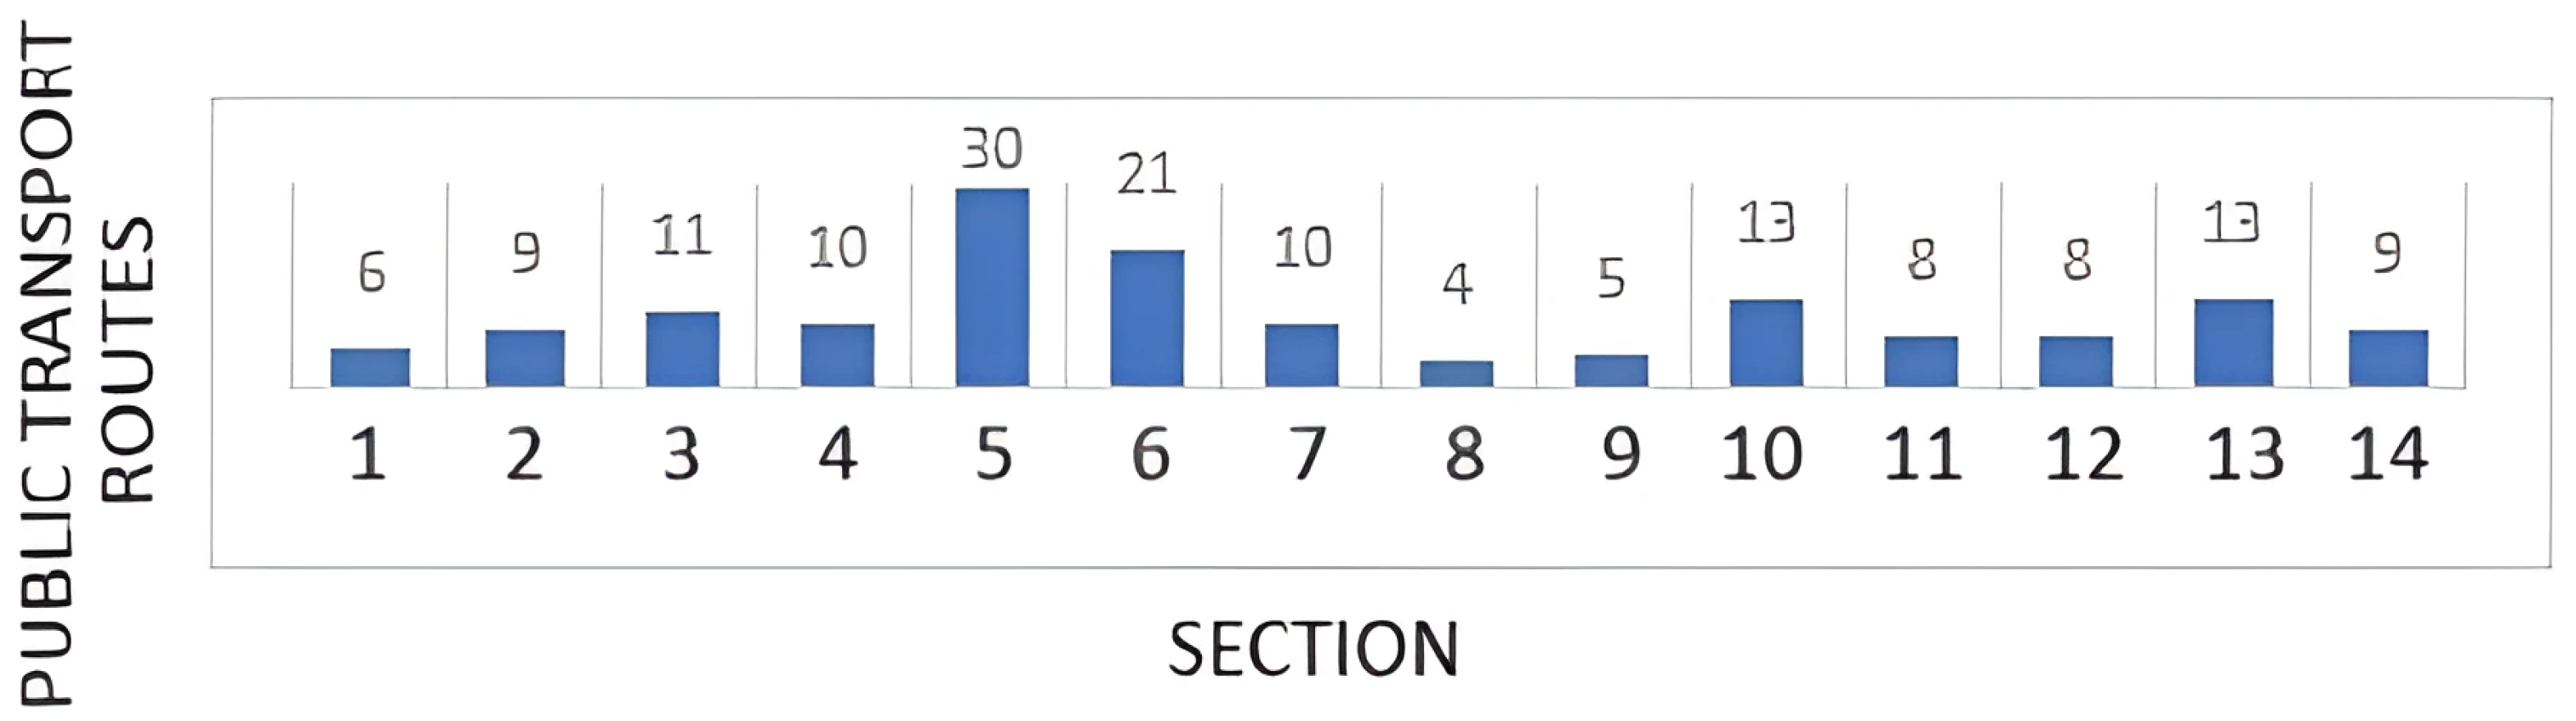
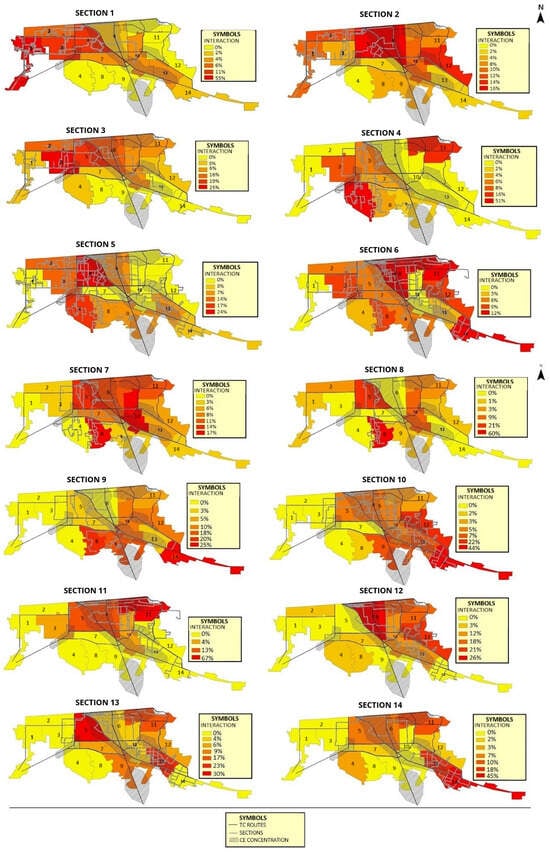
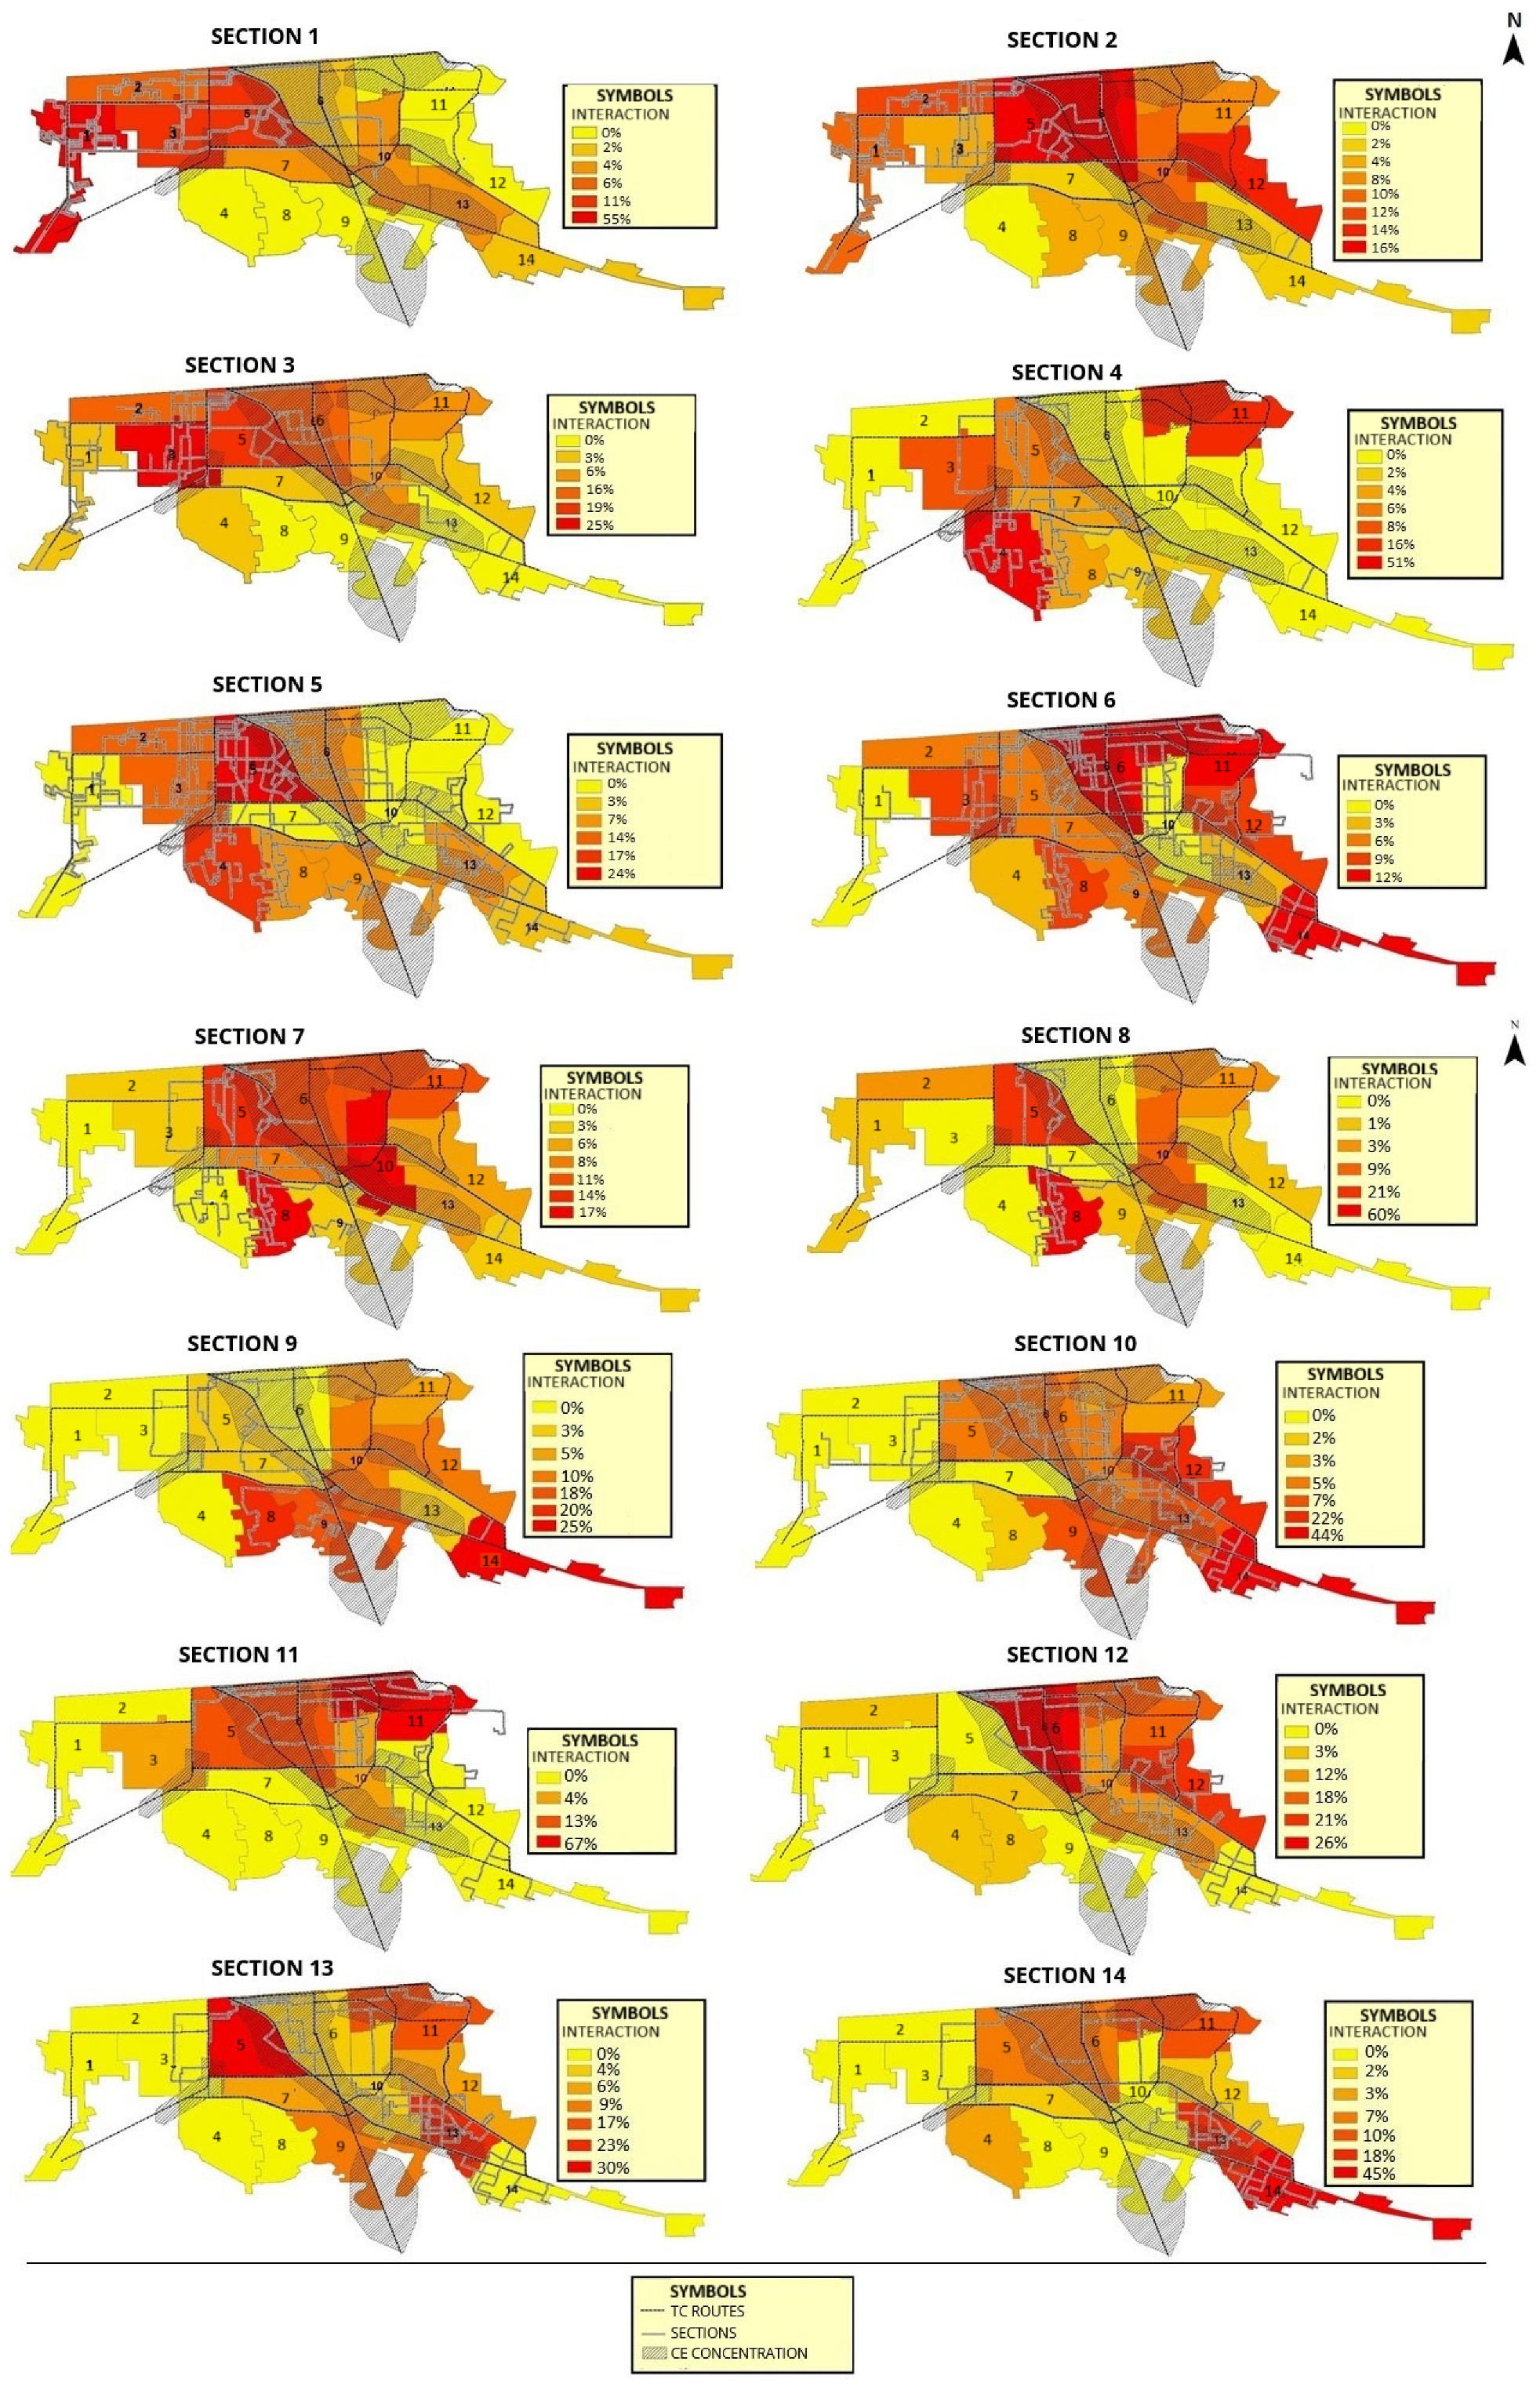

Disclaimer/Publisher’s Note: The statements, opinions and data contained in all publications are solely those of the individual author(s) and contributor(s) and not of MDPI and/or the editor(s). MDPI and/or the editor(s) disclaim responsibility for any injury to people or property resulting from any ideas, methods, instructions or products referred to in the content. |
© 2025 by the authors. Licensee MDPI, Basel, Switzerland. This article is an open access article distributed under the terms and conditions of the Creative Commons Attribution (CC BY) license (https://creativecommons.org/licenses/by/4.0/).