


Abstract
Against the backdrop of ongoing degradation of ecosystem services and the increasing demand for sustainable development, the scientific delineation of ecological management zones has become a critical means by which to balance human wellbeing and ecological conservation. This study takes Jiangxi Province as the research area and selects four typical ecosystem services—food production, water supply, carbon storage, and soil retention—to systematically evaluate their supply–demand relationships from both static and dynamic dimensions. By introducing the entropy weight method to construct a comprehensive supply–demand index and integrating a coupling coordination degree model with a four-quadrant dynamic evolution model, this paper proposes a coupled “static–dynamic” analytical framework. The findings reveal significant spatial heterogeneity in various ecosystem services; high-supply areas are concentrated in the southern and peripheral mountainous regions while demand is closely linked to population distribution, exhibiting a pattern of high demand in the central areas and high supply in the peripheral areas. Our supply–demand matching analysis uncovers a distinct gradient distribution characterized by core imbalance and peripheral coordination, with prominent supply–demand conflicts in urban expansion areas and enhanced coordination in peripheral ecological barrier zones. Based on these insights, we divide Jiangxi Province into five types of ecological management zones: Degraded Restoration, Conflict Mitigation, Coordination Enhancement, Potential Development, and Maintenance Conservation, with tailored management strategies proposed for each zone type. As a result, this study not only provides scientific support for regional ecological spatial optimization but also offers a new methodological paradigm for ecosystem services management.
1. Introduction
Ecosystem services represent as a crucial link between natural systems and human societies, providing irreplaceable support for the advancement of civilization. Their continued provision is directly tied to the trajectory of sustainable development [1]. However, the rapid processes of industrialization and urbanization along with the growing demand for high-quality ecological products has led to severe degradation of regional ecosystems, disrupting the balance between supply and demand of ecosystem services. According to the Millennium Ecosystem Assessment (MA), approximately 60% of global ecosystem services have already undergone degradation [2], primarily due to lack of effective management mechanisms [3]. This degradation fundamentally stems from spatial imbalances in supply and demand [4]; on the supply side, ecosystem capacity is constrained by landscape fragmentation and biodiversity loss, while demand-side pressures are intensified by ongoing population and economic agglomeration. Consequently, assessing the status of ecosystem service supply and demand as well as their spatial matching relationships is a prerequisite for the formulation of regional sustainable development strategies. As a core component of ecosystem service management, ecological management zoning offers an effective approach to enhancing human wellbeing and promoting regional ecological sustainability [5].
Today, quantitative assessment and matching analysis of ecosystem service supply and demand have become key research directions in the field, with increasing methodological and thematic diversification. Scholars have explored these topics across various spatial scales, including national [6], provincial [7], urban agglomerations [8], typical ecological function zones [9], forest [10], cultivated land [11,12], and river basins [13]. Major research themes include the quantitative evaluation of supply and demand [1,14], identification of ecological risks [15], analysis of tradeoffs and synergies among services [16], investigation of driving mechanisms [17], and simulation of future scenarios [18]. Accurate quantification of ecosystem service supply and demand is fundamental to identifying ecological problems. Current approaches primarily rely on value-based conversion and process-based modeling [19] to assess supply and demand in terms of both magnitude and spatial distribution [7]. Common methods for identifying supply–demand relationships include the supply–demand ratio method [20], spatial autocorrelation analysis [7], coupling coordination degree models [21], and four-quadrant classification techniques [22,23]. These methods are used to diagnose regional ecological conditions based on states of surplus, balance, or deficit. The impact of urbanization on the supply–demand balance of ecosystem services has also drawn considerable attention. Related studies have analyzed its mechanisms from the perspectives of land use change, population concentration, and economic expansion [24]. Overall, substantial progress has been made in measuring supply–demand balance, characterizing spatial patterns, and identifying influencing factors. Although existing methods provide valuable multi-dimensional insights into supply–demand relationships, limitations remain. Static analyses often fail to reveal temporal dynamics, while studies on dynamic evolution frequently lack systematic integration with static outcomes, thereby limiting the effectiveness of region-specific ecological management strategies. In recent years, scholars have begun to introduce integrated static–dynamic analytical frameworks that compare current states with multi-period changes [25]. These approaches offer deeper understanding of service gaps, risk transfers, and differentiated governance strategies, thereby enriching the comprehensive knowledge base for ecosystem service planning and management [26,27,28].
As a critical foundation for optimizing territorial spatial planning, ecological management zoning serves as an essential approach for effectively managing ecosystem services, enhancing human well-being, and promoting regional sustainable development [25]. Current research primarily delineates ecological zones based on theoretical frameworks such as ecosystem service supply–demand balance, tradeoffs and synergies, and service flows. In addition, some scholars have adopted integrated zoning methods that incorporate ecological redline policies [29], ecological protection and restoration zoning [30], and ecological risk assessment [28,31]. In light of increasingly prominent mismatches between ecosystem service supply and demand and escalating ecological issues, zoning approaches based on supply–demand relationships have gained traction. These approaches offer clear insights into matching states and allow for the identification of imbalance areas under both static coordination and dynamic transitions, providing critical guidance for regional ecological management practices.
Most existing studies on ecosystem service supply and demand remain at the level of static analysis, making it difficult to effectively reveal their temporal dynamics. Similarly, ecological management zoning studies often rely on single-method approaches, and lack comprehensive characterization of both the current state and evolving trends [32]. As one of China’s first designated Ecological and Cultural Pilot Zones, Jiangxi Province has made notable progress in ecological civilization construction [33]. However, it continues to face significant challenges, including a weak ecological foundation and pronounced tensions between development and environmental protection. In response to these issues, this study takes Jiangxi Province as the case study area, aiming to: (a) quantitatively assess the spatial patterns of supply and demand for four key ecosystem services; (b) develop a static–dynamic coupling analytical framework that integrates the coupling coordination degree model (static) and dynamic four-quadrant model (temporal evolution) in order to more comprehensively examine supply–demand matching relationships; and (c) delineate five types of ecological management zones based on the combined static and dynamic matching results to propose targeted management strategies. The results of this research provide scientific references for optimizing territorial spatial planning and promoting sustainable governance in Jiangxi Province as well as in other hilly regions with similar ecological and socioeconomic conditions.
2. Materials and Methods
2.1. Study Area
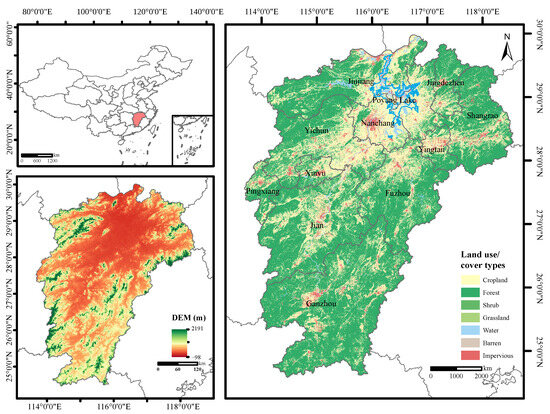
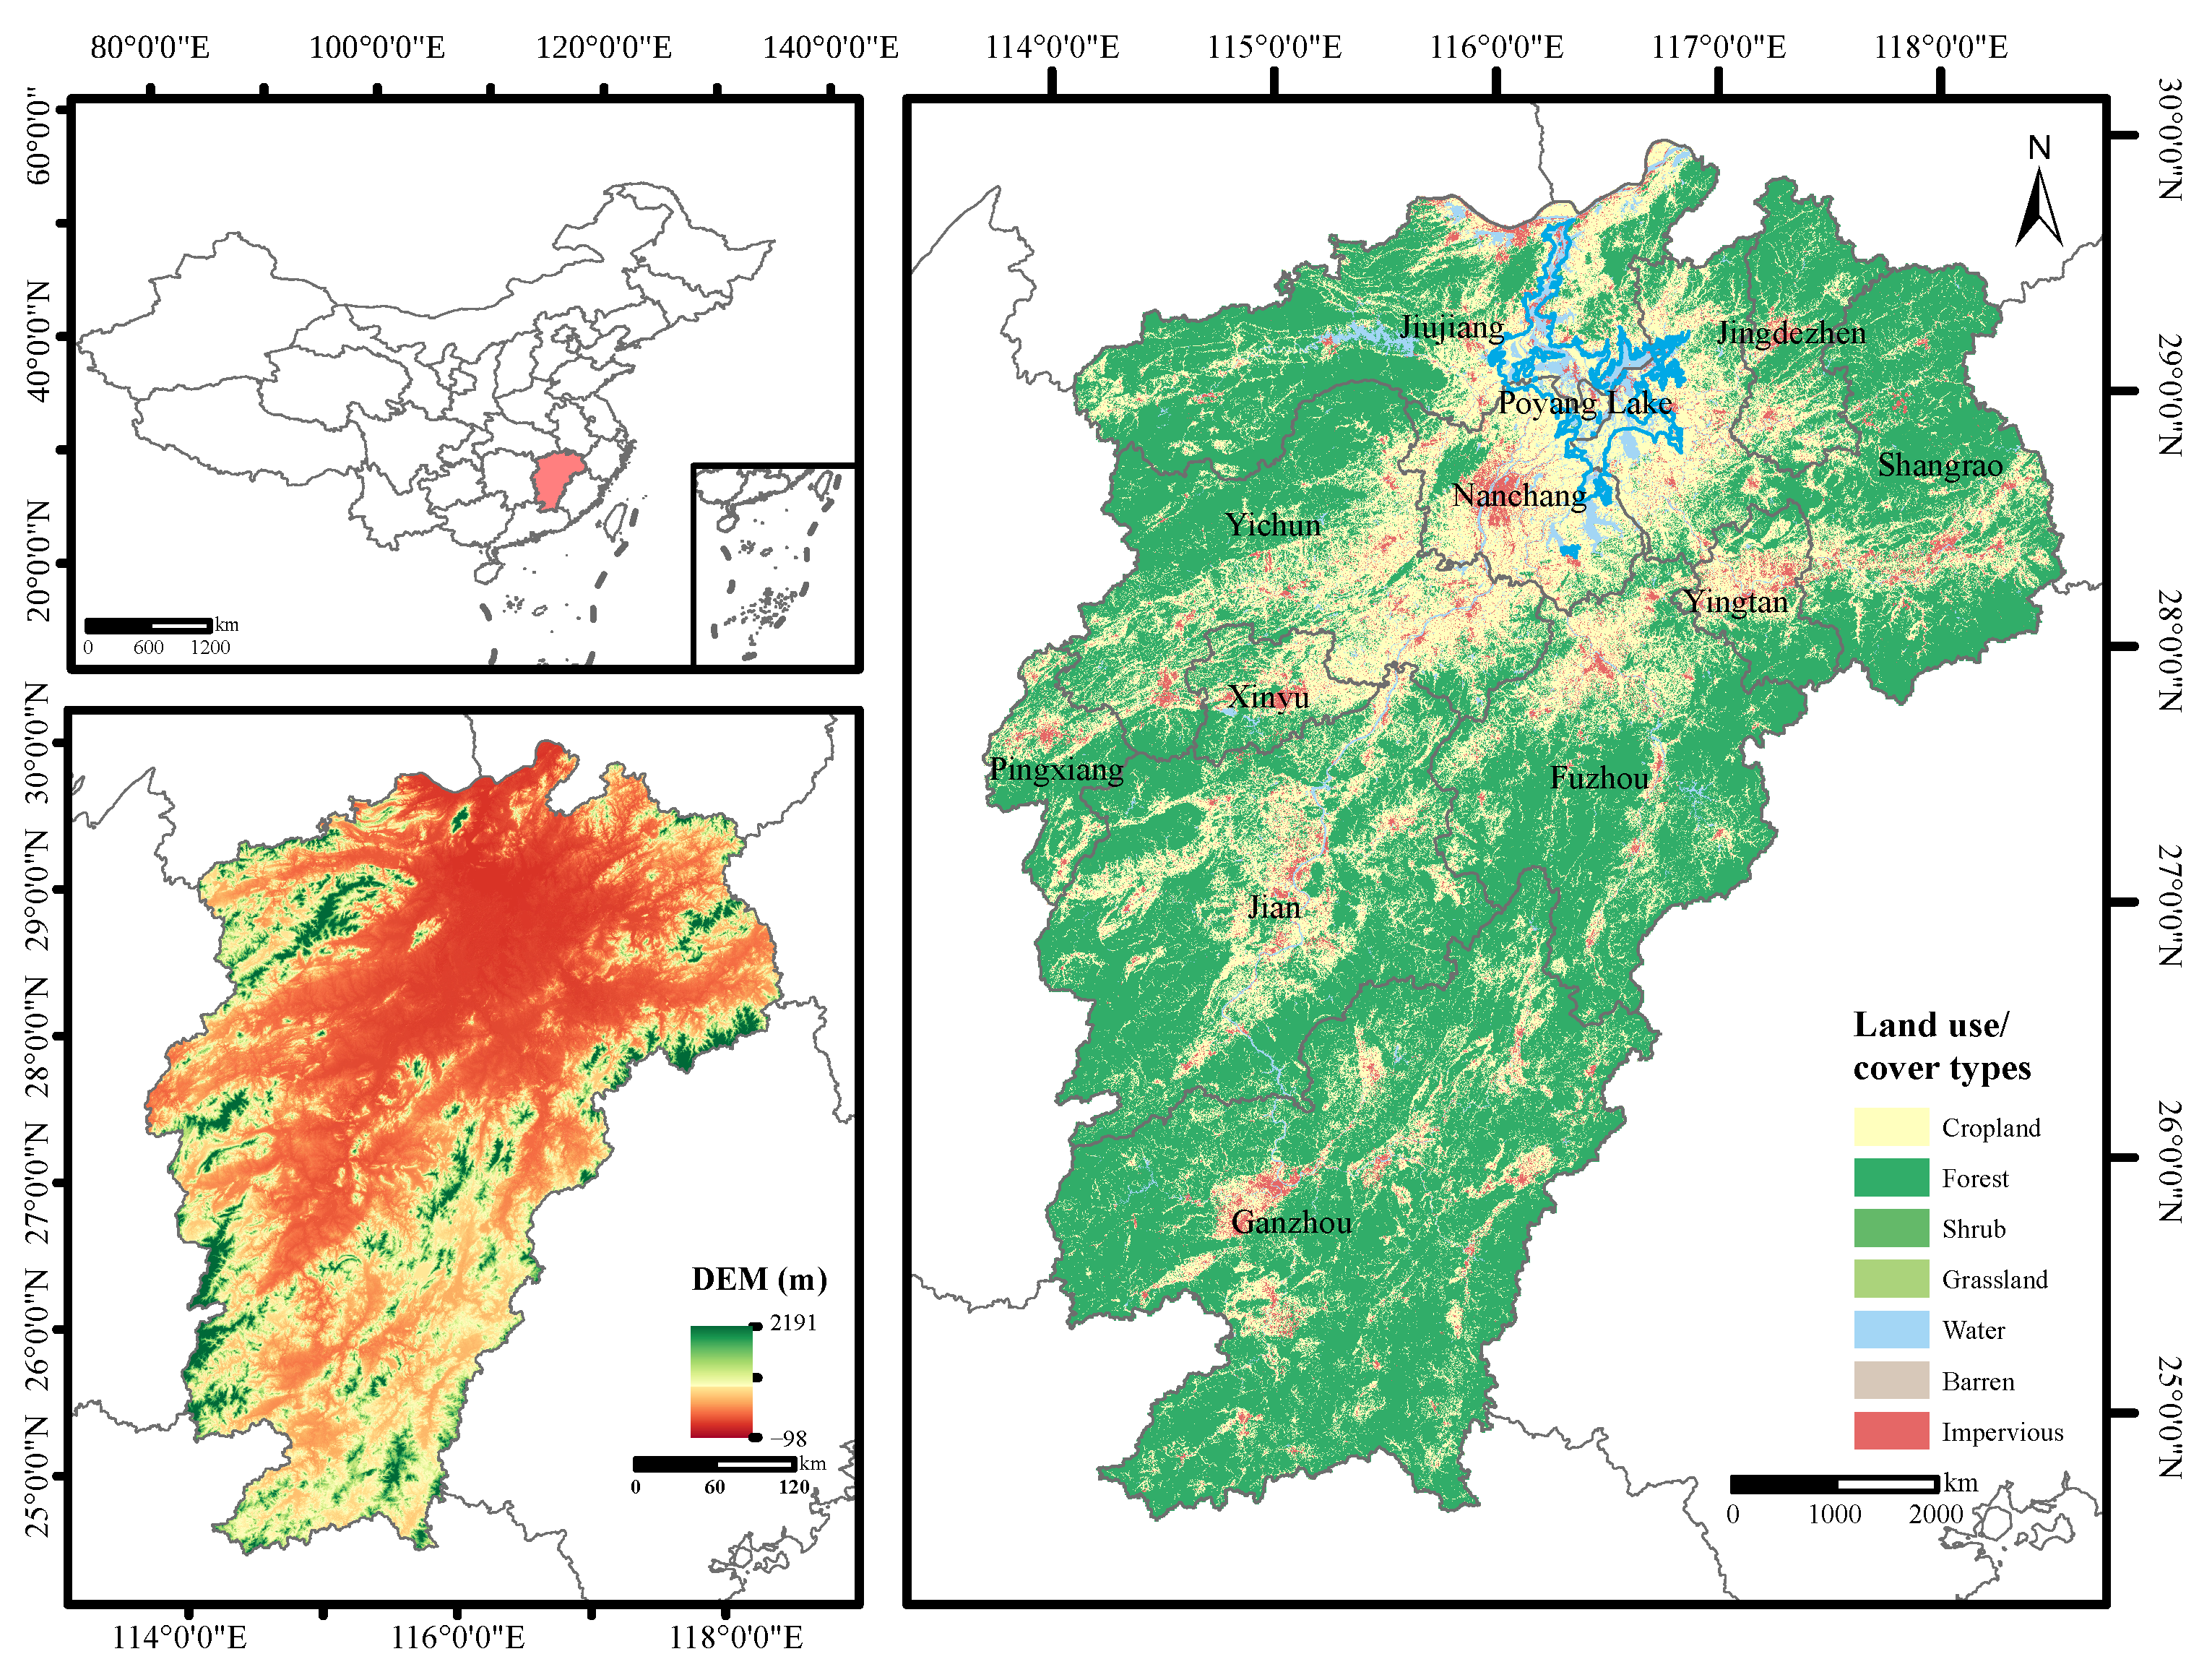
Jiangxi Province is located on the south bank of the middle and lower reaches of the Yangtze River in China, covering a total area of 166,900 km2. In 2022, Jiangxi had a total population of 45.28 million, a GDP of CNY 3207.4 billion, and a GDP growth rate of 7.5%. The province exhibits a narrow north–south elongated shape, forming an independent geographical unit surrounded by mountains on three sides. The topography is predominantly mountainous and hilly, accounting for 78% of the total area, with a distinct annular distribution pattern. Over the years, the province’s average temperature has been 19.6 °C, with an annual precipitation ranging from 1751 mm to 2523 mm. Jiangxi experiences a subtropical monsoon climate, with spatial differentiation of water and heat resources characterized by a pattern of warmer in the south, colder in the north, wetter in the east, and drier in the west [34] (Figure 1).
Figure 1.
Geographical location of Jiangxi Province.
As an ecological barrier in the middle reaches of the Yangtze River, Jiangxi Province has recently implemented various ecological protection and restoration projects, including the conservation and restoration of mountains, rivers, forests, farmlands, lakes, and grasslands in Ganzhou. However, the province still faces multiple ecological pressures, including soil erosion and the seasonal shrinkage of Poyang Lake. Additionally, the pressure for green economic transformation is increasing under the framework of ecological construction, and challenges remain in both ecological protection and restoration.
2.2. Data Sources and Processing
This study collected multi-source datasets to assess ecosystem services, including the Digital Elevation Model (DEM), land use data, Normalized Difference Vegetation Index (NDVI), night-time light data, meteorological data, and statistical data (Table 1), primarily covering the period from 2012 to 2022. To ensure the spatial consistency of these multi-source heterogeneous data, we resampled the data of different spatial resolutions to 1 km. All data were processed in ArcGIS using a unified coordinate system (WGS 1984 UTM Zone 50N).
Table 1.
Data sources and descriptions.
2.3. Research Framework
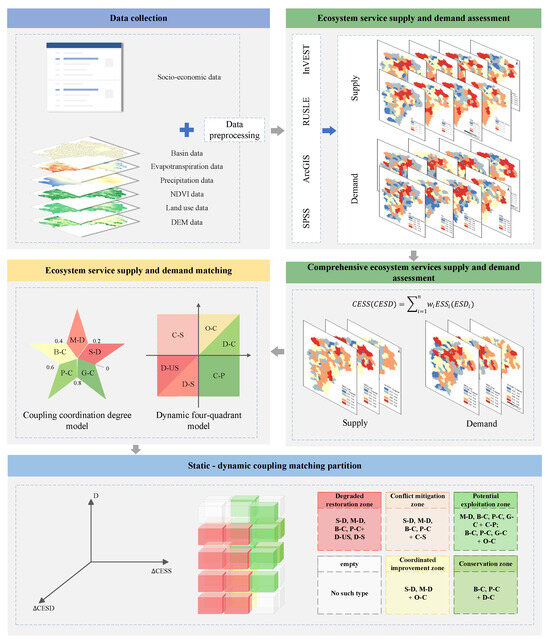
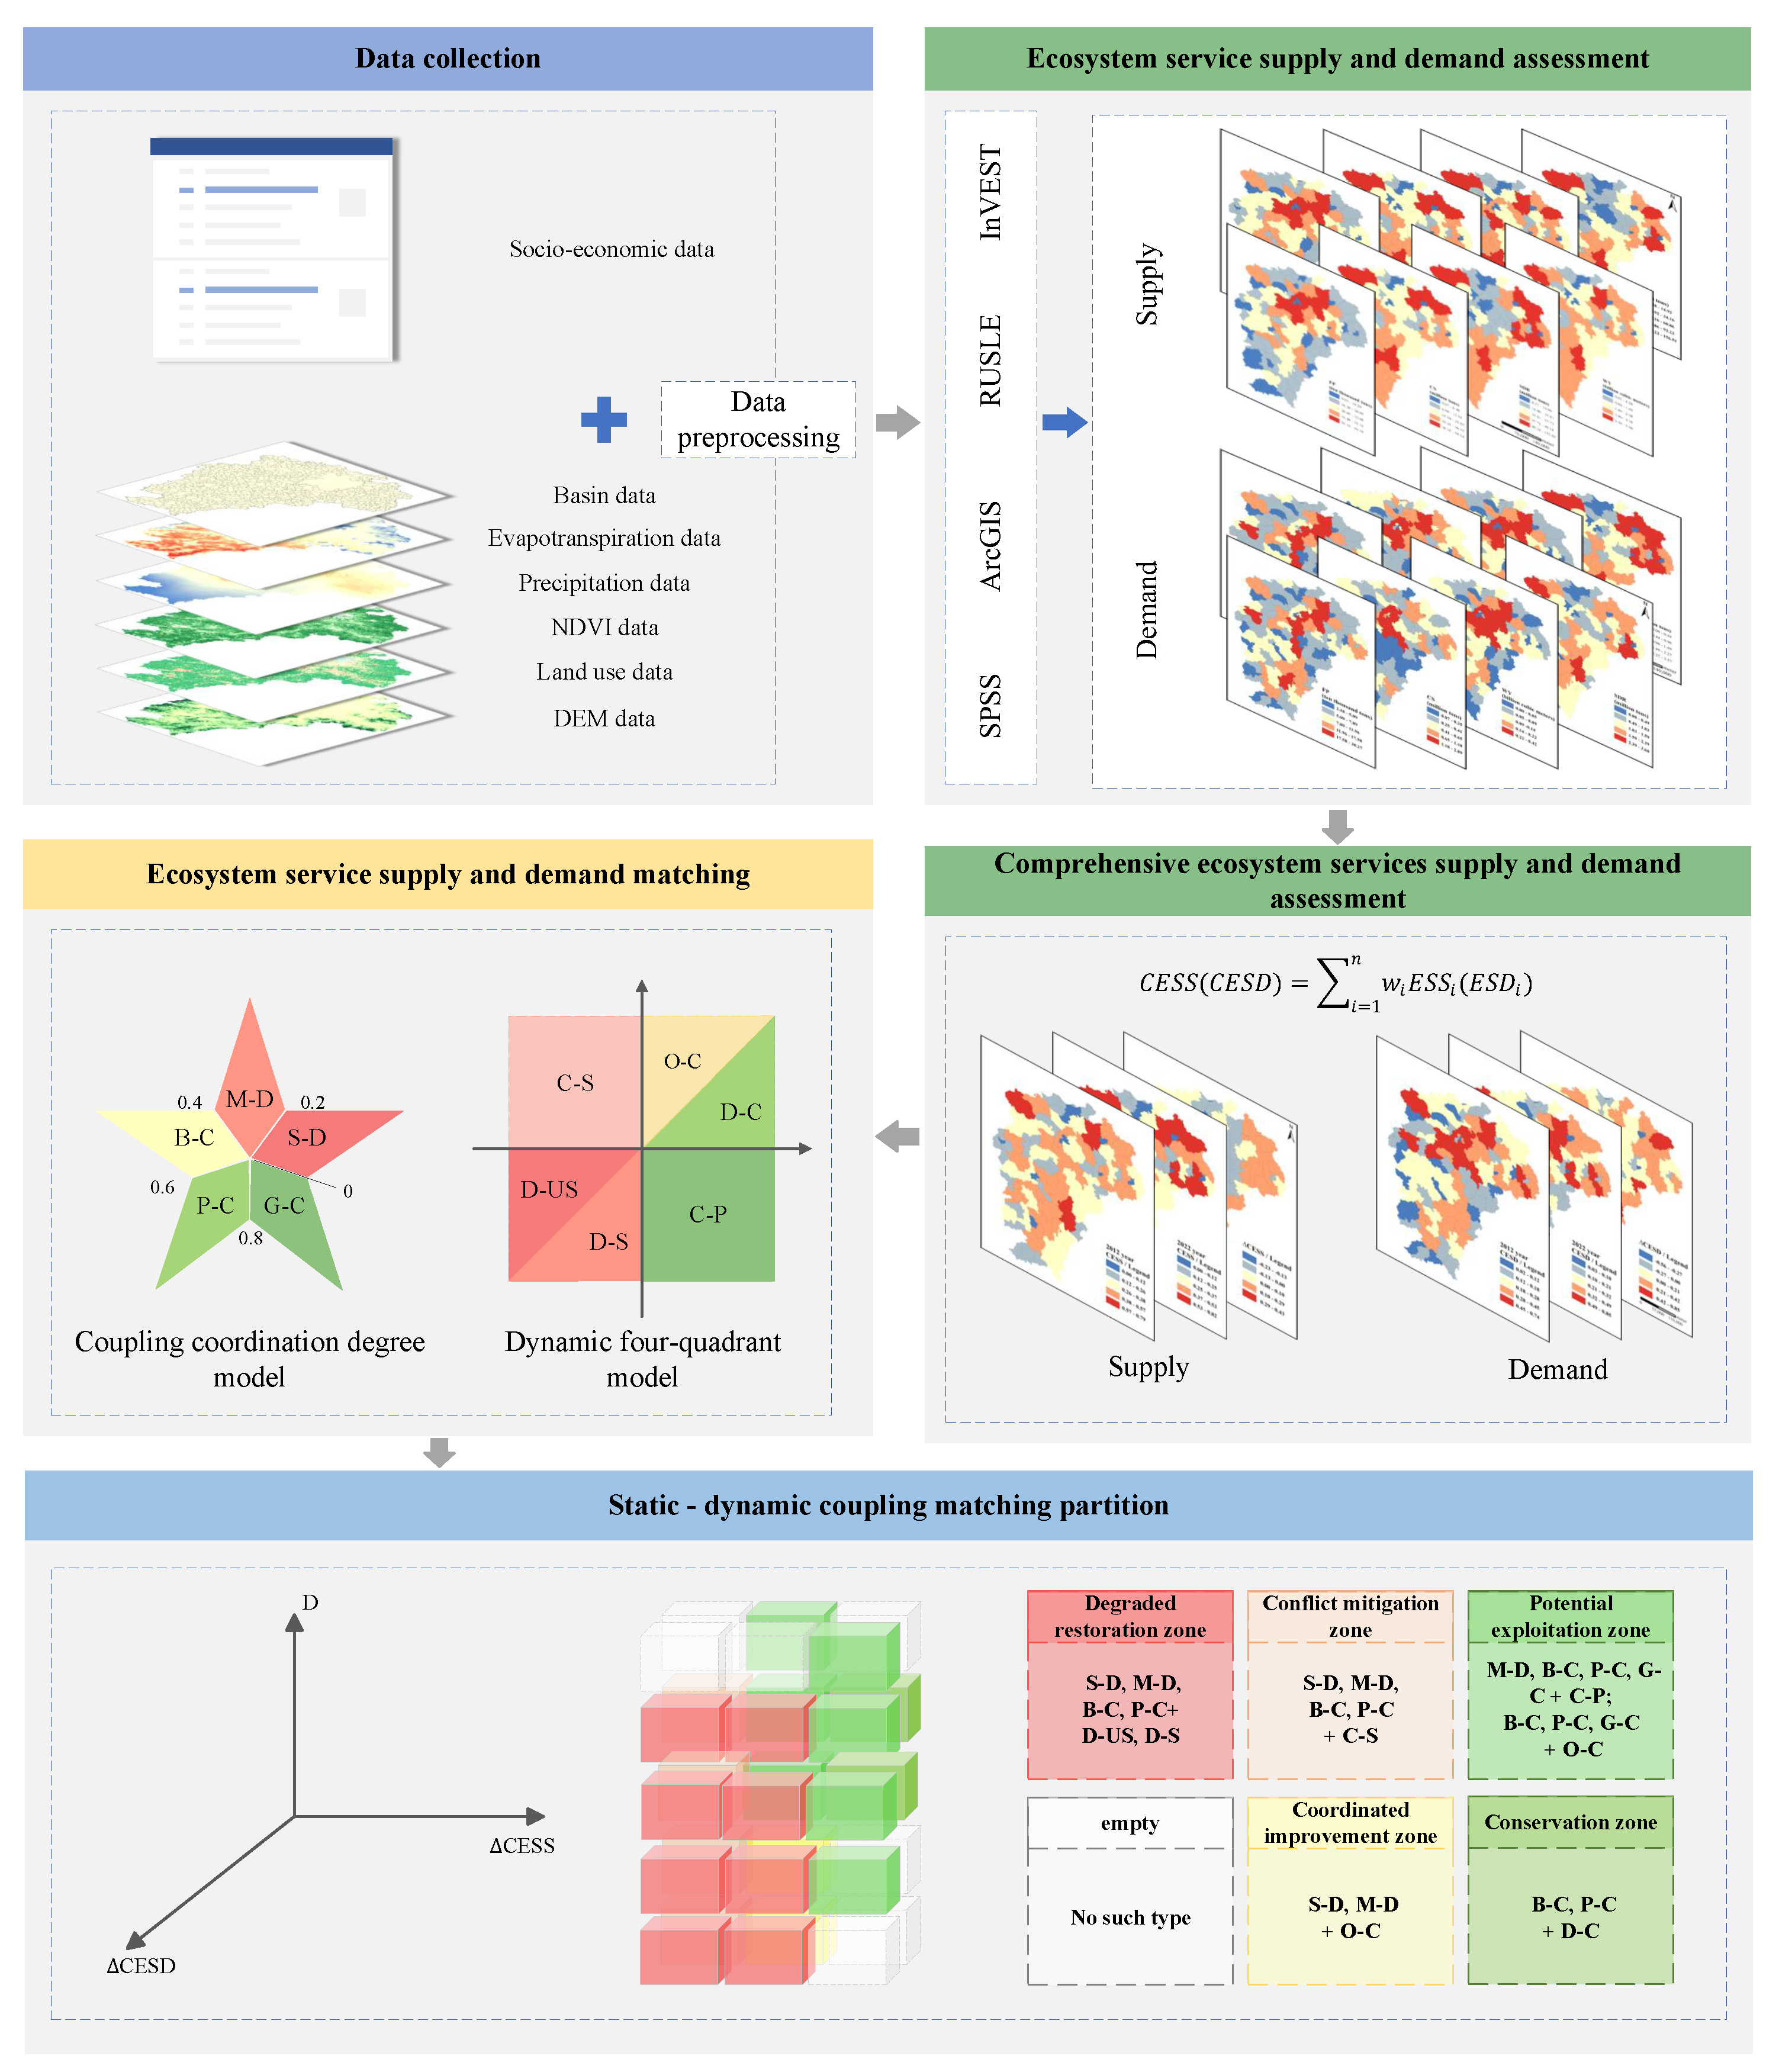
In this study, we first assessed the supply and demand of four typical ecosystem services: GP, WY, CS, and SR. The entropy weight method was used to determine the weights of supply and demand, leading to calculation of the Comprehensive Ecosystem Service Supply and Demand (CESSD). Next, the coupling coordination model was applied to conduct a static matching analysis of CESSD to evaluate the coordination between supply and demand. Meanwhile, a supply–demand intensity model was employed to develop a four-quadrant framework, identifying six distinct types of dynamic change regions. Finally, by integrating the static and dynamic matching characteristics, a matrix cube was developed to divide Jiangxi Province into five ecological management zones: degradation restoration, conflict mitigation, coordination improvement, potential exploration, and maintenance protection (Figure 2).
Figure 2.
Technology roadmap.
2.4. Ecosystem Service Supply and Demand Assessment
- (1)
- Assessment of Individual Ecosystem Service Supply and Demand
Based on the characteristics of the study area and the current research progress on ecosystem service supply and demand, four representative ecosystem services were selected for analysis: FP, WY, CS, and SDR. These services were assessed using the Integrated Valuation of Ecosystem Services and Tradeoffs (InVEST 3.14.3) model. The corresponding calculation formulas are presented in Table 2.
Table 2.
Methods and indicators for quantifying the ecosystem services supply and demand.
- (2)
- Comprehensive Ecosystem Service Supply and Demand Assessment
Next, the Comprehensive Ecosystem Service Supply (CESS) and Comprehensive Ecosystem Service Demand (CESD) indices were employed to characterize the overall level of ecosystem services within the study area. Given the differences in units among various ecosystem services, this study first applied the min–max normalization method to standardize the individual ecosystem service supply (or demand) values, thereby eliminating the influence of differing dimensions. Subsequently, the entropy weight method was used to calculate the weights of the normalized ecosystem service supply (or demand) indicators [39] (Table 3). Finally, the regional CESS or CESD index was derived through a weighted summation of all standardized indicators. The calculation formulas are presented as follows:
where represents the CESSD index for region j, represents the weight of supply or demand calculated using the entropy weight method, and denotes the individual ESSD.
Table 3.
Entropy-based weights of the four ecosystem services.
2.5. Static–Dynamic Matching of Ecosystem Services
2.5.1. Static Matching
To characterize static matching of ESSD, this study introduces the coupling coordination degree model to measure the interaction and impact between ecosystem service supply and demand [26,32]. The calculation formula is as follows:
where C represents the coupling degree, T is the comprehensive coordination index, and D is the coupling coordination degree. In addition, denotes the standardized CESSD within the range of [0, 1], while represents the system weight. Because all subsystems are considered equally important in evaluating the coupling coordination of CESSD, equal weights are assigned to each. At the same time, the coordination degree of CESSD in the research area is divided into five categories according to the degree of coupling coordination (see Table 4).
Table 4.
Coordinate grading standards.
2.5.2. Dynamic Matching
The dynamic matching analysis characterizes the relationship between ESSD by examining their changing trends. This approach compensates for the limitations of static matching, which only provides insights into the supply–demand state at a specific moment without capturing its temporal dynamics [3]. The calculation formula is as follows:
where and represent the changes in CESSD, and denote the CESS in year a and year b, respectively, and and represent the CESD in year a and year b, respectively.
By setting CESSD changes as the horizontal and vertical axes, a four-quadrant model [33] is established to classify supply–demand changes into four quadrants, identifying four dynamic matching types. Furthermore, based on the magnitude relationship between supply and demand changes, six matching types were identified. In the Coordinated Development (D-C) type, CESSD is increasing but the rate of supply growth outpaces demand. In the Coordinated Optimization (O-C) type, CESSD is increasing but supply increases less rapidly than demand. In the Potential Cultivation Zone (C-P) type, CESS is increases while CESD is decreasing. In the Sustained Degradation (D-S) type, CESSD is decreasing, with supply decreasing more rapidly than demand. In the Unsustainable Degradation (D-US) type, CESSD is decreasing, with supply declining significantly faster than demand. Finally, in the Conflict Stress (C-S) type, CESS is decreasing while CESD is increasing.
2.6. Ecological Management Zoning
Guided by the dynamic matching of Comprehensive Ecosystem Services (CES), this study constructs a matrix cube integrating the dynamic changes in supply and demand with the static coupling coordination model, resulting in classification of the study area into six ecological management zones (see Table 5).
Table 5.
Ecological management zoning.
3. Results and Analysis
3.1. Spatiotemporal Characteristics of Ecosystem Service Supply and Demand
3.1.1. Spatiotemporal Characteristics of Supply and Demand for Individual Ecosystem Services
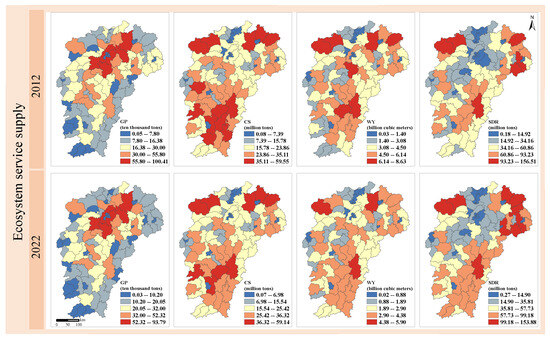
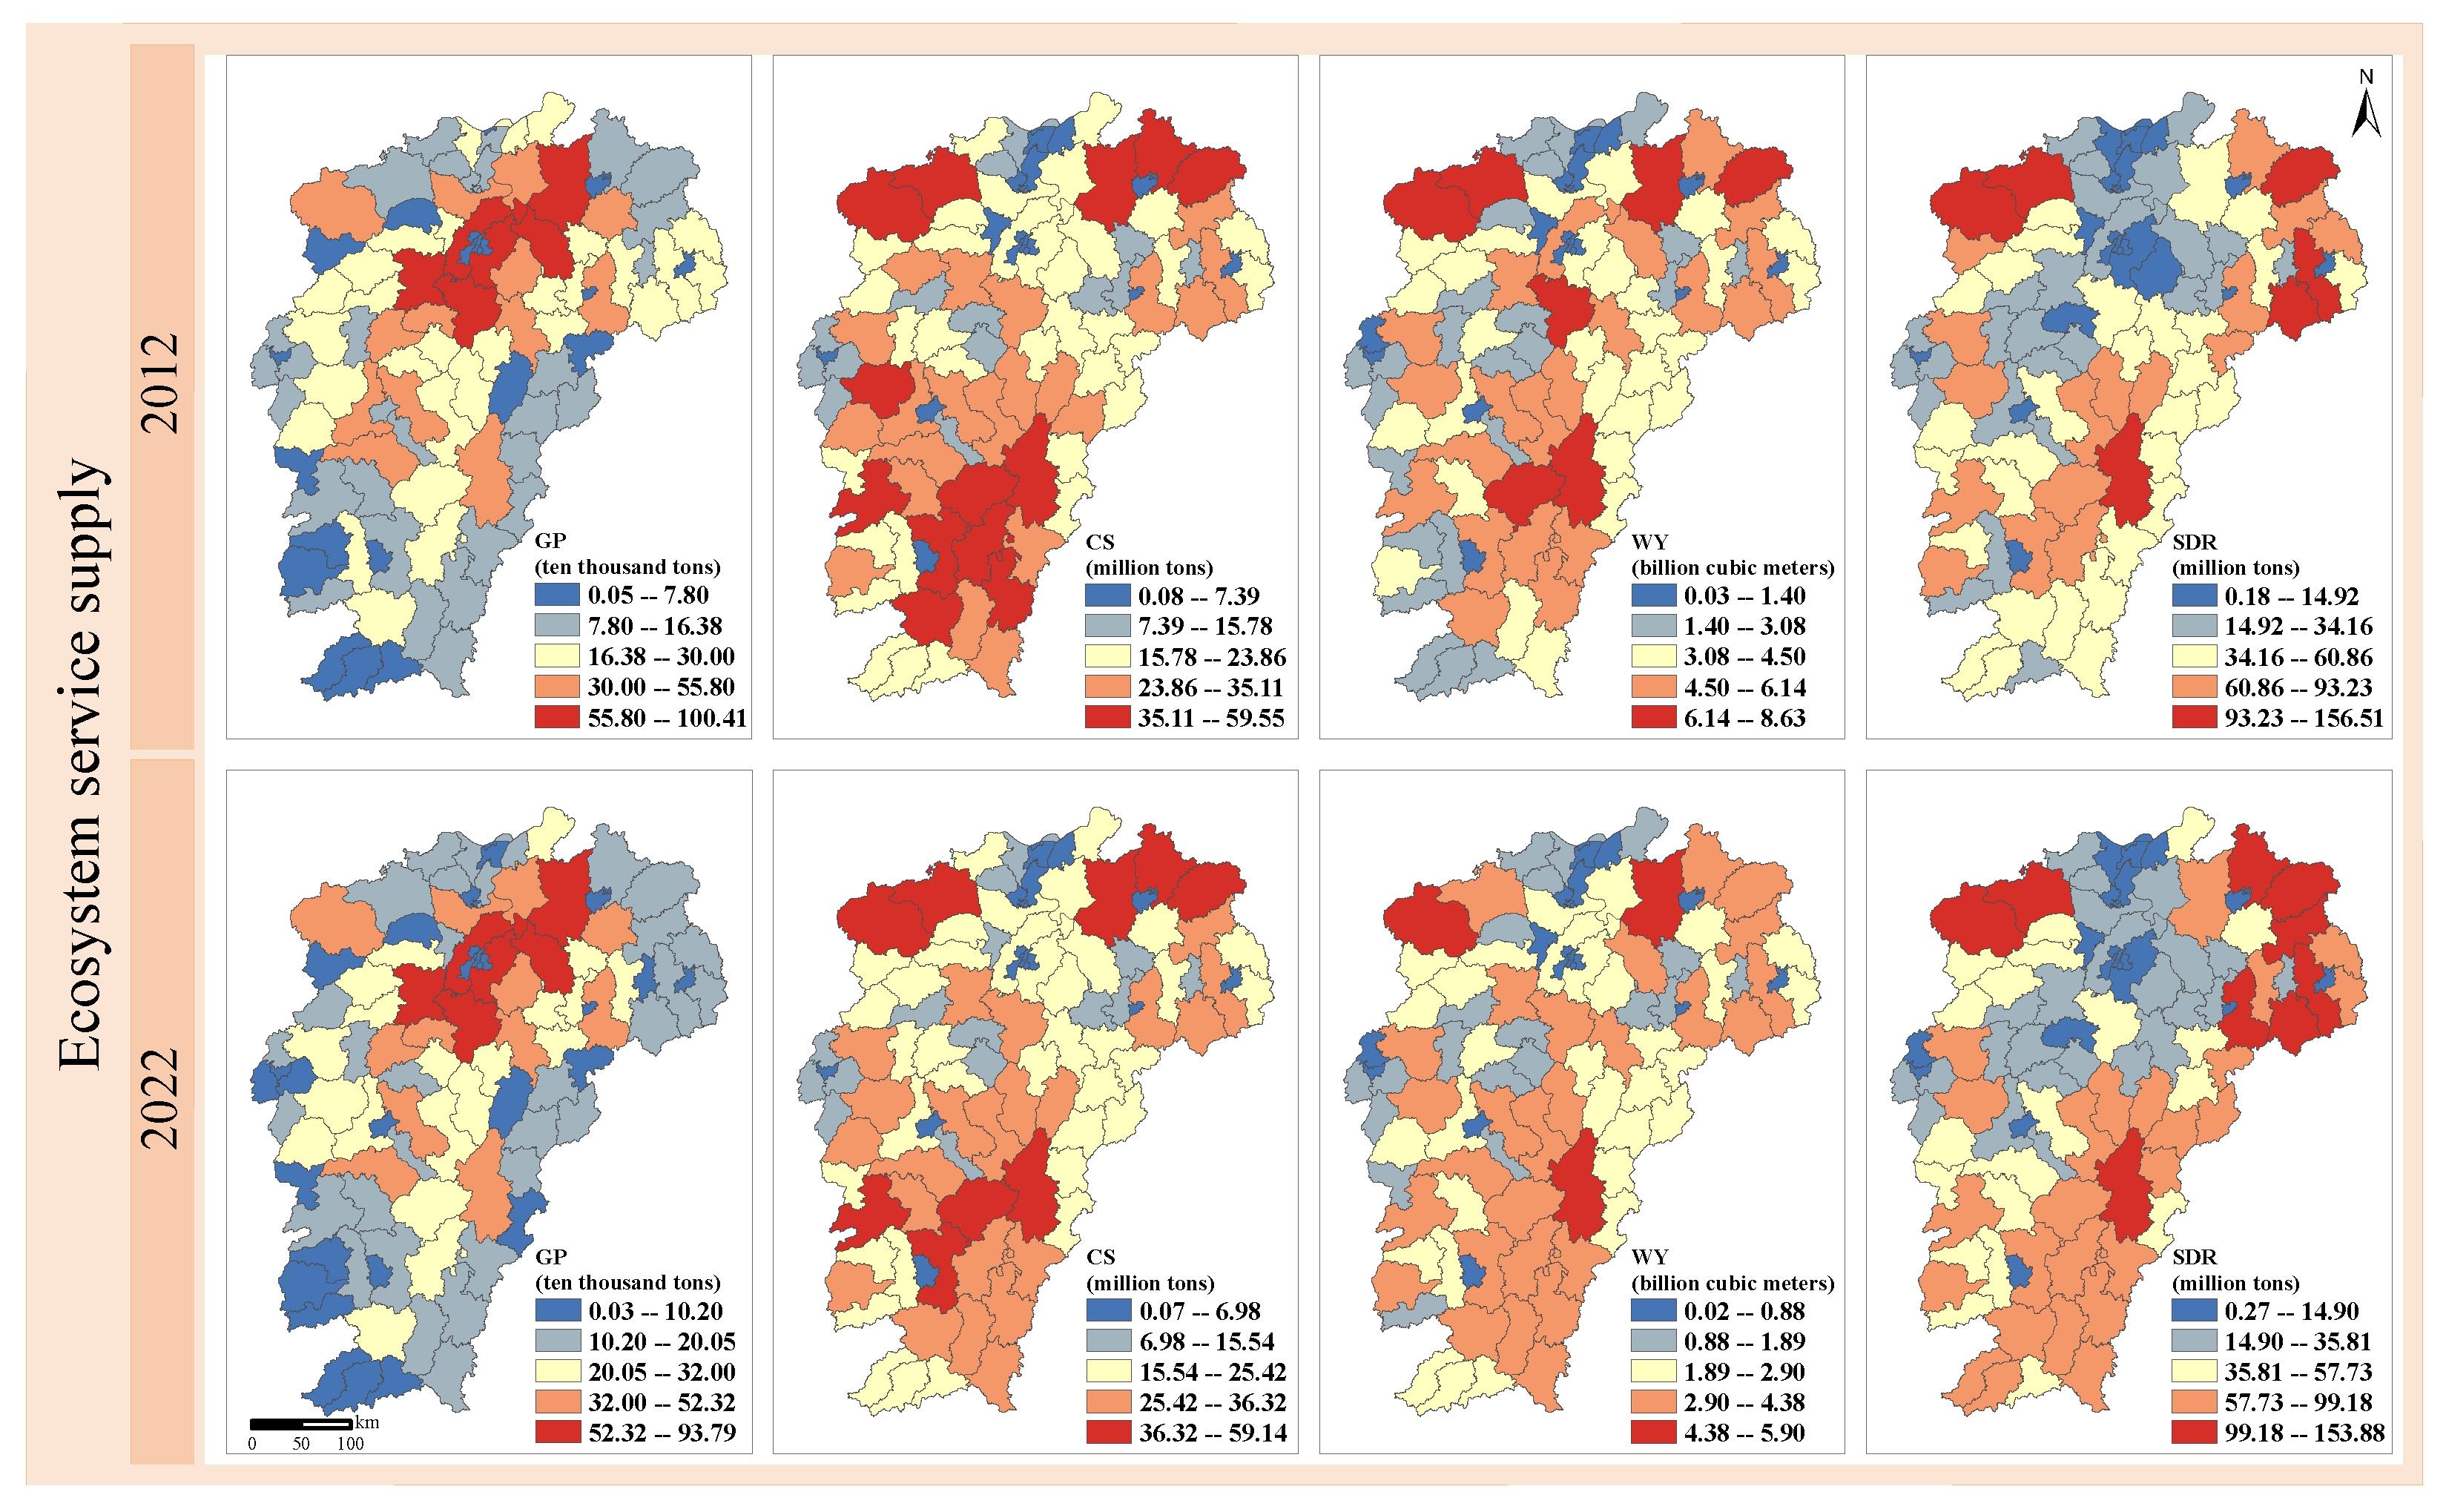
To explore the changes in ESSD, this study assessed the ESSD in 2012 and 2022. The results indicate significant spatial and temporal heterogeneity among different ecosystem services (Figure 3). GP generally exhibits a pattern of being high in the central plains and low in the surrounding mountains. In contrast, CS supply is higher in the mountainous regions surrounding the province (e.g., Ganzhou, eastern Shangrao, western Jiujiang, northern Jingdezhen, and Yichun), with some areas experiencing a decline over time (e.g., southeastern Ganzhou, including Xinfeng, Yudu, and Huichang), while maintaining a largely stable distribution. WY supply is highest in Xiushui, Wuning, Poyang, Fengcheng, Xingguo, and Ningdu, and is gradually decreasing in the surrounding areas. Due to climatic variations, overall water yield declined in 2022, but its spatial distribution remained unchanged. SR follows a pattern similar to CS, with low values in the central plains (e.g., Nanchang and surrounding counties) and high values in mountainous areas (e.g., most of Ganzhou, eastern Jingdezhen, and northern Shangrao).
Figure 3.
Spatial and temporal distribution characteristics of ecosystem service supply.
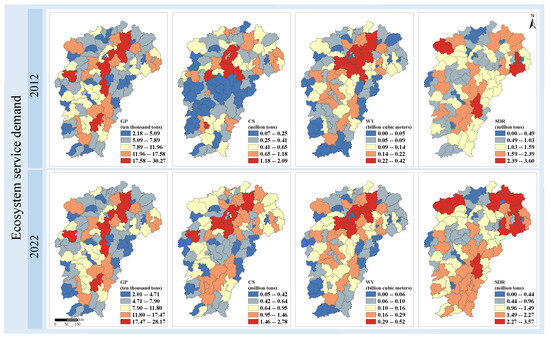
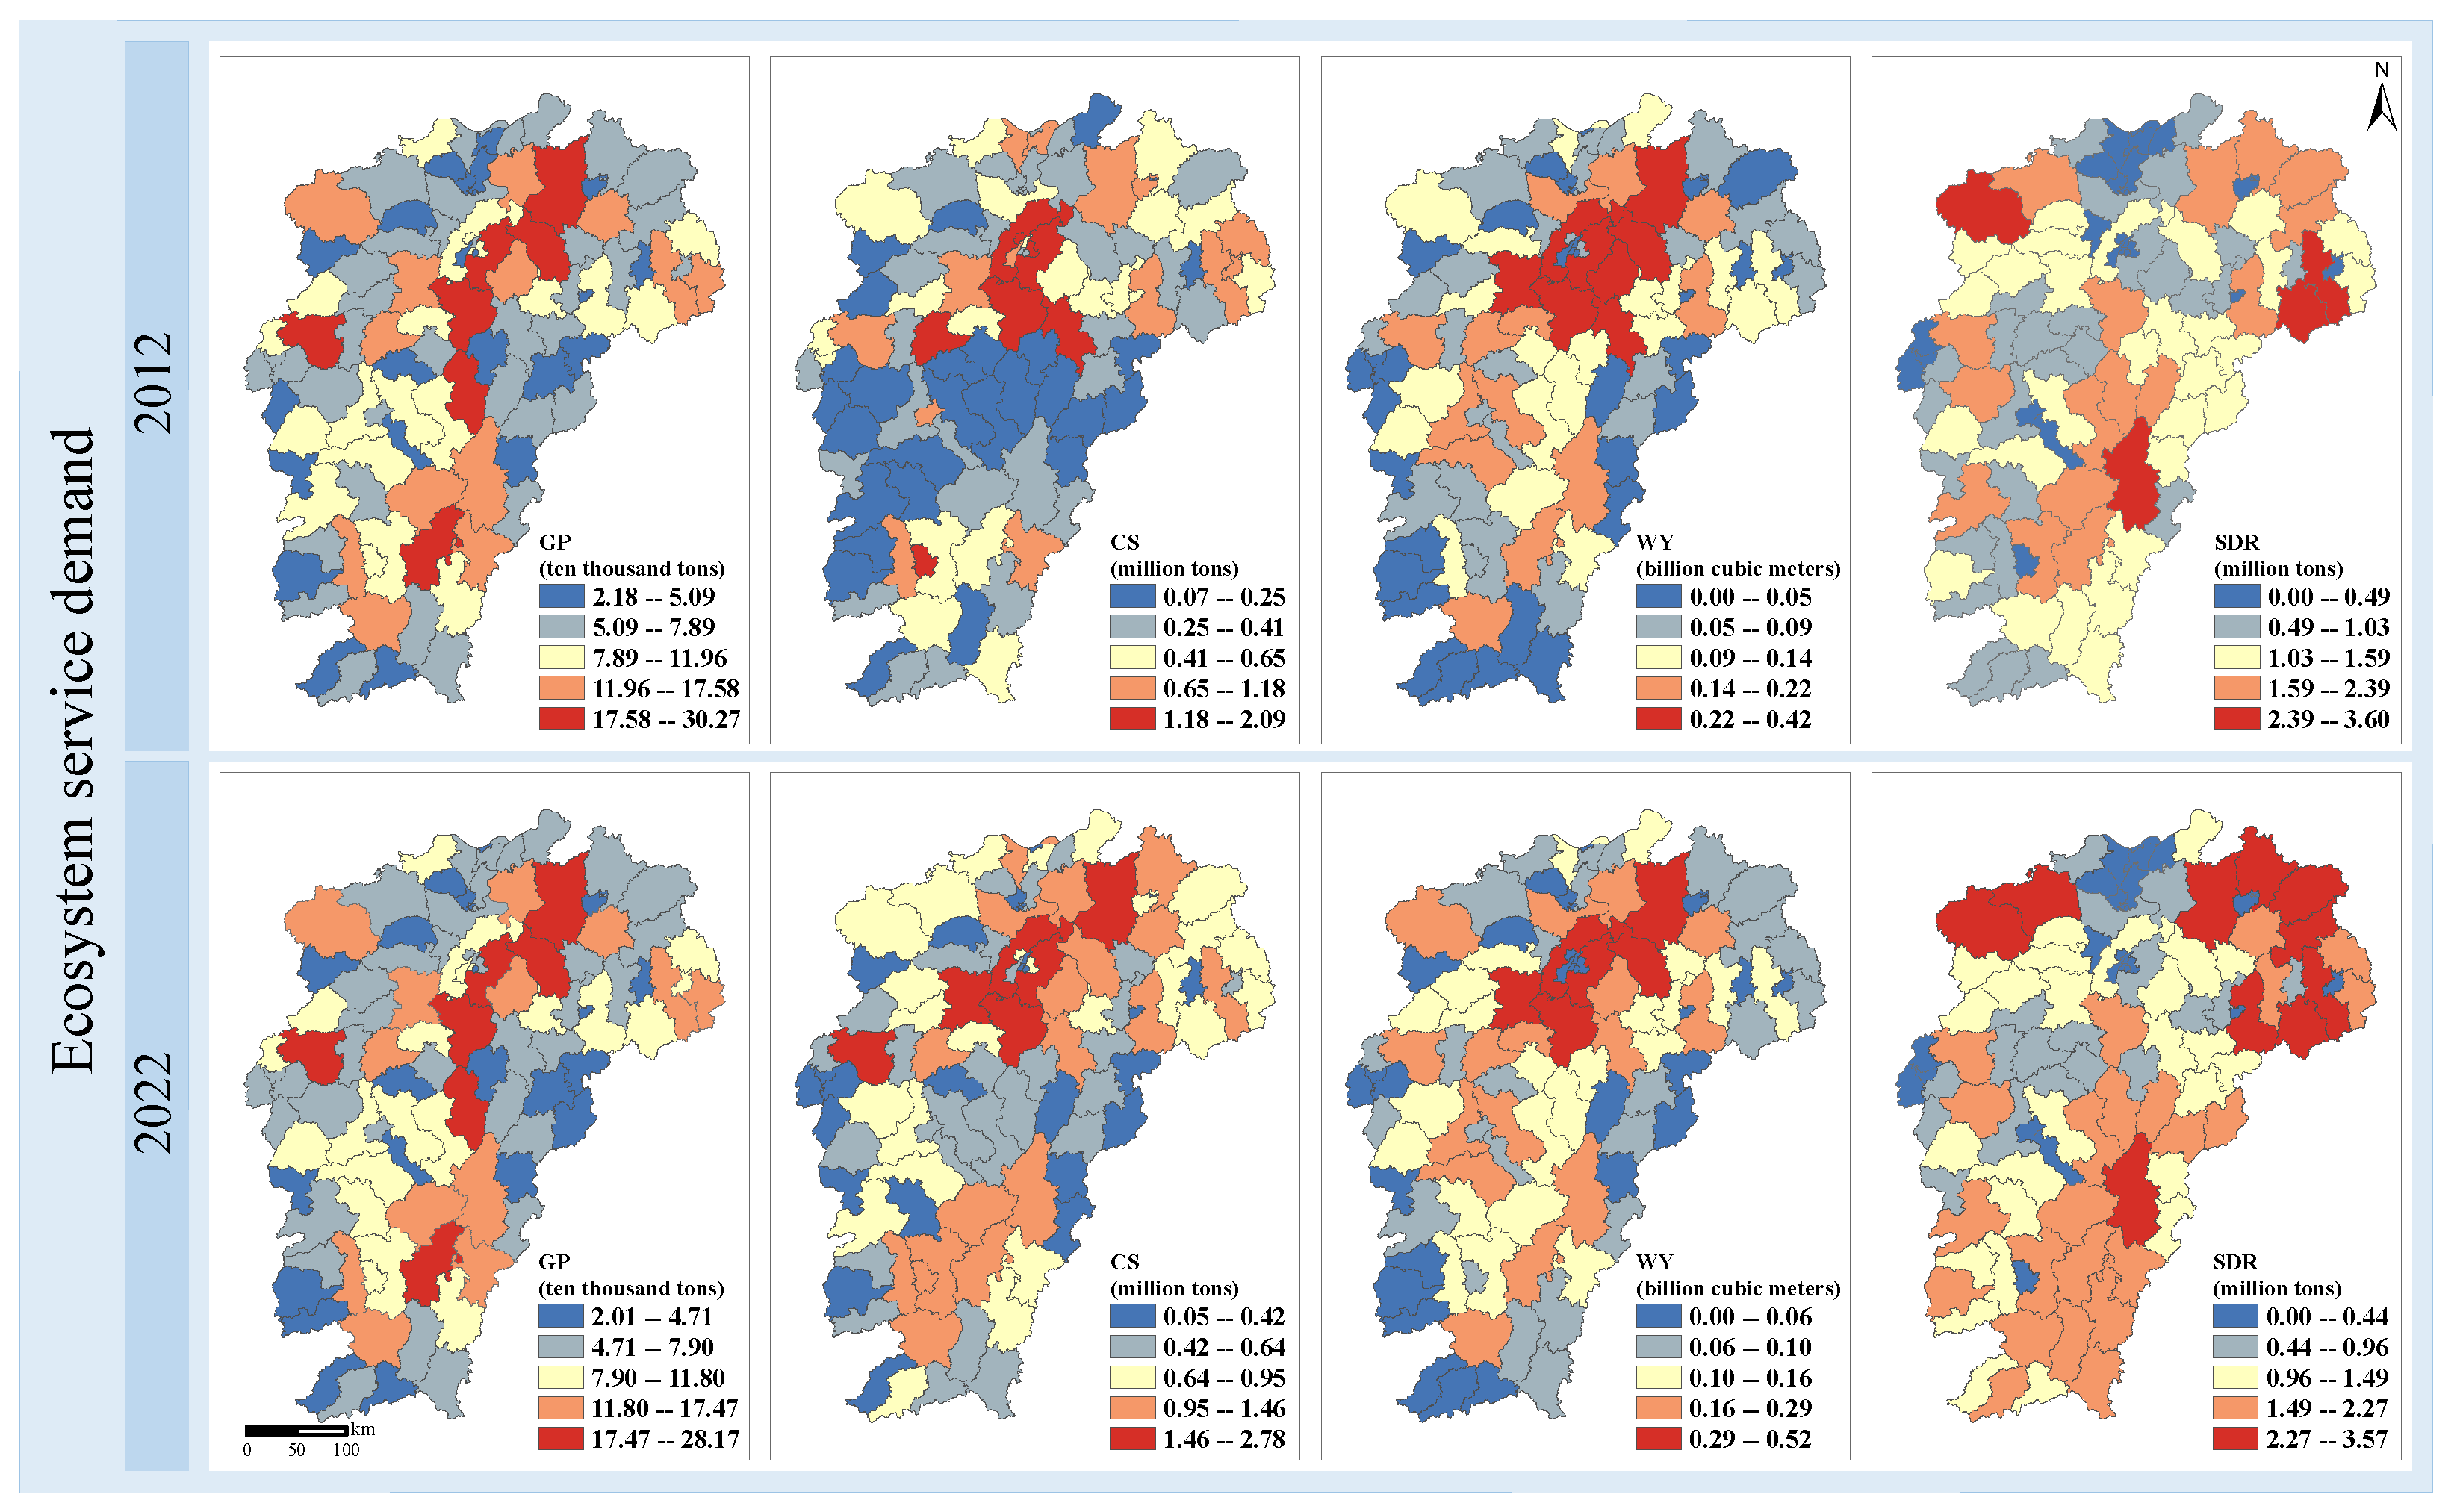
From the demand perspective, population density directly determines the spatial distribution of ecosystem service demand (Figure 4). High-demand areas for GP, CS, and WY are concentrated in Nanchang and its surrounding counties (e.g., Poyang, Yugan, Fengcheng) as well as highly populated counties in Ganzhou (e.g., Xinfeng, Yudu, Ganxian, Ningdu). These regions are highly urbanized, densely populated, and have high demands for food and water. In addition, extensive industrial activities consume significant resources, leading to increased demand for carbon sequestration services. On the other hand, SR demand is primarily influenced by topographic factors and follows a similar distribution to supply, with high-demand regions in Ningdu, Guixi, Guangxin, Xiushui, and Wuning. These areas are located in Jiangxi’s ecological barrier zone, which is characterized by hilly and mountainous terrain with high soil erosion risk.
Figure 4.
Spatial and temporal distribution characteristics of ecosystem service demand.
3.1.2. Spatial Characteristics of Comprehensive Ecosystem Service Supply and Demand
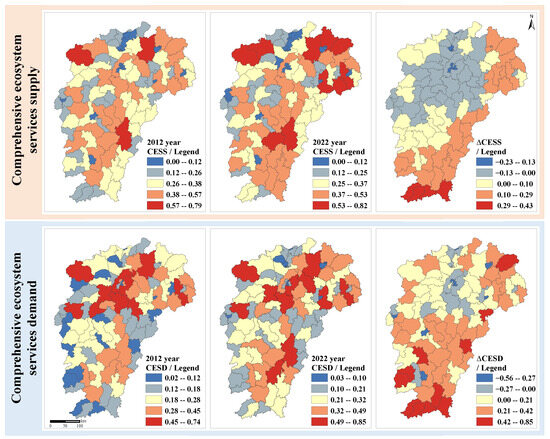
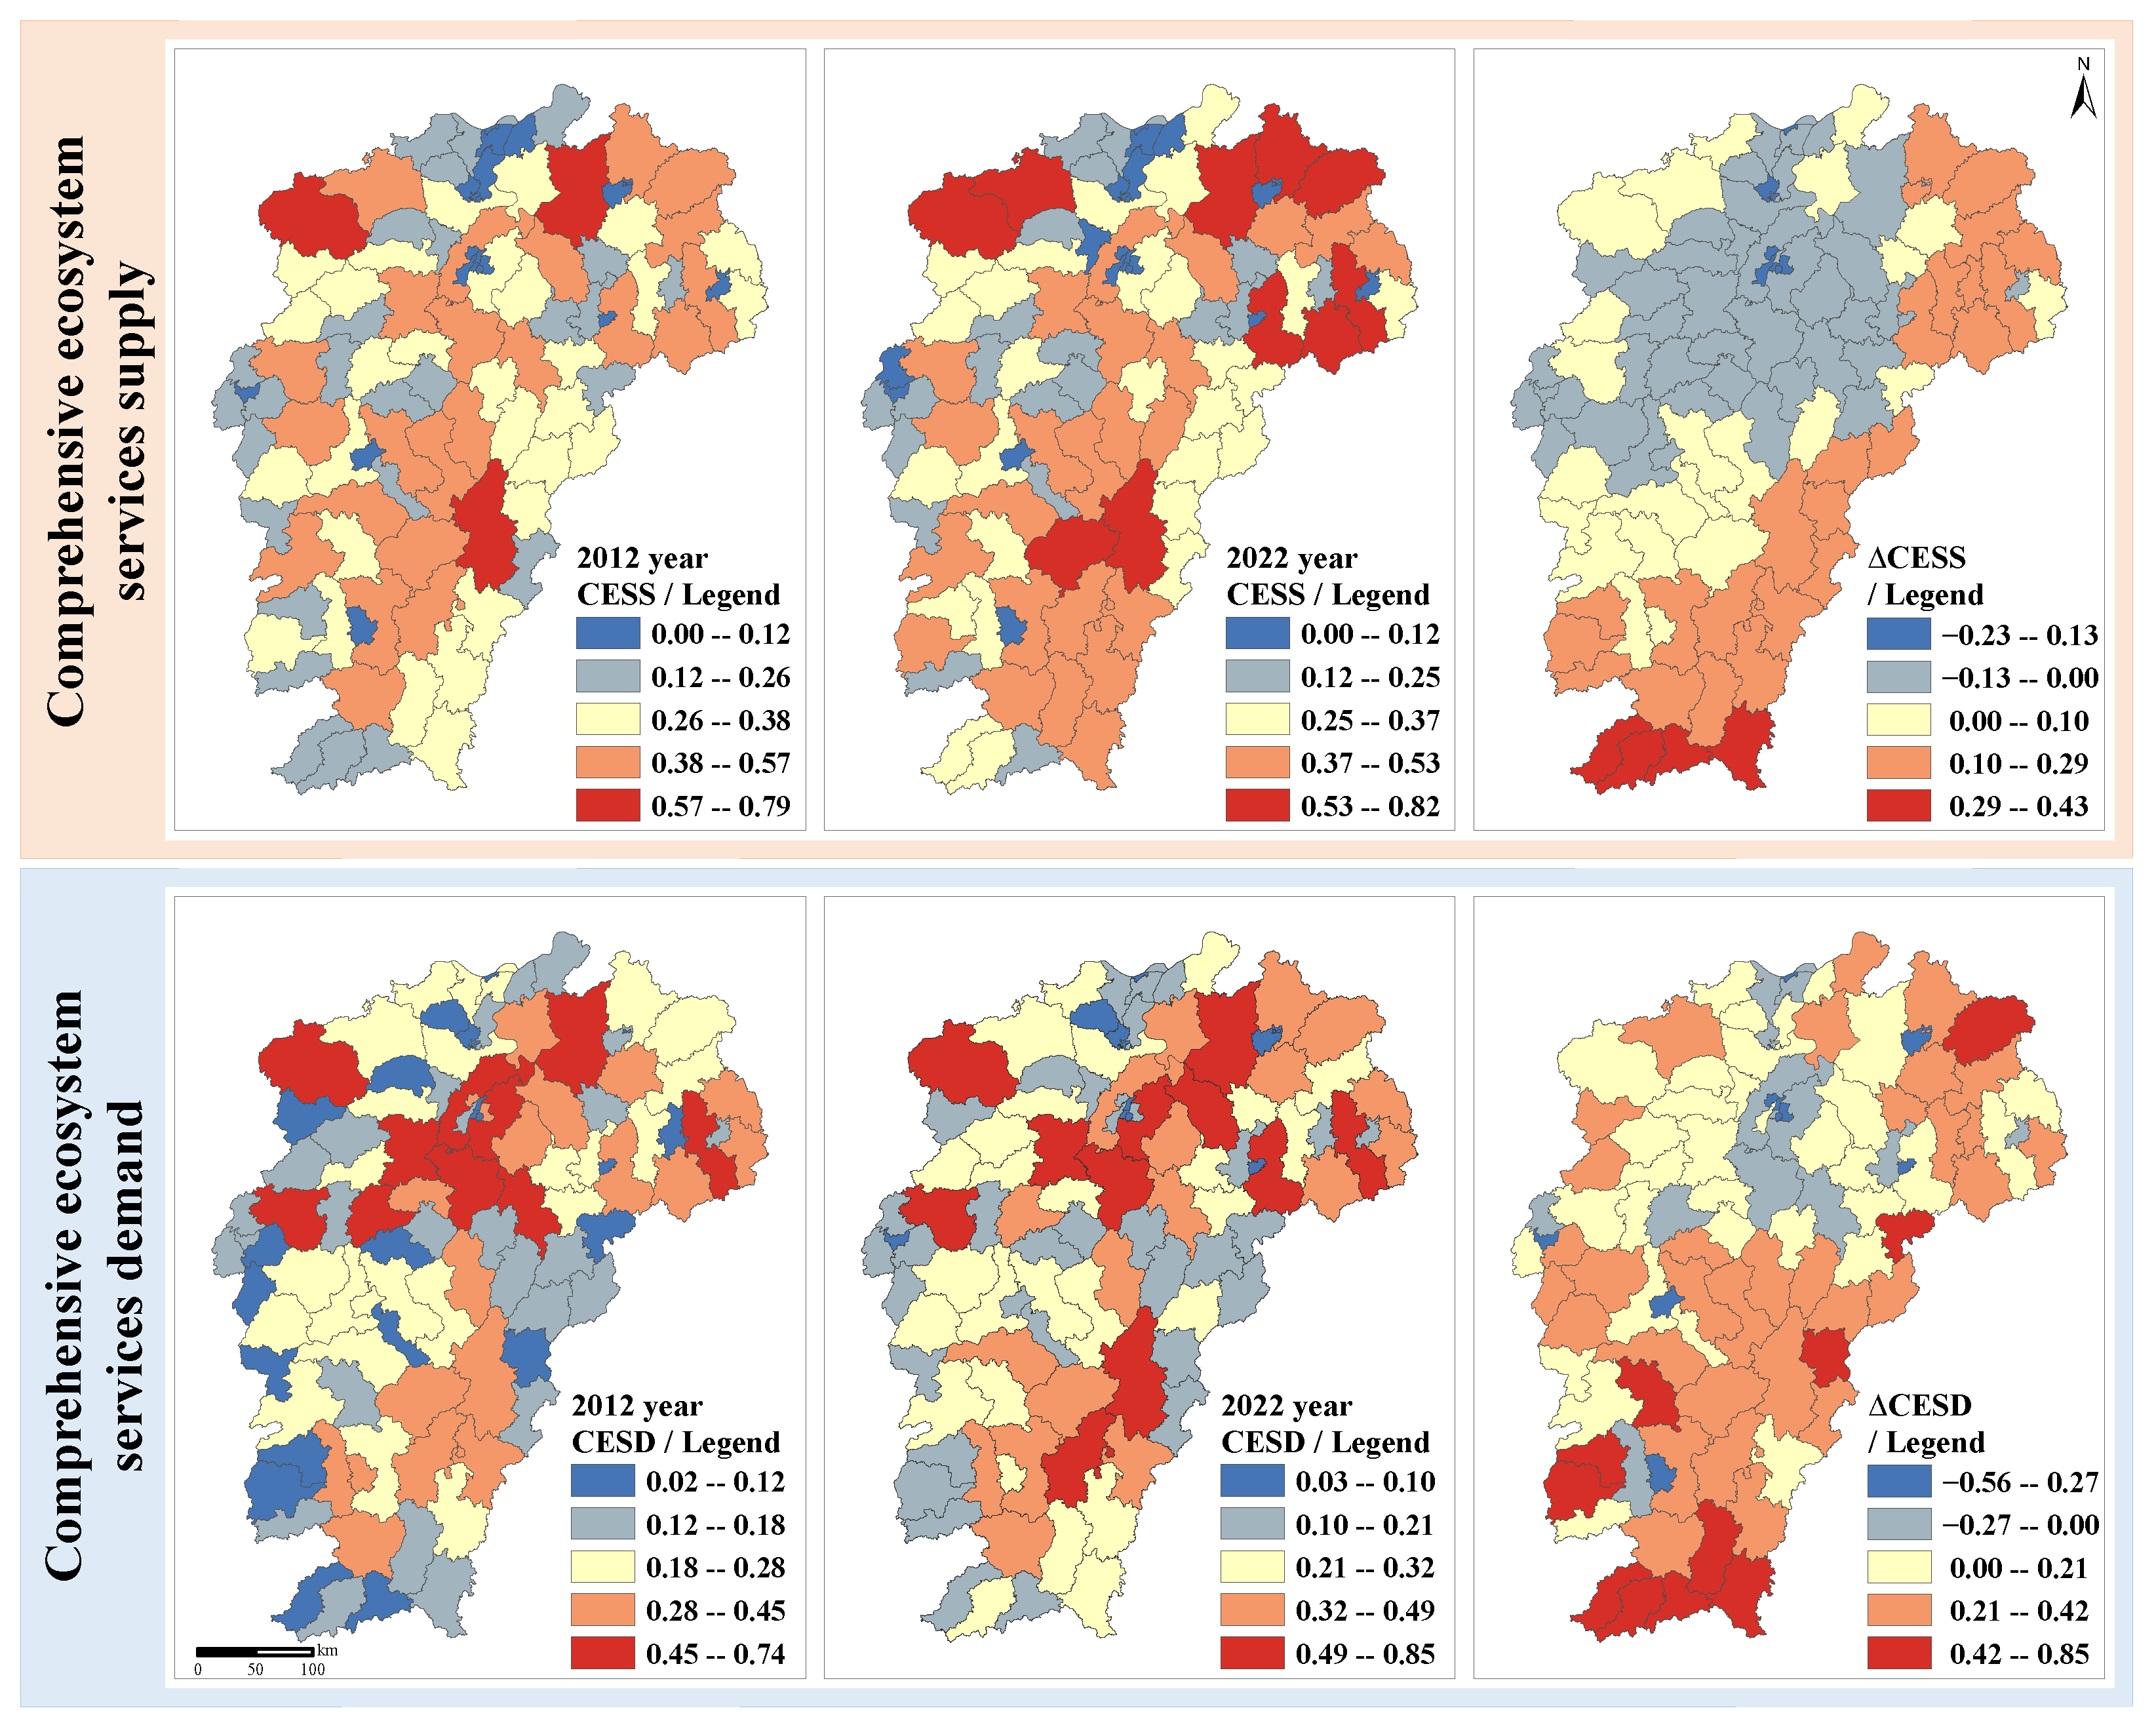
High-supply areas for comprehensive ecosystem services (Figure 5) are mainly found in southern, western, and northeastern Jiangxi (e.g., Ningdu, Xingguo, Huichang, Ruijin, and Wuyuan). These regions have extensive mountain ranges, high vegetation coverage, and rich biodiversity. Additionally, they serve as barriers to coastal moisture intrusion, resulting in abundant precipitation that supports ecological functions. Several eastern counties (e.g., Nanfeng, Guangchang, Lichuan) share similar environmental characteristics with southern Jiangxi, although they are more constrained by topography, with lower forest coverage and smaller natural habitats. In contrast, central Jiangxi is a densely populated plain where human activities have significantly impacted the environment, leading to weaker ecological foundations and lower CESS capacity. Core urban areas such as Nanchang and Ganzhou exhibit high comprehensive demand due to high population density and economic activity. Although demand decreases outwards from urban centers, demand intensity in the plains remains higher than in the mountainous south. Population density and environmental conditions directly influence CESSD.
Figure 5.
Spatial distribution characteristics of integrated ecosystem service supply and demand.
When comparing changes in supply and demand, both exhibit a similar spatial pattern, radiating outward from Nanchang stepwise. In terms of supply, ES capacity has increased in Jiangxi’s peripheral ecological barrier zones, reflecting the effectiveness of environmental protection policies over the past decade. However, in the Poyang Lake ecological barrier, supply has declined due to concentrated urbanization and intense land use. On the demand side, population growth has led to an overall increase, though major cities and their surrounding counties have experienced a decline. In contrast, other areas generally show an upward trend, with An’yuan, Dingnan, and Xunwu experiencing the most significant growth.
3.2. Matching Analysis of Ecosystem Service Supply and Demand
3.2.1. Static Matching Analysis
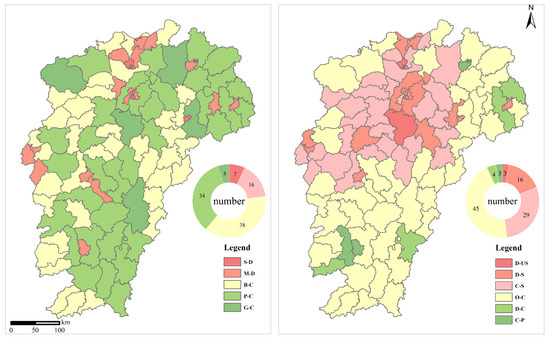
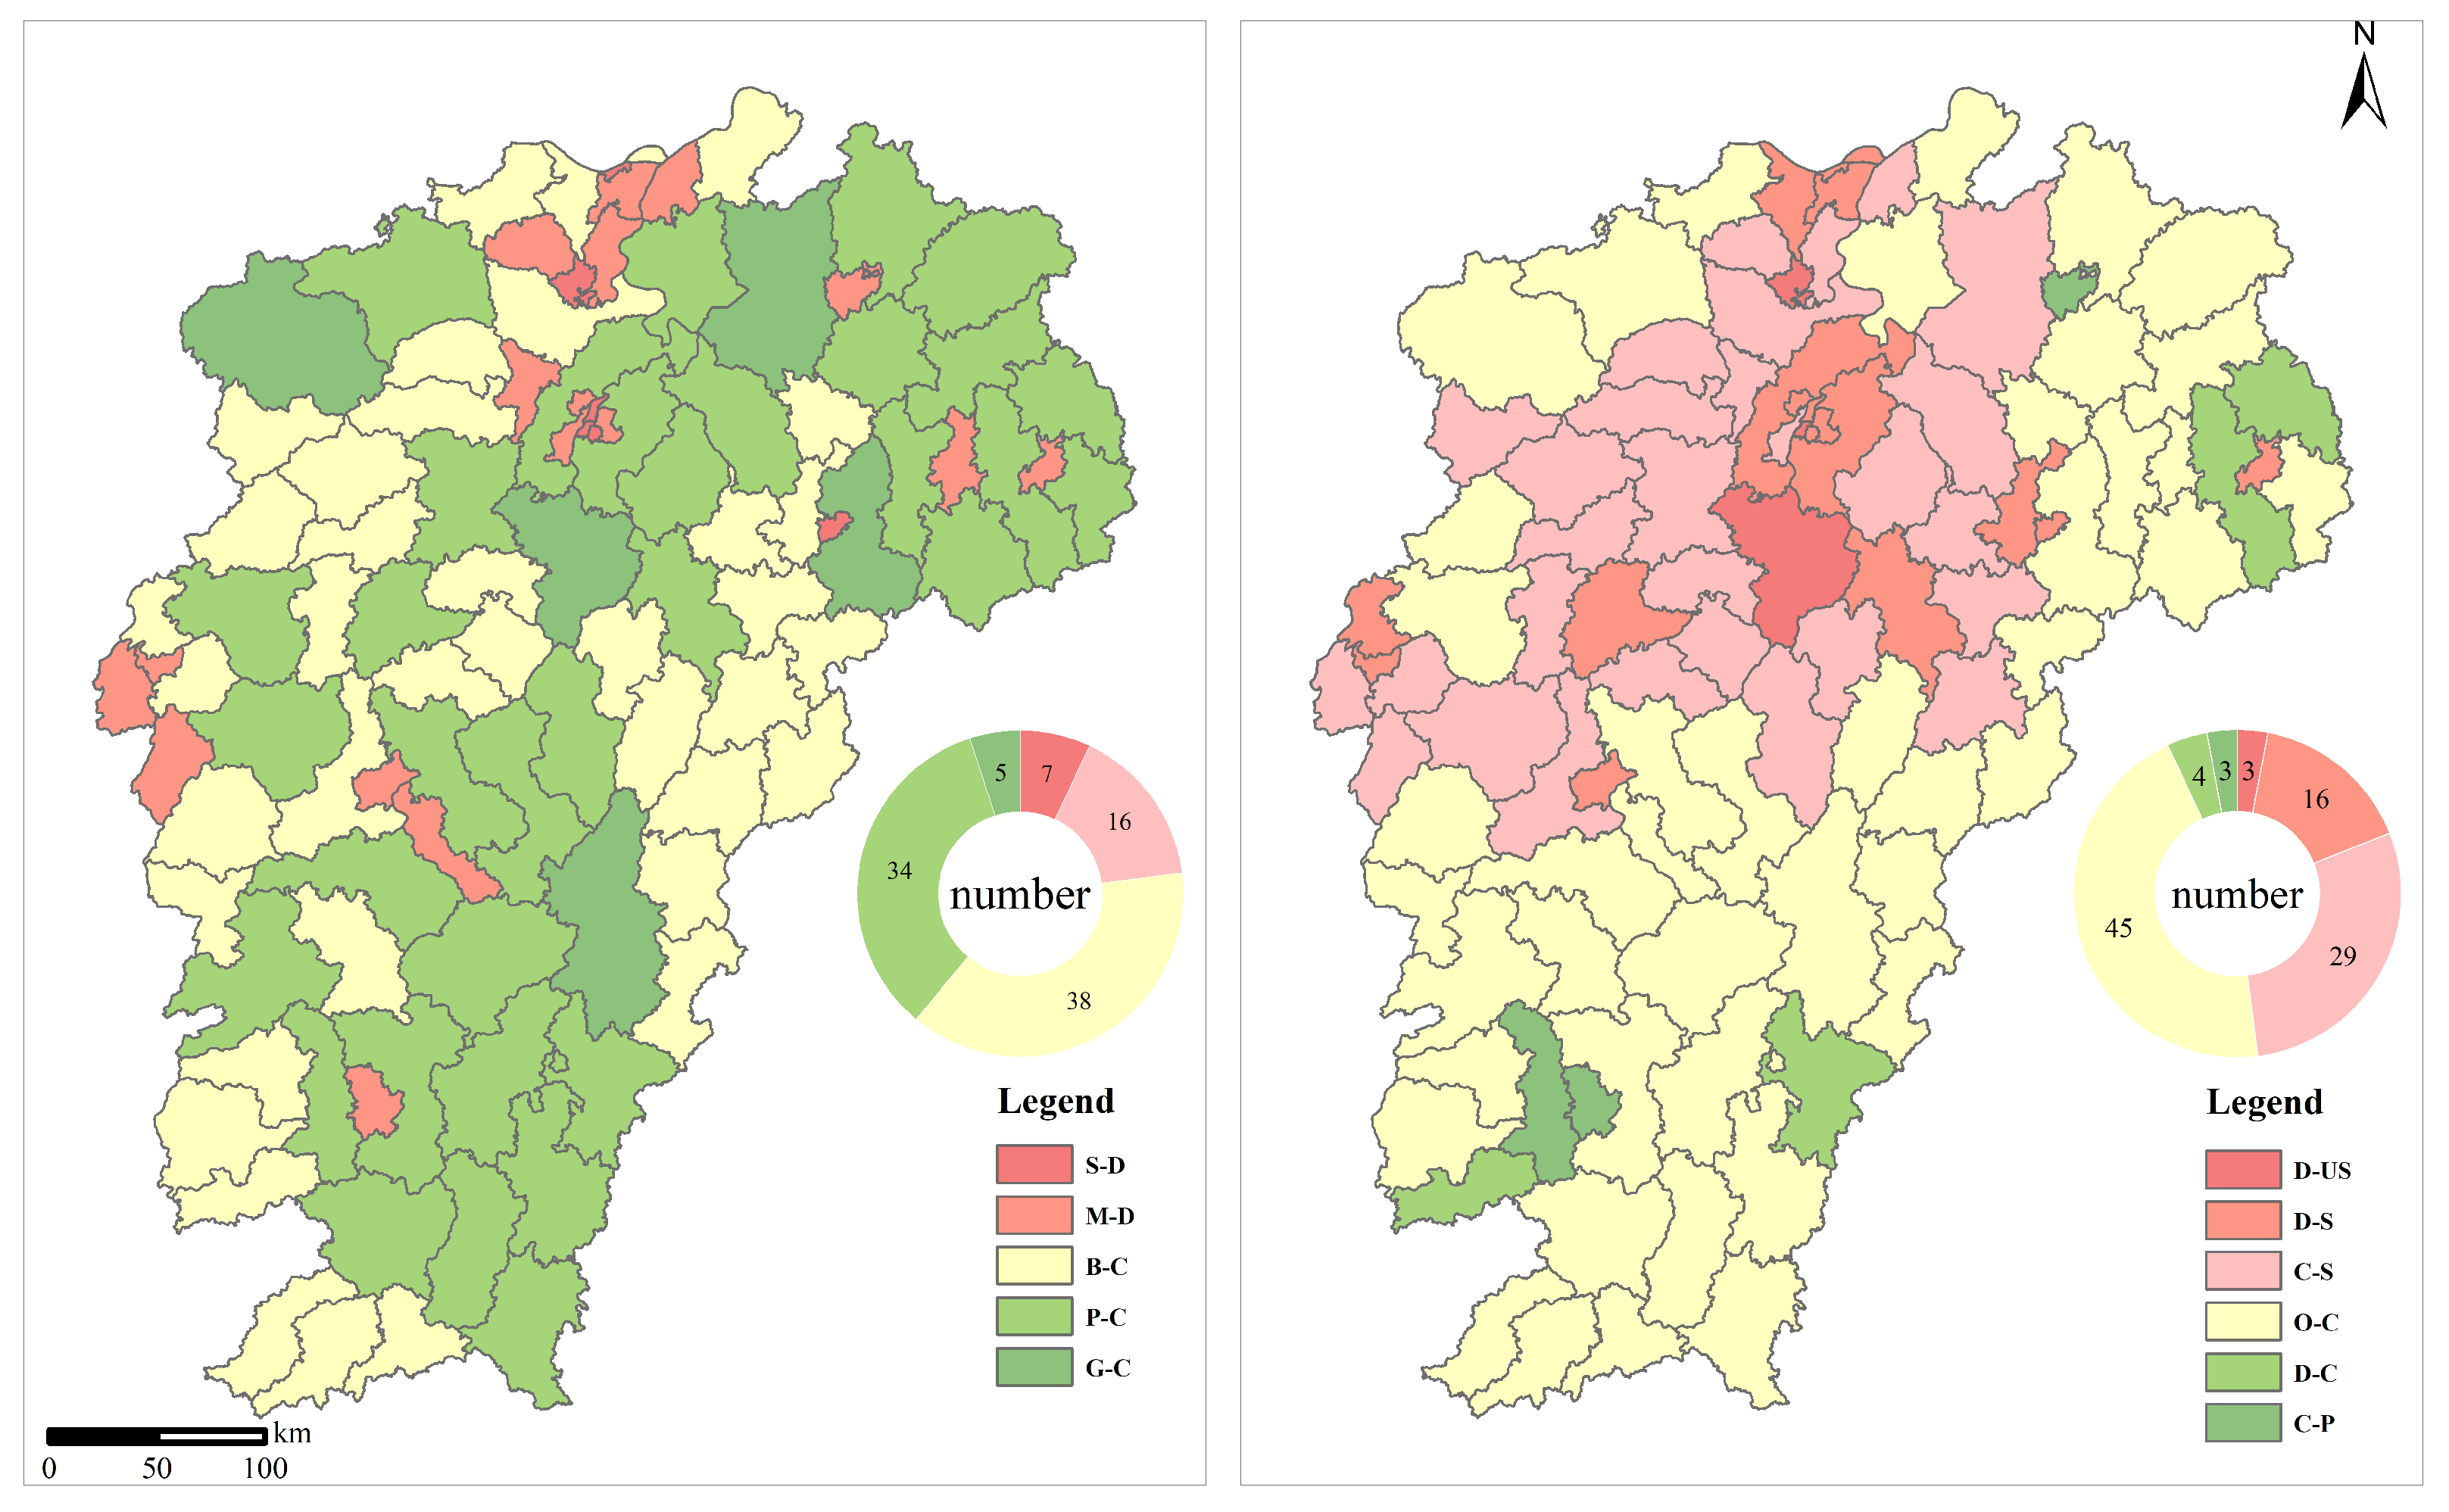
Based on CESSD, the coupling coordination model classified the supply–demand coordination state in Jiangxi Province into five categories for 2022 (Figure 6, left). Overall, coordination decreases progressively from the central region toward the east and west. Severely uncoordinated areas are primarily concentrated in core urban centers (e.g., Nanchang, downtown Ganzhou), encompassing eight counties. Mildly uncoordinated areas are more scattered, mainly found in Nanchang, Pingxiang, Jiujiang, Ji’an, and Shangrao, covering 16 counties. Essential coordination is observed in 38 counties, mostly in eastern Fuzhou, eastern Yingtan, western Yichun, western Ji’an, and western Ganzhou. Primary coordination is concentrated in the southern (most of Ganzhou) and southeastern (most of Shangrao and Yingtan) regions, covering 34 counties. Well-coordinated counties are the least frequent, totaling five counties, and are scattered throughout the province adjacent to basic and primary coordination zones.
Figure 6.
Static (left) and dynamic (right) matching partitions.
3.2.2. Dynamic Matching Analysis
Using the dynamic changes in CESSD from 2012 to 2022, a four-quadrant model (Figure 6, right) was developed to determine the dynamic matching characteristics of the study area over the decade. In terms of quantity, the coordinated optimization type is the most prevalent, covering 45 counties and nearly 50% of the study area. The conflict pressure type is the second most common, present in 29 counties and found across all municipal regions. The sustained degradation type encompasses 15 counties, primarily in Jingdezhen, Xinyu, Nanchang, and Ganzhou. Meanwhile, the potential cultivation, unsustainable degradation, and coordinated development types appear in roughly equal proportions. Spatially, the dynamic matching relationships in the study area exhibit a “core conflict–peripheral coordination” gradient distribution, radiating outward from Nanchang in three hierarchical rings. The inner ring (Nanchang and nearby counties) is dominated by the sustained degradation type, with some unsustainable degradation areas. This plain region is characterized by agricultural production and resource extraction, where long-term overexploitation and land degradation have reduced ESS. At the same time, population decline has led to decreased demand. The middle ring (Jiujiang, Yichun, Shangrao, Ji’an, and parts of Fuzhou) is dominated by conflict pressure areas due to urban expansion and infrastructure development over the past decade; this has intensified land use, reducing ESS while increasing demand due to population growth and industrial clustering. The outer ring (all of Ganzhou along with parts of Jiujiang, Ji’an, Shangrao, and Jingdezhen) mainly comprises coordinated optimization areas, with scattered coordinated development and potential cultivation areas. These regions have experienced rapid economic growth and urban expansion; however, although ecological protection and green development efforts have made progress, supply growth still lags behind demand, leading to an incomplete balance. Overall, the study area exhibits distinct regional disparities and spatial clustering patterns. The southern and southwestern regions primarily show positive matching (coordinated development, potential cultivation, coordinated optimization), reflecting strong ES capacity. In contrast, the central and northern areas predominantly exhibit negative matching (sustained degradation, unsustainable degradation, and conflict pressure), indicating high ecological risks. Tailored ecological management strategies should be adopted to ensure sustained optimization of ESSD.
3.2.3. Static–Dynamic Coupling Matching Analysis
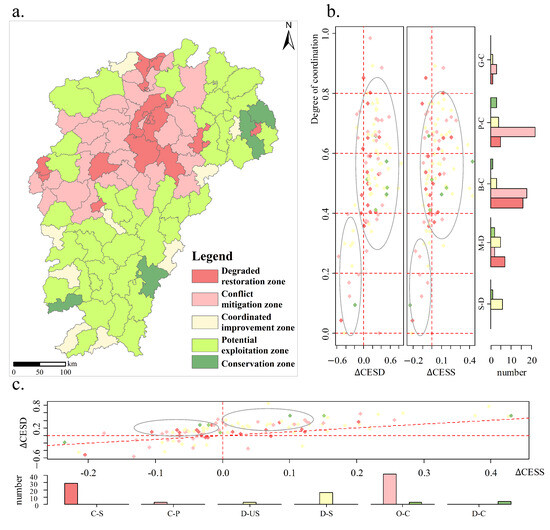
The static–dynamic coupling analysis reveals significant differentiation in CESSD changes across Jiangxi’s counties. Supply levels generally exhibit minimal fluctuations, maintaining relative stability and spatial equilibrium (Figure 7b,c). In contrast, demand changes show strong unidirectional clustering, with approximately 65% of counties experiencing demand growth concentrated in urban expansion and population aggregation areas, forming distinct demand hotspots (Figure 7b,c). Further analysis of static matching relationships indicates that uncoordinated regions (severely uncoordinated, mildly uncoordinated) experience bidirectional supply–demand pressure characterized by reduced supply and shrinking demand. Coordinated regions (basic, primary, well-coordinated) show demand-driven growth, with essential coordination areas experiencing pronounced supply contraction, primary coordination areas showing supply expansion, and well-coordinated areas maintaining dynamic supply–demand balance.
Figure 7.
Ecological management zones. Subgraph (a) is spatial distribution of ecological management areas; subgraph (b) is a scatter plot of the ecological management area under the coupled coordination degree model; subgraph (c) is a scatter plot of the ecological management area under the dynamic four-quadrant model. (Note: The red lines in subgraphs (b,c) represent the partition thresholds of the coupled coordination model and the dynamic four-quadrant model. The gray circles represent the main aggregation areas of the ecological management zone under the coupled coordination model and the dynamic four-quadrant model.)
3.3. Ecological Management Zoning
Guided by the dynamic matching of CESSD (dynamic change quadrants) and static coupling matching of CESs, the counties of Jiangxi Province can be categorized into five ecological management zones (Figure 7a).
Degradation Restoration Zone: This zone comprises 19 counties, primarily located along the Jiujiang–Nanchang development axis and within some legacy industrial areas. These counties typically exhibit weak natural resource supply capacity and fragile ecological foundations while also serving as hubs of population concentration, industrial activity, and transportation networks. As a result, the ecological systems in these areas are under significant pressure, with high demand for ecosystem services and simultaneous declines in both supply and demand. Although the coordination level between supply and demand includes both imbalanced and moderately coordinated states, the overall trajectory of ecosystem service change remains one of degradation. Therefore, it is imperative to enhance the regional ecological carrying capacity through restoration and compensation efforts. Targeted ecosystem service protection measures should be implemented to rehabilitate ecosystems without further degradation, thereby transforming the net negative trends into positive ecological outcomes and promoting sustainable development. Specific strategies include large-scale mine reclamation, wetland restoration, and waterbody remediation along with the construction of urban forests and ecological buffer zones, industrial restructuring, and the introduction of ecological compensation mechanisms. These interventions aim to reverse the declining trend in service supply and safeguard ecological security within the urban agglomeration of the middle reaches of the Yangtze River.
Conflict Mitigation Zone: The conflict mitigation zone is widely distributed across the central plains of the study area, particularly along urban expansion corridors such as Yongxiu County (Jiujiang), Lichuan District (Fuzhou), and Jizhou District (Ji’an). These areas exhibit the most pronounced contradictions between rapid economic growth and ecological degradation. With accelerating urban expansion and increasing population concentration, ecological pressure has intensified. Abandonment of arable land in these areas has further reduced the capacity of ecosystems to provide services, while urban population growth has significantly increased demand, resulting in pronounced supply–demand imbalances. The primary objective of governance in this zone is to alleviate the ecological pressures driven by rapid urbanization. This includes strictly safeguarding permanent basic farmland and ecological redlines, controlling the scale of newly developed construction land, and promoting the redevelopment of underutilized land. Simultaneously, green infrastructure should be developed, water use efficiency improved, and green industrial transformation advanced to achieve a dual balance between economic growth and ecological protection.
Coordination Improvement Zone: This zone is primarily located in core urban districts and their immediate peripheries, such as Qingyuan District and Hengfeng County. These regions face intensified human demand due to population concentration, resulting in pronounced mismatches between ecosystem service supply and demand. While the implementation of ecological policies has contributed to an increase in service supply, dynamic analysis indicates that the rate of supply growth still lags behind that of demand. To address this imbalance, ecological policies must be further enforced and optimized. Specific measures include the introduction of precision agriculture and efficient irrigation technologies, as well as the promotion of green energy substitution and smart city development. Policy orientation should emphasize “optimized regulation” to prevent future widening of the supply–demand gap through proactive and adaptive governance approaches.
Potential Exploration Zone: The potential development zone is mainly located in the southern and eastern mountainous and hilly areas of Jiangxi Province, including large parts of Ganzhou, Shangrao, and Jingdezhen. Dominated by land use types such as forest, cropland, and orchards, these regions possess abundant natural resources, strong ecological foundations, and significant potential for ecosystem service provision through agriculture and forestry. Although the supply–demand coordination degree in this zone indicates predominantly coordinated development and both supply and demand are increasing, the rate of supply growth remains lower than that of demand, placing the system in a potentially unsustainable state. To address this, the latent ecological potential must be transformed into drivers of green development. This includes optimizing industrial structures, developing under-forest economies and ecotourism, and enhancing mechanisms for realizing the value of ecological products, e.g., carbon trading and ecological compensation. Additionally, expanding forest and wetland protection networks and advancing industrial upgrading can promote the monetization of ecological resources and contribute to regional sustainability.
Maintenance Protection Zone: This zone includes only a few counties scattered across eastern and southwestern forested regions, such as Yushan County, Guangxin District, Ruijin City, and Dayu County. These areas exhibit strong ecological foundations and high resource-carrying capacity, while facing relatively low population pressure and ecological demand. Supply and demand of ecosystem services are relatively well balanced, with both undergoing positive change and supply increasing at a higher rate than demand, indicating a sustainable development stage. Given these advantages, efforts should focus on maintaining current ecological strengths while mitigating potential risks. Strict control over ecological redlines and protected areas is essential. Measures should include the conservation of primary forests and promotion of natural restoration. In addition, low-impact ecotourism and ecological cultural education should be expanded to ensure long-term ecological security in the region.
4. Discussion
4.1. Comparison of Related Zoning Methods
The degree of coordination between ecosystem service supply and demand serves as a critical indicator for assessing the synergy between regional socioeconomic development and natural ecological systems. In recent years, scholarly attention has increasingly focused on constructing multi-dimensional ecological zoning frameworks based on ecosystem service supply–demand relationships. Such approaches transcend traditional supply-oriented paradigms by integrating ecological resource endowments with human wellbeing demands into a unified analytical framework, thereby significantly enhancing the capacity to address supply–demand mismatches in ecosystem services.
Compared with existing studies (Table 6), the “Static Coordination–Dynamic Quadrant” framework developed in this study demonstrates notable methodological advancements. Prior studies have predominantly adopted singular analytical pathways. Some have assessed surplus or deficit conditions solely through supply–demand ratios, while others have evaluated static matching relationships using coupling coordination degree models; still others have depicted the trajectories of change through trend analysis. A few recent studies have attempted to combine quadrant-based classification with coordination degree analysis in order to reflect relative discrepancies and matching quality or link supply–demand indices with dynamic assessments to associate current balance states with evolutionary trends. However, these methods generally share a common limitation in that struggle to simultaneously answer two fundamental questions: “Is the current supply–demand relationship coordinated?” and “What is the trajectory of change?”.
Table 6.
Comparison of ecosystem service supply–demand matching methods.
The integrated framework proposed in this study overcomes this limitation by organically combining static and dynamic dimensions. It addresses the dimensional deficiency inherent in purely static approaches (e.g., coordination models alone) and purely dynamic methods (e.g., quadrant analysis alone), enabling simultaneous diagnosis of both current coordination status and future evolutionary pathways of ecosystem service supply and demand. Furthermore, by optimizing the threshold-setting mechanism, the framework mitigates the subjectivity and potential misclassification associated with conventional four-quadrant models. It also reveals the underlying systemic coordination mechanisms that govern supply–demand dynamics.
In this regard, the framework not only facilitates quantitative evaluation of the current balance of ecosystem services but also systematically characterizes temporal evolution paths, providing both theoretical and methodological advancements to the existing body of literature.
4.2. Spatial Differentiation Mechanisms and Regional Governance Strategies
This study identifies a typical spatial gradient pattern within the Jiangxi Ecological and Cultural Pilot Zone in the form of intensified conflict along urban corridors, coordinated improvement in peripheral mountainous areas, and stability in forested zones. This spatial configuration reveals the underlying differentiation mechanisms of ecosystem service supply—demand relationships within the coupled socio-ecological system.
From the perspective of spatial heterogeneity, urban corridor regions (e.g., the Jiujiang–Ganzhou development axis) have emerged as core zones of supply–demand imbalance due to intensive human activities. On the one hand, population agglomeration and urban expansion have compressed ecological spaces, resulting in a continuous decline in the supply of key services such as food production and carbon storage; on the other, the acceleration of industrialization has driven up water consumption and carbon demand, leading to a significant ecological deficit in which demand far exceeds supply. This supply contraction—demand surge conflict pattern is highly consistent with the findings of Xiang et al. [50] in the urban belts of Northeast China, confirming the common ecological stress observed in rapidly urbanizing regions.
In contrast, the mountainous areas of the west and south (e.g., western Yichun, Xingguo, Ningdu) exhibit a coordinated and optimized spatial pattern. These areas benefit from natural barriers such as steep terrain and high forest coverage, which effectively constrain development intensity and sustain strong ecosystem service supply capacity. Meanwhile, net population outflow has reduced demand pressure, forming a virtuous cycle in the supply–demand relationship. This aligns with the conclusions of Yang, et al. [24].
From a socio-ecological coupling perspective, the dynamic evolution trajectories of different regions exhibit clear path dependence. In degradation-persistent zones (e.g., Nanchang, Xinyu), prolonged overexploitation of natural resources has triggered a negative feedback loop consisting of land degradation, supply decline, population outmigration, and demand shrinkage [24], resulting in a locked spatial effect. In contrast, conflict-pressure zones (e.g., Shangrao, Ji’an) experience rapid urban expansion that outpaces ecological restoration, leading to a steep increase in demand relative to supply; this is an archetype of the “rapid-growth mismatch” described by Wang et al. [51]. Meanwhile, evidence from coordination-optimization zones (e.g., eastern Fuzhou, southern Ganzhou) shows that targeted interventions such as ecological compensation and industrial transformation can improve coordination despite slow supply growth. This supports the “structural adjustment” mechanism proposed by Wang et al. [52], which suggests that overcoming ecological constraints depends on reconstructing the feedback loop between social and ecological systems.
From a policy perspective, these zoning results offer a differentiated governance approach for ecological civilization construction. In degradation-restoration and conflict-mitigation zones, where urban expansion has led to declining supply and rising demand, policy priorities should focus on enhancing supply capacity and managing demand. Measures may include ecological compensation, cross-regional ecological product transfer, and the introduction of green technologies to ease imbalances. For potential development zones, which possess strong supply advantages in forest coverage and carbon storage, efforts should prioritize industrial restructuring and green development pathways in order to ensure sustainable ecosystem service provision and explore the transformation of ecological assets into economic values (i.e., “clear waters and green mountains” into “gold and silver mountains”). For conservation zones, strict enforcement of ecological redlines and long-term monitoring should be maintained to ensure the sustained supply of ecosystem services.
Collectively, this differentiated governance strategy forms a multi-tiered provincial framework consisting of restoration, coordination, optimization, cultivation, and protection, which aligns closely with the national “territorial spatial planning” requirements under the principle of multi-plan integration. This provides scientific support for the implementation of spatial zoning control and the realization of ecological product value.
4.3. Limitations and Future Research
This study considered several representative ecosystem services, including food production, water yield, carbon storage, and soil retention. However, due to limitations in data availability, it was not possible to provide a comprehensive depiction of the full spectrum of ecosystem services within the study area. Additionally, while the use of county-level administrative units as the primary spatial analysis scale facilitates policy formulation, it inevitably conceals the spatial heterogeneity within the study region at finer scales, reducing the precision and specificity of the zoning outcomes.
Moreover, although this study successfully identified provincial-scale patterns of ecosystem service supply and demand, it falls short in capturing the inter-county interactions and coordination mechanisms. In reality, counties constitute the fundamental units for implementing ecological compensation schemes and facilitating resource flows. The supply–demand complementarity among counties largely determines the feasibility of regional coordination. For example, counties with ecological supply advantages, such as forest-dominated regions, often provide essential regulating services to downstream urban areas, including water conservation and carbon sequestration. In return, high-demand counties may offer compensation through fiscal transfer payments or by absorbing ecological service spillovers via industrial relocation.
Therefore, future research should incorporate inter-county supply–demand exchange models in order to better elucidate the tradeoffs and synergies between counties. Such models would enable a more integrated understanding of spatial interdependence and enhance the alignment between provincial zoning strategies and county-level policy instruments, thereby improving the practical applicability and effectiveness of ecosystem governance.
5. Conclusions
This study utilized ArcGIS and the InVEST model to assess the spatial and temporal patterns of ecosystem service supply and demand in the Jiangxi Ecological and Cultural Pilot Zone from 2012 to 2022. A static–dynamic coupling framework was applied to analyze their matching characteristics, which then formed the basis for dividing the study area into ecological management zones. The main findings are as follows:
- (1)
- Significant spatial heterogeneity was observed among individual ecosystem services. Food production was concentrated in the central plains, while water yield and carbon storage were predominantly located in mountainous areas. Demand patterns were closely associated with population density and topographic conditions. Overall, a spatial gradient of “high supply–low demand” and “low supply–high demand” emerged, with high-supply areas located in ecological barrier zones and high-demand areas concentrated along urban corridors.
- (2)
- The static–dynamic coupling analysis revealed a distinct spatial structure characterized by being low in the center and high in the periphery. Urban core areas exhibited severe mismatches, while peripheral ecological regions demonstrated stronger coordination between supply and demand.
- (3)
- Based on the coupling analysis, five ecological management zones were delineated: degradation restoration, conflict mitigation, coordination enhancement, potential exploration, and conservation maintenance. Each zone assumes a distinct functional role: degradation restoration zones address ecological deficiencies; conflict mitigation zones aim to control development pressure; coordination enhancement zones focus on system regulation to prevent risks; potential exploration zones promote industrial transformation and green growth; and conservation maintenance zones act as ecological safety baselines.
Author Contributions
Conceptualization, F.Z.; methodology, F.Z., X.L. and Z.-A.C.; software, X.L.; validation, F.Z.; formal analysis, F.Z.; investigation, F.Z.; resources, F.Z.; data curation, F.Z.; writing—original draft preparation, F.Z.; writing—review and editing, F.Z. and Z.-A.C.; visualization, F.Z.; supervision, X.L.; project administration, Z.-A.C.; funding acquisition, Z.-A.C. All authors have read and agreed to the published version of the manuscript.
Funding
This work was supported by the Natural Science Foundation of China (grant number NSFC 52168010), Jiangxi Graduate Student Innovation Project Application Approval Form (Item number YC2024-S485).
Institutional Review Board Statement
Not applicable.
Informed Consent Statement
Not applicable.
Data Availability Statement
All data are contained within the article.
Conflicts of Interest
The authors declare no conflicts of interest.
Abbreviations
The following abbreviations are used in this manuscript:
| ES | Ecosystem Service |
| ESSD | Ecosystem Services Supply and Demand |
| GP | Grain Production |
| WY | Water Yield |
| CS | Carbon Storage |
| SR | Soil Retention |
| CES | Comprehensive Ecosystem Services |
| GDP | GDP Density |
| NDVI | Normalized Difference Vegetation Index |
| CESSD | Comprehensive Ecosystem Services Supply and Demand |
| CESS | Comprehensive Ecosystem Services Supply |
| CESD | Comprehensive Ecosystem Services Demand |
| S-D | Severe Disorder |
| M-D | Mild Disorder |
| B-C | Basic Coordination |
| P-C | Primary Coordination |
| G-C | Good Coordination |
| D-C | Coordinated Development |
| O-C | Coordinated Optimization |
| C-P | Potential Cultivation |
| D-S | Sustained Degradation |
| D-US | Unsustainable Degradation |
| C-S | Conflict Stress |
References
- Ma, Y.B.; Zhai, T.L.; Bi, Q.S.; Chang, M.Y.; Li, L.; Ma, Z.Y.; Li, Y.C. Ecological management zoning in the Yellow River Basin based on hierarchy of needs theory and ecosystem services supply and demand. Acta Eeol. Sin. 2024, 44, 6513–6526. [Google Scholar]
- Millennium Ecosystem Assessment. Ecosystems and Human Well-Being; Island Press: Washington, DC, USA, 2005. [Google Scholar]
- Wang, B.; Tang, H.; Zhang, Q.; Cui, F. Exploring connections among ecosystem services supply, demand and human well-being in a mountain-basin system, China. Int. J. Environ. Res. Public Health 2020, 17, 5309. [Google Scholar] [CrossRef] [Scilit] [PubMed]
- Li, X.; Yu, X.; Wu, K.; Feng, Z.; Liu, Y.; Li, X. Land-use zoning management to protecting the Regional Key Ecosystem Services: A case study in the city belt along the Chaobai River, China. Sci. Total Environ. 2021, 762, 143167. [Google Scholar] [CrossRef] [Scilit]
- Han, Z.; Liu, C.; Yan, X.; Li, X.; Wang, X. Coupling coordination and matches in ecosystem services supply-demand for ecological zoning management: A case study of Dalian. Acta Ecol. Sin. 2021, 41, 9064–9075. [Google Scholar] [CrossRef] [Scilit]
- Sun, H.; Di, Z.; Sun, P.; Wang, X.; Liu, Z.; Zhang, W. Spatiotemporal differentiation and its attribution of the ecosystem service trade-off/synergy in the Yellow River Basin. Land 2024, 13, 369. [Google Scholar] [CrossRef] [Scilit]
- Qu, J.; Xu, Z.; Dong, B.; Wang, H.; Han, Y. Analyzing trade-offs, synergies, and driving factors of ecosystem services in Anhui Province using spatial analysis and XG-boost modeling. Ecol. Indic. 2025, 171, 113098. [Google Scholar] [CrossRef] [Scilit]
- Zhong, Z.; Fang, X.; Zhang, Y.; Shu, X.; Guo, D. Mapping ecosystem service supply–demand bundles for an integrated analysis of tradeoffs in an urban agglomeration of China. Land 2022, 11, 1558. [Google Scholar] [CrossRef] [Scilit]
- Wang, D.; Liang, Y.; Peng, S.; Yin, Z.; Huang, J. Integrated assessment of the supply–demand relationship of ecosystem services in the Loess Plateau during 1992–2015. Ecosyst. Health Sustain. 2022, 8, 2130093. [Google Scholar] [CrossRef] [Scilit]
- You, S.; Zheng, Q.; Chen, B.; Xu, Z.; Lin, Y.; Gan, M.; Zhu, C.; Deng, J.; Wang, K. Identifying the spatiotemporal dynamics of forest ecotourism values with remotely sensed images and social media data: A perspective of public preferences. J. Clean. Prod. 2022, 341, 130715. [Google Scholar] [CrossRef] [Scilit]
- Da, C.; Zhi, J.; Zhao, W.; Liu, W.; Xue, C.; Bao, S. Cultural service assessment of cultivated land ecosystem in the Yangtze River Delta region from a supply–demand-flow perspective. Ecol. Indic. 2025, 173, 113378. [Google Scholar] [CrossRef] [Scilit]
- He, S.; Su, Y.; Shahtahmassebi, A.R.; Huang, L.; Zhou, M.; Gan, M.; Deng, J.; Zhao, G.; Wang, K. Assessing and mapping cultural ecosystem services supply, demand and flow of farmlands in the Hangzhou metropolitan area, China. Sci. Total Environ. 2019, 692, 756–768. [Google Scholar] [CrossRef] [Scilit]
- Chen, Y.; Qiao, X.; Yang, Y.; Zheng, J.; Dai, Y.; Zhang, J. Identifying the spatial relationships and drivers of ecosystem service supply–demand matching: A case of Yiluo River Basin. Ecol. Indic. 2024, 163, 112122. [Google Scholar] [CrossRef] [Scilit]
- Zhai, T.; Ma, Y.; Huang, L.; Lu, Y.; Li, L.; Chen, Y.; Chang, M.; Ma, Z. Research on the spatiotemporal evolution characteristics and driving mechanisms of supply–demand risks of ecosystem services in the yellow river basin integrating the hierarchy of needs theory. Ecol. Indic. 2025, 171, 113229. [Google Scholar] [CrossRef] [Scilit]
- Zhai, T.; Wang, J.; Jin, Z.; Qi, Y.; Fang, Y.; Liu, J. Did improvements of ecosystem services supply-demand imbalance change environmental spatial injustices? Ecol. Indic. 2020, 111, 106068. [Google Scholar] [CrossRef] [Scilit]
- Zhang, J.; Wang, M.; Liu, K.; Chen, S.; Zhao, Z.A. Social-ecological system sustainability in China from the perspective of supply-demand balance for ecosystem services. J. Clean. Prod. 2025, 497, 145039. [Google Scholar] [CrossRef] [Scilit]
- Han, X.; Gao, G.; Zhang, J.; Wang, Z.; Wu, X.; Lü, Y. Spatial scale-dependence and controlling factors of ecosystem service supply-demand relationships in the Loess Plateau of China. Geogr. Sustain. 2025, 6, 100297. [Google Scholar] [CrossRef] [Scilit]
- Gao, M.; Hu, Y.; Liu, X.; Liang, M. Revealing multi-scale characteristics of ecosystem services supply and demand imbalance to enhance refined ecosystem management in China. Ecol. Indic. 2025, 170, 112971. [Google Scholar] [CrossRef] [Scilit]
- Qi, F.; Liu, J.; Gao, H.; Fu, T.; Wang, F. Characteristics and spatial–temporal patterns of supply and demand of ecosystem services in the Taihang Mountains. Ecol. Indic. 2023, 147, 109932. [Google Scholar] [CrossRef] [Scilit]
- Wu, J.; Huang, Y.; Jiang, W. Spatial matching and value transfer assessment of ecosystem services supply and demand in urban agglomerations: A case study of the Guangdong-Hong Kong-Macao Greater Bay area in China. J. Clean. Prod. 2022, 375, 134081. [Google Scholar] [CrossRef] [Scilit]
- Xie, Y.C.; Zhang, S.X.; Lin, B.; Zhao, Y.J.; Hu, B.Q. Spatial zoning for land ecological consolidation in Guangxi based on the ecosystem services supply and demand. J. Nat. Resour. 2020, 35, 217–229. [Google Scholar] [CrossRef] [Scilit]
- Zhou, L.; Zhang, H.; Bi, G.; Su, K.; Wang, L.; Chen, H.; Yang, Q. Multiscale perspective research on the evolution characteristics of the ecosystem services supply-demand relationship in the chongqing section of the three gorges reservoir area. Ecol. Indic. 2022, 142, 109227. [Google Scholar] [CrossRef] [Scilit]
- Li, J.Y.; Wang, H. Understanding supply-demand mismatches in ecosystem services and interactive effects of drivers to support spatial planning in Tianjin metropolis, China. Sci. Total Environ. 2023, 895, 165067. [Google Scholar] [CrossRef] [Scilit] [PubMed]
- Yang, M.; Chen, Y.; Yang, Y.; Yan, Y. Nonlinear relationship and threshold-based zones between ecosystem service supply-demand ratio and land use intensity: A case study of the Beijing-Tianjin-Hebei region, China. J. Clean. Prod. 2024, 481, 144148. [Google Scholar] [CrossRef] [Scilit]
- Teng, Y.; Chen, G.; Su, M.; Zhang, Y.; Li, S.; Xu, C. Ecological management zoning based on static and dynamic matching characteristics of ecosystem services supply and demand in the Guangdong–Hong Kong–Macao Greater Bay Area. J. Clean. Prod. 2024, 448, 141599. [Google Scholar] [CrossRef] [Scilit]
- Sun, R.; Jin, X.; Han, B.; Liang, X.; Zhang, X.; Zhou, Y. Does scale matter? Analysis and measurement of ecosystem service supply and demand status based on ecological unit. Environ. Impact Assess. Rev. 2022, 95, 106785. [Google Scholar] [CrossRef] [Scilit]
- Wang, J.; Zhai, T.; Lin, Y.; Kong, X.; He, T. Spatial imbalance and changes in supply and demand of ecosystem services in China. Sci. Total Environ. 2019, 657, 781–791. [Google Scholar] [CrossRef] [Scilit]
- Xu, Z.; Peng, J.; Dong, J.; Liu, Y.; Liu, Q.; Lyu, D.; Qiao, R.; Zhang, Z. Spatial correlation between the changes of ecosystem service supply and demand: An ecological zoning approach. Landsc. Urban Plan. 2022, 217, 104258. [Google Scholar] [CrossRef] [Scilit]
- Lai, J.; Qi, S. Construction of ecological security pattern based on ecological protection red line, machine learning algorithms, and circuit theory: A case study of Kunming city, China. J. Clean. Prod. 2025, 520, 146117. [Google Scholar] [CrossRef] [Scilit]
- Shen, J.; Zhao, M.; Tang, X.; Wu, C. Ecological restoration zoning and strategy based on ecosystem service supply and demand relationships: A case study of the Yellow River Basin. J. Nat. Conserv. 2025, 84, 126837. [Google Scholar] [CrossRef] [Scilit]
- Wang, X.; Qiu, X.; Wang, Z.; Feng, C.; Fan, Z.; He, W. Construction of a social ecological security pattern based on the supply and demand of ecosystem services. J. Nat. Conserv. 2025, 86, 126962. [Google Scholar] [CrossRef] [Scilit]
- Chen, Y.; Zhai, Y.; Gao, J. Spatial patterns in ecosystem services supply and demand in the Jing-Jin-Ji region, China. J. Clean. Prod. 2022, 361, 132177. [Google Scholar] [CrossRef] [Scilit]
- Hu, B.; Xie, M.; He, R.; Shi, Z.; Zhou, Y.; Ni, H.; Li, H. Spatio-temporal evolution of cropland ecosystem services value and its spatially varying dominate over the past two decades: A case study in Jiangxi Province in southern China. J. Clean. Prod. 2023, 427, 139228. [Google Scholar] [CrossRef] [Scilit]
- Zhang, X.; Fan, H.; Sun, L.; Liu, W.; Wang, C.; Wu, Z.; Lv, T. Identifying regional eco-environment quality and its influencing factors: A case study of an ecological civilization pilot zone in China. J. Clean. Prod. 2024, 435, 140308. [Google Scholar] [CrossRef] [Scilit]
- Xie, Y.; Dai, W.; Xiang, S.; Deng, H.; Wang, Z.; Li, Y.; Wang, Z.; Zhou, M.; Gao, M. Supply and demand of ecosystem services and their interaction with urbanization: The case of Chengdu-Chongqing urban agglomeration. Urban Clim. 2024, 55, 101978. [Google Scholar] [CrossRef] [Scilit]
- Lv, L.; Han, X.; Zhu, J.; Liao, K.; Yang, Q.; Wang, X. Spatial drivers of ecosystem services supply-demand balances in the Nanjing metropolitan area, China. J. Clean. Prod. 2024, 434, 139894. [Google Scholar] [CrossRef] [Scilit]
- Wang, Y.; Dai, E.; Ge, Q.; Zhang, X.; Yu, C. Spatial heterogeneity of ecosystem services and their trade-offs in the Hengduan Mountain region, Southwest China. Catena 2021, 207, 105632. [Google Scholar] [CrossRef] [Scilit]
- Yu, J.; Yi, L.; Xie, B.; Li, X.; Li, J.; Xiao, J.; Zhang, L. Matching and coupling coordination between the supply and demand for ecosystem services in Hunan Province, China. Ecol. Indic. 2023, 157, 111303. [Google Scholar] [CrossRef] [Scilit]
- Ding, T.; Chen, J.; Fang, Z.; Chen, J. Assessment of coordinative relationship between comprehensive ecosystem service and urbanization: A case study of Yangtze River Delta urban Agglomerations, China. Ecol. Indic. 2021, 133, 108454. [Google Scholar] [CrossRef] [Scilit]
- Lyu, R.; Clarke, K.C.; Tian, X.; Zhao, W.; Pang, J.; Zhang, J. Land use zoning management to coordinate the supply–demand imbalance of ecosystem services: A case study in the city belt along the yellow river in Ningxia, China. Front. Environ. Sci. 2022, 10, 911190. [Google Scholar] [CrossRef] [Scilit]
- Shen, J.; Li, S.; Wang, H.; Wu, S.; Liang, Z.; Zhang, Y.; Wei, F.; Li, S.; Ma, L.; Wang, Y. Understanding the spatial relationships and drivers of ecosystem service supply-demand mismatches towards spatially-targeted management of social-ecological system. J. Clean. Prod. 2023, 406, 136882. [Google Scholar] [CrossRef] [Scilit]
- Tian, J.; Zeng, S.; Zeng, J.; Jiang, F. Assessment of supply and demand of regional flood regulation ecosystem services and zoning management in response to flood disasters: A case study of Fujian delta. Int. J. Environ. Res. Public Health 2022, 20, 589. [Google Scholar] [CrossRef] [Scilit]
- Ji, Z.; Zou, S.; Zhang, W.; Song, F.; Yuan, T.; Xu, B. Optimizing zoning for ecological management in alpine region by combining ecosystem service supply and demand with ecosystem resilience. J. Environ. Manag. 2024, 365, 121508. [Google Scholar] [CrossRef] [Scilit]
- Liu, W.; Zhan, J.; Zhai, Y.; Zhao, F.; Asiedu Kumi, M.; Wang, C.; Bai, C.; Wang, H. Linking ecosystem service supply and demand to evaluate the ecological security in the pearl river delta based on the pressure-state-response model. Int. J. Environ. Res. Public Health 2023, 20, 4062. [Google Scholar] [CrossRef] [Scilit]
- Teng, Y.; Zhan, J.; Liu, W.; Chu, X.; Zhang, F.; Wang, C.; Wang, L. Spatial heterogeneity of ecosystem services trade-offs among ecosystem service bundles in an alpine mountainous region: A case-study in the Qilian Mountains, Northwest China. Land Degrad. Dev. 2022, 33, 1846–1861. [Google Scholar] [CrossRef] [Scilit]
- Wu, F.; Liang, Y.; Liu, L.; Yin, Z.; Huang, J. Identifying eco-functional zones on the Chinese Loess Plateau using ecosystem service bundles. Reg. Sustain. 2023, 4, 425–440. [Google Scholar] [CrossRef] [Scilit]
- Su, R.; Duan, C.; Chen, B. The shift in the spatiotemporal relationship between supply and demand of ecosystem services and its drivers in China. J. Environ. Manag. 2024, 365, 121698. [Google Scholar] [CrossRef] [Scilit]
- Xiong, S.; Yang, F.; Gu, C. Exploring spatiotemporal coupling effects between built environment and ecosystem health: Toward static–dynamic sustainable management in waterfront cities. J. Clean. Prod. 2025, 145389. [Google Scholar] [CrossRef] [Scilit]
- Lin, Y.; Xu, X.; Tan, Y.; Chen, M. Multi-scalar assessment of ecosystem-services supply and demand for establishing ecological management zoning. Appl. Geogr. 2024, 172, 103435. [Google Scholar] [CrossRef] [Scilit]
- Xiang, H.; Zhang, J.; Mao, D.; Wang, Z.; Qiu, Z.; Yan, H. Identifying spatial similarities and mismatches between supply and demand of ecosystem services for sustainable Northeast China. Ecol. Indic. 2022, 134, 108501. [Google Scholar] [CrossRef] [Scilit]
- Wang, H.; Sun, Q. Urban Sprawl and Imbalance between Supply and Demand of Ecosystem Services: Evidence from China’s Yangtze River Delta Urban Agglomerations. Sustainability 2024, 16, 8269. [Google Scholar] [CrossRef] [Scilit]
- Wang, T.; Luo, M.; Bai, L.; Li, W. Urbanization and Ecosystem Services Supply–Demand Mismatches Across Diverse Resource-Based Cities: Evidence from Sichuan, China. Sustainability 2025, 17, 7331. [Google Scholar] [CrossRef] [Scilit]

Disclaimer/Publisher’s Note: The statements, opinions and data contained in all publications are solely those of the individual author(s) and contributor(s) and not of MDPI and/or the editor(s). MDPI and/or the editor(s) disclaim responsibility for any injury to people or property resulting from any ideas, methods, instructions or products referred to in the content. |
© 2025 by the authors. Licensee MDPI, Basel, Switzerland. This article is an open access article distributed under the terms and conditions of the Creative Commons Attribution (CC BY) license (https://creativecommons.org/licenses/by/4.0/).