1. Introduction
More sustainable forms of agriculture strive to address multiple needs in order to meet future challenges related to environmental, social, and economic issues. Organic farming (synonymous in this work with organic agriculture), as an alternative to conventional agriculture, aims to meet high ecological standards while at the same time satisfying social demands and allowing for economic viability [
1]. Furthermore, organic farming is considered to have a positive effect on rural development through, e.g., job creation, biodiversity, and landscape preservation, as well as diversification of income [
2,
3,
4].
Therefore, several EU and national strategies include organic farming as an important building block for the development of a sustainable agri-food system [
5,
6]. The EU Farm to Fork Strategy, as an example, identifies organic farming as a means of providing ecosystem services to society [
7]. With the EU target of 25% organic farming by 2030, the new Common Agricultural Policy (CAP) is expected to support organic farmers with various measures such as tailored funding instruments, accompanied by investments and advisory services, and the ‘Action Plan for the Development of EU Organic Production’ was communicated by the European Commission as a directive [
8].
In addition, there are also political measures on the national level to promote organic farming. In Germany, the ‘Bundesprogramm Ökologischer Landbau’ (BÖL) (Federal Organic Farming Program) aims at improving the framework conditions for organic farming. Also, the strategy process for the future development of organic farming was developed by the Bundesministerium für Ernährung und Landwirtschaft (federal ministry for food and agriculture) within the framework of the ‘Zukunftsstrategie Ökologischer Landbau’ (Future Strategy for Organic Agriculture) [
9] and was recently replaced by the new ‘Bio-Strategie 2030’ (Organic Strategy 2030) [
10]. At the administrative level of the German states (Bundesländer), there are further targeted measures, such as the ‘BioRegio Bayern 2020’ program in Bavaria [
6] and the successive ‘BioRegio 2030’ [
11].
Many of the objectives contained in such policies are directly related to a multitude of functions attributed to agriculture [
12]. Wilson [
13] claims that more attention should be paid to the influence of spatiality in agricultural multifunctionality. The organic food system has changed from a loosely coordinated local network of producers and consumers to a globalized system of formally regulated trade. The system facilitates the interconnection of geographically disparate production and consumption sites [
14], establishing a network of supply chains. These include traditional wholesalers and supermarket chains, as well as alternative distribution channels, predominantly local in nature [
15]. However, looking at production and consumption alone would not do justice to the complexity of the organic food system, as there are more actors and associated linkages along the organic value chain.
Yet the development and spatial distribution of organic farming is almost exclusively assessed on the basis of the producer (organic agricultural area, the number of organic farms) or the consumer (turnover of organic products) [
16,
17,
18,
19,
20,
21,
22]. In order to do justice to the multiplicity of actors and processes in the organic production system, the term ‘organic sector’ is used in scientific contributions [
18], but also in the EU planning document ‘Action Plan for the Development of Organic Production’, without further specifying its participants there [
8].
Therefore, for a profound assessment of the development of organic farming, or rather the organic sector, it is crucial to take into account more than the evaluation of the organically cultivated area or the number of organic farms but rather to explore the interactions and relationships among various actors involved in the production and distribution of organic food produce [
23], including their spatial allocation [
13], as it is well known that food chains are very heterogeneous in nature, depending on the agricultural product [
24].
The aspect of spatial proximity is crucial for fulfilling the multifunctional role of organic farming and should therefore be central to the assessments, in science as in policy. However, due to heterogeneous data sources and availability, it is difficult to spatially locate different actors in the organic sector. This limits the analysis of large-scale assessments of spatial distribution of different actors in the organic sector. Studies reveal that several factors account for the uneven distribution of organic agriculture, including physical, structural, socio-cultural, and economic factors [
19,
25]. Heterogeneous causal processes influence the development of area, number of farms, or turnover, such as the conversion to organic farming [
26,
27,
28,
29] and the decision to buy organic products [
30,
31,
32]. Most prominently, it is known that farmers’ decisions to produce goods are directly correlated with the availability of a secure promise of purchase by other actors along the value chain, preferably in close proximity [
33]. Based on these facts, the spatial distribution of different actors in the organic sector along the commodity chain is necessary to assess.
The objective of this work is to show the spatial distribution of a wider set of actors as part of the organic sector in Bavaria. Hence, we investigate how to represent the real spatial development processes in the organic sector in data. This is approached by collecting the required data from publicly available EU organic certificates. Beyond visualization, the analysis also considers how different actor groups are related to each other in spatial terms in order to identify imbalances and dependencies within the value chain.
For the first time, the spatial distribution of these actors is displayed large-scale, in our case at the scale of district level (Landkreise). The work thus fills the gap of the insufficient spatial representation of different actors in the organic sector. Depicting this data allows for further analysis and new perspectives within the framework of economic geography approaches (e.g., relational economic geography, short-food-supply chains, and cluster development), as well as a better understanding of the integral development of the organic sector. In the context of the policy aims assigned to organic farming and relevant policy components such as rural development, biodiversity, and climate protection, this endeavor seems to be of vital importance for further evaluation and research.
First, the paper outlines the policy goals, the measures derived therefrom, and the benefits associated with organic farming at the EU, German, and Bavarian levels. This is followed by an insight into organic certification and its function as a regulatory instrument. Then, the paper gives an overview of the current spatial representation of the development of organic farming and the organic sector in data and delineates the gap in relation to current research attempts. The methodology and data collection are then presented. Subsequently, the maps generated by the data are shown and described in detail in terms of their patterns and distributions and the correlations between the actors are assessed. The following discussion aims to answer the questions of the usefulness and limitations of certificates as a data source and the possibilities of targeted measures to support rural development and the development of organic farming. This is followed by a conclusion and an outlook on what new possibilities are revealed by this work.
2. Policy Goals for Organic Farming and Organic Certification
Organic farming is considered crucial to achieving several policy goals on various scales. Therefore, an extensive network of policy strategies has been introduced for this purpose, all of which attribute several benefits to organic farming. The extent to which the politically desirable benefits of organic farming are achieved is measured and continuously monitored using specific indicators.
The Farm to Fork Strategy is the agricultural strategy for achieving the EU’s targets for a fair, healthy, and environmentally friendly food system, which again explicitly highlights the urgent need to increase organic farming (see
Table 1) [
34]. It is part of the overarching policy initiative, the European Green Deal, with the objective to make Europe the first climate-neutral continent by 2050 [
35]. As basic goals of the Farm to Fork Strategy, the EU defines that “the EU’s goals are to reduce the environmental and climate footprint of the EU food system and strengthen its resilience, ensure food security in the face of climate change and biodiversity loss, and lead a global transition towards competitive sustainability from farm to fork and tap into new opportunities” [
34]. The benefits and services of organic farming are compatible with many of these objectives.
The Farm to Fork Strategy was challenged by Schebesta and Candel [
36], who doubted how it will become a game changer based on the following four determinants: “the unresolved ambiguity of food sustainability, the discrepancy between policy objectives and the specific legal actions proposed, the vulnerable institutional embedding within the European Commission, and limited coordination with the EU’s Member States” [
36]. Others assessed how targeted reduction in the use of land, fertilizers, antimicrobials, and pesticides has an impact on the yields of EU agriculture and directly impacts European and worldwide food prices [
37] or how the implications of the Farm to Fork Strategy would lead to an economic imbalance and an overall net welfare loss [
38].
The policy that provides the framework for all measures and allows for financial support of farmers is the CAP. Additionally the direct payments within Pillar I of the CAP (European Agricultural Guarantee Fund (EAGF)), financial support is provided under the new CAP Rural Development Program, which allows support for organic farmers within Pillar II through the European Agricultural Fund for Rural Development (EAFRD) [
7]. In this way, organic farming makes a valuable contribution to CAP objectives such as “ensuring a fair income for farmers, rebalancing farmers’ position in the value chain, ensuring sustainable development and efficient management of the natural resources, protecting biodiversity ecosystem services and habitat and landscapes, and improving the response of EU agriculture and EU aquaculture to societal demands on food and health, as well as animal welfare” [
8]. Thus, organic farming demonstrates its multiple functionalities, also with regard to the development of rural areas, in which organic farming plays a key role. A major change in the new CAP is the possibility of additional support in Pillar I through so-called “eco-schemes”, such as, e.g., organic farming, integrated pest management practices, carbon farming, agro-ecology, and agro-forestry, where various environmental services are to be paid for, with each EU member state being able to select the appropriate eco-schemes for its country from a catalogue [
39].
The explicit goals and recommended actions to achieve the objectives have been circulated by the European Commission in the ‘Action Plan for the Development of Organic Production’ [
8]. It is based on three main axes: 1. Stimulate demand and ensure consumer trust; 2. Stimulate conversion and reinforce the entire value chain; 3. Improve the contribution of organic farming to sustainability. Within these axes, 23 actions, e.g., promoting organic canteens and increasing the use of green public procurement, encouraging conversion, investment, and exchange of best practices, and supporting the organization of the food chain, are proposed to achieve the objectives.
There is no stringency in EU strategies and policies as to whether the term organic farming refers to the farming method, the area, or the entire organic sector. In the report of the European Commission entitled “Analysis of the EU organic sector” from 2010 [
40], the term organic sector is used in connection with organically farmed area, with organic livestock, with the number of producers, with markets, and with total food expenses in the EU. In addition, the term organic sector is used by the European Commission when talking about rural development programs, and in this context, agri-environmental measures are related to the organic sector [
40]. Further within the ‘Action Plan for the Development of Organic Production’, the notion of the organic sector is frequently used without defining it [
8].
In contrast to the European Commission’s report, Konstantinidis [
41] summarizes that the organic sector is today multi-faceted, multi-layered, and reciprocal and has clearly deviated from its early social and environmental ideals by “relying on mechanization, migrant wage labor, and fossil fuels; engaging in monocultures; and marketing its products in long-distance international markets” [
41]. This is an indication of how complex and interwoven the organic production system is and how there are trends towards more conventional production and decisions. This topic is addressed in greater depth in the conventionalization debate (see [
42,
43]).
At the German level the BÖL [
44] is the funding instrument for the implementation of the ‘Zukunftsstrategie ökologischer Landbau’ (Future Strategy for Organic Agriculture) [
9] and now the Bio-Strategie 2030 [
10]. The BÖL considers four measures to be the most important: 1. Identification of the need for research and initiation and support of research projects on the topics of production, processing, and marketing; 2. Preparation of the acquired knowledge in a target group-oriented way; 3. Support and strengthening of the supply and demand of organically and sustainably produced products with a variety of further education and training programs; 4. Information offers and competitions, supporting information services, and trade fair appearances of the industry on organic agriculture [
45].
For the state of Bavaria, these nationwide initiatives and measures have been supplemented since 2012 by the state program ‘BioRegio Bayern 2020’, followed by the state program ‘BioRegio 2030’. This is a holistic approach to the promotion of organic farming in Bavaria. The focus is on education, extension, promotion, marketing, and research specifically tailored to the needs of organic farming. The objective was to double the domestic production of organic food from Bavaria by 2020 [
6]. In terms of production value in €, the target was just missed with an increase of 94%, with crop production increasing by 126% and livestock production by 91% (see more detail in [
46]). Despite the continuation of the state program, no detailed program has yet been published for ‘BioRegio 2030’. Although organic farming is already highly developed, Bavaria shows a heterogeneous distribution in 2020 (
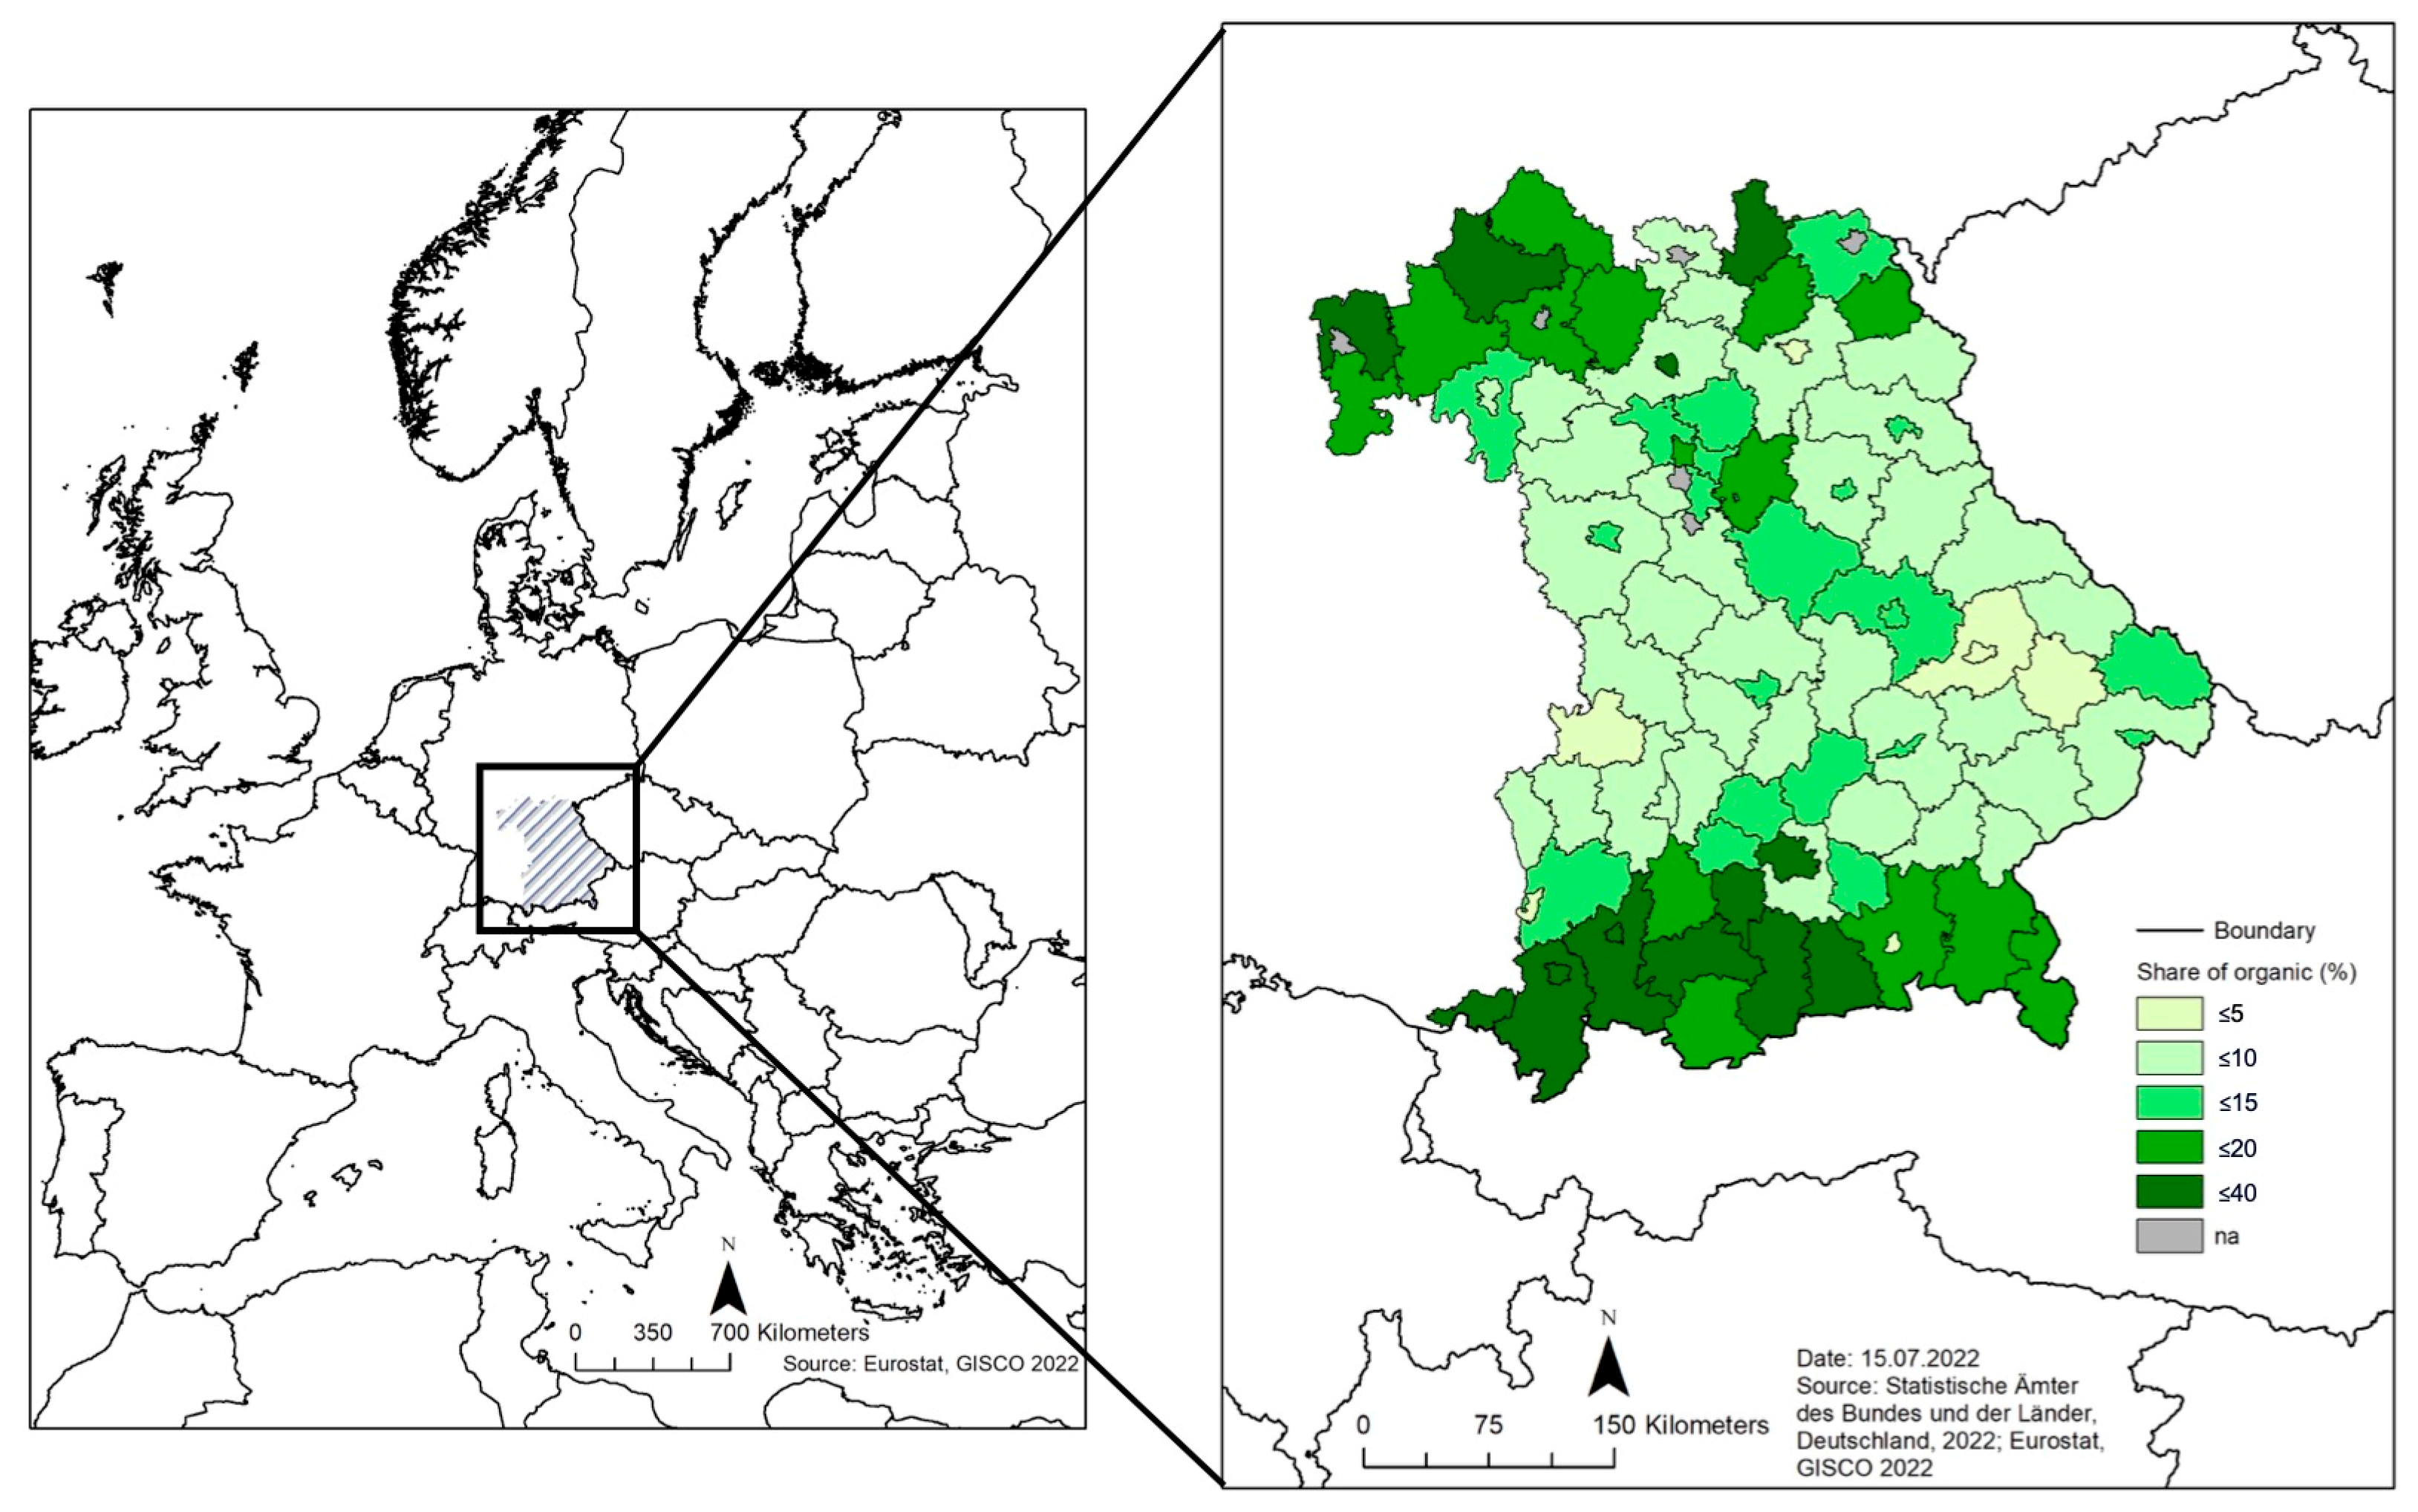
Figure 1) with the highest number of organic farms per state in Germany (10,989 (31.05%)) and the largest organic area (386,496 ha (22.71%)) while having the most producers/processors (4363 (25.15%)) [
44].
The general development of organic farming in Bavaria from 2012 to 2020 saw an increase in area of 86.6% and an increase in the number of farms by 67.8%, while the general agricultural area in Bavaria decreased by 1.5% during this period. As a result, the share of organic farming increased from 6.4% in 2012 to 12.1% in 2020 [
47,
48]. This shows very clearly that the share of farms as an indicator can be misleading if the total absolute area decreases at the same time. The area-related targets that are actually intended to be achieved can thus no longer be achieved effectively.
Figure 1.
Location of Bavaria within Europe and Germany (
left) and the share of organic area in 2020 in Bavaria (
right) [
48].
Figure 1.
Location of Bavaria within Europe and Germany (
left) and the share of organic area in 2020 in Bavaria (
right) [
48].
Policy efforts to support rural development, including the benefits of organic farming, are frequently based on scientific evidence. The contribution and the similarities between organic farming and sustainable rural development [
4], the different advantages of organic farming and its added value for rural development using the example of a case study from Austria [
2], and the possibilities of conversion to organic farming for regional development in Sicily (Italy) using the example of lemon farmers [
49] are some examples. Given that organic farming is supported by EU funds through rural development programs and that the impact of neighborhood effects [
50] on organic farming diffusion can be linked to the benefits of proximity to processors and markets [
51], it is essential to determine the precise spatial distribution of the organic sector, not only of producers but also of other actors, in order to evaluate the progress of the EU′s policy objectives.
3. Organic Certification as a Regulatory Instrument
Organic farming was first legally anchored in the EU in 1991 with the EU Commission’s definition of organic crop production (EC Reg. 2092/91) [
52], which came into force in 1993. The aim was to reduce confusion and fraud within the EU, thereby protecting both consumers and producers, and to support the development of the organic market in the EU [
53]. On the basis of this legal foundation, over the years, many additions have been made to explicitly subsidize farms wishing to convert to organic farming, as well as to facilitate the import and export of organic products within the EU.
The legal framework for organic farming established in the EU allows governments to subsidize organic farming. Standards and certification as a regulatory instrument ensure compliance and protect producers from unfair competition and consumers from fraud, thereby building confidence in organic produce [
22]. To verify compliance, private and governmental inspection bodies and organizations have been contracted to inspect the respective farms for the six control sectors. A: Agricultural production; AA: Agricultural production—seaweed and aquaculture; AI: Agricultural production—beekeeping; B: Production of processed food; C: Trade with third countries (import); D: Awarding to third parties; E: Manufacture of animal feed. Depending on the federal state in Germany, control sector H: trade, is also certified, although in some federal states it is reported separately and in some federal states it is integrated into control sector B. This certification process is the most widely used regulatory instrument to ensure compliance in agriculture [
54]. The basic EU organic certification allows for marketing organic products and using the EU organic logo. In some countries, such as Germany, a national organic logo has been most widely used for a long time. Additionally, there are four major organic farmers’ associations in Germany (Biokreis, Bioland, Demeter, and Naturland) that also provide a logo to assure consumers of the stricter specifications of the organic farmer association [
55]. This resulted in the additional use of organic certification logos with the introduced EU logo since the latter is mandatory [
56].
Certification in organic farming is a controversial issue. It serves as a means to protect and build confidence in organic production, even if it is only about production techniques and not product quality. Yet certification is not necessary for farmers to follow organic guidelines, but it is necessary to market organic produce. Furthermore, the certification process and the associated institutionalization may have an adverse impact on the sustainability performance of organic farming [
57]. The additional costs associated with certification by third-party certifiers can also be a disincentive to conversion, and larger farms in particular are more likely to be able to afford the costs [
58], although the possibility of group certification since the new EU regulations should counteract this [
59]. There is also a tendency for a shift from public to private certification, depicting a change in the mechanisms in the agri-food sector [
60].
The European Commission’s regulation on organic production and labelling of organic products (EC Reg. 2017/625) [
61] provides a definition of organic control authority. It states that it “means a public administrative organization for organic production and labelling of organic products of a Member State to which the competent authorities have conferred, in whole or in part, their competences in relation to the application of Council Regulation (EC) No 834/2007, including, where appropriate, the corresponding authority of a third country or operating in a third country” [
62]. The European Commission also defines a delegated body as “a separate legal person to which the competent authorities have delegated certain official control tasks or certain tasks related to other official activities” [
62].
In Germany, this means that there are 19 different organic inspection bodies that certify according to the regulations. They operate according to region and control sector and also carry out, to varying degrees, the additional inspection of the four organic farmers’ associations. At the moment, it is the responsibility of each individual German state (Länder) to receive the reports from the respective control bodies in accordance with Article 34 of Regulation (EU) 2018/848 [
63]. The inspection bodies report on a quarterly basis to the respective state authority, e.g., ‘Landesanstalt für Landwirtschaft’ for Bavaria, which in turn reports the data to the Federal Agency for Agriculture and Food (BLE). In turn, the BLE is responsible for reporting the data to the Federal Ministry of Agriculture and Food (BMLE), which again forwards the data to the European Commission (also see [
64]).
Due to the large number of inspection bodies and the long reporting chain, which differs from country to country and, in the case of Germany, also from state to state, there is no homogeneity in the data reporting of organic certificates and the availability of these certificates. In addition, the data available in the certificates can only be extracted and used with considerable effort. This data bottleneck prevents a comprehensive analysis of the organic sector based on certificates. Nevertheless, this paper attempts to demonstrate the possible added value of analyses based on data from certificates and thus to spatially locate several actors in the organic sector in Bavaria.
The organic certificate itself, as used in this work, is a data-rich protocol that includes not only the name and location of the company or farm but also which products have been inspected and at what stage of the conversion process (organic, in conversion (two-three years), or conventional). Organic certification therefore plays a crucial role in the organic sector for the reasons just mentioned. It is not required to practice organically but to participate in the organic sales market. Farms that are not certified but that are managed according to organic criteria are of little interest to politicians, markets, or farmers’ associations. These farms usually choose to market themselves in an alternative way (e.g., direct farm sales) [
65], thereby building trust with consumers. Hence, it is important to distinguish between the decision to farm organically and the decision to be certified [
66]. Certification is the regulatory backbone of the organic sector. It is the foundation of public trust but allows industrial-like division of labor and marketing of long-distance, unbound to the direct contact to the producer. In addition, depending on the country, the certification system is a lucrative business and a service that is increasingly in demand.
4. The Spatial Representation of Organic Farming
We use the specification of the organic sector introduced by Darnhofer et al. [
18]. They “use the term ’organic sector’ to refer to all actors linked to organic agriculture and food, including organic farmers, farmers’ associations, umbrella organizations, advocacy groups, processors, traders, certifiers, consumers, researchers, and policymakers” [
18]. Further, they “propose to focus on relations between five sets of actors: the organic farmers associations, the State, established or mainstream farmers associations, advocacy groups engaged in politicizing the agrifood system, and various actors along the food value chain” [
18].
In the context of the evaluation of organic farming in Bavaria [
26], attention was also paid to the decision to convert, as this is considered to be a key factor influencing the development of organic farming. The factors can be divided into three categories: 1. Internal factors, e.g., expertise, competence, and experience of the farm manager; requirements for buildings and land; availability of sufficient (qualified) labor; arrangements for farm succession; and motivation and willingness of the farm manager to take risks; 2. Farm setting, e.g., acceptance and support on the farm, existence of local/regional (organic-specific) collection structures, storage and processing or marketing structures, and availability and proximity of expert advice; 3. Economic/political framework conditions, e.g., favorable political framework and market conditions, level of financing, and financing conditions. The type of farm (e.g., fodder production, cash crops, livestock, special crops) also plays a crucial role [
26,
67]. This range of factors influencing the conversion decision shows the multitude of opportunities and challenges in the development of organic farming. In addition to hard factors, soft factors such as acceptance and support in the operational environment indicate that emotions and sensitivities also play an important role [
26]. The influencing factor of downstream structures and actors in the value chain, such as buyers, storage, and processors, is one of the main focuses of this work.
Existing research on the spatial distribution of organic farming has attempted to explain the distribution in terms of various factors of influence. Although the change in the share of area or number of organic farms over time gives a general picture of the growth or decline of organic farming, there is a lack of spatial differentiation. Usually, the development of whole countries is presented in this way, although this is not very informative about the actual spatial development of organic farming in the respective country. Several existing studies show the spatial distribution of organic farming for different countries [
16,
17,
19,
21,
25,
50,
68]. For example, Läpple & Cullinan [
68] described the development and distribution of organic farming in Ireland, focusing on various factors (e.g., policy impacts, farming systems, soil quality, market access) that explain the development. The influence of the neighborhood effect on the distribution of organic farming as a comparison in England and Wales [
50] and in Germany [
21] are further contributions that address the spatial distribution of organic farming. To explain the distribution of organic farming, Ilbery et al. [
25] contributed and identified physical, structural, and sociocultural factors as key factors leading to different regional concentrations of organic farming. Based on their approach, Kujala et al. [
19] have shown the spatial distribution of organic farming in Finland and have further contributed to the understanding of the different factors influencing the concentration of organic farming by adding an economic factor as decisive for the spread of organic farming.
All of the above studies are based on recent third-party data. Agricultural surveys/censuses are not conducted annually. The level of detail also varies from country to country and year to year. The most common data sources in the articles are government agencies, so accuracy and completeness are not questioned, although there may be limitations. To show multifactorial spatial distributions more extensively through different maps, Läpple & Cullinan [
68] use not only producers but also meat processors, milk processing facilities, and main marts in one of their maps, but the source of the data for markets and processors is not apparent. Only Malek et al. [
69] pursued a similar approach to this paper. They display the global distribution of organic crop farmers using certificates from publicly available datasets. While there were issues with availability depending on the country, only the most readily available datasets were used. For Germany, no response was received. For the purposes of this work, the certificates were obtained from a different website, but only individual certificates and not a complete dataset.
A discrepancy arises when the development of organic farming is so multifactorial, but the presentation of its spatial distribution is reduced to the number of organic farms or the proportionate area. As a result, the development of organic farming is attributed to the number of farms or the size of the area alone, which would neglect other actors in the overall development process. While it is known that there are neighborhood effects on the diffusion of organic farming at the municipal level [
70], it is also known that the proximity to processing companies [
33] and the proximity to markets are crucial [
50]. Further, various actors are ascribed disparate opportunities to exert influence, including with respect to the potential for enhancing the resilience of agricultural systems [
71]. This shows the need to include the spatial distribution of multiple actors in order to understand the whole development process of the organic sector.
Depending on the scale, there may also be a lack of differentiation on a large scale due to a lack of data. By using certificates as a data source, some barriers could be overcome and targeted recommendations could be made to support rural development. The environmental impact of rural development measures can variously be assessed at different scales. Factors that may be considered successful at the national level may not be at the regional level [
72]. Furthermore, due to the diversity in landscapes and regions, large-scale assessment should be given priority.
Organic certification data is useful for looking at large-scale patterns in the distribution of each control sector. In the case of Germany, data availability is given, but data collection is very time-consuming, as there are no collected datasets, or they are not freely available. The significant lack of digitalization in organic farming is visible and may hinder the future competitiveness of organic farming. Evaluations using certificate data extend the spatial assessment of organic farming beyond the number of organic farmers or the proportionate area. This added value is considered crucial because the development of organic farming is determined by the complex construct of the organic sector. A one-dimensional approach to development processes would not do it justice. What exactly makes up the organic sector and how it is influenced by different actors needs to be analyzed in the future.
5. Materials and Methods
The data for this paper was gathered from the website of the ‘Bundesverband der Öko-Kontrollstellen e.V.’ (BVK) (Federal Association of Organic Control Bodies). In 2019, 15 of the 17 organic inspection bodies were represented in the BVK, which issues about 90% of all German organic certificates. In the process, 12,904 certificates were recorded for all 2062 postal codes in the state of Bavaria [
73]. This means that each certificate and the data it contains can be assigned to one of the 95 districts and district-free cities (Landkreise und kreisfreie Städte). The data recorded consists of the postal code, the city, the control sector(s), and the name of the organic inspection body. The data collection took place from February 2019 to June 2019.
The BVK offers on its website a query directory, which performs a query by entering the postal code or the company name (at least three letters) and returns all companies with the respective postal code or name. For each company the current, and if available the previous, certificates are provided. The total number of certificates per postal code cannot exceed 30, and according to the website, the limitation of the data output is justified as follows: “Please note that for privacy and data collection purposes, a maximum of 30 companies will be displayed. If you do not find the company you are looking for, please specify your search” [
74]. By specifying the search, it was still possible to obtain the certificates exceeding the 30 certificates.
In order to put the number of certificates into relation, the agricultural area in 1000 ha was used for each district or district-free city. These data were obtained from the Agricultural Structure Survey/Agricultural Census 2020. The same applies to the comparative map showing the percentage of organic farms to the total number of farms [
73]. This is not the same year as the certificate data collection, but data at a regional depth for district and district-free cities only appear every four to six years (2010, 2016, 2020). These data and the map created based on them are still useful to show trends and concentrations, as the change within a year is negligible for general comparisons.
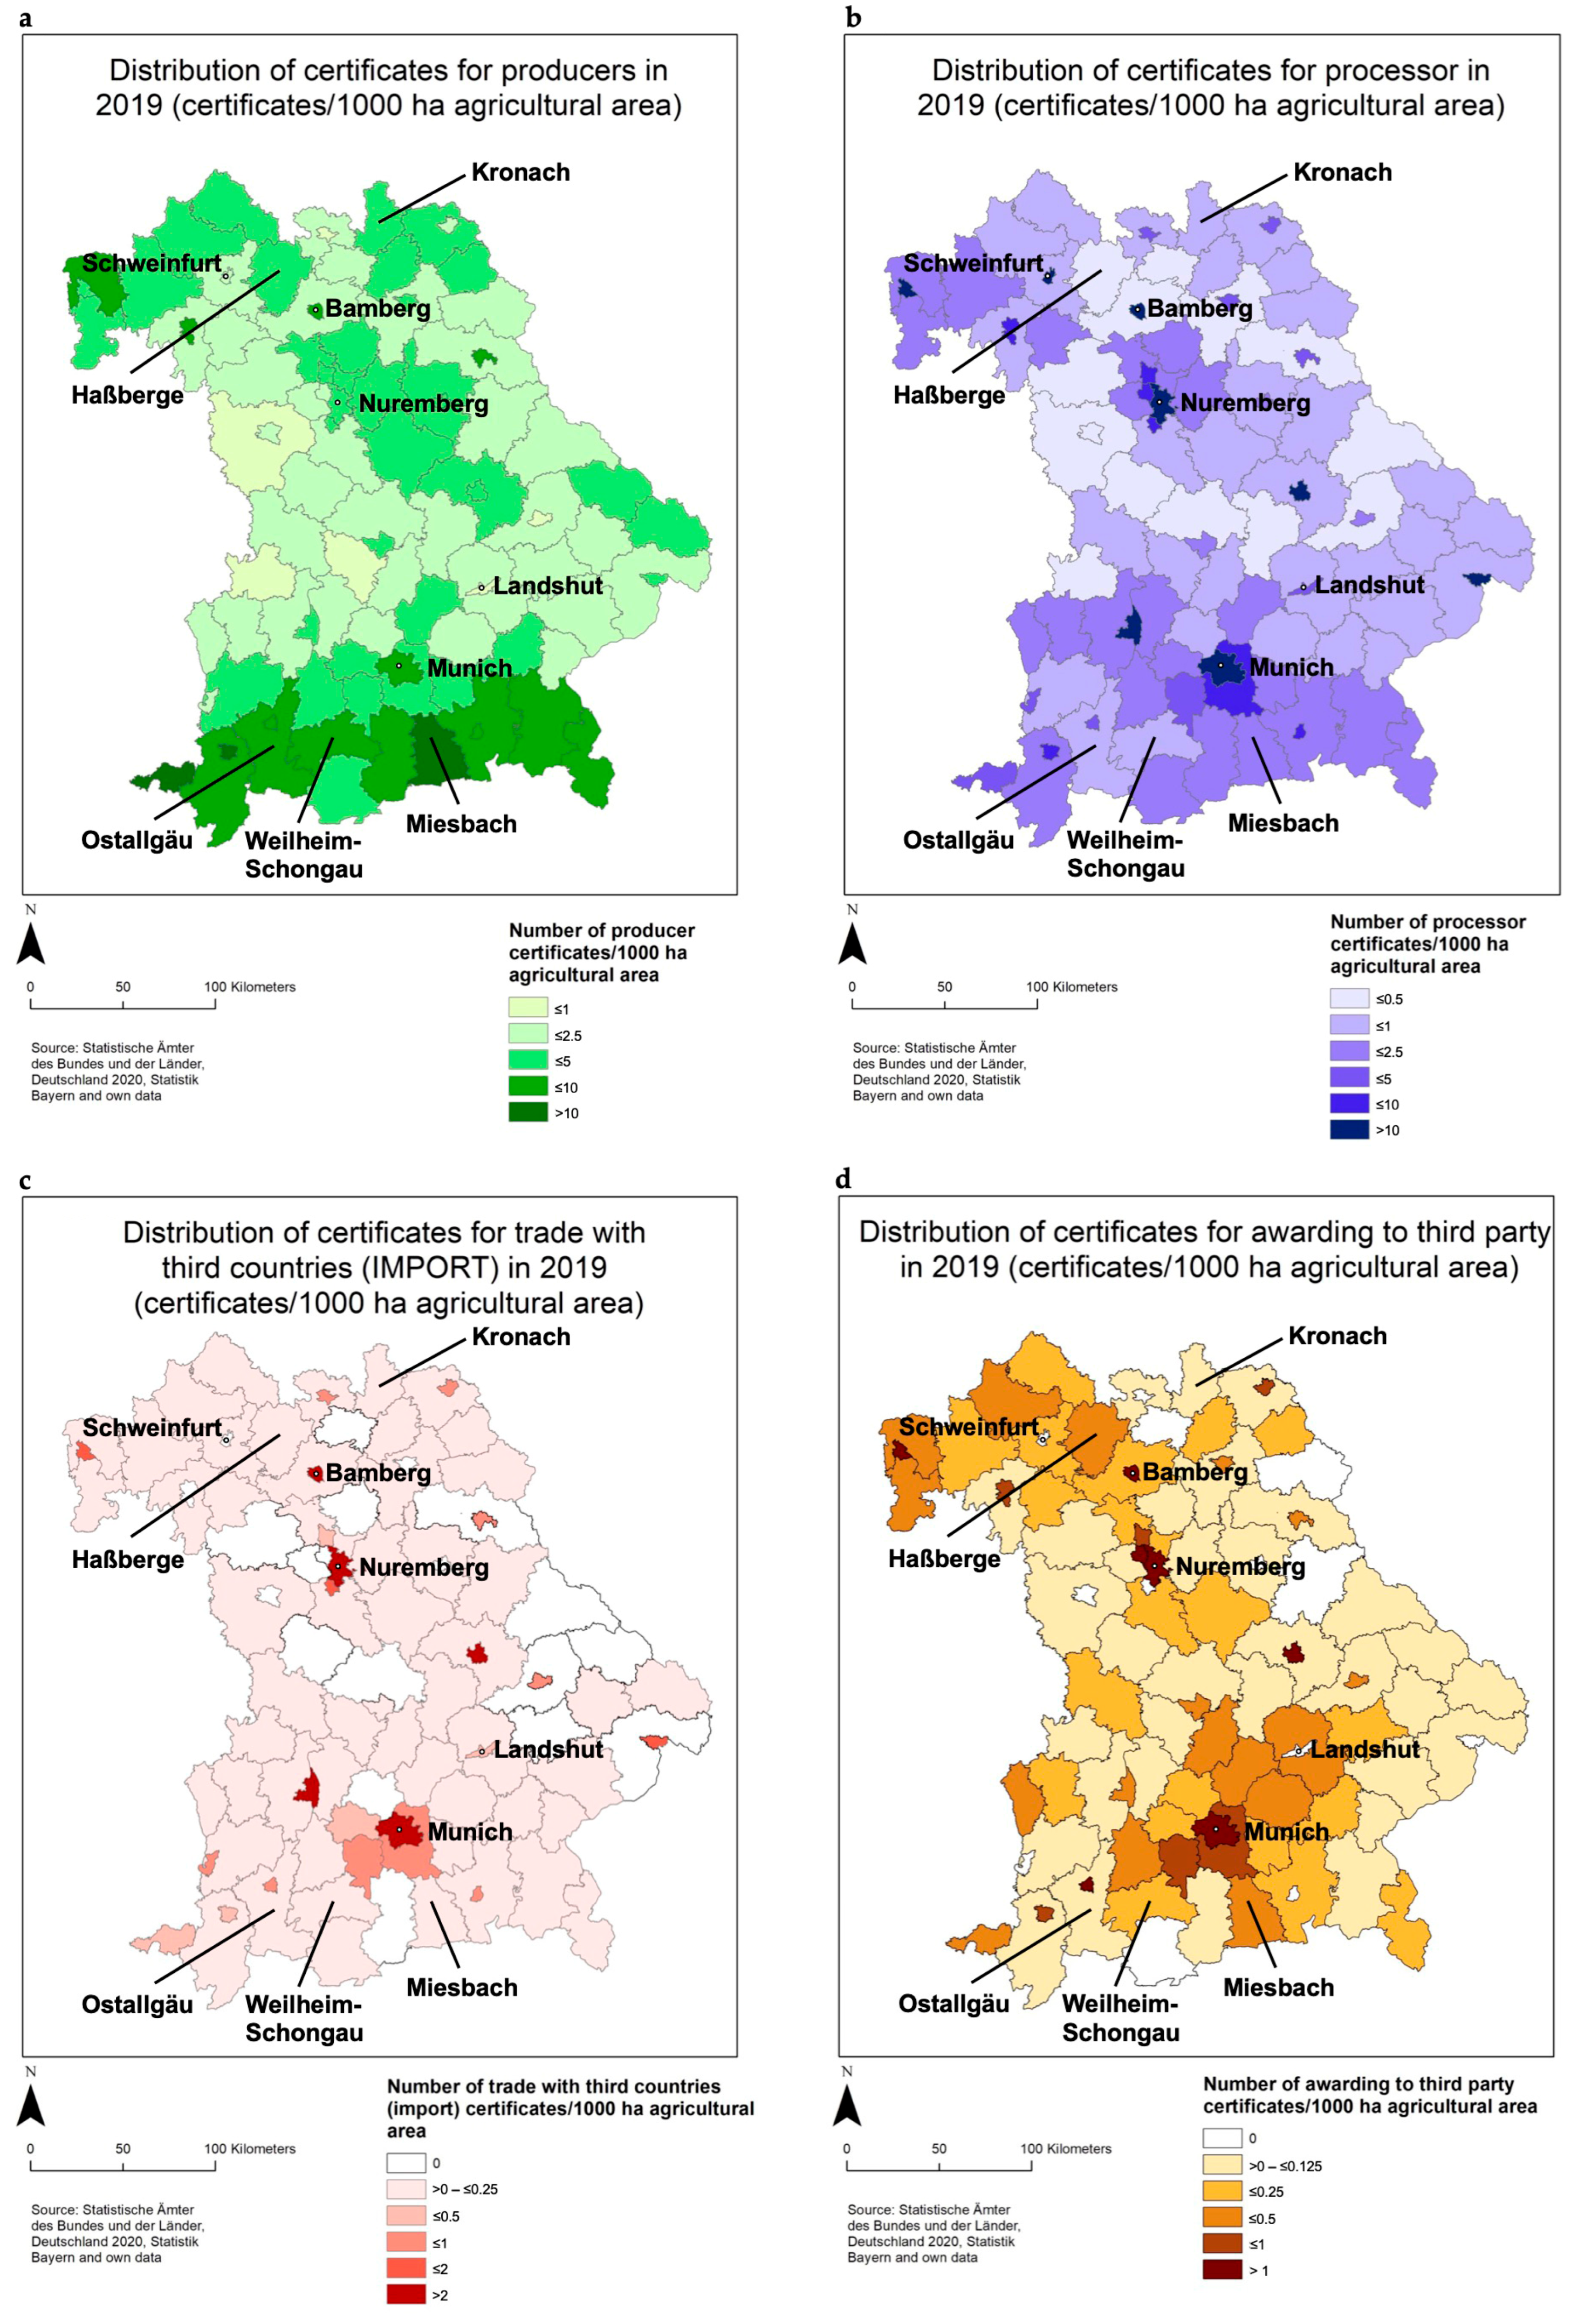
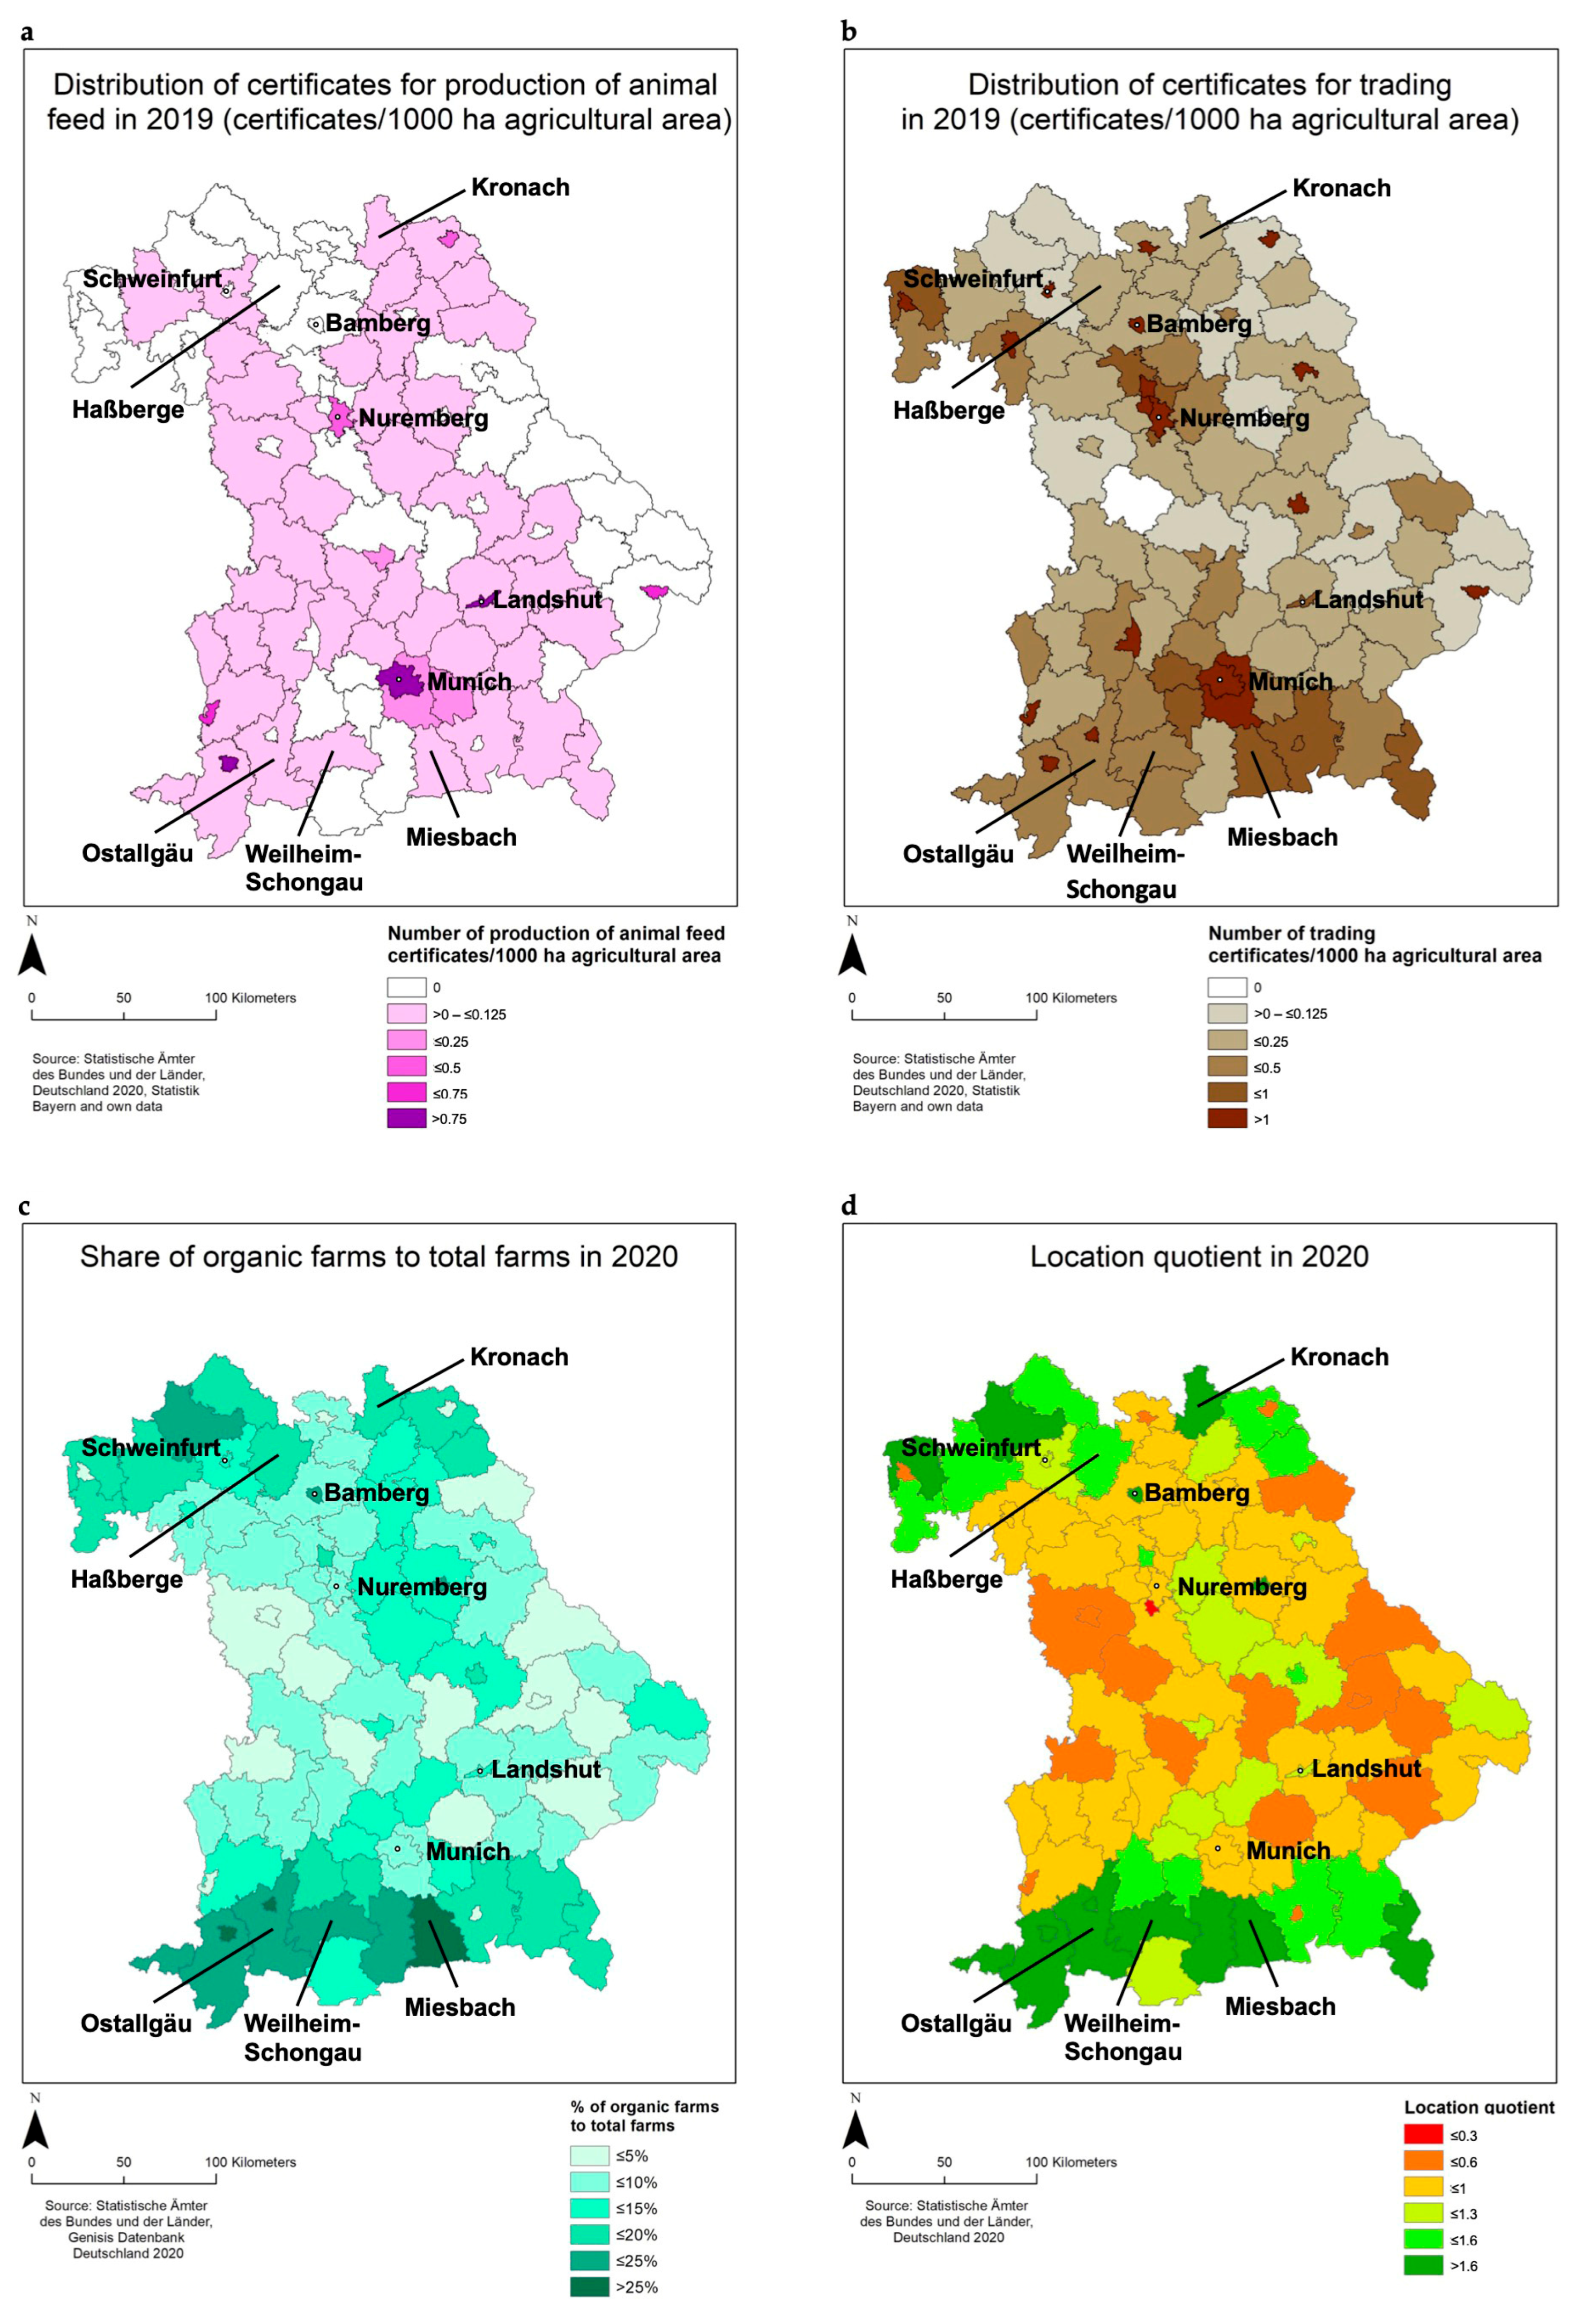
According to the information provided by the individual organic inspection bodies, the collected data have been standardized with regard to the terminology used in the control sector (main activity), as the exact choice of words is partly different depending on the organic inspection body. Each certificate has been added to one control sector; if multiple control sectors were certified, the certificate has been added to each control sector. As some farms were certified for several control sectors, 14,728 controlled sectors could be assigned to the 12,904 certificates that were recorded. For each control sector, the individual zip codes were then assigned to the corresponding district to obtain the number of certificates by control sector for all 96 districts. For each district, these values were then related to the agricultural area in 1000 ha. Although this leads to a stronger expression in the control sector of producers in regions with small-structured farms, the map with the share of organic farms in the total number of farms serves as a comparison. The tables that were generated for each of the control sectors were then uploaded into a geographic information system (GIS) (Esri ArcMap) and visualized. The resulting maps are shown in
Figure 2 and
Figure 3a,b. To put the values of the data into perspective,
Figure 3c,d are presented. The location quotient (LQ) (
Figure 3d) is used to show spatial concentrations and provides a comparative value independent of the size of the district or district-free cities. However, the LQ can only be used for the number of organic farms, as it sets the ratio of organic farms in a district to the total number of farms in this district, which in turn is set in a ratio of the total number of organic farms in Bavaria to the total number of farms in Bavaria. A value above one indicates a higher concentration compared to the Bavarian average, while a value below one indicates the exact opposite (also see [
68]).
To complement the descriptive mapping, we conducted a quantitative assessment of the relationships between actor groups across the 96 Bavarian districts and district-free cities. For each control sector, the number of certificates per district was related to the other sectors using correlation analysis. Pearson correlation coefficients were calculated to assess linear relationships, while Spearman rank correlations were applied as a robustness check. To account for structural size effects, actor counts were also normalized by agricultural area (certificates per 1000 ha). In addition, ratios such as producers per processor were calculated to highlight imbalances. This enabled the identification of spatial outliers and an assessment of whether certain actor groups co-locate.
6. Results
6.1. Spatial Distribution of Organic Sector Participants in Maps
The results, presented in the form of maps, are evaluated descriptively, since the aim is to display the different spatial distributions of the control sectors. This is done by describing how each of the eight maps distributes and exhibits distinct spatial patterns.
The distribution of certificates for the control sector producers (9278 certificates,
Figure 2a) clearly demonstrates a more pronounced distribution in the south and in the north. Almost the entire south has a high number of producers per area. The region around Nuremberg and southwest of it is a region with a proportionally lower number of producers. The western districts of Bavaria have the lowest number of producers. In the north there is a band of districts with a higher number of producers.
Among the processors (3501 certificates,
Figure 2b), there is a clear picture of high concentration within district-free cities that appear like islands in the surrounding districts, such as Munich or Nuremberg. Apart from these “islands”, there is a relatively high degree of homogeneity within Bavaria. However, there is a stronger distribution in the south. There are also many processors around Nuremberg and to the southwest of it, as well as in the far north. The districts with the lowest number of processors are located in the Midwest and in the East.
The spatial distribution of certified importers (trade with third countries, import) (292 certificates,
Figure 2c) is highly concentrated in the district-free cities. The largest cluster is in and around Munich. Apart from that, the distribution is very homogeneous, although there are a few districts throughout Bavaria in which no certificate has been issued for the control sector. The only district in the southwest that stands out is the district bordering Lake Constance.
The control sector for awarding to a third party (520 certificates,
Figure 2d) requires some explanation. Two peculiarities should be mentioned. 1. It is always certified together with one of the other control sectors. These are companies involved in, for example, transport, processing, or storage, which are also inspected as part of the certification process. It is not necessary for these companies, however, to have their own organic certification. 2. The company named in the certificate is not the service provider but the client, which means that its address is also listed in the certificate. The geographical distribution of the certificates therefore does not represent the spatiality of the service provider. The distribution is very scattered. There is a stronger presence in the district-free cities, although there are also district-free cities without a certificate. There is a cluster around Munich and a smaller one around Nuremberg. The northwest also shows a stronger distribution, while the entire west has no or very few certificates. There are also districts in the south with no or very few certificates.
In the control sector for animal feed (119 certificates,
Figure 3a), i.e., companies producing or marketing animal feed (not being agricultural producers), there is a significant number of districts (42/96) that do not contain any animal feed certificate at all. There is a higher concentration in some district-free cities. In eastern Bavaria there are many districts without a certificate, as well as in the central north and south. There are hardly any districts with a high number of certificates.
The control sector trade (1018 certificates,
Figure 3b) is for resellers who market products with reference to organic farming but are not producers. There is a high concentration of certificates in the district-free cities. In the south there are some districts with a higher concentration, while in the east of Bavaria there are districts with a lower number. There is only one district and one district-free city without a certificate.
Maps (
Figure 3c,d) serve as comparative maps. They display the share of organic farms in the total number of farms (
Figure 3c), the way organic farming is commonly presented in scientific papers. This again emphasizes that such a one-dimensional representation of the organic sector is only marginally sufficient, since this is only a part of the organic sector and the spatial distribution of the different control sectors is sometimes very different. Similarly, the location quotient map (
Figure 3d) points out a greater concentration of farms in the south and north and shows strong parallels to the maps in
Figure 2a and
Figure 3c, referring to the spatial distribution of the number of producers and the share of organic farms in the total number of farms.
6.2. Analysis of Influencing Factors for Distribution
The individual maps show different spatial distributions and patterns. The reasons for these differences and patterns are diverse and can be attributed to a variety of influencing factors such as natural conditions, historical development, infrastructure, company size, proximity to markets, political influence, population structure, and so on. Because these factors cannot be considered in isolation but rather interact with each other, the analysis of influence becomes even more difficult. However, there are some salient factors for each control sector that are listed here.
The high concentration of producers in the south is due in part to the proximity of the Alps, where high rainfall creates permanent grasslands that can be classically used for dairy farming. The number of farms is favored by the small size and three of the four largest organic dairies in Germany [
75], which facilitate the conversion decision as reliable processors. Northern Bavaria is also characterized by small farms. In addition, there are large urban centers such as Nuremberg and Frankfurt, which are good sales markets and thus could function as incentives for the conversion decision. It is also worth noting that the distribution of producer certificates (
Figure 2a) is similar to the distribution of the share of organic farms in the total number of farms (
Figure 3c). A strong distribution of organic farms in the south and north is also evident here. The map of producers also parallels the rather weak regions in the center, west, and east. The data in
Figure 3c are from the 2020 Agricultural Structure Survey, which covers 100% of all farms, but the spatial patterns are almost identical to
Figure 2a. Maps using data on the number of organic farms are analogous to those showing the number of producer certificates. This is obvious since the production of goods happens only at the farm level.
For the processors, there is a partially different distribution of certificates. Here, too, there are strong clusters in the north and south, although the distribution of processors throughout Bavaria is more even, and a different picture emerges from that of producers. However, the district-fee cities stand out, with a higher number of certificates for processors. Processor certificates fall into two categories. There are farms that are also certified as producers that have associated processing. The other type of processors are companies that specialize in further processing and then market these products directly or through an intermediary. The latter are often located in cities because of the large number of innovative companies that bring new products to the market. Infrastructure and purchasing power are also higher in cities, which is another reason for the high number of processing certificates in cities. However, size and revenue do not play a role in the data. Each certificate is valued equally. The similar pattern in the distribution of producers and processors supports the fact that farmers interested in conversion look around for possible buyers and processors in their area before being able to operate in a secure economic situation. Ideally, the processors are located in places where there are a lot of producers.
The given infrastructure in cities simplifies logistics for importers. The importers are from EU countries or third countries. Unlike producers and processors, where there is a clear logical link, importers are usually in a unique position. However, there are also links to processors or traders. Pure raw material is often imported and used by processors. The importer acts as a kind of wholesaler. Importers are also responsible for meeting domestic demand through imports. The reason for the certification of an importer is rather to guarantee the organic quality of products from third countries and to be able to trace the flow of goods. This is also to protect the organic products from fraud. The flow of goods has to be registered online in an EU database so that the flow of goods can be traced worldwide.
Unlike the other control sectors, certificates to third parties cannot be certified on their own. Therefore, the map of the distribution of certificates to third parties must be analyzed in a differentiated way since the organic enterprises are certified and thus located, which commissions the third-party company. However, this company may be located elsewhere and not appear in the BVK database as a certified organic company. Due to this fact, it must be mentioned that a large number of companies working for and within the organic sector are not covered by certificates. These can also be ’conventional‘ companies, which nevertheless comply with the regulations as companies for the respective activity related to organic farming.
The control sector of feed producers has by far the lowest number of certificates, with 119, and already a large gap to the next most common, import, with 292 certificates. Feed producers seem to be unimportant for the organic farming’s ideological approach, since organic farmers should produce most of the feed for the animals on their own mixed farm. However, purchasing feed is the rule rather than the exception. Therefore, for a farmer with livestock, in order to be able to buy regional products, feed producers play a crucial role. However, the extent to which the individual components of the feed actually originate from local, in this case Bavarian, production is not evident and must be inquired about by each farmer at the animal feed company. Thus, feed producers have a direct link to production (livestock farming) and play a critical role in sustainability issues through production, transportation, composition, and regionality.
Again, due to infrastructure and demand, the spatial distribution for trade in Bavaria shows a higher concentration in cities and adjacent districts. Especially around the cities of Munich and Nuremberg, there is a high number of traders. As a link in the agri-food chain, trade plays a crucial role as one of the ways to distribute the produced goods. Since this also includes products offered over the internet, they may be products that have no regional reference. The number of organic certifications for traders is the third most common after producers and processors in the control sector. This shows that, in addition to producers and processors, many traders of organic products have established themselves in Bavaria. Again, the size of the company or the amount of revenue it generates is not a factor in the distribution patterns.
6.3. Cross-Actor Relationships and Value Chain Balance
The cross-actor analysis confirms strong clustering among downstream actors. Processors and trade show a very strong correlation (r ≈ 0.96), as do processors and importers (r ≈ 0.95), and trade and importers (r ≈ 0.94). This indicates that processing, trading, and import activities tend to co-locate in urban centers such as München, Nürnberg, and Bamberg. A moderate correlation is also observed between processors and awarding to third parties (r ≈ 0.70), suggesting that service infrastructures follow processing activity. These results are summarized in
Table 2.
In contrast, the relationship between producers and processors is weak in absolute numbers (r ≈ 0.15). Several rural districts such as Miesbach, Ostallgäu, and Kronach are producer-heavy, while urban centers such as München, Bamberg, and Schweinfurt are processor-heavy. This imbalance illustrates the structural dependency of rural production regions on urban processing hubs. However, once normalized by agricultural area, producer and processor densities align strongly (r ≈ 0.89), suggesting that land availability, rather than a true disconnection, explains much of the imbalance. Overall, these results underline the spatial interdependence between rural and urban areas in the organic sector and highlight where the value chain is regionally unbalanced.
7. Discussion
7.1. Limitations of Approach Presented
The paper criticizes the limited number of indicators used to date for measuring organic farming with the share of the number of farms. The fact that there is no further specification of the individual farms, however, is the same in the maps produced for this work.
For example, the certificates do not differ by farm size, number of employees, or volume produced or traded. Thus, each certificate is equated to a producer, which does not take into account agricultural and business conditions.
The situation is similar for producers. It does not matter whether it is a farm that processes small quantities of one product and sells it in its farm shop, for example, or whether it is a large industrial company that processes large quantities and a large number of goods. This restriction applies to all control sectors. In addition, there are two limitations for the control sector awarding to third parties, as already mentioned in the
Section 6.2 for this control sector. First, the address given in the certificate is not that of the service provider but that of the client. Second, the service provider is also inspected but not certified as part of the organic certification process.
Due to data availability, this work is based on 90% of all certificates issued in Bavaria in 2019. The process of data retrieval is also rather time-consuming and therefore a limiting factor for rapid spatial analysis. The analysis provides a static snapshot rather than a current depiction of the sector. However, the methodological contribution lies in showing how such data can be mobilized for relational spatial assessment. The same approach can be repeated for future years to trace temporal developments.
The challenge of map presentation is also limiting. The number of certificates must be in the same ratio for all maps. One could use other parameters such as population or district area. Since this work is basically about agricultural processes, the agricultural area was used as a parameter. This has limitations in the sense that some maps show a high concentration of certificates in the district-free cities. Since the agricultural area is usually very small there, this can quickly lead to a high ratio. On the other hand, it is important to note another parameter, such as population, might distort the map in another direction. The maps should therefore be considered and compared with each other. Nevertheless, in this work, the two comparative maps (
Figure 3c,d) have been used to show the spatial distribution when using commonly used parameters such as number of farms or organic area. Here again, the location quotient (
Figure 3d) serves as a useful measure for assessing the proportional distribution of organic farmers.
Further analysis of the maps, which aim to describe the reasons for the distributions, must be conducted with great care and consideration, as it is exceedingly challenging to accurately represent the intricate nuances of the agricultural context. Additionally, it is imperative to recognize that the spatial presentation of actors provides only a limited insight into their connections to other actors.
7.2. Advantages of the Approach
The approach in this paper is valuable for an in-depth, large-scale analysis of organic farming. It broadens the spatial understanding of other activities and actors in the organic sector. For a functioning and effective organic value chain, secure buyers for the produced organic products and proximity to processors are crucial. Thus, the spatial location of processors, i.e., control sector processors, is helpful in identifying patterns and possibly supporting the establishment of processors, thereby stimulating the conversion rate to organic farming. The processing companies should ideally be located close to where the raw material is produced in order to also take into account sustainability aspects in transport or marketing. The influences of the individual control sectors on the large-scale structural development of organic farming must be investigated and understood in more detail in the future. This will enable recommendations to be made on how structurally weak regions can benefit from the organic commodity chain through targeted agricultural development measures and thus pursue sustainable regional development.
The added cross-actor analysis demonstrates that certification data can be mobilized not only for descriptive mapping but also for relational spatial assessment. Strong downstream clustering (processors–trade–importers) and the rural–urban division of labor confirm established agri-food patterns, yet our results quantify the magnitude of these asymmetries and highlight extreme outliers. Particularly striking is the strong correlation of producer and processor densities (r ≈ 0.89), which reveals a structural alignment hidden by raw counts. This shows how a relatively simple relational analysis adds explanatory depth and provides new insights into value chain dependencies.
If this paper were to show the spatial distribution of organic farming based on data, as in the work of Ilbery and Maye [
50] or Blaće et al. [
17], it would look most like
Figure 2a, producer certificates, or
Figure 3c, share of organic farms to total farms, for Bavaria. The other control sectors, however, demonstrate different spatial distributions. These observations point to various networks between actors of different control sectors in distinct regional contexts. The spatial distributions also show different dynamics, which in turn are influenced by multiple factors and thus can be considered individually, but due to the interconnectedness and interdependence within the entire organic sector, they must be considered in the context of the overall development. For future studies, it is necessary to identify the individual factors that determine the development of each control sector, which can further contribute to the discussion on the development of the organic sector.
The organic sector consists of a variety of actors and is an evolving social process shaped by the interwoven relationships between them. In addition to their detailed list of actors that constitute the organic sector for them, Darnhofer et al. [
18] also call for a focus on the relationships between different actors and actor groups. The authors use this relational perspective on the basis of very influential groups and relevant and decisive actions. In doing so, they neglect the spatial perspective and its influence. However, this work shows that spatiality has an influence and that the spatial distribution of different actors, in our case along the value chain, is inhomogeneous and highly relevant. The connections and interactions between the different actors in each context will determine how organic agriculture develops in the future, rather than the individual actions of farmers or other organizations [
76]. Similar markets and consumer preferences evolve together, and actors, producers, sellers, and consumers influence how they change [
77]. Further projects should attempt to show the relationships between a very large number of actors. This would allow for a better understanding of the dynamics, influences, and barriers of the organic sector.
Through a better understanding of the organic sector and the spatial distribution of actors, spatially better targeted policies could be developed to exploit the benefits of organic farming for rural development. The common policy expectation that conversion to organic farming will automatically develop the entire organic sector is naïve and does not necessarily lead to benefits for rural development. The challenges (data availability, digital accessibility, spatial distribution of actors, relationships between actors) for large-scale, multi-actor analysis need to be overcome in order to understand the future networks and pathways of influence of organic farming and to promote rural development in a targeted way.
8. Conclusions and Outlook
Organic farming has found its way into many political programs as a sustainable form of agriculture at the EU, member states, and, in the case of this work, federal state level in Germany (Bavaria). Not only are positive environmental characteristics attributed to organic farming, but also socio-economic effects and added value for rural development. Organic farming can therefore be promoted within the framework of the CAP through environmental services as well as added value for rural development.
In this context, organic certificates play a crucial role as a regulatory instrument to ensure compliance with the standards in order to achieve the objectives of the programs. The impact of the policy is measured almost exclusively in terms of the share of organic farming in total agriculture, even though the associated strategies and the ‘Action Plan for the Development of EU Organic Production’ include a large number of measures with environmental, economic, and social impacts. This is because the factors for the development of organic farming are manifold, as is the decision to convert to organic farming.
For an adequate assessment of the development of organic farming, including its influence on rural areas, as well as for a more comprehensive evaluation of its impacts, a spatial analysis of more actors than just producers is required. However, this is hampered by the availability of data, which is overcome in this work by using EU organic certificates. This allows us to spatially map and show the distribution of several actors in organic agriculture, divided into their respective control sectors within certification.
The results are visualized in maps with different distributions of certified farms/enterprises depending on the control sector. While the number of producers is particularly high in the north and south of Bavaria, processors tend to be concentrated in urban areas. Traders, importers, and certificates for services are also mainly located in and near cities. The distribution of certificates for feed production does not show a clear pattern, although they also tend to be located in cities.
Such datasets make it possible to present spatial information from a larger number of actors and are therefore very useful for scientific studies. They also offer the opportunity to conduct more comprehensive impact analyses and thus to make more targeted, large-scale policy recommendations that take greater account of the interconnectedness and ramifications of the organic sector.
The targets set out in policy strategies cannot be adequately verified using the currently monitored indicators of the number of farms and the size of the organically farmed area. On the evidence of scientific research, we know that the overarching objectives pursued, such as biodiversity and habitat protection, rural development, the improved position of farmers in the agri-food system, and the production of healthy food and other ecosystem services for EU citizens, are the result of a complex interplay of multiple components. The parameters that have been set for meeting the EU’s objectives are in fact a shortcoming. These datasets are jumping short in relation to reality’s complexities of conversion processes and decisions and long-term farm success.
The flipside of the coin of policy strategies is financial support for rural development, farms/companies, and nature conservation. The currently very rough data situation poses a massive difficulty in this regard, as the spatial allocation of data in large spatial containers does not allow for targeted and efficient support of rural areas. Besides insufficient data complexity, the access to data poses problems, as the data basis is collected and secured in numerous segregated administrative bodies on the one hand and complicated to collect via digital ports on the other hand.
The EU Green Deal funding instruments leave flexibility to the subsidiary political decision-making units to set priorities for funding. This leeway, which from a rural development perspective appears reasonable, enables locally divergent circumstances to be balanced out in a targeted manner. This advantage can only be used efficiently if detailed data is available that can be spatially localized and differentiates between specific actors in the agri-food network. To date no reasonable data-based option to analyze the efficiency of these rural development policies is available, which leads to a barrier for extensive evaluations.
It is important to note here that the analysis is based solely on certification data and offers a static view of spatial patterns without examining the underlying causal factors or actor interactions. The main theoretical contribution of this work lies in applying a large-scale, multi-actor spatial perspective to the organic sector, moving beyond the narrow producer focus common in existing research. Practically, the findings offer a new evidence base that can support more targeted rural development and environmental policies and provide a foundation for further research on the complex, multi-scalar dynamics of the organic sector.
The aim of this paper is to make this kind of spatialized and differentiated data on the organically certified sector available for the German state of Bavaria and thus open up possibilities of further inquiry. Based on this dataset, a range of follow-up studies are possible to be conducted. First of all, it would be desirable to generate comparable databases in other federal states in order to carry out comparative studies across federal states. Second, this data is relatable to other existing datasets on the district level, e.g., soil type, inhabitants, or purchasing power, in order to generate mappings. As research in relational economic geography reveals that besides geographical closeness, also the quality of relationships are important conditioners of successful local economic value generation, these analyses give valuable information about the formation of local alternative food networks, decision-making in conversion to the organic sector, and long-term farm development and economic success.
Furthermore, future research could examine spatial heterogeneity in greater depth, for example, by considering how variations in regional resource endowments or policy frameworks influence the distribution of certified entities. This could also involve using qualitative data to explore regional contrasts and gain insights into local conditions, informal institutions, cooperation models, or the role of agricultural associations in shaping these patterns. Incorporating spatio-temporal perspectives could reveal development trajectories, while mapping relational networks between different types of actors, such as leading enterprises, producers, processors, and traders, could help to identify geographical association networks and spatial value chains.