


Abstract
With China’s dual carbon goals of “carbon neutrality” and “carbon peak”, the role of digital agriculture in agricultural carbon emissions has drawn increasing attention. In this study, we construct a model to explore how the level of digital agricultural development affects agricultural carbon emissions by improving efficiency (agricultural labor productivity and agricultural production technical efficiency). In this study, data of 31 provinces in China from 2010 to 2021 are used for model testing. The results show the following: (1) the level of digital agricultural development significantly reduces agricultural carbon emissions; (2) agricultural labor productivity acts as a full mediator, whereas agricultural production technical efficiency plays a partial mediating role in this relationship; (3) an analysis of regional differences shows that digital agriculture development is associated with a greater decrease in agricultural carbon emissions in East and North China. Conversely, compared with South, Northeast, and Northwest China, Central and Southwest China register greater emission reductions from digital agriculture. Therefore, it is necessary to fully explore the positive impact of digital agriculture on agricultural carbon emission reduction and promote the development of low-carbon agriculture in China.
1. Introduction
Global warming is becoming a major challenge that humanity is addressing together. Among all the industries affecting global climate change, agriculture has long played a special and crucial role. On the one hand, agriculture is the second most important source of greenhouse gases [1]. On the other hand, climate warming severely affects the yield of crops and the quality of agricultural products [2]. China is among the leading global emitters of greenhouse gases and is a major agricultural country; thus, the issue of agricultural carbon emission reduction urgently needs to be addressed. At present, digital technology and agriculture are constantly integrated into various fields. Digital technology is reshaping the traditional agricultural model in many ways, from the production end of the industrial chain to the governance system. Since the development goal of “digital agriculture” was proposed by the Chinese government, the application scenarios of digital agriculture in agricultural management and agricultural production have been continuously expanding. This provides a new opportunity for transforming the mode of agricultural development and reducing agricultural carbon emissions. Therefore, we believe that the level of development of digital agriculture is an important driver of agricultural carbon emission reduction.
Studies on agricultural carbon emissions fall into two main categories. One type focuses on the measurement and temporal and spatial differences in the level of agricultural carbon emissions [3,4,5,6,7,8,9]. Another type explores the main drivers of agricultural carbon emissions. Agricultural carbon emissions are arguably influenced by digital financial inclusion [10,11], government fiscal intervention [12,13,14], the transition to green growth [15,16], demographic changes [17,18,19], and energy consumption intensity [20,21,22,23].
Studies have focused widely on the driving factors of carbon emission reduction in agriculture. However, against the backdrop of China’s “big country with small-scale farmers”, there is no consensus on whether, or how, digital agriculture influences agricultural carbon emissions. Digital agriculture mainly optimizes production decisions (such as precise fertilization, intelligent irrigation, and agricultural machinery scheduling) and reshapes the agricultural production process through technologies such as the Internet of Things (IoT), big data, and artificial intelligence (AI), with a focus on efficiency reform on the supply side. However, previous studies have focused more on the impact of the external environment (government financial intervention, demographic structure change, and digital inclusive finance) and production mode (green growth transformation and energy consumption intensity), which emphasize changes in institutional and socioeconomic dynamics. In this study, we aim to bridge these gaps and shortcomings. The aim of this study is to develop a driving model that explores how the level of digital agriculture affects carbon emissions in agriculture through agricultural labor productivity and agricultural production technical efficiency. The purpose of this study is to explore the following questions.
First, this study explores the extent to which the development of digital agriculture impacts agricultural carbon emissions. Previous studies on the relationship between digitalization and carbon emissions have focused mostly on the industrial and service sectors [24,25,26,27,28,29,30,31], which are less involved in agriculture. Compared with integrating the industrial and service sectors with digitalization, integrating agriculture with digitalization is slower. Therefore, the impact of the development of digital agriculture on agricultural carbon emissions needs to be further analyzed. Additionally, unlike developed countries, which have large-scale cultivation and mechanized operations, China’s agricultural development has certain unique characteristics. On the one hand, the foundation for the development of digital agriculture in China is weak and is still in its infancy. Some time is needed to achieve the transformation from a model guided by agricultural experience to one oriented towards digital technology in agricultural production practices; agriculture in China is typically practiced by small-scale farmers. On the other hand, the supporting facilities and policies for agricultural carbon reduction in China, such as the agricultural carbon trading market and agricultural carbon tax, are still not fully developed. Thus, good environmental support for agricultural carbon emission reduction is lacking. Therefore, exploring the impact of the level of digital agricultural development on agricultural carbon emissions in China helps extend the discussion about the factors affecting agricultural carbon emissions.
Second, empirical support is demonstrated for the mediating mechanism, whereby “the development level of digital agriculture affects agricultural carbon emissions through agricultural labor productivity and agricultural production technical efficiency”. Some studies have focused on the mediating role of factors such as the digital inclusive finance [32], agricultural industrial structure [33], green technology innovation and appropriate scale operations [34,35,36,37], as well as factor inputs and human capital in the relationship between digital agriculture and agricultural carbon emission reduction [38,39,40]. However, few studies have analyzed this relationship from the perspective of production efficiency, particularly the differences in the role of different types of efficiency. We argue that digital agriculture reduces carbon emissions from agriculture through efficiency improvements. For example, the application of technologies such as sensors and the IoT has achieved precision throughout the entire agricultural production process. The application of unmanned agricultural machinery, intelligent sprinkler irrigation and other equipment has reduced resource input. Data platforms can dynamically analyze the sources of carbon emissions and support scientific decision-making. Agricultural labor productivity and agricultural production technical efficiency significantly improve in these processes, which in turn affects agricultural carbon emissions. Compared with other factors, labor productivity and technical efficiency not only capture human–machine synergy in digital agricultural development more precisely, but also align with China’s practical need for labor-saving and efficiency gains for an ageing workforce, while aligning with the national policy orientation of “storing grain in technology”. Therefore, we start from the perspective of efficiency and analyze the differences between human and technological efficiency. This information helps reveal the “black box” of the impact of digital agriculture on agricultural carbon emissions and enriches the mechanism of agricultural carbon emission reduction.
Third, heterogeneity analysis changes the traditional classification commonly used in economics by most scholars (dividing China into four categories: East, Central, West, and Northeast), replacing it with seven regions: East China, South China, Central China, North China, Northeast China, Northwest China, and Southwest China. The diversity of China’s geography and climate has led to varying levels of digital agriculture and agricultural carbon emissions in different regions. For example, the promotion pathways of digital agricultural technologies differ significantly between Southwest China (abundant in mountains and hills) and Northeast China (predominantly plains). The optimization potential of the multiple cropping index in the tropical climate zone of South China is greater than that in the temperate zone of North China, with distinct carbon mitigation mechanisms between the two regions. Furthermore, the traditional Western Region encompasses both the “topographically complex Southwest China” and the “plateau-dominated Northwest China”, which demonstrate substantial divergences in energy composition and advancement rates of agricultural digital transformation. Therefore, analyses that disregard these regional distinctions are likely to produce biased conclusions. Dividing China into seven major geographical regions helps to more accurately identify suitable paths for digital agricultural technologies, which can better match the characteristics of the terrain, climate, and agricultural structure and provide experience for differentiated carbon reduction policies.
- ▪
- To what extent can the level of digital agriculture development have an impact on agricultural carbon emissions?
- ▪
- How can the agricultural labor productivity and the agricultural production technical efficiency provide differentiated transmission mechanisms between digital agriculture and agricultural carbon emissions?
- ▪
- How does the level of digital agriculture development in different regions affect agricultural carbon emissions?
Combining the above three key issues, this study is structured as follows: Section 2 discusses the mechanism of digital agriculture affecting carbon emissions and puts forward research hypotheses. Section 3 describes the variable selection, models, data sources, and the measurement methodology. Section 4 is the empirical study. Section 5 presents the research conclusions and policy recommendations.
2. Theoretical Analysis and Research Hypotheses
The pathway through which the level of digital agricultural development affects agricultural carbon emissions via efficiency can be explained by resource allocation theory [41]. This theory posits that societal resources are scarce. To achieve the optimal allocation of resources, it is necessary to improve the utilization efficiency of production factors to maximize economic, social, and environmental benefits.
The essence of digital agriculture lies in integrating technologies such as the IoT, big data, and AI into all stages of agricultural production. Improving efficiency optimizes decision-making and reshapes agricultural processes. Digital agriculture provides critical resources such as technology and tools for agricultural development. Decision-support systems that enable precision fertilization, smart irrigation, and agricultural machinery scheduling increase the allocation efficiency of agricultural resources (e.g., technology and labor), consequently reducing agricultural carbon emissions.
In light of this, and building on the research logic of technology adoption, the following sequence of actions is proposed: increase in efficiency → environmental performance improvement. In this study, a theoretical framework of digital agriculture is proposed: increase in efficiency → agricultural carbon reduction (see Figure 1).
Figure 1.
Theoretical logical framework.
2.1. Direct Effect of the Level of Digital Agriculture Development on Agricultural Carbon Emissions
Digital agriculture makes the agricultural production process more accurate and efficient through the use of modern high technology. Digital technology is widely used in crop growth monitoring, pest control, and other applications [42], and AI, big data, cloud computing, and other intelligent technologies can effectively help producers carry out more accurate agricultural production operations and optimize resource allocation while minimizing resource waste, increasing the quality and production of agricultural products. Second, digital technology can facilitate intelligent analyses of crop storage and processing through multiple sources of data, such as soil, crop and market data, provide producers with more scientific cultivation suggestions and sales strategies, thereby improving the agri–industrial structure. Additionally, the implementation of a convenient and quick intelligent management system can allow monitoring of the growth and development of crops in real time, enabling agricultural producers to more accurately capture the dynamics of agricultural production, which reduces the application of agrochemicals as well as the pollution of soil and water bodies. Moreover, strengthening the multidimensional construction of digital technology facilities can also foster the advancement of a circular economy via the secondary utilization and nutrient extraction of livestock manure, crop residues, and other agricultural wastes for conversion into usable resources [43]. This approach can extend the use of these factors, effectively reducing resource waste, reducing greenhouse gases such as CO2, protecting the agroecological environment, and improving agroecosystem stability.
H1.
The level of digital agriculture development has a significant inhibitory effect on agricultural carbon emissions.
2.2. Indirect Effects of the Level of Digital Agriculture Development on Agricultural Carbon Emissions: Mediating Mechanisms
We contend that digital agriculture reduces agricultural carbon emissions through efficiency gains, which are mediated primarily by two pathways: agricultural labor productivity and agricultural production technical efficiency.
The carbon emission reduction pathways of agricultural labor productivity and agricultural production technical efficiency differ fundamentally in their mechanisms. Agricultural labor productivity—measured as incremental output per unit labor input—primarily mitigates emissions through labor substitution. This enables scaled farming operations, subsequently reducing carbon intensity per unit area. Conversely, agricultural production technical efficiency, defined as the ratio of realized output to maximum feasible output under optimal technology deployment (i.e., the production frontier), is reduced by releasing the potential of technology, in which technological elements (e.g., precision systems) directly displace carbon-intensive resources, such as fertilizers and pesticides, and directly displace carbon-intensive inputs, including synthetic fertilizers and pesticides.
The use of advanced intelligent detection platforms and other technologies, rational crop control, scientific fertilization, water-saving irrigation, and other measures can effectively increase the number of products produced per unit of land area, enabling agricultural producers to utilize resources more efficiently. Through the application of digital technology, agricultural product-processing enterprises can effectively improve labor productivity and reduce energy consumption; with improvements in energy efficiency, producers can invest more energy and funds to develop novel technologies that save more energy, are environmentally friendly, and significantly reduce carbon emissions. The application of digital technology increases productivity for producers [44], which can help agricultural production become more energy-efficient and green and replace energy-intensive industries with low-carbon industries, thereby promoting biodiversity, achieving ecological protection and improvement, and reducing agricultural carbon emissions.
With the continuous development of science and technology, digital technology and artificial intelligence have been widely used in agriculture, and agricultural robots can currently replace farmers in performing various complex operations in the field. With the help of digitalized agricultural equipment, production costs can be reduced [45], and the efficiency of production technology can be improved, making agricultural production methods more efficient and environmentally friendly. Moreover, advanced agricultural production technology can effectively improve the quality and yield of crops and reduce the consumption of resources while meeting the needs of farmers. To implement these measures, the application and popularization of digital agriculture is indispensable, and more advanced technological equipment is required to more accurately control the agricultural production process, thereby reducing excessive energy consumption.
Conversely, agricultural labor productivity and agricultural production technical efficiency exhibit mutually reinforcing dynamics.
First, the technical efficiency of agricultural production increases agricultural labor productivity. Digital agriculture technologies increase labor efficiency through two mechanisms:
- (i)
- labor substitution (e.g., autonomous machinery and harvesting robots reduce manual labor requirements) and
- (ii)
- labor augmentation (e.g., AR-enabled skill training increasing output per labor hour).
Simultaneously, gains in agricultural labor productivity generate positive feedback loops for the technical efficiency of agricultural production. The operational economies of scale achieved through heightened labor efficiency dilute fixed costs of technology adoption (e.g., IoT infrastructure per unit area), whereas standardized workflows increase algorithmic precision—collectively amplifying returns to technological inputs.
H2.
The level of digital agriculture development can inhibit agricultural carbon emissions by increasing agricultural labor productivity and the agricultural production technical efficiency.
3. Research Design
Digital agriculture is a typical application of upgrading and transforming traditional industries in various new ways in the context of the digital economy. Digital agriculture involves digital information technology and agricultural production, sales, storage, and other aspects of effective integration to achieve the efficient utilization of agricultural resources, reduce production expenses, and enhance the ecological environment. Currently, China’s digital agriculture is developing quickly, with research organizations developing a range of key and practical agricultural technology products. These products have yielded important results in terms of agricultural information collection, crop growth and development, and agriculture macromonitoring, thereby promoting the modernization of agriculture in China.
3.1. Variables Selection
3.1.1. Core Explanatory Variable
The level of digital agriculture development (DAL). To measure the level of development of digital agriculture, it is necessary to consider many aspects in depth. As consumer demand for high-quality agricultural products continues to grow, the market tends to pay more attention to the quality and traceability of agricultural products. When the government formulates relevant policies, it pays more attention to the distribution and consumption of agricultural products. This is because it is directly related to the income of farmers and the well-being of consumers, whereas the policy orientation is more focused on the development of digitalization at the consumer end. Additionally, in this study, the composition of the indicator system was determined by drawing on the research of several scholars [46,47]. The construction of infrastructure is a typical measure of the development of digital agriculture, economic efficiency is a constant driving force for the development of digital agriculture, and green production is an important guarantee for the sustainable development of digital agriculture.
Some scholars use principal component analysis to calculate weights and obtain accurate results [48]. However, the indicators related to digital agriculture in this study involve multidimensional data. Compared with other methods, the entropy method is more capable of objectively processing such complex data. Therefore, in order to obtain more accurate results, this study chooses the entropy method to calculate the weights (all indicators are positive indicators, and negative indicators are not involved). The specific indicators and their measurements are shown in Table 1.
Table 1.
Digital agriculture development evaluation indicator system.
The specific steps are as follows [38,49].
- ①
- The n evaluation indicators of m provinces are arranged into the original data matrix in a certain order, where 1 ≤ i ≤ m and 1 ≤ j ≤ n.
- ②
- The extreme value method was chosen to de-measure the data for standardization.
- ③
- The positive indicator data were subjected to coordinate levelling.
- ④
- The weight of each indicator is calculated.
- ⑤
- The entropy values for each indicator are calculated. If the data are panel data, m here is equal to the product of the number of years and the number of provinces.
- ⑥
- The coefficient of differentiation is calculated for each indicator.
- ⑦
- The differentiation coefficients were normalized to calculate the indicator weights, where .
- ⑧
- The final score is derived by weighted summation based on the indicator weights and the normalized panned values .
3.1.2. Explained Variable
Total agricultural carbon emissions (ACE). In this study, we use the logarithmic value of agricultural carbon emissions to determine and compare emission levels across different provinces. Agriculture in this study is narrowly defined as farming. On the basis of the high input characteristics of China’s agricultural production, carbon emissions from agriculture generally originate from six main sources. First, carbon emissions are produced from fertilizer production and application. Second, carbon emissions are produced from the production and use of pesticides. Third, carbon emissions are produced from the production and use of agricultural films. Fourth, fossil fuel is directly or indirectly consumed through the use of agricultural machinery, which refers mainly to carbon emissions from agricultural diesel. Fifth, in the process of agricultural production, ploughing operations destroy the original structure of the soil’s organic carbon pool, leading to the release of a large amount of organic carbon into the atmosphere in its gaseous form, which in turn creates carbon emissions. Sixth, the acquisition and use of electrical energy in irrigation operations indirectly trigger the consumption of fossil fuels, which leads to carbon emissions [50,51,52,53,54]. Therefore, carbon emission sources can be summarized as fertilizers, pesticides, agricultural films, diesel fuel, ploughing, and irrigation.
The carbon emission calculation system includes a variety of methods, among which the emission factor method is among the most widely used core approaches. The formulas used in this method are simple and intuitive, the calculation process is transparent, and the results are easy to verify. Therefore, in this study, the emission factor method, which has been adopted by some scholars and belongs to the IPCC method [55], is used. The exact formula used to calculate carbon emissions is as follows:
In the given Equation (9), E represents the overall agricultural carbon emissions. Ei denotes the carbon emissions from the top six sources, while Ti stands for the quantity of those six primary sources. Lastly, δi accounts for the emission factors specific to each of these carbon sources.
On the basis of data obtained from T.o.west, Oak Ridge National Laboratory, USA, the carbon emission factor for fertilizers is 0.8956 kg·kg−1 and for pesticides is 4.9341 kg·kg−1. According to the data from the Institute of Agricultural Resources and Ecological Environment of Nanjing Agricultural University, the carbon emission coefficient of agricultural film is 5.1800 kg·kg−1. According to the IPCC, the carbon emission factor for diesel fuel is 0.5927 kg·kg−1. Based on the data from the College of Biology and Technology, China Agricultural University, the carbon emission coefficient of tilling is 312.6000 kg·km−2. According to a previous scholar [56], a researcher at the Joint Laboratory of Agricultural Information Technology Research and Development of the National People’s Committee of the Chinese Academy of Sciences (NPC), the carbon emission coefficient for irrigated agriculture is 20.4760 kg·hm−2.
As shown in Figure 2, agricultural carbon emissions are higher in Henan, Shandong, Hebei, Jiangsu, and Anhui Provinces, which are all large agricultural provinces in China. Among these provinces, Henan Province, which is China’s important grain-producing region, has a large agricultural scale and ranks first in carbon emissions, averaging nearly 8.3 million tons of emissions per year. Shandong Province is strategically located with a rich variety of agricultural products and has an efficient food production system that emits an average of nearly 7.27 million tons per year. Areas with lower emissions include Beijing, Tianjin, Shanghai, the Tibet Autonomous Region, and Qinghai Province, with average annual emissions less than 500,000 tons. Beijing, Tianjin, and Shanghai may have lower carbon emissions because they are urban areas and have less agricultural land. Tibet and Qinghai may be geographically restricted or ecologically fragile, leading to lagging agricultural development and thus lower carbon emissions.
Figure 2.
Average of total agricultural carbon emissions in 31 provinces (autonomous regions and municipalities), 2010–2021.
The data in Figure 3 illustrate that China’s agricultural carbon emissions generally increased between 2010 and 2015. Emissions hit their high-water mark in 2015, peaking at approximately 91.23 million tons. This surge was probably fueled by the increased use of resources and energy in the agricultural sector. Following the 2015 peak, China’s agricultural carbon emissions have, by and large, been declining through 2021. At this point, the decrease in emissions is largely a result of significant advances in science and technology, ever-improving energy efficiency, and a large push from government initiatives. A breakdown of agricultural carbon emissions by province (including autonomous regions and municipalities) across China is shown in Figure 4. This enables visualizing the carbon footprint of each region and tailoring emission reduction strategies accordingly.
Figure 3.
Total annual agricultural carbon emissions and overall trends in 31 provinces (autonomous regions and municipalities), 2010–2021.
Figure 4.
Distribution of average total agricultural carbon emissions in 31 provinces (autonomous regions and municipalities), 2010–2021. Note: The map is produced based on the standard map with review number GS(2019)1822 downloaded from the website of the Standard Map Service of the Ministry of Natural Resources of the People’s Republic of China, with no modifications to the base map, as below.
The agricultural carbon emissions by region in four representative years are shown in Figure 5. The 2010 distribution chart shows that most regions had relatively low carbon emissions, while Hebei, Henan, and Shandong provinces had relatively high carbon emissions. This is due to the rich agricultural resources and large crop planting area in these areas, which also reflects the low level of agricultural mechanization in China as a whole. As seen from the distribution maps in 2013 and 2017, the number of regions with high carbon emissions increased. The reason may be that with the improvement of people’s living standards, the scale of livestock breeding grew, but the efficiency of resource utilization in the agricultural production process was low, resulting in increased agricultural carbon emissions. In 2021, agricultural carbon emissions gradually decreased. Moreover, with the development of agricultural mechanization, the structure of agricultural machinery equipment was optimized, and the operation efficiency of agricultural machinery improved, thus reducing agricultural carbon emissions. All these factors are interconnected and mutually influencing, jointly promoting the transition of China’s agriculture to green and low-carbon development.
Figure 5.
Distribution of agricultural carbon emissions in 31 provinces (autonomous regions and municipalities) in 2010, 2013, 2017, and 2021.
3.1.3. Mediating Variables
In according with scholarly research [57,58], agricultural labor productivity (LP) was selected as one of the mediating variables. Following the methodology of individual studies [59,60], the calculation is based on the ratio of the primary industry’s value added to its workforce.
Regarding the measurement of agricultural production technical efficiency (APTE), agricultural labor, agricultural machinery, and fertilizers are considered three classical types of agricultural inputs [61,62]. Since agricultural production is strongly influenced by labor inputs [63], agricultural machinery is among the most important basic factors of production in the agricultural sector [64,65], and fertilizers are unique and necessary input factors for agriculture [66]. Therefore, they are included in the input indicators, which include the number of people employed in the primary sector, the total power of agricultural machinery, and the amount of fertilizer applied. Land inputs reveal the structure of agriculture and the intensity of production and play an important role in the balance between the supply and demand of farmland in agricultural production [63]; these factors are included in the input indicators, including the total sown area of crops. Pesticides are also crucial for crop growth [67] and are characterized by pesticide use. The gross value of agriculture, forestry, livestock, and fisheries is used as an output indicator to measure efficiency more accurately [68].
On the basis of the CCR model, some scholars have proposed a relaxed measurement data envelopment analysis (SBM-DEA) model [69]. In contrast to other models (CCR and BCC) [70], which integrate all the relaxation values into the objective function through a scalar approach, the bias in the measurement of efficiency is eliminated because of differences in radial selection. Therefore, this study applies the SBM-DEA model to measure the agricultural production technical efficiency.
3.1.4. Control Variables
By drawing on other studies [71,72], this study prioritizes variables that have a more direct impact on carbon emissions, which cover the four dimensions of socioeconomic structure, policy interventions, technology and inputs, and production structure. Factors such as climate or energy prices may involve data gaps or market supervision uncertainties and are less directly related to the impact of digital technology. Therefore, these factors have not been considered. The names of the variables are urbanization level (UL), financial support to agriculture level (FSAL), major agricultural machinery ownership (MAMO), agricultural planting structure (APS), and agrochemical input intensity (AII).
Urbanization level (UL): Urbanization is related to the ratio of city dwellers to the overall population. As an increasing number of people move to cities, the need for food and other agricultural goods increases. This, in turn, fosters a stronger connection between urban and rural communities and drives the modernization of farming practices.
Fiscal support for agriculture level (FSAL): This is measured by the percentage of local government spending on agriculture, forestry, and water management, relative to overall public budget expenditures. By providing financial support for agriculture, the government can pump more money into digital agriculture and develop cutting-edge technology and apparatuses while increasing the accuracy and intelligence of agricultural output.
Major agricultural machinery ownership (MAMO): Agricultural machinery power is measured on a logarithmic scale, which means that the more sophisticated the equipment is, the more effectively it aids farmers in their work. This leads to higher productivity while efficiently using resources.
Agricultural Planting Structure (APS): This is marked by the proportion of land dedicated to food crops in relation to the total arable area. A strategic arrangement of planting, tailored to soil, climate, and humidity variations across regions, not only increases crop quality but also ensures that resources are used efficiently, thereby increasing agricultural productivity.
Agrochemical Input Intensity (AII): The metric involves comparing the total amount of pesticides and fertilizers used with the total area of crops planted. By closely monitoring soil nutrients and pest problems and creating a well-considered strategy for applying these inputs, we can guarantee the robust growth of crops. This approach not only prevents the application of unnecessary amounts of agrochemicals but also fosters a greener, more eco-conscious, and ultimately more sustainable agricultural system.
3.2. Data Sources and Descriptive Statistics
Drawing from the reliability and precision of the information at hand, this study employs panel data encompassing 31 Chinese provinces, including autonomous regions and municipalities, from the year 2010 through 2021 for its analysis. The data sources include the China Statistical Yearbook from the National Bureau of Statistics, the China Rural Statistical Yearbook, the China Population and Employment Statistical Yearbook, insights from the Ali Research Institute, and the Wind database. The descriptive statistics for each variable are presented in Table 2.
Table 2.
Descriptive statistics of each variable.
3.3. Model Construction
To examine the influence of digital agriculture development on agricultural carbon emissions, baseline models are constructed for testing, as shown below.
Model (10) represents the direct effect of the level of digital agriculture development on total agricultural carbon emissions.
Model (11) represents the effect of digital agriculture development on agricultural labor productivity and agricultural production technical efficiency.
Model (12) represents the effect of digital agriculture development on total agricultural carbon emissions through agricultural labor productivity and agricultural production technical efficiency.
ln ACEit = α0 + α1·DALit + α2·Controlit + σi + τi + εit
Within the context of provinces (denoted by ‘i’) and years (indicated by ‘t’), the cumulative agricultural carbon emissions for the i-th province in the t-th year are represented as ACEit. DAL represents the level of digital agriculture development of the core explanatory variable. This model is adjusted for various control variables, such as the degree of urbanization (UL), the level of financial support for agriculture (FSAL), the presence of major agricultural machinery (MAMO), the composition of agricultural crops (APS), and the extent of agrochemical use (AII). The province-level and time-level fixed effects are signified by σi and τi, respectively, while εit refers to the random disturbance term. The coefficient α1 is attributed to the overall impact of the advancement in digital agriculture on the emission of agricultural carbon.
In order to test the mechanism of the role of agricultural labor productivity and agricultural production technical efficiency in agricultural carbon emissions, a model is constructed for testing, as shown below.
Mediationit = β0 + β1·DALit + β2·Controlit + σi + τi + εit
ln ACEit = γ0 + γ1·DALit + γ2·Mediationit + γ3·Controlit + σi + τi + εit
In this model, Mediationit represents the value of the mediating variable, while β0 represents the constant term in the estimation. The coefficient β1 captures the influence of digital agriculture advancement on both agricultural labor productivity and the agricultural production technical efficiency. Moreover, β2 reflects the weight of the control variable in the equation. Additionally, γ1 measures the impact of digital agricultural development on agricultural carbon emissions after accounting for labor productivity and technical efficiency. Conversely, γ2 quantifies how labor productivity and technical efficiency affect agricultural carbon emissions when the level of digital agricultural development is controlled. If the regression coefficients α1, β1, and γ2 are significant and the value of γ1 decreases compared with the regression result of α1, a partial mediation effect is indicated. If the above conditions are met and γ1 is not significant, a full mediation effect is demonstrated.
4. Empirical Analysis and Testing
4.1. Analysis of Baseline Regression Results
By performing F-test as well as Breusch–Pagan test, it shows that both of them have a p-value of 0, which suggests that both the fixed effect model and the random effect model are better than the mixed effect model. Subsequently, the Hausman test further showed that the p-value was less than 0.05, which indicated that the fixed effect model was superior to the random effect model. As a result, this study settles on the two-way fixed effect model for our empirical investigation into how the advancement in digital agriculture affects agricultural carbon emissions. Table 3 provides the details of the regression outcomes. In Column (1), we examine only the effects of the core explanatory variables. Notably, the effect of the degree of digital agriculture progress on carbon emissions from agriculture is negative, suggesting a suppression of emissions at the 1% confidence level, with a coefficient of −0.7029. As we incrementally incorporate control variables in Column (2) through (6), the impact coefficient remains negative, indicating that the development of digital agriculture continues to dampen the growth of agricultural carbon emissions at the 1% level, though the magnitude of the coefficient decreases to −0.4191. With these findings, Hypothesis 1 is approved.
Table 3.
Model estimation results for DAL and lnACE.
We believe that China’s success in reducing agricultural carbon emissions is largely attributable to the following factors. First, government policy support is indispensable. The Chinese government has lowered the threshold for the adoption of digital technologies through financial subsidies and infrastructure investment. Moreover, digital transformation and emission reduction targets are bound through regulations and strategic guidance, such as the “Outline of the Digital Rural Development Strategy” and the “Implementation Programme for Reducing Emissions and Sequestering Carbon in Agriculture and Rural Areas”, which ensure the synergistic advancement of agricultural digitization and decarbonization. Second, economic incentives are indispensable. Digital technologies create economic incentives through green finance and market mechanisms, with farmers benefiting from carbon trading while shortening supply chains to reduce carbon emissions. Third, protection of the ecological environment is indispensable. Satellite remote sensing is used to detect the quality of arable land to avoid land desertification caused by excessive cultivation. Moreover, waste resources are integrated through digital platforms to promote the fertilization and energy use of waste to replace fossil fuels and reduce incineration emissions.
4.2. Endogeneity Test
To tackle the issue of endogeneity, commonly known as reverse causality, this research employs a suite of endogeneity tests, utilizing regression models with both one-period and two-period lagged explanatory variables. The carbon emission response of the agricultural system is usually lagged, and the regression method using the lagged term can cover this dynamic transmission path and reduce the error to a certain extent. Therefore, the digital agricultural development level was treated and regressed with lag one and two periods, respectively, and the results are shown in Table 4. As can be seen from Columns (1) and (2) of Table 4, the progression of digital agriculture exhibits a statistically significant negative association with total agricultural carbon emissions at the 1% confidence level when accounting for one-period and two-period lags—aligning with the baseline regression findings. When lagged by one period, digital agriculture development exerts a notable dampening effect on emissions, yielding a coefficient of −1.6505. This inhibitory influence becomes even more pronounced with a two-period lag, producing a stronger coefficient of −1.8573, underscoring the compounding benefits of sustained digital integration. Over time, the progression of digital agriculture has not only enhanced ecological conditions and substantially reduced energy usage but has also strengthened the long-term viability of agricultural practices.
Table 4.
Empirical results of the endogeneity test.
4.3. Robustness Test
To improve the reliability of the model and the results, the following four methods are adopted to test its robustness.
4.3.1. Substitution of Explanatory Variables
Shifting the scale of the explanatory factors allows for a clearer view of the model’s consistency across various scenarios, which in turn helps evaluate its robustness. If the core findings hold up, they are likely to be broadly applicable and trustworthy. Given that there are multiple methods to gauge the carbon footprint of farming, this experiment explores additional approaches to measurement. The IACE, or the ratio of total agricultural carbon emissions to the agricultural output value, serves as a key indicator. Our initial sample was trimmed by 5%. As depicted in Table 5’s Column (1), the regression analysis reveals that the advancement in digital agriculture exerts a notable negative impact on the IACE, a finding that holds at the 1% significance level even when we incorporate control variables. This negative correlation persists at the 1% level post-control variables, aligning with the outcomes from the baseline regression. Thus, this approach appears to be effective in validating the robustness of our model.81
Table 5.
Empirical results of the robustness test.
4.3.2. Reduced Sample Cycle Time
Narrowing the time frame of the sample data can enhance the data’s accuracy and responsiveness, while mitigating the effects of unforeseen incidents on the data set. In the latter half of 2019, the COVID-19 crisis, a colossal public health disaster with substantial socioeconomic repercussions, erupted in China. This study omits the 2020–2021 data to factor in the pandemic’s influence on economic and social oscillations. The outcomes are delineated in Column (2) of Table 5. This table reveals that, despite the exclusion of this atypical data set, the digital agriculture’s advancement level still exerts a noteworthy negative influence on total agricultural carbon emissions at the 1% significance level, with the core results remaining steadfast. Thus, the conclusions drawn from the baseline regression are deemed reliable.
4.3.3. Replacement Regression Model
To assess the robustness of our findings, we employed alternative regression specifications to determine whether the coefficients and statistical significance of our primary explanatory factors remained stable. This approach helps to validate the reliability of our conclusions. For this particular robustness check, we applied a standard ordinary least squares (OLS) regression model. As demonstrated in Column (3) of Table 5, the results indicate that—even when using different estimation techniques—the development level of digital agriculture maintains a strongly pronounced negative effect (at the 1% level) on total agricultural carbon emissions. These findings align perfectly with our baseline regression results, confirming that our core conclusions hold firm across methodological variations.
4.3.4. Shrinkage Treatment
Scaling down the variables helps minimize the impact of outliers on regression outcomes, while model stability can be assessed by checking for significant deviations in the results. Provided the results closely correspond with the baseline regression, this validates the model’s robustness. All variables were truncated at the 1st and 99th percentiles prior to conducting the regression analysis. Column (4) of Table 5 demonstrates that the progression of digital agriculture consistently exerts a statistically significant negative effect on total agricultural carbon emissions at the 1% significance level. This reinforces the validity of the initial conclusion.
The data indicate that as digital agriculture takes off, agricultural carbon emissions decrease significantly. This trend held steady even after we conducted four different robustness tests to confirm the results. Therefore, our initial findings are solid.
4.4. Heterogeneity Test
China is the third-largest country globally in terms of land area, possessing a large and diverse territory. Consequently, implementing effective geographic zoning to investigate regional inequalities is imperative. Disparities in economic development, the natural environment, culture, and policies and regulations across regions in China make it difficult to generalize local characteristics when the divisions are too large, increasing the risk of error in the results. Therefore, given the influence of many factors, this study divides the data sample into seven regions, namely, East China, South China, Central China, North China, Northeast China, Northwest China, and Southwest China. Subsample regressions are conducted to explore the regional heterogeneity of the effects of the level of digital agricultural development on agricultural carbon emissions in each region. The regression results are shown in Table 6.
Table 6.
Empirical results of DAL on regional heterogeneity of lnACE.
The findings indicate that in most regions in China, the advancement of digital agriculture has an inhibitory influence on overall agricultural carbon emissions. The advancement of digital agriculture in East and North China significantly reduces agricultural carbon emissions. East China includes many economically developed provinces and cities, such as Jiangsu, Zhejiang, Anhui, Fujian, and Shanghai, which are dominated by market-incentivized policies, including the Shanghai Carbon Trading Pilot and the Zhejiang Agricultural Carbon Sink Accounts, which incentivize farmers to invest in digital technologies through carbon credit returns. Relying on the “digital platform + green supply chain” also enables agribusinesses to optimize distribution routes and reduce carbon emissions from cold-chain logistics. North China, which includes the cities of Beijing, Tianjin, Shijiazhuang, and Taiyuan, is one of the largest economic regions in China. The region has adopted administrative regulation-based policies and established relevant supporting mechanisms, such as the Hebei photovoltaic power station that supplies power to digital irrigation systems, which solves the problem of the stability of the new energy supply. The cooperative coordinates resource inputs through data sharing, reducing carbon emissions per unit area. Additionally, the government has strengthened farmers’ sense of ecological responsibility through cultural awareness, increasing their willingness to cooperate with digital technology monitoring, adjusting their farming practices to reduce soil carbon disturbance, and planning their chemical inputs in a way that reduces unnecessary energy waste.
In Central and Southwest China, the degree of digital agricultural growth has an insignificant negative effect on agricultural carbon emissions. The current digital agricultural policy is mostly based on a national framework. However, compared with policies in the eastern and northern regions of China, there are major differences in climate, topography, and planting structure in Central and Southwest China, where the “one-size-fits-all” approach to policy implementation is also more prominent. Moreover, digital agriculture services have not become popular, and smallholder farmers engage in behaviors such as technological exclusion and market myopia, which constrain the emission reduction effect.
Compared with East and North China, the development of digital agriculture in South, Northeast, and Northwest China has been slower. Compared with Central and Southwest China, the agricultural structure and climate environment in these regions are more complex, which may lead to increased carbon emissions. This is because the promotion of intelligent temperature control systems in South China’s hot and humid environment has led to the overuse of high-emission machinery and equipment by farmers to adapt to the climate, and relevant policies have not constrained use intensity, conflicting with the benefits of carbon reduction. The digital infrastructure in Northeast and Northwest China is lagging behind: in these regions, policies are less geared towards designing compensatory mechanisms for regional shortcomings, resulting in farmers prioritizing higher-carbon alternatives to safeguard the stability of their production. As a result, the low-carbon benefits of digital agriculture are cancelled out or even outweighed by these shortcomings.
4.5. Mediating Mechanisms Test
4.5.1. Mediating Effects of Agricultural Labor Productivity
Table 7 showcases the nuanced regression outcomes of these mediation effects. Notably, the results in Column (1) indicate that innovations in digital agriculture significantly improve labor productivity, exhibiting a statistically significant positive connection at the 1% significance level, with a coefficient of 9.5532. By leveraging technologies such as soil moisture and nutrient analysis, crop diagnostics, and smart precision farming techniques, digital agriculture enables more efficient land utilization, thereby boosting overall productivity for agricultural workers. This data-driven approach to farm management allows producers to optimize resources and streamline operations, leading to measurable gains in output. In Column (2), the study combines the independent, dependent, and mediating variables, including labor productivity, and discovers that the degree of digital agriculture’s advancement has a non-existent negative influence on overall agricultural carbon emissions, indicated by a coefficient of −0.0147. In the mediation model, the direct effect refers to the effect of the independent variable X on the dependent variable Y. The residual effect is referred to after controlling for the mediating variable M. Its regression coefficient is denoted by c’. Combined with the regression results, it was seen that c’ did not reach significance (p ≥ 0.1); furthermore, Bootstrap test showed a significant indirect effect (p-value of 0.006, 95% CI: [−0.7367, −0.1207], which does not include 0), thus supporting a fully mediated effect.
Table 7.
Empirical results of the mediating effects of DAL on lnACE.
4.5.2. Mediating Effects of Technical Efficiency in Agricultural Production
The findings presented in Column (3) of Table 7 demonstrate that advancements in digital agriculture substantially enhance agricultural technical efficiency, with a statistically significant coefficient of 0.3436 at the 1% confidence level. By utilizing advanced technology like internet connectivity and big data analytics, digital farming enables smarter, more precise agricultural practices. This technological integration optimizes the allocation of labor and land resources while minimizing energy waste, ultimately driving measurable gains in production efficiency. Column (4) incorporates both the independent and dependent variables alongside the mediating factor—agricultural production’s technical efficiency. Regression analyses showed that advances in digital agriculture had a statistically significant dampening effect on overall agricultural carbon emissions, with a coefficient of −0.2149. Although digital agriculture continues to be effective in curbing carbon emissions, its impact appears to be less pronounced than previously observed. Combined with the regression results, c’ was found to be significant (0.05 ≤ p < 0.1) and further shown to have a significant indirect effect by Bootstrap test (p-value of 0.000, 95% CI: [−0.9050, −0.3906], which does not include 0), thus supporting a partially mediated effect. The agricultural production technical efficiency partially elucidates the influence of digital agriculture development on carbon emissions.
Thus, these results substantiate Hypothesis 2, empirically.
5. Research Findings and Policy Recommendations
First, the level of digital agricultural development has a significant inhibitory effect on agricultural carbon emissions. These results are consistent with the conclusions of most scholars [73,74,75]. Moreover, examining digital development is important for reducing carbon emissions in agriculture.
Second, efficiency plays a mediating role in the relationship between digital agricultural development and agricultural carbon emissions. Specifically, the labor productivity of agricultural production plays a fully mediating role, whereas agricultural production technical efficiency serves as a partially mediating factor. These conclusions complement the research of scholars who have focused on other mediating factors between digital development and agricultural carbon emissions [76]. It also further validates the research logic regarding the mediating role of technological and human factors [77]. The detailed exploration of the distinct effects of these two types of efficiency factors also extends the existing research.
Third, the heterogeneity test reveals that the level of digital agricultural development in different regions has different effects on agricultural carbon emissions. These findings are consistent with the conclusions of previous studies [78,79,80]. Notably, digital agricultural development in East and North China has a greater effect on suppressing carbon emissions than it does in Central and Southwest China, whereas in Central and Southwest China, digital agricultural development has a stronger effect on suppressing carbon emissions than it does in South, Northeast, and Northwest China. This contrasts with the findings of previous studies, which have usually divided China into four regions: East, Central, West, and Northeast.
In this context, the following recommendations are made to promote the development of digital agriculture in China and to improve emission reduction efficiency.
5.1. Build an Agricultural Digital Service System That Brings Together the “Government, Businesses, and Farmers”
Government policymaking should be made more flexible. The government can implement carbon efficiency-linked fiscal subsidy policies, linking farmland subsidies to “digital carbon efficiency”. It can also prioritize support for the construction of dedicated 5G farmland networks and edge computing nodes by establishing tax incentives and digital agricultural banks, digital agricultural carbon emission reduction insurance pools, and digital agricultural green bonds. The technological innovation advantages of enterprises should be leveraged. Enterprises should actively participate in the research, development, and promotion of digital agricultural equipment, such as autonomous tillage machines, intelligent irrigation systems, and soil moisture stations. They can also innovate and launch a “cloud farm” service model, in which farmers contribute land or production data as equity, facilitating the sharing of digital benefits. Agricultural participation should be increased. The development of a “company advance payment–farmer benefit–carbon sink sharing” model should be encouraged, whereby companies install IoT equipment free of charge and receive a share of farmer carbon–sink transactions. Additionally, farmers should improve their skills in operating equipment, such as drones and autonomous agricultural machinery.
5.2. Establish an Efficiency-Driven Mechanism Centered on “Talent Optimization and Technological Innovation”
Agricultural labor productivity and agricultural production technical efficiency are important factors affecting carbon emissions in carbon agriculture. Therefore, improving production efficiency from both the human resource perspective and the technology perspective is necessary. On the one hand, agricultural labor productivity can be improved through talent cultivation. Digital agricultural technology and smart agriculture majors should be established at agricultural universities to cultivate professional talent and provide systematic training for returning youth and cooperative leaders to improve the quality of agricultural talent, thereby improving agricultural labor productivity. On the other hand, agricultural production efficiency can be improved through technological innovation. Unmanned agricultural machinery-sharing platforms and land management models based on AI should be innovated, and technological innovations, such as photovoltaic electric agricultural machinery and soil moisture meters, should be implemented.
5.3. Developing Tailored Implementation Policies Based on the Concept of “Emission Reduction and Carbon Sequestration + Regular Monitoring”
On the basis of regional differences in the emission reduction effects of digital agriculture (East China/North China > Central China/Southwest China > South China/Northeast China/Northwest China), a three-tiered policy system must be implemented. In East and North China, the advantages of carbon emission reduction should be significantly refined. For example, pilot projects for agricultural and industrial carbon trading should be launched, and the installation of IoT carbon-monitoring terminals on large-scale farms should be explored and gradually promoted. In Central and Southwest China, overcoming the constraints of small and scattered land plots and enhancing the carbon reduction benefits of large-scale operations are necessary. For example, mountainous plots of land can be virtually connected, and drones can be used to carry out cross-household operations to achieve digital land management. Village collectives are encouraged to develop carbon sink assets (such as oil tea forests in Central China) in accordance with local industries. Moreover, subsidies for climate-smart facilities (such as drone warning networks and IoT greenhouses resistant to heavy rain) can be provided to regions with harsh climates, such as Southwest China. In South, Northeast, and Northwest China, it is necessary to strengthen the foundation and cultivate momentum for carbon emission reduction. For example, photovoltaic irrigation systems should be constructed for crops in the sandy areas of Northwest China, carbon sink protection compensation should be implemented for black soil in Northeast China, fragmented land consolidation actions should be carried out in South China, and low-carbon crops should be promoted.
A cross-regional collaborative emission reduction mechanism should be established. The Ministry of Agriculture should take the lead in establishing a joint digital agriculture carbon emission reduction platform for East, Central, and West China, forming a virtuous cycle in which East China provides technology and Central and West China provide carbon sink indicators, with the regions jointly developing technology and sharing carbon emission reduction results. After the policy is implemented, key data samples should be collected in real time using the IoT, big data platforms, and other means. For example, a “Farmland Carbon Sink APP” should be developed to automatically connect with carbon exchange, which will not only increase farmers’ carbon sink income but also facilitate government supervision.
While this study draws some valuable conclusions, it has some degree of limitations. (1) The study of carbon emissions in this study only considered agriculture in a narrow sense (planting), and the results of subsequent studies may be more comprehensive if they consider agriculture in a broad sense (including livestock, etc.). (2) In conducting heterogeneity analysis, although the data samples were divided into more detailed categories, some regions had small sample sizes, which may have reduced the accuracy of the conclusions. Further research needs to focus on small sample intervals or increase the overall sample size. (3) There is a gap in this paper’s research on the rebound effect of digital technology on carbon emissions. Subsequent studies can use methods such as bilateral effects modelling to further clarify the net effect of digital technologies, making the results more scientific.
Author Contributions
Z.C.: Writing—Original draft preparation, Conceptualization, Methodology, Investigation, Validation and Writing—Review; G.B.: Data curation, Software, Investigation, Writing—Original draft preparation and editing; H.G.: Supervision, Investigation and Writing—Review. All authors have read and agreed to the published version of the manuscript.
Funding
This work was supported by the Research Project of Shandong Province Research Center of Xi Jinping Thought on Socialism with Chinese Characteristics for a New Era (24CXWHJ07), Social Science Planning Research Project of Shandong Province (24CXWHJ07), Philosophy and Social Science Youth Talent Team Project of Shandong Province (2024-QNRC-40) and The “Youth Innovation Team Program” Project of Higher Education Institutions in Shandong Province (2023RW039).
Institutional Review Board Statement
Not applicable.
Informed Consent Statement
Not applicable.
Data Availability Statement
The datasets used and analyzed in the current study are available from the corresponding author upon reasonable request.
Conflicts of Interest
All authors certify that they have no affiliations with or involvement in any organization or entity with any financial interest or non-financial interest in the subject matter or materials discussed in this manuscript.
References
- IPCC. Climate Change 2007: Synthesis Report. Contribution of Working Groups I, II and III to the Fourth Assessment Report of the Intergovernmental Panel on Climate Change; Core Writing Team, Pachauri, R.K., Reisinger, A., Eds.; IPCC: Geneva, Switzerland, 2007; 104p. [Google Scholar]
- IPCC. Climate Change 2014: Synthesis Report. Contribution of Working Groups I, II and III to the Fifth Assessment Report of the Intergovernmental Panel on Climate Change; Core Writing Team, Pachauri, R.K., Meyer, L.A., Eds.; IPCC: Geneva, Switzerland, 2014; 151p. [Google Scholar]
- Wang, G.; Liao, M.; Jiang, J. Research on agricultural carbon emissions and regional carbon emissions reduction strategies in China. Sustainability 2020, 12, 2627. [Google Scholar] [CrossRef] [Scilit]
- Wang, Y.; Liu, X.; Song, M. Spatial-temporal evolution of carbon sequestration and emission reduction capacity of agricultural cultivation in different functional grain areas. Sustainability 2024, 16, 10455. [Google Scholar] [CrossRef] [Scilit]
- Wright, A.; Hudson, D. An analysis of the feasibility of carbon management policies as a mechanism to influence water conservation using optimization methods. J. Environ. Manag. 2014, 143, 88–98. [Google Scholar] [CrossRef] [Scilit]
- Yoon, P.R.; Choi, J.Y.; Lee, S.H. Evaluation of Electricity Use and Carbon Emissions for Agricultural Water Supply in South Korea: Focusing on Water for Food (WF) Nexus System. Agric. Water Manag. 2025, 312, 109446. [Google Scholar] [CrossRef] [Scilit]
- Zhao, X.; Yang, D.; Duan, X. Temporal and spatial evolution characteristics and decoupling trend of Chinese agricultural carbon emission efficiency. PLoS ONE 2024, 19, e0311562. [Google Scholar] [CrossRef] [Scilit]
- Zhang, X.; Zhang, J.; Fu, W.; Pei, Z.; Zhang, B.; Zhuang, M. Analysis on agricultural carbon emissions transfer of inter-provincial trade in China. PLoS ONE 2024, 19, e0311744. [Google Scholar] [CrossRef] [Scilit]
- Wen, S.; Hu, Y.; Liu, H. Measurement and spatial–temporal characteristics of agricultural carbon emission in China: An internal structural perspective. Agriculture 2022, 12, 1749. [Google Scholar] [CrossRef] [Scilit]
- Hong, H.; Sun, L.; Zhao, L. Exploring the Impact of Digital Inclusive Finance on Agricultural Carbon Emissions: Evidence from the Mediation Effect of Capital Deepening. Sustainability 2024, 16, 3071. [Google Scholar] [CrossRef] [Scilit]
- Zhang, X.; Li, W. The impact of digital inclusive finance on agricultural carbon emissions at the city level in China: The role of rural entrepreneurship and agricultural innovation. J. Clean. Prod. 2025, 505, 145469. [Google Scholar] [CrossRef] [Scilit]
- Wang, T. Fiscal Expansion and Agricultural Carbon Reduction: Evidence from China. Pol. J. Environ. Stud. 2025, 34, 3837–3851. [Google Scholar] [CrossRef] [Scilit]
- Ahmed, N.; Hamid, Z.; Rehman, K.U.; Senkus, P.; Khan, N.A.; Wysokińska-Senkus, A.; Hadryjańska, B. Environmental regulation, fiscal decentralization, and agricultural carbon intensity: A challenge to ecological sustainability policies in the United States. Sustainability 2023, 15, 5145. [Google Scholar] [CrossRef] [Scilit]
- He, Q.; Deng, X.; Li, C.; Yan, Z.; Kong, F.; Qi, Y. The green paradox puzzle: Fiscal decentralisation, environmental regulation, and agricultural carbon intensity in China. Environ. Sci. Pollut. Res. 2022, 29, 78009–78028. [Google Scholar] [CrossRef] [Scilit]
- Zahra, S.; Selvanathan, E.A.; Gupta, R.; Jayasinghe, M.S. Green growth transition and carbon neutrality nexus: A comparative study on the top carbon emitters. J. Environ. Manag. 2025, 375, 124228. [Google Scholar] [CrossRef] [Scilit]
- Guo, Z.; Zhang, X. Carbon reduction effect of agricultural green production technology: A new evidence from China. Sci. Total Environ. 2023, 874, 162483. [Google Scholar] [CrossRef] [Scilit]
- Zhang, Y.; Dong, Q.; Ma, G. Effects of rural population aging on agricultural carbon emissions in China. Sustainability 2023, 15, 6812. [Google Scholar] [CrossRef] [Scilit]
- Ma, L.; Zhang, W.; Wu, S.; Shi, Z. Research on the impact of rural population structure changes on the net carbon sink of agricultural production-take Huan County in the loess Hilly region of China as an example. Front. Environ. Sci. 2022, 10, 911403. [Google Scholar] [CrossRef] [Scilit]
- Chen, W.; Han, D.; Zhan, Y.; Chen, B. The Impact of Rural Population Decline on the Economic Efficiency of Agricultural Carbon Emissions: A Case Study of the Contiguous Karst Areas in Yunnan–Guizhou Provinces, China. Agriculture 2025, 15, 1081. [Google Scholar] [CrossRef] [Scilit]
- Xu, X.; Yang, H.; Yang, H. The threshold effect of agricultural energy consumption on agricultural carbon emissions: A comparison between relative poverty regions and other regions. Environ. Sci. Pollut. Res. 2021, 28, 55592–55602. [Google Scholar] [CrossRef] [Scilit]
- He, H.; Ding, R. Spatiotemporal heterogeneity effect of technological progress and agricultural centrality on agricultural carbon emissions in China. Front. Environ. Sci. 2023, 10, 1078357. [Google Scholar] [CrossRef] [Scilit]
- Guan, N.; Liu, L.; Dong, K.; Xie, M.; Du, Y. Agricultural mechanization, large-scale operation and agricultural carbon emissions. Cogent Food Agric. 2023, 9, 2238430. [Google Scholar] [CrossRef] [Scilit]
- Ma, M.; Li, J.; Song, J.; Chen, X. Digital agriculture’s impact on carbon dioxide emissions varies with the economic development of Chinese provinces. Commun. Earth Environ. 2024, 5, 621. [Google Scholar] [CrossRef] [Scilit]
- Jiang, H.; Chen, Z.; Liang, Y.; Zhao, W.; Liu, D.; Chen, Z. The impact of industrial structure upgrading and digital economy integration on China’s urban carbon emissions. Front. Ecol. Evol. 2023, 11, 1231855. [Google Scholar] [CrossRef] [Scilit]
- Kurniawan, T.A.; Maiurova, A.; Kustikova, M.; Bykovskaia, E.; Othman, M.H.D.; Goh, H.H. Accelerating sustainability transition in St. Petersburg (Russia) through digitalization-based circular economy in waste recycling industry: A strategy to promote carbon neutrality in era of Industry 4.0. J. Clean. Prod. 2022, 363, 132452. [Google Scholar] [CrossRef] [Scilit]
- Kwilinski, A.; Lyulyov, O.; Pimonenko, T. Environmental sustainability within attaining sustainable development goals: The role of digitalization and the transport sector. Sustainability 2023, 15, 11282. [Google Scholar] [CrossRef] [Scilit]
- Liu, Y.-L.; Zhang, J.-R.; Li, H.-B. Has Digital Industrialization Promoted Carbon Emission Reduction in the Construction Industry? Sustainability 2025, 17, 3197. [Google Scholar] [CrossRef] [Scilit]
- Wang, Y.; Yuan, Y.; Qian, X.; Chi, Y. The impact of China’s digital economy industry development and its structural indicators on carbon emission intensity. Front. Environ. Sci. 2024, 12, 1438927. [Google Scholar] [CrossRef] [Scilit]
- Xie, X.; Wang, J. Study on the impact of industrial digitization on carbon emissions: Evidence from China’s Logistics Industry. Environ. Res. Commun. 2023, 5, 105008. [Google Scholar] [CrossRef] [Scilit]
- Zhang, R.L.; Liu, X.H.; Jiang, W.B. How does the industrial digitization affect carbon emission efficiency? Empirical measurement evidence from China’s industry. Sustainability 2023, 15, 9043. [Google Scholar] [CrossRef] [Scilit]
- Zhao, Z.; Zhao, Y.; Shi, X.; Zheng, L.; Fan, S.; Zuo, S. Green innovation and carbon emission performance: The role of digital economy. Energy Policy 2024, 195, 114344. [Google Scholar] [CrossRef] [Scilit]
- Ma, S.; Li, J.; Wei, W. The carbon emission reduction effect of digital agriculture in China. Environ. Sci. Pollut. Res. 2022, 1–18. [Google Scholar] [CrossRef] [Scilit]
- Chen, Y.; Li, M. How does the digital transformation of agriculture affect carbon emissions? Evidence from China’s provincial panel data. Humanit. Soc. Sci. Commun. 2024, 11, 713. [Google Scholar] [CrossRef] [Scilit]
- Qi, J.; Xu, J.; Jin, J.; Zhang, S. Digital Economy–Agriculture Integration Empowers Low-Carbon Transformation of Agriculture: Theory and Empirical Evidence. Sustainability 2025, 17, 2183. [Google Scholar] [CrossRef] [Scilit]
- Song, Y.; Liu, M. Empowering Sustainable Farming: Harnessing Digital Technology for Green and Low-Carbon Agricultural Practices. Sustainability 2025, 17, 1617. [Google Scholar] [CrossRef] [Scilit]
- Su, Y.; Liu, M.; Deng, N.; Cai, Z.; Zheng, R. Rural Digital Economy, Agricultural Green Technology Innovation, and Agricultural Carbon Emissions-Based on Panel Data from 30 Provinces in China between 2012 and 2021. Pol. J. Environ. Stud. 2024, 33, 6347–6361. [Google Scholar] [CrossRef] [Scilit]
- Zhang, H.; Guo, K.; Liu, Z.; Ji, Z.; Yu, J. How has the rural digital economy influenced agricultural carbon emissions? Agricultural green technology change as a mediated variable. Front. Environ. Sci. 2024, 12, 1372500. [Google Scholar] [CrossRef] [Scilit]
- Li, W.; Guo, J.; Tang, Y.; Zhang, P. The impact of digital rural construction on agricultural carbon emission intensity. Front. Environ. Sci. 2024, 12, 1492454. [Google Scholar] [CrossRef] [Scilit]
- Xu, Y.; Li, C.; Wang, X.; Wang, J. Digitalization, resource misallocation and low-carbon agricultural production: Evidence from China. Front. Environ. Sci. 2023, 11, 1117086. [Google Scholar] [CrossRef] [Scilit]
- Zhao, L.; Rao, X.; Lin, Q. Study of the impact of digitization on the carbon emission intensity of agricultural production in China. Sci. Total Environ. 2023, 903, 166544. [Google Scholar] [CrossRef] [Scilit]
- Smith, A. An Inquiry into the Nature and Causes of the Wealth of Nations; W. Strahan and T. Cadell: London, UK, 1776. [Google Scholar]
- Alahmadi, A.N.; Rehman, S.U.; Alhazmi, H.S.; Glynn, D.G.; Shoaib, H.; Solé, P. Cyber-security threats and side-channel attacks for digital agriculture. Sensors 2022, 22, 3520. [Google Scholar] [CrossRef] [Scilit]
- Assandri, D.; Bagagiolo, G.; Cavallo, E.; Pampuro, N. Replacing agricultural diesel fuel with biomethane from agricultural waste: Assessment of biomass availability and potential energy supply in piedmont (North-West Italy). Agronomy 2022, 12, 2996. [Google Scholar] [CrossRef] [Scilit]
- Azlan, Z.H.Z.; Junaini, S.N.; Bolhassan, N.A. Evidence of the potential benefits of digital technology integration in Asian agronomy and forestry: A systematic review. Agric. Syst. 2024, 217, 103947. [Google Scholar] [CrossRef] [Scilit]
- Shao, L.T.; Gong, J.Q.; Fan, W.Q.; Zhang, Z.Y.; Zhang, M. Cost comparison between digital management and traditional management of cotton fields—Evidence from cotton fields in Xinjiang, China. Agriculture 2022, 12, 1105. [Google Scholar] [CrossRef] [Scilit]
- Hong, M.; Tian, M.; Wang, J. The impact of digital economy on green development of agriculture and its spatial spillover effect. China Agric. Econ. Rev. 2023, 15, 708–726. [Google Scholar] [CrossRef] [Scilit]
- Zhong, Y.P.; Tang, L.R.; Li, Y. Role of digital empowerment in developing farmers’ green production by agro-tourism integration in Xichong, Sichuan. Agriculture 2022, 12, 1761. [Google Scholar] [CrossRef] [Scilit]
- Ana-Maria, S.A.V.A. Weighting Method for Developing Composite Indices. Application for Measuring Sectoral Specialization. J. Appl. Quant. Methods 2016, 11, 77–84. [Google Scholar]
- Liu, H.; Chen, Z.; Wen, S.; Zhang, J.; Xia, X. Impact of Digital Literacy on Farmers’ Adoption Behaviors of Green Production Technologies. Agriculture 2025, 15, 303. [Google Scholar] [CrossRef] [Scilit]
- Du, Y.; Liu, H.; Huang, H.; Li, X. The carbon emission reduction effect of agricultural policy—Evidence from China. J. Clean. Prod. 2023, 406, 137005. [Google Scholar] [CrossRef] [Scilit]
- Jin, M.; Feng, Y.; Wang, S.; Chen, N.; Cao, F. Can the development of the rural digital economy reduce agricultural carbon emissions? A spatiotemporal empirical study based on China’s provinces. Sci. Total Environ. 2024, 939, 173437. [Google Scholar] [CrossRef] [Scilit]
- Guo, L.; Zhao, S.; Song, Y.; Tang, M.; Li, H. Green finance, chemical fertilizer use and carbon emissions from agricultural production. Agriculture 2022, 12, 313. [Google Scholar] [CrossRef] [Scilit]
- Zhang, Z.; Chen, Y.H.; Mishra, A.K.; Ni, M. Effects of agricultural subsidy policy adjustment on carbon emissions: A quasi-natural experiment in China. J. Clean. Prod. 2025, 487, 144603. [Google Scholar] [CrossRef] [Scilit]
- Mostashari-Rad, F.; Ghasemi-Mobtaker, H.; Taki, M.; Ghahderijani, M.; Kaab, A.; Chau, K.W.; Nabavi-Pelesaraei, A. Exergoenvironmental damages assessment of horticultural crops using ReCiPe2016 and cumulative exergy demand frameworks. J. Clean. Prod. 2021, 278, 123788. [Google Scholar] [CrossRef] [Scilit]
- Song, S.; Zhao, S.; Zhang, Y.; Ma, Y. Carbon emissions from agricultural inputs in China over the past three decades. Agriculture 2023, 13, 919. [Google Scholar] [CrossRef] [Scilit]
- Li, B. Empirical study on the relationship between economic growth and agricultural carbon emissions. Acta Ecol. Environ. 2012, 21, 220–224. (In Chinese) [Google Scholar]
- Bocean, C.G. A cross-sectional analysis of the relationship between digital technology use and agricultural productivity in EU countries. Agriculture 2024, 14, 519. [Google Scholar] [CrossRef] [Scilit]
- Ma, W.; Liu, T.; Li, W.; Yang, H. The role of agricultural machinery in improving green grain productivity in China: Towards trans-regional operation and low-carbon practices. Heliyon 2023, 9, e20279. [Google Scholar] [CrossRef] [Scilit]
- Shen, D.; Liang, H.; Shi, W. Rural population aging, capital deepening, and agricultural labor productivity. Sustainability 2023, 15, 8331. [Google Scholar] [CrossRef] [Scilit]
- Fan, J. Industrial Agglomeration and Inter-regional Differences in Labor Productivity. Econ. Res. J. 2006, 11, 72–81. [Google Scholar]
- Shen, Z.; Baležentis, T.; Ferrier, G.D. Agricultural productivity evolution in China: A generalized decomposition of the Luenberger-Hicks-Moorsteen productivity indicator. China Econ. Rev. 2019, 57, 101315. [Google Scholar] [CrossRef] [Scilit]
- Chen, S.; Gong, B. Response and adaptation of agriculture to climate change: Evidence from China. J. Dev. Econ. 2021, 148, 102557. [Google Scholar] [CrossRef] [Scilit]
- Liao, J.; Yu, C.; Feng, Z.; Zhao, H.; Wu, K.; Ma, X. Spatial differentiation characteristics and driving factors of agricultural eco-efficiency in Chinese provinces from the perspective of ecosystem services. J. Clean. Prod. 2021, 288, 125466. [Google Scholar] [CrossRef] [Scilit]
- Han, H.; Ding, T.; Nie, L.; Hao, Z. Agricultural eco-efficiency loss under technology heterogeneity given regional differences in China. J. Clean. Prod. 2020, 250, 119511. [Google Scholar] [CrossRef] [Scilit]
- Ma, S.; Feng, H. Will the decline of efficiency in China’s agriculture come to an end? An analysis based on opening and convergence. China Econ. Rev. 2013, 27, 179–190. [Google Scholar] [CrossRef] [Scilit]
- McArthur, J.W.; McCord, G.C. Fertilizing growth: Agricultural inputs and their effects in economic development. J. Dev. Econ. 2017, 127, 133–152. [Google Scholar] [CrossRef] [Scilit]
- Huang, X.; Feng, C.; Qin, J.; Wang, X.; Zhang, T. Measuring China’s agricultural green total factor productivity and its drivers during 1998–2019. Sci. Total Environ. 2022, 829, 154477. [Google Scholar] [CrossRef] [Scilit]
- Li, Y.B.; Wei, C.H.; Liu, D.G. Research on the impact of new agricultural quality productivity on high-quality agricultural development in my country—Analysis based on the intermediary effect of agricultural production technology efficiency and the regulation effect of agricultural insurance. Southwest Financ. 2024, 45, 68–80. (In Chinese) [Google Scholar]
- Tone, K. A slacks-based measure of efficiency in data envelopment analysis. Eur. J. Oper. Res. 2001, 130, 498–509. [Google Scholar] [CrossRef] [Scilit]
- Zhang, W.; Li, J.; Li, G.; Guo, S. Emission reduction effect and carbon market efficiency of carbon emissions trading policy in China. Energy 2020, 196, 117117. [Google Scholar] [CrossRef] [Scilit]
- Feng, L.; Yang, W.; Hu, J.; Wu, K.; Li, H. Exploring the nexus between rural economic digitalization and agricultural carbon emissions: A multi-scale analysis across 1607 counties in China. J. Environ. Manag. 2025, 373, 123497. [Google Scholar] [CrossRef] [Scilit]
- Kausar, A.; Rasul, F.; Asghar, N. How to get green with agricultural footprint: A global analysis of carbon emissions, environmental taxes, and agrochemical use. J. Environ. Manag. 2024, 370, 122665. [Google Scholar] [CrossRef] [Scilit]
- Li, B.; Gao, Y. Impact and transmission mechanism of digital economy on agricultural energy carbon emission reduction. Int. Rev. Econ. Financ. 2024, 95, 103457. [Google Scholar] [CrossRef] [Scilit]
- Jiang, W.; Chen, C. The impacts of rural digitization on agricultural carbon emission efficiency: Evidence from 30 provinces in China over 2011–2022. Front. Sustain. Food Syst. 2025, 9, 1593986. [Google Scholar] [CrossRef] [Scilit]
- Zhu, Y.; Wang, X.; Zheng, G. Blessing or Curse? The Impact of Digital Technologies on Carbon Efficiency in the Agricultural Sector of China. Sustainability 2023, 15, 15613. [Google Scholar] [CrossRef] [Scilit]
- Chang, J. The role of digital finance in reducing agricultural carbon emissions: Evidence from China’s provincial panel data. Environ. Sci. Pollut. Res. 2022, 29, 87730–87745. [Google Scholar] [CrossRef] [Scilit]
- Zhong, R.; He, Q.; Qi, Y. Digital economy, agricultural technological progress, and agricultural carbon intensity: Evidence from China. Int. J. Environ. Res. Public Health 2022, 19, 6488. [Google Scholar] [CrossRef] [Scilit]
- Mei, B.; Ali, M.A.S.; Khan, I.; Luo, J. Analyzing the mediating role of industrial structure in the spatial spillover effects of financial agglomeration on carbon emission and regional heterogeneity. Environ. Sci. Pollut. Res. 2024, 31, 46669–46685. [Google Scholar] [CrossRef] [Scilit]
- Wang, G.; Zhao, B.; Zhao, M. Investigation into the Performance Characteristics of the Organic Dry Farming Transition and the Corresponding Impact on Carbon Emissions Reduction. Agriculture 2024, 14, 459. [Google Scholar] [CrossRef] [Scilit]
- Zhang, Q.; Gao, X.; Hu, Y.; He, Z.; Li, X. Spatial and temporal evolution characteristics of apple carbon emissions in China, 1991–2020. Sci. Rep. 2025, 15, 18478. [Google Scholar] [CrossRef] [Scilit] [PubMed]
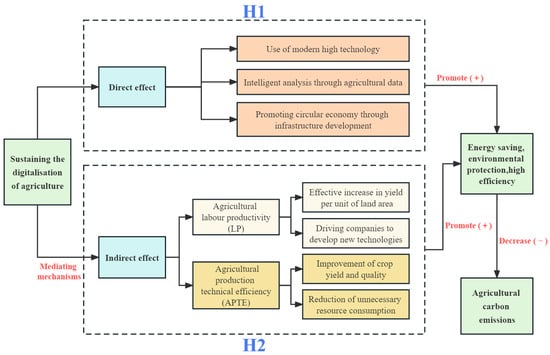
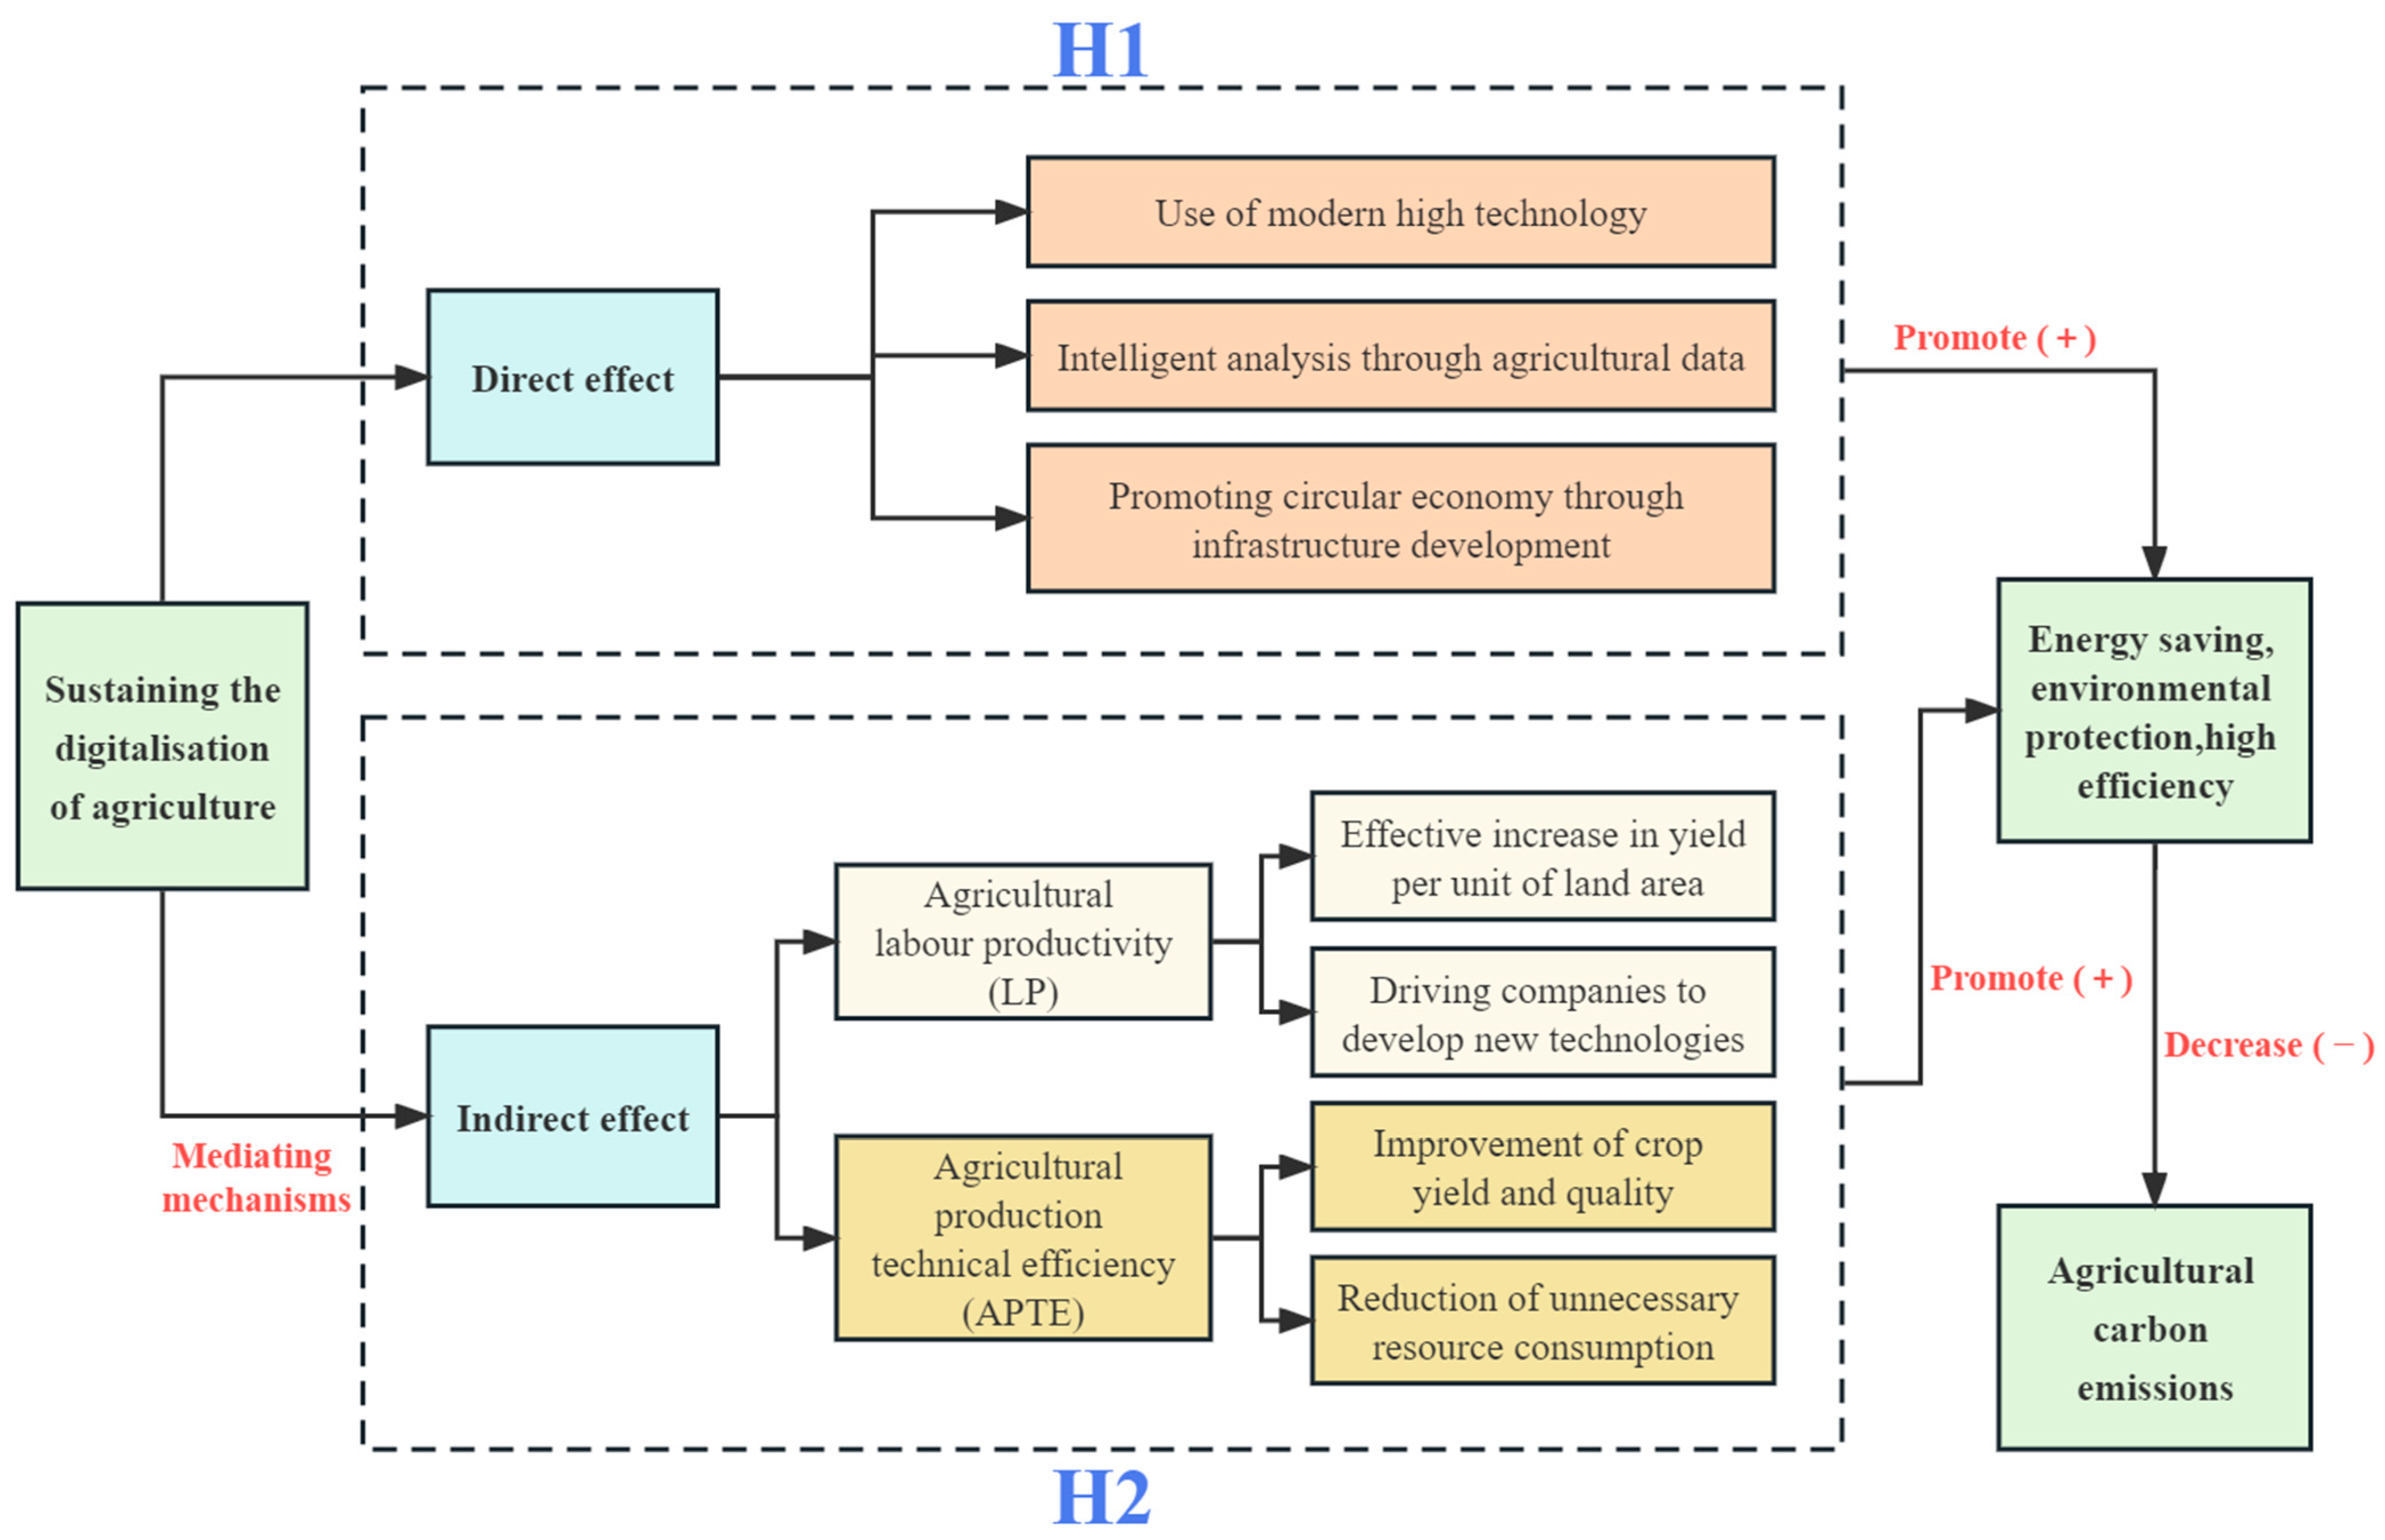
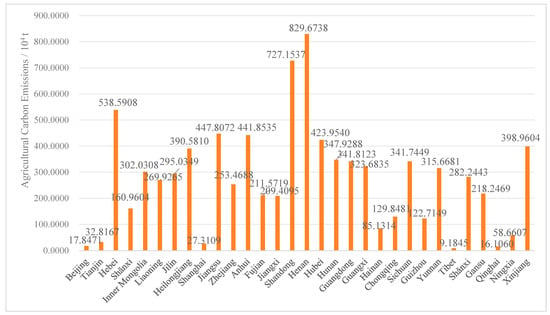
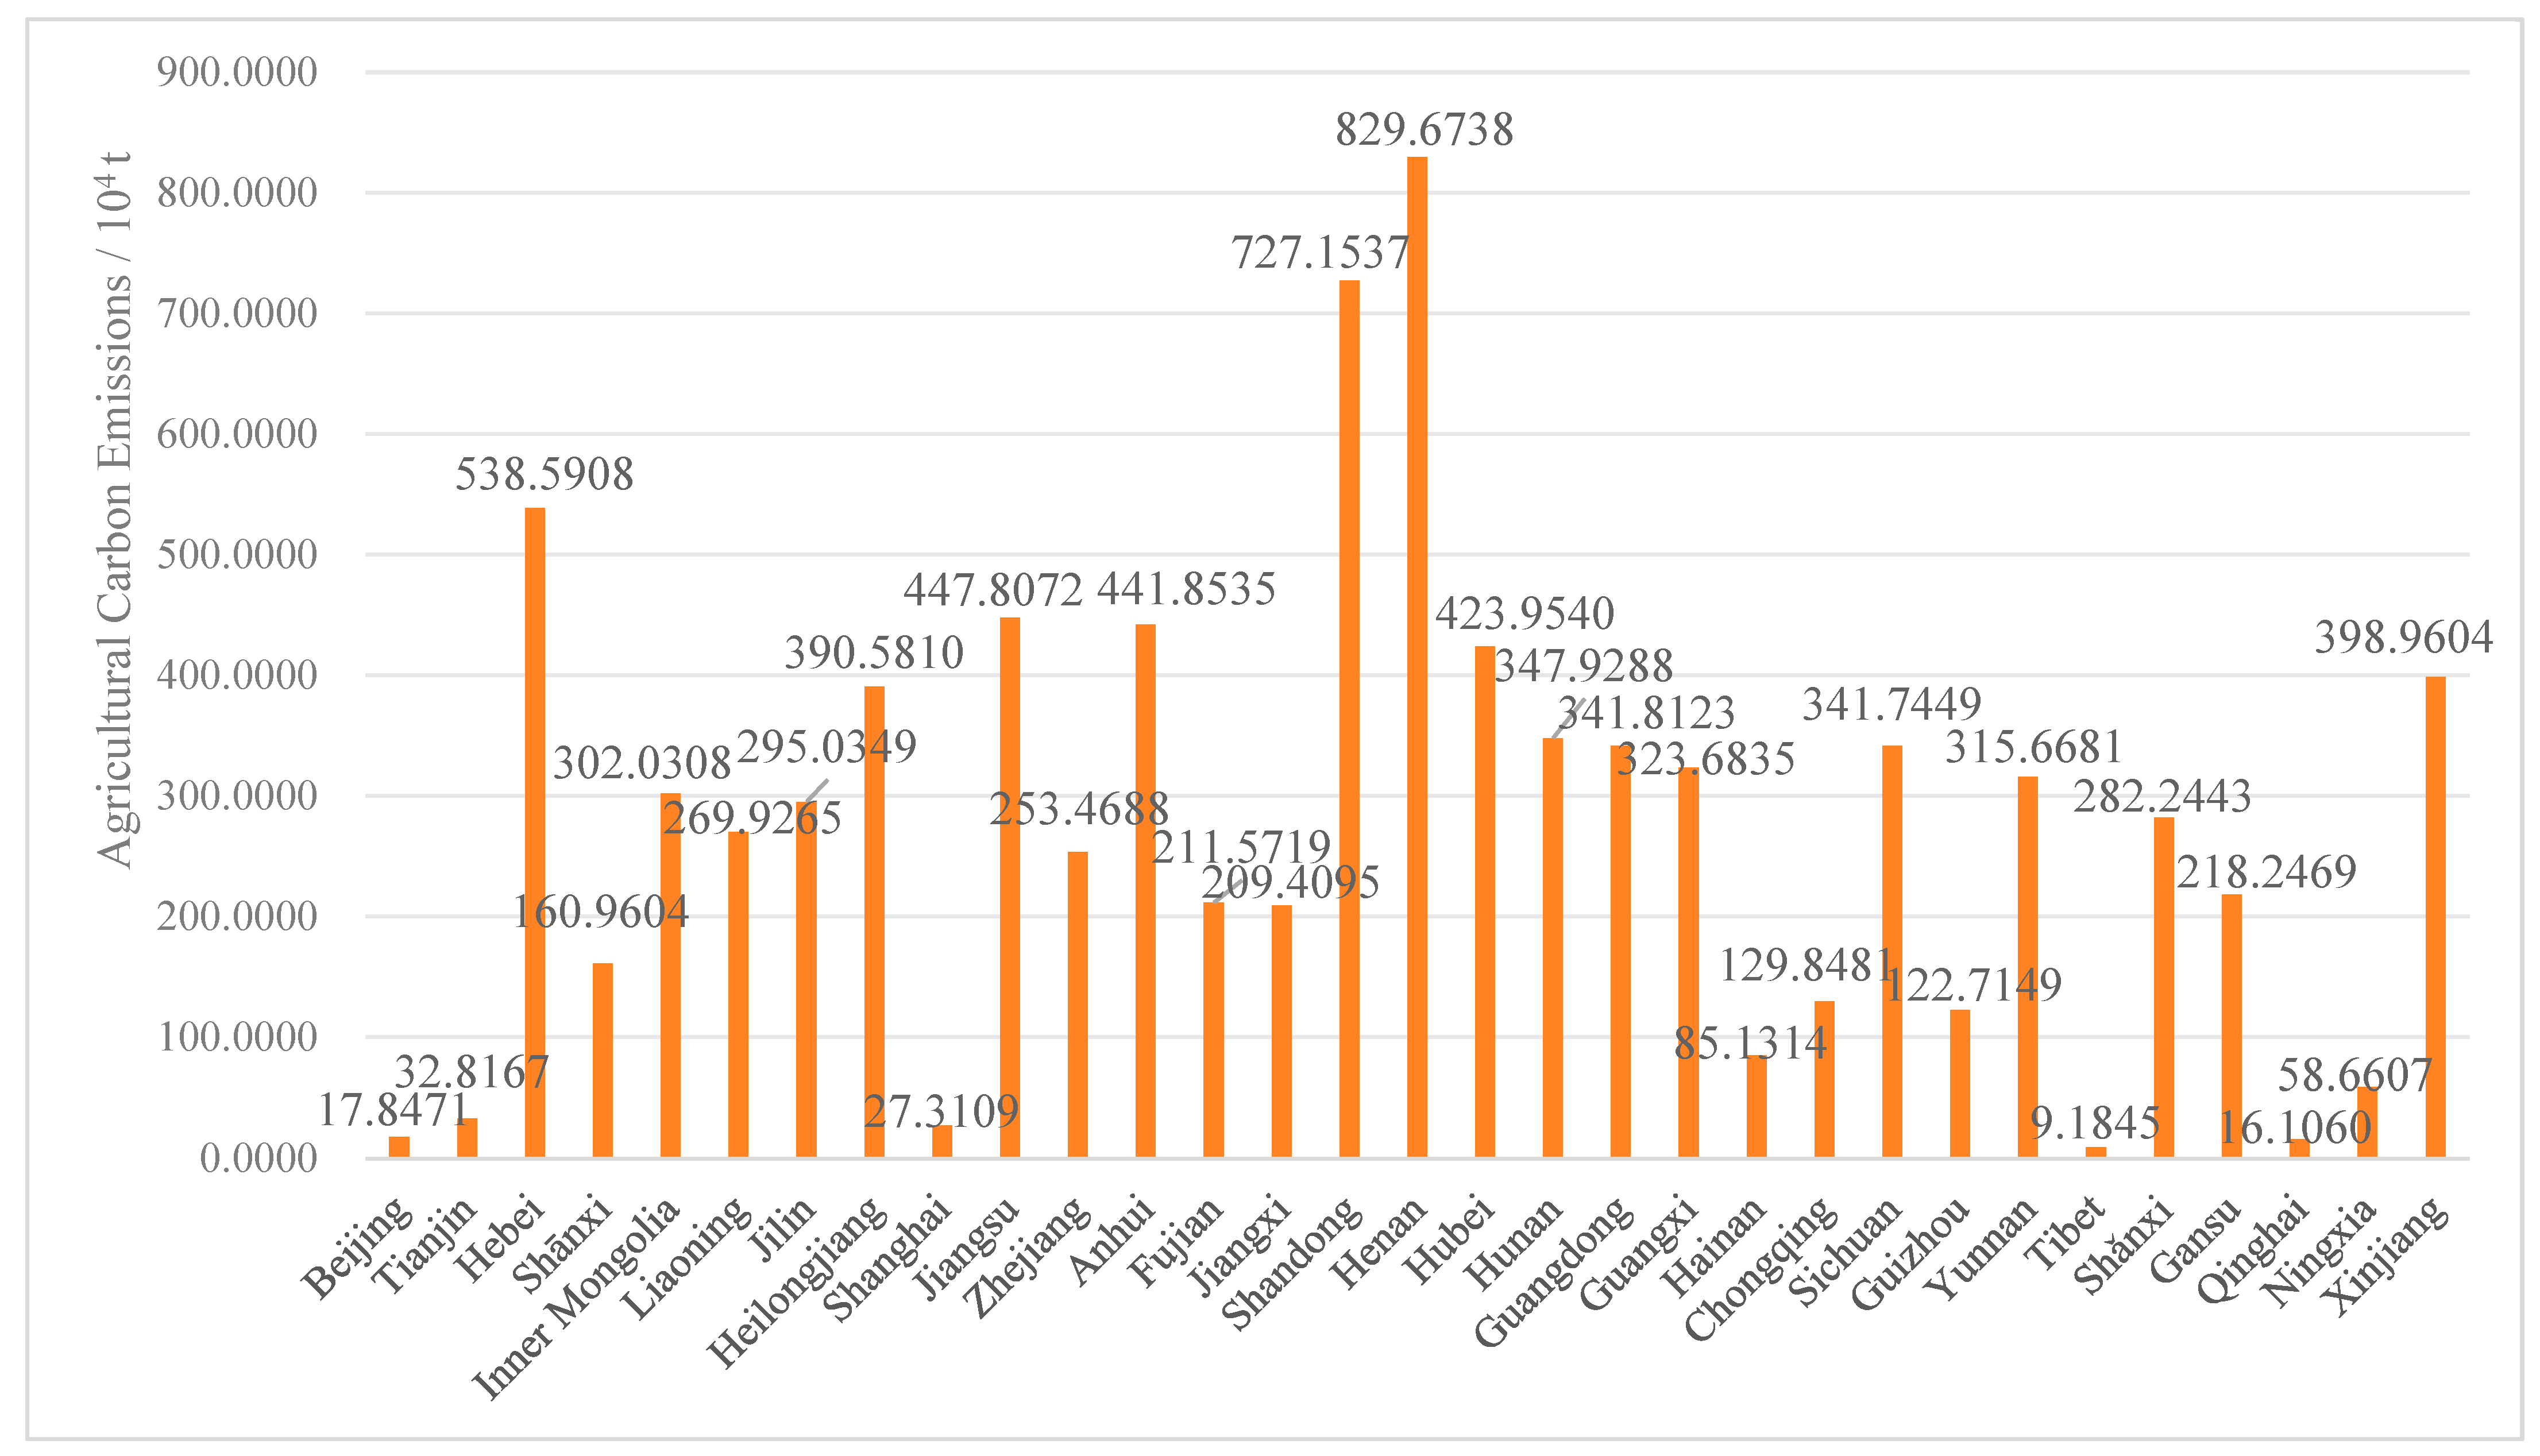
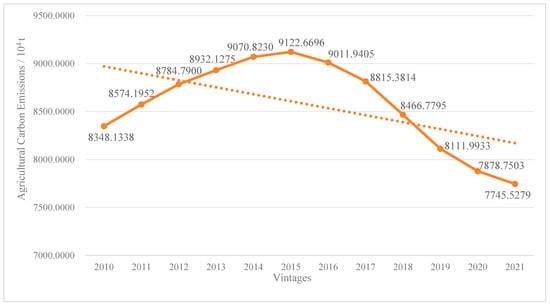
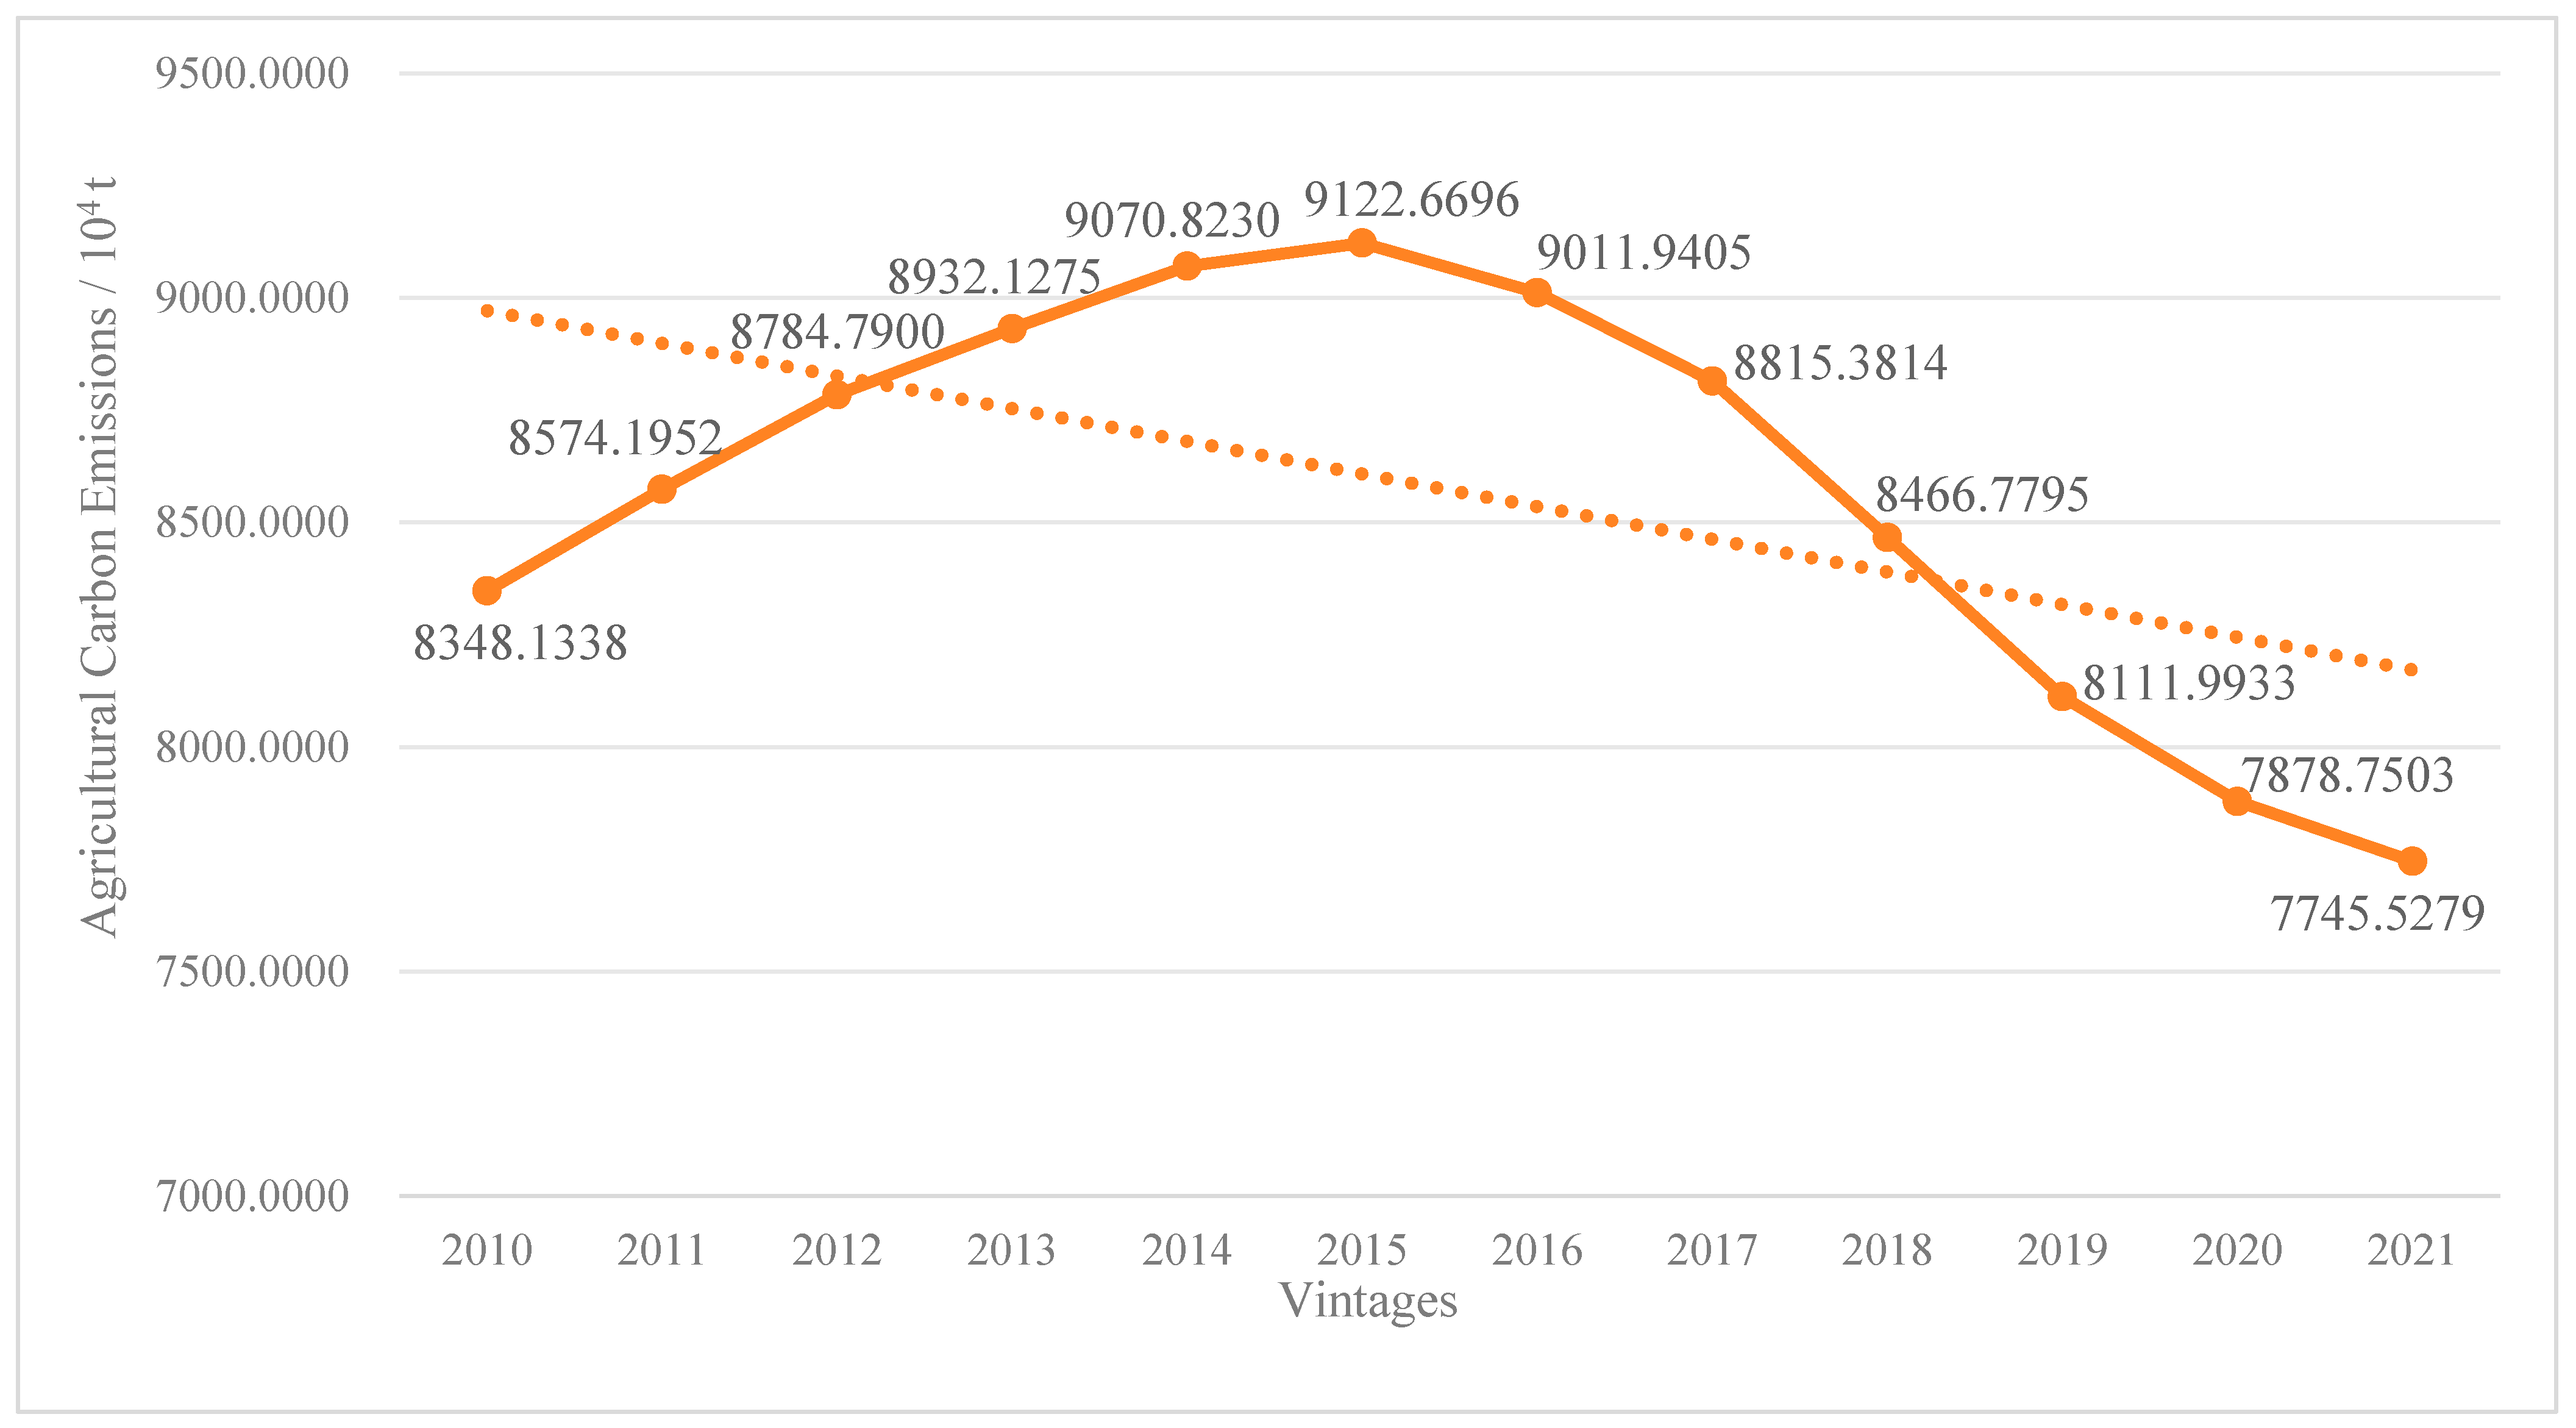
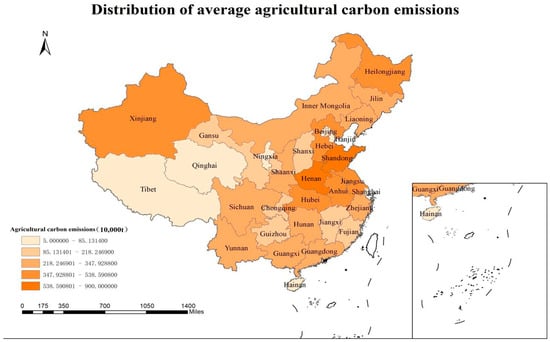
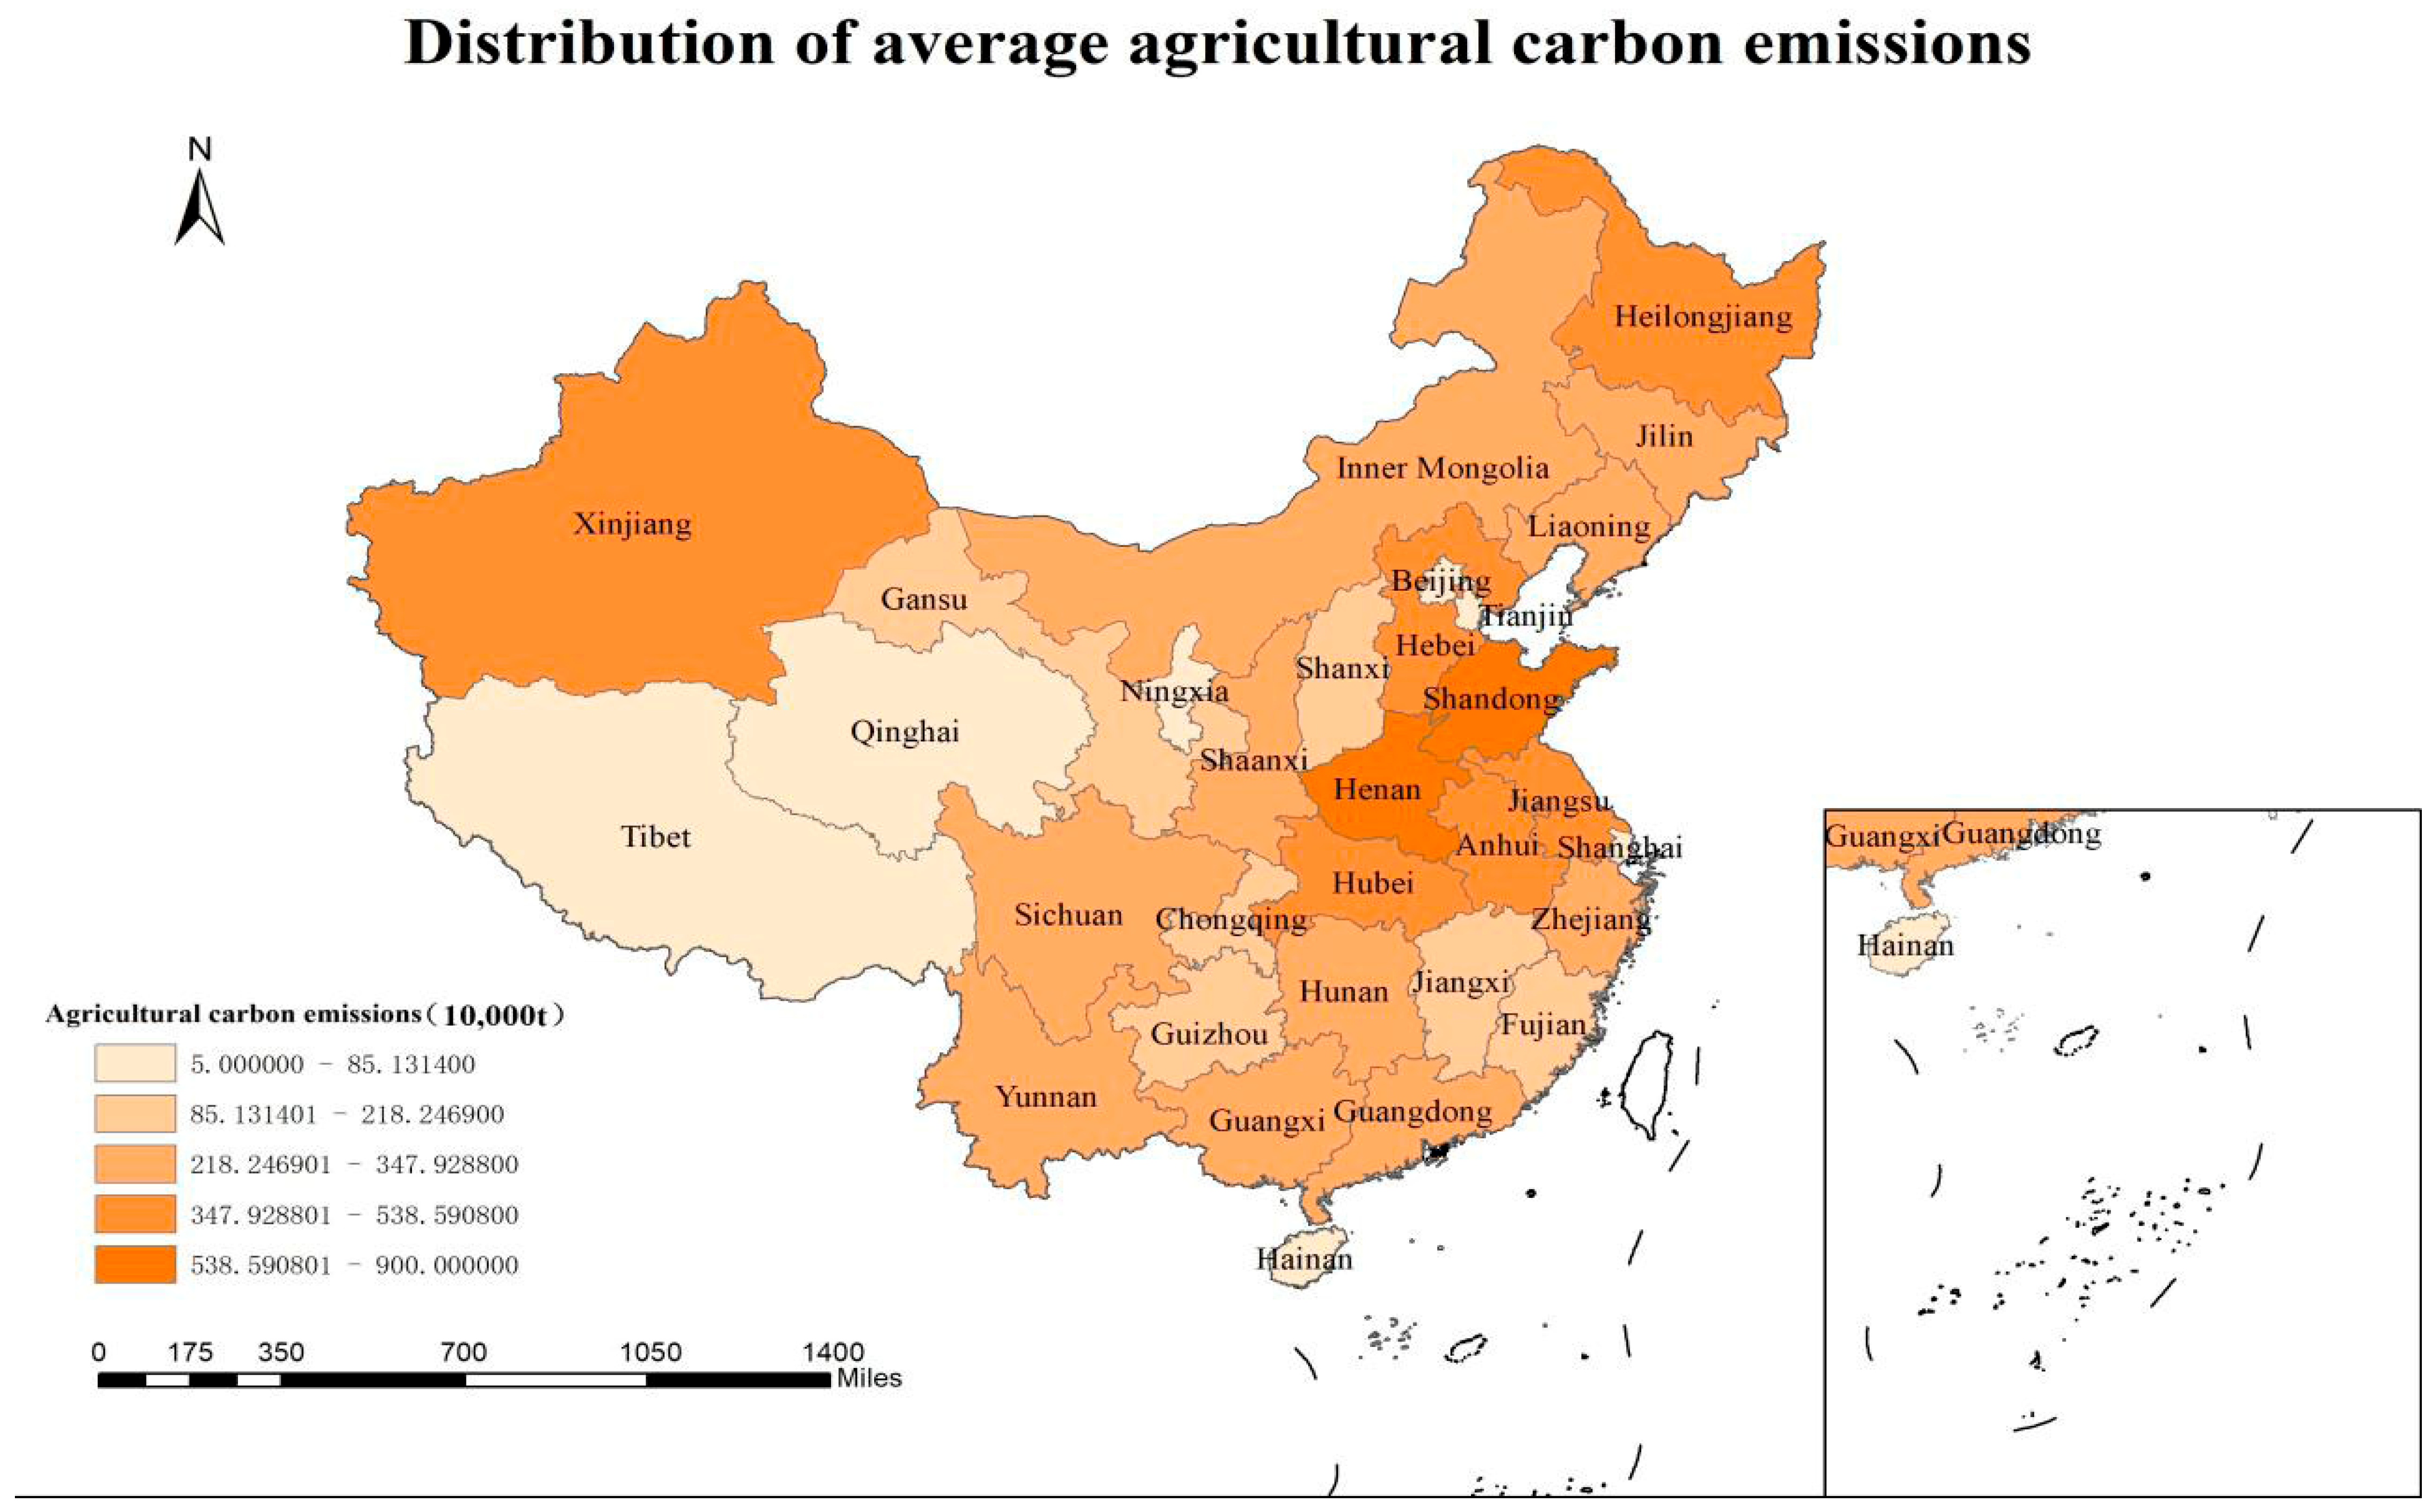
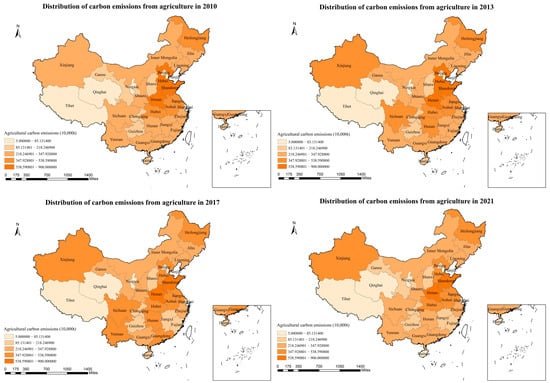
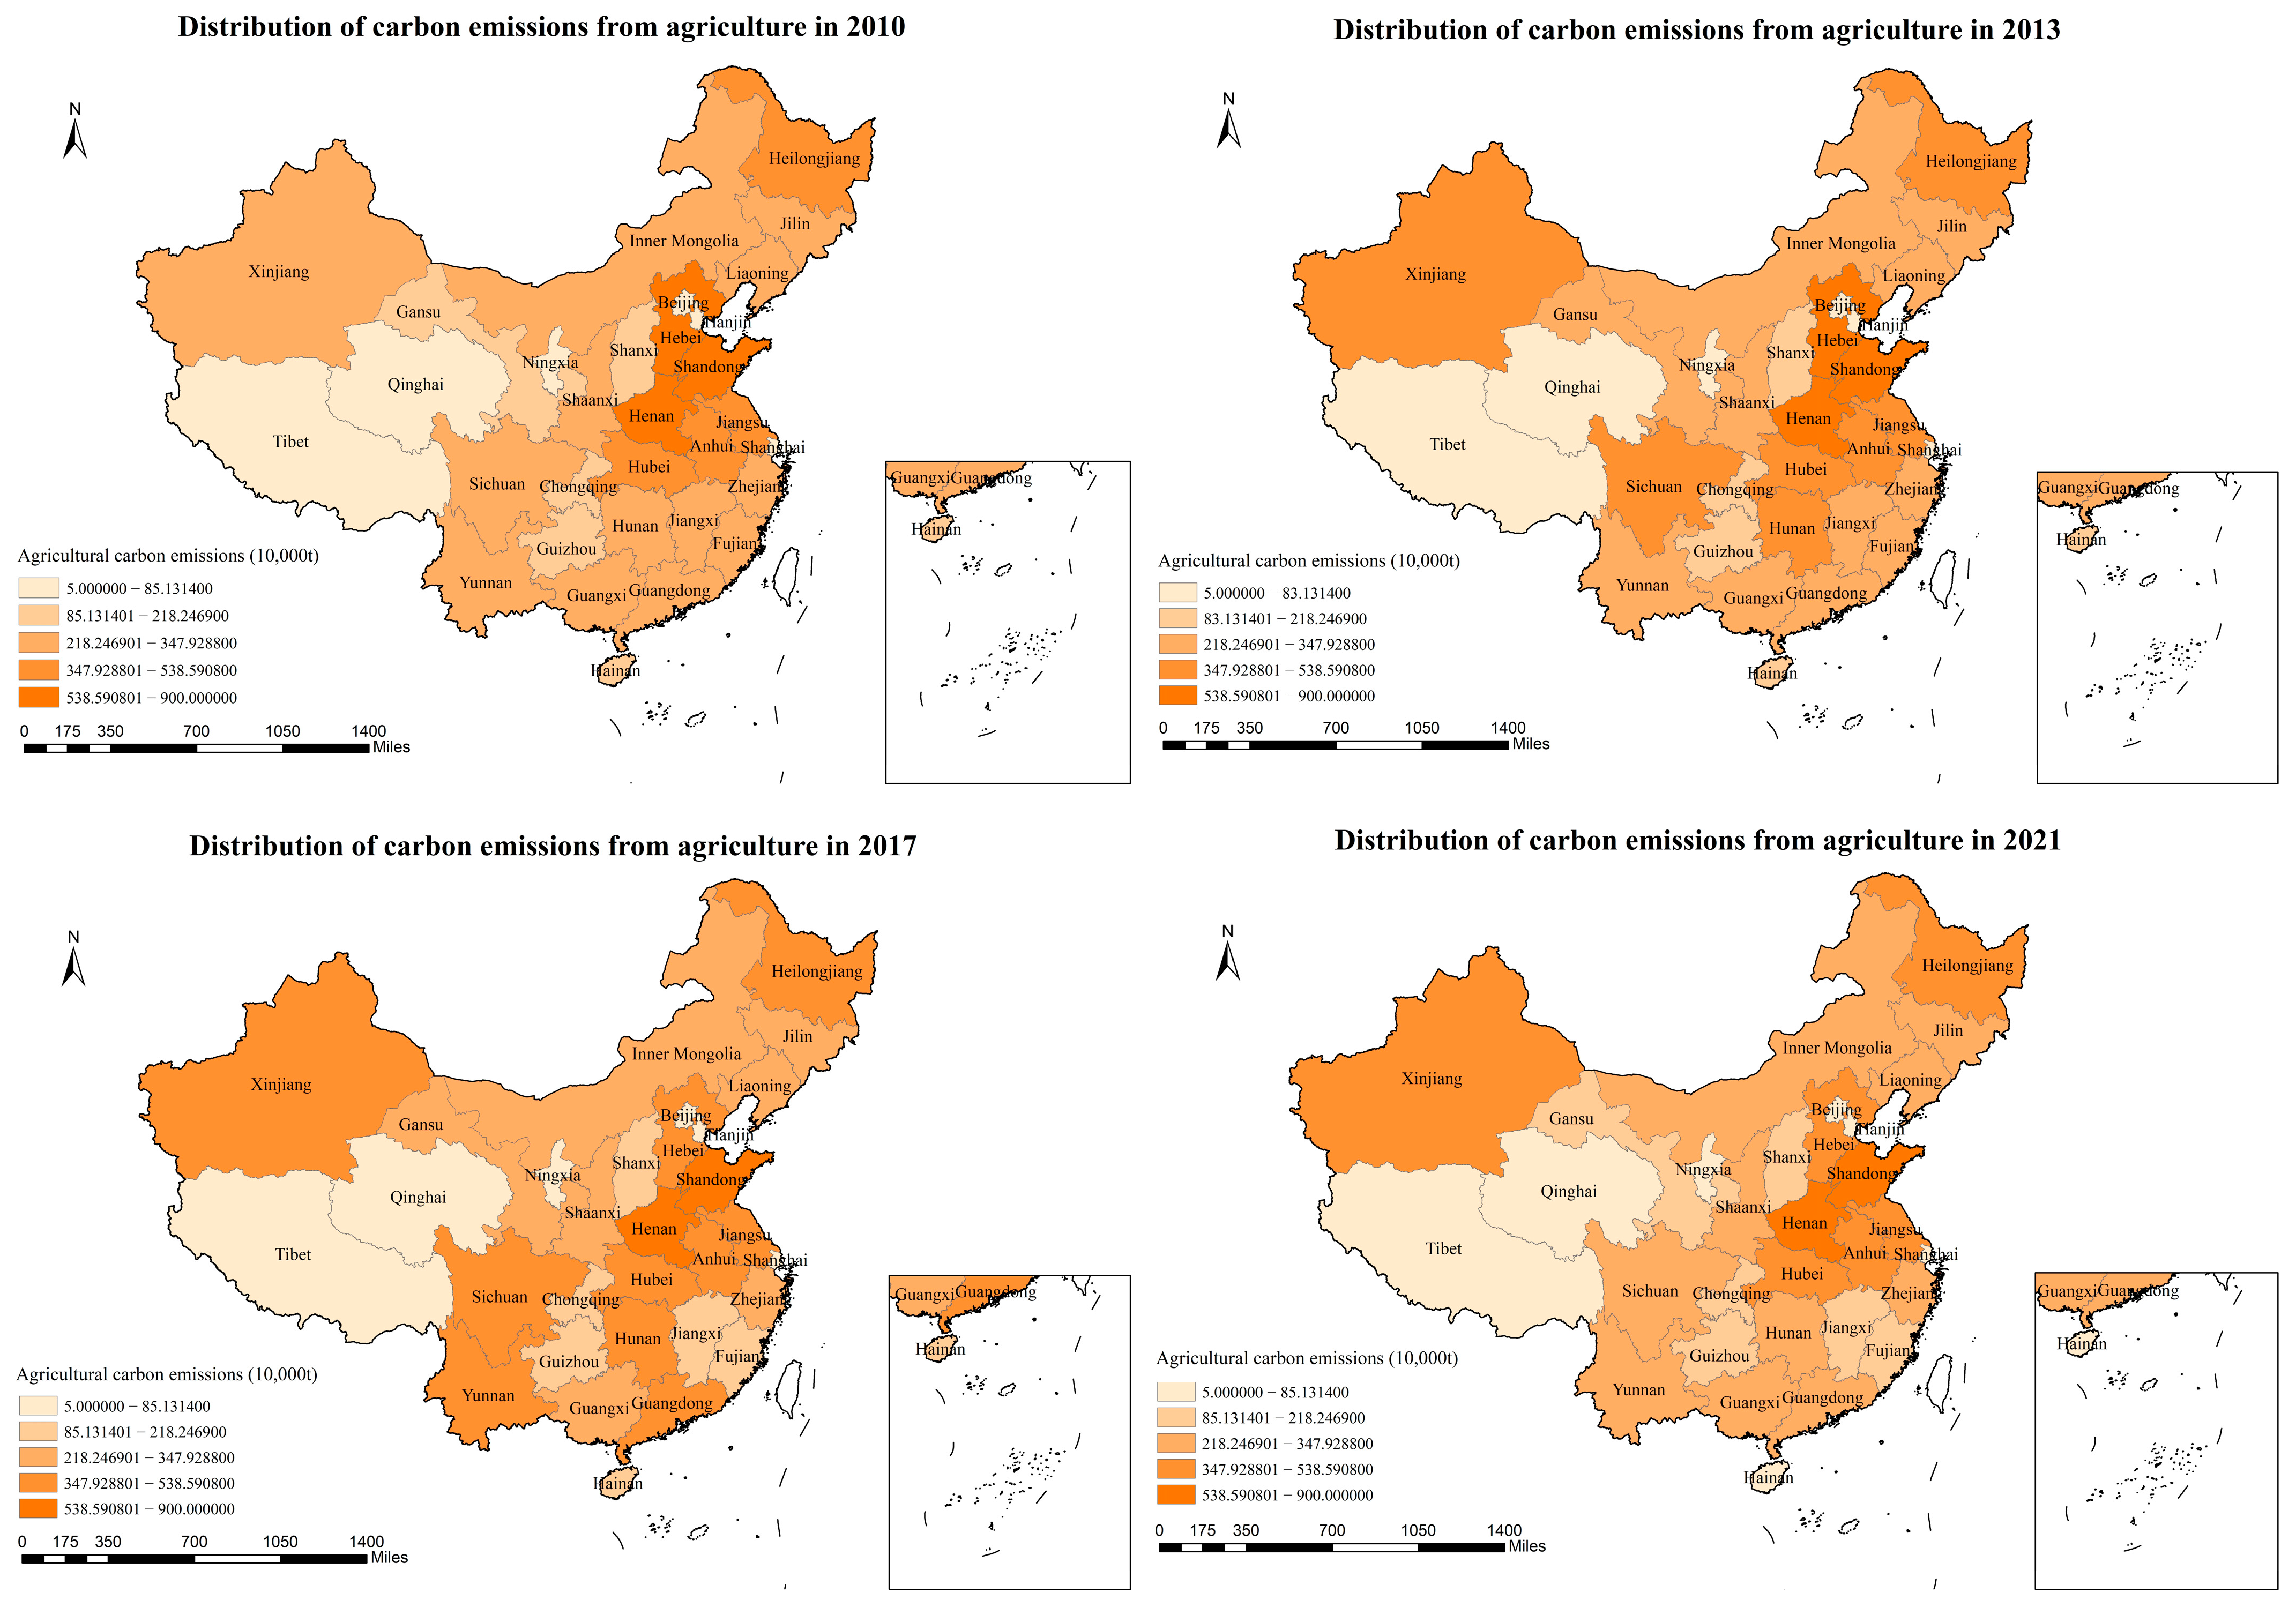

Disclaimer/Publisher’s Note: The statements, opinions and data contained in all publications are solely those of the individual author(s) and contributor(s) and not of MDPI and/or the editor(s). MDPI and/or the editor(s) disclaim responsibility for any injury to people or property resulting from any ideas, methods, instructions or products referred to in the content. |
© 2025 by the authors. Licensee MDPI, Basel, Switzerland. This article is an open access article distributed under the terms and conditions of the Creative Commons Attribution (CC BY) license (https://creativecommons.org/licenses/by/4.0/).