


Abstract
With the ongoing transformation of the energy structure and the advancement of smart grid development, green and sustainable development of substations has become an inevitable trend. As the core driving force of substation transformation, novel technologies remain at the pilot application stage, and their performance evaluations are yet to be clarified. In view of this, this paper proposes a comprehensive evaluation framework for the application effectiveness of novel technologies in green construction for substations. Firstly, based on the feature for the whole life cycle of the technologies, an evaluation index system is established covering multiple dimensions and stages, including resource conservation, technical performance enhancement, and economic benefits. Secondly, on the basis of AHP group decision and EWM combination weights, a variable-weight model is constructed by combining projection gray target evaluation to enable significant differentiation in cross-technology comparative analysis. Finally, a case study is conducted on pilot applications of multiple novel technologies in substations within a specific region, and the results indicate that novel technologies which demonstrate better sustainable development effects throughout the entire life cycle have a broader prospect for promotion.
1. Introduction
Under the background of carbon peaking and carbon neutrality targets, the green and sustainable development of infrastructure has become a key pathway for the low-carbon transition of energy systems under the construction of novel power systems [1]. Among them, substations, as an essential component, can significantly contribute to the reduction of carbon emissions in infrastructure construction through green transformation, as life cycle assessments indicate that a typical 500 kV substation emits approximately 150,000 tons of CO2 from construction to decommissioning [2]. In this context, the deployment of novel technologies in green construction for substations has become a strategic lever for achieving low-carbon and ultimately zero-carbon transformation. The construction and renovation of substations have increasingly incorporated various types of green and efficient novel technologies. On the one hand, novel technologies characterized by equipment integration, system modularization, and intelligent operation have continuously emerged. The new generation of electrical equipment achieves space reduction and enhances reliability and construction efficiency through the deep integration of structure and function [3,4,5]. On the other hand, by leveraging technologies such as BIM, GIS, and the Internet of Things, full-process digitalization covering design, construction, and operation and maintenance has been realized. Resource conservation and carbon reduction have been embedded into technical architectures, contributing to the achievement of “dual-green” goals in both construction and operation phases [6,7,8].
Overall, the development of novel technologies in green construction for substations has been characterized by digital-driven approaches, system integration, and green efficiency, which can be broadly categorized into two main types. The first category focuses on construction-related technologies, emphasizing innovations in physical structures and equipment, including advanced construction techniques, new material applications, and equipment integration. The other involves intelligent centralized control platform technologies that leverage big data and artificial intelligence to enhance operational management and informatization levels. Additionally, the construction philosophy of construction-related technologies has shifted from a singular focus on cost and schedule to holistic process optimization and life-cycle value orientation [9]. However, most of these novel technologies in green construction for substations remain at the pilot application stage, and their effectiveness has not been systematically quantified, making it difficult to provide a reliable basis for technology selection and large-scale promotion. Therefore, there is an urgent need to establish a scientifically grounded and systematic comprehensive evaluation framework for assessing the actual application effectiveness of novel technologies in green construction for substations. Such a framework is expected to coordinate the improvement of technological performance with economic feasibility, thereby supporting the capacity expansion and transformation of substations. It also aims to enhance their safe and efficient operation, while promoting progress toward economic efficiency, green and low-carbon development, and long-term sustainability.
Nowadays, relatively few evaluation studies have been conducted on novel technologies in green construction for substations considering the technical application characteristics of novel substation technologies. Nevertheless, studies on the field of green building have been relatively more extensive. As the concepts of digitalization, intelligence, and green development continue to advance across infrastructure sectors, various industries are entering a critical stage in the transition from exploration to practical implementation in green construction practices [10,11]. Existing studies have explored comprehensive evaluation frameworks for novel technologies and projects across various domains, providing useful references for indicator selection relevant to substations. For example, Luo et al. identified three major research focuses, while analyzing key obstacles and driving forces, including stakeholder engagement, policy and regulatory frameworks, project delivery models, and cost and time performance. Technological performance and economic feasibility were found to be primary concerns for stakeholders [12]. Other scholars have developed quantitative models, such as BIM-based simulations of life-cycle energy consumption [13], and conducted qualitative analyses of green materials in terms of energy efficiency, resource conservation, and environmental impact mitigation [14]. Additionally, several evaluation frameworks have been proposed for specialized engineering contexts, including the “Three-Three” concept for underground projects that systematically considers planning, design, and construction phases alongside environmental, resource, and cost dimensions [15], and low-carbon assessment models for tunnel engineering focusing on carbon reduction, resource utilization efficiency, and ecological protection [16]. Collectively, these studies have contributed to the advancement of comprehensive evaluation methods in green construction. However, as a critical hub within the power system, substations are characterized by a high degree of technological integration and stringent operational safety requirements. Their green construction must not only focus on energy conservation, emission reduction, and resource recycling but also ensure equipment performance and system stability. Meanwhile, substation construction often faces unique environmental constraints, necessitating that the application of novel technologies further integrates considerations of technical feasibility, operational efficiency, and environmental sustainability. Therefore, the comprehensive effectiveness evaluation of novel technologies in green substation construction requires further systematic and refined development.
In the novel technology evaluation section, current studies primarily focus on individual technologies or specific engineering projects. Reference [17] establishes both qualitative and quantitative indicators from the perspective of green and low-carbon substation applications and conducts a subjective evaluation of low-carbon substation schemes using the Analytic Hierarchy Process (AHP). Reference [18], considering the context of renewable energy development, analyzes the influencing factors of technical and economic performance in renewable energy substation projects. An improved TOPSIS evaluation model is constructed, and expert scoring of qualitative indicators is applied to conduct a comparative analysis of the technical implementation performance across 35 substations. Reference [19] establishes a full-process green construction evaluation system for substation engineering projects, covering the planning, design, construction, and delivery phases. The AHP is employed to conduct subjective assessments. Reference [20], considering the complexity and uncertainty of technologies, constructs an evaluation framework for intelligent construction technologies across six dimensions: schedule management, cost management, quality management, safety management, collaborative management, and environmental management. A combination of questionnaire surveys and the Delphi method is used to evaluate the application effectiveness during the construction phase of actual engineering projects. Reference [21] begins with an analysis of the key technical characteristics of substation heating and ventilation systems and proceeds to construct an evaluation framework encompassing energy efficiency, comfort, and economic performance, all of which are subjected to quantitative analysis. Reference [22] establishes a performance evaluation model for water-saving technologies using the life-cycle assessment method, constructing two evaluation dimensions: economic benefits and environmental benefits. The effectiveness of water-saving technology applications during the construction phase is validated through the integrated implementation of different technologies in two engineering projects.
A review of existing research shows that current theoretical work mainly focuses on green construction technology systems and frameworks within the broader construction industry. However, the evaluation of novel technologies in substation green construction faces several key limitations. (1) Most studies examine individual technology or single substation projects, and few conduct horizontal comparative assessments across multiple novel technologies from the perspective of substation sustainability. Engineering projects are typically regarded only as holistic systems reflecting overall performance in green transformation. Few studies have conducted comprehensive evaluations of cross-technology effectiveness of various novel technologies in green construction from the perspective of substation sustainability. Consequently, decision-making for novel technologies in the green transformation of existing substations is limited, making it difficult to support substation expansion and upgrades and the integrated demands of novel power systems. (2) Evaluation indicators are largely limited to the design and construction stages, with insufficient attention to the full life cycle of technology application. Given the long-term operation and maintenance characteristics of substations, the evaluation of novel technologies should not only focus on the feasibility during the construction phase but also fully consider the convenience, reliability, and sustainability during the operation and maintenance stages. Meanwhile, empirical analyses are often confined to isolated indicator data and one-dimensional quantitative assessments, lacking systematic, multi-dimensional evaluation models. (3) Due to the focus on single-technology evaluation and limited operational data, objective weighting is often unfeasible. Most studies adopt single, subjectively assigned weights, making evaluation results vulnerable to expert bias.
Therefore, this paper focuses on the novel technological demands in green construction for substations. From the perspective of the whole life cycle, an evaluation system is developed to assess the application effectiveness of novel substation technologies across multiple stages and dimensions. Furthermore, a comprehensive variable-weight-projection gray target evaluation model is constructed based on AHP group decision and EWM. The key contributions of this paper are outlined as follows:
- (1)
- An index system of application effectiveness has been established to encompass the construction phase as well as the operation and maintenance stage. By systematically incorporating factors such as resource conservation, construction efficiency and difficulty, technological performance, operational reliability, economic benefits, and environmental impact, the framework enables comprehensive life-cycle evaluation of novel technologies, addressing the limitations of prior assessments focused solely on design and construction.
- (2)
- A group decision AHP-EWM weighting approach is proposed. The group AHP approach synthesizes expert judgments from different stages and domains through inter-class and intra-class coefficients, thus effectively integrating expert opinions and minimizing cognitive uncertainty. Subsequently, objective weights derived from EWM are combined with subjective weights, enhancing the alignment of indicator weights with actual performance and improving the objectivity of evaluation outcomes.
- (3)
- A comprehensive variable weight-projection gray target evaluation model with a penalty–reward mechanism is introduced. Considering the scale differences of multi-technology schemes across various substation pilot sites and the inflexibility of fixed-weight evaluations, this model identifies extreme indicator values by constructing positive and negative ideal points. A penalty–reward variable weighting strategy is employed to obtain variable weights for different pilot technology schemes, which are further integrated into the projection-based gray target model. The proposed comprehensive evaluation model effectively enhances the response ability of the evaluation system to changes in key indicators, while improving the adaptability and discrimination of multi-scheme comprehensive evaluation.
The subsequent structure of this paper is organized as follows: Section 2 analyzes the application requirements of novel technologies in green construction for substations. Section 3 introduces the evaluation index system for the application effectiveness of novel technologies in green construction for substations. Section 4 presents the weighting method based on AHP group decision and EWM, and constructs a variable weight-projection gray target model for evaluating the performance of novel technologies in substations. Section 5 describes the case study and comparative analysis of results. Finally, Section 6 concludes the study.
2. Analysis of Novel Technology Requirements in Green Construction for Substations
With the continued advancement of the “dual-carbon” strategy and the accelerating transformation of power grid development, the concept of green construction is reshaping the objectives and technological pathways of substation projects. As the concept of green construction progresses steadily, substation construction increasingly emphasizes a comprehensive approach to resource conservation, environmental protection, system resilience, and compatibility in technology research and application. This emphasis has driven the ongoing development and implementation of related novel technologies. For example, the prefabricated cabin-type modular integration technology, through factory prefabrication and rapid on-site assembly, enhances compatibility and integration capabilities among different equipment and systems. This technology can shorten the construction period of 35–110 kV substations by 40–70% and reduce the occupied area by 25–70%. Meanwhile, by reducing on-site wet operations through this technology, construction energy consumption can be decreased by 30%. Online capacity verification technology enables real-time monitoring of battery capacity and health status, allowing online evaluation of batteries’ remaining life and performance variations. This technology supports battery maintenance and replacement without power interruption, thus avoiding system risks and operational interruptions caused by power outages during conventional inspections.
From the application status of the aforementioned technologies, it can be observed that the research and application of novel technologies for substations not only focus on technical performance itself but also closely align with the core requirements of green construction. These efforts serve to comprehensively enhance infrastructure in terms of resource conservation, environmental friendliness, operational resilience, and system compatibility. Based on this, conducting a demand analysis for novel technologies in the field of green substation construction is considered especially important. Such analysis ensures that, during the research, development, and deployment of novel technologies, their performance advantages are fully utilized while maintaining alignment with the overall direction of green development.
2.1. Resource Conservation and Efficient Utilization
In the context of increasingly stringent land-use regulations and rising raw material prices, green construction urgently requires technological breakthroughs in space reduction, material savings, and improved construction efficiency to enhance the effectiveness of resource utilization in engineering projects. During the construction phase, integrated functionality and compact equipment design should be promoted to reduce land occupation and earthwork volume, while efficient construction techniques are employed to minimize resource waste. In terms of material usage, the application of lightweight, high-strength, and low-consumption components should be accelerated to avoid repeated consumption and support the achievement of resource control objectives throughout the construction process.
2.2. Environmental Friendliness and Low Carbon Emissions
The core value of green construction lies in minimizing the negative environmental impacts during both construction and operation, with a particular focus on carbon emission control and the application of sustainable materials. During the construction phase, novel technologies are expected to reduce the carbon footprint through the substitution of green materials, integration of high-efficiency equipment, and minimization of construction-related disturbances. In the operational phase, the integration of clean energy sources, energy consumption monitoring, and dynamic regulation mechanisms should be promoted to establish a low-carbon operational system. Simultaneously, energy-saving retrofitting and optimization of equipment and systems can be enhanced, contributing to the continuous reduction in environmental burdens during operation and facilitating the green and low-carbon transformation of substations.
2.3. System Resilience and Intelligent Adaptation
Green construction emphasizes not only energy conservation and emission reduction during the initial construction phase, but also the long-term stability, adaptability, and fault tolerance of the built system. In the context of increasing load fluctuations and frequent extreme weather events, substations must demonstrate enhanced risk resistance and intelligent response capabilities. Novel technologies should support sensing systems based on multi-source data fusion, deployment of highly reliable operational equipment, and the integration of proactive control algorithms, enabling real-time monitoring, fault self-healing, and remote dispatching.
2.4. Standardization and System Compatibility
In the systematic advancement of green construction, enhancing the adaptability and coordination efficiency of novel technologies across diverse engineering scenarios has become a critical requirement. By promoting standardized components, unified interfaces, and improved system compatibility, novel technologies can be efficiently deployed and stably operated in multi-station, multi-vendor, and multi-system environments. This approach reduces design modification and debugging coordination costs, minimizes resource waste and collaboration barriers caused by customized development, and improves construction scheduling and system integration efficiency. Technologies with high levels of standardization and compatibility are also more conducive to large-scale integration and cross-regional replication, thereby enhancing the overall consistency of green construction systems.
3. Construction of Evaluation Index System
Guided by the core requirements of green construction, novel technologies integrate modularization, standardization, intelligence, and low-carbonization throughout the entire substation construction process; while enhancing construction efficiency, operational performance, and supporting substation capacity expansion, they also need to address multi-dimensional demands in green transformation. Thus, this study establishes a multi-stage, multi-dimensional evaluation index system (covering the substation’s whole life cycle of construction, operation, and maintenance, based on the integrated application path of novel technologies) and sets seven primary indicators (Building Resource Conservation, Construction Efficiency Improvement, Technical Performance Improvement, Technical Operational Reliability, Technical Scalability, Economic Benefits of Technology Investment, Social and Environmental Benefits) to comprehensively assess their application effectiveness.
These indicators target key aspects of green substation construction: they respond to fundamental needs such as efficient utilization of core resources in construction, optimization of practical efficiency in the construction phase, guarantee of the substation’s core power service capabilities (including functional performance and operational safety), support for large-scale promotion of technologies, balance between green goals and economic rationality for enterprises, and fulfillment of low-carbon development requirements. To ensure rationality and relevance, the indicators align with international standards, national norms, and sustainability frameworks, for example, referencing the “Control Indicators for Industrial Project Land Use” (No. 24 [2008] of the Ministry of Natural Resources) and the “Code for General Layout Design of Industrial Enterprises” (GB 50187-2012) [23], complying with ISO 50001 [24] (Energy Management Systems) and ISO 14001 [25] (Environmental Management Systems), and matching SDGs such as “Sustainable Cities and Communities (SDG 11)” and “Affordable and Clean Energy (SDG 7)”. Meanwhile, they address core concerns of different stakeholders: meeting policy and social demands for resource conservation and low-carbon development, satisfying grid operators’ needs for stable and reliable power supply, responding to enterprises’ considerations of cost and return, and providing a basis for regional technology promotion, thereby forming a comprehensive evaluation framework covering the whole life cycle and multi-dimensional demands of green substation construction. The specific content of this index system is shown in Table 1.
Table 1.
Evaluation index system for the application effectiveness of novel technologies in green construction for substations.
3.1. Building Resource Conservation
Building resource conservation is the foundational objective of substation green construction, requiring minimized consumption of natural resources and reduced environmental impact throughout the project life cycle. This aligns with the “Sustainable Cities and Communities” framework of the Sustainable Development Goals (SDGs), not only echoing the “Enhancing the Inclusiveness, Safety and Sustainability of Urban Space Planning and Management” component’s focus on efficient land use, but also responding to the SDGs’ demand for comprehensive resource efficiency, such as cutting material waste and optimizing earthwork to mitigate ecological disruption. Meanwhile, the “Control Indicators for Industrial Project Land Use” (No. 24 [2008] of the Ministry of Natural Resources) supports multi-dimensional resource conservation: beyond promoting land savings via floor area ratio and building coefficient, its “intensive industrial land use” principle also guides rational control of earthwork and material consumption, in line with international holistic resource efficiency consensus. Driven by technological advancements, substation construction has shifted from extensive resource use to lean, sustainable allocation. The reductions in land, earthwork, and material directly reflect novel technologies effectiveness in enabling efficient resource utilization.
Therefore, this paper selects Land area savings, Earthwork volume reduction, and Material consumption savings as secondary indicators for Building Resource Conservation. These indicator values are derived by calculating the difference in material usage before and after the implementation of novel technologies.
3.2. Construction Efficiency Improvement
The enhancement of construction efficiency is a direct manifestation of how novel technologies empower the high-quality development of green construction. In substation expansion projects, in the early stage of construction, multiple novel technologies rely on modular design and standardized component system to promote prefabricated production and on-site assembly of equipment; precise allocation and dynamic optimization of land, building materials, and construction resources effectively reduce inefficient resource utilization and redundant construction. By optimizing the design of building utilization coefficients and controlling the installation difficulty of novel technology equipment, the systemic impact of novel technologies on work efficiency in green construction can be systematically evaluated. Based on this, this paper identifies building utilization coefficient improvement and difficulty coefficient of novel technology installation as secondary indicators for construction efficiency enhancement.
- (1)
- Building utilization coefficient improvement: In alignment with the SDGs’ requirement to “optimize urban spatial utilization,” reducing land occupation through improved building efficiency is essential. The “Code for General Layout Design of Industrial Enterprises” (GB 50187-2012) also emphasizes “enhancing the rationality of plant layouts,” which aligns with the international concept of “compact cities.” The improvement in construction efficiency serves as a tangible demonstration of how novel technologies empower high-quality green development in construction. It is shown that the use efficiency of building space is improved after the adoption of novel technology in the process of substation construction.
In the formula, represents the building utilization coefficient improvement, represents the building volume of the conventional scheme configuration area, and represents the building volume of the novel technology configuration area.
- (2)
- Difficulty coefficient of novel technology installation: The conventional technology and novel technology are compared in terms of process steps, labor, tools and space to quantify the difference in installation difficulty.
In the formula, represents the difficulty coefficient of novel technology installation; denotes the required procedures for conventional equipment installation; indicates the necessary procedures for installing novel technologies and equipment; stands for labor requirements for conventional equipment installation; corresponds to labor needs for novel technology and equipment installation; reflects the number of tools required for conventional equipment installation; indicates tool quantities needed for novel technology and equipment installation; specifies the operational space required for conventional equipment installation; represents the operational space needed for novel technology and equipment installation.
3.3. Technical Performance Improvement
Green construction not only pursues energy conservation and environmental protection during the building process but also emphasizes the optimization level of the operational performance of the engineering system itself. The introduction of novel technologies, while ensuring the achievement of green construction goals, also requires synergistic effects in enhancing the overall comprehensive performance of substations. Therefore, this paper adopts dispatch system fault response time reduction, substation equivalent utilization rate improvement, and disaster resilience capability enhancement as secondary indicators for evaluating technical performance improvements. The specific values of these indicators will be calculated based on the differences in relevant metrics before and after the implementation of novel technologies in substations.
3.4. Technical Operational Reliability
The primary task of deploying novel technologies is to ensure the reliability and safety of substations during operation and maintenance phases. Through technical means such as online monitoring, intelligent maintenance, and remote control, the operational stability and self-healing capabilities of substation equipment have been significantly enhanced. Among these, operational power supply reliability and maintenance capabilities serve as critical supports for ensuring the resilience and secure, stable response of the power system. Therefore, power supply reliability improvement, maintenance outage duration reduction, maintenance difficulty coefficient for novel technologies, and repair difficulty coefficient for novel technologies are established as secondary indicators for evaluating technical operational reliability.
The scoring method for maintenance difficulty coefficient and repair difficulty coefficient is set as follows:
For new equipment and novel technology maintenance difficulty coefficient, a comprehensive evaluation is conducted based on whether the equipment itself and the layout of the formed power distribution device affect daily maintenance. It is divided into three levels: Level 1, which is more conducive to daily maintenance, is assigned 9 points; Level 2, which has almost no impact on daily maintenance work, is assigned 6 points; and Level 3, which increases the difficulty of daily maintenance work, is assigned 3 points. The scoring method for novel technology repair difficulty coefficient is similar to this indicator.
3.5. Technical Scalability
Green construction emphasizes the standardization and replicability of technologies, while the scalability of technologies directly determines their promotion value within a region or even broader areas. Against the backdrop of continuously growing demand for green transformation, the strong sustainability and compatibility of novel substation technologies can support rapid deployment in multi-scenario and multi-type engineering projects during later stages of substation development. Technical scalability must intuitively reflect whether novel technologies meet the conditions for large-scale application while ensuring their adaptability to future expansion needs throughout their entire life cycle, thereby avoiding large-scale retrofitting due to subsequent technological iterations. Based on this, this paper adopts sustainability of novel technologies [26] and provincial-level scalability ratio for similar projects as secondary indicators for technical scalability.
Among them, the provincial-level scalability ratio is designed in accordance with the requirements of “knowledge and technology sharing” in “Strengthening Global Partnership” of SDGs, and the influence of sustainable development will be expanded by promoting advanced technologies; to quantify the provincial-level scalability ratio for similar projects, the calculation formula is derived as follows:
In the formula, indicates the proportion of similar projects within the province that can be promoted, represents the number of projects where novel technologies and equipment can be applied, and denotes the total number of projects in the province.
3.6. Economic Benefits of Technology Investment
Green construction must balance environmental responsibility with economic rationality, as cost-effectiveness is a key factor determining whether novel technologies can achieve large-scale deployment. Under green construction requirements, novel technologies demonstrate significant cost-reduction and efficiency-enhancing characteristics by lowering construction costs, optimizing operation and maintenance expenditures, and increasing electricity sales revenue. Meanwhile, the shortened investment payback period reflects the shift of green construction from a cost center to a value center. Based on this, this paper adopts investment and construction cost savings [27], operation and maintenance cost savings [28], electricity sales revenue growth, and investment payback period reduction as secondary indicators for evaluating the economic benefits of technology investment.
Among them, electricity sales revenue growth indirectly supports SDG 7 “Energy affordability” through income feedback to reduce user costs while meeting the requirements of ISO 50001 [24] “Economically sustainable energy systems”; it is calculated by combining outage duration savings, construction time savings, average load, and electricity price.
In the formula, represents the electricity sales revenue growth, represents the annual outage duration of conventional substations, represents the annual outage duration of substations after applying novel technologies, represents the savings in substation construction time, represents the average load of the substation, and represents the average electricity price.
3.7. Social and Environmental Benefits
The ultimate value of green construction is reflected in the improvement of environmental quality and the promotion of sustainable social development. By reducing environmental footprints, it can address external societal demands for green, low-carbon substations and public safety responsibilities. Among these, the reduction in carbon emissions during the construction and operation phases of substations can effectively evaluate the contribution of technologies to carbon reduction. Therefore, this paper categorizes carbon emission reduction in substation construction and carbon emission reduction in substation operation as secondary indicators under the dimension of social and environmental benefits.
- (1)
- Carbon emission reduction in substation construction: The carbon emission reduction during the construction phase is characterized by the product of material savings and the carbon emissions per unit of material. The calculation methodology of this indicator aligns with the core principles of building carbon emission quantification outlined in the “Building Carbon Emission Calculation Standard” (GB/T 51366-2019) [29], which establishes a benchmark for quantifying construction-phase emissions. Concurrently, the energy efficiency requirements specified in the “Technical Standard for Near-Zero Energy Buildings” (GB/T 51350-2019) [30] provide actionable guidance for reducing carbon emissions during construction. Furthermore, the group standard “Guidelines for Low-Carbon Design of Substations Based on Life Cycle Assessment” (T/CES 258-2023) [31] establishes technical requirements for low-carbon design in substation construction phases through a comprehensive life cycle carbon reduction framework, offering practical implementation pathways to achieve this indicator.
In the formula, represents the reduction in carbon emissions from substation construction, represents the quantity of various materials saved through the application of novel technologies and equipment in substation construction, and represents the carbon emissions generated per unit of production and consumption of each material.
- (2)
- Carbon emission reduction in substation operation: The carbon reduction effect during the operational phase is characterized by the difference in annual carbon emissions between conventional and novel technology applications. The “General Rules for Accounting and Reporting of Greenhouse Gas Emissions in Industrial Enterprises” (GB/T 32150-2015) [32] provides core principles for greenhouse gas accounting during the operational phase. Meanwhile, the group standard “Guidelines for Low-Carbon Design of Substations Based on Life Cycle Assessment” (T/CES 258-2023) [31] establishes practical requirements for implementing carbon reduction measures, such as adopting high-efficiency equipment, during the operational phase to achieve this indicator.
In the formula, represents the reduction in operational carbon emissions from substations, represents the annual carbon emissions of conventional substations, and represents the annual carbon emissions of novel technology substations.
4. Construction of Evaluation Method Based on Variable Weight-Projection Gray Target Model
4.1. Evaluation Model Framework
Under the background of green construction, substations, as the core supporting facilities of power systems, are continuously applying novel technologies to achieve substation transformation. Faced with technology selection and evaluation scenarios involving multiple parallel technologies and competing solutions, traditional evaluation methods suffer from strong subjectivity and are inadequate for effectively supporting decision-making in the selection of novel technologies for green construction. Moreover, as most novel technologies are in the pilot stage, the limited test data leads to significant deviations in evaluation results when relying solely on subjective or objective weighting methods. To address these issues, this paper integrates the advantages of subjective and objective weighting by adopting an improved AHP group decision method combined with the entropy weight method (EWM) to establish a composite weighting approach. The AHP group decision process incorporates evaluations from experts across different stages and domains, categorizing them based on Pearson correlation coefficients. Within each category, a consistency ratio weighting mechanism is introduced to enhance the contribution of experts with high judgment reliability, thereby minimizing the uncertainty arising from expert cognition. Furthermore, the entropy weight method (EWM) is employed to derive a weight vector that reflects objective information disparities. The composite weights integrating subjective and objective factors are then constructed through linear weighting. Additionally, to mitigate the impact of differences in pilot scale among multiple technology solutions across substations and to enhance the evaluation model responsiveness to performance disparities of novel technology solutions across various indicator dimensions, this paper introduces a penalty–reward mechanism to establish a dynamic variable-weight function. Based on positive and negative target benchmarks, the dominance of indicators is dynamically adjusted to refine the composite weights. Finally, to more accurately characterize the alignment between each technology solution and indicator dimensions, the projection closeness of each solution toward the positive target direction is calculated using vector projection principles, building upon indicator dominance. This approach combines distance measurement and directional consistency assessment, enabling a horizontal comparison of the comprehensive application efficacy of multiple technology solutions across substations of varying scales.
Based on the above, this paper proposes an effectiveness evaluation model for novel technology applications in substations, which combines the AHP group decision–EWM with a variable weight-projection gray target decision model. The evaluation flowchart is shown in Figure 1. First, by integrating the effectiveness index system for novel technology applications, the inter-class and intra-class coefficients are calculated based on expert ratings to derive the integrated subjective weights. The objective weights are obtained using the EWM method from the original evaluation data, and the combined weights are determined through linear weighting. Next, the combined weights are dynamically adjusted based on the indicator superiority degrees to obtain variable weights for different categories of novel technologies. Finally, the comprehensive evaluation results for various novel technologies are calculated using the variable weight-projection gray target decision model.
Figure 1.
Flow chart of the evaluation algorithm.
4.2. AHP Group Decision–EWM Combination Variable-Weight Model
4.2.1. Subjective Weight Based on AHP Group Decision
The AHP method combines qualitative and quantitative analysis, effectively addressing multi-criteria decision-making in comprehensive evaluations. However, judgments from a single expert are highly subjective and prone to bias due to uncertainty and cognitive ambiguity [33]. By aggregating weighting information from multiple experts through group decision-making, extreme subjective biases can be mitigated, enhancing the scientific rigor and stability of subjective weights. The calculation process is as follows:
- (1)
- Construct the judgment matrix and consistency test
Due to the inconsistency of the nine-point scale method with the consistency of thought, the assignment error is relatively large, in addition, the exponential scale method has significant superiority in consistency and weight fitting. In this paper, the exponential scale method is adopted to construct the judgment matrix. On the basis of the expert opinions, the maximum eigenvalue and its eigenvector are calculated through the judgment matrix.
- (2)
- Consistency check
The consistency ratio index is used to measure the degree of consistency of the judgment matrix. When , the judgment matrix meets the consistency requirement; otherwise, it needs to be modified. The relevant calculation formula is as follows:
In the formula, is the number of indicators, is the consistency index, and is the average random consistency index.
- (3)
- Determine the weights of the indicators
After normalization, the eigenvectors represent the relative weights of the indicators at the same layer for those at the upper layer. Then, a hierarchical total ranking is conducted to obtain the weight vector of the indicators relative to the highest-level indicators .
- (4)
- Calculate integration weights through group decision
Suppose there are experts in total; then, the weight matrix obtained from the opinions of the expert is as follows:
The steps for determining the integrated subjective weights through group decision-making are as follows:
- a.
- Utilize the following formula to calculate the Pearson correlation coefficient among expert opinions, and then perform normalization processing to obtain the correlation coefficient matrix.
- b.
- Calculate the inter-class weights
Cluster analysis was employed to classify experts. Based on the expert opinion correlation matrix, a threshold was selected. For each row of the matrix, experts whose off-diagonal correlation coefficients with the expert exceeded were identified and grouped into subsets. Subsets with non-empty intersections were merged to obtain the final classification results. Suppose experts were divided into categories, with the category containing experts. The inter-class weight was then calculated as follows:
where represents the inter-class weight of the category.
- c.
- Calculate the intra-class weights
Determine the intra-class weights by using the weighting method based on the consistency ratio:
where , denote the intra-class weight of expert and its consistency ratio index, respectively. is the adjustment factor, and is taken.
The calculation formula for the integrated weight of group decision-making is
4.2.2. Objective Weight Based on EWM
The entropy weight method is an objective weighting approach, whose fundamental principle involves calculating information entropy to reflect the degree of variation in the evaluation of each indicator and the contribution of the indicator in providing effective information, thereby determining the relative importance of the indicator in a comprehensive evaluation [34]. The calculation process is as follows:
- (1)
- Standardization Processing
Since the measurement units of various indicators are not uniform, it is necessary to perform standardization before using them to calculate comprehensive indicators. This involves converting absolute values of the indicators into relative values, thereby resolving the homogenization issue of different qualitative indicator values.
Additionally, the meanings represented by the values of positive and negative indicators differ (higher values are better for positive indicators, while lower values are better for negative indicators). Therefore, different algorithms must be employed for the data standardization processing of positive and negative indicators:
For positive indicators, Equation (14) is applied for standardization processing; for negative indicators, Equation (15) is applied for standardization processing.
- (2)
- Calculate the proportion of the value of the -th alternative under the -th indicator relative to that indicator:
- (3)
- Calculate the entropy value
Calculate the entropy value of the -th indicator:
Among them, satisfies .
- (4)
- Calculating Redundancy
Compute the Information Entropy Redundancy:
- (5)
- Calculate weights
Calculate the weights of each indicator:
4.2.3. Combined Weight
The objective function is established with the goal of minimizing the sum of squared deviations between “the deviation between the combined weight and the improved AHP weight” and “the deviation between the combined weight and the entropy weight method weight.” The optimal combined weight result is obtained when the sum of the squares of the two deviations between the combined weights and the subjective and objective weights is the smallest.
Here, represents the minimum objective function, and is the combined weight of the indicator after the combination of two weighting methods. is a linear combination of and . is the proportion of the weight of the subjective preference coefficient in the combined weight. is the weight of the AHP group decision method for the indicator. is the proportion of the objective preference coefficient in the combined weight. is the weight of the EWM for the indicator.
4.2.4. Dynamic Revision of Combined Weights Based on Variable-Weight Theory
- (1)
- Variable-weight theory
The concept of variable weight involves dynamically adjusting indicator weights based on their values during evaluation, ensuring a more accurate reflection of their impact on the results [35].
Definition 1.
A set of
-dimensional variable weights refers to
mappings, satisfying the following:
- a.
- Normalization: ;
- b.
- Continuity: , continuous with respect to each variable ;
- c.
- Monotonicity: , where the variable is monotonically increasing (incentive type) or monotonically decreasing (punishment type).
Taking any constant-weight vector that satisfies the normalization, continuity, and monotonicity conditions in Definition 1,
In the equation, represents the variable-weight vector composed of state variable-weight functions, where , and represents the corresponding variable-weight vector.
- (2)
- Calculate Indicator Dominance Degree
Referring to the idea of the gray target decision-making method, this paper defines the positive and negative target centers as the ideal schemes. By applying the Gaussian criterion, the projection value of the difference between the inferior information and the superior information of the indicator is converted into the indicator dominance degree, so as to measure the advantages and disadvantages of the indicator.
Definition 2.
Let
be the standardized evaluation matrix, where
represents the standardized evaluation value of the evaluation indicator . For the
column of the matrix , denote , . The evaluation value corresponding to the location of
is , and
is referred to as the positive target center of the gray target. The evaluation value corresponding to the location of
is
, and
is referred to as the negative target center of the gray target.
Definition 3.
For evaluation object ,
is the corresponding standardized evaluation value of indicator . Then the dominance degree of
under
is
:
Figure 2.
Dominance function.
According to Equation (20), the dominance degree of each indicator under each evaluation object is calculated, and the constructed dominance degree matrix is .
- (3)
- Determine the state variable-weight function
The function of the state variable-weight function is to adjust the weights according to the specific states of the indicators. According to the characteristic novel technologies, the value of the state variable-weight function should meet the following principles:
- Enhance the attention to extreme indicators. When the dominance of a certain indicator is very low, even if its constant weight is relatively large, it will significantly reduce the overall effectiveness. Similarly, when the dominance of a certain indicator is very high, even if its constant weight is very low, it will significantly enhance the overall system effectiveness. Therefore, during variable weighting, the weights of indicators with low dominance are penalized, while the weights of indicators with high dominance are incentivized.
- The incentive amplitude should be smaller than the penalty amplitude. When the dominance of a certain indicator is very low, the overall effectiveness will significantly decrease. However, when the dominance of a certain indicator is relatively high, the improvement in overall effectiveness may not be very pronounced.
- The sensitivity of the penalty-incentive should correspond to the magnitude of the constant weight.
According to principles above, the penalty-incentive-type local state variable-weight function based on the indicator dominance degree is constructed as follows:
where and respectively represent the critical values of penalty and incentive, their values are determined by the K-means algorithm which are clustered into three categories, and the intermediate value of the adjacent clustering centers is taken as the critical values of penalty and incentive. The variation in the variable-weight function with respect to parameter is shown in Table 2. It represents the amplitude ratio between incentive and penalty.
Table 2.
The variation in the variable-weight function.
Combined with Equation (20), the variable weight of the indicator of the evaluation object is obtained as follows:
4.3. Integrated Evaluation Model Based on Projected Gray Target Decision Model
According to Definitions 2 and 3, the positive target distance is , negative target distance is , and mean distance is . Combining with the weights derived from Equation (26), the weighted positive target distances , weighted negative target distances , and mean weighted distances between positive and negative targets are computed.
Based on projection theory, the projected target distances of evaluation objects are calculated. Let the angle between the evaluation object and be . According to the cosine law, the projection of onto is , and the projection of onto is similarly.
The projected target distance of evaluation objects is used as the value of application effectiveness. The projected target distance of the evaluation object is .
Taking the projection bullseye distance of the evaluation object as the effectiveness metric, the greater the projection bullseye distance, the higher the comprehensive system effectiveness, and the higher the ranking of the evaluation object.
5. Example Analysis
This paper selects four novel technology operation schemes from pilot substations in a provincial power grid as evaluation objects: hybrid gas-insulated switchgear with dual-circuit breaker integration (HGIS), improved 110 kV single-bus three-sectionalization technology (IST), rack-mounted prefabricated secondary combination equipment cabin (RPE), and distributed parallel DC power supply system (DDC). The core selection criteria are the technologies’ technical representativeness, practical verification and innovative value: in technical maturity and coverage, HGIS was first used in 220 kV substations, saves 26.82% of floor area and is national award-winning; IST is promoted in 110 kV substation renovations to narrow expansion outage scope; DDC system cuts maintenance by over 50% and is a key promoted technology for green substations. In innovation and standard compliance, RPE adheres to China Grid’s “prefabrication and standardization” via factory production and “plug-and-play” wiring and has a utility model patent; HGIS aligns with “green low-carbon” requirements, while the DC system meets “safe and reliable” standards. Collectively, the four technologies cover equipment integration, connection optimization, secondary equipment prefabrication and DC power supply across the whole life cycle, reflecting efficiency differences to support horizontal comparison.
On the basis of the above model, the comprehensive application effectiveness and advantageous and disadvantageous links of the four novel technologies are assessed and compared.
5.1. Base Data and Standardization Processing
Based on the operational data from the commissioning and applying substation of the novel technologies, standardization processing is performed, as shown in Table 3.
Table 3.
Standardized application efficacy metrics of novel technologies.
5.2. Indicator Weight Calculation
5.2.1. Calculate the Combination Weights
This paper is based on the opinions of multiple experts from different fields such as building construction and substation operation and maintenance. According to their judgment matrices, obtain the weights as Table 4:
Table 4.
The subjective weights of single expert and the AHP group decision.
From Table 4, distinct patterns in weight allocation among experts from different fields can be observed. Expert 1, with extensive operation and maintenance experience, assigns greater weight to indicators tied to operational stability, such as Improvement in Power Supply Reliability (C41) and Reduction in Maintenance Outage Duration (C42), reflecting the priority placed on uninterrupted power supply. Expert 2, from the planning field, emphasizes forward-looking indicators, notably Sustainability of Novel Technologies (C51) and Provincial-Level Scalability Ratio (C52), to ensure technological adaptability and long-term viability in green construction. Expert 3, with a construction background, focuses on resource conservation and efficiency, giving higher weights to Improvement in Building Utilization Coefficient (C21) and Difficulty Coefficient of Novel Technology Installation (C22), as these factors directly influence progress, cost, and energy consumption during construction. The subjective integrated weights are further obtained based on the inter-class and intra-class coefficients. Through group decision-making, these complementary perspectives are integrated, enabling a more balanced and comprehensive evaluation framework that accounts for both immediate operational needs and long-term sustainability goals.
Then, the objective weights for evaluating novel technologies are derived through the entropy weight method (EWM). The combined weights are obtained by integrating subjective and objective weighting, which are used as the initial combined constant weights, as shown in Table 5.
Table 5.
Weights of primary and secondary indicators.
From the results of subjective weight assignment, the overall weight of operation and maintenance-related indicators is significantly higher than that of resource-saving indicators in the construction stage. This is highly consistent with the actual demands of substation construction and operation and maintenance in the time span of the whole life cycle. In the context of green construction, expert decision-making not only pursues resource compression in the construction link but also pays more attention to energy conservation, emission reduction, and stability improvement in the operation stage. Compared with the emphasis on environmental benefits and the weakening of the construction stage in objective weight assignment, the subjective integrated weights can better balance the comprehensive consideration of experts between the control of initial resource input and the realization of long-term benefits.
5.2.2. Dynamic Correction of Combined Weights Based on Variable-Weight Theory
- (1)
- Determine the index dominance.
Calculate the dominance matrix of each index of the novel technology based on Formula (19), and the result of the dominance matrix is shown in Figure 3.
Figure 3.
Dominance matrix for four types of novel technologies.
- (2)
- Calculate the variable weight of the indicators.
Apply the K-means algorithm to analyze the index dominance . It is easy to judge from Equation (25) that the independent variable values of the local state variable-weight function are divided into three regions. Therefore, when clustering, the number of clusters is set to 3, and the three cluster centers are obtained as , and . Then the penalty threshold and the incentive threshold are and , respectively. Combining with Equation (22), the variable weight is calculated as shown in Table 6.
Table 6.
The variable weights for four types of novel technologies.
As can be seen from Table 5, based on the principle of the whole-process integration of green construction with novel technologies, the proportions of the construction and operation phases account for approximately 25% and 75%, respectively. The stage of operation and maintenance plays a dominant role in the comprehensive efficiency, which fully reflects the core concept of green construction that emphasizes the whole-life-cycle management. Among them, the weight of the operation carbon emission reduction index is as high as 0.0685, which is close to the level of traditional key indicators. This indicates that the current green construction evaluation is not only limited to resource conservation and material optimization during the construction phase, but also strengthens the consideration of low-carbon performance during the operation period. Under the background of the “dual-carbon” strategy, the selection and integration of novel technologies for substations increasingly emphasize the green contribution of the operation phase. By integrating high-efficiency equipment, intensive structural design, and intelligent operation and maintenance means, it aims to maximize the carbon benefit per unit of investment and promote the evolution of green construction from material and energy conservation in the initial construction stage to carbon reduction and efficiency improvement in the whole process. In addition, economy and reliability, as the key supports to ensure the sustainable commissioning and safe operation of green construction projects, are the most intuitive attractions for the engineering commissioning and application of novel technologies. Their combined comprehensive weight exceeds 38%. The single-item weight of the novel technology reliability improvement index reaches 0.0753. This coordinated orientation of green performance and operation and maintenance safety not only strengthens the expected contribution of novel technologies to the whole-life-cycle value of substations, but also further confirms the development trend of green construction transforming from single-point energy conservation to optimal system benefits.
Combining Figure 3 and Table 6, in the variable weights obtained through dynamic correction based on the combined weights, the variable weights of each primary indicator are basically consistent with the constant weights. The variable weights of the second-level indicators are adjusted according to the indicator dominance. As a measurement basis for the relative performance of different technical solutions on each indicator, the dominance guides the adjustment of weights in a direction more sensitive to the performance of superiority and inferiority. The weight adjustment range for extreme values exceeds 10%. The indicators in the superiority and inferiority intervals have significantly increased weights. For example, the high dominance of RPE in C31 and the low dominance of DDC in C12 are enhanced to varying degrees in the variable weights adjustment. This mechanism avoids the evaluation blind spots caused by structural masking under fixed weights, enabling the evaluation results to not only magnify the leading position of superior indicators but also highlight the negative impact of key weaknesses on the overall effectiveness. At the same time, the model keeps the weights of indicators with medium dominance basically stable, avoiding unnecessary drastic fluctuations. This variable-weight idea can more effectively reflect the real performance of different technologies in the pilot applications of different types of substations in scenarios where the application differences of novel technologies are significant, which helps to achieve the identification of technical effectiveness with horizontal comparability and vertical difference visibility.
5.3. Evaluation Results and Analysis of the Application Efficiency of Novel Technologies
5.3.1. Evaluation Results
According to Equations (26)–(30), the multi-dimensional evaluation results of the application effectiveness of the four types of novel technologies under the variable-weight method are shown in Figure 4. Also, based on the variable weights of each technology, the comprehensive application effectiveness results are obtained, as shown in Table 7.
Figure 4.
Comparison of the results of the primary indicators of the application effectiveness of four types of novel technologies under the variable-weight method.
Table 7.
Novel technology application effectiveness scores under the positive and negative bullseye distance evaluation method.
As can be seen from Table 7, based on the results of the variable-weight-projection target center distance, the evaluation objects are ranked, and the comprehensive application effectiveness of DDC is the best, followed by HGIS, and the comprehensive effectiveness of IST is the worst. Combined with Figure 4, it can be seen that the modularization of the distributed parallel DC power system shows strong adaptability and integration advantages in the whole process of green construction. Its modular design significantly improves the construction convenience and equipment integration efficiency in the construction stage. At the same time, through the configuration of the management mechanism for battery online capacity checking, real-time perception of the battery operating status and replacement without power outage are realized. This strengthens the reliability and maintenance flexibility in the operation stage. It also achieves both safe operation and energy conservation in the whole life cycle of green construction. The dual-circuit breaker integrated equipment is outstanding in terms of space-intensive utilization. Through the parallel arrangement of the busbar and the double-layer outgoing line method, the station area occupation is effectively reduced. It also reduces the line crossing risk. This provides technical support for flexible layout under complex terrain and limited site conditions. In the operation stage, it has characteristics of easy expansion, small power outage range and short power outage time. These characteristics significantly improve the construction efficiency and operation continuity. It also has good system compatibility and regional promotion potential. Moreover, it possesses both the structural flexibility of green construction and the coordination of construction and maintenance.
In comparison, the comprehensive performance evaluation results of IST and RPE are relatively low, mainly due to their insufficient adaptability under the requirements of green construction. These two types of technologies have problems in actual applications, such as low compatibility with the existing substation line structure and capacity configuration, resulting in complex system integration and low spatial layout efficiency. At the same time, due to the large differences in connection methods, the difficulty of construction coordination increases, the workload of later operation and maintenance increases, and the flexibility of expansion and transformation is insufficient. The above characteristics deviate to a certain extent from the direction of “standardization, modularization, easy maintenance, and expandability” advocated by green construction, affecting their promotion value in multiple scenarios and long-term engineering benefits.
In summary, novel technologies with outstanding overall performance often combine two aspects. One is the spatial compactness and system integration efficiency during the construction phase. The other is the high reliability and low-carbon operation and maintenance characteristics during the operation phase. This combination enables the coordinated optimization of performance in all aspects of green construction throughout the whole life cycle. Therefore, from the perspective of the practical application of new technologies, HGIS and DDC have strong adaptability and spatial integration advantages, with good potential for regional promotion and a high promotion priority at present. Among them, HGIS can optimize space utilization and has strong expansion flexibility, making it suitable for promotion in areas with scarce land resources. DDC has high construction efficiency and low power outage risk, making it suitable for situations with high reliability requirements. However, IST and RPE have insufficient adaptability under the requirements of green construction, and their current promotion priority is low. It is recommended to improve configuration compatibility, reduce differences in connection methods, and enhance technical flexibility before promotion.
5.3.2. Comparative Analysis of Weighting Methods
To better illustrate the rationality of the variable-weight method in evaluating different types of novel technologies in substations under the background of green construction, this paper conducts a comparative analysis of the comprehensive evaluation and primary indicators under the variable-weight and constant-weight methods.
The comprehensive effectiveness evaluation and ranking results of the four novel technologies through constant weights are shown in Table 7, and the evaluation results of the primary indicators of the application effectiveness of the corresponding novel technologies are shown in Figure 5. Under the variable-weight and constant-weight methods, the ranking results of the comprehensive evaluation of the novel technologies do not change significantly, but the gap in their comprehensive scores increases. By comparing Figure 4 and Figure 5, it can be seen that when the effectiveness evaluation results of multiple novel technologies are close, the fixed-weight method is prone to the problem of ambiguous ranking. Under the variable-weight method, the various indicators of the novel technology evaluation are significantly differentiated in different dimensions, improving the performance comparison and selection of similar technologies and the reliability of decision-making support.
Figure 5.
Comparison of the results of the primary indicators of the application effectiveness of four types of novel technologies under the constant-weight method.
The variable-weight method significantly enhances the contribution of key superior indicators, highlighting the technical characteristics. The variable-weight mechanism assigns incentive dynamic weights to advantageous indicators, magnifying the core advantages of a certain technology, thereby enhancing its influence in the comprehensive effectiveness. At the same time, through measurement by the dominance function, punitive weight adjustments are implemented for poorly performing indicators to strengthen their negative impact.
6. Conclusions
Under the green transformation of energy infrastructure, this paper proposes a comprehensive evaluation framework for the application effectiveness of novel technologies in green substation construction to facilitate their green transformation and upgrading. Compared with existing studies, this work conducts an application demand analysis based on the current status of novel green construction technologies in substations and, from a full-life-cycle perspective, develops a multi-stage and multi-dimensional evaluation index system for application effectiveness. Moreover, an AHP group decision–EWM combined variable-weight evaluation method is established to enable horizontal comparisons of various novel technologies under different technological characteristics and application scales. Through the evaluation and analysis of the example, the following conclusions can be drawn:
- (1)
- In the context of green construction, evaluation has increasingly focused on low-carbon operation and synergistic efficiency across the full life cycle, while technical reliability and economic performance remain core criteria.
- (2)
- The empirical analysis of the pilot applications of novel technologies in a certain province shows that novel technologies such as distributed parallel DC power supply systems and HGIS are efficient during construction, have low carbon emissions, and are reliable during operation, achieving coordinated life-cycle optimization and high comprehensive application efficiency with strong promotion potential.
- (3)
- The proposed variable weight-projection gray target method provides an effective tool for horizontal comparison of novel technologies with different characteristics. It enhances discrimination in evaluation by clearly identifying relative strengths and weaknesses, thereby improving the reliability of comparative results. This method not only supports decision-making for substation capacity expansion and transformation, but also offers data-driven insights for the subsequent optimization and refinement of novel technologies.
However, the proposed methodology in this paper also has some limitations, which we aim to resolve in future studies. In the current study, many related technologies remain at the pilot or early deployment stages, resulting in limited practical application data and long-term operational outcomes, and predominantly single-scenario applications. In the future, we will further investigate the generalizability of the variable-weight evaluation method in assessing regional differences, ensuring its applicability across diverse substation contexts and scales. We will develop more reliable evaluation models and conduct extensive empirical evaluations to guide decision-making for substation technology deployment, thereby promoting low-carbon and zero-carbon development of substations.
Author Contributions
Y.W. and J.S. contributed to conception and design of this study; methodology and validation, F.G. and Y.W.; investigation, Y.Z. and X.S.; writing—original draft preparation, Z.W. and Y.W.; writing—review and editing, H.Q. and W.X.; visualization, Z.W. and J.S. All authors have read and agreed to the published version of the manuscript.
Funding
This research was financially supported by State Grid Henan Electric Power Economic and Technology Research Institute science and technology project “Research on the Application Efficiency Evaluation System of New Technologies in Substations”, (grant number: SGHAYJ00SJJS2400045), the Fundamental Research Funds for the Central Universities (grant number: 2025MS167).
Data Availability Statement
Data are contained within the article.
Conflicts of Interest
The authors declare no conflicts of interest.
References
- Sun, L.; Xiao, X.; Zhu, T.; Lu, Y.; Zhang, W.; Wang, N. Green Construction in China: Development Concepts, Leading Directions, and Technological Innovations. J. Eng. Sci. 2024, 26, 190–201. [Google Scholar]
- Caldarelli, V.; Filipponi, M.; Saetta, S.; Rossi, F. Lean and green production for the modular construction. Procedia Comput. Sci. 2022, 200, 1298–1307. [Google Scholar] [CrossRef] [Scilit]
- Xing, W.; Wang, Z.; Tang, Z. Research on the Application of Green Construction Technology in Building Construction. Hous. Ind. 2025, 4, 233–234. [Google Scholar]
- Santos, G.R.; Zancul, E.; Manassero, G.; Spinola, M. From conventional to smart substations: A classification model. Electr. Power Syst. Res. 2024, 226, 109887. [Google Scholar] [CrossRef] [Scilit]
- Wangsa, I.D.; Vanany, I.; Siswanto, N. A sustainable supply chain coordination model with an investment in green technology and electric equipment. Int. J. Syst. Sci. Oper. Logist. 2023, 10, 2221078. [Google Scholar] [CrossRef] [Scilit]
- Li, T.; Guo, J.; Hu, S.; Chai, L.; Jing, Z.; Cheng, R.; Wang, Z. Research on the design of the integrated wall panel of the prefabricated building in substations. J. Phys. Conf. Ser. 2021, 1904, 012026. [Google Scholar] [CrossRef] [Scilit]
- Vahedi, S.; Banejad, M.; Assili, M. GIS-Based Substation Expansion Planning. IEEE Syst. J. 2021, 15, 959–970. [Google Scholar] [CrossRef] [Scilit]
- Huang, B.; Qin, Y. Research on Intelligent Power Consumption Reduction Technology of Substation. Transformer 2020, 57, 89. [Google Scholar]
- Cheng, Z.; Jiang, J.; Zhou, H.; Zhang, X.; Wu, Z.; Xu, Z.; Chen, X. Life cycle carbon dioxide emissions of a typical 500 kV substation: Design, production, construction, operation, and recycling. Electr. Eng. 2025, 107, 1–12. [Google Scholar] [CrossRef] [Scilit]
- Yu, Z.; Sun, J. Green Cooperation Strategy of Prefabricated Building Supply Chain Based on Smart Construction Management Platform. Sustainability 2023, 15, 15882. [Google Scholar] [CrossRef] [Scilit]
- Zhao, Y.; Sun, Q.; Wei, T.; Wang, B.; Gong, L. Study on Green Construction Evaluation System of Prefabricated Buildings. Build. Sci. 2022, 38, 134–140. [Google Scholar]
- Luo, W.; Sandanayake, M.; Hou, L.; Tan, Y.; Zhang, G. A systematic review of green construction research using scientometrics methods. J. Clean. Prod. 2022, 366, 132710. [Google Scholar] [CrossRef] [Scilit]
- Wang, D. Application of BIM and Green Construction Technology in Building Lifecycle Management. Green Constr. Intell. Build. 2025, 6, 85–87. [Google Scholar]
- Iwuanyanwu, O.; Gil-Ozoudeh, I.; Okwandu, A.C.; Ike, C.S. The role of green building materials in sustainable architecture: Innovations, challenges, and future trends. Int. J. Appl. Res. Soc. Sci. 2024, 6, 1935–1950. [Google Scholar] [CrossRef] [Scilit]
- You, X.; Wang, Q.; Lu, Z.; Du, J. Theoretical Exploration and Technical Practice of Green Construction in Underground Engineering. Chin. J. Undergr. Space Eng. 2025, 21, 367–375+402. [Google Scholar]
- Lv, G.; Liu, J.; Yu, C.; Chen, H.; Zhao, Y.; Shi, S. Practice and Prospect of Green and Low-Carbon Construction Technology for Railway Tunnels. Tunn. Constr. 2024, 44, 633–642. [Google Scholar]
- Li, S.; Hu, Y.; Xu, F. Analysis of Green and Low-carbon Applications in Substation Engineering. Earthq. Resist. Eng. Retrofit. 2024, 46, 182. [Google Scholar]
- Wu, H.; Zou, M.; Ke, Y.; Ou, W.; Li, Y.; Ye, M. Effect Evaluation and Intelligent Prediction of Power Substation Project Considering New Energy. CMES-Comput. Model. Eng. Sci. 2022, 132, 739–761. [Google Scholar] [CrossRef] [Scilit]
- Gao, M.; Liang, Y.; Wang, T.; Fan, Y.; Luo, X. Research on the Whole Process Evaluation System for the Green Construction of Substation. Urban. Archit. 2024, 21, 107–111. [Google Scholar]
- Yuan, D.; Li, S.; Ren, L. Evaluation Study on the Application Effect of Intelligent Construction Technology in the Construction Process. Sustainability 2024, 16, 1071. [Google Scholar] [CrossRef] [Scilit]
- Yang, Y. Application and Effect Evaluation of Intelligent Control Technology for Heating and Ventilation Systems in Substations. Digit. Technol. Appl. 2025, 43, 142–144. [Google Scholar]
- Liang, X.; Wu, Z.; Fei, G.; Wang, K. Application and Efficiency Analysis of Water-Saving Technologies in the Construction Process of Green Buildings. IAC 2025, 8, 109–111. [Google Scholar]
- GB 50187-2012; Code for General Layout Design of Industrial Enterprises. China Planning Press: Beijing, China, 2012.
- ISO 50001:2018; Energy Management Systems—Requirements with Guidance for Use. International Organization for Standardization (ISO): Geneva, Switzerland, 2018.
- ISO 14001:2015; Environmental Management Systems—Requirements with Guidance for Use. International Organization for Standardization (ISO): Geneva, Switzerland, 2015.
- Li, F.; Li, R. Study on the Cumulative Loss Life Model based on the Comprehensive Technical Life Evaluation Method. Hydropower New Energy 2016, 10, 48–50+69. [Google Scholar]
- Luo, L. Research on Cost Control of Substation Overhaul and Technical Renovation Projects Based on the Whole Life Cycle Theory. Value Eng. 2023, 42, 23–25. [Google Scholar]
- Wang, J.; Hou, D.; Xu, T. Optimization of Substation Equipment Maintenance and Renewal Decision-making Based on Life Cycle Cost Analysis. Electr. Technol. Econ. 2023, 8, 298–301. [Google Scholar]
- GB/T 51366-2019; Standard for Building Carbon Emission Calculation. China Architecture & Building Press: Beijing, China, 2019.
- GB/T 51350-2019; Standard Technical Standard for Near-Zero Energy Buildings. China Architecture & Building Press: Beijing, China, 2019.
- T/CES 258-2023; Guidelines for Low Carbon Design of Substations Based on Whole Life Cycle. China Electric Power Press: Beijing, China, 2023.
- GB/T 32150-2015; General Guideline of the Greenhouse Gas Emissions Accounting and Reporting for Industrial Enterprises. China Standards Press: Beijing, China, 2015.
- Chen, D.; Lin, P.; Ding, P.; Li, G.; Chen, T.; Yv, Z. Vibro-stone column filling schemes based on Group AHP. J. Tsinghua Univ. (Sci. Technol.) 2022, 62, 1915–1921. [Google Scholar]
- Feng, W.; Zhang, X.; Tang, L.; Sun, M.; Luo, M. Dynamic Monitoring and Evaluation of Safety Risk in Tailings Reservoir Based on AHP-EWM and Multi-source Data. Met. Mine 2025, 7, 172–181. [Google Scholar]
- Song, Z.; Ge, Q.; Li, C. Prediction Method of EV Charging Demand Power Based on Reinforcement Learning and Variable Weight Combination Model. J. Data Acquis. Process. 2025, 40, 530–544. [Google Scholar]
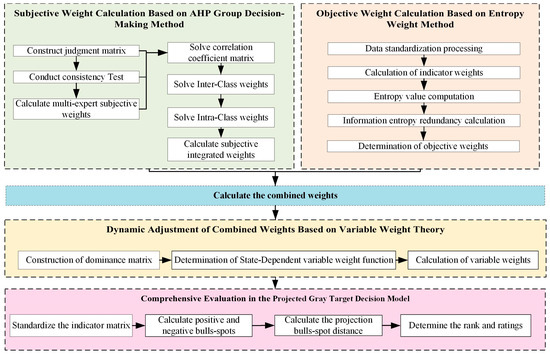
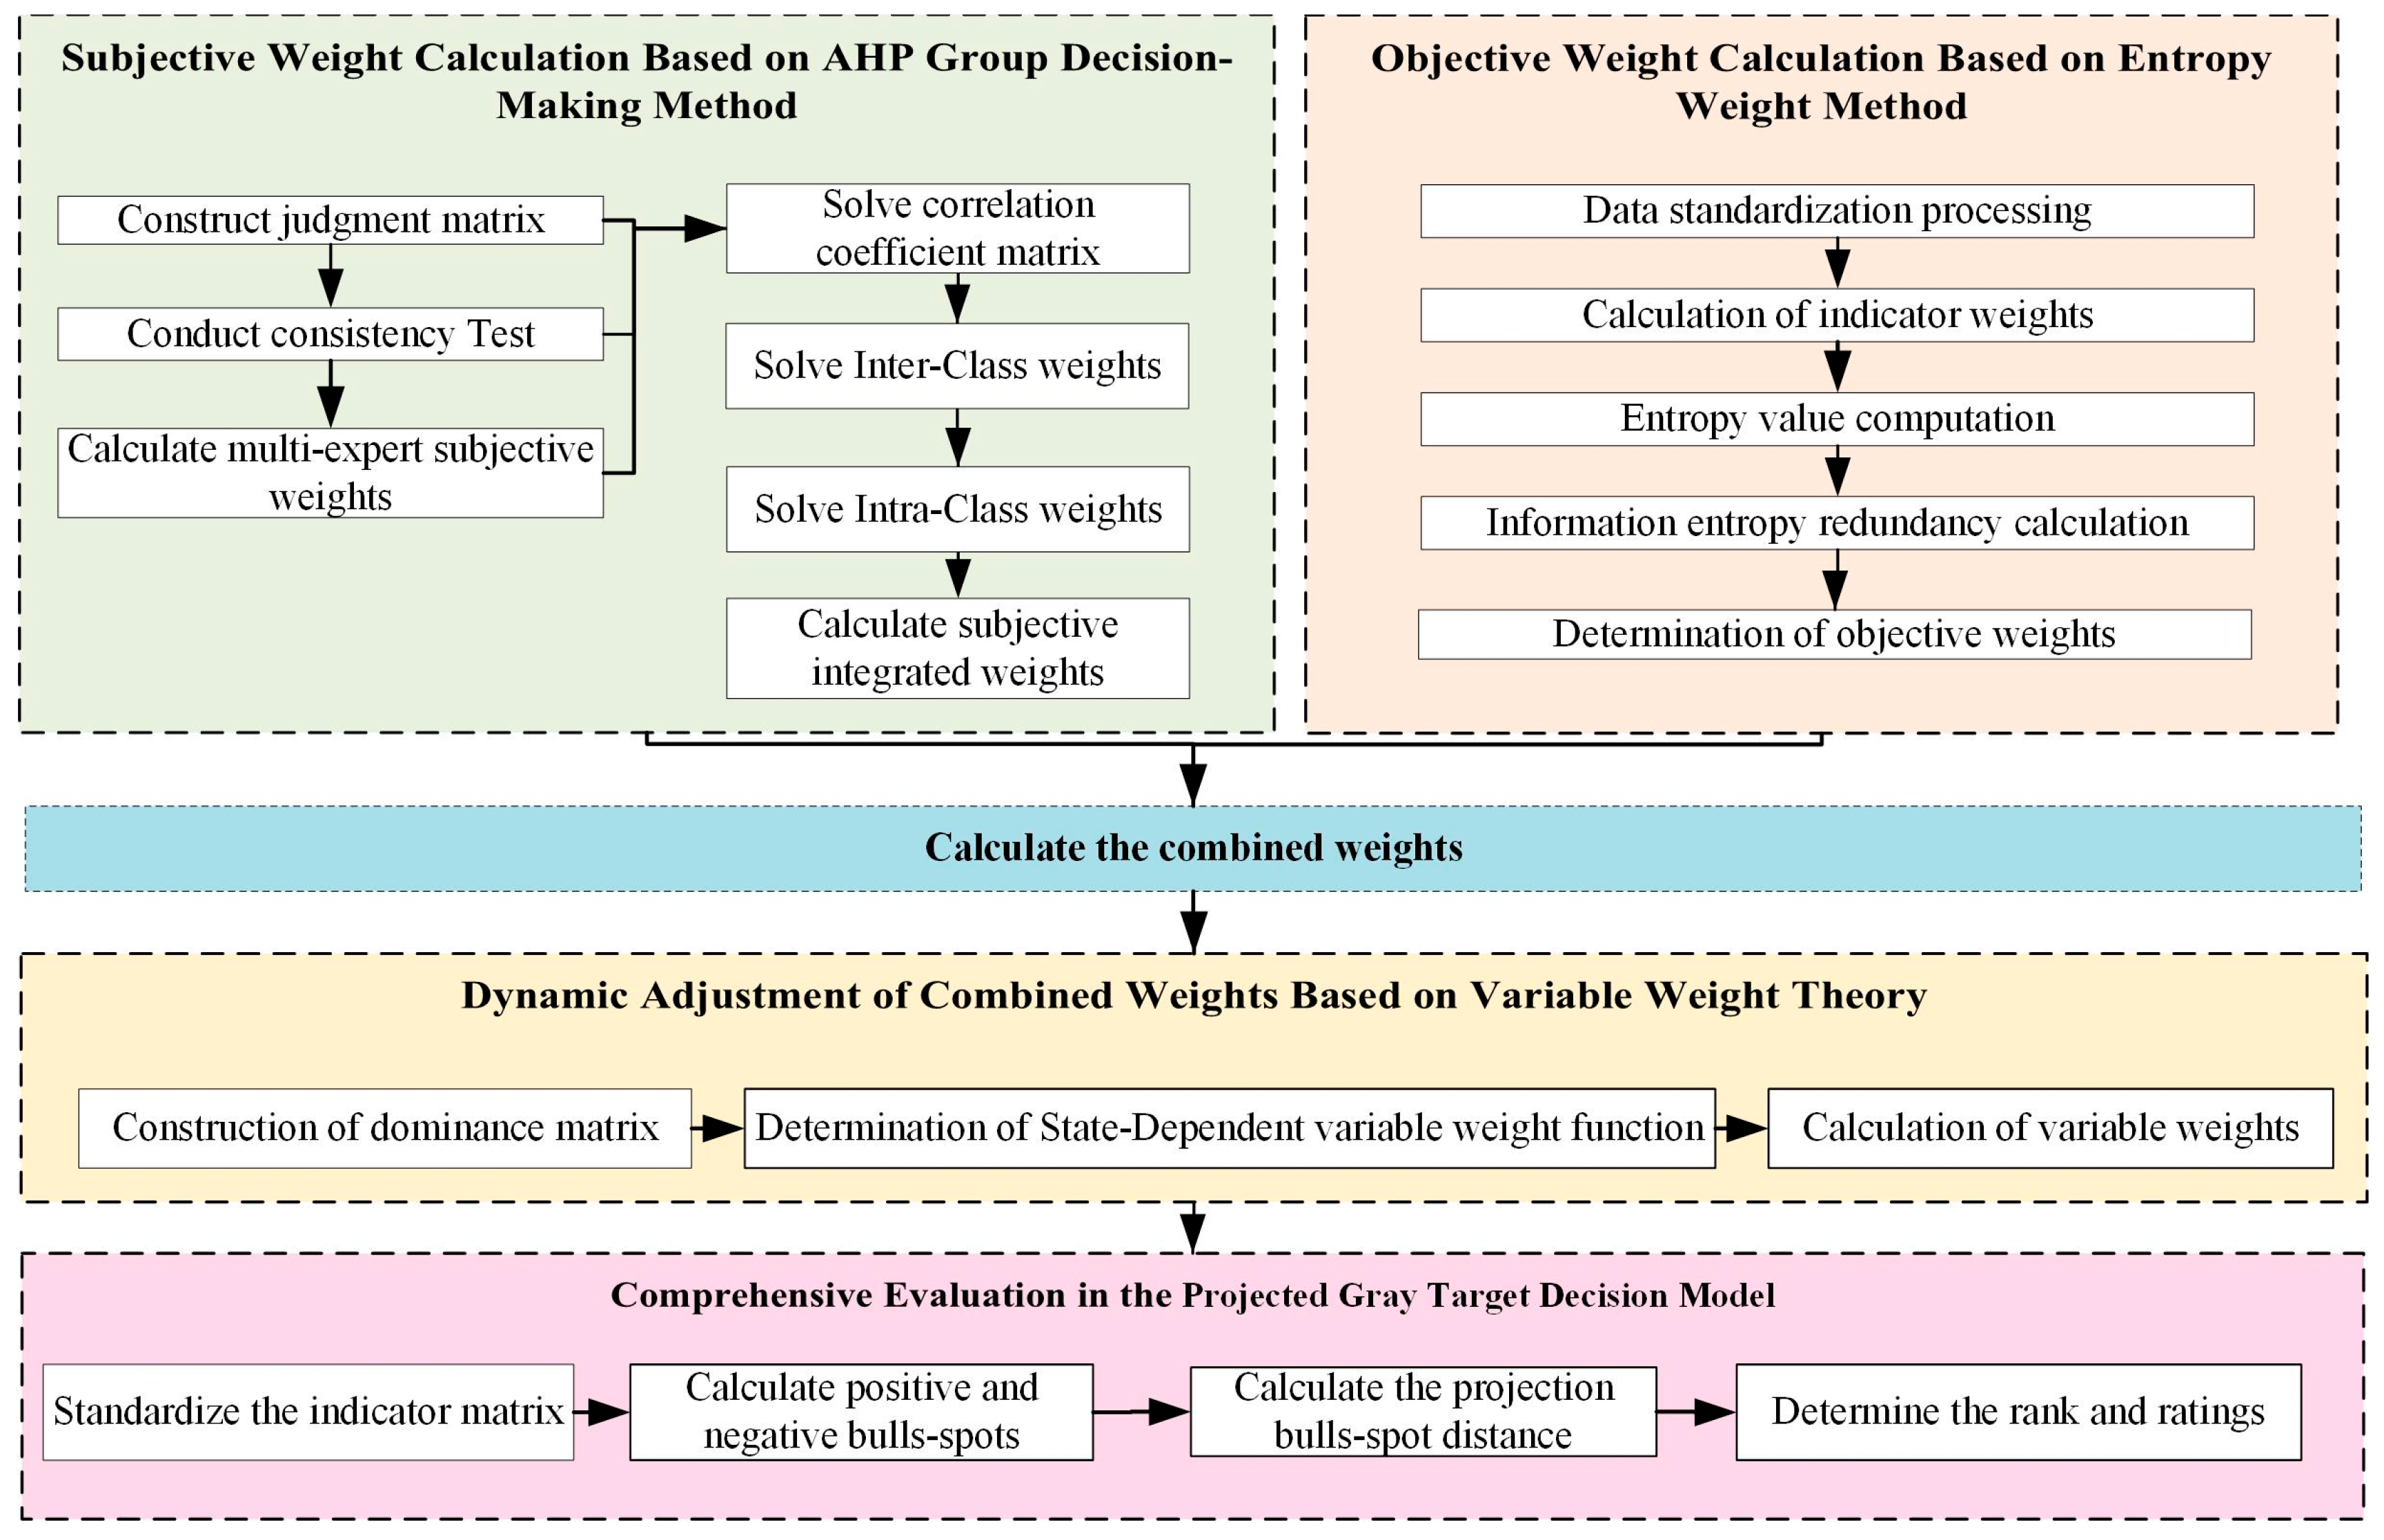
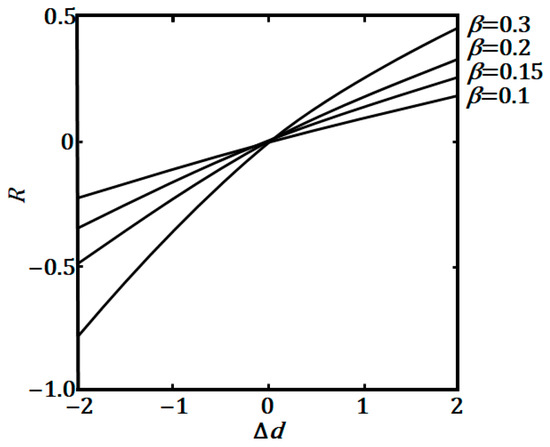
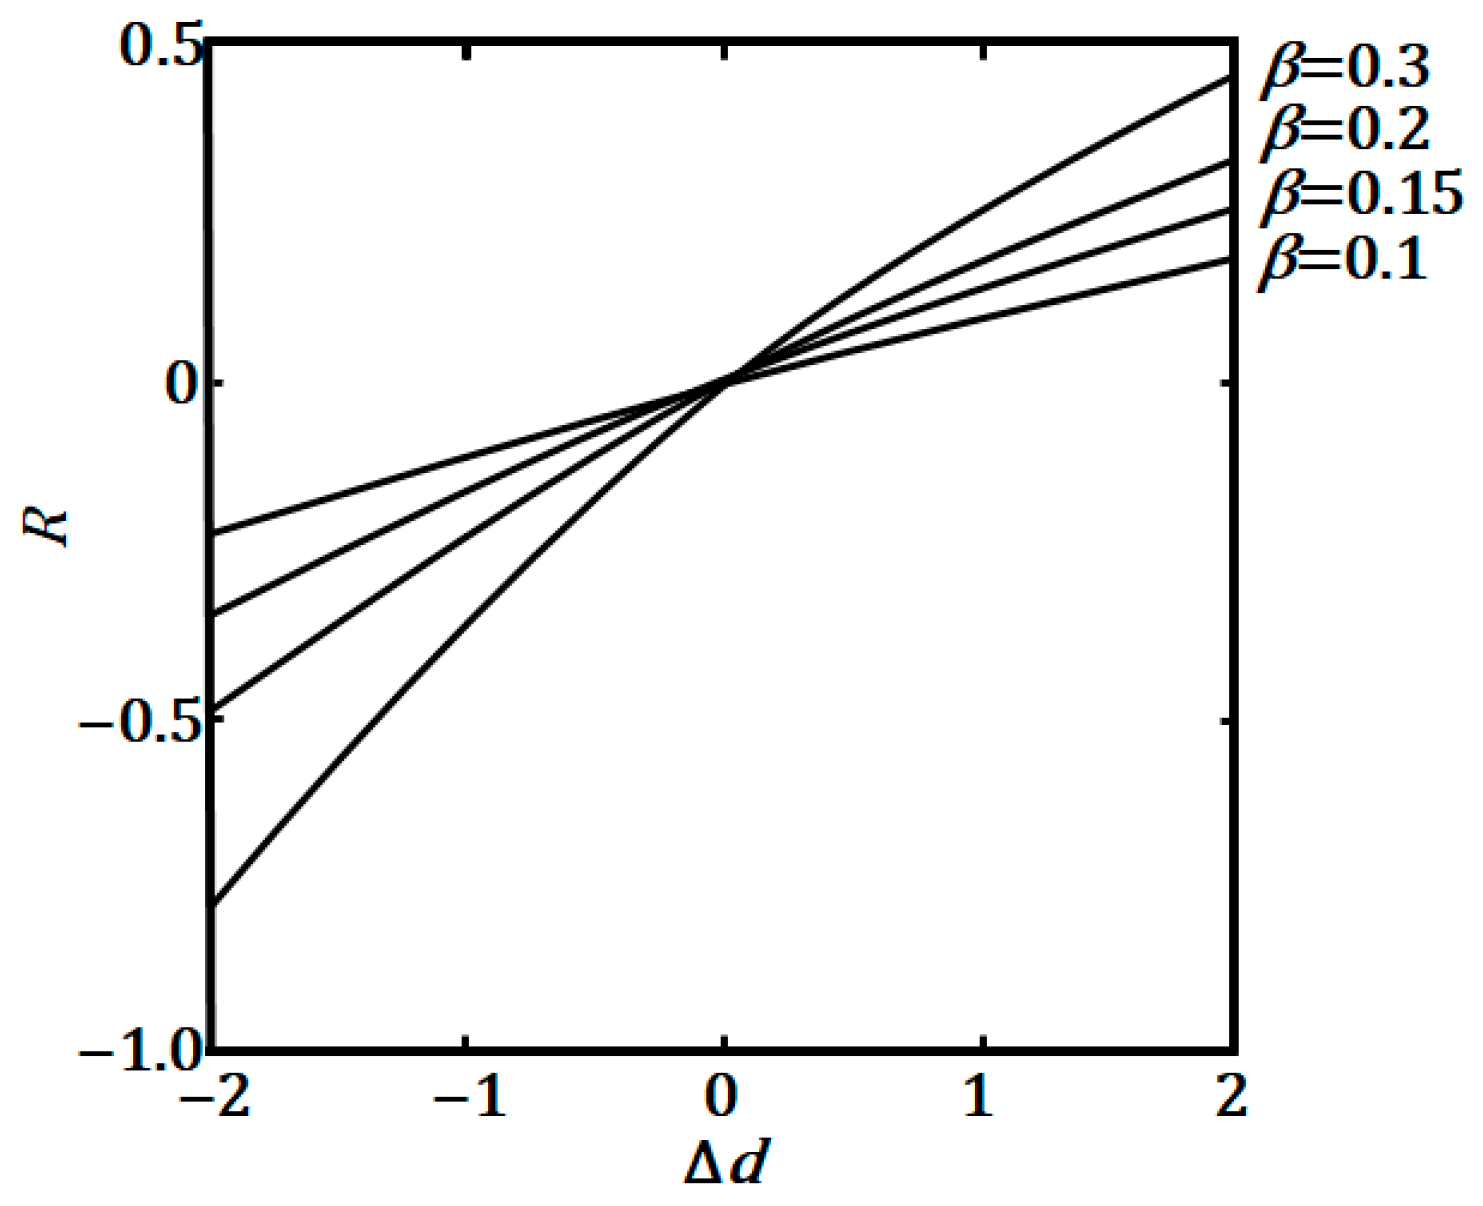
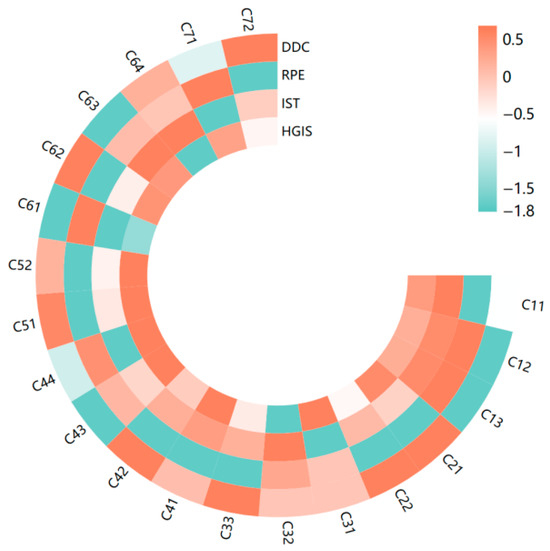
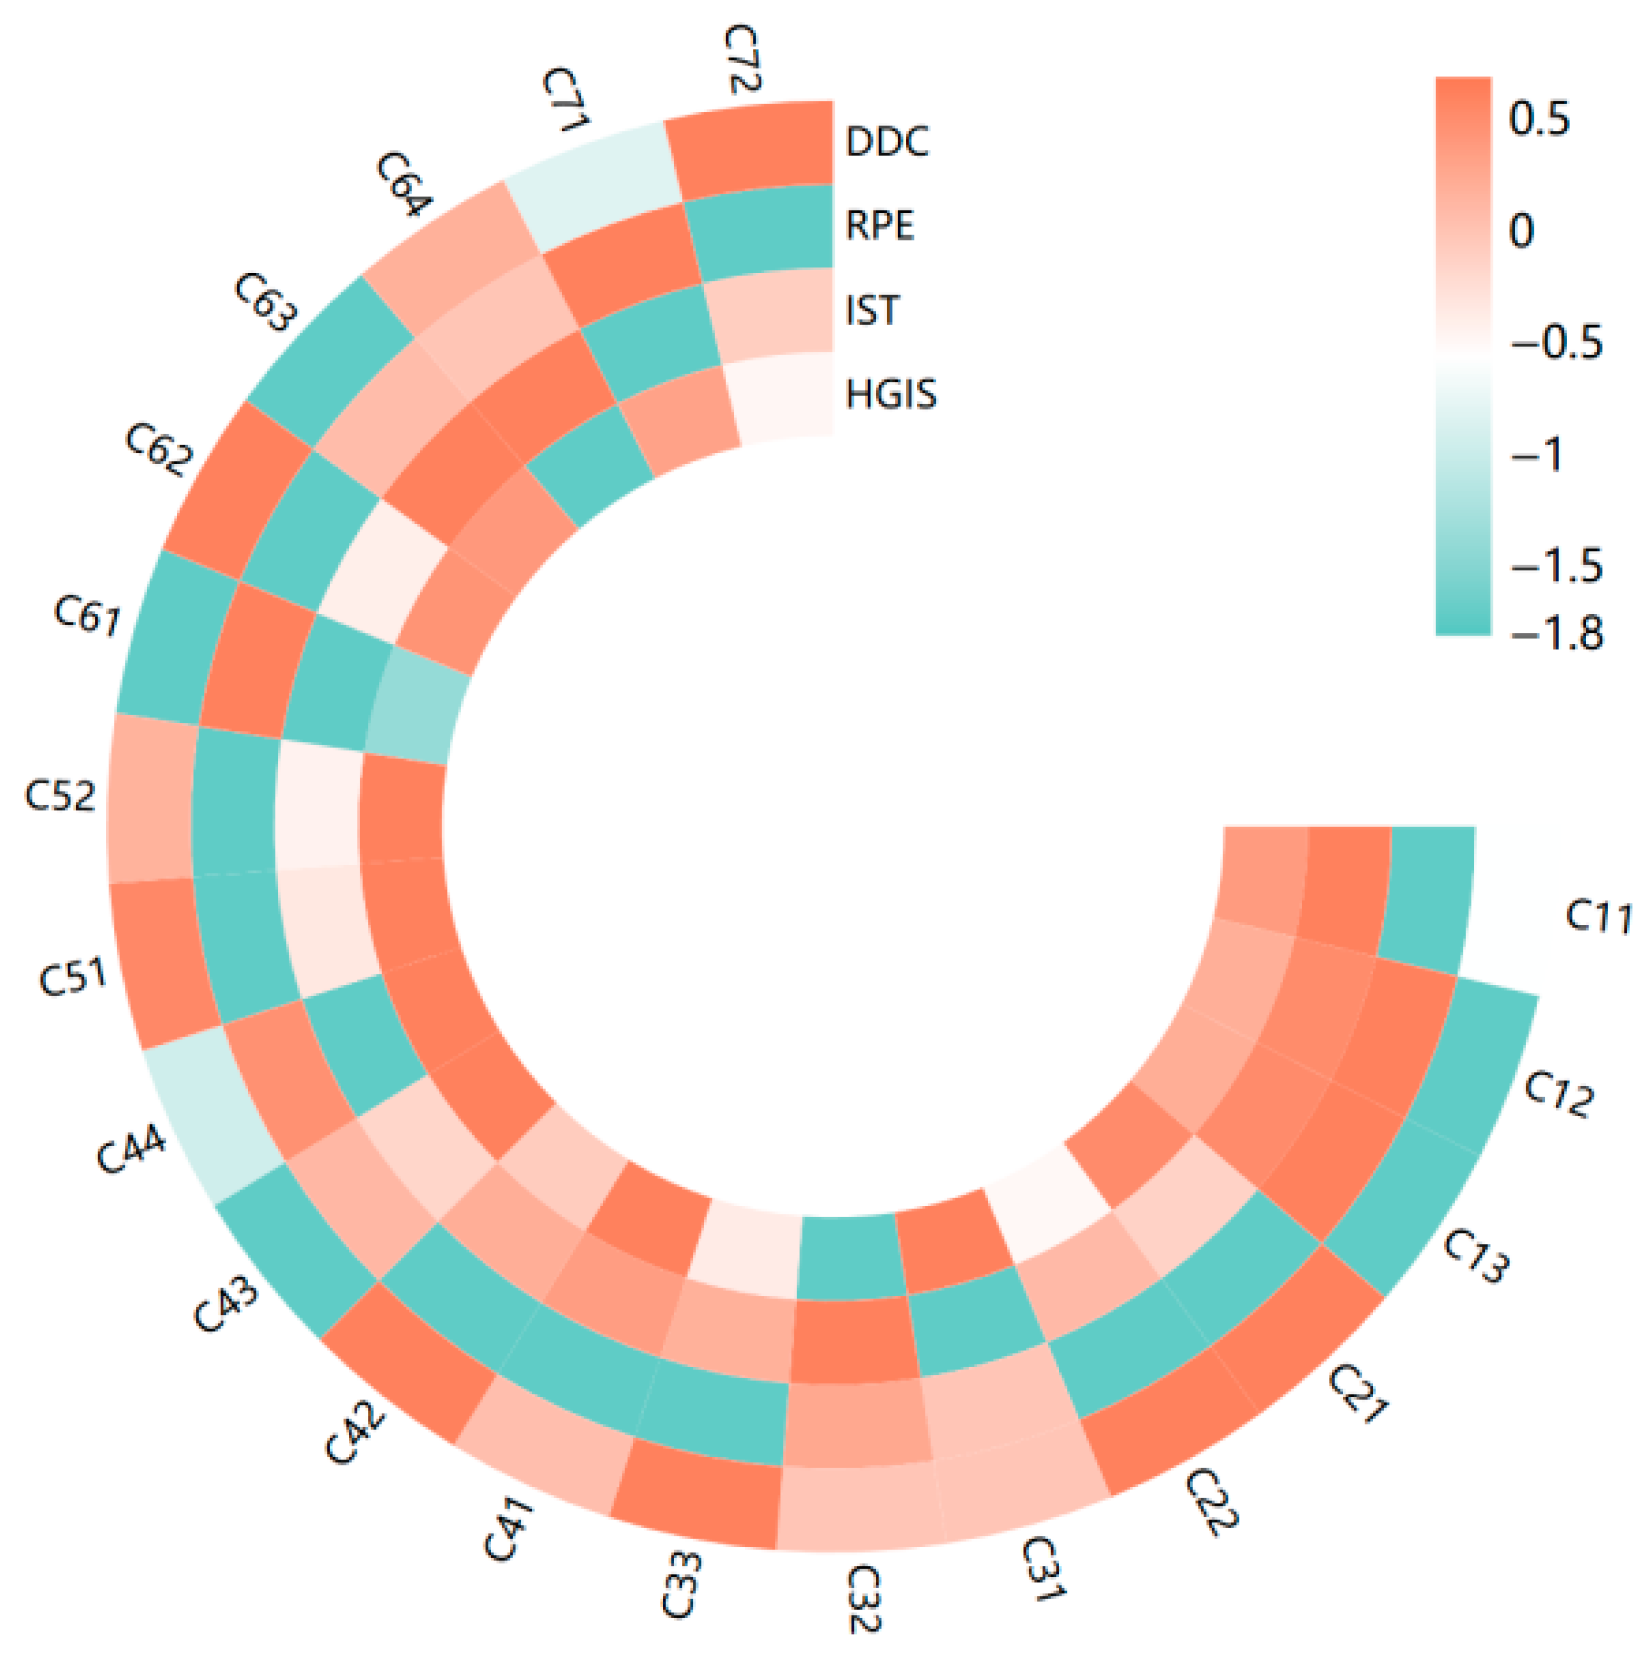
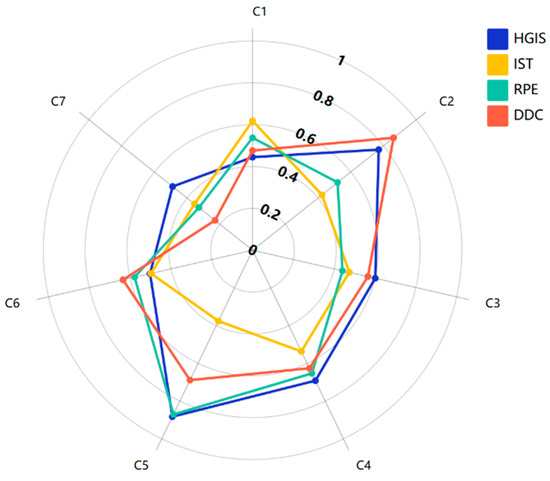
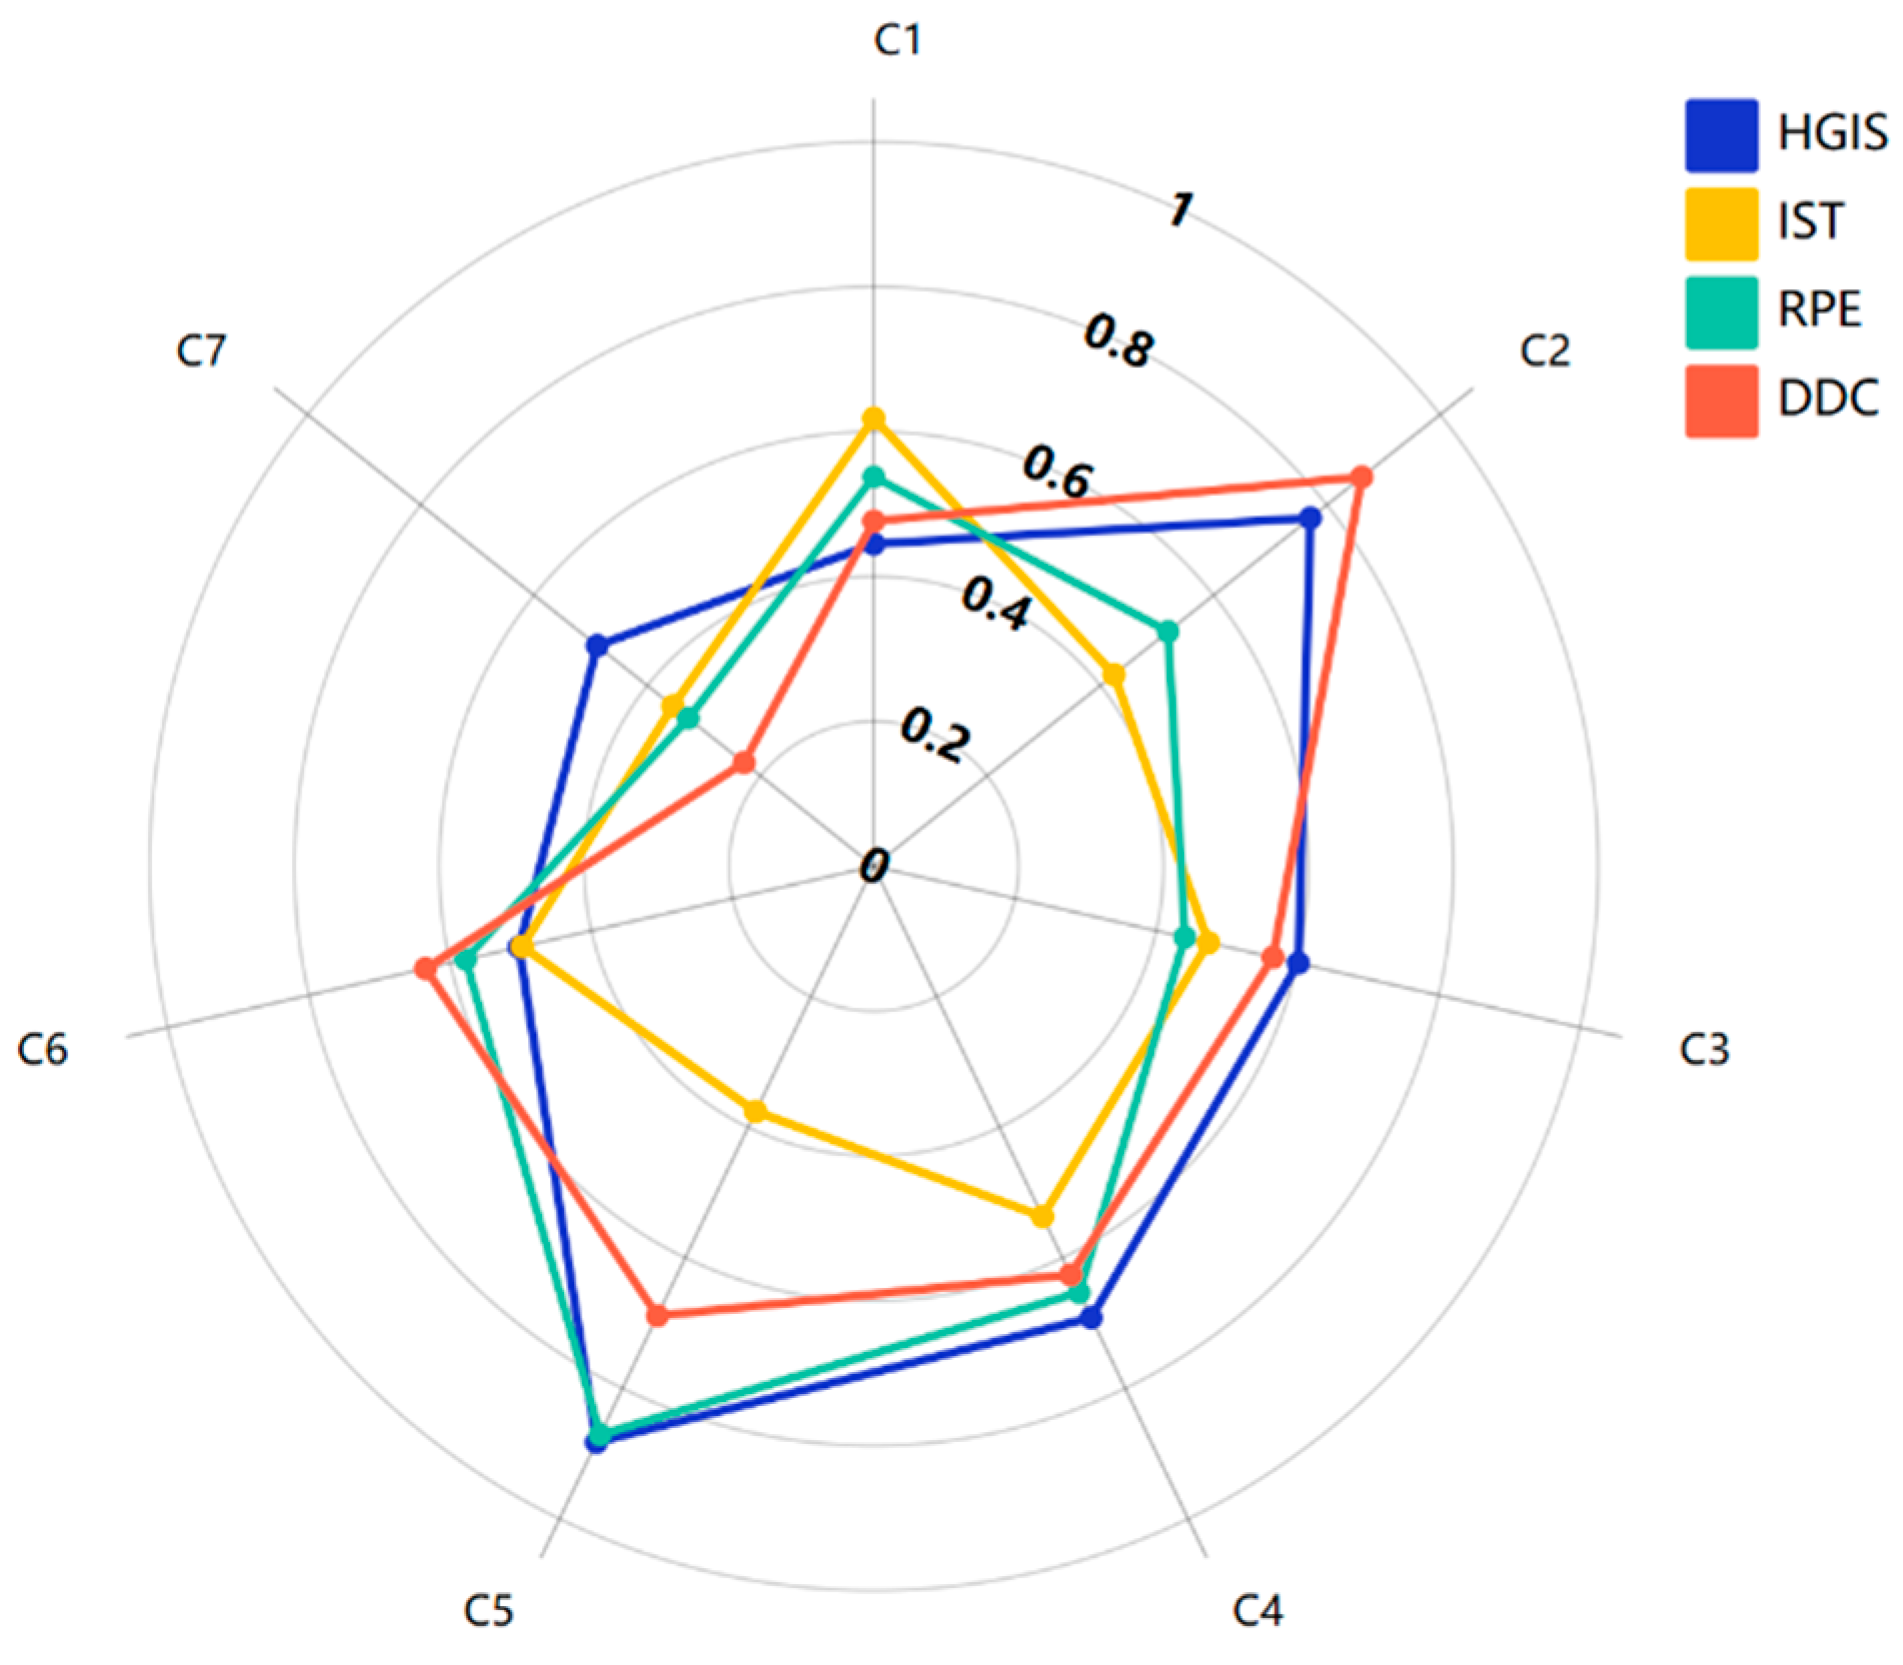
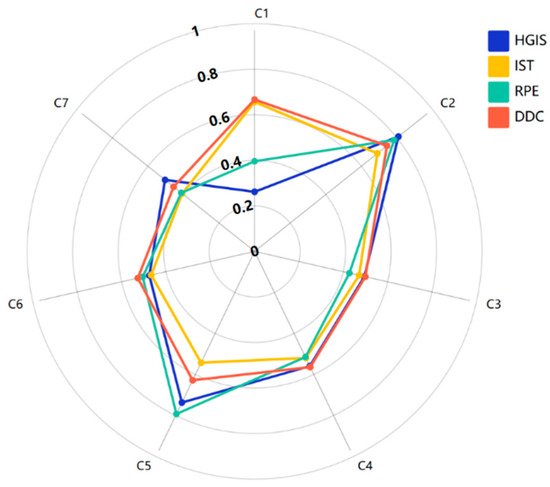
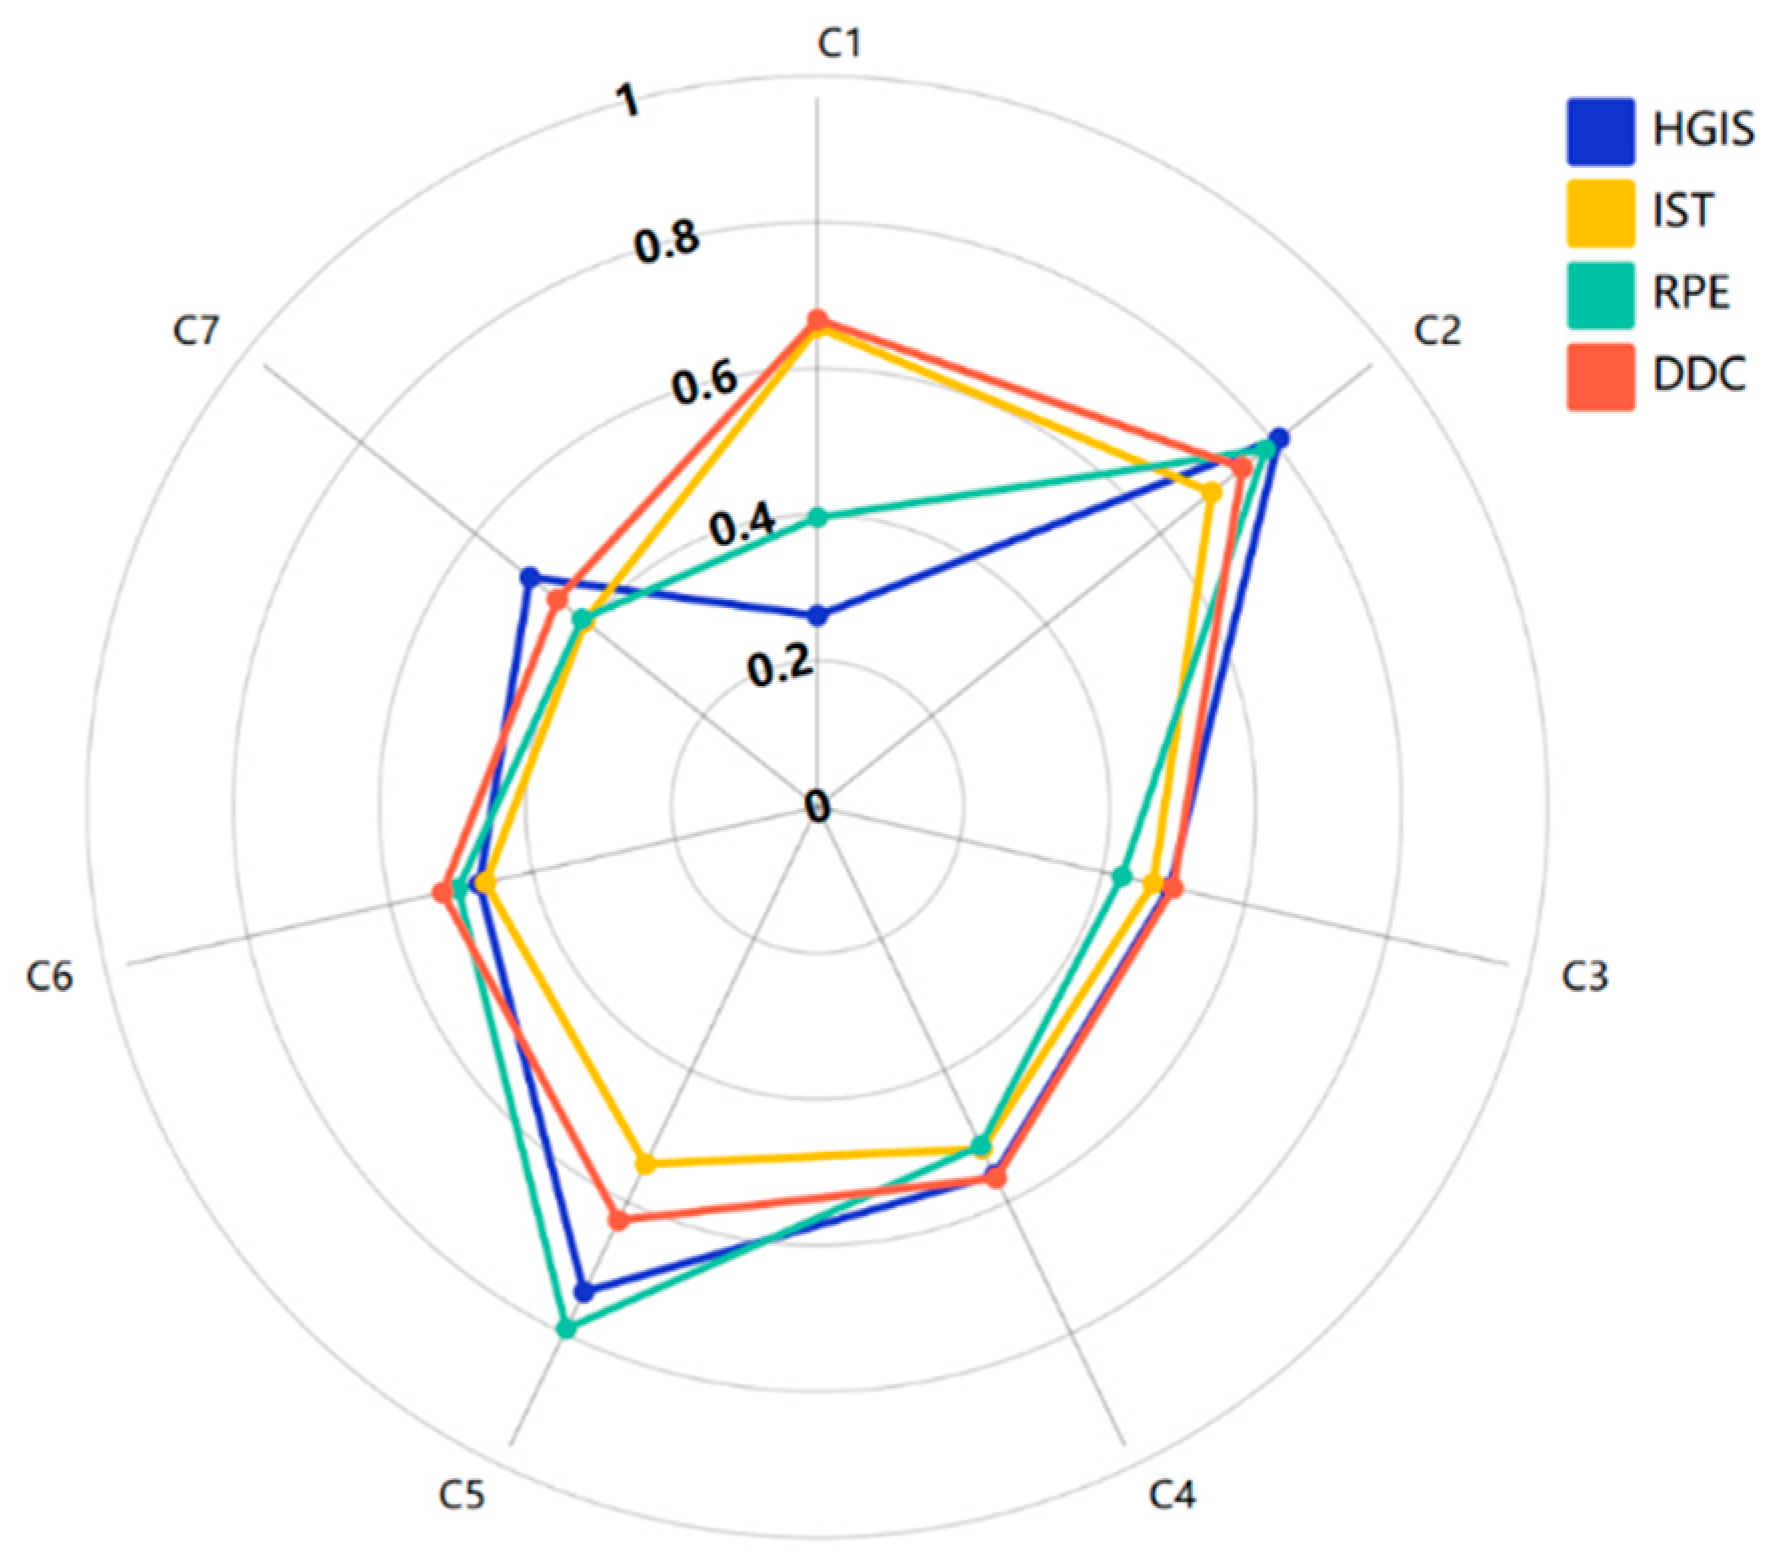

Disclaimer/Publisher’s Note: The statements, opinions and data contained in all publications are solely those of the individual author(s) and contributor(s) and not of MDPI and/or the editor(s). MDPI and/or the editor(s) disclaim responsibility for any injury to people or property resulting from any ideas, methods, instructions or products referred to in the content. |
© 2025 by the authors. Licensee MDPI, Basel, Switzerland. This article is an open access article distributed under the terms and conditions of the Creative Commons Attribution (CC BY) license (https://creativecommons.org/licenses/by/4.0/).