Article

Key Success Factors That Enable IT Service Providers to Achieve Organizational Performance: Evidence from Romania

by
Andreea Barbu
1,*,
Gheorghe Militaru
1,
Dana Corina Deselnicu
1 and
Ştefan-Alexandru Catană
2
1
Faculty of Entrepreneurship, Business Engineering and Management, University Politehnica of Bucharest, 060042 Bucharest, Romania
2
Faculty of Business and Administration, University of Bucharest, 030018 Bucharest, Romania
*
Author to whom correspondence should be addressed.
Sustainability 2021, 13(19), 10996; https://doi.org/10.3390/su131910996
Submission received: 24 August 2021 / Revised: 28 September 2021 / Accepted: 30 September 2021 / Published: 3 October 2021
(This article belongs to the Special Issue 4th Industrial Revolution and New Trends in Service Industry)

Abstract

:
The recent preoccupations of companies are quite varied, but most of them have the same objective—the improvement of organizational performance. The service area is a very popular one among individual clients or legal entities, the latter having many more interactions with companies in the IT area following the COVID-19 pandemic. The objective of this paper is to determine the factors that contribute to improving the organizational performance of IT service companies. The study involves exploratory, quantitative research that analyzes the perceptions of employees in the Romanian IT sector regarding the performance of their companies, as well as the key success factors that enable its achievement. The results indicate that organizational culture, organizational innovation level, service quality, and employee skills are some of the most important variables that can influence the organizational performance of Romanian IT service providers, thus contributing to their economic sustainability. Moreover, in this field, entrepreneurs should be more concerned about developing employees’ skills and improving their satisfaction, as they are one of the key resources for a sustainable business in the IT industry.

1. Introduction

Since March 2020, when the World Health Organization declared the COVID-19 pandemic [1], it has had an enormous impact on numerous aspects of the economy, business, and work [2]. The outbreak of the coronavirus disease has led to numerous changes in the way businesses are operating around the world. All companies experienced a critical point, many of them needing to completely change the way they organize, produce, or even provide services [3,4,5,6]. Most economic sectors have suffered, as they have been pushed to adapt quickly and to implement more technologies or even to switch to online [7]. In this way, IT providers became some of the most important players in the economy, and their performance became an important concern with numerous implications [8].
Research on organizational performance is rapidly developing and the interest in this field is reflected by the multitude of papers written (over 7.41 million results on Google Scholar by searching the keyword “performance” and over 815,000 results by searching the keywords “organizational performance”). Recent studies have investigated organizational performance and the factors that affect it. Although there is no internationally recognized definition, organizational performance is considered a sustainable multidimensional concept [9,10,11], which is based on the relationships between several interconnected factors [12]. On the one hand, Sink and Tuttle [13] define performance as a complex relationship between effectiveness, efficiency, quality, and productivity [13], while on the other hand, some researchers mention innovation and profitability [14,15,16]. Different authors describe the concept as the result of complex interactions involving efficiency and effectiveness [17], the value created within the company [18], capitalization of internal resources and opportunities in the business environment, the satisfaction of stakeholders [19], and achieving the proposed objectives [20].
To complicate matters more, according to the causality model of performance [21], organizational performance is not limited to measuring the financial results of a company, but also the quality of the relations with its stakeholders. In addition, Suárez-Gargallo and Zaragoza-Sáez [22] point out that the use of both financial and non-financial measures acts as a factor influencing organizational performance. Thus, the performance of an organization can be seen as a globalizing concept, which pursues several dimensions, taking into account multiple issues related to the company’s stakeholders (employees, customers, suppliers, investors, and so on). These aspects can be quite confusing for the management team, as they can affect the company’s performance in various ways: the ability to motivate staff; to offer value-added products/services to customers; to properly reimburse investors; and to develop profitable, long-term relationships with suppliers [23].
Referring to the performance of service companies in particular, it can be noted that defining and measuring organizational performance is a complex and difficult task [24]. Although the literature presents numerous ways of measuring and evaluating it, none of them clearly emphasize what the factors are that affect it. According to the literature, the key success factors are aspects that must be achieved for the business to succeed and, if not well performed, will make the achievement of the missions and goals unlikely within a business or project [25].
Some papers indicate that the factors that should be taken into consideration for evaluating organizational performance are as follows: financial dimension, innovation, management experience, quality, continuous improvement, and business excellence [26,27]. Still, the authors are not aware of an analysis being performed on evaluating these factors for IT services providers. Given the importance of the IT sector in these turbulent times, this study aims to fill this gap by providing a scientific approach for testing whether these factors affect IT providers’ ability to achieve organizational performance.
In Romania, the IT sector was the star of the economy and the pandemic-winning sector in the first half of the year 2020. In the pandemic context, the IT sector increased by 12.4% in volume in the first 6 months of 2020 compared with the same period of the previous year, accounting for 7–8% of Romania’s GDP [28]. The companies that offer IT services were very busy during this period, as they had an essential contribution to the digitalization of the enterprises. They had to find solutions to automate ordinary, time-consuming tasks and critical business activities. At the same time, the activity of the IT companies aimed to ensure a high level of cybersecurity, as well as promoting operations based on cloud computing [29]. Thus, IT companies were forced to operate at full capacity to ensure the smooth running of all other companies in the economy. However, this should set off an alarm signal to the management team, which should find the most efficient solutions to improve organizational performance. Considering the large volume of work, these companies need to streamline their activities; improve their organizational performance; and stand out in the market through quality services, high performance, and excellence.
Despite the rapid evolution of technology, the IT sector is also facing several problems, which are increasingly felt with the trend of digitalization. Thus, according to a report by Global Knowledge, the most important challenges faced by professionals from this field are related to the workforce, workload, the trend of digitization, cybersecurity, and process automation [29]. The employees are overwhelmed by the workload during this period. Many of them do not have the necessary skills to handle all the work tasks. Thus, one of the problems reported by both management staff and employees is the lack of training [29]. Moreover, the lack of programs dedicated to the development of employees’ knowledge and skills negatively influences the employees’ and organizational performance [30].
Against this background, the purpose of this paper is to determine the key success factors that contribute to improving the organizational performance of IT service companies. Such information can aid IT providers that are willing to improve their organizational performance to create implementation strategies with a higher chance of achieving success.
As can be observed, the aforementioned studies investigated some of the key factors individually. The present paper approaches and tests several identified factors at the same time, integrating them into the conceptual model, in order to investigate their impact on organizational performance. To accomplish this purpose, the authors used a quantitative research method.
In the next section, the literature on the key success factors that enable organizational performance is examined. The third section presents the research methodology, while Section 4 and Section 5 are dedicated to results and discussion, respectively. Section 6 is devoted to conclusions that can be drawn, along with their theoretical and practical implications.

2. Literature Review and Hypothesis Development

2.1. Relationship between the Financial Dimension and Organizational Performance

Financial indicators were among the first used to measure organizational performance, being the easiest to identify, define, track, and improve [31,32]. With the evolution of technology, the financial accounting process has changed, beginning to be approached more with the help of computer programs. Cleary and Quinn [33] studied the impact of a cloud-based infrastructure in the field of accounting and finance on micro and small and medium-sized enterprises (SMEs), as well as their performance in the analyzed enterprises. Their results indicated that the cloud-based accounting/finance infrastructure had a positive and statistically significant impact on organizational performance.
Recent research on the impact of the financial dimension on organizational performance [34,35,36,37,38,39,40,41,42,43,44] reveals that it is a subject of major interest for the scientific community. However, the obtained results are presented in a general manner, without a distinction between the typology and the field of activity of the analyzed companies. Therefore, the authors hypothesize the following:
Hypothesis 1 (H1).
There is a positive correlation between the financial dimension and organizational performance.

2.2. Relationship between the Organizational Innovation Level and Organizational Performance

While research on innovation in service sectors is little explored, some studies reveal a strong correlation between innovation and business performance, especially in terms of process innovation [45]. Therefore, improving business performance can also be achieved by developing the company’s innovation potential (e.g., product, process, organization, or marketing innovation).
The intensity of research and development is correlated with patenting measures, while measured innovation in the introduction of new products is associated with business performance [46]. One of the studies conducted in this regard analyzes the moderating effect of intellectual property rights on the relationship between innovation and performance of manufacturing companies, and the results indicate a positive correlation between patenting and improvements in the performance of new enterprises [47].
Other studies emphasize that the use of a stimulating rewarding policy for creative employees leads to a high level of organizational innovation and, as a consequence, to an improved level of business performance [48]. Moreover, there are scientific articles pointing out that the use of social networks positively affects a company’s innovation potential [49,50]. Therefore, the authors argue the following:
Hypothesis 2 (H2).
There is a positive correlation between the organizational innovation level and organizational performance.

2.3. Relationship between Management Experience and Organizational Performance

Various studies have analyzed the strategic involvement of managers in companies and revealed that their involvement in strategy formulation is associated with improved organizational performance [51,52,53]. Thus, internal process management has positive effects on both internal and external operational performance, while external process management has a positive effect on external operational performance only. Moreover, internal and external operational performance have positive effects on the company’s overall performance [54].
Most successful companies choose to improve process management [55]. Focusing on improving processes, the company’s management aims to increase business performance and flexibility, so that it can respond to the needs and changes of the market. The relationship between planning and success is mediated by process management, and the strength of these relationships is moderated by uncertainty, being determined by the degree of innovation [56]. Based on these aspects, the following hypothesis was considered:
Hypothesis 3 (H3).
There is a positive correlation between organizational performance and management experience.

2.4. Relationship between Service Quality and Organizational Performance

In defining performance, both Jacot [57] and Pottier [58] emphasized the important roles of competitiveness, productivity, and profitability. One of the most important elements that contribute to ensuring organizational performance is the quality of services. It helps to increase customer satisfaction, to repeat purchases, and even to attract new customers [59].
Other studies reveal that the quality of services is associated with the general performance evaluation of a service provider, usually performed in the long term, as opposed to the satisfaction of services, which is measured in the short term [60]. Moreover, service quality is often associated with continuous improvement [60], and Deming’s approach [61] highlighted that all the interested parties should focus on quality improvement processes. Therefore, the authors argue the following:
Hypothesis 4 (H4).
There is a positive correlation between service quality and organizational performance.

2.5. Relationship between Continuous Improvement and Organizational Performance

Within companies, continuous improvement is achieved through personal development programs, implementation of ISO 9000 standards, total quality management, implementation of Six Sigma programs, or even the application of business excellence models [60]. Personal development programs are designed to help the company’s employees acquire certain specific skills and knowledge that are used to improve workplace performance [62]. Thus, in the long run, these programs can also improve organizational performance [63]. Based on these aspects, the authors aimed to investigate how continuous improvement affects organizational performance. The hypothesis formulated in this regard was as follows:
Hypothesis 5 (H5).
There is a positive correlation between organizational performance and continuous improvements.

2.6. Relationship between Business Excellence and Organizational Performance

Following the success obtained by companies regarding quality and performance, excellence is born, which implies permanent, repetitive transformations, regarding both the quality level of the services offered by the organizations and their efficient development [64]. Both the concepts of organizational excellence and business excellence are reflected in the literature. According to Harrington [65], the concept of organizational excellence emphasizes how a company performs well in all its activities, striving not to register errors or failures at any level of the organization. Thus, Harrington [65] points out that, through organizational excellence, companies need to create an internal framework that is based on standards and procedures, with quality as a key factor in this regard. According to McAdam [66], business excellence refers to how companies register high levels of performance in terms of market growth, but also in terms of the relations with the other stakeholders. Business excellence refers to ensuring long-term competitive success, which can be achieved by creating and balancing value for all stakeholders [67]. Thus, business excellence often incurs a direct comparison with other competitors in the market, when excelling means being better than others [68], standing out positively compared with the rest of the market competitors. The analysis of outstanding results is a determination of organizational performance, which, once measured, may indicate a certain level of business excellence [69].
Business excellence models (BEMs) are often associated with the concept of business excellence [70]. BEMs represent a set of values and concepts that create a basis for integrating key performance requirements and operational requirements in a results-oriented, action and feedback framework [71]. These models refer to achieving and sustaining higher levels of performance that meet or exceed all stakeholders’ expectations [72]. The framework offered by BEMs assists the adoption of the business excellence principles, as well as the measurement of the degree of integration of this adoption, with the models also being internationally recognized [73].
The EFQM (European Foundation for Quality Management) Excellence Model is the most widely-used evaluation and self-evaluation framework for companies [74], acting as a management tool applied for the implementation of total quality management. This model should not necessarily be seen as a standard, but as an evaluation benchmark and a management framework [75], which analyzes seven important criteria: purpose, vision, and strategy; organizational culture and leadership; stakeholder involvement; creating sustainable value; performance and transformation management; results on stakeholder perceptions; and results on operational and strategic performance.
In this regard, the authors aimed to verify whether, in the case of IT companies, the positive relationship between the business excellence models and organizational performance is valid. The authors formulated the following hypothesis:
Hypothesis 6 (H6).
There is a positive correlation between organizational performance and using business excellence models.

2.7. Relationship between Organizational Performance, the Size of the Company, and the Age of the Company

The age and the size of the company are often mentioned in different papers whose subject is related to organizational performance. For example, a study in India focused on the relationship between the age of the company and the company’s performance, defined as the company’s productivity and profitability. The results show that, on the one hand, older companies are more productive, but less profitable. On the other hand, larger companies are more profitable, but less productive [76]. Coad et al. [77] analyzed in their paper the role of both size and age of the company in its evolution. The results of their paper indicate that organizational performance improves with age (higher profits, higher productivity, larger company size).
However, some researchers highlighted the fact that the age of the company negatively affects organizational performance, because, despite the benefits of the knowledge gained during the company’s growth, they begin to be limited by a more rigid structure, routine, or inflexibility of managers [77,78]. As Coad et al. [77] argue, the relationship between company age and organizational performance still requires the attention of researchers. Many aspects can be analyzed in various industries regarding the understanding of how managers can further improve the organizational performance when companies reach the stage of maturity or even later. Thus, the authors aim to analyze if the age of Romanian IT companies influences their level of organizational performance:
Hypothesis 7 (H7).
The age of companies influences the level of organizational performance.
While many papers highlight the fact that the size of the company is a significant factor regarding how profitable a company is, some authors found a negative or non-existent relationship between them. Odalo et al. [79] studied the relationship between company size and its financial performance. The results of their research confirmed that the size of the company had a positive influence on the financial performance, with larger firms having more resources than smaller ones, enjoying economies of scale, and being more competitive in the market. These results are also supported by other studies [80,81,82], with the firm’s size also affecting its value. However, a very large firm size can impact the company in negative ways owing to bureaucracy or some other factors [79].
Despite these findings, things are not so clear regarding the relationship between performance and company size. For example, Mahzura [83] claims that, to some extent, the size of the company does not affect its performance; more precisely, it does not influence its value. An important aspect is how the size of the company is defined. Even though the papers mentioned above used the assets or the sales to define the firm size, the added value or the number of employees could be better measures of a firm’s size [82]. Thus, the authors intended to test whether, in Romanian IT companies, the size of the company (defined as the number of employees) is one of the factors that could influence the organizational performance:
Hypothesis 8 (H8).
The size of companies influences the level of organizational performance.

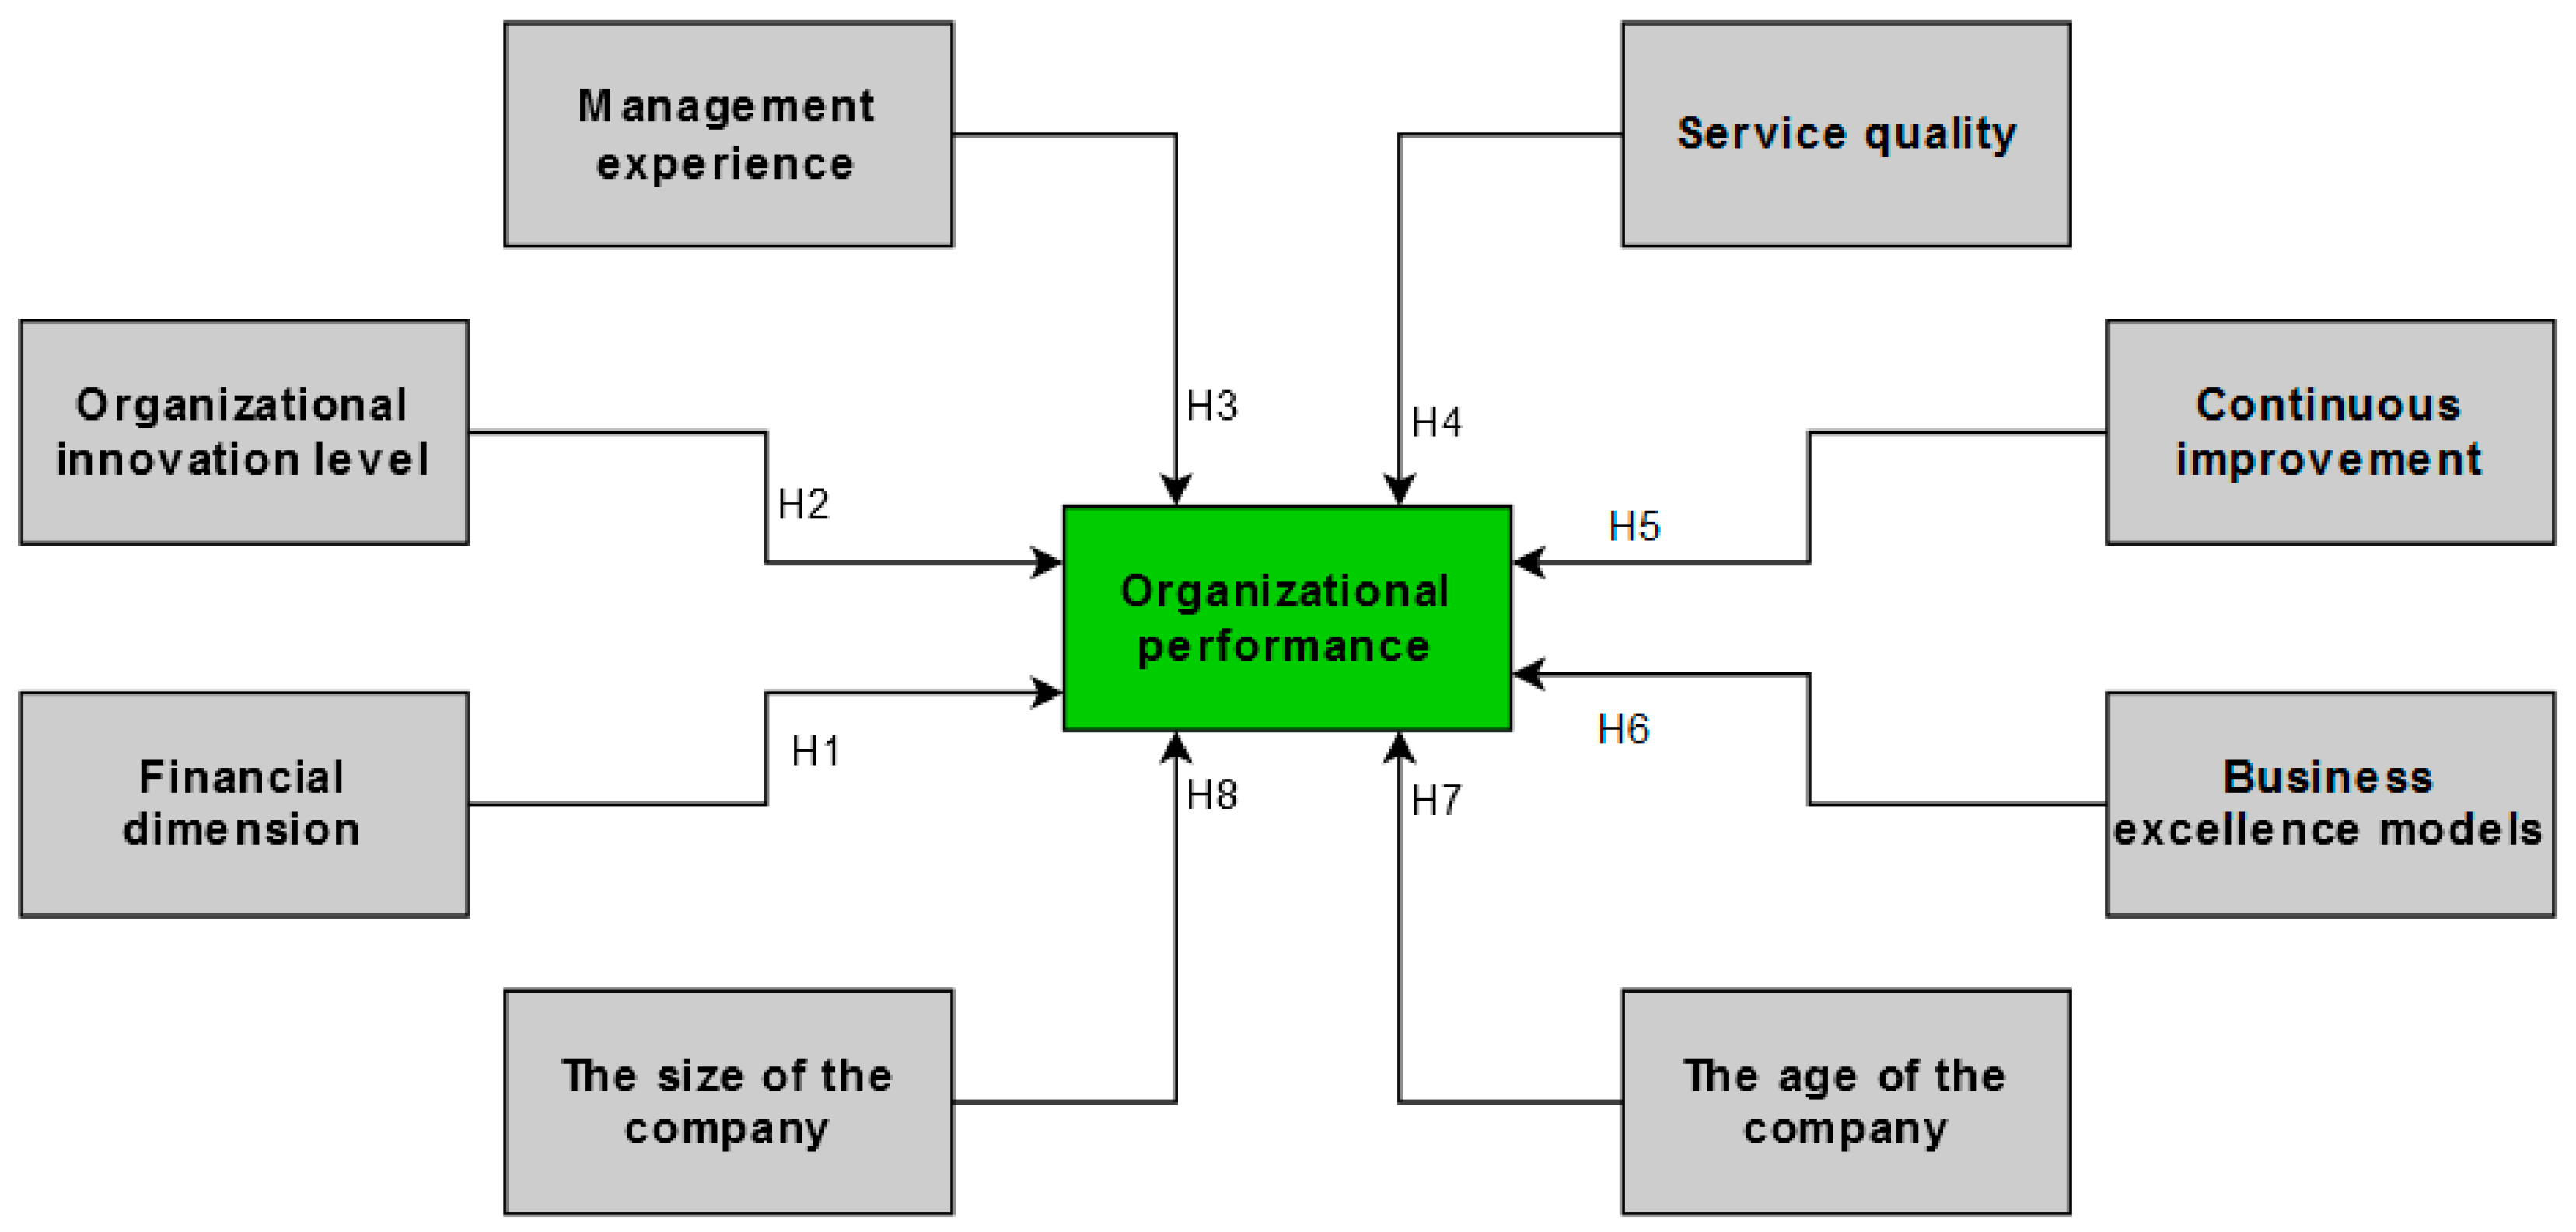
2.8. Conceptual Framework

The authors have designed and empirically tested a conceptual framework to present the eight hypotheses that were mentioned in the theoretical background, which address the concepts of quality, organizational performance, and business excellence (Figure 1):
Thus, the authors aimed to test this model to determine the key factors that contribute to improving organizational performance in IT service companies from Romania.

3. Research Methodology

This paper employed an exploratory survey that used a quantitative methodology to investigate the main factors that influence the organizational performance of companies providing IT services. In this regard, the authors conducted quantitative research, based on the analysis of the perceptions of people working in IT service companies in Bucharest, Romania, using the questionnaire as a tool for data collection. Thus, the main objective of this paper was to determine the key success factors that enable IT service providers to achieve organizational performance.

3.1. Survey Data

The survey data utilized in this study were collected from the Alumni group of students from the Faculty of Automation and Computers from University Politehnica of Bucharest. The reasons for choosing this group were, on the one hand, that three out of the four authors work within this faculty and, on the other hand, because it is a relevant group for the objective of the study.
The sample of respondents consisted of 44 employees working in IT companies in Bucharest, Romania. The authors used the non-probabilistic method of sampling (the “snowball” method), based on convenience, typical, and critical cases [74].
Out of the total respondents, 63.6% were male, with the largest share of respondents having executive positions within the company (95.5%). Regarding their service experience, 13.6% of the respondents had between 5 and 10 years of experience in the service sector, and 20.5% of them had between 3 and 5 years in this sector (Table 1). About 61% of the firms surveyed had been in the market for more than 10 years, while 20.5% had been established within the prior 3 years.
Most of the analyzed companies were big companies, with more than 250 employees (61.4%), while 11.4% of them had less than 50 employees, being small enterprises [84].

3.2. Measurement Instrument

The research method used in this paper was an exploratory survey. The research instrument consisted of a self-administered questionnaire containing 37 items, with the questionnaire divided into four sections. The first section consisted of collecting demographic data regarding the gender of the respondents, their position within the company, their service experience, and their working time within the company. The next section analyzed data about the IT companies, such as years since their establishment and number of employees. The third section of the questionnaire was dedicated to the analysis of the organizational performance level, while the fourth section involved the analysis of the factors that can influence organizational performance.
A five-point Likert scale was used to measure respondents’ perceptions of the organizational performance of Romanian IT service providers (Table 2).
The scale indicated the following attitudes regarding the analyzed statements: (1) total disagreement, (2) partial disagreement, (3) neither agreement nor disagreement, (4) partial agreement, and (5) total agreement. Table 3 describes the other constructs that show the factors that can influence organizational performance.
The items chosen to describe these factors reflect the respondents’ perception regarding the extent to which the analyzed aspects are implemented within their companies.

3.3. The Reliability of the Data

To identify the factors that influence organizational performance, an analysis of the items was performed. The authors interpreted the collected data using the SPSS statistical software (Version 19.0). Thus, factorial analysis was performed using principal component analysis as the extraction method and the Varimax rotation method with Kaiser normalization [109,110]. To measure the internal validity of the questionnaire, Cronbach’s alpha coefficients were determined. Given the fact that several concepts were analyzed in this paper, reliability testing was performed for each factor, also mentioning the initial eigenvalues and the percentage of variance (Table 4).
For the financial, innovation, and quality factors, the Cronbach’s alpha coefficients had values between 0.5 and 0.7, which indicate moderate reliability [111]. All the other factors had Cronbach’s Alpha values higher than 0.7, which indicates a good internal consistency of the tested items [112], guaranteeing the reliability of the data used for statistical analyses.
Based on these results, this paper used organizational performance (OP) as the dependent variable, while the independent variables were financial dimension (F), quality (Q), continuous improvement (Ci), management experience (Me), innovation (I), and business excellence models (BEMs). Except for innovation and management experience, all the other variables were obtained by mediating the items that described them (Table 4). Moreover, the authors aimed to analyze if the age and the size of the company can influence organizational performance.

4. Results

To analyze the data, the authors used the SPSS statistical software, version 19.0, and descriptive and inferential statistics to present the statistical summary of the most relevant data (descriptive statistics), as well as the analysis of correlations between variables (inferential statistics).

4.1. Analyzing the Level of Perceived Organizational Performance of Companies Providing IT Services

To determine the overall organizational performance score (P), the authors considered the following variables: profitability (Pr), revenue (Re), market share (Ms), the perspective of clients (Pc), employees (Pe), interest groups (Pig), the process perspective (Pp), and the quality of services (Qs) [111]. Thus, the overall organizational performance score was calculated by determining an average score of the eight variables taken into account (Table 5).
Regarding the organizational performance score, the results highlighted a high degree of perceived organizational performance, with an arithmetic mean of 4.34, with a maximum score of 5.
As for the level of concern for improving organizational performance, all companies were concerned with this aspect, but only 34.1% were very concerned, while 11.4% were less concerned (Table 6).
The authors used the one-way ANOVA statistical test to analyze whether the company’s level of concern regarding the organizational performance (OP) improvement is influenced by the size of the company or its age. According to the test results (F (2,41) = 0.218, p = 0.805), there is no statistically significant difference between the groups of companies having different sizes regarding the level of concern about organizational performance improvement (Table 7).
The same result was obtained regarding the age of the company: the one-way ANOVA test (F (3,40) = 1.092, p = 0.364) proved that there is no statistically significant difference between groups of companies with different ages regarding the level of concern about organizational performance improvement (Table 7).

4.2. Determining the Main Factors That Influence the Organizational Performance of Companies Providing IT Services

To determine the main factors that influence the organizational performance of companies (OP) providing IT services, an analysis of Pearson coefficients was performed (Table 8).
To interpret the values of the Pearson coefficients, the authors used Evans’ guide, according to which a moderate correlation ranges between 0.40 and 0.59, a strong correlation ranges between 0.60 and 0.79, a very strong correlation ranges between 0.80 and 1.0, while below 0.40 there is a very low correlation [113]. The results indicate that there is a strong positive correlation between quality and organizational performance (r = 0.640, p < 0.01), while innovation, continuous improvement, and management experience moderate influence on the firm performance. On the one hand, the factor that influences organizational performance the most is the business excellence model, and the correlation between this factor and organizational performance is strong and positive (r = 0.755, p < 0.01). On the other hand, the factor that does not influence the organizational performance is the financial one (r = 0.264, p > 0.05).
To analyze in-depth the results obtained, the correlations between the items used to describe the factors mentioned in this study and the organizational performance were also investigated (Table 9).
The results of the study show that companies that use employee skills development programs or ISO 9000 standards have an improved level of performance. It is very interesting to note that there is no significant correlation between organizational performance and using Six Sigma or Lean Six Sigma (p > 0.05). These results may suggest that, for improving the quality of IT services, the use of Six Sigma methods is not necessary, because many of the services are personalized, requiring increased attention of employees who have highly developed knowledge and skills in this area. Furthermore, all of the main criteria that describe the European Foundation for Quality Management Excellence Model (EFQM) are positively associated with organizational performance.
Developing an organizational culture (r = 0.735, p < 0.01) and analyzing the results obtained by the company (r = 0.665, p < 0.01) also have a strong positive correlation with the organizational performance of companies in the IT area. Those results may indicate the importance of developing an organizational culture oriented to excellence as well as the importance of the key performance indicators that must be clearly defined, implemented, monitored, analyzed, and developed to measure the improvements in firm performance. Although the manager’s experience can influence the organizational performance, it seems that the manager’s age is not relevant for this goal.
To test if the age or the size of the company influence the organizational performance, the authors performed a nonlinear regression analysis. Thus, SPSS software was used to analyze curve estimation for the relationship between organizational performance and both variables (Table 10).
The equation that best describes the relationship between the dependent and independent variables is the quadratic one (F-value of 5.199 for the size of the company as an independent variable and 4.129 for the age of the company as an independent variable). Both of the R-square values for the quadratic equation are low (0.202 and 0.169), which indicates that these equations did not explain very much the variance in organizational performance.

5. Discussion

The results of this study indicate that any IT service provider that aims for a high level of organizational performance should be more concerned with innovating services and processes (H2), as well as improving its quality (H4). Quality is one of the key factors that can positively influence customer satisfaction [60] or even all stakeholders [71]. These aspects are also supported by the results of the studies mentioned in the literature review and hypothesis development section [45,46,47,48], which indicate that developing and improving a company’s innovation potential helps to improve organizational performance. Moreover, Romanian IT companies should focus on improving processes and the employees’ knowledge and skills, with these also being key factors that can influence organizational performance, as Huang [41] found. To be able to successfully implement these aspects, the company must carefully choose the people in charge and rely on their experience and knowledge (H2), with their age being irrelevant. These results are supported by other studies [80,81,82].
Business excellence models greatly influence organizational performance, and the results of this study showed that there is the strongest direct correlation between these concepts (H6). Analyzing the main criteria on which the business excellence models are based, the authors determined that, the more importance the company attaches to these criteria, the higher the level of business performance. This outcome is in accordance with what is claimed by the EFQM model of excellence [72,75], which states that the role of implementing such models is not only to measure a company’s level of organizational performance, but even to continuously improve it, leading to business sustainability. Consequently, business excellence models are used not only to achieve high levels of organizational performance to exceed the expectations of all stakeholders [72], but also as tools for assessing sustainability [114]. Other papers emphasize that sustainability can be achieved only if a company integrates both business models and corporate social responsibility practices [114]. If companies are concerned with achieving business excellence, they manage to improve their performance at the economic, social, or environmental level, with these being important pillars of sustainability [115].
Furthermore, the results of the study also indicate that continuous improvement influences the organizational performance of Romanian IT companies (H5). Despite this result, the use of Six Sigma and Lean Six Sigma methods does not contribute to organizational performance improvement, which contradicts other studies [60,105,107,116]. This could be explained by the fact that there are other more widely used techniques in the IT industry (Agile, Scrum, or Kanban practices) that help the company to provide quality IT services [117,118]. However, ISO 9000 standards remain elements that certify the quality of services and help improve the level of quality within companies, with these results being in accordance with previous studies [97]. Moreover, the age (H7) and size (H8) of the company influence organizational performance to some extent, because, over time, the company can grow and invest more in its employees, which will consequently develop specific skills and lead the company to higher organizational performance [77,79].
Although many studies show that improvements in the financial dimension of a company contribute to the improvement in financial performance [34,35,36,37,38,39,40,41,42,43,44,119], the results of the present research contradict this hypothesis. The obtained results indicate that an improvement in the financial resources allocated to the activity in the IT industry does not necessarily help to attain better results (H1). This can be explained by the fact that, in this industry, great value is placed on employees, their knowledge, and what they achieve. In the last few years, in Romania, over 24,000 companies operated in the IT sector [120], precisely because the investment necessary to open and conduct such a business is not large, with the labor force being the most expensive resource.

6. Conclusions

This paper identified and analyzed the key success factors that enable IT service providers to achieve organizational performance. By analyzing these factors, the authors intended to assist the IT organizations in developing strategies for improving their organizational performance, indicating features that could guide the success of such initiatives.
The results of this research are summarized as follows. First, the results of the study show that companies that use employee skills development programs or ISO 9000 standards have an improved level of performance. Second, the outcomes of the paper could help IT companies with the recruitment decisions of top managers, who must be experienced and have knowledge in the field, with their age being irrelevant. Third, the study results fill the gap and emphasize that the use of Six Sigma and Lean Six Sigma methods does not contribute to the organizational performance improvement for IT companies.
Through the results obtained, this study makes significant contributions to the specialized literature. First, while previous studies investigated some of the key factors that can influence organizational performance individually, this research integrated them into a conceptual model, in order to investigate their impact on organizational performance. Thus, the results of this study confirm that business excellence models, continuous improvement, service quality, management experience, and the organizational innovation level are some of the key success factors that positively influence the organizational performance of Romanian IT companies.
Second, this study highlights the relationship between organizational performance and the use of business excellence models, which was found to have the most positive influence on organizational performance. In this respect, aspects like developing an organizational culture that is oriented towards leadership, sustainable value, and stakeholders’ involvement; performing more detailed analyses regarding the results obtained by the company; adaptation to changes in the environment; and setting a clear definition of the company’s purpose, vision, and mission, must be key issues on which companies should focus if they are interested in achieving a high level of organizational performance that could lead to organizational excellence. Therefore, this study contributes to the literature on business sustainability, as it demonstrates the features that can make a company successful and resilient in the market, by improving its organizational performance. Other key success factors that a company should take into account are the following: adapting to changes in the environment, leadership style, the continuous analysis of stakeholder’s perceptions on results obtained by the company, developing an organizational culture, and creating sustainable value.
Third, in this study, the authors examined if the age or the size of the company influence organizational performance. By performing nonlinear regression analysis, the authors found that organizational performance is not linearly influenced by the age or size of companies, which means that, no matter how small or large, or new or old, an IT company is, it can still achieve results that ensure its success in the market, especially if it turns its attention towards the key success factors discussed in this paper.
The practical implications of this research can be provided as follows. The results of this study can represent a starting point in the development of a guide for the successful implementation of initiatives to improve organizational performance. The findings emphasize the need to develop projects or work strategies that concentrate not only on improving the quality of services provided or the level of the company’s innovation, but also on developing an organizational culture focused on the advantages of business excellence models.
Furthermore, the results highlight that organizational performance can also be influenced by management experience, process improvement, application of ISO 9000 standards, and employees’ skills development programs. IT service employees and the management style are focal points in a company, because they represent the core of the organization. By having well-trained and satisfied employees that are constantly involved in skills development programs, a well-founded organizational culture, and a good leadership style, IT service companies can be one step closer to innovative services and top service quality, creating sustainable added value.
From a practical standpoint, too, this research indicates that the financial results of Romanian companies in the IT industry do not necessarily influence organizational performance. In general, services in the IT industry are very expensive, compared with the low operating costs. This is why a large amount of money collected for the provision of IT services does not necessarily reflect good quality of these services, a high degree of satisfaction of customers or employees, or a high level of organizational performance, but simply shows the normal trends of a constantly expanding market, especially in the current context of digitalization. Thus, on one hand, these results can give an incentive to IT enthusiasts to open their business in this field, because the lack of financial resources would not necessarily prevent them from registering favorable results in the market. On the other hand, the results show that, in a business field for which the revenues from the provision of services can be considerably higher than in others, entrepreneurs and employees should be more concerned with improving different aspects of the company, as the financial aspect is not the one that directly drives the organizational performance of a business and its sustainable operation in the market.
However, although the financial component is not a factor that directly affects organizational performance, it has an important role to play in ensuring continuous improvement, as well as ensuring experienced management. Thus, the results of this paper show that, the more companies are willing to invest in attracting experienced managers, the better their financial results can be. In addition, management experience, supported by the continuous allocation of financial resources, can help IT companies improve both their processes and the skills and knowledge of employees. As this research has demonstrated that business excellence models are the most important factor in achieving performance, it can be said that the financial dimension is still a factor that contributes to improving the organizational performance over time, indirectly. Thus, the financial dimension proves to be the necessary fuel for the proper functioning of the other factors that enable the achievement of organizational performance.
Despite the results obtained, this study has several limitations. Firstly, as this study was based on a non-probabilistic method (e.g., the survey), future studies should be conducted using qualitative and quantitative analysis. Thus, in the future, interviews will be conducted with the managers of the IT companies to identify other possible factors that influence the organizational performance of the companies providing IT service. Through such studies, the literature in the field can be improved with new factors that have not been addressed yet, and the results of future research indicating more practical directions that can be focused on by companies interested in improving organizational performance.
Secondly, the size and structure of the population are other limitations, as this is an exploratory study. The limited resources, as well as the busy schedule of those working in the IT field during this turbulent period caused by the COVID-10 pandemic, have left their mark on data collection. Considering that more than a year and a half has passed since IT companies started to adapt to new trends and activities, a larger and more representative population should be analyzed for future studies.
Thirdly, as the questionnaire was applied only to IT companies in Bucharest, future studies should focus on targeting other cities, in order to test if the region, population density, education, or lifestyle bring changes in terms of factors that affect the organizational performance of companies in the IT sector.
Fourthly, this study did not take into account the satisfaction of stakeholders in the analysis of factors affecting organizational performance. However, the results indicated that the quality of services is one of the key factors influencing performance. High levels of quality could lead to high levels of satisfaction, which could have a potentially positive impact on the financial performance of companies. Although quality and customers’ satisfaction are closely linked, they are not necessarily derivative of each other, and future research should take this aspect into account. Thus, stakeholder satisfaction should be introduced in future research as a potential key factor contributing to improving organizational performance.
In conclusion, there is a need for future studies related to the factors that enable companies to achieve organizational performance. This should be sustained by developing new business models and by increasing the interest of the companies in this field.

Author Contributions

Conceptualization, A.B. and G.M.; methodology, A.B. and G.M.; software, A.B.; validation, A.B., G.M., D.C.D. and Ş.-A.C.; formal analysis, A.B.; investigation, A.B.; resources, A.B., G.M., D.C.D. and Ş.-A.C.; data curation, A.B.; writing—original draft preparation, A.B.; writing—review and editing, A.B., D.C.D. and Ş.-A.C.; visualization, A.B.; supervision, G.M. and D.C.D.; project administration, A.B., G.M., D.C.D. and Ş.-A.C.; funding acquisition, University POLITEHNICA of Bucharest. All authors have read and agreed to the published version of the manuscript.

Funding

This research was funded by University Politehnica of Bucharest, “Engineer in Europe” project, No. 140/GP/19.04.2021, through the Romanian Ministry of Education fund for financing special situations.

Institutional Review Board Statement

The study was conducted according to the guidelines of the Declaration of Helsinki, and in accordance with the University Professional Code of Ethics of University Politehnica of Bucharest from the University Charter (2019).

Informed Consent Statement

Informed consent was obtained from all subjects involved in the study.

Data Availability Statement

Not applicable.

Conflicts of Interest

The authors declare no conflict of interest.

References

  1. Cucinotta, D.; Vanelli, M. WHO Declares COVID-19 a Pandemic. Acta Biomed. Atenei Parm. 2020, 91, 157–160. [Google Scholar]
  2. Jung, J.-H.; Shin, J.-I. Big Data Analysis of Media Reports Related to COVID-19. Int. J. Environ. Res. Public Health 2020, 17, 5688. [Google Scholar] [CrossRef]
  3. Chowdhury, S.A.; Akter, S.; Chowdhury, M.M.; Ahsan, S.M.H.; Yasir Arafat, A.B.M. Is COVID-19 a Blessing for Ecommerce: A View from Bangladesh. Glob. J. Manag. Bus. Res. 2021. Available online: https://journalofbusiness.org/index.php/GJMBR/article/view/3366 (accessed on 28 July 2021).
  4. Bhatti, A.; Akram, H.; Basit, H.M.; Khan, A.U.; Raza, S.M.; Bilal, M. E-commerce trends during COVID-19 Pandemic. Int. J. Future Gener. Commun. Netw. 2020, 13, 5. [Google Scholar]
  5. Priyono, A.; Moin, A.; Putri, V.N.A.O. Identifying Digital Transformation Paths in the Business Model of SMEs during the COVID-19 Pandemic. J. Open Innov. Technol. Mark. Complex. 2020, 6, 104. [Google Scholar] [CrossRef]
  6. Hasanat, M.W.; Hoque, A.; Shikha, F.A.; Anwar, M.; Hamid, A.B.A.; Tat, H.H. The Impact of Coronavirus (Covid-19) on E-Business in Malaysia. Asian J. Multidiscip. Stud. 2020, 3, 85–90. [Google Scholar]
  7. Xayrullaevna, S.N.; Pakhritdinovna, K.D.; Anvarovna, B.G. Digitalization of the economy during a pandemic: Accelerating the pace of development. J. Crit. Rev. 2020, 7, 2491–2498. [Google Scholar]
  8. Jung, S.; Wortmann, F.; Bronner, W.; Gassmann, O. Platform Economy: Converging IoT Platforms and Ecosystems. In Connected Business; Gassmann, O., Ferrandina, F., Eds.; Springer: Cham, Switzerland, 2021. [Google Scholar]
  9. Hamann, P.M.; Schiemann, F.; Bellora, L.; Guenther, T.W. Exploring the dimensions of organizational performance: A construct validity study. Organ. Res. Methods 2013, 16, 67–87. [Google Scholar] [CrossRef]
  10. Devinney, T.M.; Yip, G.S.; Johnson, G. Using frontier analysis to evaluate company performance. Br. J. Manag. 2010, 21, 921–938. [Google Scholar] [CrossRef]
  11. Combs, J.G.; Crook, T.R.; Shook, C.L. The dimensionality of organizational performance and its implications for strategic management research. In Research Methodology in Strategy and Management; Ketchen, D.J., Bergh, D.D., Eds.; Emerald Group Publishing Limited: Bingley, UK, 2005; Volume 2, pp. 259–286. [Google Scholar]
  12. Wong, C.-S.; Law, K.S.; Huang, G.-H. On the importance of conducting construct-level analysis for multidimensional constructs in theory development and testing. J. Manag. 2008, 34, 744–764. [Google Scholar] [CrossRef] [Green Version]
  13. Sink, S.; Tuttle, T. Planning and Measurement in your Organization of the Future; Industrial Engineering and Management Press: Norcross, GA, USA, 1989. [Google Scholar]
  14. Rolstadas, A. Enterprise performance measurement. Int. J. Oper. Prod. Manag. 1998, 18, 989–999. [Google Scholar] [CrossRef]
  15. Cozza, C.; Malerba, F.; Mancusi, M.L.; Perani, G.; Vezzulli, A. Innovation, profitability and growth in medium and high-tech manufacturing industries: Evidence from Italy. Appl. Econ. 2012, 44, 1963–1976. [Google Scholar] [CrossRef]
  16. Fukuyama, H.; Tan, Y. Implementing strategic disposability for performance evaluation: Innovation, stability, profitability and corporate social responsibility in Chinese banking. Eur. J. Oper. Res. 2021, 296, 652–668. [Google Scholar] [CrossRef]
  17. Verboncu, I.; Zalman, M. Management şi Performanţe; Universitary Publishing House: Bucharest, Romania, 2005. [Google Scholar]
  18. Albu, N.; Albu, C. Soluţii Practice de Eficientizare a Activităţilor şi de Creştere a Performanţei Organizaţionale; Editura CECCAR: Bucharest, Romania, 2005. [Google Scholar]
  19. Menu, M. Controlul Performanței în Management; Editura Tehnica-Info: Chişinău, Republic of Moldova, 2009. [Google Scholar]
  20. Manciu, I.; Marian, L.; Leşe, I.; Chibelean, C. The impact of using the mathematic model on managerial performance. Rev. De Manag. Şi Ing. Econ. 2018, 17, 504–513. [Google Scholar]
  21. Lebas, M. Performance measurement and performance management. Int. J. Prod. Econ. 1995, 41, 23–35. [Google Scholar] [CrossRef]
  22. Suárez-Gargallo, C.; Zaragoza-Sáez, P. How the Balanced Scorecard Is Implemented in the Spanish Footwear Industry. Sustainability 2021, 13, 5641. [Google Scholar] [CrossRef]
  23. Perkbox. Available online: https://www.perkbox.com/uk/resources/blog/why-employee-motivation-is-important-and-how-to-improve-measure-and-maintain-it (accessed on 1 July 2021).
  24. Richard, P.J.; Devinney, T.M.; Yip, G.S.; Johnson, G. Measuring organizational performance: Towards methodological best practice. J. Manag. 2009, 35, 718–804. [Google Scholar] [CrossRef] [Green Version]
  25. Pollard, C.; Cater-Steel, A. Justifications, strategies, and critical success factors in successful ITIL implementations in U.S. and Australian companies: An exploratory study. Inf. Syst. Manag. 2009, 26, 164–175. [Google Scholar] [CrossRef] [Green Version]
  26. Bordoloi, S.; Fitzsimmons, J.; Fitzsimmons, M. Service Management: Operations, Strategy, Information Technology; McGraw-Hill Education: New York, NY, USA, 2018. [Google Scholar]
  27. The European Commission Mutual Learning Programme for Public Employment Services, 2012, Organisational Development, Improvement and Innovation Management in Public Employment Services. Available online: https://ec.europa.eu/social/BlobServlet?docId=14104&langId=en (accessed on 13 November 2020).
  28. Financial Paper. Available online: https://www.zf.ro/banci-si-asigurari/it-ul-vedeta-economiei-romanesti-sectorul-castigator-pandemiei-prima-19654861 (accessed on 22 June 2021).
  29. Global Knowledge. Available online: https://www.globalknowledge.com/us-en/resources/resource-library/articles/12-challenges-facing-it-professionals/#gref (accessed on 22 June 2021).
  30. Yoopetch, C.; Nimsai, S.; Kongarchapatara, B. The Effects of Employee Learning, Knowledge, Benefits, and Satisfaction on Employee Performance and Career Growth in the Hospitality Industry. Sustainability 2021, 13, 4101. [Google Scholar] [CrossRef]
  31. Hannabarger, C.; Buchman, R.; Economy, P. Goals, Scores, and the Balanced Scorecard. In Balanced Scorecard Strategy for Dummies; John Wiley and Sons: Indianapolis, IN, USA, 2007. [Google Scholar]
  32. Barbu, A.; Militaru, G. The Key Indicators Used to Measure the Performance of the Service Companies: A Literature Review. Ovidius Univ. Ann. Ser. Econ. Sci. 2019, 19, 355–364. [Google Scholar]
  33. Cleary, P.; Quinn, M. Intellectual capital and business performance. J. Intellect. Cap. 2016, 17, 255–278. [Google Scholar] [CrossRef] [Green Version]
  34. Holler, A. New Metrics for Value-Based Management. Enhancement of Performance Measurement and Empirical Evidence on Value-Relevance; Gabler: Heidelberg, Germany, 2009. [Google Scholar]
  35. Ebert, C.; Dumke, R.; Bundschuh, M.; Schmietendorf, A. Best Practices in Software Measurement: How to Use Metrics to Improve Project and Process Performance; Springer: Berlin, Germany, 2005. [Google Scholar]
  36. Kerzner, H. Project Management Metrics, KPIs, And Dashboards. A Guide to Measuring and Monitoring Project Performance, 3rd ed.; John Wiley and Sons: New Jersey, NJ, USA, 2017. [Google Scholar]
  37. Okes, D. Performance Metrics. The Levers for Process Management; ASQ Quality Press: Milwaukee, WI, USA, 2013. [Google Scholar]
  38. Militaru, G. Financial Management; Politehnica Press: Bucharest, Romania, 2015. [Google Scholar]
  39. Horváthová, E. Does environmental performance affect financial performance? A meta-analysis. Ecol. Econ. 2010, 70, 52–59. [Google Scholar] [CrossRef]
  40. Huang, C.J. Corporate governance, corporate social responsibility and corporate performance. J. Man. Org. 2010, 16, 641–655. [Google Scholar] [CrossRef]
  41. Magness, V. Strategic posture, financial performance and environmental disclosure: An empirical test of legitimacy theory. Account. Audit. Account. 2006, 19, 540–563. [Google Scholar] [CrossRef]
  42. Donker, H.; Poff, D.; Zahir, S. Corporate values, codes of ethics, and firm performance: A look at the Canadian context. J. Bus. Ethics 2008, 82, 527–537. [Google Scholar] [CrossRef]
  43. Berrone, P.; Surroca, J.; Tribó, J.A. Corporate ethical identity as a determinant of firm performance: A test of the mediating role of stakeholder satisfaction. J. Bus. Ethics 2007, 76, 35–53. [Google Scholar] [CrossRef]
  44. Chang, W.; Ellinger, A.E.; Kim, K.; Franke, G.R. Supply chain integration and firm financial performance: A meta-analysis of positional advantage mediation and moderating factors. Eur. Manag. J. 2016, 34, 282–295. [Google Scholar] [CrossRef]
  45. Prajogo, D. The relationship Between Innovation and Business Performance—A Comparative Study Between Manufacturing and Service Firms. Knowl. Process. Manag. 2006, 13, 218–225. [Google Scholar] [CrossRef]
  46. Hall, L.A.; Bagchi-Sen, S. A study of R&D, innovation, and business performance in the Canadian biotechnology industry. Technovation 2002, 22, 231–244. [Google Scholar]
  47. Barbu, A.; Militaru, G. The Moderating Effect of Intellectual Property Rights on Relationship between Innovation and Company Performance in Manufacturing Sector. Procedia Manuf. 2019, 32, 1077–1084. [Google Scholar] [CrossRef]
  48. Barbu, A.; Militaru, G.; Fleacă, B.; Corocăescu, M. The Mediating Role of the Policy of Rewarding Creative Employees on the Relationship between the Personal Innovation Potential and Organizational Innovation. Evidence from Romania. In Proceedings of the 6th Review of Management and Economic Engineering International Management Conference, Cluj-Napoca, Romania, 20–22 September 2018; Todesco Publishing House: Cluj-Napoca, Romania, 2018; pp. 315–322. [Google Scholar]
  49. Barbu, A.; Militaru, G. Investigating the Innovation Potential of a Company Obtained Through Social Media. In Proceedings of the 12th International Management Conference “Management Perspectives in the Digital Era”, Bucharest, Romania, 1–2 November 2018; Editura ASE: Bucharest, Romania, 2018; pp. 247–258. [Google Scholar]
  50. Fang, S.C.; Wang, M.C.; Chen, P.C. The influence of knowledge networks on a firm’s innovative performance. J. Manag. Organ. 2017, 23, 22–45. [Google Scholar]
  51. Wooldridge, B.; Floyd, S.W. The strategy process, middle management involvement, and organizational performance. Strateg. Manag. J. 1990, 11, 231–241. [Google Scholar] [CrossRef]
  52. Armistead, C. Knowledge management and process performance. J. Knowl. Manag. 1999, 3, 143–157. [Google Scholar] [CrossRef]
  53. Chang, J. Business Process Management Systems. Strategy and Implementation, 1st ed.; Auerbach Publications: New York, NY, USA, 2006. [Google Scholar]
  54. Prajogo, D.; Toy, J.; Bhattacharya, A.; Oke, A.; Cheng, T.C.E. The Relationships Between Information Management, Process Management and Operational Performance: Internal and External Contexts. Int. J. Prod. Econ. 2018, 199, 95–103. [Google Scholar] [CrossRef]
  55. Miers, D. BPM: Driving Business Performance. BP Trends 2005, 5, 1–13. [Google Scholar]
  56. Salomo, S.; Weise, J.; Gemünden, H.G. NPD Planning Activities and Innovation Performance: The Mediating Role of Process Management and the Moderating Effect of Product Innovativeness. J. Prod. Innov. Manag. 2007, 24, 285–302. [Google Scholar] [CrossRef]
  57. Jacot, J. De la trilogie: Productivité, compétitivité, réntabilité a l’évaluation sociale de la performance industrielle. In Entreprise et Performance Globale: Outils, Évaluation, Pilotage; Economica: Paris, France, 1997; pp. 29–37. [Google Scholar]
  58. Pottier, P. Introduction à la gestion; Faucher: Paris, France, 2000. [Google Scholar]
  59. Militaru, G. Service Management; C.H. Beck: Bucharest, Romania, 2010. [Google Scholar]
  60. Fitzsimmons, J.; Fitzsimmons, M. Service Management; McGraw-Hill: New York, NY, USA, 2003. [Google Scholar]
  61. Deming, W. Quality, Productivity and Competitive Position; Cambridge: Cambridge, MA, USA, 1982. [Google Scholar]
  62. Halawi, A.; Haydar, N. Effects of Training on Employee Performance: A Case Study of Bonjus and Khatib & Alami Companies. Int. Humanit. Stud. 2018, 5, 24–45. [Google Scholar]
  63. Iqbal, A. The strategic human resource management approaches and organisational performance: The mediating role of creative climate. J. Adv. Manag. Res. 2019, 16, 181–193. [Google Scholar] [CrossRef]
  64. Deselnicu, D.C.; Swiger, J.A.; Albu, L.; Doman, C. Leadership Performance in Romanian Companies. Case Study. In Proceedings of the 3rd International Conference on Advanced Materials and Systems, Bucharest, Romania, 16–18 September 2010; Certex Publishing House: Bucharest, Romania; pp. 509–514. [Google Scholar]
  65. Harrington, H. The five pillars of organizational excellence. Handb. Bus. Strategy 2005, 6, 107–114. [Google Scholar] [CrossRef]
  66. McAdam, R. Quality models in an SME context. Int. J. Qual. Reliab. Manag. 2000, 17, 305–323. [Google Scholar] [CrossRef]
  67. Cameron, K.S.; Quinn, R.E. Diagnosing and Changing Organizational Culture: Based on the Competing Values Framework; John Wiley & Sons: Hoboken, NJ, USA, 2011. [Google Scholar]
  68. Cătuneanu, V. Quality Improvement; Romanian Foundation for Quality Promotion: Bucharest, Romania, 2003; pp. 100–103. [Google Scholar]
  69. Crişan, C. Elaboration of Recommendations for Public Policies at Central and Local Level. Available online: https://econ.ubbcluj.ro/documente2013/Documente%20justificative%20martie%202013-%20iulie%202013/Activitatea%20WP%2011.5/Wp.11.5%20Recomandari%20pentru%20politicile%20publice%20la%20nivel%20central%20si%20local.docx (accessed on 13 November 2020).
  70. Mann, R.; Adebanjo, D.; Tickle, M. Deployment of business excellence in Asia: An exploratory study. Int. J. Qual. Reliab. Manag. 2011, 28, 604–627. [Google Scholar] [CrossRef] [Green Version]
  71. Vadari, S.; Parandker, S.R. A systems approach to business excellence to improve the sustainability of an organization. In Proceedings of the 2011 Annual IEEE India Conference, Engineering Sustainable Solutions, Hyderabad, India, 16–18 December 2011; pp. 1–4. [Google Scholar]
  72. EFQM. Available online: https://www.efqm.org/ (accessed on 16 March 2021).
  73. Business Excellence Tools. Available online: https://www.businessexcellencetools.com/business-excellence/ (accessed on 1 September 2021).
  74. Araújo, M.; Sampaio, P. The path to excellence of the Portuguese organisations recognised by the EFQM model. Total Qual. Manag. Bus. Excell. 2014, 25, 427–438. [Google Scholar] [CrossRef] [Green Version]
  75. Dahlgaard-Park, S. Reviewing the European excellence model from a management control view. TQM J. 2008, 20, 98–119. [Google Scholar] [CrossRef]
  76. Majumdar, S.K. The Impact of Size and Age on Firm-Level Performance: Some Evidence from India. Rev. Ind. Organ. 1997, 12, 231–241. [Google Scholar] [CrossRef]
  77. Coad, A.; Segarra, A.; Teruel, M. Like milk or wine: Does firm performance improve with age? Struct. Chang. Econ. Dyn. 2013, 24, 173–189. [Google Scholar] [CrossRef] [Green Version]
  78. Pervan, M.; Pervan, I.; Ćurak, M. The Influence of Age on Firm Performance: Evidence from the Croatian Food Industry. J. East. Eur. Res. Bus. Econ. 2017, 2017, 1–10. [Google Scholar] [CrossRef] [Green Version]
  79. Odalo, S.K.; Achoki, G.; Njuguna, A. Relating Company Size and Financial Performance in Agricultural Firms Listed in the Nairobi Securities Exchange in Kenya. Int. J. Econ. Financ. 2016, 8, 34–40. [Google Scholar] [CrossRef] [Green Version]
  80. Utami, E.S.; Hasan, M. The Role of Corporate Social Responsibility on the Relationship between Financial Performance and Company Value. J. Asian Financ. Econ. Bus. 2021, 8, 1249–1256. [Google Scholar]
  81. Fujiant, L. Top Management Characteristics and Company Performance: An Empirical Analysis on Public Companies Listed in the Indonesian Stock Exchange. Eur. Res. Stud. J. 2018, XXI, 62–76. [Google Scholar] [CrossRef] [Green Version]
  82. Becker-Blease, J.R.; Kaen, F.R.; Etebari, A.; Baumann, H. Employees, firm size and profitability in U.S. manufacturing industries. Invest. Manag. Financ. Innov. 2010, 7, 7–23. [Google Scholar]
  83. Mahzura, T.A.S. The Analysis of the Influence of Financial Performance, Company Size, Ownership Structure, Leverage and Company Growth on Company Values in Food and Beverage Industry Companies Listed in IDX 2012–2016 Period. Int. J. Public Budg. Account. Financ. 2018, 1, 1–12. [Google Scholar]
  84. Commission Recommendation of 6 May 2003 Concerning the Definition of Micro, Small and Medium-Sized Enterprises (Text with EEA Relevance) (Notified under Document Number C(2003) 1422) OJ L 12420.5. 2003, pp. 36–41. Available online: http://data.europa.eu/eli/reco/2003/361/oj (accessed on 16 July 2021).
  85. Kaplan, R.; Norton, D. The Balanced Scorecard: Measures That Drive Performance. Harv. Bus. Rev. 1992, 70, 71–79. [Google Scholar]
  86. Heskett, J.L.; Jones, T.O.; Loveman, G.W.; Sasser, E., Jr.; Schlesinger, L.A. Putting the Service-Profit Chain to Work. Harv. Bus. Rev. 1994, 72, 164–170. [Google Scholar]
  87. Koys, D.J. The Effects of Employee Satisfaction, Organizational Citizenship Behavior, and Turnover on Organizational Effectiveness: A Unit-Level, Longitudinal Study. Pers. Psychol. 2001, 54, 101–114. [Google Scholar] [CrossRef]
  88. Larivière, B. Linking Perceptual and Behavioral Customer Metrics to Multiperiod Customer Profitability: A Comprehensive Service-Profit Chain Application. J. Serv. Res. 2008, 11, 3–21. [Google Scholar] [CrossRef]
  89. Coviello, N.; Winklhofer, H.; Hamilton, K. Marketing Practices and Performance of Small Service Firms: An Examination în the Tourism Accommodation Sector. J. Serv. Res. 2006, 9, 38–58. [Google Scholar] [CrossRef]
  90. Tseng, L.-M.; Wu, J.-Y. How can financial organizations improve employee loyalty? The effects of ethical leadership, psychological contract fulfillment and organizaţional identification. Leadersh. Organ. Dev. J. 2017, 38, 679–698. [Google Scholar] [CrossRef]
  91. Meyer, J.; Stanley, D.; Herscovitch, L.; Topolnytsky, L. Affective, Continuance, and Normative Commitment to the Organization: A Meta-analysis of Antecedents, Correlates, and Consequences. J. Vocat. Behav. 2002, 61, 20–52. [Google Scholar] [CrossRef]
  92. Cotton, J.; Tuttle, J. Employee Turnover: A Meta-Analysis and Review with Implications for Research. Acad. Manag. Rev. 1986, 11, 55–70. [Google Scholar] [CrossRef]
  93. Griffeth, R.W.; Hom, P.W.; Gaertner, S. A Meta-Analysis of Antecedents and Correlates of Employee Turnover: Update, Moderator Tests, and Research Implications for the Next Millennium. J. Manag. 2000, 26, 463–488. [Google Scholar] [CrossRef]
  94. Brown, S.P.; Lam, S.K. A Meta-Analysis of Relationships Linking Employee Satisfaction to Customer Responses. J. Retail. 2008, 84, 243–255. [Google Scholar] [CrossRef]
  95. Saks, A. Antecedents and consequences of employee engagement. J. Manag. Psychol. 2006, 21, 600–619. [Google Scholar] [CrossRef] [Green Version]
  96. International Organization for Standardization. Available online: https://www.iso.org/iso-9001-quality-management.html (accessed on 22 June 2021).
  97. Siougle, E.; Dimelis, S.; Economidou, C. Does ISO 9000 certification matter for firm performance? A group analysis of Greek listed companies. Int. J. Prod. Econ. 2019, 209, 2–11. [Google Scholar]
  98. Kakouris, A.; Sfakianaki, E. Impacts of ISO 9000 on Greek SMEs business performance. Int. J. Qual. Reliab. Manag. 2018, 35, 2248–2271. [Google Scholar]
  99. Chiarini, A. From Total Quality Control to Lean Six Sigma. Evolution of the Most Important Management Systems for the Excellence; Springer: New York, NY, USA, 2012. [Google Scholar]
  100. Chams, N.; García-Blandón, J.; Hassan, K. Role Reversal! Financial Performance as an Antecedent of ESG: The Moderating Effect of Total Quality Management. Sustainability 2021, 13, 7026. [Google Scholar] [CrossRef]
  101. Klefsjo, B.; Wiklund, H.; Edgeman, R.L. Six sigma seen as a methodology for total quality management. Meas. Bus Excell. 2001, 5, 31–35. [Google Scholar] [CrossRef]
  102. Adebanjo, D. TQM and business excellence: Is there really a conflict? Meas. Bus. Excell. 2001, 5, 37–40. [Google Scholar] [CrossRef] [Green Version]
  103. The Association of Accountants and Financial Professionals in Business. Available online: https://higherlogicdownload.s3.amazonaws.com/IMANET/9c3fec55-8e4a-4c76-80f7-e0f5f2927b3f/UploadedImages/Six_Sigma_n_Process_Improvement_25Jan20.pdf (accessed on 23 July 2021).
  104. Przekop, P. Six Sigma for Business Excellence: A Manager’s Guide to Supervising Six Sigma Projects and Teams; McGraw-Hill: New York, NY, USA, 2003. [Google Scholar]
  105. Charantimath, P. Total Quality Management, 3rd ed.; Pearson: Uttar Pradesh, India, 2017. [Google Scholar]
  106. Snee, R.D. Lean Six Sigma–Getting better all the time. Int. J. Lean Six Sigma 2010, 1, 9–29. [Google Scholar] [CrossRef]
  107. Zhan, W.; Ding, X. Engineering Management Collection: Lean Six Sigma and Statistical Tools for Engineers and Engineering Managers; Momentum Press: New York, NY, USA, 2016. [Google Scholar]
  108. EFQM. The EFQM Model Brochure; EFQM: Brussels, Belgium, 2019; pp. 1–42. [Google Scholar]
  109. Anbuselvan, S.; Kumar, D.N. Challenges Faced by Professors in Online Teaching during COVID-19 Pandemic with Special Reference to Madurai District of Tamilnadu. Res. Explor. Blind Rev. Ref. Q. Int. J. 2020, 1, 1–9. [Google Scholar]
  110. Alipour, S.; Zohreh, Z.; Ghadiri, M. Validating Factor Structure of the Persian Version of Emotion Regulation Strategies Inventory among Iranian EFL University Teachers. Appl. Res. Engl. Lang. 2021, 10, 81–104. [Google Scholar]
  111. Perry, R.H.; Charlotte, B.; Isabella, M.; Bob, C. SPSS Explained; Routledge Taylor & Francis Group: New York, NY, USA, 2004. [Google Scholar]
  112. Taber, K.S. The Use of Cronbach’s Alpha When Developing and Reporting Research Instruments in Science Education. Res. Sci. Educ. 2017, 48, 1273–1296. [Google Scholar] [CrossRef]
  113. Evans, J.D. Straightforward Statistics for the Behavioral Science; Brooks/Cole Publishing Company: Pacific Grove, CA, USA, 1996. [Google Scholar]
  114. Jankalová, M.; Jankal, R. Sustainability Assessment According to the Selected Business Excellence Models. Sustainability 2018, 10, 3784. [Google Scholar] [CrossRef] [Green Version]
  115. Slapper, T.F.; Hall, T.J. The Triple Bottom Line: What Is It and How Does It Work? Indiana Bus. Rev. 2011, 2011, 1–8. [Google Scholar]
  116. Cai, S.; Jun, M. A qualitative study of the internalization of ISO 9000 standards: The linkages among firms’ motivations, internalization processes, and performance. Int. J. Prod. Econ. 2018, 196, 248–260. [Google Scholar] [CrossRef]
  117. Azanha, A.; Argoud, A.R.T.T.; Camargo Junior, J.B.; Antoniolli, P.D. Agile project management with Scrum. Int. J. Proj. Manag. Bus. 2017, 10, 121–142. [Google Scholar] [CrossRef]
  118. Lei, H.; Ganjeizadeh, F.; Jayachandran, P.K.; Ozcan, P. A statistical analysis of the effects of Scrum and Kanban on software development projects. Robot Comput. Integr. Manuf. 2017, 43, 59–67. [Google Scholar] [CrossRef]
  119. Barbu, A.; Militaru, G.; Savu, I.C. The Influence of the Financial-Accounting Process on the Performance of the Organizations in the Field of Services. In Proceedings of the 7th Review of Management and Economic Engineering, International Management Conference, “Management Challenges Within Globalization”, Cluj-Napoca, Romania, 17–19 September 2020; Todesco Publishing House: Cluj Napoca, Romania, 2020; pp. 530–536. [Google Scholar]
  120. Economica.net. Available online: https://www.economica.net/analiza-industria-de-software-din-romania-va-creste-la-un-maxim-istoric-de-peste-8-miliarde-de-euro-in-2020-topul-companiilor_193563.html (accessed on 30 June 2021).
Figure 1. The conceptual framework.
Sustainability 13 10996 g001
Table 1. Respondents’ gender, position, and experience in the IT sector.
GenderPositionExperience in the IT SectorTotal
Less than 3 YearsBetween 3 and 5 YearsBetween 5 and 10 Years
MaleLeadership0112
Execution185326
Total186428
FemaleExecution113216
Total113216
Table 2. Items used to describe the organizational performance.
ConstructVariablesReferences
Organizational
performance
(OP)
Profitability[36,37,38,39,40,41,42,43,44,45,46,85,86,87,88]
Revenue[36,37,38,39,40,41,42,43,44,45,46,85,86,87,88]
Market share[85,86,87,88]
Service quality[73,85,86,87,88,89]
Customers’ satisfaction[73,85,86,87,88,89]
Employees’ satisfaction[73,85,86,87,88,89]
Processes[73,85,86,87,88,89]
Stakeholders’ satisfaction[85]
Table 3. Factors used in the research.
FactorsVariablesReferences
Financial dimension (F)•Financial resources[33,34,35,36,37,38,39,40,41,42,43,44,85]
•Financial results[33,34,35,36,37,38,39,40,41,42,43,44,85]
Organizational innovation level (I)•Innovative products and services
•Innovation methods and technics
[46,47,48,49,50]
Management experience (Me)•Management experience[55,56]
Service quality (Q)•Perceived service quality[59,60]
•Process improvement[61]
Continuous improvement (Ci)•Employee skills[62,90,91,92,93,94,95]
•Employee skills development programs[61,90,91,92,93,94,95,96]
•Application of ISO 9000 standards[96,97,98]
•Using the Six Sigma method[99,100,101,102,103,104]
•Using the Lean Six Sigma method[105,106,107]
Business excellence models (BEMs)•Clear definition of the company’s purpose, vision, and mission[108]
•Developing an organizational culture[108]
•Leadership style[108]
•Stakeholder involvement[108]
•Creating a sustainable value[108]
•Adaptation to changes in the environment[108]
•Stakeholder perceptions analysis[108]
•Analysis of the results obtained by the company[108]
Size of the company•The size of the company[79,80,81,82,83,84,85]
Age of the company•The age of the company[76,77,78]
Table 4. Reliability and validity analysis of the questionnaire.
VariablesFactor
Loadings
FactorEigenvalues%VarianceCronbach’s Alpha
Financial resources0.843Financial
dimension
1.4271.140.686
Financial results0.843
Innovative products and services0.834Innovation1.3768.970.645
Innovation methods and techniques0.824
Service quality0.817Quality1.3366.680.601
Process improvement0.817
ISO 9000 standards0.881Continuous
improvement
2.9158.260.819
Six Sigma0.783
Lean Six Sigma0.838
Employees’ skills0.680
Employees’ skills development programs0.598
Company’s purpose, vision, and mission0.751Business
excellence
models
4.5356.670.888
Leadership style0.760
Organizational culture0.709
Sustainable value0.808
Stakeholder involvement0.746
Adaptation to environmental changes0.630
Stakeholders’ perceptions0.735
Results0.862
Profitability0.871Organizational performance4.3754.710.857
Revenue0.679
Market share0.864
Service quality0.841
Customers’ satisfaction0.811
Employees’ satisfaction0.808
Processes0.682
Stakeholders’ satisfaction0.702
Table 5. The calculation method of the organizational performance score.
VariableCalculation Method
Organizational performanceP = (Pr + Re + Ms + Pc + Pe + Pig + Pp + Qs)/8 = 4.34
Table 6. The company’s level of concern regarding the organizational performance improvement.
ValuesFrequencyPercentValid PercentCumulative Percent
Less concerned511.411.411.4
Concerned2454.554.565.9
Very concerned1534.134.1100.0
Total44100.0100.0
Table 7. One-way ANOVA test for the size and the age of the companies based on OP.
VariablesValuesSum of SquaresdfMean SquareFSig.
SizeBetween Groups0.18720.0930.2180.805
Within Groups17.541410.428
Total17.72743
AgeBetween Groups1.34230.4471.0920.364
Within Groups16.385400.410
Total17.72743
Table 8. Correlations between OP and identified factors.
FactorsOPBEMsCiFQMeI
OP-
BEMs0.755 **-
Ci0.438 **0.721 **-
F0.2640.490 **0.593 **-
Q0.640 **0.529 **0.1980.018-
Me0.478 **0.569 **0.573 **0.300 *0.563 **-
I0.577 **0.513 **0.314 *0.1900.696 **0.345 *-
Note: OP—organizational performance, BEMs—business excellence models, Ci—continuous improvement; F—financial dimension; Q—service quality; Me—management experience; I—organizational innovation level; N = 44; * correlation is significant at the 0.05 level (two-tailed); ** correlation is significant at the 0.01 level (two-tailed).
Table 9. Correlations between OP and the identified study items.
VariablesThe Relationship with OPTypes of Correlations
Pearson CorrelationSig. (Two-Tailed)
Financial resources0.2050.182No correlation
Financial results0.2450.109No correlation
Innovation0.577 **0.000Positive, moderate
Innovative products and services0.570 **0.000Positive, moderate
Innovation methods and techniques0.584 **0.000Positive, moderate
Management experience0.478 **0.001Positive, moderate
Perceived service quality0.638 **0.000Positive, strong
Process improvement0.417 **0.005Positive, moderate
Application of ISO 9000 standards0.401 **0.007Positive, moderate
Using the Six Sigma method0.1720.263No correlation
Using the Lean Six Sigma method0.1230.425No correlation
Employee skills0.543 **0.000Positive, moderate
Employee skills development programs0.474 **0.001Positive, moderate
Clear definition of the company’s purpose, vision, and mission0.387 **0.010Positive, weak
Developing an organizational culture0.735 **0.000Positive, strong
Leadership style0.575 **0.000Positive, moderate
Creating a sustainable value0.584 **0.000Positive, moderate
Stakeholder involvement0.506 **0.000Positive, moderate
Adaptation to changes in the environment0.482 **0.001Positive, moderate
Stakeholder perceptions analysis0.576 **0.000Positive, moderate
Analysis of the results obtained by the company0.665 **0.000Positive, strong
Manager’s age0.0980.526No correlation
Note: N = 44; OP—organizational performance; ** correlation is significant at the 0.01 level (two-tailed).
Table 10. Model summaries and parameter estimates for the selected study variables.
The Independent VariableEquationModel SummaryParameter Estimates
R-SquareFdf1df2Sig.Constantb1b2
Size of the companyLinear0.0542.4041420.1293.6520.199
Logarithmic0.0733.3281420.0753.4880.701
Inverse0.0954.3931420.0425.036−2.281
Quadratic0.2025.1992410.010−1.6423.788−0.571
Compound0.0803.6501420.0633.4141.068
Power0.1044.8691420.0333.2550.227
Growth0.0803.6501420.0631.2280.066
Exponential0.0803.6501420.0633.4140.066
Logistic0.0803.6501420.0630.2930.936
Age of the companyLinear0.0863.9331420.0543.9030.142
Logarithmic0.0582.6091420.1144.0830.260
Inverse0.0341.4781420.2314.508−0.369
Quadratic0.1694.1592410.0234.976−1.0140.226
Compound0.0823.7461420.0603.8181.039
Power0.0532.3541420.1324.0130.067
Growth0.0823.7461420.0601.3400.038
Exponential0.0823.7461420.0603.8180.038
Logistic0.0823.7461420.0600.2620.963
Note: the dependent variable is organizational performance.
Publisher’s Note: MDPI stays neutral with regard to jurisdictional claims in published maps and institutional affiliations.

