1. Introduction
Developing urban infrastructure is impossible without engaging the ecosystem and considering its changes. Urban landscapes are becoming more “technological” and less natural, which poses a threat to biological species and natural resource conservation [
1].
Urban construction is difficult, due to various land prices, attractiveness, and time frames; it complicates the creation of ecological landscapes and, essentially, becomes a business [
2].
Issues surrounding nature and landscape conservation, tourism, traffic management, and social and economic liveability, are interrelated [
3].
In the Ukraine, we still see out-of-date methods used in designing urban systems, i.e., newly built elements are surrounded by “dangerous” buildings, and are randomly constructed without considering environmental standards. The decrease (in the number and areas) of natural parks and landscapes, comprehensive ecosystem services, and increased pollution have become common phenomena [
4,
5]. Old buildings in the Ukraine, if not restored, are inefficient and dangerous [
6]. Landscape design is used for local buildings, and most of the territory of the cities of Kharkov, Odessa and Dnepropetrovsk regions is in an emergency and dilapidated state of housing from the entire housing stock [
7]. Moreover, as the world rapidly develops, new technologies appear, people live differently, and “old” cities become ineffective [
8].
Business competition has led to the emergence of new goods, more packaging materials, and new production facilities in unoccupied (urban) areas—a reflection of anthropogenic effects. In the Ukraine, there is corruption, inadequate fines, and minimal control over compliance with the law [
9]. Environmental passports are bought and sold; corruption exacerbates these effects [
10].
Along with landscape problems, there is the problem surrounding obsolescence in infrastructure, irrational planning of highways, and obsolescence of technology [
11]. There are opportunities for energy efficiency in all infrastructure elements and surrounding landscapes, which would not only benefit the environment, but also humans [
12].
Reconstructing old-fashioned buildings can be unprofitable and more expensive than developing new ones, resulting in “out-of-production” manufacturing facilities. This would be unprofitable for the owner, and the country does not have enough resources to liquidate such economic entities. City plans are obsolete and reorganization of management systems is not a primary objective for many local municipalities, while local urban land improvement is selective and does not significantly affect the current situation. Irrational natural resource management is a problem in all developing countries, posing a threat to basic human activities [
13]. The convergence of all life spheres is becoming comprehensive; changes in one system leads to changes in other systems; therefore, it is necessary to calculate the relationships among influencing indicators, in particular ecological components, on other systems [
3].
As we discuss in this article—for the first time, a model to assess the innovativeness of cities was developed; moreover, a strategy to develop smart cities in the Ukraine is proposed, which considers the desires of the population and the spatial and geographical location.
3. Materials and Result
3.1. The Principles of the “Smart City” Functioning
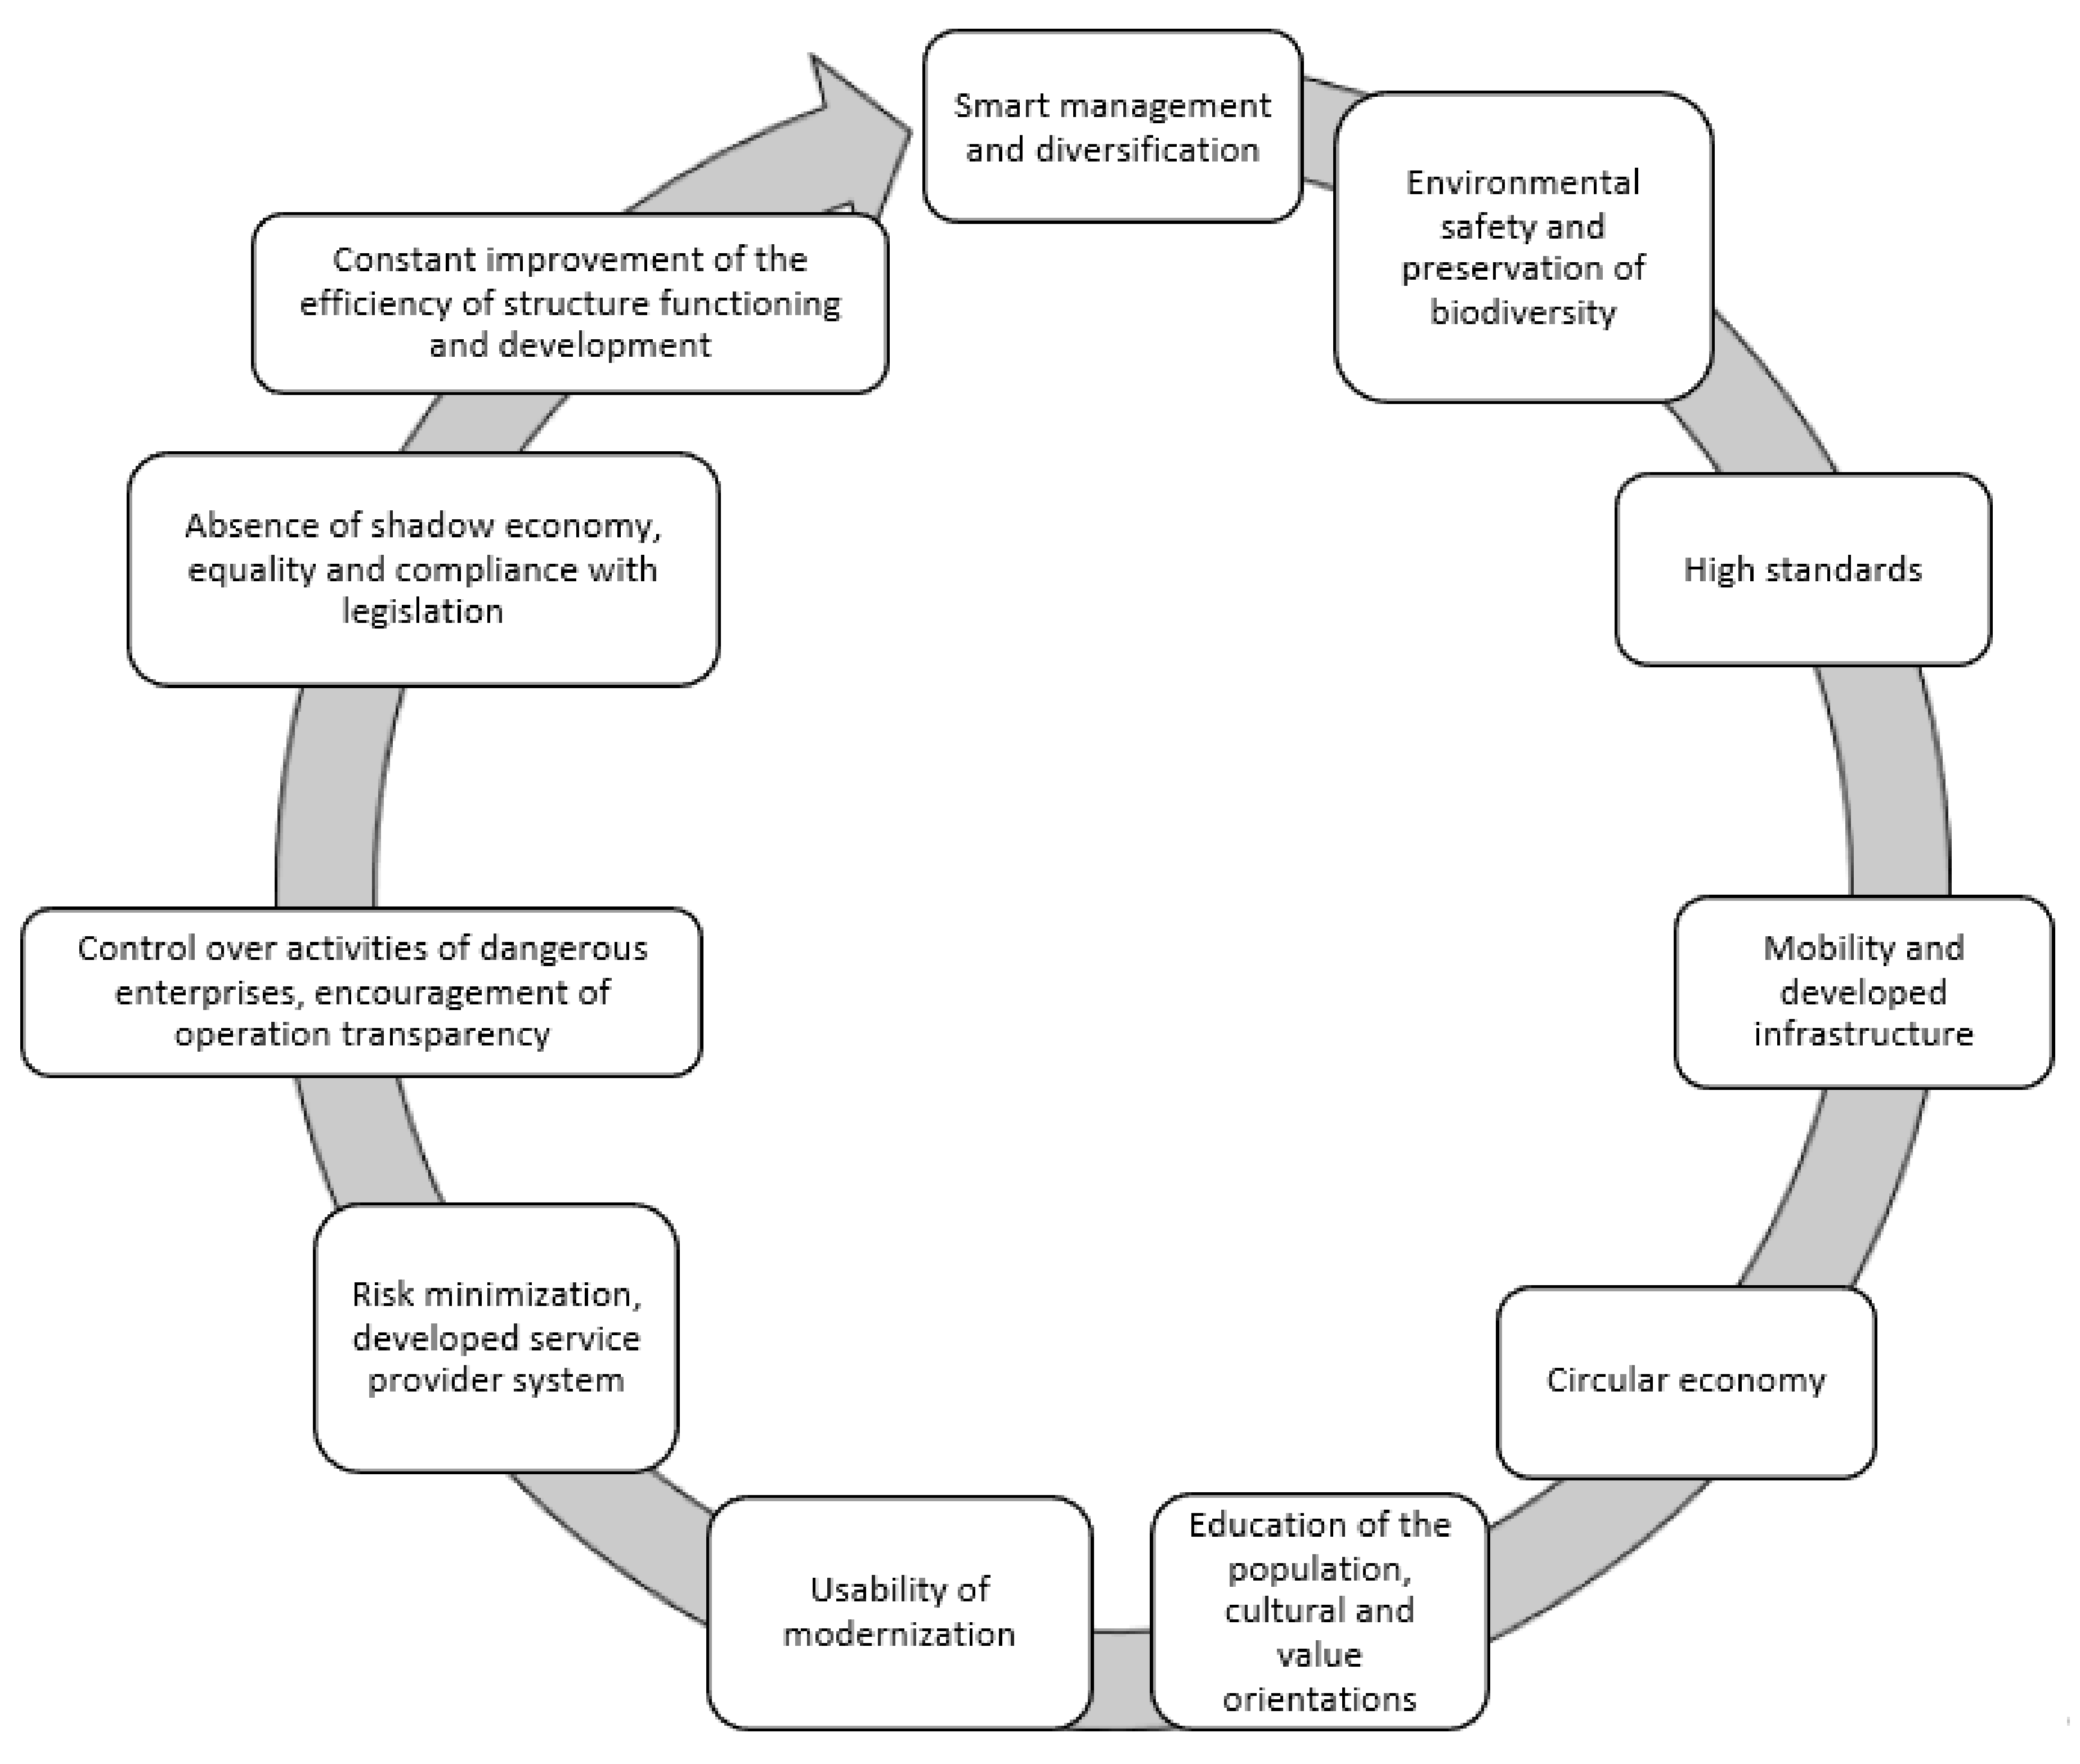
Smart cities are based on principles that combine scientific achievements with government control and encouragement from businesses in order to ensure decent lives for future generations (
Figure 1).
The creation of smart cities could be encouraged by environmentally oriented state policies, with legislation that will allow people to run sustainable ecological economies and encourage resource saving; manufacturing would be conducted according to estimates of critical civilization load on natural balances [
14].
There are many methods used to estimate the anthropogenic impact on the ecosystem, although Ukrainian entrepreneurs and public institutions rarely use them, and carry out manufacturing processes and service provisions due to environmental changes.
Assessing ecosystem conditions is a multi-objective problem with a small prediction horizon because of the risk factors (e.g., anthropogenic factors). The mathematical model makes sense when correlating with actual data. The model selection depends on goals and set criteria, with the main criteria involving the characters of the analyzed objects, the impact factors, the levels of detail, the nature of statistical techniques, and analysis methods.
The ecological environment involves stabilization and self-restoration, but within the limits of allowable standards, which allows developing models and neutralizing negative impact factors [
15].
The total anthropogenic impact on the ecosystem should be less than the maximum allowable standards of loading due to experimental indicators, which will not cause significant tipping points in the ecosystem, changes in the population of biological species, and deterioration of population health.
, where A
i is the amount of hazardous substance in the unit of investigated volume (amount, mass) or ecological capacity of certain ecosystem structures (soil, atmosphere, etc.).
where K
i is the ecological capacity of the investigated separate unit of the ecosystem (for example, humus or nitrogen content in soil, oxygen in the atmosphere); Y
i is a significance coefficient of this element (negative impact) in the investigated ecosystem structure.
This formula can be used for any human impacts on the environment. This is especially true in the agricultural sector, where soils are oversaturated with chemicals that are unnatural and uncharacteristic of the area. During constant measurements and research, the situation is constantly monitored and the necessary measures are taken to improve the situation.
The permanent impact of certain elements sometimes leads to the increase in affected areas and the interaction of factors poisoning the ecosystem, as well as results in the storage effect and deterioration in the ecosystem conditions [
16].
For example, soil pollution with fertilizer elements accumulated in deeper surface layers causes the interaction of chemical compounds, the greater probability of obtaining new, more harmful substances, resulting in the decrease in the quality and cost of land resources. The availability of subsoil waters and flows can cause potential pollution of the ecosystem for long distances, which substantially exceed the areas of the cultivated territories, accumulating the negative effects because of the increasing number of substances and their incomplete use or dissolution.
The same situation can be observed in territories of large megalopolises, where soils, which are not involved in the construction activity, can be used for factories, enterprises, and local landfills, resulting in (constantly growing) anthropogenic impact zones and ecological danger.
3.2. Interactive Innovation Map as the Basis of a “Smart” Settlement
When constructing an advanced residential area, it is necessary to design an interactive city map based on the cloud service that will have a single base of regional infrastructure management, access to government representatives, businesses, and society, as well as a monitoring (and quick response) system in case of unsatisfactory situations or accidents.
Cutting-edge residential areas should be developed step-by-step, beginning with a certain territory, due to private investments (as an example, for other Ukrainian residential areas), which will encourage the adoption of innovative technologies at the state level.
The responsibility of a particular legal or physical entity for invested funds reduces the probability of shadow schemes and irrational use of funds, and the purchase of defected goods. Thus, it is recommended that private investors get involved in constructing contemporary residential areas. Online platforms for fundraising are encouraged, along with targeted applications, with possible feedback and discussions involving other economic entities. Developing integrated information systems will encourage consolidation of a large number of inhabitants and project promotions, and lead to prompt responses to changes. Creating a smart residential area should start with reconstructing the infrastructure most appropriate to a particular residential area, considering global experiences and innovations. The minimum negative impacts on the ecosystem (minimization of residues and decarbonization) and the maximization of innovation technology integration as an optimality criterion should be considered. It is reasonable to pull down and dispose out-of-date buildings and facilities, because, in case of their reconstruction as an alternative option, citizens will obtain facilities in smaller operating times (and potential accident situations) at the same cost.
When designing a smart residential area, one should consider reaching residential area end points, which should not exceed 25 min by car, and obeying traffic regulations. It should have bicycle paths, convenient road junctions, charging stations for electric cars and vehicles, with low amounts of waste, free parking lots with online monitoring options, road paths covered with online monitoring options to inform road users, a real-time warning system, and smart traffic lights. When developing a smart residential area, one should adopt rational energy saving strategies with maximum involvement of alternative energy generation methods, planning for structures to use natural light and light-emitting diode lighting devices. Rational water utilization should be implemented, allowing for (purified) used water, and applying it, secondly, for technical purposes, as well as to design modern purification plants. Natural air purification can be implemented using greenery on roofs and facilities, and by opening recreation parks and leisure zones.
All negative effects, including waste products, should be neutralized in order to reduce the impact on the ecosystem, minimally changing it. Agricultural manufacturing should be considered, a constant source of soil and groundwater pollution. One should investigate innovative methods to minimize the anthropogenic impacts in real-time, regularly analyze data, and control the compliance with ecological legislation. In case of violations, increased penalties for physical and legal entities are recommended; funds should be spent on environmental conservation and innovative development of the residential area.
After development of territory infrastructure, economic conditions for comfort living should be considered. For example, high-tech manufacturing, service industry development with maximum use of online technology, expanding the banking sector, and engaging enterprises based on intellectual labor (as a key factor of production) should be considered. This technology will encourage the development of educational spaces and the gathering of young people desiring to fulfil their own potential in their native county. The high levels of regional education and culture will increase the responsibility of each individual. Crucial components of the smart residential area include the availability of high-quality first aid posts, medical scientific achievements, affordability of medical services for all members of society, information support, free access to data, and a reduction in physical media.
The 2020–2021 pandemic will enhance digitalization in the Ukraine; however, actions by the government and private enterprises did not lead to substantial breakthroughs in the development of Ukraine’s information society, while neighboring countries are already in better conditions, in terms of numerous indicators (formulas (4) and (5)), and integrating information technology into social life.
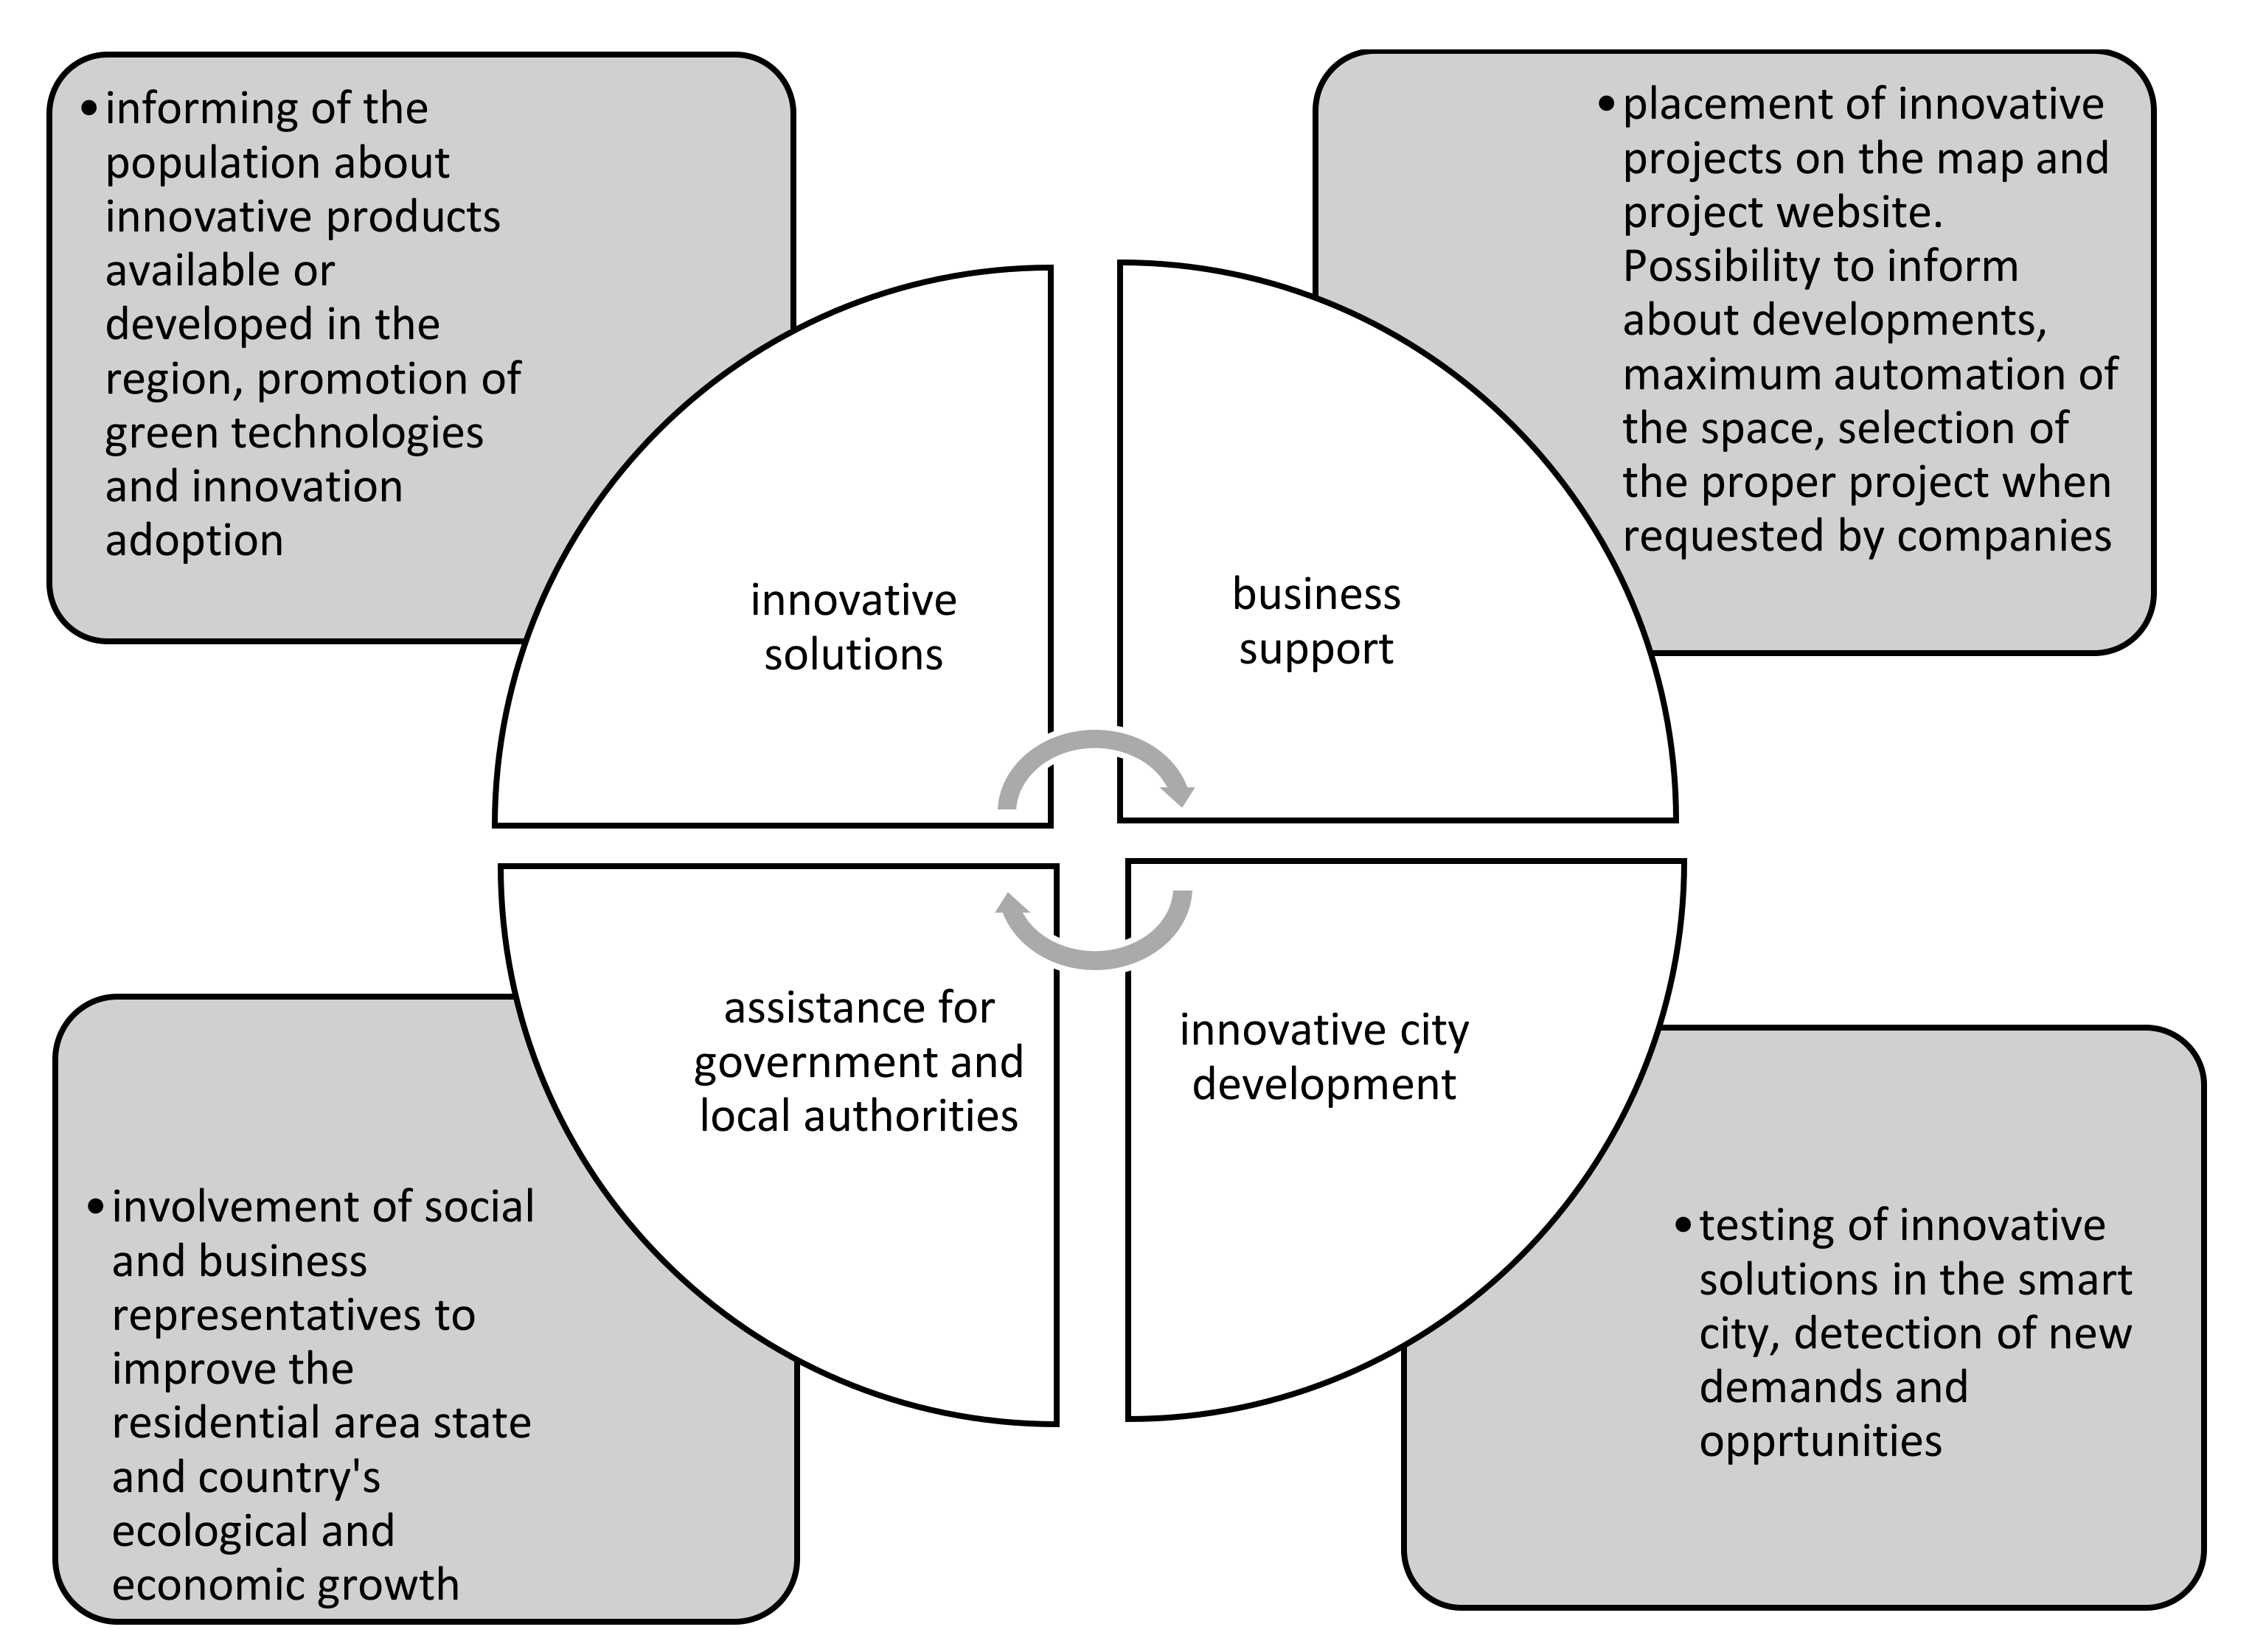
One option to improve contemporary cities is to create innovative solution maps for each city, which would be controlled by a special department of innovation in a given residential area (
Figure 2).
It is best to develop authorization for consumers in “posted services” who can publish queries, and for sellers who would post their services or products. The innovative map should consist of the following obligatory pages for all residential areas:
- -
Business (automation of business processes, analysis of buyers and feedback, non-contact payment systems, payment platforms, smart investments, smart advertising and marketing, e-commerce, e-document flow, and communication, etc.);
- -
Infrastructure (logistics (smart cargo delivery, warehousing, monitoring), mobility (smart traffic lights, online video surveillance, navigation systems, smart parking lots, traffic management, sharing services, monitoring of the road surface condition, diagnostics of vehicles, smart infrastructural solutions, municipal transport, car fleet management, etc.);
- -
Social maintenance (social documents, adapted living environment, autonomy and care, social relations, employment and self-actualization, etc.);
- -
Housing and public utilities (contemporary engineering systems, waste management system, control over the condition of buildings and facilities, etc.);
- -
Security (information security and information transparency, data transparency, anti-virus software, data protection from loss and hacking, security information and event management (SIEM), authentication and access management systems, public security, smart security and property protection, actions in case of emergencies, public security monitoring system, traffic security, forecasting of potential threats, etc.);
- -
Healthcare (patient health monitoring, rendering urgent medical aid, processing of medical images, patient rehabilitation, robotic systems, medical decision-making support systems, healthcare informative systems, treatment and diagnostic process management, management of medical institutions, digital modeling and equipment simulation to train doctors, healthy lifestyle, rehabilitation systems, digital psychologist, etc.);
- -
Education (staff management, personnel administration systems, recruitment tools, employee competence profile management, monitoring of cutting-edge education institutions, educational content distribution, content development tools, educational process management, training support, equipment, and devices, etc.);
- -
Construction and repair (3D printing of buildings, information modeling and designing of objects, control over building operations, city spatial modeling, smart construction materials, digital real estate agencies, etc.);
- -
Ecology (monitoring of the environmental condition, green planting, smart farming, ecological taxes, penalties and grants, etc.);
- -
Recreation and leisure (entertainment industry, conferences and events, multimedia, and new ways of content, booking and payment services, navigation systems and virtual tours, management of culture and tourism organization, café and restaurant services, digital museums and exhibitions, digital exhibits, etc.);
To improve residential area operations and access to advanced technological solutions, continuous support of the portal should be provided, considering comments and ensuring feedback. This map is a tool that would involve high-tech companies in this territory in order to create additional jobs, enhance the economic state of the residential area, encourage its innovative evolution, and integrate its own solutions.
The expansion of innovative smart residential areas will decrease disproportion between cities, which are sources of extra risks, anthropogenic burdens, and rural settlements, the majority of which are in critical conditions. For example, some of them disappear, and working populations migrate to other residential areas with better social and economic states for further life activities.
3.3. Analysis of the Competitiveness of Regions
Considering a city as a brand that generates a municipality’s tourist capital, we can see the increasing role of environmental friendliness as a regional competitiveness factor. One of the crucial roles in the development of modern brand cities is the availability of a skilled workforce, which encourages long-term growth and possibilities for predicting and adopting advanced technologies, to be easily integrated into management and other activities. Therefore, what really matters is the level of education in the country, opportunities for adopting artificial intelligence, and systematic operations of the government, businesses, and society. According to the Institute for Management Development (IMD) World Competitiveness Center, the IMD index was 52.67 in 2019 (four points more than in 2018), which also included investments in education. IMD leaders are Switzerland, Denmark, and Sweden, which provide their citizens with the best living conditions and free access to primary needs, in particular, high-quality educational services [
17]. Although many leading specialists stress the vulnerability and dependence of smart cities, we believe that the first thing to consider in future city maps is the concept of rational nature management and human-centrism. The share of the Ukrainian urban population is growing, along with ecosystem pollution and transformation. Creation of the emotionally positive mood makes brand cities more attractive in comparison with rural settlements following conventional housekeeping patterns. Thus, permanent internal migration of the population and movements of younger generations to cities create new organizational and economic clusters. However, crowds and localization of the large number of people in significant territories result in individual micro-ecosystems; typical features include higher risks and dependence on numerous factors, and focus on greater consumption.
The anthropogenic impact on the ecosystem can be considered in the plane regarding each type of change; we can use the Pfaffian equation to investigate the effect of human activities [
18].
Contaminant concentration in a certain plane (Q) can be calculated for a particular period of time (t):
where x is the distance from the distribution point (radius, altitude, depth), k is a diffusion coefficient, F—a decreasing rate of contaminant concentration caused by natural processes (plant uptake, availability of filters, and other minimization factors), Fx—contaminant generation.
For example, the result of creating a landfill of household waste, with an area of 1 square meter, is the deterioration of the ecosystem, at a distance of 50 m from the landfill, on five indicators of analysis (air, soil, water, harmful or pathogenic microorganisms, and changes in the natural landscape), by an 80% plot, at a distance of 5 km from the landfill. The effect was considered permanent.
This method can be applied in the Ukraine to assess negative consequences of manufacturing activities and define their relation to morbidity and mortality rates (Figure 7).
To determine the impacts of urban ecosystem changes, regarding general conditions and other interrelated factors, one can use the diffusion equation [
19].
In case of migration, people frequently choose a city for its life activities, i.e., the sum of its maximum benefits at the minimum distance to the residential area where they previously lived. Other parameters that define the vector of city usefulness and attractiveness include worthy employment, a developed infrastructure, the possibility of satisfying the needs according to Maslow, ecological aspects, and development opportunities.
By analyzing the number of inhabitants, it is reasonable to apply the Stouffer equation [
20], which defines the value of migration streams (M) between two residential areas, creating additional loads in cities by arrivals from rural districts:
where N is the number of inhabitants in the area,
—the number of positive opportunities in the residential area, k—a significance coefficient of opportunities for each individual, x—the sum of positive possibilities in targeted residential areas (alternative options).
The Equation (3) shows that the lager the number of intermediate points to the destination, the greater the probability that people will stay there, rather than move to larger distances, searching for a better place of residence.
Contemporary cities should be built by taking into account the potential number of citizens, environmental and vehicle loads, as well as other characteristics that have significantly changed in recent decades, accompanied by chaotic construction operations and reconstructions.
3.4. Migration Movement of the Population in Urban Areas by Regions of Ukraine
According to the State Committee of Statistics, the Ukraine is showing a decreasing number of inhabitants, as the death rate is exceeding the birth rate. As of 2019, Ukraine had 41,983,600 people, which is 19% less than the same figure in 1990 (the calculation of the resident population covers all oblasts of the Ukraine, except for the temporarily occupied territories of the Autonomous Republic of Crimea and Sevastopol). At the same time, the share of urban populations are growing compared to rural populations.
In 1990, the share of the urban population in the Ukraine was 67% of the general number of inhabitants; in 2020, it increased to 70%. The reduction in the rural population corresponds with the reduction in rural settlements. Ukraine had 28,376 rural settlements in 2020 and 28,804 in 1990. The number of cities ever 30 years increased by 25, indicating the migratory movement of the population and the priority of cities over rural settlements when selecting a place of residence [
21].
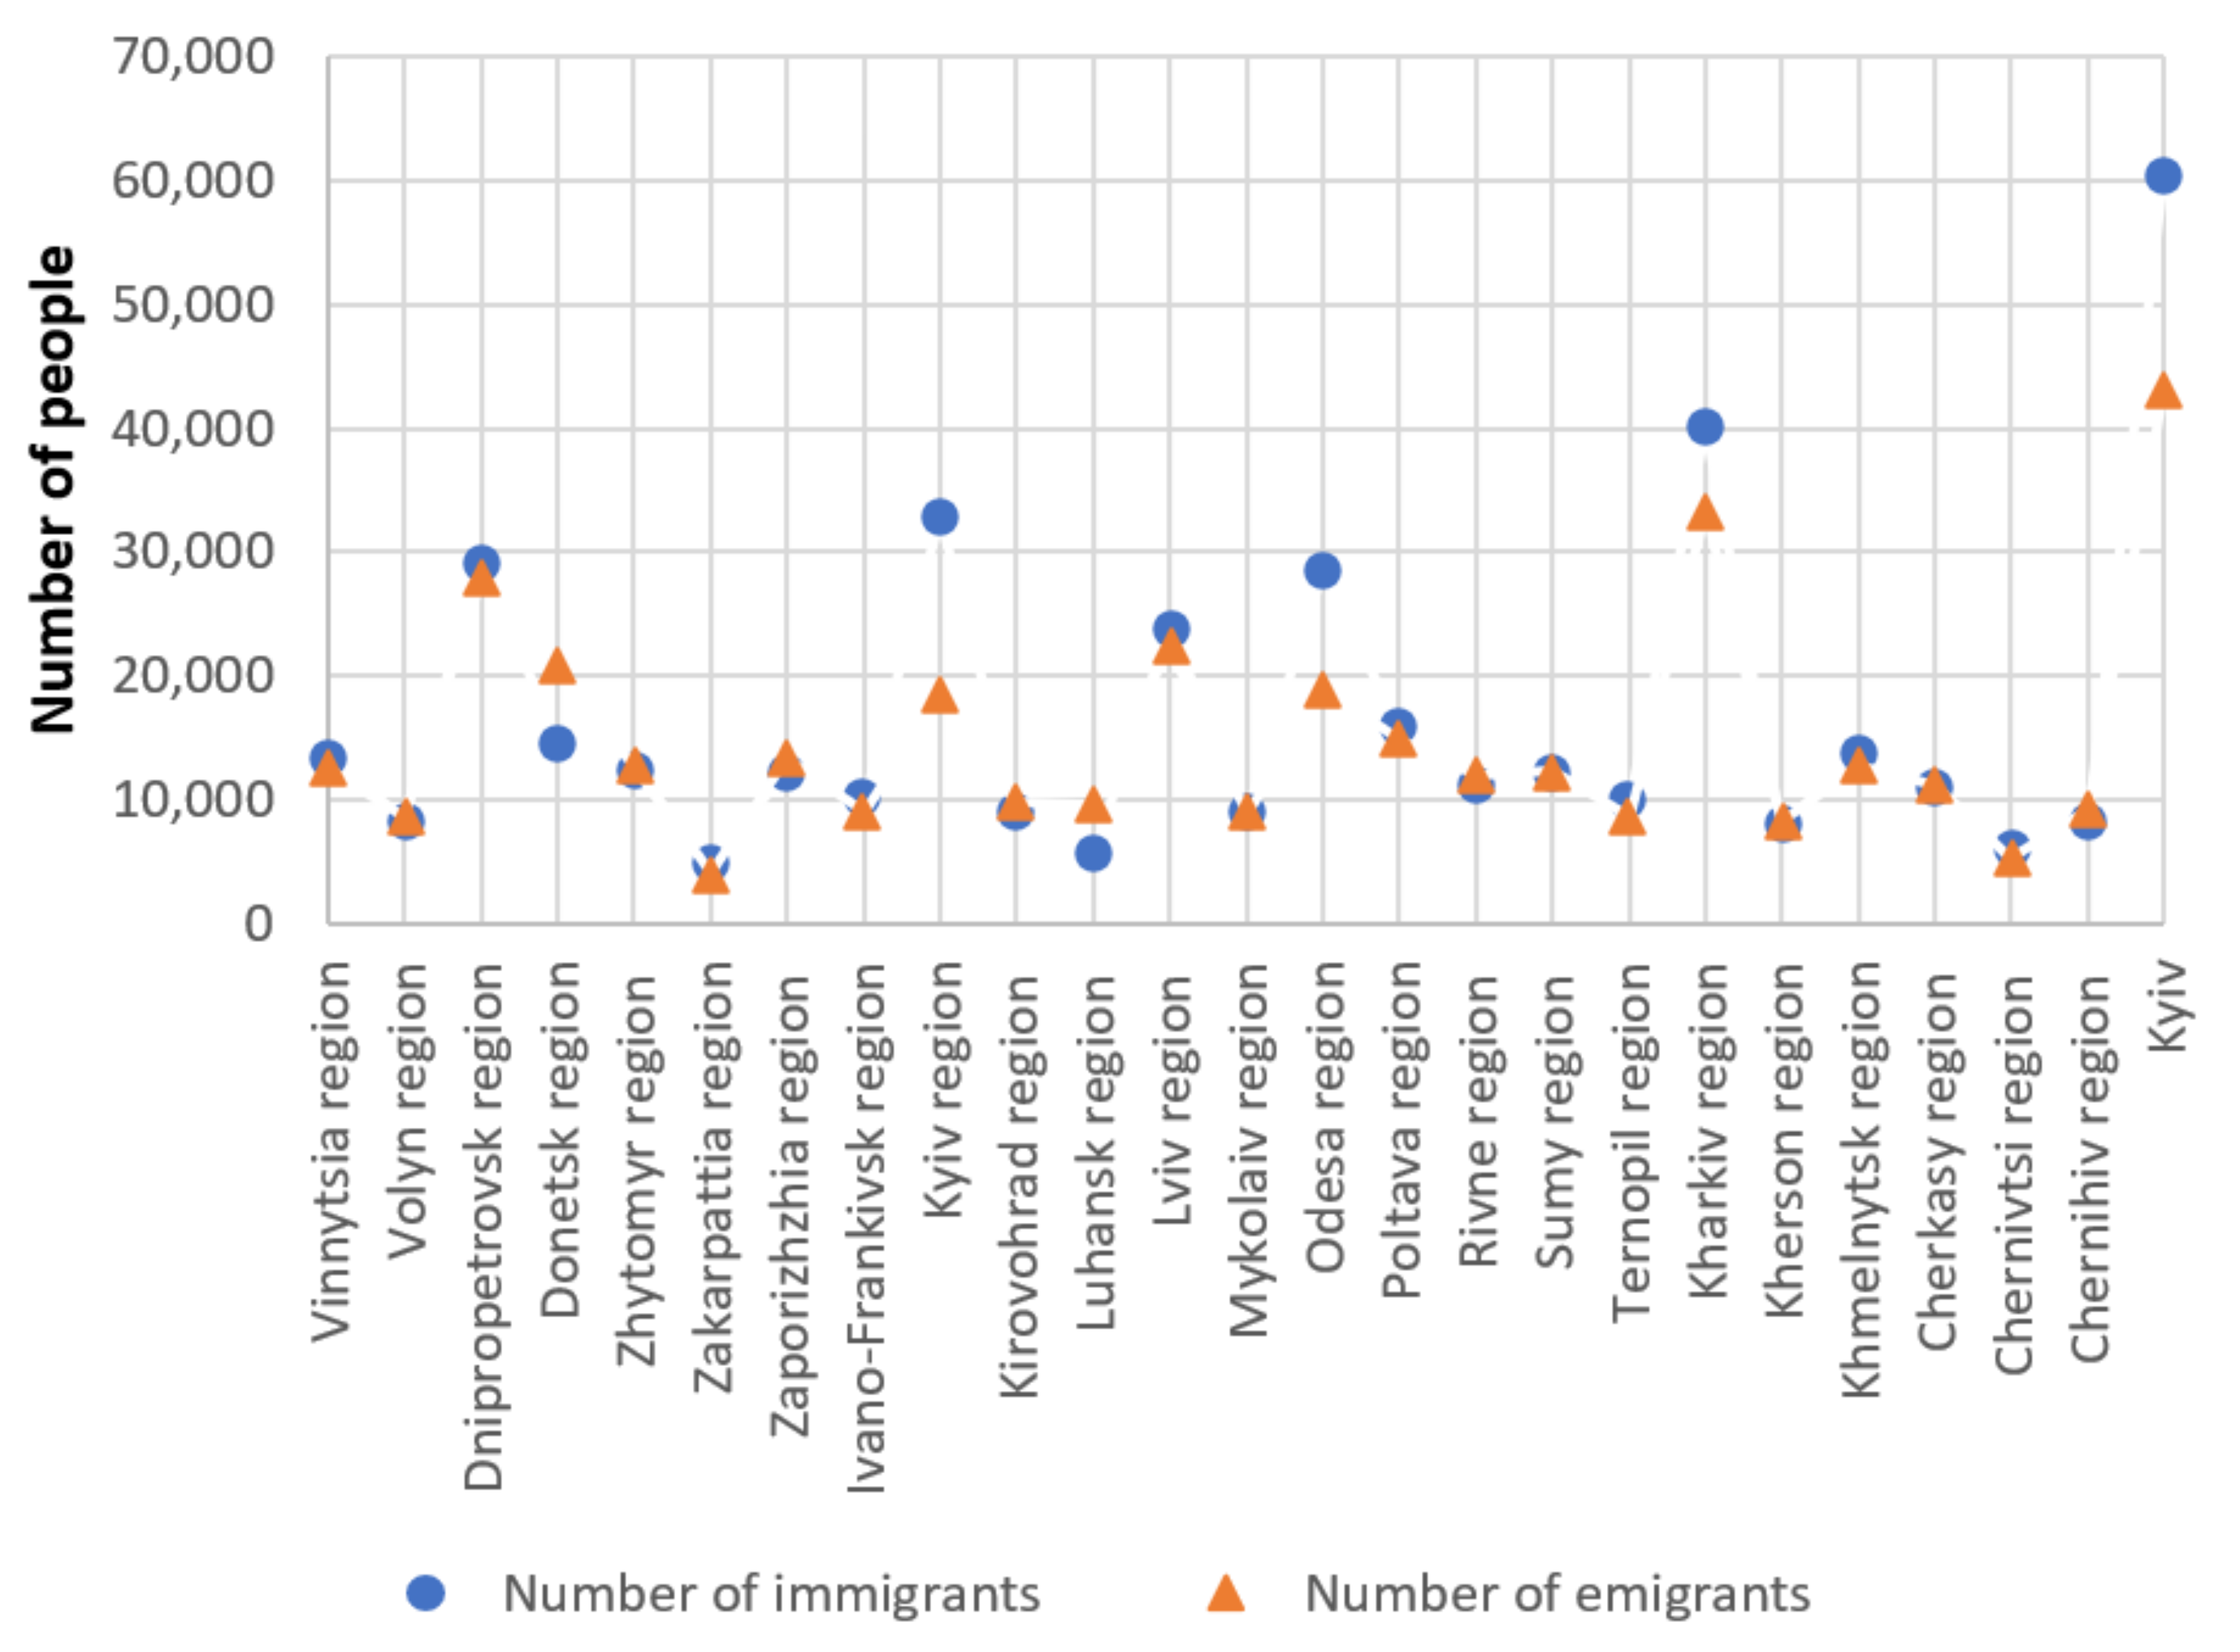
Figure 3 shows that the number of immigrants substantially exceeded the number of emigrants in 2019 in Kyiv (17,175 people), Kyiv region (14,235 people), Odesa region (9561 people), Kharkiv region (6837 people).
These regions are industrially and economically developed, with higher life quality indices in comparison with other Ukrainian regions. Meanwhile, the number of emigrants exceeded the number of immigrants in such regions, such as Donetsk region (−6275 people), Luhansk region (−3912 people), and Zaporizhzhia region (−996 people). Key migration flows are directed to Kyiv, and other more economically developed and favorable regions, which proves the hypothesis about internal migration of the population to big residential areas, with better quality of living conditions, in comparison to ecologically dangerous regions, economically unfavorable territories, or places of military activities.
Examining population preferences and anthropoecosystem structures, one critical factor involves the presence of environmental consciousness, education and culture, s.
This formulates the concept of residential satisfaction, which affects one’s desire to live in a territory [
22].
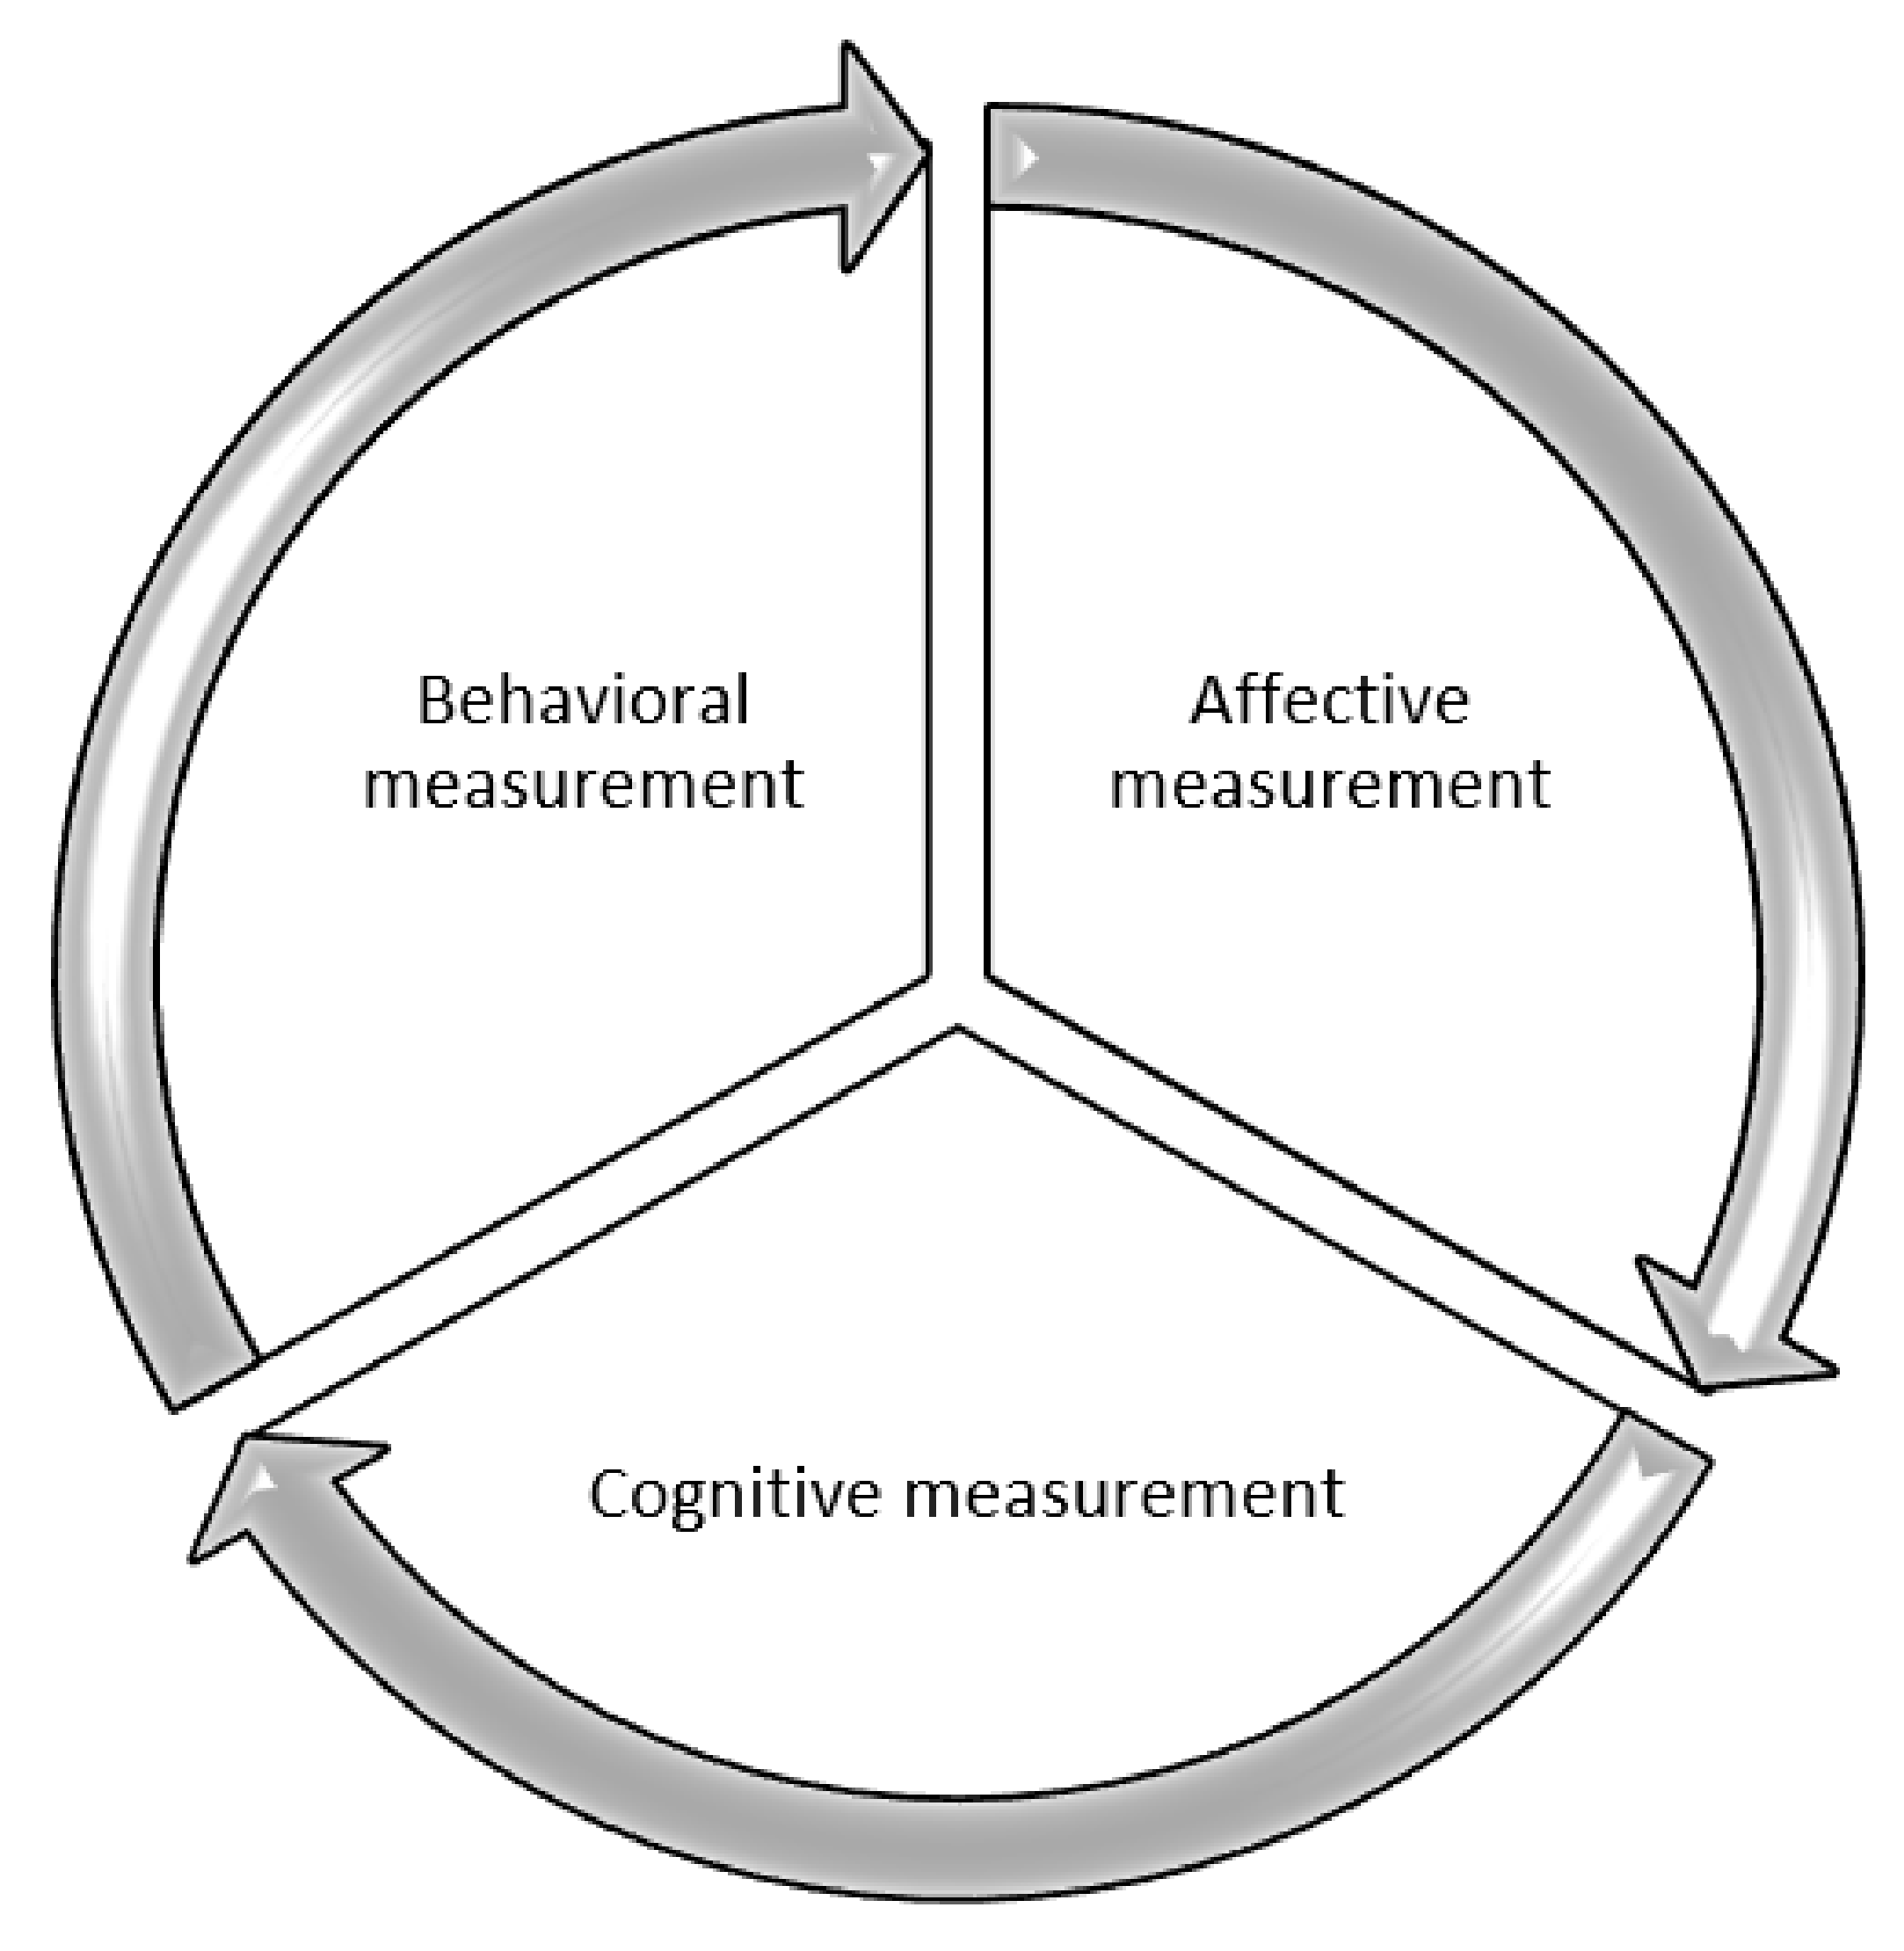
Figure 4 depicts measures that affect a person’s desire to live in a certain area or migrate.
- (1)
Affective measurement: factors that can influence residential satisfaction considered as a dependent variable. They include such objective factors as particularities of residential conditions and region, density, health, the amount of greenery, subjective attributes (congestion, security, social relations), and personal qualities (age, gender, profit).
- (2)
Cognitive measurement: modeling of the cognitive viewpoint on residential satisfaction and the quality of living environment, or definition of internal factors, allowing residents to assess the quality living environment.
- (3)
Behavioral measurement: behavioral consequences of residential satisfaction. Residential satisfaction is considered an independent variable or a predictor of potential behavioral consequences, such as residential mobility, care of home or neighborhood/residential region, good relations with neighbors, participation in neighboring events, adaptation to a certain territory.
Based on satisfaction of the three human life measurements, one can predict human tendency to migrate to another permanent place of residence. According to the State Committee of Statistics of Ukraine, it can be concluded that cities with populations of more than 1 million people are becoming more attractive to Ukrainians, showing the domination of economic factors when choosing a place of residence, as well as the poor state of Ukrainian villages compared with cities. Improving the planning strategy results to enhance the living standards of Ukrainian citizens, aimed at increasing the performance of government operations, requires assessing social perceptions of the environment and detecting regions and urban challenges that dissatisfy inhabitants.
A questionnaire survey was distributed among 10,000 Ukrainian residents to analyze the main preferences involved in one’s decision to change their primary place of residence.
Since we know the preferences of Ukrainians, we can use an equation to determine the rating of cities and analyze the shortcomings of cities that contribute to population emigration. We can also analyze the causes of unsatisfactory living conditions and the level of implementation of energy efficient technologies.
While reconstructing and comparing residential areas when selecting a place to live, Ukraine takes into account key criteria defining the indicators of permanent residency attractiveness for an average Ukrainian:
—an indicator of the average salary in the region in comparison with the average salary in the Ukraine;
—an indicator of infrastructure development (infrastructural index of the region);
—a safety coefficient equal to the number of crimes within a certain period per 100,000 people or for the amount of inhabitants in the region or residential area;
—the level of ecological safety equal to the indicator of the environmental risk for a certain time where is a probability of the negative impact or situation, is an impact in money terms, equal to the sum of expenses for compensation of all losses related to the liquidation of negative situation consequences;
—the number of contracts in providing urban services, which involve open data using generally available apps or programs, maps;
—a survival index of new business entities per 100,000 inhabitants;
—a share of buildings in the city with smart meters of resource counting constructed no earlier than 20 years from the period of calculation;
—a share of available online urban services (including the level of online access to social, medical, education, and other institutions);
—the level of information technology adoption on the city streets.
—the share of the city area covered by video surveillance cameras;
—the share of municipal trash bins with sensors and waste sorting due to fractions;
—the share of urban streets and highways equipped with the road user informing online system and the real-time warning system;
—a city area shown by interactive street maps in the real-time mode as a share of the general area of the city;
—the share of parking lots equipped with the real-time system of available places;
—the share of intelligent/smart traffic lights.
The calculation produces an integrated index, allowing us to compare residential areas in terms of innovations and development, which affect population preferences, while choosing a permanent place of residence. Given the analysis of the small residential areas, the share of which decreases along with the share of their population in the Ukraine, it is reasonable to upgrade currently existing rural settlements that would correspond to the requirements of contemporary Ukrainian citizens. Creating small residential areas with higher indices, mentioned in formulas (4) and (5), than in megalopolises, we could see migration from cities to small settlements, which would advance the state of Ukrainian villages, and economic performance at the regional level, which would generate profits of local budgets to be used for further growth. It would decrease urban loading and population dependence on external factors, such as water supply, electricity, the internet, water discharge, etc., in a separate small area. The harmonious development of all Ukrainian regions will result in the evolution of agriculture and higher responsibility of each citizen for their actions, including the ones related to environmental conservation. The development of regions will encourage more investments in education, particularly in better public awareness of ecosystem protection and modernization of current nature management systems. Satisfaction of public demands in the three measurements of desire should be accompanied by informing inhabitants about such actions, to correct migration flows and their directions.
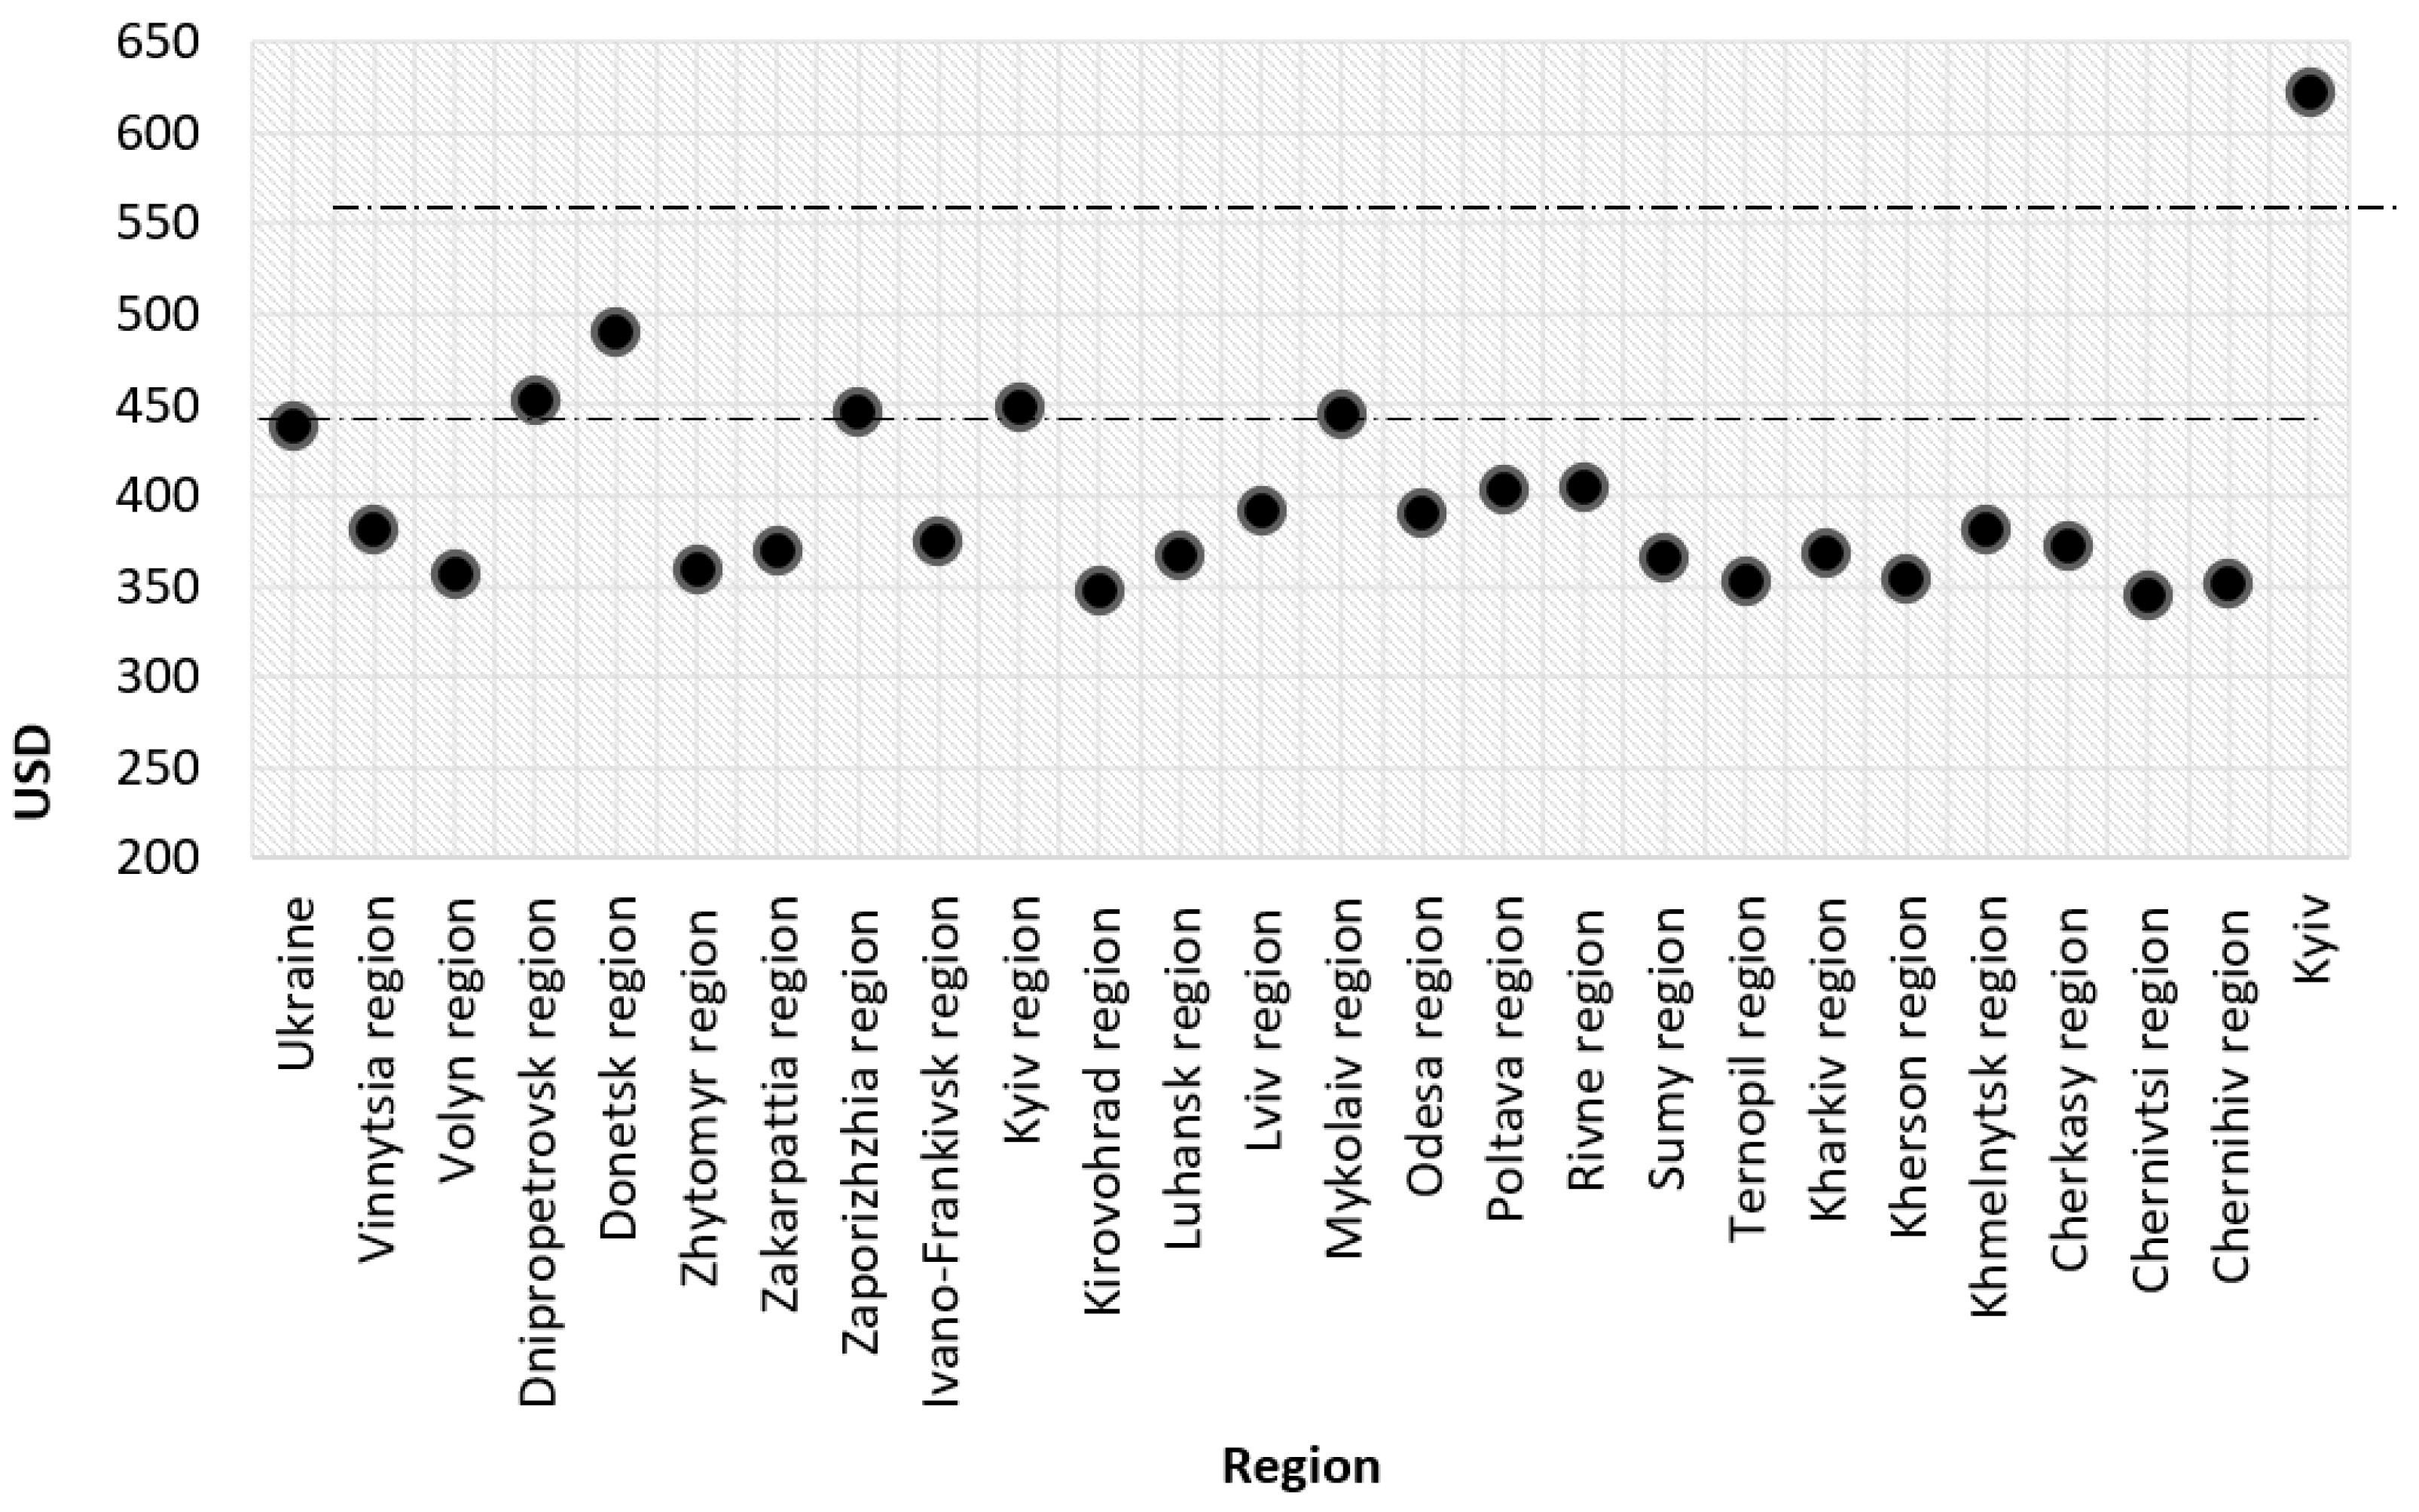
By analyzing the average salary in the Ukraine (
Figure 5), it can be concluded that Kyiv has the highest, as the majority of internal migrations are currently focused there.
The Donetsk region, where salaries are also high in comparison with other Ukrainian regions, has a higher level of danger because of military activities, which is a crucial factor when choosing a place of residence. Therefore, the priority areas of migration include Dnipropetrovsk, Zaporizhzhia, Kyiv, and Mykolaiv regions. The lowest salaries of regular employees are in the Chernivtsi region, where we can observe labor migration to Poland and other European countries, the distance that is shorter than to Kyiv.
3.5. Analysis of Internal Migration of the Population of Ukraine
The decrease in profits results in the increase in the passenger turnover among inhabitants moving to other places of residence. However, it takes place until a particular level when passengers fail to buy a transport ticket, which is common in countries with low living standards. The increase in revenue changes the goal of traveling. Citizens replace mid- and long-term labor migration with short-term trips in order to take rest and make short-term business visits. In general, the increase in population income increases the number of short-term (up to two weeks) trips, which causes a larger passenger turnover.
According to the State Committee of Statistics [
21], the passenger turnover in the Ukraine grew until 2018, and reduced from 2008 until 2014. However, the number of passengers was sustainable at the level of 12 billion passengers per kilometer caused by economic and political stability, a decreasing number of inhabitants changed their permanent places of residence, but the amount of short-term migration grew. From 2014, except for the reduction in the Ukraine, we can see a reduction in the number of passengers caused by the lower GDP per individual and deterioration of life quality.
Since 2014, we have seen a decreasing number of moving passengers, which forms the descending trend (blue color). Nevertheless, from 2014, we see greater long-term migration due to movement from territories of military operations, and the decreasing number of short-term movements. Meanwhile, the weight density of railway transports decreased while the share of road vehicles increased in the Ukraine, which is common for the majority of countries due to higher affordability of personal cars and the development of the ground transport chain.
The main method of transportation in the Ukraine is by road (passenger turnover in 2021 from January to May amounted to 7108.3 million passenger-km) and railway transport (passenger turnover in 2021 from January to May amounted to 5067.3 million passenger-km). Compared to 2019, in 2020, all types of displacement decreased by 45.8% due to quarantine and declining welfare.
The years 2020 and 2021 are considered “crisis” years in the transportation sector because of the COVID-19 pandemic, which had a negative impact on almost all activity areas. In countries such as the Ukraine, which do not have a sufficient reserve fund for rapid complete restoration of the economy, the economic growth rate slowed, requiring the assistance of other, more developed countries, which makes the Ukraine more dependent on external impact and investors.
Developed countries encourage passenger turnover by issuing discount cards, special offers, better transport conditions, and business demonopolization. This technique can be also applied in the Ukraine, but all governance parties should be interested in industry development to conduct shadow economic activities, which is an acute problem in the Ukraine.
One trend that is reasonable to develop in the Ukraine is rural tourism and construction of cutting-edge smart residential areas. It can lead to minimal anthropogenic burden on natural resources, larger passenger turnover, money flow into local budgets, a population of national values and healthy lifestyles, preservation of national heritage, and lower loads on Ukrainian cities in poor conditions, in terms of indicators (Formulas (4) and (5)), in comparison with European countries.
3.6. Modern Approaches to Energy Saving and Rational Use of Nature
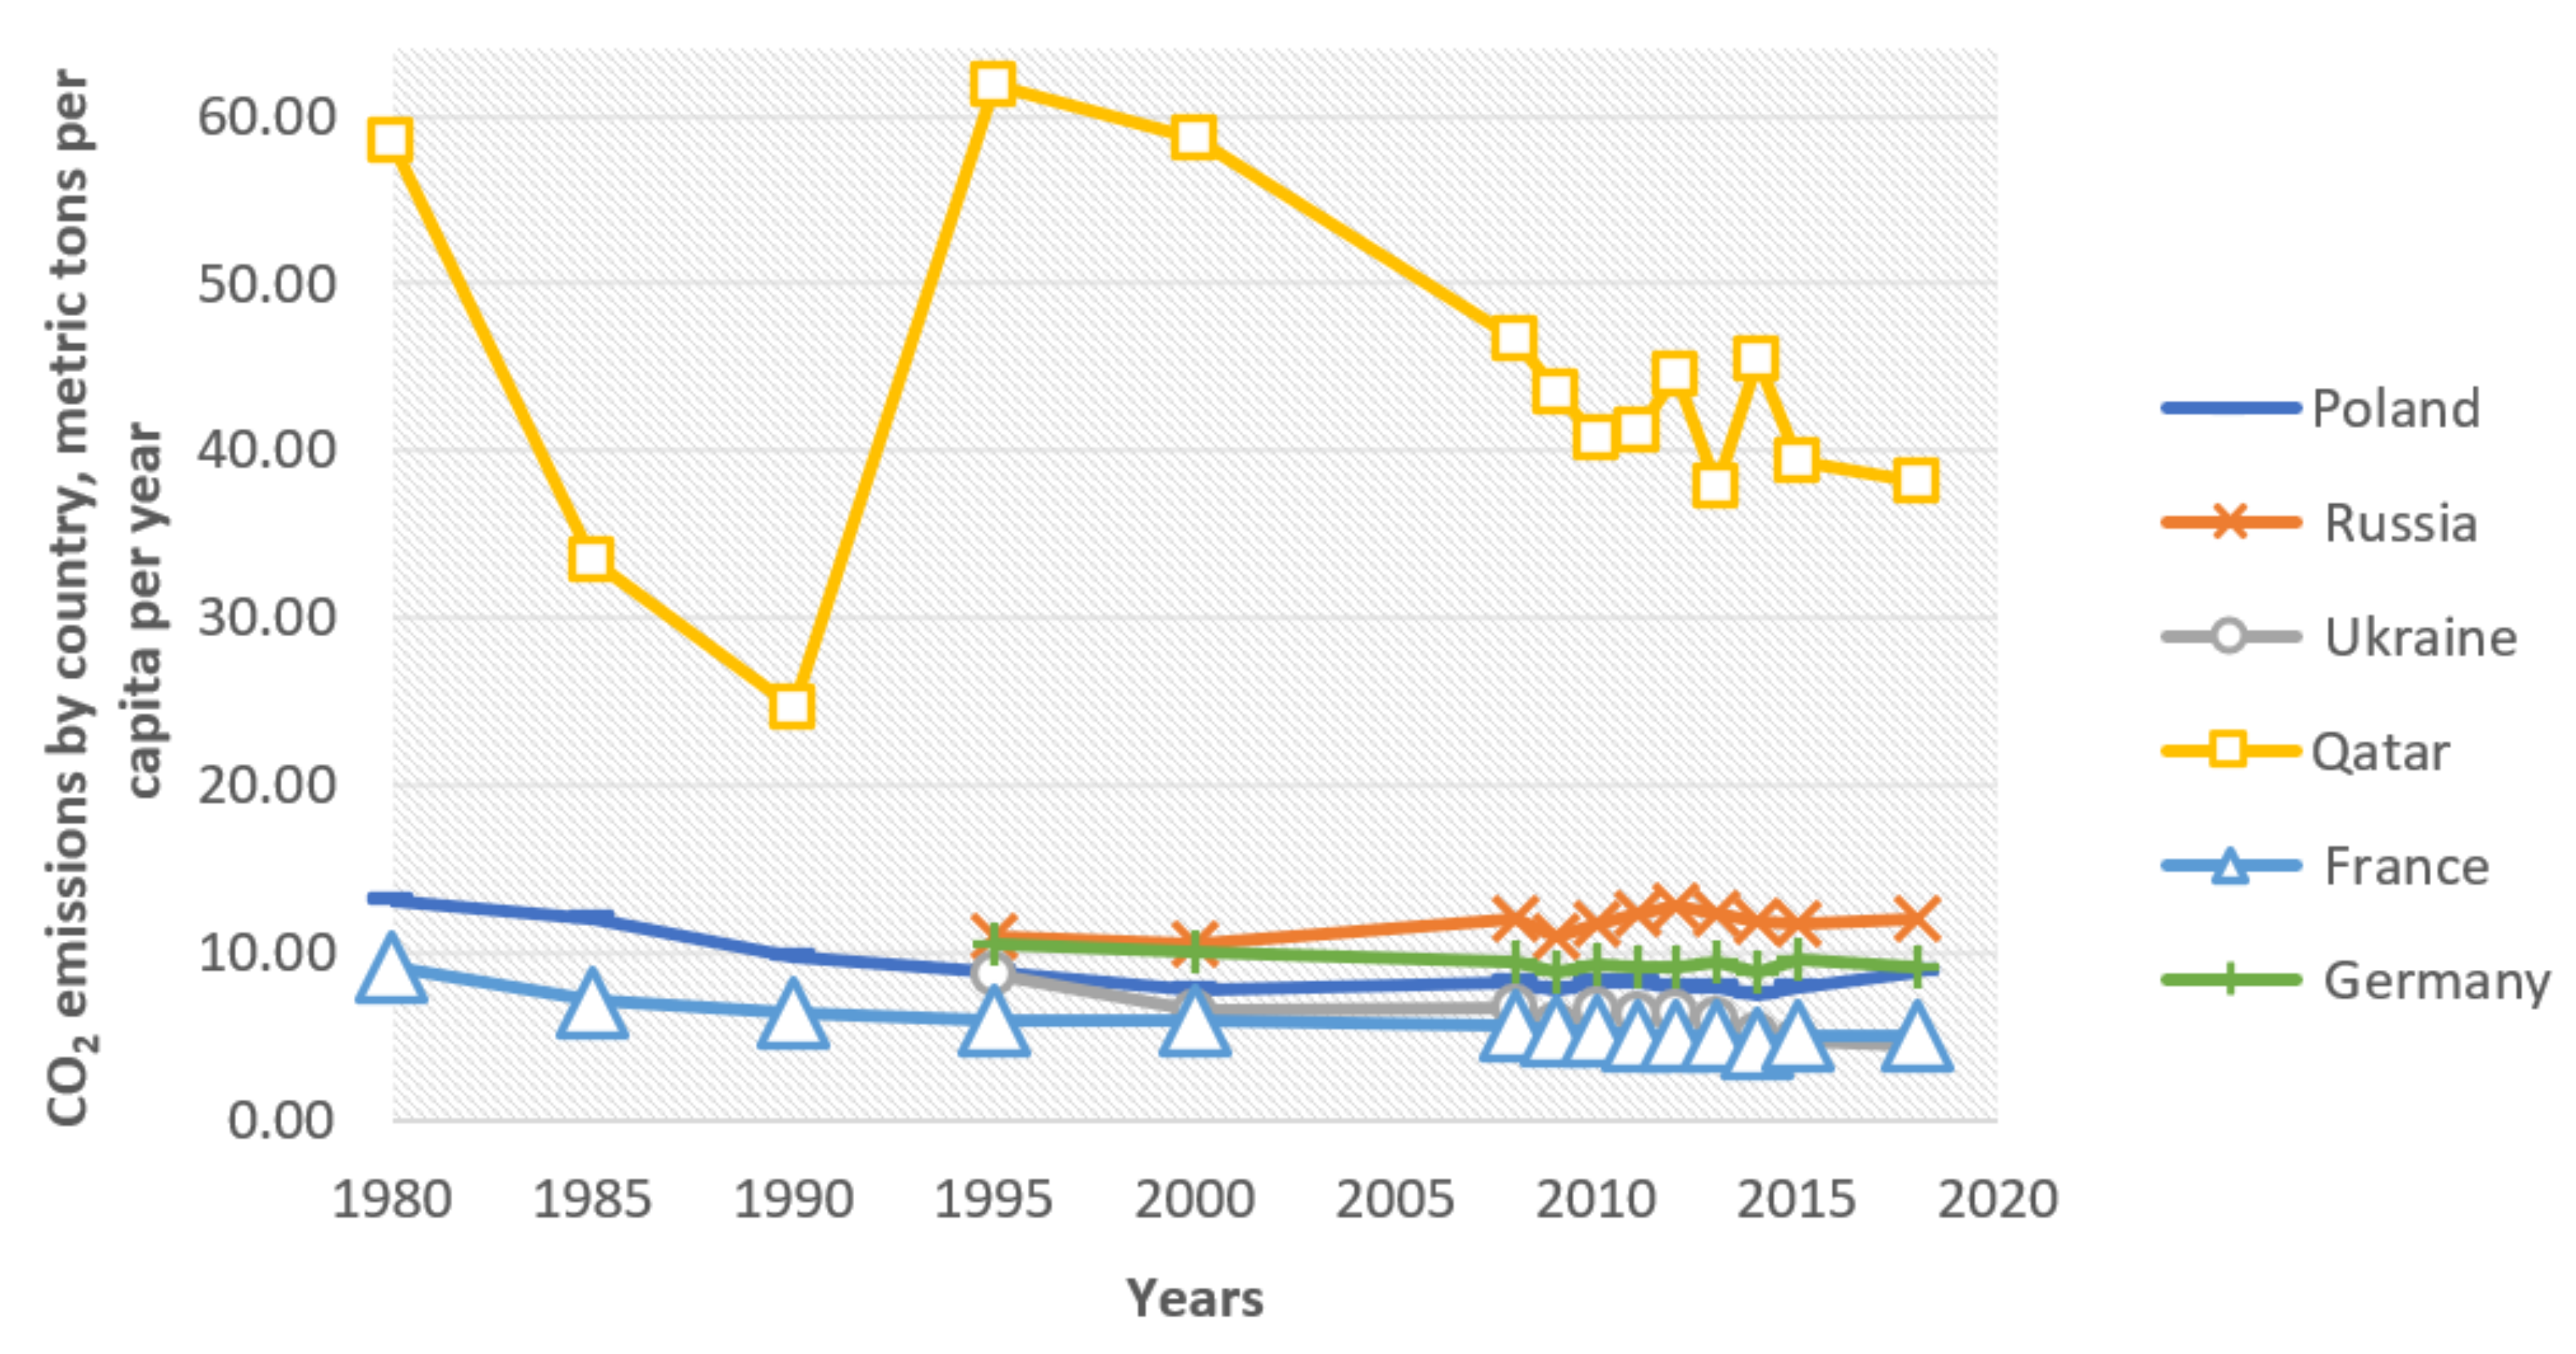
Ecosystem pollution takes place at all levels, regarding anthropogenic impacts in large areas, causing the development of manufacturing due to greater consumption, which is common in big cities. Currently, we can see a decreasing number of emissions in atmospheric air because of the global pandemic and less consumption. However, until 2019, production and consumption grew, while the ecological legislation only partially restrained world trends that increased emissions, particularly in developing countries (
Figure 6). One of the greatest pollutants is energy production using mineral resources and natural gas.
Moderate pollutant emissions in the Ukraine are in a similar range to countries with a higher anthropogenic burden, while the death rate caused by ecosystem pollution remains the highest among investigated countries, which means “the worst” state of the medical system, lower indicators of living standards, and inaccuracy of data on environmental pollution provided by the Ukraine.
The existence of double documentation, data falsification (out-of-date purification plants), and provision of unreliable data, are typical in the Ukraine, so the environmental impact of human activities is much higher than specified on official websites, which is confirmed by high mortality and morbidity of neoplasms, heart, and respiratory diseases. The time interval shows the reduction in CO2 emissions in France, Germany, and Qatar, which is caused by technological changes and innovation adoption. The reason for the decrease in CO2 emissions in the Ukraine since 2014 is the neglect of industrially developed territories (Donetsk and Luhansk regions), which are leaders in energy source production and consumption in the Ukraine.
The framework for the smart residential area is the rational use of natural resources and a shift to renewable energy sources. Without a technological increase, greenhouse gas emissions were 33 Gt worldwide in 2017, and will increase every year by 13%, according to EWS, while the change in technologies—towards the rational use of natural resources—could improve the primary intensity of emissions up to 31 Gt per year, according to EWS. At the same time, one expects increasing consumption, causing greater loads on the ecosystem because of increased production, a constant search for new solutions to expand the range of companies, and heavier use of energy and natural resources. By examining country trends, regarding the use of renewable energy sources, we conclude that the shift from primary fuel resources is slow, especially in developing countries where the reconstruction of the energy source market and infrastructure have “local and temporary character”, due to the lack of financial resources, while the use of grant funds has a point-like nature.
Coal, peat, oil, natural gas, and nuclear energy remain the world’s main sources of energy, while renewable types of energy with lower environmental risks, were about 27% in 2019 [
23].
According to the latest analysis, hydroelectric power plant activities and reservoir construction have a number of negative impacts on the ecosystem, which remove them from the list of safe and renewable forms of energy generation offered for implementation in smart residential areas [
24]. With the global increase in energy consumption, the development of energy production from non-renewable energy sources is also taking place. This is evidenced by the reduction in CHP emissions and modernization of purification plants, although the high costs and short operating life lead to the neglect of environmental problems and production, due to the deterioration of the quality of human living environments. As for the obligations of each state, regarding the reduction in greenhouse gases and rational farm management, EU countries have strict environmental legislations, which is primarily adhered to. However, non-compliance is recorded, resulting in penalties and increased taxes, while poor countries, in terms of GDP level, have shadow schemes, use out-of-date equipment, and face many environmental offenses [
25].
Presently, global renewable energy sources are increasing [
25]; these resources are more environmentally friendly than traditional energy generation systems. In Europe, there is the launch of new wind and solar power plants and increased scientific activity regarding the development of alternative sources and resource-saving technologies.
From 1990 to 2019, the share of renewable energy sources increased in Europe (from 18% to 39%), CIS countries (from 14% to 18%), North America (from 18% to 24%), Asia (from 18% to 24%), the Pacific Ocean (from 23% to 27%), and Africa (from 18% to 20%). As of 2019, the use of alternative energy sources globally was 27%, which was the result of programs by state governments and non-governmental structures aimed at preserving the ecosystem. The maximum percentage of renewable energy sources is in Norway (97.6%), Brazil (82.3%), and New Zealand (81.9%), which is mainly due to the availability and high-efficiency of alternative types of energy generation [
23]. However, major countries producing these mineral resources are not interested in losing that market, which results in constant wars for sale markets, adjustment of price formation models, manipulation of geopolitical situations, and the application of other tools for creating better business conditions in the energy sector. Oil production is controlled by such countries as the USA, Russia, Saudi Arabia, Canada, Iraq, and China—leaders in crude oil production; extraction decreased globally by 0.7% due to the general decline in production in the Middle East, whose share in the world’s energy consumption was 31% in 2019. There was an increase in crude oil production in the USA, Nigeria, and Russia in 2019. When producing petroleum products out of crude oil, the leaders include countries that consume more refined oil: the USA (760 Mt), China (617 Mt), India (224 Mt), and Japan (151 Mt). The leader in the consumption of petroleum products among European countries is Germany (96 Mt), where the demand for petroleum products for manufacturing and transport industries is growing. The years 2020 and 2021 are characterized by a global decline in demand and industrial production, the effect of which will be observed for at least 2 years because of the reduction in economic growth. European countries continue to reduce the percentage of energy generation out of coal, which is environmentally dangerous because of air pollution, residues, and other negative effects. Due to the increase in the price of carbon dioxide emission quotas, many countries have begun to rapidly develop alternative types of energy production primarily supported by society, with less environmental burden, and is desirable for implementation, i.e., such as in Germany [
25].
The production of energy sources is closely interrelated to energy consumption.
Figure 7 shows the significant increase in the time interval of electricity consumption in Asian countries, particularly in 2019 in China, India, and Russia. Energy consumption in European countries has increased slightly due to the introduction of energy-saving technologies. Despite the increase in energy consumption, the number of alternative types of production is growing. In 2019, consumption of oil as an energy source accounted for 31%, coal for 26%, natural gas for 23%, and biomass energy for 10%, indicating the significant potential for the introduction of alternative types of energy. Larger cities have greater energy consumption than smaller residential areas because of advanced infrastructure requiring maintenance and higher utility bills. The share of wind and solar energy in electricity generation is the largest in such countries as Portugal (5.5%), Germany (4.2%), Mexico (4.2%), Chile (3.3%), Argentina (3.1%), and Sweden (2.8%), due to favorable climate conditions and government support. Biofuel production based on oilseed rape is widely developed, causing soil impoverishment and deterioration of its condition while neglecting crop rotation. Rape cultivation requires constant investments in the restoration of soil quality and research of its chemical conditions, considered by the authors as a negative effect in energy production. Leaders in rape cultivation among European countries are France, Germany, and Poland, due to the constant demand for energy sources, and Sweden (2.8%), due to favorable climatic conditions and government support. Production of biofuels based on rapeseed is widely developed, which is the cause of soil impoverishment and deterioration of their conditions if crop rotation conditions are not taken into account. Rapeseed cultivation requires a constant investment in restoring the quality of the soil and studying its chemical state, which is considered by the authors as a negative effect on energy production.
One important role in building nuclear power plants involves the absence of risk for energy production, because of the negative impact, in case of accidents that have already occurred in the world and cause ecosystem changes for decades, which makes nuclear power development slower and more deliberate.
One of the promising areas of energy generation is the production of biohydrogen, it has become especially relevant in the period of global warming caused by the accumulation of carbon dioxide, which releases large amounts of energy (285.8 kJ/mol) and water vapor. At the same time, there is no pollution in the atmosphere, which is a promising area for the introduction of alternative methods of energy production. Another positive factor contributing to the introduction of biohydrogen production is the possibility of obtaining it out of waste products, including agriculture, food, and oil wastes.
The issue of safety and transportation of biohydrogen remains open because of its explosiveness.
The use of thermochemical methods involving hydrogen generation is unjustified and undesirable for the Ukraine due to the use of finite natural resources, high pollution of atmospheric air, and technological difficulties. The best option to build smart residential areas, while achieving maximum conversion of used substrates into hydrogen, is to apply anaerobic fermentation of organic substances by anaerobic bacteria in combination with photosynthetic bacteria, which is environmentally safe and useful for organic waste disposal [
26,
27]. This technique can also be used in wastewater purification, which is economically and environmentally sound and fast enough, in combination with other purification methods. Another efficient way is to combine light and wind energy to produce hydrogen by electrolysis, which can be used for heating and other domestic purposes supporting the functioning of smart residential areas.
Figure 7 shows that countries with high living standards have more opportunities to preserve the environment, but the reconstruction of existing systems of rational use of natural resources requires constant investments, while the results can be reflected in future periods (e.g., in Poland). Petroleum producing countries have high GDP levels, increasing investments in eco-friendly technologies and improving the quality of life, which results in low mortality caused by ecosystem degradation. The extraction of petroleum products is hazardous to the environment due to water basin pollution and higher risks of an unfavorable situation, accompanied by the negative environmental impact, although the economic factor in such countries is decisive. Access to prompt treatment and favorable living conditions in such countries as Qatar affect the mortality rate. Ukraine is a high-risk country due to environmental deterioration with a relatively low GDP level, which slows down the introduction of innovative technologies. Therefore, it is suggested to build small residential areas based on energy-saving technologies, with rational use of natural resources.
Figure 7.
Premature mortality caused by environmental pollution on 1 mln citizens as of 2019 and the GDP level per capita Adapted with permission from [
28].
Figure 7.
Premature mortality caused by environmental pollution on 1 mln citizens as of 2019 and the GDP level per capita Adapted with permission from [
28].
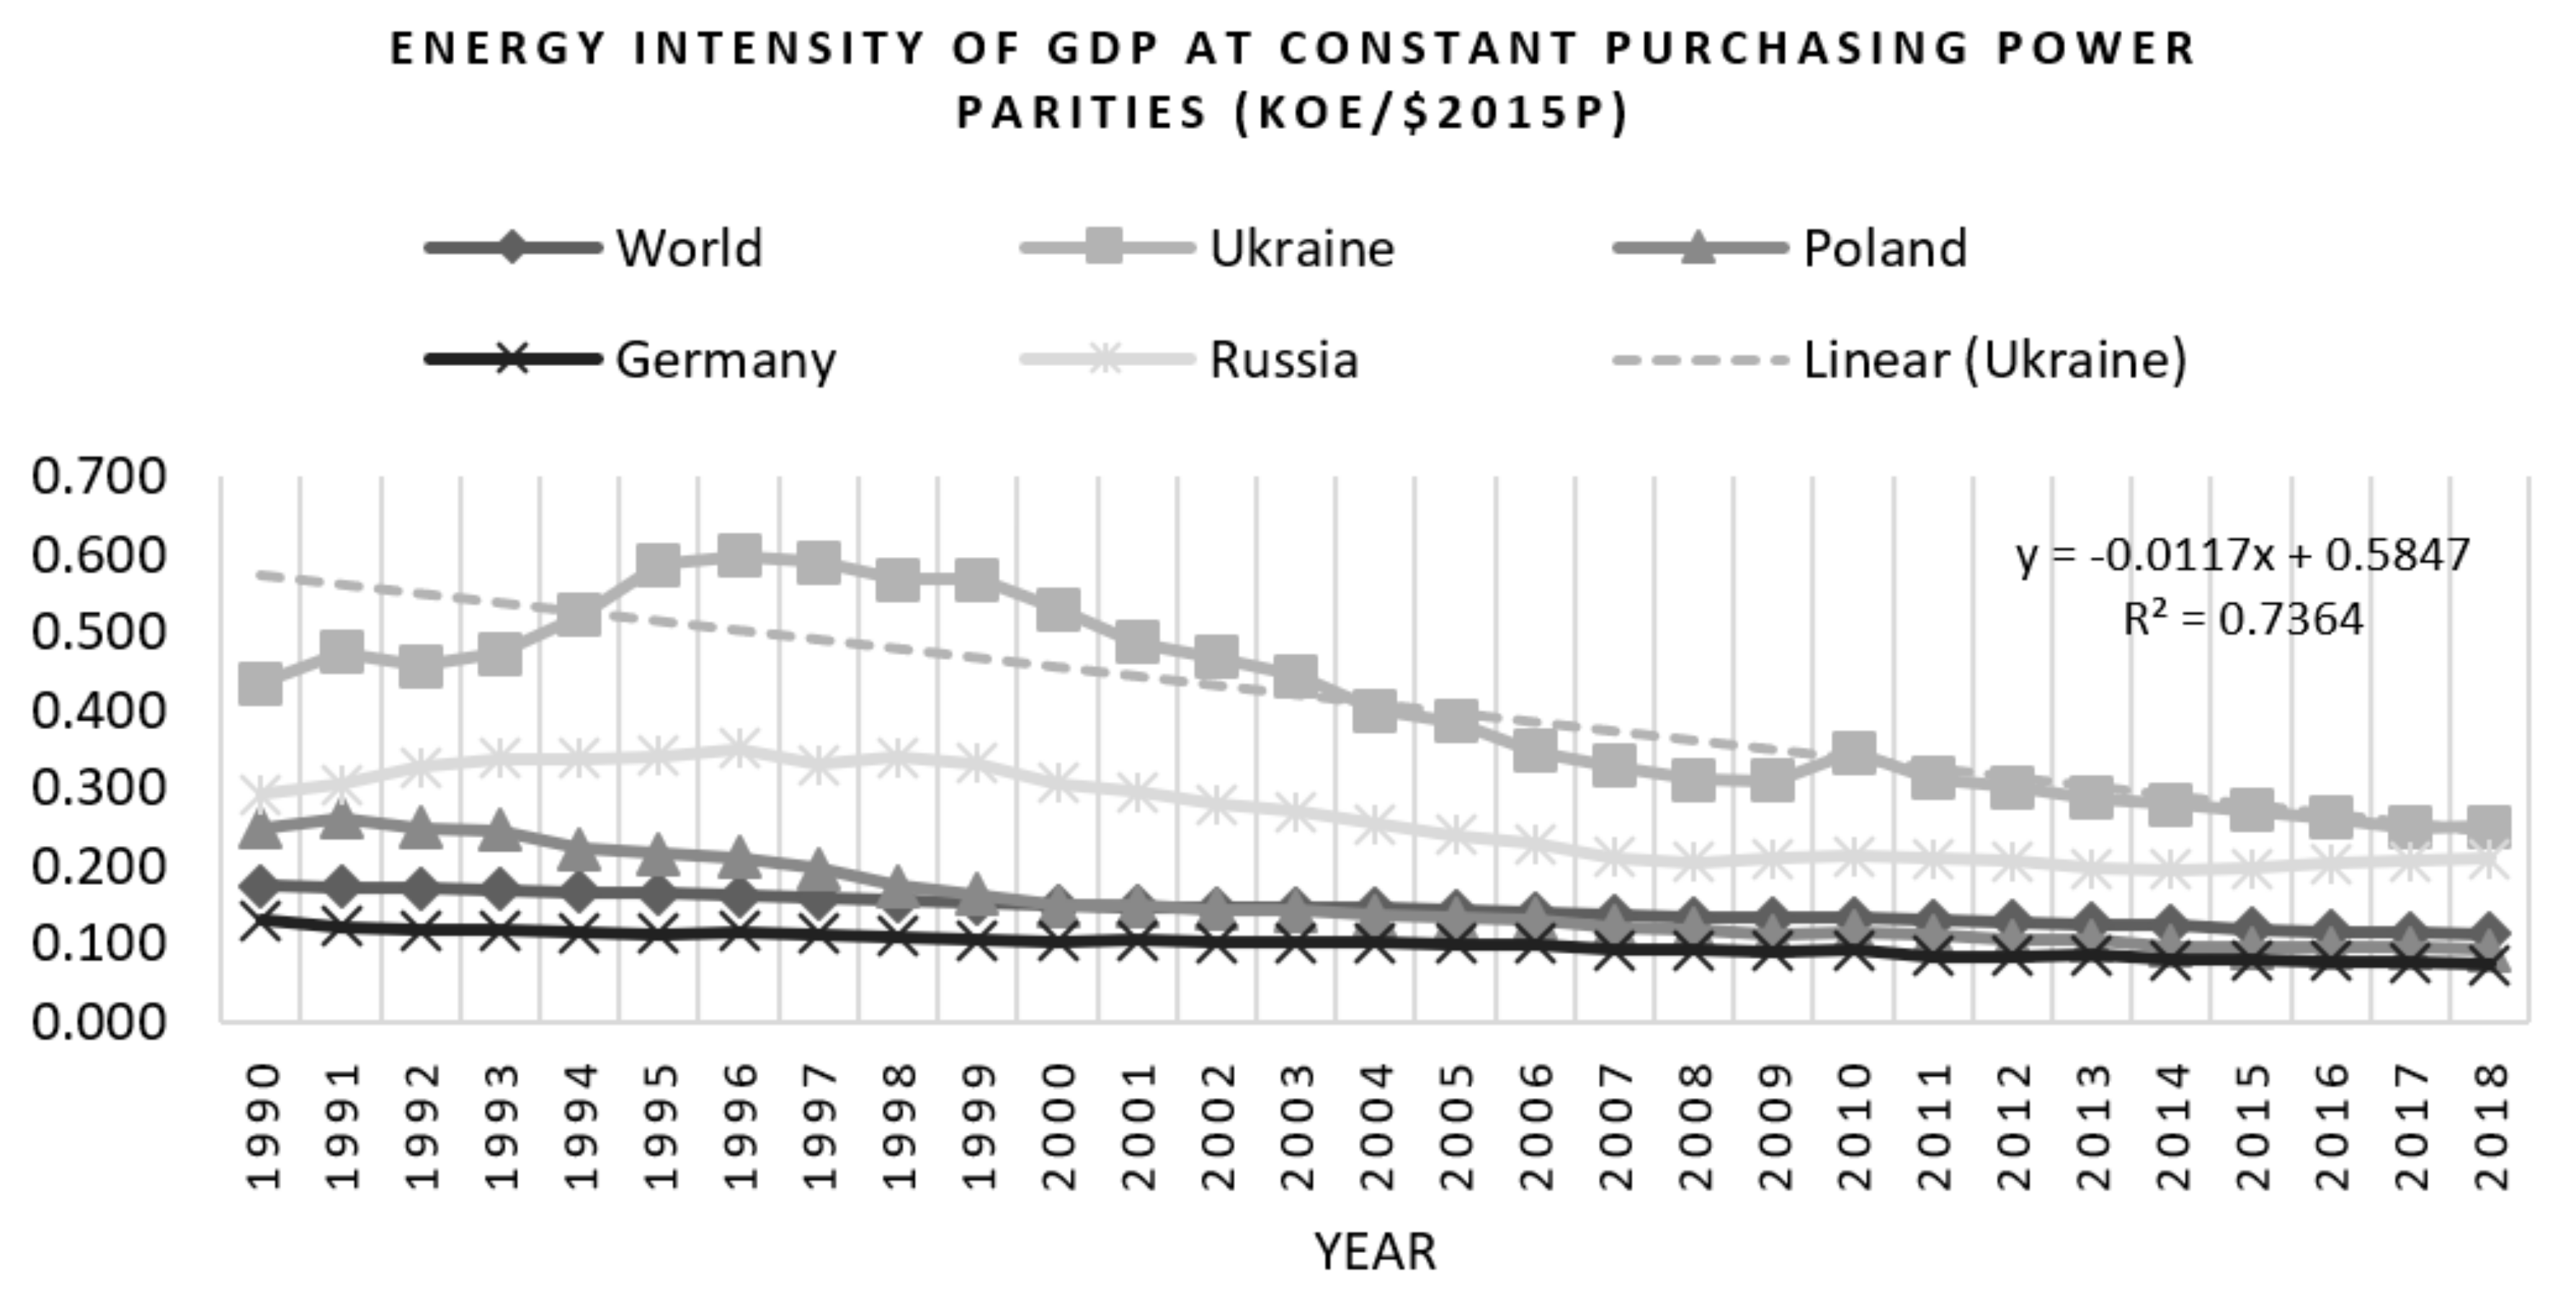
One of the generalizing macroeconomic indicators characterizing the level of spending fuel and energy resources per unit of produced gross domestic product is the energy intensity of the gross domestic product. As Ukraine is a developing country, high-energy consumption with the comparatively low GDP level is reflected in the indicator of GDP energy intensity, which can be seen in
Figure 8, where the Ukraine has the highest indicators among the investigated countries.
Figure 9 shows the decrease in GDP energy intensity for the Ukraine, which is caused by the reduction in production capacity and energy consumption alongside the slight increase in GDP (except for 2009). The lowest GDP energy intensity indicator is observed in Germany, which enhances production capacity simultaneously with energy-saving technologies, creating additional reserves for economic growth. This indicator is lower than the global energy intensity that falls slightly due to the development of innovative technologies and increased production.
Using Poland as an example, we see improvements in its economic and environmental situations since its entry into the European Union, characterized by the availability of regulated ecological legislation, and the improvement of life quality, which has a positive impact on the implementation of rational use of natural resources. However, Poland’s GDP energy intensity indicator is higher than Germany’s, where the problem of ecosystem degradation emerged much earlier.
Figure 9 shows the 96% correlation between GDP energy intensity indicators of the Ukraine and the Russian Federation. This was especially noticeable until 2014 when the Ukraine was completely dependent on Russia in both energy and economic sectors.
Since 2014, the Ukraine has become less dependent on the Russian Federation and has diversified its energy production by using its own resources (since 2015, there has been a significant decrease in energy exports (by 74% in 2019 relatively to 2014)). According to the State Committee of Statistics, energy consumption in the Ukraine has decreased since 2014 due to reduced energy needs of the manufacturing industry, the development rate of which has decreased significantly in recent years. Energy consumption is one GDP source; it was approximately 49 million TOE in 2019, in the Ukraine, which was 2.1 million TOE less than in 2018 [
21], caused by the decrease in consumption of energy resources by households and the service sector, which can be an indicator of income decrease and excessive energy savings among the population.
Ukrainians typically use energy-efficient vehicles, and at a small price, while in Europe, due to increased taxes on cars—taking into account the age of the car and its impact on the environment—cars are resold to countries with low environmental standards, with low purchasing power of citizens (from Germany, Poland, to the Ukraine). Long-term structural factors in market reconstruction can play a significant role in the future, which can be seen in such countries as France, Poland, and Germany.
Ukraine’s developed agricultural sector predetermined the energy use, at 3.8% in 2019, which did not significantly affect the level of energy consumption, but formed the GDP of the Ukraine, while in France and Germany, the energy use in the agricultural sector is much higher, indicating intensive economic activity in this area. The energy consumption indicator can demonstrate the economic situation in the country and its innovative development.
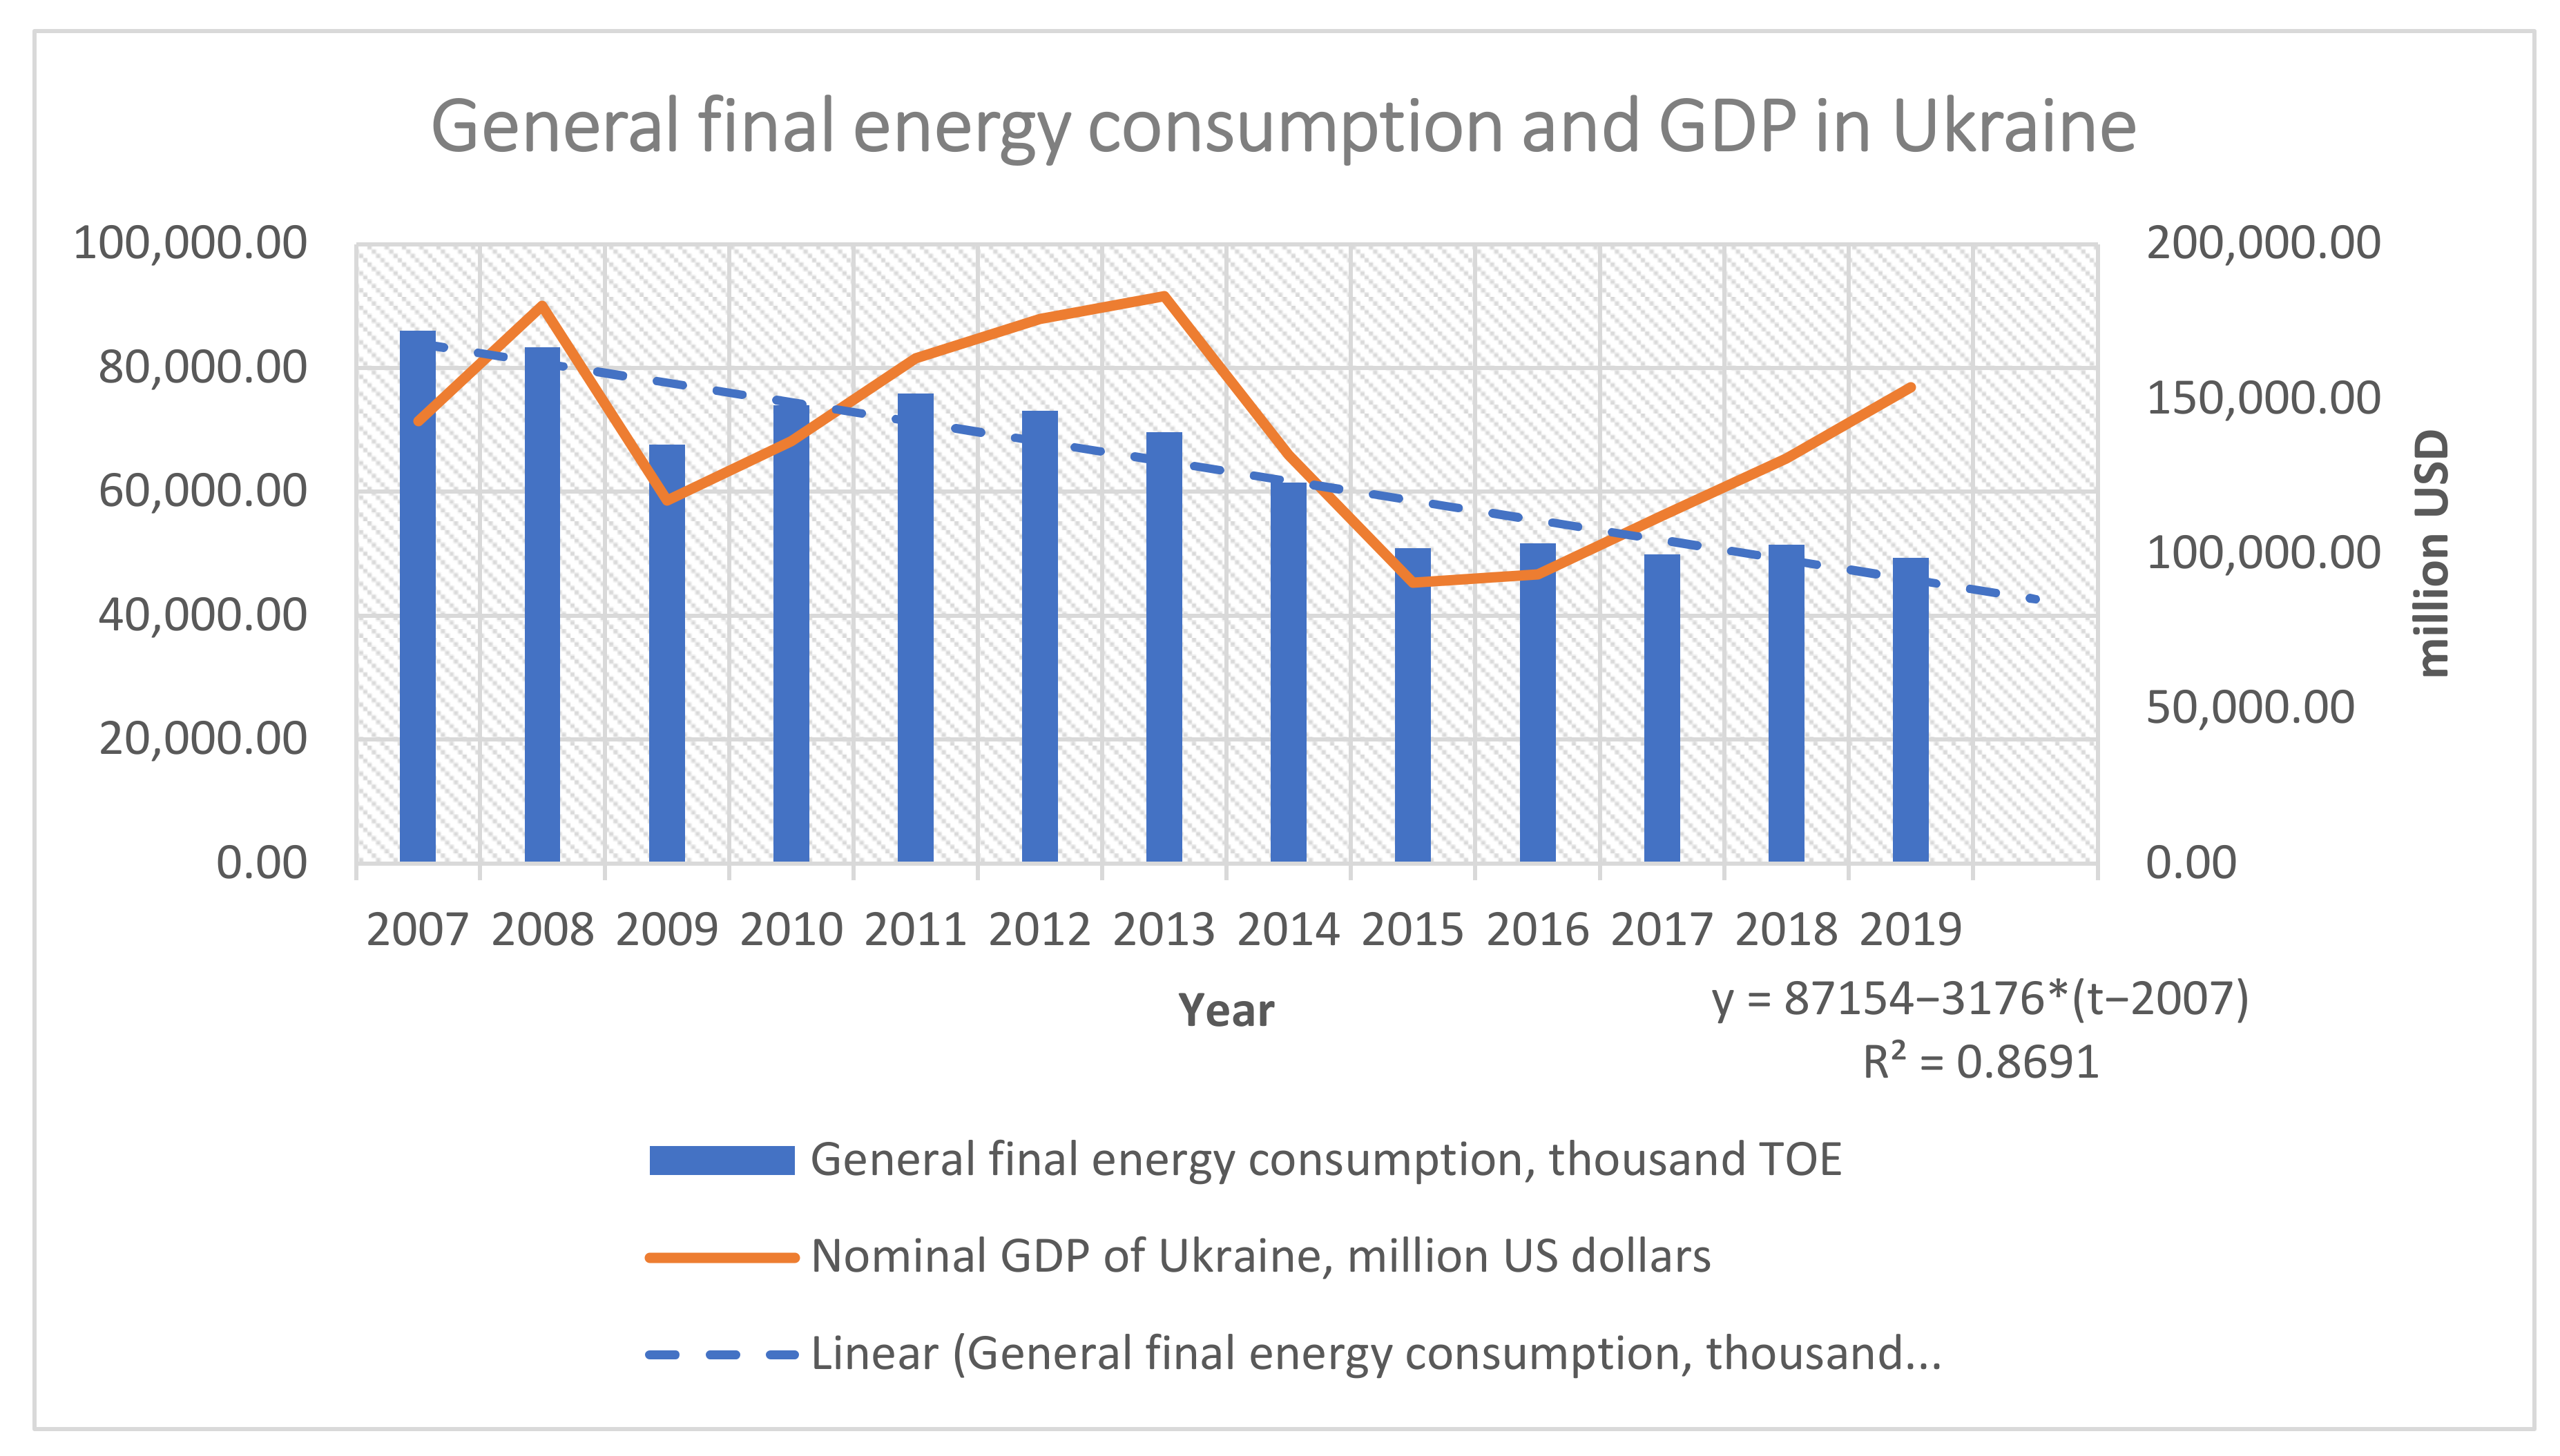
Since 2007, the decrease in energy consumption in the Ukraine has correlated with the nominal GDP indicator, in dollar equivalent, by 63%, indicating a moderate direct relationship. The GDP decrease leads to a reduction in energy consumption, confirming the impact of economic instability in increments of 1 year (2008, 2014—years of destabilization, the impact was felt in 2009 and 2015) on the activities of manufacturing, transport sector, service sector, and households, which are powerful consumers of energy in the Ukraine. Due to the pandemic, 2020 and 2021 saw reduced energy consumption, particularly felt in the service sector and industrial production. One could also predict the GDP decrease in 2022 and less energy consumption, in comparison with 2019, amid worsening economic problems and decreasing purchasing power of the population, businesses, and global economic growth. As Europe aims to decarbonize and improve the quality of ecosystem functioning, energy consumption and energy efficiency will decrease in 2022, which will have a synergetic effect and a positive impact on the ecological state of the environment. Such an effect is not expected in the Ukraine because of the maximum savings of resources by the state and entrepreneurs during crises and the reduction in business profitability, which will lead to a decrease in contributions to eco-friendly production, renovation of fixed assets, and purification facilities. There will be many cases of non-compliance with environmental legislation and irrational use of natural resources caused by low living standards and the desire to earn money at any cost; thus, the reduction in GDP energy intensity is a process that should be supported by law within at least 10 years in the Ukraine, involving local communities and businesses to achieve a similar level to Germany.


 ,
, 