
Learning from Each Other—A Bibliometric Review of Research on Information Disorders


1
Department of Psychology, Faculty of Sociology and Psychology, West University of Timisoara, Office 233, 4 Bd. Vasile Pârvan, 300223 Timișoara, Romania
2
Department of Sociology, Faculty of Sociology and Psychology, West University of Timisoara, Office 318, 4 Bd. Vasile Pârvan, 300223 Timișoara, Romania
3
Department of Computer Sciences, Faculty of Computer Sciences, “Ioan Slavici” University of Timisoara, 144 Str. Păunescu Podeanu, 300569 Timișoara, Romania
4
Department of Communication Sciences, Faculty of Political Sciences, Philosophy and Communication Sciences, West University of Timisoara, Office 501, 4 Bd. Vasile Pârvan, 300223 Timișoara, Romania
*
Author to whom correspondence should be addressed.
Sustainability 2021, 13(18), 10094; https://doi.org/10.3390/su131810094
Submission received: 10 August 2021
/
Revised: 30 August 2021
/
Accepted: 31 August 2021
/
Published: 9 September 2021
(This article belongs to the Special Issue Sustainable Education and Social Networks)
Abstract
:Interest in research connected to information disorders has grown considerably in recent years. The phrase “information disorders” refers to three different notions: dis-, mis-, and malinformation. It is difficult to pin down this new and dynamic phenomenon of informational disruption and to assess its impact on society. Therefore, we conducted a bibliometric analysis on the complexity of information disorders using the Web of Science Core Collection database from 1975 to June 2021. We analyzed 8964 papers with the goal to have an overall picture of the topic, clarify the knowledge framework of research in this field, examine the development dynamics, identify future research directions and increase the understanding of the research on information disorders. The following are our main findings: the number of publications, authors, and journals has increased; research on information disorders has earned considerable attention in multiple academic fields; there are more and more works written in collaboration by scholars from different parts and cultures of the world. This paper makes important contributions to the literature, not only by providing researchers and practitioners with a coherent and perceptible intellectual basis to find answers, but also by bringing valuable insights for further investigation and future research directions.
1. Introduction
With the development of contemporary social technology, we are witnessing a new phenomenon: global scale information pollution. Sometimes called infollution [1], one of the biggest challenges of our time is defined as the presence and spread of unwanted messages in human society, in large enough quantities to cause significant negative effects on human and social activities [2]. Other authors [3,4,5] refer to it as the contamination, with irrelevant, inaccurate, redundant, noisy, excessive, unsolicited and low-value information which distorts reality and prevents the process of understanding.
Information pollution can be of several types: direct manipulation, ideological manipulation, propaganda, fake news, online disinformation, conspiracy theories, psychological contamination, memes and memetic warfare, etc. According to Meel and Vishwakarma these “are not mutually exclusive but at the same time also have some heterogeneity that brings them under a specific category” [6] (p. 3).
Information pollution has affected both society and human nature itself. As Wang et al. [7] mentioned, the consequences of infollution include wasted time, physical health issues, informational stress or addiction problems. Yet the most devastating consequences are represented by the disruption of information in digital communication environments: we live in the post-truth age, we are exposed to alternative facts and fake news, we suffer from distress caused by information overload [4,8,9]. It is clear that we live in an age of disruption whose direct and indirect impacts are difficult to quantify and, as Wardle [10] has observed, the long-term implications of disinformation campaigns are the most worrying.
Pollution of the information ecosystem is frequently associated either with disinformation or with the term “fake news”. As Wardle and Derakhshan [5] have shown, it is a vague term, misused and “widely ab(used)” [11] that is not at all suitable to describe the extent of information sharing practices that result in nothing other than questionable or manipulative information. Thus, in order to capture this new reality, Wardle and Derakhshan [5] do not consider that the term “fake news” has a simple, widely accepted meaning, for at least two reasons: (1) it is inadequate to describe “the complexity of the information pollution phenomenon” and (2) it has been picked up by some politicians who use it to label media organizations that do not endorse them (the most conspicuous example being Donald Trump, who stated that CNN, The New York Times and other media outlets produce “fake news”).
The authors of the already cited article [5] suggest using the term information disorders (ID) which refers simultaneously to three different notions: “mis-information” (false information, but which is not intended to cause harm), “dis-information” (false information intentionally spread in order to cause harm) and “mal-information” (genuine information that is manipulated in order to produce harm). The three types of ID can take different forms: satire or parody, misleading content, imposter content, fabricated content, false connection, false context and manipulated content [5] and “have their own actors, motivations and rhetoric”, as Frau-Meigs [12] (p. 16) explains. There are also other terms that attempt to pin down this new informational disruption, the changes, even malformations the information ecosystem goes through nowadays as a result of the endless possibilities offered by technology: narrowcasting, viral autobots, like factories, algorithms that generate content, troll armies, computational propaganda, clickbait headlines, deep fakes, etc. [13,14].
The impact of information disorders is often downplayed despite the huge risks they entail. For instance, since the beginning of 2020, large amounts of disinformation regarding COVID-19 have been spread [15], including fake studies, phony-testing and ineffective prevention methods. Consequently, the World Health Organization on the 2nd of February 2020 has described this overabundance of information generated by the COVID-19 pandemic as the first massive infodemic spread both online and offline, which brings about significant health risks [16,17].
This phenomenon is clearly worrying, thus any discussion regarding information disruptions and their effects might start from the following questions:
- How many types of information disorders exist? Is there a taxonomy in scientific literature?
- What sources produce and spread information disorders? Who are the main actors in this field and what expertise do they have?
- How much of the digital content is organic and how much is distributed by bots?
- How do information disorders evolve over time? What common experiences and knowledge about information disorders exist on a global scale?
- Has the complexity of the problem been discussed/explored publicly?
- Which approaches could contribute to an informed and resilient society in a pandemic context?
Researching information disorders is a challenging task and any study has limitations. If Hansson et al. [15] identify six types of harmful information during the pandemic in Europe, Kapantai et al. [11] (p. 1) reported that, although there is rich scientific literature on diverse topics, it does not address ID in a unitary way. It only deals separately with its elements, with “no commonly agreed typology framework, specific categorization criteria”. Basically, as Wardle and Derakhshan [5] have observed, ID is a research field that is too complex. If some of its aspects could be described as low-level information pollution, others are sophisticated and deeply deceptive. Most of all, in the literature, we encountered varied definitions and dimensions of ID and its manifestations, which makes it difficult to understand the concept unequivocally [18]. That is reason enough to undertake a thorough analysis in order to identify the most interesting research directions of the concept of ID. In fact, as far as we know, there are no publications presenting the results of a literature analysis covering the breadth of the field of ID. We identified some papers that focus on general results on fake news in different areas, but they need to be updated and extended due to a significant increase in the number of recent publications. Therefore, our paper is focused on filling this gap.
The structure of the current paper is as follows: After the introduction and an overview of how ID topics are reflected in the literature from a bibliometric perspective, we describe the methodology, and in the Section 4 we analyze the data. The Section 5 discusses the results, provides limitations and suggestions for further research. Finally, at the end, we draw several conclusions.
2. Literature Review of Bibliometric Studies on Information Disorders
Bibliometric studies analyze scientific production from a quantitative perspective and it has become well known among researchers. It is considered a very good tool for analyzing the dynamics of science as it provides an overview of research trends in general or in a particular field [19]. At the moment, bibliometric indicators are the main elements that evaluate the quality of work and the effectiveness of scientific research, scholars, research teams, research institutions (universities or other organizations) and countries in general [20]. More specifically, bibliometric tools are used to study the flows of scientific publications, to rank the quality of work in a particular field, to assess the pace of development and to identify specialists, institutions and countries recognized worldwide for their contribution to the development of science by calculating the number of publications and citations. For example, networks of citations are built by taking into account citations. They can be interpreted in many ways: the degree of international collaboration between researchers can be determined, the “centrality” or “periphery” of a journal can be established, the trajectory over time of a certain journal can be tracked down, and so on. The analysis of citations can also help to establish the links between articles and based on them, thematic networks can be formed, links between disciplines and many others can be visualized [21].
The bibliometric analysis of ID has been less covered by scientific publications and the conversation surrounding fake news is still relatively centralized. Moreover, they do not look at ID globally, but choose either a research field (media and communication, politics, health, etc.) or just a topic (fake news, post-truth, propaganda, etc.). Sometimes, they are limited to only one database (Web of Science or Scopus), but they do not study in-depth co-citation, for example, or they do not perform science mapping. Therefore, previous bibliometric studies provide the foundation for understanding the ways bibliometrics might be applied to the evaluation of scientific output from the ID domain.
One of the first bibliometric studies on the effects of fake news and misinformation was carried out by Ha et al., who examined 142 journal articles. They focused on mapping development in scholarship on fake news and misinformation between 2008 and 2017, paying special attention to how the “surge in social media and mobile media use and the election of Donald Trump affected the research on misinformation and fake news” [22] (p. 2). The authors suggested more research was needed on other topics “to cover areas such as the responsibility in the information creation and dissemination process, identification of fake news or misinformation in different types of content, and practical strategies to use in real life” [22] (p. 22).
The study of Dalesandro et al. [23] was similar to the approach of Ha et al. [22] and consisted of mapping the fake news topic in the scientific literature based on 325 papers indexed in the Scopus database between 2005 and 2018. The authors assessed the scientific production related to fake news to better understand this phenomenon and its causes and/or motivations and pointed out the fact that the theme was aligned with international policy (Brexit and Presidential Elections 2016 in the USA). They concluded that fake news was related to other themes such as social networks, misinformation, post-truth, informational competence, journalism and the internet, and there was a need to further explain the most common issues linked to this theme.
Park et al. [24] came to the same conclusion. They conducted a comprehensive study of 479 academic articles indexed in Web of Science (WoS) in the last 20 years on fake news and related concepts, such as truthiness, post-factuality and deep fakes. Based on their findings the authors developed a conceptual fake news framework classifying fake news into misinformation, disinformation, malinformation, and non-information. However, the authors explored only some of the topics from the large spectrum of information disorders and concluded that malinformation and non-information should be investigated more closely. Lee and Nah [25] also confirmed that the theme of misinformation became more critical to academia. Similar findings were reported in [26]. The authors empirically examined 103 peer-reviewed articles published between 2000 and 2018 on fake news. Their study focused more on content analysis of the field of journalism, and it took into consideration the United States more than any other country.
Alonso Garcia et al. focused on the impact of fake news on the scientific community. They took into consideration 640 scientific articles from WoS, excluding other types of documents. Their findings suggest that, although this is “a line of research whose assent is emerging at the same time is vertiginous” [27] (p. 14), there is a keen/intense need to “continue on a path that combines the eradication of the phenomenon, as well as education for the prevention of its consumption”. In the same vein, the purpose of the research carried out by Wang [28] on 387 articles indexed in WoS was to identify the different forms of fake news and other related concepts and to explore the recent trends of research in this field. The author concluded that not all research on disinformation is related to the investigation of fake news. Some papers just discussed errors and disinformation in their fields of research. However, this study limited the publication year to 2019 and earlier.
Other studies have explored “how fake news is taking over social media and putting public health at risk” [29] (p. 143) and, more recently, the infodemic effects. Wang et al. [30] conducted a systematic literature review on 57 articles from different databases about the spread of health-related misinformation on social media. The authors argued that there have been fewer studies on misinformation about infectious disease or vaccination and a more targeted approach was needed on research topics such as psychological responses and social contexts where misinformation spread.
Between January–April 2020, Naeem et al. made a content analysis of 1225 COVID-19 fake news stories in English taken from fact checkers, myth-busters and COVID-19 dashboards. The authors concluded that the “COVID-19 infodemic is full of false claims, half-baked conspiracy theories and pseudoscientific therapies” [29] (p. 148). Therefore, researchers, scholars, scientists and journalists should “exercise their professional responsibility to help the general public identify fake news stories”.
Along the same lines, Pool et al. carried out a bibliometric study in order to map the infodemic literature. After analyzing 414 records indexed in WoS published between 1993 and 2021, the authors proposed an infodemic research platform based on research nodes such as coronavirus (COVID, pandemic, disinformation, lockdown), post-truth, fake news, fact checking and social networks (Facebook, WhatsApp). However, one of the limits of this study was that it did not explore the “effective use of social media in the context of pandemics misinformation” [31] (p. 768).
More recently, Kapantai et al., conducted a systematic literature review on disinformation with a clear objective “to identify and define the various underlying content types in the information disorder ecosystem and organize them” [11] (p. 17). They proposed a unified typology framework for disinformation to be validated in the years to come. The authors reached a consensus, namely that ID was a complex, dynamic and broad research field that had to be analyzed continuously and periodic research was necessary to update the literature.
Other authors made bibliometric reviews in conjunction with information disorders on topics such as propaganda or rumor. For example, the study of Chaudhari and Pawar [32] analyzed propaganda in social media and offered evidence that it was related with fake news, political astroturfing, terrorism or radicalization. Similar findings were reported earlier by Tal and Gordon [33] who argued that, although propaganda plays a very important role in our lives, it cannot be considered an autonomous field of research. Wang et al. [34] carried out a bibliometric analysis of 970 articles indexed in WoS between 1989–2019 and found that the research on rumor propagation dynamics was directly linked with online social networks, social media and Twitter.
What the authors of the current paper noticed is that the profile of scientific production related to this subject can be described as something recent given the few studies mentioned above. There is a need to further understand how the conversation surrounding information disorders is evolving and how its practice is changing, not only in politics or public health but also in other strategic domains, such as digital communication channels, the environmental field or education. To the best of our knowledge, this is the first bibliometric study that covers an extensive period from 1975 to present and thus provides a wider coverage.
3. Methodology
This study follows the guidelines set by Andres [21], Ball [20], Gutiérrez-Salcedo et al. [19], Oliveira et al. [35] and Grosseck et al. [36].
3.1. Methods and Tools
The main goal of this paper is to conduct a bibliometric analysis on information disorders research. In order to achieve this goal, we set four objectives:
- Establishing a descriptive structure through content analysis for documents, authors, journals, institutions and countries: Which authors are the most productive? What is the annual scientific publication growth? Which journal do scholars mostly publish in?
- Determining the impact scientific publications have on generating new knowledge through citation and co-citation analysis on publications, authors, journals, institutions and countries: Who are the most cited scientists and scholars? What is the academic performance of the ID theme in the WoS database? Is there a certain level of authors’ contribution that follows a particular pattern?
- Tracing collaboration patterns through co-authorship analysis for authors, countries and institutions: Which countries collaborate in information disorders research? What is the specific contribution pattern of authors who researched this topic?
- Identifying key research areas and emerging trends through co-occurrence analysis: What is the conceptual structure of the research field? What are the most relevant topics in the research developed on ID? How has ID research progressed over the past 40 years?
In order to quantify scholarly communication, we worked with Biblioshiny (a bibliometric software package web-based on R language) and with VoSViewer to analyze and visualize the research status and trends in the field of ID. Both software programs are freely available online and effective in performing bibliometric research [37].
3.2. Sources and Data Collection
The documents were extracted from the Web of Science Core Collection which is considered one of the most important and comprehensive collections of scientific resources worldwide for detailed bibliometric analysis [38]. WoS gives researchers the opportunity to access and analyze information in order to form an opinion on the various research trends and models and the possibility to have an overview of the worldwide research phenomenon through a single platform and search sequence [39]. WoS has a complex structure and includes several indexing databases which differ according to the range of subjects they cover. Hence, what makes WoS the most well-known and recognized scientific and research platform in the world is, on the one hand, the large volume of information it contains and, on the other hand, the ease and very short time in which correlations can be established between articles based on citations or other information on a given study topic.
The topics used as search criteria to retrieve papers in the field of ID are depicted in Table 1.
We based our search on PRISMA guidelines [40]. As a result, on 6 June 2021, we extracted a total of 10,195 papers which were downloaded in a tab separator format. Figure 1 shows the refining process until the final set was obtained.
The final data set consists of 8964 documents, which represents, as far as we know, the largest dataset for this type of analysis on information disorders.
4. Data Analysis and Results
4.1. Content Analysis—An Overview of the Collection
Content analysis uses the following terms (Figure 2):
- A document (or a citing document) is a scientific paper (article, review, conference proceeding, etc.) included in a bibliographic collection. In our collection, we have 8964 documents in 4108 sources (journals, books, etc.).
- A reference (or cited reference) refers to a scientific document included in at least one of the reference lists (bibliography) of the document set. Then a reference is cited by one or more documents. In our collection we have 239,719 references included in the 8964 documents.
- A cited document is a scientific document included in a bibliographic collection and, at the same time, it is cited in at least one other document of the collection. Cited documents belong both to the Document and the Reference set. We have 2283 cited documents.
4.1.1. Document Types
We retrieved 26 types of documents. The most frequent are the articles, including early access (5678) followed by proceedings papers (1211), editorial materials (660) and reviews (360). Other document types were letter (223), book review (177), meeting abstract (106) and news items (46). The remaining documents are present in a very small number. The majority of the papers (8299) are written in English. When it comes to other languages, the number of papers written in Spanish is 254, Portuguese (101), German (83), French (64) and other languages make up fewer than 50 papers (Russian—49, Italian—37, Turkish—22, etc.).
4.1.2. Papers in Different Subfields/Categories
Counting published documents is one of the several possible units of analysis. Categories and research areas are worth considering as well. The publications in WoS are included in more than 250 subject categories and are considered peer-reviewed literature (both traditional or open access). A paper can belong to several categories. The highest number (1053) is associated with the category Communication (11.74%) followed by Computer Science Information Systems (7.02%), Public Environmental Occupational Health (6.99%), Psychology Experimental (6.25%) and Computer Science Theory Methods (6.19%). Next, with a much smaller percentage, we found Information Science Library Science (4.63%), Computer Science Artificial Intelligence (4.19%), Political Science (4.06%), Engineering Electrical Electronic (3.83%) and Psychology Multidisciplinary (3.80%). The remaining WoS categories (such as Medicine General, Educational and Educational Research, Law, Social Sciences, etc.) have a share of under 3%.
WoS has 156 research areas, with each category being mapped to one research area. The five broad categories of research areas are Arts and Humanities, Life Sciences and Biomedicine, Physical Sciences and Social Sciences and Technology. The first ten research areas covered by our data set are Psychology (14.16%), Computer Science (14.14%), Communication (11.74%), Public Environmental Occupational Health (6.9%), Government Law (6.57%), Engineering (5.34%), Information Science Library Science (4.63%), Education Educational Research (3.79%), General Internal Medicine (3.77%) and Business Economics (3.55%).
4.1.3. The Annual Trends of ID-Related Publications
Research on ID can be placed in a timeframe that can be divided into three categories of scientific stories (Figure 3): initial stage (1975–2009), steady rise (2010–2016) and high growth (2017–present).
The growth of scientific production is exponential, with an annual growth rate of 12.38%.
4.1.4. Authorship
For the period 1975–June 2021 we identified 26,242 authors. The “top 10” authors published 321 papers (3.58%) in total and include the following scholars: Elizabeth Loftus (54 papers), Stephen Lewandowsky (40), Ullrich K. H. Ecker (35), Daniel Wright (26), Emily Vraga (25), Henry Otgaar (24), Garry M. (22), Hill J.A. (21), Paterson H.M. and Pennycook Gordon (19).
4.1.5. Keywords
Bibliometric analysis uses two types of words:
- Author Keywords are short informational structures which the authors use believing that they best represent the major concept of their works.
- Keywords Plus are sets of words that are automatically generated from an existing database and that we find in the titles of bibliographic references of the paper, sometimes without being present in the title or keywords established by the authors.
Comparing keywords plus and author keywords, Garfield and Sher [41] claimed that the first terms are able to grasp an article’s content with greater depth and variety. As Zhang et al. [42] suggest, although keywords plus are important to investigate the knowledge structure of a scientific field they are “less comprehensive in representing an article’s content”.
There are 14,489 authors keywords and 7380 keywords plus. Word TreeMap representations (Figure 4) are useful for quickly spotting the most prominent terms and for locating a term alphabetically to determine its relative prominence. Most of all, de Bellis [43] says it reflects both the topic and the direction of writing articles in the field in a more concise and intuitive way.
The top 20 authors keywords occurrences are fake news (1106 papers), misinformation (899), social media (852), COVID-19 (499), disinformation (467), Twitter (229), internet (164), infodemic (141), post truth (137), coronavirus (136), social networks (132), fact checking (125), media (123), memory (123), journalism (122), communication (116), pandemic (114), false memory (113), machine learning (112) and public health (103).
The dynamic of authors keywords is shown in Figure 5.
4.1.6. Countries or Regional Distributions
We took into consideration the country where the authors work, which may be different from the country of birth or country of citizenship (Figure 6).
Out of 136 countries identified, the USA dominates the classification with 3670 papers, followed by England (819) and Australia with 525. In the top 10 most productive countries we can also find Canada (455 papers), Spain (416), China (363), Germany (361), Italy (342), Brazil (245) and India (224).
4.1.7. The Distribution of Institutions
Our data set includes 5368 institutions. The highest number of ID-related documents belongs to Harvard University with 134 papers. It is closely followed by the University of North Carolina with 118 papers and Oxford University with 108 papers. In the top 10 most productive affiliations of authors, we also find Michigan University (101), The University of Sydney (101), University of Pennsylvania (99), University of Toronto (96), Washington University (95), University California Irvine (84) and University of Illinois (81). The top 10 institutions amount to 11.34% of the total publications.
4.1.8. The Distribution of Sources of Publications
Scientific papers are usually included in journals, books or conference proceedings, which in addition to knowledge claims, offer relevant information on various aspects of the organization of research (such as authors, institutions, collaboration between groups of researchers, etc.). Therefore, the distributions of sources of publications can be a powerful tool of investigation at the crossroads between different analytic dimensions. The 8964 papers from our data set were published in 4108 sources. The first 20 publication sources comprised 950 papers.
To establish a quantitative relationship between the publication sources and the documents from the bibliography set, we took into consideration Andres’ [21] advice to use Bradford’s law (Figure 7).
Thus, we identified three journals as a “core” source: Journal of Medical Internet Research (887 papers), Applied Cognitive Psychology (119) and PLoS ONE (91). In the top 10 most productive journals we find Memory (75 papers), Social Media + Society (50), International Journal of Communication (48), Media and Communication (44), International Journal of Environmental Research and Public Health (43), Profesional de la informacion (40), Proceedings of the National Academy of Sciences of the United States of America (37), American Journal of Public Health (36), Memory & Cognition (36) and New Media & Society (35).
4.2. Conceptual Structure of Knowledge Analysis
The conceptual structure of knowledge refers to what sciences talk about, the main themes and trends, and it is based on relations among concepts or words in a set of publications. Aria and Cuccurullo [44] indicate it can be carried out on three levels:
- Co-occurrence analysis (sometimes called co-words network) to understand the research front (what topics and issues are the most important and recent, what is the evolution of research subjects over time and what are the trends).
- Factorial analysis (data reduction techniques) is helpful in identifying subfields. Aria and Cuccurullo [44] show that clustering algorithms can also be used in cases of both network and factorial analysis.
- Mixed approach. Starting from a conceptual network, one can identify thematic networks that plot on a bi-dimensional matrix, where axes are functions of centrality and density of the thematic network. Dividing the timespan in time slices, it is possible to represent the thematic evolution within a specific research field through an alluvial graph.
4.2.1. Co-Words Analysis
As de Bellis [43] stated, the best-known technique to detect associations of scientific concepts for delineating subject areas, growing subfields or disciplinary patterns is to run a co-word analysis. The analysis with VoSViewer revealed the most used terms by authors [45]. In the visualization featured in Figure 8 each term is represented by a bubble. Alonso Garcia et al. [27] explained that the size of a bubble is directly proportional to the number of publications which contain the term analyzed. Usually, terms co-occurring often tend to be located close to each other.
The highest frequency was clearly fake news (1999). Other topics studied in the literature were effect (1381), participant (1037), news (848), user (819), COVID (778), event (732), experiment (617), health (614), patient (594), pandemic (541), education (525), condition (520), accuracy (499), memory (494), network (489), attitude (477), population (470), child (456) and feature (448).
Cluster analysis is an additional method of co-word analysis to visualize the evolution of scientific fields and to reveal patterns, research hotspots and development trends in scientific discourse. This method measures the association strength between representative terms in documents. As depicted in Figure 8, the research front is condensed in four major clusters.
- The green cluster is important throughout the entire period and it focuses on political research topics, with studies on how fake news is constructed and propagated in various electoral contexts or other approaches (climate change, for example) in the media, etc., especially with the help of new technologies. Moreover, in this cluster we find topics related to media education, the impact of fake news being even more worrying in countries where civic and media education are still weak.
- The blue cluster encompasses research on critical perspectives of technology and social networking as enablers of fake news, mis- and disinformation, and contains topics about the role online and digital technologies play in creating, promoting, detecting, tracking, signaling and combating fake content, about social media as disruption technologies for truth and trust, and about the major contribution of algorithms in amplifying the phenomenon.
- The yellow cluster is oriented more toward the cognitive processes involved in accepting, sharing and correcting false information. Mainly, we find topics about false memory, exposure to misleading content and their devastating effects on mental health.
- The red cluster includes specific topics related to the effects of disinformation on public health, especially in the context generated by the coronavirus pandemic, but also topics that address certain national contexts (Philippines, Saudi Arabia, South Africa, Thailand, Vietnam).
Figure 9 provides a temporal view of what has been studied over the years. For example, the lighter the yellow color, the newer, more recent the themes after 2016, such as propagation—especially through online networks such as Facebook and Twitter, source credibility and legitimacy, fact checking, US presidential elections (Donald Trump), civic engagement, media and information literacy, deep fake, natural language processing or how blockchain can help in assessing the news credibility and in building trust in news posted online, and also in preventing the spread of disinformation. In 2020, we have come across research topics such as those related to the pandemic caused by SARS-CoV-2 (COVID, coronavirus, outbreak, quarantine, infodemic, vaccine, etc.).
4.2.2. Thematic Map
The thematic map is also used to highlight different themes and to depict hidden patterns. It is obtained by applying a clustering algorithm to the keywords network, with each cluster represented as a strategic or thematic map, a two-dimensional graph generated by Biblioshiny, according to their density and centrality:
- Centrality corresponds to the importance of the theme in the entire research field.
- Density depicts the degree of the theme’s development.
By combining the high and low levels of density and centrality, the thematic mapping allows a visualization of four different typologies of themes (Figure 10):
- Motor themes (high/strong centrality and density): The driving force themes are reflected in the upper right quadrant.
- Basic and transversal themes: The lower right quadrant frames the fundamental and cross-cutting issues. Although significant, these themes are basic, general and transversal.
- Emerging or declining issues (low centrality and density): The topics are marginal and underdeveloped.
- Highly developed and isolated themes: These are marginal topics due to their highly specialized nature.
In order to understand how the ID area of research developed over time and to identify the evolutionary relationships, paths and trends, we relied on thematic evolution analysis. Such a representation of the data is useful because it can be applied to data that changes over time and helps us to better understand the flow conditions of different themes in the field. The analysis made by Biblioshiny is based on a Sankey diagram (Figure 11), a specific type of flow chart which is an important tool for visualizing energy and material flows.
4.3. Intellectual Structure of Knowledge Analysis
Citation analysis is an efficient way to study communication within the academic community, the structure of a science from an interdisciplinary point of view, as well as the mechanisms of creating new knowledge. We look at the most cited authors, documents, countries, journals and institutions.
Bibliometric analysis also makes use of citation networks based on the links between documents that cite and documents that are cited. Two documents are in a co-citation relationship when both are cited in a third document. Thus, when examined over time, co-citation analysis is helpful in detecting a shift in paradigms and schools of thought [20,21]. We looked at cited authors, references and journals.
4.3.1. Citation Context Analysis
Global citations are used in order to identify the highly cited papers, to measure the number of citations a document received from documents in the entire database. Local citations are used to measure the number of citations a document received from the documents included in the analyzed collection.
Regarding direct citations corresponding to our dataset, WoS indicators point out that the 8964 publications were cited 98,681 times, 75,290 of them being bibliographic references, without counting self-citations. The number of papers citing these articles is 66,366, out of which 62,068 are articles without bibliographic self-citations. The average citations per item is 11, while the Hirsch index is 118.
Figure 12 shows that the average citations per item experience several fluctuations, but generally the trend is upward. The period between 2005–2010 is the research time slot with the biggest number of highly cited papers. The highest average citations per item reached 3.46 in 2010 (over a period of 11 years). However, the most citations were received by the 42 articles from 1997 (52.61%) with an average of 2.19 per article and the longest citation period (32 years) is detected in the articles from 1989.
The next logical step was to find who are the authors who contribute most to the advancement of ID knowledge and what are the most cited documents. The authors who have brought important contributions to the advancement of ID are included in Table 2. The most cited author is Brendan Nyhan, a professor of Political Sciences at Dartmouth College, USA, followed by Stephan Lewandowsky, a professor of Psychology at University of Bristol, Ulrich K. H. Ecker, a professor of Psychology at University of Western Australia, and the professor of Psychology, Elizabeth F. Loftus, from the University of California, Irvine.
Table 3 identifies the highly cited papers as reported by Web of Science. The papers from the top 10 locally cited documents received 2739 citations, meaning 14.48% of the total number of local citations belong to the first ten most influential papers.
According to [43], citations do not simply link documents, they link ideas and arguments. Therefore, the citation analysis can be also used to quantify the impact of different actors, such as countries, universities, research institutions or journals, on the research stage and to monitor the variations of their performance over time.
Following are the top 10 most cited countries (the number of total citations is written in parentheses): USA (52,015—far ahead of the others), UK (9170), Canada (6274), Australia (5471), Italy (2675), Germany (2116), China (1745), Spain (1595), Netherlands (1571) and Israel (1110).
Table 4 shows the institutions with the best performances in terms of citations received by papers authored by people affiliated with them.
In addition, Table 5 features the top 10 most cited journals (with high impact factor) attracting most researchers in search of high-quality papers.
4.3.2. Co-Citation Analysis
The co-citation analysis allows us not only to draw the intellectual boundaries of the research field, but also to highlight its articulation into subareas and emerging research fronts and its connections with other specialties.
Figure 13 uncovers the relationships between authors in five clusters. In the visualization made by VoSViewer each circle represents a researcher. The larger the circle, the more publications meeting the analysis criteria were authored by these researchers. The closer the researchers are, the more strongly they are linked to each other.
Of the 144,918 authors, 1568 meet the threshold, with a minimum number of citations of an author = 20.
The most influential authors prove to be Loftus (1750 citations), Lewandowsky (862 citations) and Allcott (750 citations), scholars whose works center on identifying information disorders and its most common form—fake news, including the ways in which fake news spreads and produces damage. In the top 10 co-cited authors follows the World Health Organization—WHO (701), Nyhan B. (681), Vosoughi S. (665), Pennycook G. (624), Roediger H.L. (557), Lindsay D.S. (526) and Ecker U.K.H. (487).
The next step was to identify the most influential papers by doing a co-citation analysis with VoSViewer on 239,719 valid references (751 met the threshold with a minimum number of 20 citations of a cited reference) (see Table 6).
The visualization of co-citation networks of publication sources is presented in Figure 14. Each circle represents either a journal, a book or a conference proceedings volume. The dimension of the circles is proportional to the number of papers citing the corresponding publication. Based on co-citations, the closer they are, the stronger they are related.
Of the 99,481 sources, 2004 meet the threshold, with a minimum of 20 citations of a source.
4.4. Social Structure of Knowledge Analysis
Co-Authorship and Collaboration Patterns
The most common kind of social structure is a co-authorship network. Gutiérrez-Salcedo et al. [19] stressed that co-authorship networks allow the discovery of groups of regular and influential authors, hidden communities of authors, relevant institutions in a specific research field, regional collaboration, research hotspots, etc. The map presented in Figure 15 shows the network of co-authorship links between authors of publications or those that have co-authored with them. Colors indicate clusters of authors that are quite strongly connected by co-authorship links.
Collaborative patterns were analyzed for countries as well. In Figure 16, each node represents a country. There are connecting lines between the nodes, indicating that there is a cooperative relationship between the countries. The thicker the link between countries, the stronger the collaborative relationship and vice versa. The USA has an outstanding performance in international collaboration: UK–USA (179 papers), Canada–USA (119), USA–Australia (113), USA–China (112), UK–Australia (90), USA–Germany (65) and USA–Italy (58).
And regarding the corresponding author, the ranking is approximately the same (Table 7).
Concerning the collaboration between institutions, Figure 17 shows that regional cooperation predominates. Nevertheless, global international collaboration seems not to be missing either.
5. Discussions
The current study focused on providing answers to the following questions: What are the main areas and themes, the most current and “trending” topics in the ID field? What are the most cited works and authors? Which are the most influential scientific journals? Which human communities (institutions, regions, groups of countries) have the biggest influence on the development of this field? How does interest in certain scientific results evolve over time? As we have shown in the previous section, we retrieved some interesting results. In what follows, we will present our findings associated with the four research objectives.
5.1. Content Analysis
First, we looked at the document growth, counting the number of documents on ID in each year, in order to grasp the trend of scholars’ attention on the domain as a whole. The analysis of document types indicated that journal articles constituted the most important channel for formal scientific communication, approximately 63% of the total number of documents, although proceedings papers (13%) also played an important role. The proportion of other types of documents (editorial materials, reviews, etc.) was much smaller. The majority of the papers (92.5%) were written in English, which reinforced what Hallinger and Chatpinyakoop found, namely that “the coverage of documents in other languages remains quite uneven” [36] (p. 5).
We chose not to focus on a single descriptor (e.g., fake news) because, as mentioned earlier, discussions about today’s information ecosystem should cover more comprehensive concepts, such as disinformation, digital misinformation, malinformation, information pollution and even informational pathologies (see Table 1). Basically, we are dealing with a multitude of concepts which, as EU expert Alina Bârgăoanu [14] said, starts from relatively innocent forms of misinformation but also includes hostile propaganda from state or non-state actors with economic, political or geopolitical interests. This wide range covers lies, rumors, propaganda, manipulation, conspiracy theories, sensational or contextual information, but also almost fake or almost true news (the most dangerous type because it is difficult to distinguish between them). As a result, our work differs from and complements previous bibliometric studies.
Then we analyzed the categories and domains in which papers were included in WoS from the point of view of their value and contribution to the development of the field. We found that research related to ID entailed great efforts on the part of professionals from various scientific areas and disciplines, such as Communication, Computer Science Information Systems, Public Environmental Occupational Health or Psychology Experimental.
It should also be mentioned that a paper can be recorded in more than one research field, with many papers being interdisciplinary. ID research practically brings contributions to all scientific fields, which opens up new paths of integrative research. In truth, ID is too complex to be fully covered by accessing a single research domain.
The next step was to see how the academic conversation evolves over time and concerns publications directly related to the ID, such as documents where the terms disinformation or fake news appeared as the publication topic or as part of the title. Based on the annual trends of ID related publications analysis, we divided the evolution of research into three stages (Figure 3):
- From 1975 to 2009, the initial stage, with a low-production exploration period of over 35 years. An early stage with slight fluctuations in the number of publications, amounting to less than 100 per year. Abu Arquob et al. [26] reported that prior to the 2000s, few studies in this field were conducted (an increase in scholarly attention to the topic can be seen after the 2000s). Starting in the 1970s, authors have explored misinformation and disinformation [46], and have written about how “even after misinformation is corrected, false beliefs can still persist” [47], how “people are more likely to accept misinformation as fact if it’s easy to hear or read” [48] or about how people can be influenced by information after an event has happened, and the nature of false memories [49].
- Between 2010 and 2016, we are in a stage of rapid development. Starting with the year 2011, a rapid increase can be noticed in the number of publications. Papers are usually oriented towards spotting trends and phenomena related to the impact of fake news, such as anti-intellectualism, antiscience or agnotology [50]. According to Jankowski [51], works from this period generally focus on a particular type of ID and Abu Arquob et al. agrees that they “do not generally reflect the theoretical grounding expected from academic research” [26] (p. 6). We should also note that the proliferation of the ID phenomenon that has led to the increase in the number of publications and research related to ID since 2010 is closely related to the affordances of social media platforms, the most popular being launched around this year: Facebook (2004), YouTube (2005), Twitter (2006), WhatsApp (2009). In this period, one can see underlined the paradox of trust, where the crisis of confidence in governments, politicians, journalists, scientists and experts is riposted by trust in anonymous messages on social media platforms. If in the early years of web 2.0 and social media the technology was saluted for its potential for innovation, positive change and democratization of information within the social world, this optimism slowly collapsed into exhaustion and suspicion of online discourse and business practices on social media platforms.
- From 2017 to present we are talking about an explosive period. The literature volume is abundant, it increased sharply and attracted the attention of scholars from various countries, reaching 1958 papers in 2020 compared to 141 in 2010, with a burst in publications in the pandemic year of 2020. The year 2016 marked the publication of the first scientific research on the role of digital technologies in important recent and very recent events, such as the Arab Spring, the crisis in the Ukraine, Brexit, the popularity of Donald Trump, the war in Syria, etc. Most such research relates to digital disinformation or fake news. In fact, Jankowski [51] suggests that fake news has become a serious topic for empirical research after 2016, when public discourse tried to make sense of Brexit and the US presidential campaign. Moveover, after 2016, more studies on the psychological aspects of disinformation were published. In fact, in a meta-analysis, Chan et al. [52] singled out almost 7000 studies focusing on these aspects.
For the future, we can expect the production of literature on ID to grow constantly, as we are witnesses to a significant development in a range of disciplines: history, media and communication, education, psychology, philosophy, health, economics, environment, etc.
Between 1975 and June 2021, contributions to research were made by 26,242 authors, 2380 of whom are authors of single-authored documents and 18,255 are authors of multi-authored documents, which means 0.418 documents per author and 2.39 authors per document. Psychology professor Elizabeth Loftus from the University of California, Irvine, specialized in cognitive psychology, human memory, psychology and law and is the author with the most publications. Since the mid-1970s, Professor Loftus has conducted a series of innovative research on how semantic memory works, focusing on relatively unknown theories, investigating how complex memories change, how discoveries can be applied in the legal system and striving to understand the circumstances in which an honest eyewitness may have misidentified an innocent defendant.
At the same time, each author from the top 10 most productive authors developed and conducted research on different aspects of ID. For instance, Australian researchers Stephan Lewandowsky and Ullrich Ecker wrote about the way in which some “misinformation” “sticks” in the public consciousness, about how people continue to believe untrue things, even after it turns out they were lies, about conspiracy theories and how to avoid being fooled by the media and about the worrying effects that fake news can have on democracy [8,53].
Going further to find out the productivity of authors on the scientific subject of ID, we used Lotka’s law (Figure 18). Alfred Lotka observed that there is a “small group of experts that carry out a greater scientific production and the rest of them make only a minimal contribution to the field of knowledge in question” [21] (p. 23).
Results from the authors who contribute most to the development of the research in the field of ID are presented in Figure 19.
Fake news and disinformation are topics that have been covered a lot in recent years. They are not a new phenomenon, but specific to the times we live in is that this phenomenon now has the means to spread instantly to a huge number of people through social networks and social media applications. Hence, the concept has become a challenge for researchers all over the world who are trying to identify, fight, fact check and reduce the negative effects of disinformation and fake news at individual and social levels.
The co-word analysis is an indicator of the different poles of interests that shape the structure and the dynamics of a research field [43]. Figure 4 presents a synthesis of research topics in the ID spectrum such as fake news, disinformation, manipulation, but also other forms of influencing public opinion (persuasion, propaganda, etc.) in various fields ranging from politics, economics, medicine, public health and journalism, to education or science. Current topics such as the infodemic generated by the COVID-19 pandemic are also present. With the rapid development of technologies and the diversification of mass communication and of data transmission channels, we are witnessing the magnitude and development of the phenomenon. Therefore, researchers have the responsibility to keep exploring, investigating, analyzing and debating the issues typical of this vast, constantly developing field.
The co-occurrence of author keywords demonstrates a substantial diversity and a significant variety of published ID literature. In Figure 5 we see a sustained increase in research on distorted narratives, misleading interpretations, the negative influence of false content on human behavior, the effects of exposure to fake news about COVID-19 on social media, how digital platforms combat misinformation, etc.
According to de Bellis [43], scientific production is an important indicator of the degree of a country’s development and reflects its influence in the field of research. There is no doubt that the impact of research from the USA, England and Australia is the most significant, since it accounts for 56% of the total papers. As we can see in Figure 6, the study of ID has a greater impact on countries where elections were organized (USA, UK, Brazil), natural disasters occurred (Katrina in the USA, the fires in Australia, etc.) or those which are targets of Russian or Chinese disinformation attempts. On the other hand, it is not surprising that in this top 10 we find countries such as China, Brazil or India, knowing that they are countries where, in recent years, fake news and disinformation have spread rapidly, with the highest number of rumors and conspiracy theories [6,55]. For example, Guo [56], exploring the spread of online rumors in China where the media environment is tightly controlled by the government, demonstrated that the government institutions also advanced some rumors themselves and contributed to the perpetration of misinformation in a coordinated effort to control the narrative.
In India, the spread of fake news occurred in relation to political (e.g., Citizenship Amendment Act 2019, general elections) and religious matters (e.g., Delhi religious riots) and has been a particular problem during the coronavirus pandemic [57], contributing to the epidemiological explosion in the country. According to WHO, in July 2021, India is the country that reports the most cases of COVID-19 infection after the USA [58]. Misinformation and disinformation related to Pakistan and Kashmir is also widely prevalent [59,60].
Brazil, a country that has a culture of communication via WhatsApp, witnessed the distribution of false information through this messaging service that protects private conversations. In fact, according to Alves et al. [61], WhatsApp has become an ideal platform for disinformation particularly during the 2018 presidential election, when far-right candidate Jair Bolsonaro was accused of benefiting from an undemocratic “industry” of fake news in his attempt to become president of the country. During the pandemic the situation worsened and [62] reported that “digital media, especially social networks, become a breeding ground for fake news, political attacks and large-scale misinformation”.
According to our data, the most active institution is Harvard University, with 134 papers published by affiliated authors. The top only includes North American institutions, with very few exceptions (The University of Sydney and Oxford University). It should be noted that Harvard University runs a special program to tackle disinformation through the Berkman Klein Center for Internet & Society and housed until 2019 the organization First Draft, “the world’s foremost nonprofit focused on research and practice to address mis- and disinformation” [63].
From our dataset, 950 papers (10.6%) featured in the top 20 highly productive and visible specialized journals: Applied Cognitive Psychology, PLoS ONE or Journal of Medical Internet Research. The vast majority of top 10 publications have a high impact factor and offer open access publication, which is considered the best way to improve knowledge flow and to increase research impact (the probability of being cited).
On the other hand, as we can see in Figure 20, among the mainstream journals the most dynamic is the Journal of Medical Internet Research (JMIR), the pandemic creating a fertile ground for disinformation, especially in matters of public health. Thus, there was an increase to 45 papers published in JMIR in 2020 and 22 papers in 2021 (up to date).
5.2. Conceptual Structure of Knowledge Analysis
In order to properly assess the complexity of ID research, we must first understand the conceptual foundations of the construct. Besides the progress and issues of the field, from the co-occurrence analysis we can also identify emerging concepts within themes.
The strategic diagram (Figure 10) presents six clusters out of which two are motor themes (COVID-19 and emerging technologies), two are basic and transversal (fake news and communication), one is emerging or declining themes (false memory) and one is highly developed and isolated themes (freedom of expression).
The first cluster that contains motor themes is the one entitled COVID-19, with research on COVID-19 (276 items), Internet (145), coronavirus (89), infodemic (77), public health (74), pandemic (68), China (34), stigma (33), mental health (27), SARS-COVID-2 926), prevention (23), risk communication (22), health information (19), infoveillance (19), health literacy (19), patient education (19), anxiety (18), surveillance (18), women (17), risk perception (16), etc.
Many of the topics in this cluster have China as a major player in this new global disinformation order from at least two perspectives: surveillance capitalism [64,65] (that is, the ways in which technology—especially the Internet—is used for social control) and infodemia—information pandemic triggered by the virus pandemic [66].
Until the protests in Hong Kong in 2019, Chinese disinformation operations were carried out on domestic online platforms such as Weibo or WeChat. However, China’s growing interest then also spread to Facebook, Twitter or YouTube, which could or should be a wake-up call for targeted democracies [56].
In the context of the coronavirus pandemic, we are simultaneously facing an informational pathology with dramatic effects on the human psyche and, consequently, on its health [15]. Moreover, the infodemia and mistrust feed into each other, therefore disinformation can have devastating effects on society, causing division between groups, social tensions, weakening the rule of law and creating general confusion [67]. COVID-19 pandemic management, with all related syncopes, has generated a crisis of confidence (eroding public trust in a COVID-19 vaccine), a wave of skepticism fueled by COVID-19 misinformation narratives and conspiracy theories proliferating in social media [68]. In addition, as long as the crisis in health persists, the information war connected to it will also exist. In a joint statement, WHO, United Nations, UNICEF, UNESCO and other international organizations stressed the fact that only by reducing uncertainty can the effects of disinformation be limited [69]. Thus, the new study area is aimed at finding measures to strengthen resilience (personal and societal) in the context of the coronavirus pandemic [70].
The second cluster with motor themes, emerging media, must be understood in the context of online social networks and revolutionary technologies, which have fundamentally changed the way information is produced, consumed and transmitted: media (102 items), machine learning (86), fake news detection (66), deep learning (62), social network (52), natural language processing (49), artificial intelligence (35), sentiment analysis (32), classification (30), online social networks (28), data mining (27), reliability (20), transparency (18), privacy (18), advertising (17), text mining (17), rumor detection (17), crowdsourcing (16), text classification (15), blockchain (15).
Emerging media offer unlimited possibilities in terms of expression, participation, mobilization, but at the same time make way for disinformation, misinformation, confusion, division, polarization, etc. The new information disorder is organically linked to the media emergence and explosion, says the EU expert Alina Bârgăoanu [14]. They create the technological infrastructure that allows instant dissemination of fake news, fake visuals, opinions and interpretations that are disconnected from facts; and, above all, a lot of emotions are stirred [71].
In specialized literature we can already see a well-defined outline for studies that investigate the impact that artificial intelligence or virtual reality have in creating, detecting, spreading, stopping false content or misinformation, the use of narratives using machine learning, distorted deep fake interpretations, generation of computational propaganda campaigns, etc. [70,72,73]. Recently, because fighting this infodemic has become a significant challenge, researchers came with solutions for data analysis and fake news detection by applying emerging technologies such as Artificial Intelligence, Internet of Things, deep learning, blockchain, Neural Network, Fuzzy [74], machine learning algorithms [75] or chatbots [76].
Amid the global pandemic crisis, the importance of providing reliable information becomes increasingly crucial [77]. Emerging technologies (such as blockchain) could have an impact in filtering, combating or blocking fake news and deep fakes. Due to the traceability, transparency and decentralization nature [78,79], blockchain is going to revolutionize the way information is produced and distributed and will increase confidence by providing communications and media organizations and online users with trusted data tracking systems, ensuring a reliable way of verifying digital content, including video, and its source and history [80,81,82].
Basic and transversal themes are included in the fake news cluster, covering topics such as fake news (878 items), misinformation (683), social media (662), disinformation (343), Twitter (178), social networks (110), post-truth (110), journalism (96), media literacy (79), Facebook (77), propaganda (75), fact-checking (60), trust (60), democracy (54), information literacy (49), credibility (49), climate change (41), etc.
In the post-truth era, communication takes forms and channels of manifestation that we are just beginning to identify and understand [8,79]. So, in this cluster we find dominant themes which try to pin down “the new informational disorder”, the changes, and even malformations affecting the current informational ecosystem, from politics, economy, environment, health to society, culture, journalism, science, education and technology. However, we also find research on very narrow or new topics (either due to technology, or to the pandemic context), such as the blockchain approach for detecting and blocking fake news in social networks [81,82], data deficits on social media [68,83], cognition security [84], misinfodemics [85,86], etc.
Nevertheless, fake news should be annihilated by cultivating media literacy [87] and information literacy [88], by sharpening critical thinking and the ability to decode messages [89]. However, in the current context of “infobesity”, “infoxication”, “infosaturation” or “data smog” [90,91,92], more and more people are actually overwhelmed when it comes to assessing the credibility and importance of content they come in contact with for the first time in the online environment [91]. A solution to navigate more easily through the “information jungle” [93] would be to use critical thinking abilities, as well as abilities to critically ignore information [70,94].
Less studied topics that have potential for future research identified in this cluster are combating misinformation through nudging [95,96] or manipulation via TikTok [97]. Manipulation is possible on all platforms, but of all the social networks, TikTok, a platform with many children and young people among its users, is the most vulnerable to fake news and disinformation [98,99].
The second cluster with basic and transversal themes is health communication, and it includes topics about disinformation as a risk to public health (misleading health information, false claims, conspiracy theories, patient protection fraud, etc.): communication (88 items), vaccination (62), health communication (54), education (51), infodemiology (35), ethics (37), qualitative research (36), contraception (31), vaccines (28), pregnancy (28), abortion (27), vaccine hesitancy (27), attitudes (24), reproductive health (24), adolescents (24), immunization (23), HIV (23), nutrition (21), vaccine (21), regulation (19), gender (18), news media (18), information dissemination (18), misconceptions (18), etc.
Since March 2020 we have been fighting the COVID-19 pandemic. Huge efforts have been made to study and find the vulnerabilities of this new coronavirus, to develop an effective vaccine, but also to stop the spread of misinformation about the harmful consequences of vaccination [67,68,74]. It has never been clearer that communication is an important public intervention in health [70].
Whether true or false, excessive amounts of information can negatively affect people’s health, increasing stress and possibly causing people to accept advice that could be dangerous [29]. However, this is not a new problem, even though online misinformation, with and without public health intent, has become a major political and societal problem in the current context of the coronavirus pandemic [31]. We have witnessed over the years the erroneous, unclear, misleading or false communication of health-related information on topics such as diet and fitness, contraception and pregnancy, especially among vulnerable groups such as children, adolescents and young people, who face a higher risk to be misled [100]; promoting false remedies and wrong beliefs for terminal or chronic illnesses such as cancer or smoking [30,101]; anti-vaccine propaganda [102]; spreading false narratives about the pharmaceutical and beauty industry [103]; fueling misconceptions about HIV, AIDS, Ebola or Zika [104], etc.
So far, research [30,31,77] has shown that false or misleading discourse regarding health information comes in various forms that require different reactions. New topics of interest are those related to mental and psychosocial health during and after the pandemic [105] or the way in which online platforms and social networks will handle these threats [106]. A solution may come from infodemiology that aims to study how best to manage these threats [16,107]. In theory, this can also be achieved by providing clear information that can help the public better understand the current situation of media literacy. For example, in a recent study [55] that examines how COVID-19 vaccine rumors and conspiracy theories circulate on online platforms, the authors suggest that by tracking COVID-19 vaccine misinformation in real time and engaging with social media to disseminate correct information could help the public against misinformation. At the same time, as [108] show, a better understanding of the relationship between public emotions and rumors during the epidemic may help generate useful strategies for guiding public emotions and dispelling rumors. Moreover, the authorities should more clearly communicate the necessity of the measures taken to combat the current crisis, such as the use of web-based monitoring methods to guide public emotions and behavior [108]. The cluster comprising emerging or declining themes was named false memory because of the subjects it covers: memory (120 items), false memory (108), misinformation effect (70), eyewitness memory (66), suggestibility (64), children (45), eyewitness testimony (37), rumor (35), memory conformity (31), source monitoring (29).
Many themes in this cluster stem from the research of Elizabeth Loftus, a psychologist and expert in human memory, who has conducted numerous studies trying to explain the sensitivity of memory to distortion [109,110]. She demonstrated through a series of experiments that false memories can be induced through suggestion, and this can be achieved relatively easily. Loftus has been studying false memories since the 1970s, and her work has revealed the serious consequences that disinformation can have on memory. She also showed that these memories can become stronger and more vivid over time [49]. In some cases, the original memory may even be modified to incorporate new information or experiences [111]. Moreover, a false memory transmitted during a criminal testimony can lead to an innocent person being convicted of a crime [112].
In more recent studies, Murphy et al. [113] highlighted that exposure to propaganda may include false memories or push polls exposure increase false memories for fake news. Surprisingly, people with exceptional memory are still likely to do things without realizing it [114]—an aspect that still needs in-depth research—which explains why this cluster is in both the emerging and declining area.
A new research theme (multidisciplinary research field) has emerged, cognition security, which investigates the intrinsic propagation and cognition mechanisms of fake news [84]. In addition, recent studies on memory and cognitive processes [115] try to explain how this type of information works on individuals and what makes them so easily attracted and determined to believe what they are told.
Due to an increase in disinformation, misinformation and fake news during the coronavirus pandemic, Greenspan and Loftus [105] suggest that it is more important than ever to understand the factors that influence the development of false memories [70]. For example, the study by Greene and Murphy [116] measures the susceptibility to false memories that follows exposure to fabricated news stories about the pandemic or the work of Murphy and Flynn [117] which studies how deep fake videos may distort memory for public events.
The cluster highly developed and isolated themes is grouped around freedom of expression (15 items) and also includes authoritarianism (14), Indonesia (14), censorship (14), television (10), Middle East (8), immigration (8), public diplomacy (8), soft power (7), Iran (7), free speech (7), digital technologies (6), political economy (6), human rights (6), copyright (6), Malaysia (5).
We also encounter topics about “computational propaganda” used as a tool for controlling information, weaponization of information and social media, COVID-19 as a political weapon [62] and misinformation in the post-truth era as part of the hybrid arsenal of authoritarian states for which social media has become an associated working tool [32,33,79]. Other issues address authoritarian states such as Iran, some states in the Middle East, or less developed, more politically and economically fragile countries (e.g., Malaysia, Indonesia) where human rights are violated, and which have found an opportunity to carry out social media and social networks campaigns to promote their regimes and silence their dissidents [56].
Another interesting topic is connected to deep fakes and how they affect the democratic process, whereby constant contact with misinformation causes users to lose confidence in what they see and hear, leading to a phenomenon in which individuals will look at everything around them as false information [70]. In this way, the security of the individual, the attribution of words and personal identity are subject to an increasing number of threats.
Because in an information-dominated society, situations of information pollution are not excluded, the individual’s ability to find some order in the information chaos (real or apparent), to control information through selection, ranking, processing, to identify and eliminate irrelevant, eroded or useless elements, becomes a necessary feature, without which the question of his freedom could not be posed [79]. Therefore, this cluster not only launches new topics for discussion but also invites us to reflect on the limits of freedom in an era dominated by digital technologies, whose development seems to have no other limit than that of time.
On the other hand, as we can see in Figure 11, the field of ID is maturing, with varied research themes in different periods, with the one connected to the coronavirus being in a development stage. The same holds true for deep learning and fact checking (online news) because of the rapid progress of technology. It is clear from the diagram that the term “fake news” started gaining in popularity in 2016, when presidential elections took place in the United States. Later it began to be used frequently by experts in political communication, international relations and security studies, with references to Russian disinformation campaigns (Russia’s involvement in the internal affairs of some Central and Eastern European states, as well as in the presidential elections in the United States, on vaccines, etc.).
5.3. Intellectual Structure of Knowledge Analysis
De Bellis [43] stressed the fact that the citation and co-citation networks among scientific documents in a specialized area over a given period of time may be thought to reflect its socio-cognitive structure and evolution. Therefore, by taking citations into account as indicators of usage and visibility, we were able to assess the structure of the essential part of fundamental literature on ID regarding important documents, authors, and journals. At the same time, citation context analysis gave us useful perspectives on the performance of certain scholars and research groups concerning the impact citations have on researchers’ work. From Figure 12 one can notice that, after 2016, there has been a very rapid increase in the number of citations, which confirms both the researchers’ growing interest and the evolution of the field.
The most cited author is Professor Brendan Nyhan, Dartmouth College, whose research focuses on misperceptions and conspiracy theories about politics and health care, political communication and the media, political scandal and corruption (Table 2). At the time of writing this paper, 49 documents co-authored by professor Nyhan that have 4498 citations are included in WoS. However, it is important to note that in our collection, the author with the most published papers (Loftus) has the highest h index (21) and g index (44). However, in a recent large scale-study, Koltun and Hafner [118] suggest that the “h-index is no longer an effective correlate of scientific reputation” and should be reconsidered.
On the other hand, if we are looking at global citations, the first position in the top 10 most globally cited documents is occupied by Meyers’ paper from 1997, with 1294 global citations. The paper [119], published in Organic Geochemistry (journal that appears in the top 10 most cited journals only with this paper—see Table 6), talks about how the magnitude of the diagenesis can be a potential source of misinformation, and the author stresses the idea that it “must always be considered and evaluated”. Although the paper addresses an information disorder, namely misinformation, it is a niche (a very specialized, narrow field). So, we can ask ourselves: “It is really an impactful paper (in our analysis)?” Basically, Meyers’ presence demonstrates that, for many documents, a large part of global citations could come from other disciplines. Therefore, by looking at local citations we can measure the impact of a document in the analyzed collection.
Browsing the most cited papers (Table 3) provided a very quick understanding of ID mainstream related research and its major trends. The most cited papers belong to economists Hunt Allcott (New York University) and Matthew Gentzkow (Stanford University). In their study [120], they estimated an ordinary US adult consumed one to three fake news in the months leading up to the 2016 presidential election. They also identified other practices that could be likened to fake news, such as journalistic errors, the spread of clearly unreasonable rumors, the spread of conspiracy theory, political satire, unfounded or false statements made by politicians and electoral contestants or journalistic content that is not false, but is created in a way that confuses voters.
In terms of relative impact of countries, American research was outstanding with 52.72% of all citations referencing papers from the USA (52,015 citations) with an average article citation of 16.079. Interestingly, Iraq has only 10 papers but leads in the top of average citations per year (34.5).
The most cited institution is the University of Michigan, as a leader in research, learning and teaching for more than 200 years (Table 4). According to the Times Higher Education University ranking [121], University of Michigan is ranked 15th in the World Reputation Rankings 2020. This could be due to Meyers’ affiliation with the University of Michigan and with the fact that some of the most cited authors, such as Brendan Nyhan or Professors Lewandowsky and Ecker, either worked for a time at the University of Michigan or they wrote in collaboration with authors affiliated to this university [53,122].
After analyzing the dispersion of journal citations, we found that the journal with the greatest influence on the field is Applied Cognitive Psychology (Table 5). The most cited journal entry in our dataset belongs to Hyman et al. [123]. It is about false memories of childhood experiences and has 271 citations. It is followed by Loftus et al. [124], with a paper about individual differences in memory and suggestibility.
The analysis of co-citation was first presented by Small in 1973 in [36] and since then it has been the dominant method for creating bibliometric maps. A special case of co-citation analysis is “author co-citation analysis”, in which the analyzed units are authors. This method has also been applied for the analysis of journal co-citation (in which case the analyzed units are journals) and cited references (in which case the analyzed units are papers in bibliographic association). The power of co-citation and the power of bibliographic association express the resemblance between two journals, two authors or two documents, as reflected by the authors’ reference system. All three forms of co-citation analysis were applied in this study. The resulting maps can be interpreted as follows: a long distance between points representing objects corresponds to a weak resemblance and vice versa.
The author with the biggest impact is Elizabeth Loftus. However, we can notice in Figure 13 that the ID phenomenon is examined by various specialists, bringing together experts from different fields or with similar specializations who have common research interests. To paraphrase Lazer et al. [125], addressing ID news requires a multidisciplinary effort, which is classified in five clusters:
- The red cluster, oriented towards political psychology, behavioral economics, behavioral science, includes Lewandowsky Stephen, Allcott Hunt, Nyhan Brendan, Gordon Pennycook and organizations such as WHO and the European Commission.
- The green cluster is dominated by cognitive psychology, false memory and has authors such as Elizabeth Loftus, Henry L. Roediger, Daniel B. Wright or Lindsay D. Stephen.
- The blue cluster is more oriented towards computer science, artificial intelligence, deep learning, machine learning, social computing, with researchers such as Soroushi Vosoughi, Kai Shu, Suhang Wang, etc.
- The yellow cluster is focused on developmental psychology, human cognition, consumer psychology, having Stephen J. Ceci, Charles J. Breinerd, Merrie Brucks as central scholars.
- The purple cluster groups together topics connected to cognitive science and memory and includes researchers such as Ullrich K. H. Ecker, Johnson H.M. and Marsj E.J.
It is no coincidence that we find WHO in the red cluster, since it is an organization responsible for managing global health issues, setting the health research agenda, setting norms and standards and developing evidence-based policies. In the current global COVID-19 crisis, researchers ground their studies on data and information provided by WHO and other institutions, such as the European Commission.
The most influential work (Table 6) is written by Vosoughi, Roy and Aral [72], who studied behaviors of spreading fake news on Twitter. Their research suggests that disinformation spreads further, faster and deeper than the truth in all categories of information because of perceived novelty and the ability to inspire fear, disgust and surprise.
A more visualized representation of relationships among prolific scholars, references they cite and keywords they use is shown in Figure 21, a three-fields plot. The left-most column represents the references the top authors cite, the middle column shows scholars’ names contributing the most to the research in the field of ID and the right-most column represents the most used keywords used by the authors.
Taking into consideration the height of the boxes and the thickness of the connecting lines (the taller the box, the more significant and the thicker the lines’ correlation, the more information or volume of work was produced [54]), the above diagram emphasizes the central research content as misinformation, social media, communication and fake news with emerging topics as infodemic, pandemic, coronavirus and COVID-19.
In Figure 14 we can see that the essential part of the intellectual base really belongs to ID research in fields such as health, communication, politics, technology and psychology, with several journals placed in the center of the map and less cited and co-cited journals in more peripheral positions. VoSViewer identified four major clusters. In each of them we can distinguish a core publication around which the others gravitate:
- The red cluster (287 items) includes journals from the medical/health area such as LANCET (1524), Nature (1112), J. Med. INTERNET RES. (1279), Vaccine (1509), BMJ-BRIT. MED. J. (803) or JAMA-J. AM. MED. ASSOC. (1395).
- The green cluster (267 items) focuses more on communication, political sciences and economics, and includes NY Times (1765), Forbes, BBC, ABC News, Business Insider, Corriere della Sera, Economist, El Mundo, Financial Times, Foreign Policy, Gallup, Guardian and journals such as J. Commun. (1507), Digit. Journal (971), J. ECON. PERSPEC. (722), Harvard Law Review (90), etc.
- The blue cluster (236 items) is oriented towards technology and sciences and comprises: SCIENCE (2711), PLoS ONE (2327), Comput. Hum. Behav. (1137), P. Natl. Acad. Sci. USA (1564).
- The yellow cluster (210 items) focuses on different aspects of psychology and includes Appl. Cognitive Psych. (2522), Mem. Cognition (2311), J. Exp. Psychol. Learn. (2022), J. Pers. Soc. Psychol. (1675) and J. Exp. Psychol. Gen. (1528).
Among the most co-cited sources, there are both high impact journals such as Science, Appl Cognitive Psych or Lancet, and journals dedicated to a particular field of research such as allergology (Journal of Allergy and Clinical Immunology—126; Clinical & Experimental Allergy—46; Allergy—34; Pediatric Allergy and Immunology—21).
5.4. Social Structure of Knowledge Analysis
The social structure shows how authors, institutions or countries relate to others in the field of scientific research of information disorders. As one can see from Figure 15, there are some cooperation patterns between the topmost productive and cited authors, but in general these research communities are islands of cooperation.
There is a need for a global cooperative effort among researchers and institutions to produce studies that help expose the harmful impact of fake news, mis- and disinformation and to propose potential remedies. In our set, co-authors per document is 3.05 and collaboration index 3.02. Authors that have co-authored also tend to be located close to each other on the map. Eleven collaborative groups were found.
From Figure 16 we can see that in each cluster there are some core countries. By looking at the clusters placed further from the core countries, such as the one which includes Austria, Czech Republic, Slovakia, Poland, Hungary, Romania or Ukraine, we notice that the geographical advantage (they are all countries from Central and Eastern Europe) is not a primary factor that influences collaborations and relationships and that disinformation, misinformation and fake news are fields of interest for researchers all over the world, with research themes waiting to be developed further (e.g., how geopolitics is shaping online communities’ responses to the pandemic or what is the impact of religious misinformation in Latin America). These results are similar with those of Abu Arquob et al. [26] and Jancowski [51] who suggest that there are some regions, such as Africa and South America, where research on ID has not been conducted and further studies need to be carried out.
Regarding the collaborative research aspects, our study’s results can be summed up as follows: There were some collaboration patterns between the highly cited, most productive authors, countries tended to work together for a core-country, and regional cooperation among institutions predominated. Most of all, we need to create collaboration mechanisms that involve not only higher education institutions and research units, but also monitoring organizations, experts in the field, social media platforms, government and decision makers [11] to make sure that data deficits can be identified early on and replaced with accessible, evidence-based information [83]. These results are in line with those of Skarzauskiene et al. [126], who argue that in this way the successful spread of harmful narratives can be prevented.
5.5. Limits and Suggestions for Further Research
The data we analyzed provided interesting insights on research about ID: the number of publications, authors, and journals has increased, research on ID has earned considerable attention in multiple academic fields, there are more and more works written in collaboration by people from different parts and cultures of the world, etc.
Nevertheless, there are some limitations that should be acknowledged: (a) Our study was based on a sample of documents from WoS (there are other databases that should be explored); (b) There are other terms related to the subject of this study which can be taken into consideration, such as “misinfodemics” or “viral misinformation” [85,106]; (c) Following the analysis of the complete data set covering the period 1975—present, we made an overview of the field, considering the impact of documents, authors and how publication in journals changes over time; (d) Regarding institutions, we did not separately analyze the affiliation of authors to private and public institutions, academic or non-academic ones; (e) We did not insist on the type of journals (open access or non-open access), nor on the publishers. For example, we did not focus on predatory publishing. Considered "the fake news of science", predatory practices represent not only a global threat to quality science, but they also particularly affect young students and researchers). Bibliometrics is not designed to evaluate research performance directly, so this type of analysis should be accompanied by qualitative analysis as well.
However, these limitations can be seen as pathways for future research. The co-occurrence analysis indicates there are important, highly specialized, niche topics or less prominent key aspects that are less researched and are awaiting contributions. Here are some examples identified by us, with some of them being mentioned in other studies as well [6,12,70,125,127]: the impact of religious misinformation in different countries; how to develop literacy programmes to combat mis-, mal- or disinformation; what are the psychological consequences of mal- or non-information; what are the implications of artificial intelligence that enables fake news creation and sharing (deep fake techniques); how new technologies such as blockchain can prevent digital disinformation; what are the effects of information overabundance or of the information vacuum; how data analytics and open-source tools can be used to identify misinformation and disinformation networks; individual security and cognitive security; combating misinformation through nudging; how to build resilience to misinformation.
Similarly, we need to understand the infodemic if we are going to address it. Questions to be asked before the next infodemic occurs [128]: how geopolitical and nationalist narratives are influencing online communities regarding medical cures; how to debunk false information especially on social media; how to measure, post-pandemic, the effects of misinformation on the mental health of the population; what ways are there to identify “data deficits” and “data voids” in order to prevent the spread of medical disinformation narratives [83,129]; how to build our mental (and therefore social) resilience [70], etc.
6. Conclusions
This paper conducted a comprehensive quantitative analysis and evaluation of the literature on the complexity of ID in the Web of Science Core Collection database from 1975 to June 2021. The goal of this study was to map an overall picture of the topic from a global perspective, clarify the knowledge framework of research in this field, examine the development dynamics, identify future research directions and enrich understanding of the research on ID. Three types of bibliometric indicators were used: quantity indicators (for measuring productivity), quality indicators (for measuring the impact) and structural indicators (for measuring the connections). A network analysis (i.e., co-keyword analysis, co-authorship analysis and co-citation analysis) was also performed and major clusters of the information disorders research were identified.
We witnessed a significant development in a range of disciplines (history, media and communication, education, psychology, philosophy, health, economics, environment, etc.) with contributions to research made by a big number of authors (26,242). The co-occurrence of author keywords demonstrates a substantial diversity and a significant variety of published ID literature, with a remarkable increase in research on distorted narratives, misleading interpretations, the negative influence of false content on human behavior, the effects of exposure to fake news about COVID-19 on social media, how digital platforms combat misinformation, etc. On the other hand, addressing news reports that disseminate false information requires a multidisciplinary effort. After 2016, there has been a rapid increase in the number of citations, which confirms both the researchers’ growing interest and the evolution of the field. We also identified emerging concepts within themes included in six clusters, out of which two are motor themes (COVID-19 and emerging technologies), two are basic and transversal (fake news and communication), one is emerging or declining themes (false memory) and one is highly developed and isolated themes (freedom of expression).
Undoubtedly, the digital revolution has brought with it a series of information disorders which affect each and every one of us. We are witnessing a true technocalypse, in which the truth is contested, denied, settled, judged, condemned with ferocity [130]. Hence, several questions remain: What is the truth? What does communication look like from the perspective of technological evolution? What is the influence of literature? What is new and what is true about mis-, mal- and disinformation? How much does fake news and disinformation affect our daily existence? What news has the biggest impact and in what way? How serious is the problem of ID, of informational pathologies? What makes people accept and distribute fake news and what can be done against misinformation? How do opinions influence public health messages? How do we build psychological “immunity” against online mis- and disinformation? etc. All these and others demand a reformulation of the research framework and a common effort of the whole society.
In conclusion, based on our findings, we believe that this paper makes important contributions to the literature, not only by providing researchers and practitioners with a coherent and perceptible intellectual basis to find answers, but also by bringing valuable insights for further investigation and future research directions.
Author Contributions
Conceptualization, G.G. and R.B.; methodology, L.T. and G.G.; software, G.G. and C.H.; validation, L.M., C.H., R.B. and G.G.; formal analysis, G.G., L.T. and R.B.; investigation, G.G. and C.H.; resources, L.M. and G.G.; data curation, G.G. and C.H.; writing—original draft preparation, G.G.; writing—review and editing, G.G., R.B. and C.H.; visualization, L.T., C.H. and G.G.; supervision, G.G. All authors have read and agreed to the published version of the manuscript.
Funding
This research was partially funded by Erasmus+, grant number 611623-EPP-1-2019-1-RO-EPPJMO-MODULE.
Conflicts of Interest
The authors declare no conflict of interest. The funders had no role in the design of the study; in the collection, analyses, or interpretation of data; in the writing of the manuscript; or in the decision to publish the results.
References
- Cho, P.J. ‘Infollution’ and the Quality of Life. Available online: http://stanford.edu/~ncho/Infollution_manuscript_PJCho_2002.pdf (accessed on 31 July 2021).
- Cai, K.Y.; Zhang, C.Y.; IEEE. Towards a research on information pollution. In Proceedings of the 1996 IEEE International Conference on Systems, Man and Cybernetics. Information Intelligence and Systems (Cat. No.96CH35929), Beijing, China, 14–17 October 1996; pp. 3124–3129. [Google Scholar] [CrossRef]
- Orman, L. Fighting Information Pollution with Decision Support Systems. J. Manag. Inf. Syst. 1984, 1, 64–71. [Google Scholar] [CrossRef]
- Bray, D.A. Information Pollution, Knowledge Overload, Limited Attention Spans, and Our Responsibilities as IS Professionals. In Proceedings of the Global Information Technology Management Association (GITMA) World Conference, Paris, France, 22–24 June 2008. [Google Scholar] [CrossRef]
- Wardle, C.; Derakhshan, H. Information Disorder Toward an Interdisciplinary Framework for Research and Policymaking; Strasbourg. Available online: https://rm.coe.int/information-disorder-report-november-2017/1680764666 (accessed on 31 July 2021).
- Meel, P.; Vishwakarma, D.K. Fake news, rumor, information pollution in social media and web: A contemporary survey of state-of-the-arts, challenges and opportunities. Expert Syst. Appl. 2020, 153, 112986. [Google Scholar] [CrossRef]
- Wang, N.; Jiang, K.; Meier, R.; Zeng, H. Information Filtering against Information Pollution and Crime. In Proceedings of the 2012 International Conference on Computing, Measurement, Control and Sensor Network, Taiyuan, China, 7–9 July 2012; pp. 45–47. [Google Scholar] [CrossRef]
- Lewandowsky, S.; Ecker, U.K.H.; Cook, J. Beyond Misinformation: Understanding and Coping with the “Post-Truth” Era. J. Appl. Res. Mem. Cogn. 2017, 6, 353–369. [Google Scholar] [CrossRef] [Green Version]
- Pennycook, G.; Rand, D.G. The Psychology of Fake News. Trends Cogn. Sci. 2021, 25, 388–402. [Google Scholar] [CrossRef]
- Wardle, C. Understanding Information Disorders. FirstDraft Report. Available online: https://firstdraftnews.org/wp-content/uploads/2019/10/Information_Disorder_Digital_AW.pdf?x76701 (accessed on 31 July 2021).
- Kapantai, E.; Christopoulou, A.; Berberidis, C.; Peristeras, V. A systematic literature review on disinformation: Toward a unified taxonomical framework. New Media Soc. 2021, 23, 1301–1326. [Google Scholar] [CrossRef]
- Frau-Meigs, D. Information Disorders: Risks and Opportunities for Digital Media and Information Literacy? Media Stud. 2019, 10, 10–28. [Google Scholar] [CrossRef]
- Wardle, C. Information Disorder: The Essential Glossary, Shorenstein Center on Media, Politics, and Public Policy. Harvard Kennedy School. Available online: https://firstdraftnews.org/wp-content/uploads/2018/07/infoDisorder_glossary.pdf (accessed on 31 July 2021).
- Bârgăoanu, A. Fake News. Noua Cursă a Înarmării; Evrika Publishing: Bucuresti, Romania, 2018. [Google Scholar]
- Hansson, S.; Orru, K.; Torpan, S.; Back, A.; Kazemekaityte, A.; Meyer, S.F.; Ludvigsen, J.; Savadori, L.; Galvagni, A.; Pigree, A. COVID-19 information disorder: Six types of harmful information during the pandemic in Europe. J. Risk Res. 2021, 24, 380–393. [Google Scholar] [CrossRef]
- Zarocostas, J. How to fight an infodemic. Lancet 2020, 395, 676. [Google Scholar] [CrossRef]
- World Health Organization. Novel Coronavirus(2019-nCoV). Situation Report. Available online: https://www.who.int/docs/default-source/coronaviruse/situation-reports/20200202-sitrep-13-ncov-v3.pdf (accessed on 31 July 2021).
- Vraga, E.K.; Bode, L. Defining Misinformation and Understanding its Bounded Nature: Using Expertise and Evidence for Describing Misinformation. Political Commun. 2020, 37, 136–144. [Google Scholar] [CrossRef]
- Gutierrez-Salcedo, M.; Martinez, M.A.; Moral-Munoz, J.A.; Herrera-Viedma, E.; Cobo, M.J. Some bibliometric procedures for analyzing and evaluating research fields. Appl. Intell. 2018, 48, 1275–1287. [Google Scholar] [CrossRef]
- Ball, R. An Introduction to Bibliometrics: New Development and Trends; Chandos Publishing: Amsterdam, The Netherlands, 2017. [Google Scholar]
- Andres, A. Measuring Academic Research: How to Undertake a Bibliometric Study; Chandos Publishing: Amsterdam, The Netherlands, 2009. [Google Scholar]
- Ha, L.; Perez, L.A.; Ray, R. Mapping Recent Development in Scholarship on Fake News and Misinformation, 2008 to 2017: Disciplinary Contribution, Topics, and Impact. Am. Behav. Sci. 2021, 65, 290–315. [Google Scholar] [CrossRef]
- Dalessandro, R.C.; Veronez Junior, W.R.; Castanha, R.G. A produção científica relacionada a fake news: Uma análise bibliométrica na base de dados Scopus. Rev. Conhecimento Ação 2020, 5, 2–16. [Google Scholar] [CrossRef]
- Park, A.; Montecchi, M.; Feng, C.M.; Plangger, K.; Pitt, L. Understanding ‘Fake News’: A Bibliographic Perspective. Def. Strateg. Commun. 2020, 8, 141–172. [Google Scholar] [CrossRef]
- Lee, S.; Nah, K. A Counterattack of Misinformation: How the Information Influence to Human Being. Intell. Hum. Syst. Integr. 2020, 1131, 600–604. [Google Scholar] [CrossRef]
- Abu Arqoub, O.; Elega, A.A.; Ozad, B.E.; Dwikat, H.; Oloyede, F.A. Mapping the Scholarship of Fake News Research: A Systematic Review. J. Pract. 2020, 1–13. [Google Scholar] [CrossRef]
- Alonso García, S.; Gómez García, G.; Sanz Prieto, M.; Moreno Guerrero, A.J.; Rodríguez Jiménez, C. The Impact of Term Fake News on the Scientific Community. Scientific Performance and Mapping in Web of Science. Soc. Sci. 2020, 9, 73. [Google Scholar] [CrossRef]
- Wang, C.-C. Fake News and Related Concepts: Definitions and Recent Research Development. Contemp. Manag. Res. 2020, 16, 145–174. [Google Scholar] [CrossRef]
- Bin Naeem, S.; Bhatti, R.; Khan, A. An exploration of how fake news is taking over social media and putting public health at risk. Health Inf. Libr. J. 2021, 38, 143–149. [Google Scholar] [CrossRef]
- Wang, Y.X.; McKee, M.; Torbica, A.; Stuckler, D. Systematic Literature Review on the Spread of Health-related Misinformation on Social Media. Soc. Sci. Med. 2019, 240, 112552. [Google Scholar] [CrossRef]
- Pool, J.; Fatehi, F.; Akhlaghpour, S. Infodemic, Misinformation and Disinformation in Pandemics: Scientific Landscape and the Road Ahead for Public Health Informatics Research. Stud. Health Technol. Inform. 2021, 281, 764–768. [Google Scholar] [CrossRef]
- Chaudhari, D.D.; Pawar, A.V. Propaganda analysis in social media: A bibliometric review. Inf. Discov. Deliv. 2021, 49, 57–70. [Google Scholar] [CrossRef]
- Tal, D.; Gordon, A. Propaganda as a research field: A bibliometric study. Scientometrics 2020, 122, 741–750. [Google Scholar] [CrossRef]
- Wang, Z.Y.; Zhao, H.L.; Nie, H.F. Bibliometric Analysis of Rumor Propagation Research Through Web of Science from 1989 to 2019. J. Stat. Phys. 2020, 178, 532–551. [Google Scholar] [CrossRef]
- Oliveira, O.J.d.; da Silva, F.F.; Juliani, F.; Ferreira, L.C.M.B.; Nunhes, T.V. Bibliometric Method for Mapping the State-of-the-Art and Identifying Research Gaps and Trends in Literature: An Essential Instrument to Support the Development of Scientific Projects. In Scientometrics Recent Advances; Kunosic, S., Zerem, E., Eds.; IntechOpen: London, UK, 2019. [Google Scholar]
- Grosseck, G.; Tiru, L.G.; Bran, R.A. Education for Sustainable Development: Evolution and Perspectives: A Bibliometric Review of Research, 1992–2018. Sustainability 2019, 11, 6136. [Google Scholar] [CrossRef] [Green Version]
- Moral-Munoz, J.A.; Herrera-Viedma, E.; Santisteban-Espejo, A.; Cobo, M.J. Software tools for conducting bibliometric analysis in science: An up-to-date review. Prof. Inf. 2020, 29, e290103. [Google Scholar] [CrossRef] [Green Version]
- AlRyalat, S.A.S.; Malkawi, L.W.; Momani, S.M. Comparing Bibliometric Analysis Using PubMed, Scopus, and Web of Science Databases. Jove J. Vis. Exp. 2019, e58494. [Google Scholar] [CrossRef]
- Singh, V.K.; Singh, P.; Karmakar, M.; Leta, J.; Mayr, P. The journal coverage of Web of Science, Scopus and Dimensions: A comparative analysis. Scientometrics 2021, 126, 5113–5142. [Google Scholar] [CrossRef]
- Page, M.J.; McKenzie, J.E.; Bossuyt, P.M.; Boutron, I.; Hoffmann, T.C.; Mulrow, C.D.; Shamseer, L.; Tetzlaff, J.M.; Akl, E.A.; Brennan, S.E.; et al. The PRISMA 2020 statement: An updated guideline for reporting systematic reviews. J. Clin. Epidemiol. 2021, 134, 178–189. [Google Scholar] [CrossRef]
- Garfield, E.; Sher, I.H. Keywords-Plus (TM)—Algorithmic Derivative Indexing. J. Am. Soc. Inf. Sci. 1993, 44, 298–299. [Google Scholar] [CrossRef]
- Zhang, J.; Yu, Q.; Zheng, F.S.; Long, C.; Lu, Z.X.; Duan, Z.G. Comparing keywords plus of WOS and author keywords: A case study of patient adherence research. J. Assoc. Inf. Sci. Technol. 2016, 67, 967–972. [Google Scholar] [CrossRef]
- De Bellis, N. Bibliometrics and Citation Analysis: From the Science Citation Index to Cybermetrics; Scarecrow Press, Inc.: Lanham, MD, USA, 2009. [Google Scholar]
- Aria, M.; Cuccurullo, C. Bibliometrix: An R-tool for comprehensive science mapping analysis. J. Informetr. 2017, 11, 959–975. [Google Scholar] [CrossRef]
- van Eck, N.J.; Waltman, L. Software survey: VOSviewer, a computer program for bibliometric mapping. Scientometrics 2010, 84, 523–538. [Google Scholar] [CrossRef] [Green Version]
- Hernon, P. Disinformation and misinformation through the Internet—Findings of an Exploratory Study. Gov. Inf. Q. 1995, 12, 133–139. [Google Scholar] [CrossRef]
- Anderson, C.A.; Lepper, M.R.; Ross, L. Perseverance of Social Theories—The Role of Explanation in the Persistence of Discredited Information. J. Personal. Soc. Psychol. 1980, 39, 1037–1049. [Google Scholar] [CrossRef] [Green Version]
- Reber, R.; Schwarz, N. Effects of perceptual fluency on judgments of truth. Conscious. Cogn. 1999, 8, 338–342. [Google Scholar] [CrossRef] [PubMed] [Green Version]
- Loftus, E.F. Creating false memories. Sci. Am. 1997, 277, 70–75. [Google Scholar] [CrossRef] [PubMed]
- Slater, T. The Myth of “Broken Britain”: Welfare Reform and the Production of Ignorance. Antipode 2014, 46, 948–969. [Google Scholar] [CrossRef] [Green Version]
- Jankowski, N.W. Researching Fake News: A Selective Examination of Empirical Studies. Javn. Public 2018, 25, 248–255. [Google Scholar] [CrossRef]
- Chan, M.P.S.; Jones, C.R.; Jamieson, K.H.; Albarracin, D. Debunking: A Meta-Analysis of the Psychological Efficacy of Messages Countering Misinformation. Psychol. Sci. 2017, 28, 1531–1546. [Google Scholar] [CrossRef]
- Lewandowsky, S.; Ecker, U.K.H.; Seifert, C.M.; Schwarz, N.; Cook, J. Misinformation and Its Correction: Continued Influence and Successful Debiasing. Psychol. Sci. Public Interest 2012, 13, 106–131. [Google Scholar] [CrossRef]
- Agbo, F.J.; Oyelere, S.S.; Suhonen, J.; Tukiainen, M. Scientific production and thematic breakthroughs in smart learning environments: A bibliometric analysis. Smart Learn. Environ. 2021, 8, 1–25. [Google Scholar] [CrossRef]
- Islam, S.; Kamal, A.-H.M.; Kabir, A.; Southern, D.L.; Khan, S.H.; Hasan, S.M.M.; Sarkar, T.; Sharmin, S.; Das, S.; Roy, T.; et al. COVID-19 vaccine rumors and conspiracy theories: The need for cognitive inoculation against misinformation to improve vaccine adherence. PLoS ONE 2021, 16, e0251605. [Google Scholar] [CrossRef] [PubMed]
- Guo, L. China’s “Fake News” Problem: Exploring the Spread of Online Rumors in the Government-Controlled News Media. Digit. J. 2020, 8, 992–1010. [Google Scholar] [CrossRef]
- Kadam, A.B.; Atre, S.R. Negative impact of social media panic during the COVID-19 outbreak in India. J. Travel Med. 2020, 27, taaa057. [Google Scholar] [CrossRef] [Green Version]
- World Health Organization. WHO Coronavirus (COVID-19) Dashboard. Available online: https://covid19.who.int/?gclid=Cj0KCQjw3f6HBhDHARIsAD_i3D9GspGXgBPqLB9ix0VEQjjQw18kEanlSa43EzjocnwuUVKySNMH1ocaAvqQEALw_wcB (accessed on 31 July 2021).
- Siddiqui, N. Who do you believe? Political parties and conspiracy theories in Pakistan. Party Politics 2018, 26, 107–119. [Google Scholar] [CrossRef]
- Ahmed, M.; Riaz, M.Q.; Qamar, M.; Asghar, R. Fake News Shared on WhatsApp During Covid-19: An Analysis of Groups and Statuses in Pakistan. Media Educ. Mediaobrazovanie 2021, 17, 4–17. [Google Scholar] [CrossRef]
- Alves, J.L.; Weitzel, L.; Quaresma, P.; Cardoso, C.E.; Cunha, L. Brazilian Presidential Elections in the Era of Misinformation: A Machine Learning Approach to Analyse Fake News. In Progress in Pattern Recognition, Image Analysis, Computer Vision, and Applications (Ciarp 2019); Springer: Berlin/Heidelberg, Germany, 2019; Volume 11896, pp. 72–84. [Google Scholar] [CrossRef]
- Silva, M.; Benevenuto, F. COVID-19 ads as political weapon. In Proceedings of the 36th Annual ACM Symposium on Applied Computing (SAC ’21), New York, NY, USA, 22–26 March 2021; pp. 1705–1710. [Google Scholar] [CrossRef] [Green Version]
- Wardle, C.; Wardle, C. Annenberg School of Communication. University of Pennsylvania. Available online: https://www.asc.upenn.edu/people/faculty/claire-wardle-phd (accessed on 31 July 2021).
- Kuehn, K.M.; Salter, L.A. Assessing Digital Threats to Democracy, and Workable Solutions: A Review of the Recent Literature. Int. J. Commun. 2020, 14, 2589–2610. [Google Scholar]
- Zuboff, S. The Age of Surveillance Capitalism: The Fight for a Human Future at the New Frontier of Power; PublicAffairs: New York, NY, USA, 2019. [Google Scholar]
- Abd-Alrazaq, A.; Alhuwail, D.; Househ, M.; Hamdi, M.; Shah, Z. Top Concerns of Tweeters During the COVID-19 Pandemic: Infoveillance Study. J. Med. Internet Res. 2020, 22, e19016. [Google Scholar] [CrossRef] [Green Version]
- Greene, C.M.; Murphy, G. Quantifying the effects of fake news on behavior: Evidence from a study of COVID-19 misinformation. J. Exp. Psychol. Appl. 2021. [Google Scholar] [CrossRef]
- Smith, R.; Cubbon, S.; Wardle, C. Under the Surface: Covid-19 Vaccine Narratives, Misinformation and Data Deficits on Social Media. FirstDraftNews. 12 November 2020. Available online: https://firstdraftnews.org/long-form-article/under-the-surface-covid-19-vaccine-narratives-misinformation-and-data-deficits-on-social-media/ (accessed on 31 July 2021).
- World Health Organization. Managing the COVID-19 Infodemic: Promoting Healthy Behaviours and Mitigating the Harm from Misinformation and Disinformation. Joint Statement by WHO, UN, UNICEF, UNDP, UNESCO, UNAIDS, ITU, UN Global Pulse, and IFRC. Available online: https://www.who.int/news/item/23-09-2020-managing-the-covid-19-infodemic-promoting-healthy-behaviours-and-mitigating-the-harm-from-misinformation-and-disinformation (accessed on 31 July 2021).
- Murthy, V.H. Confronting Health Misinformation: The U.S. Surgeon General’s Advisory on Building a Healthy Information Environment. Available online: https://www.hhs.gov/sites/default/files/surgeon-general-misinformation-advisory.pdf (accessed on 31 July 2021).
- Steinert, S. Corona and value change. The role of social media and emotional contagion. Ethics Inf. Technol. 2020, 1–10. [Google Scholar] [CrossRef]
- Vosoughi, S.; Roy, D.; Aral, S. The spread of true and false news online. Science 2018, 359, 1146–1151. [Google Scholar] [CrossRef]
- Vaccari, C.; Chadwick, A. Deepfakes and Disinformation: Exploring the Impact of Synthetic Political Video on Deception, Uncertainty, and Trust in News. Soc. Media Soc. 2020, 6, 2056305120903408. [Google Scholar] [CrossRef] [Green Version]
- Rana, A.; Malik, S. A Review of Computational Intelligence Technologies for Tackling Covid-19 Pandemic. In The Fusion of Internet of Things, Artificial Intelligence, and Cloud Computing in Health Care. Internet of Things (Technology, Communications and Computing); Siarry, P., Jabbar, M., Aluvalu, R., Abraham, A., Madureira, A., Eds.; Springer: Berlin/Heidelberg, Germany, 2021. [Google Scholar] [CrossRef]
- Shams, A.B.; Hoque Apu, E.; Rahman, A.; Sarker Raihan, M.M.; Siddika, N.; Preo, R.B.; Hussein, M.R.; Mostari, S.; Kabir, R. Web Search Engine Misinformation Notifier Extension (SEMiNExt): A Machine Learning Based Approach during COVID-19 Pandemic. Healthcare 2021, 9, 156. [Google Scholar] [CrossRef]
- Miner, A.S.; Laranjo, L.; Kocaballi, A.B. Chatbots in the fight against the COVID-19 pandemic. NPJ Digit. Med. 2020, 3, 65. [Google Scholar] [CrossRef] [PubMed]
- Mesquita, C.T.; Oliveira, A.; Seixas, F.L.; Paes, A. Infodemia, Fake News and Medicine: Science and The Quest for Truth. Int. J. Cardiovasc. Sci. 2020, 33, 203–205. [Google Scholar] [CrossRef]
- Holotescu, V.; Vasiu, R. Challenges and emerging solutions for public blockchains. BRAIN. Broad Res. Artif. Intell. Neurosci. 2020, 11, 58–83. [Google Scholar] [CrossRef]
- Grech, A. Media, Technology and Education in a Post-Truth Society: From Fake News, Datafication and Mass Surveillance to the Death of Trust, 1st ed.; Grech, A., Ed.; Emerald Publishing Limited: Bingley, UK, 2021. [Google Scholar]
- Fraga-Lamas, P.; Fernandez-Carames, T.M. Fake News, Disinformation, and Deepfakes: Leveraging Distributed Ledger Technologies and Blockchain to Combat Digital Deception and Counterfeit Reality. IT Prof. 2020, 22, 53–59. [Google Scholar] [CrossRef] [Green Version]
- Torky, M.; Nabil, E.; Said, W. Proof of Credibility: A Blockchain Approach for Detecting and Blocking Fake News in Social Networks. Int. J. Adv. Comput. Sci. Appl. 2019, 10, 321–327. [Google Scholar] [CrossRef]
- Chen, Q.; Srivastava, G.; Parizi, R.M.; Aloqaily, M.; Al Ridhawi, I. An incentive-aware blockchain-based solution for internet of fake media things. Inf. Process. Manag. 2020, 57, 102370. [Google Scholar] [CrossRef]
- Cubbon, S. Identifying ‘Data Deficits’ Can pre-Empt the Spread of Disinformation. Medium, 15 December 2020. [Google Scholar]
- Guo, B.; Ding, Y.S.; Sun, Y.H.; Ma, S.; Li, K.; Yu, Z.W. The mass, fake news, and cognition security. Front. Comput. Sci. 2021, 15, 1–13. [Google Scholar] [CrossRef]
- Gyenes, N.; Mina, A.X. How Misinfodemics Spread Disease. Available online: https://www.theatlantic.com/technology/archive/2018/08/how-misinfodemics-spread-disease/568921/ (accessed on 31 July 2021).
- Mukhtar, S. Psychology and politics of COVID-19 misinfodemics: Why and how do people believe in misinfodemics? Int. Sociol. 2021, 36, 111–123. [Google Scholar] [CrossRef]
- De Jesus, I.Q.; Hubbard, J. Media Literacy for Elementary Education Students: Inquiry into Fake News. Soc. Stud. 2020, 112, 136–145. [Google Scholar] [CrossRef]
- Jones-Jang, S.M.; Mortensen, T.; Liu, J. Does Media Literacy Help Identification of Fake News? Information Literacy Helps, but Other Literacies Don’t. Am. Behav. Sci. 2019, 65, 371–388. [Google Scholar] [CrossRef]
- Leeke, P.A. Fake narratives and critical thought: How creative writing can facilitate critical thinking in an age of fake news and false accounting. New Writ. Int. J. Pract. Theory Creat. Writ. 2020, 17, 199–207. [Google Scholar] [CrossRef]
- Dias, P. From ‘Infoxication’ to ‘Infosaturation’: A Theoretical Overview of the Cognitive and Social Effects of Digital Immersion. Available online: https://repositorio.ucp.pt/bitstream/10400.14/14939/1/PD_Infoxication_2014.pdf (accessed on 31 July 2021).
- Aguaded, J.I.; Romero-Rodríguez, L.M. Mediamorfosis y desinformación en la infoesfera: Alfabetización mediática, digital e informacional ante los cambios de hábitos de consumo informativo. Educ. Knowl. Soc. 2015, 16, 44–57. [Google Scholar] [CrossRef] [Green Version]
- Witlox, F. Beyond the Data Smog? Transport. Rev. 2015, 35, 245–249. [Google Scholar] [CrossRef]
- Carpini, M.X.D.; Suárez, M.M.; Herman, B. Being Informed: A Study of the Information Needs and Habits of Philadelphia Residents. Available online: https://www.lenfestinstitute.org/being-informed/ (accessed on 31 July 2021).
- Breakstone, J.; Smith, M.; Wineburg, S.; Rapaport, A.; Carle, J.; Garland, M.; Saavedra, A. Students’ Civic Online Reasoning: A National Portrait. Educ. Res. 2021, 1–11. [Google Scholar] [CrossRef]
- Konstantinou, L.; Caraban, A.; Karapanos, E. Combating Misinformation Through Nudging. Hum.-Comput. Interact.—Interact. 2019, 11749, 630–634. [Google Scholar] [CrossRef]
- Nekmat, E. Nudge Effect of Fact-Check Alerts: Source Influence and Media Skepticism on Sharing of News Misinformation in Social Media. Soc. Media + Soc. 2020, 6, 2056305119897322. [Google Scholar] [CrossRef]
- Beckerman, M. TikTok’s H2 2020 Transparency Report. Available online: https://newsroom.tiktok.com/en-us/tiktoks-h-2-2020-transparency-report (accessed on 31 July 2021).
- Alonso-López, N.; Sidorenko-Bautista, P.; Giacomelli, F. Beyond challenges and viral dance moves: TikTok as a vehicle for disinformation and fact-checking in Spain, Portugal, Brazil, and the USA. Anàlisi Quad. Comun. Cult. 2021, 64, 65–84. [Google Scholar] [CrossRef]
- Basch, C.H.; Meleo-Erwin, Z.; Fera, J.; Jaime, C.; Basch, C.E. A global pandemic in the time of viral memes: COVID-19 vaccine misinformation and disinformation on TikTok. Hum. Vaccines Immunother. 2021, 25, 1–5. [Google Scholar] [CrossRef]
- Saad, A.; Akinsulie, B.; Ega, C.; Akiode, A.; Awaisu, A. Misconceptions and current use of contraception among women of reproductive age in six major cities in Nigeria. Eur. J. Contracept. Reprod. Health Care 2018, 23, 415–420. [Google Scholar] [CrossRef] [PubMed]
- Barbhuiya, F. Causal health attributes and beliefs of tobacco-related cancer patients in Assam, India. J. Psychosoc. Oncol. 2021, 27, 1–16. [Google Scholar] [CrossRef]
- Betsch, C. Advocating for vaccination in a climate of science denial. Nat. Microbiol. 2017, 2, 17106. [Google Scholar] [CrossRef] [PubMed]
- De Regt, A.; Montecchi, M.; Ferguson, S.L. A false image of health: How fake news and pseudo-facts spread in the health and beauty industry. J. Prod. Brand Manag. 2020, 29, 168–179. [Google Scholar] [CrossRef]
- Strudwicke, I.J.; Grant, W.J. #JunkScience: Investigating pseudoscience disinformation in the Russian Internet Research Agency tweets. Public Underst. Sci. 2020, 29, 459–472. [Google Scholar] [CrossRef] [PubMed]
- Greenspan, R.L.; Loftus, E.F. Pandemics and infodemics: Research on the effects of misinformation on memory. Hum. Behav. Emerg. Technol. 2021, 3, 8–12. [Google Scholar] [CrossRef] [PubMed]
- Young, L.E.; Sidnam-Mauch, E.; Twyman, M.; Wang, L.Y.; Xu, J.J.Y.; Sargent, M.; Valente, T.W.; Ferrara, E.; Fulk, J.; Monge, P. Disrupting the COVID-19 Misinfodemic With Network Interventions: Network Solutions for Network Problems. Am. J. Public Health 2021, 111, 514–519. [Google Scholar] [CrossRef]
- Zielinski, C. Infodemics and infodemiology: A short history, a long future. Rev. Panam. Salud Publica-Pan Am. J. Public Health 2021, 45, 1–8. [Google Scholar] [CrossRef]
- Dong, W.; Tao, J.; Xia, X.; Ye, L.; Xu, H.; Jiang, P.; Liu, Y. Public Emotions and Rumors Spread During the COVID-19 Epidemic in China: Web-Based Correlation Study. J. Med. Internet Res. 2020, 22, e21933. [Google Scholar] [CrossRef]
- Loftus, E.F.; Pickrell, J.E. The Formation of False Memories. Psychiatr. Ann. 1995, 25, 720–725. [Google Scholar] [CrossRef] [Green Version]
- Loftus, E.F. Planting misinformation in the human mind: A 30-year investigation of the malleability of memory. Learn. Mem. 2005, 12, 361–366. [Google Scholar] [CrossRef] [PubMed] [Green Version]
- Braun, K.A.; Ellis, R.; Loftus, E.F. Make my memory: How advertising can change our memories of the past. Psychol. Mark. 2002, 19, 1–23. [Google Scholar] [CrossRef]
- Loftus, E.F. Make-believe memories. Am. Psychol. 2003, 58, 867–873. [Google Scholar] [CrossRef]
- Murphy, G.; Loftus, E.F.; Grady, R.H.; Levine, L.J.; Greene, C.M. False Memories for Fake News During Ireland’s Abortion Referendum. Psychol. Sci. 2019, 30, 1449–1459. [Google Scholar] [CrossRef] [PubMed]
- Murphy, G.; Lynch, L.; Loftus, E.; Egan, R. Push polls increase false memories for fake news stories. Memory 2021, 29, 693–707. [Google Scholar] [CrossRef] [PubMed]
- Baptista, J.P.; Gradim, A. “Brave New World” of Fake News: How it Works. Javn. Public 2021, 1–18. [Google Scholar] [CrossRef]
- Greene, C.M.; Murphy, G. Individual differences in susceptibility to false memories for COVID-19 fake news. Cogn. Res. Princ. Implic. 2020, 5, 1–8. [Google Scholar] [CrossRef]
- Murphy, G.; Flynn, E. Deepfake false memories. Memory 2021, 1–13. [Google Scholar] [CrossRef]
- Koltun, V.; Hafner, D. The h-index is no longer an effective correlate of scientific reputation. PLoS ONE 2021, 16, e0253397. [Google Scholar] [CrossRef]
- Meyers, P.A. Organic geochemical proxies of paleoceanographic, paleolimnologic, and paleoclimatic processes. Org. Geochem. 1997, 27, 213–250. [Google Scholar] [CrossRef]
- Allcott, H.; Gentzkow, M. Social Media and Fake News in the 2016 Election. J. Econ. Perspect. 2017, 31, 211–235. [Google Scholar] [CrossRef] [Green Version]
- Times Higher Education. University of Michigan-Ann Arbor. Available online: https://www.timeshighereducation.com/world-university-rankings/university-michigan-ann-arbor (accessed on 31 July 2021).
- Nyhan, B.; Reifler, J. When Corrections Fail: The Persistence of Political Misperceptions. Political Behav. 2010, 32, 303–330. [Google Scholar] [CrossRef]
- Hyman, I.E.; Husband, T.H.; Billings, F.J. False Memories of Childhood Experiences. Appl. Cogn. Psychol. 1995, 9, 181–197. [Google Scholar] [CrossRef]
- Loftus, E.F.; Levidow, B.; Duensing, S. Who Remembers Best—Individual-Differences in Memory for Events that Occurred in a Science Museum. Appl. Cogn. Psychol. 1992, 6, 93–107. [Google Scholar] [CrossRef]
- Lazer, D.M.J.; Baum, M.A.; Benkler, Y.; Berinsky, A.J.; Greenhill, K.M.; Menczer, F.; Metzger, M.J.; Nyhan, B.; Pennycook, G.; Rothschild, D.; et al. The science of fake news. Science 2018, 359, 1094–1096. [Google Scholar] [CrossRef] [PubMed]
- Skarzauskiene, A.; Maciuliene, M.; Ramasauskaite, O. The Digital Media in Lithuania: Combating Disinformation and Fake News. Acta Inform. Pragensia 2020, 9, 74–91. [Google Scholar] [CrossRef]
- Marin, L. Three contextual dimensions of information on social media: Lessons learned from the COVID-19 infodemic. Ethics Inf. Technol. 2020, 1–8. [Google Scholar] [CrossRef]
- Shane, T. The Questions We Need to Ask before the Next Infodemic. Available online: https://medium.com/1st-draft/the-questions-we-need-to-ask-before-the-next-infodemic-ff68671d07aa (accessed on 31 July 2021).
- Golebiewski, M.; Boyd, D. Data Voids: Where Missing Data Can Be Easily Exploited. Available online: https://datasociety.net/wp-content/uploads/2019/11/Data-Voids-2.0-Final.pdf (accessed on 31 July 2021).
- Negoiță, C. Mediamorfoze V: Reflectare, (De)Formare Și Fake News în Spațiul Mediatic Și Cultural; Tritonic: Bucuresti, Romania, 2020. [Google Scholar]
Figure 1.
PRISMA guidelines.

Figure 2.
Cited documents.

Figure 3.
Temporal evolution of scientific productivity. Information disorders research papers published from 1975 to June 2021.
Figure 3.
Temporal evolution of scientific productivity. Information disorders research papers published from 1975 to June 2021.

Figure 4.
Word TreeMap of high-frequency authors keywords.

Figure 5.
Dynamic of authors keywords in the information disorders literature.

Figure 6.
Visibility of scientific production. Legend: The color intensity is proportional to the number of publications.
Figure 6.
Visibility of scientific production. Legend: The color intensity is proportional to the number of publications.

Figure 7.
Bradford zones regarding the distribution of publishing sources productivity.

Figure 8.
Map of key descriptors about information disorders (Of the 117,029 terms, 3228 meet the threshold (minimum number of occurrences of a term is 10).
Figure 8.
Map of key descriptors about information disorders (Of the 117,029 terms, 3228 meet the threshold (minimum number of occurrences of a term is 10).

Figure 9.
Overlay visualization of the scientific landscape.

Figure 10.
Strategic diagram depicting the performance of ID research themes. Legend: The volume of each bubble is proportional to the number of documents containing each keyword.
Figure 10.
Strategic diagram depicting the performance of ID research themes. Legend: The volume of each bubble is proportional to the number of documents containing each keyword.

Figure 11.
Thematic evolution of the ID research over time (1975–June 2021). Legend: node = topic; size = number of keywords included in the theme; colors = to distinguish different research themes; width = to indicate the number of shared keywords. The thicker the line, the higher the relevance of the two themes.

Figure 12.
Citation dynamics. Average article citation per year.

Figure 13.
Co-citation networks of authors.

Figure 14.
Co-citation networks of publication sources.

Figure 15.
Map of authors with collaborative links.

Figure 16.
The dynamics of international collaboration between countries in the field of ID.
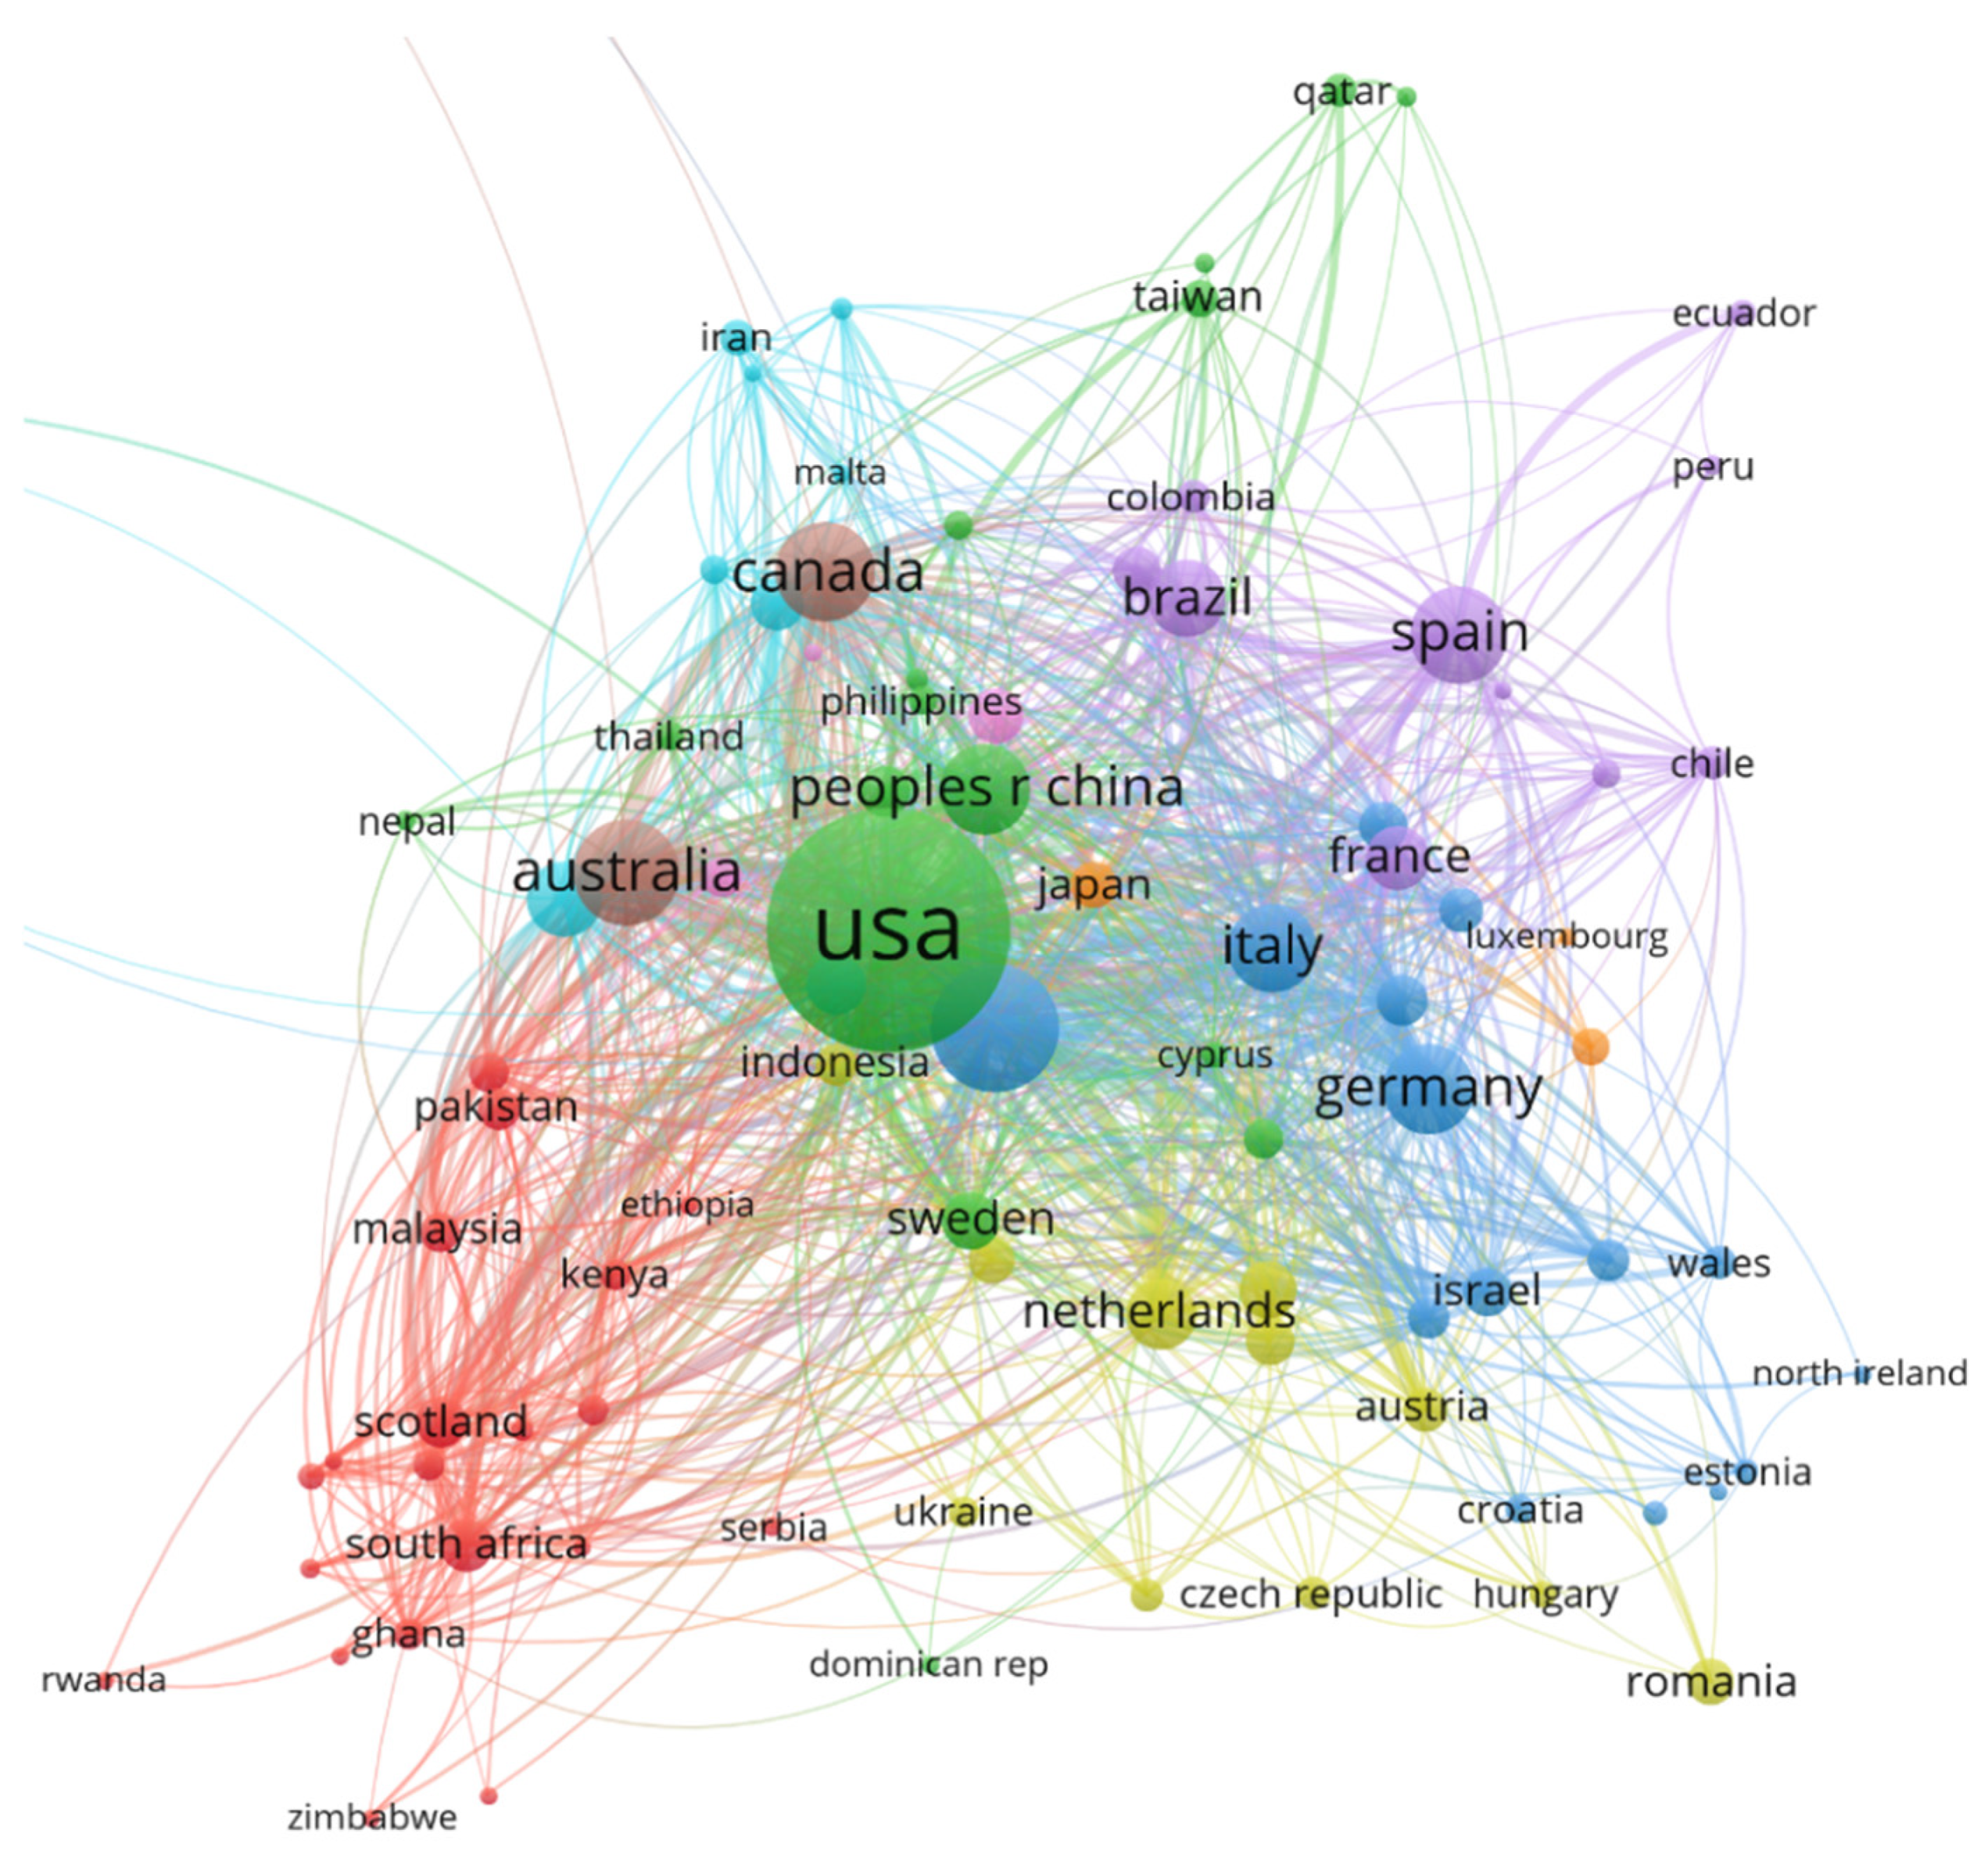
Figure 17.
The institution co-authorship. (a) North American universities; (b) universities in the Asian and Oceanian space.
Figure 17.
The institution co-authorship. (a) North American universities; (b) universities in the Asian and Oceanian space.

Figure 18.
The frequency distribution of scientific productivity.

Figure 19.
Top authors production over time. Legend: line = authors’ timeline; bubble size = number of documents per year; color intensity = total citations per year. The first bubble on a line shows when an author began to publish in the field. A big bubble indicates a big number of articles published per year. The darker the color, the higher the number of citations [54].

Figure 20.
Top 10 source dynamics (in terms of number of publications per year).

Figure 21.
A three-field plot of references, authors and themes of ID.


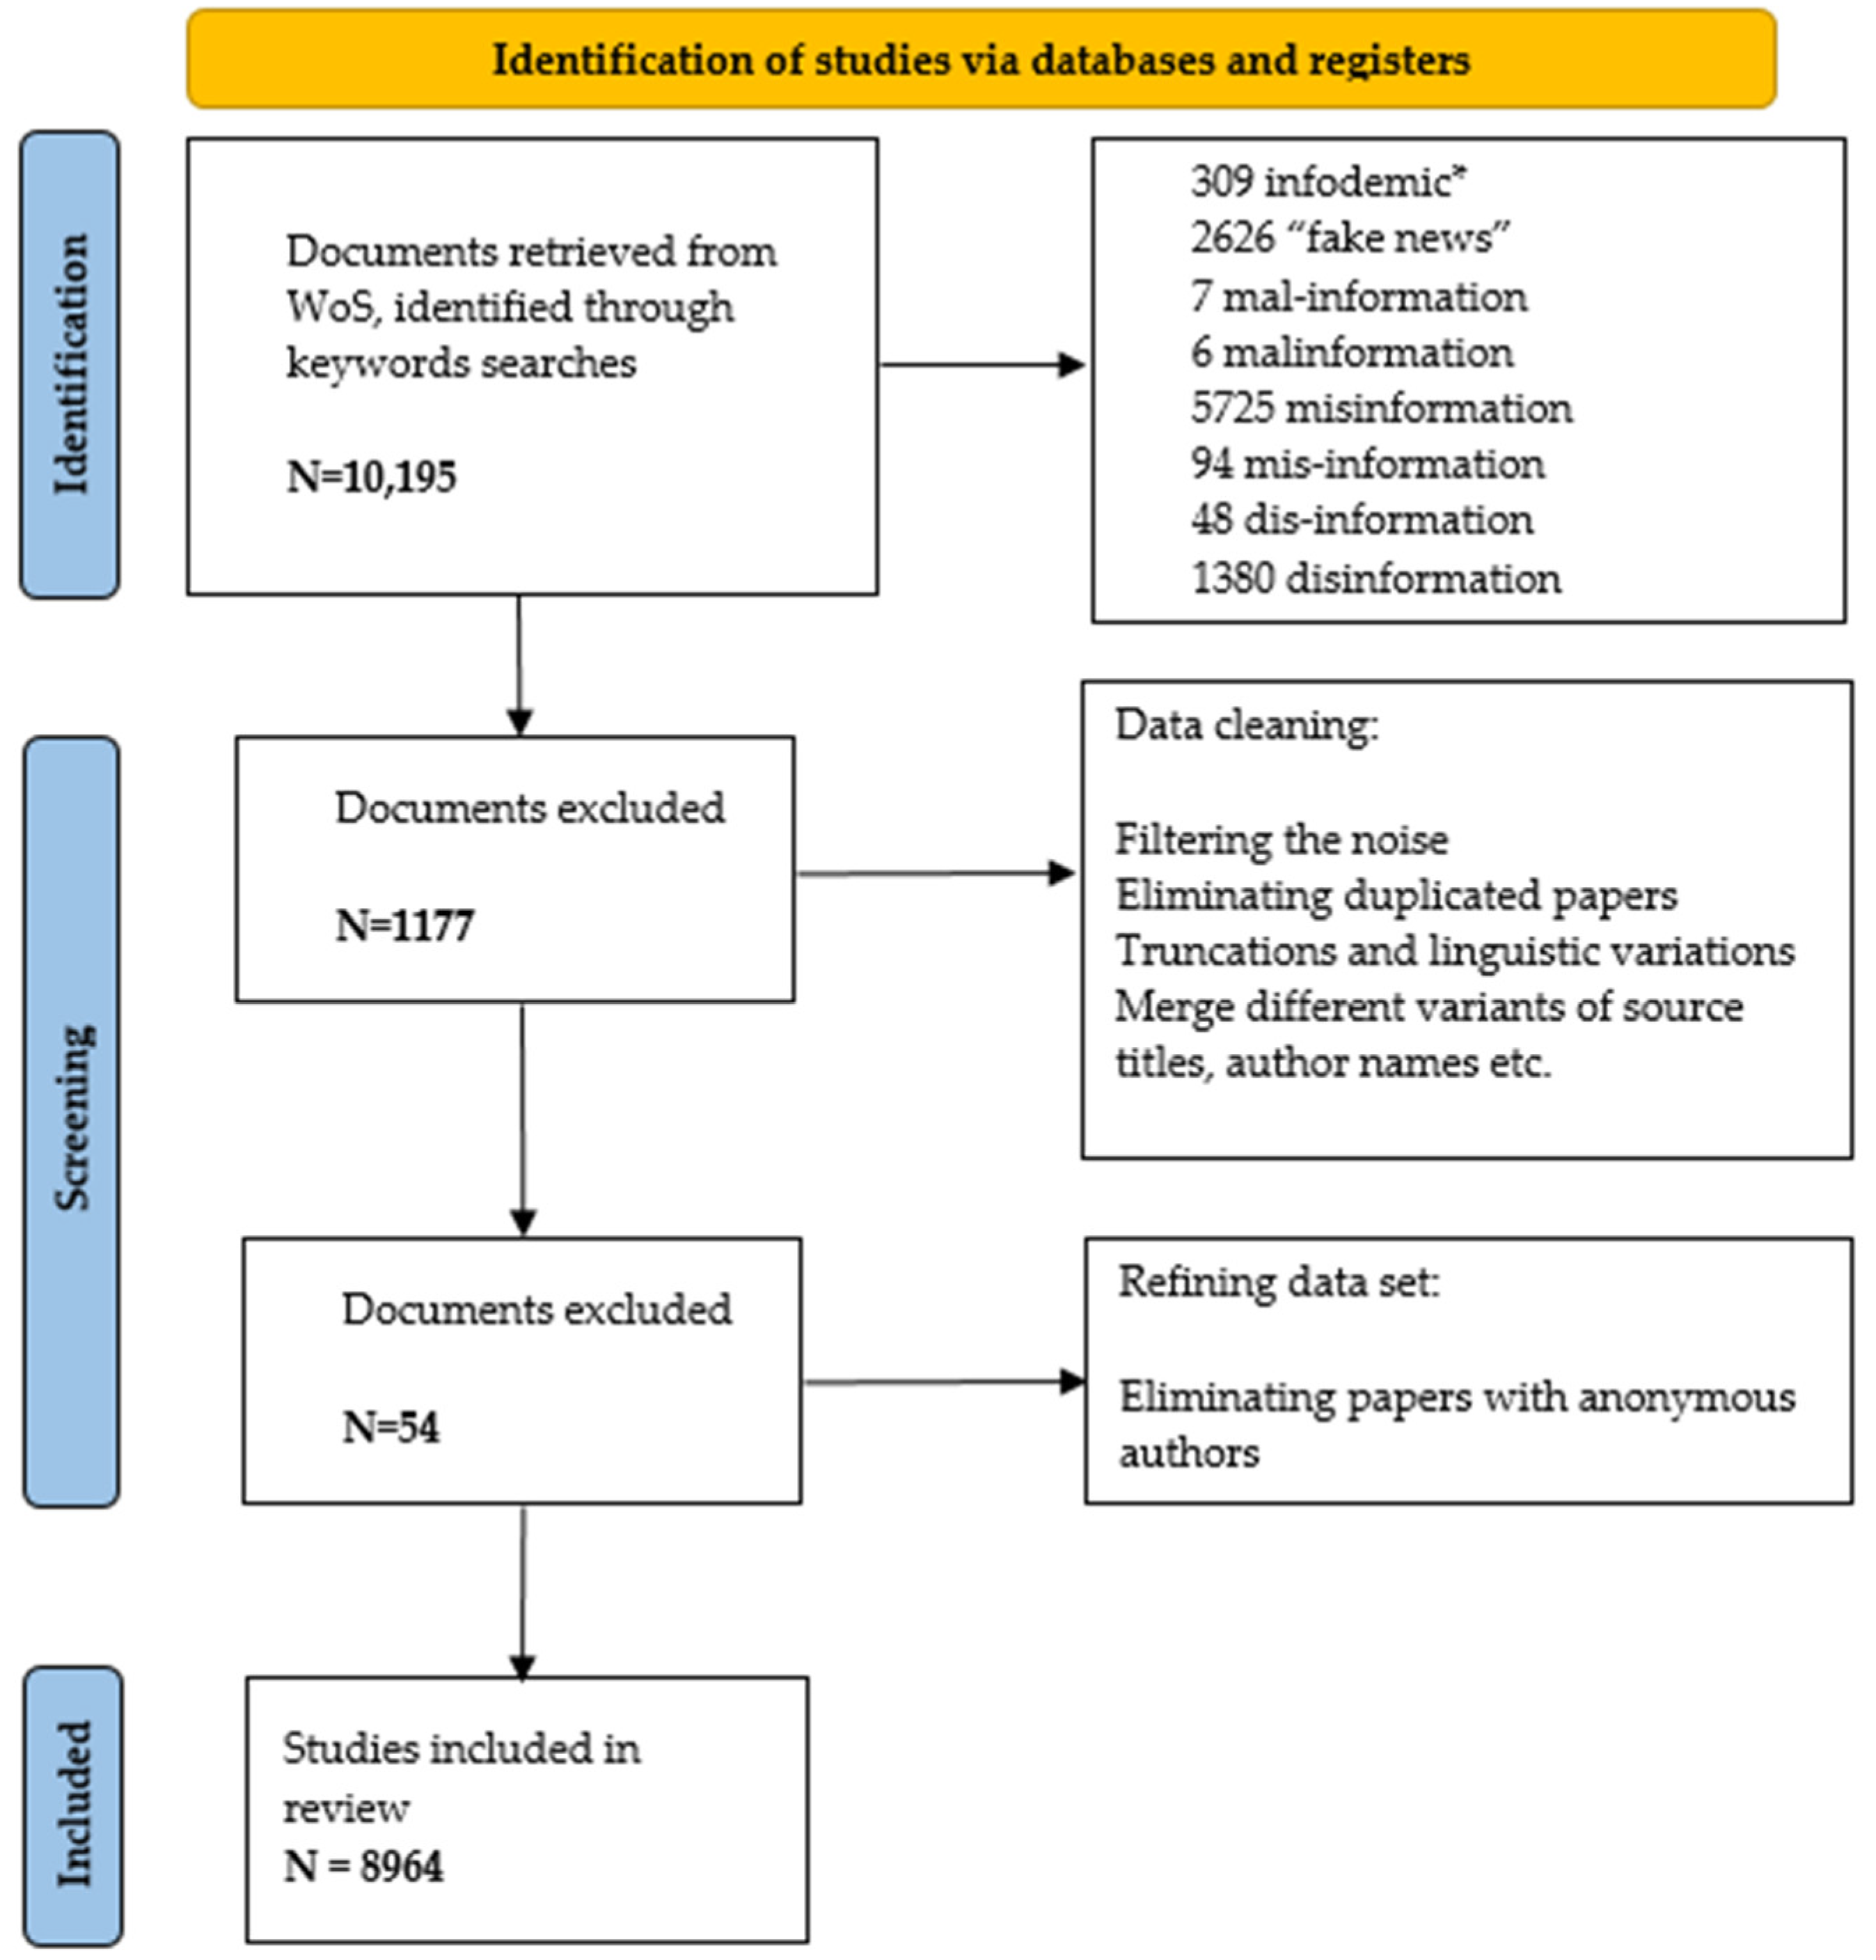
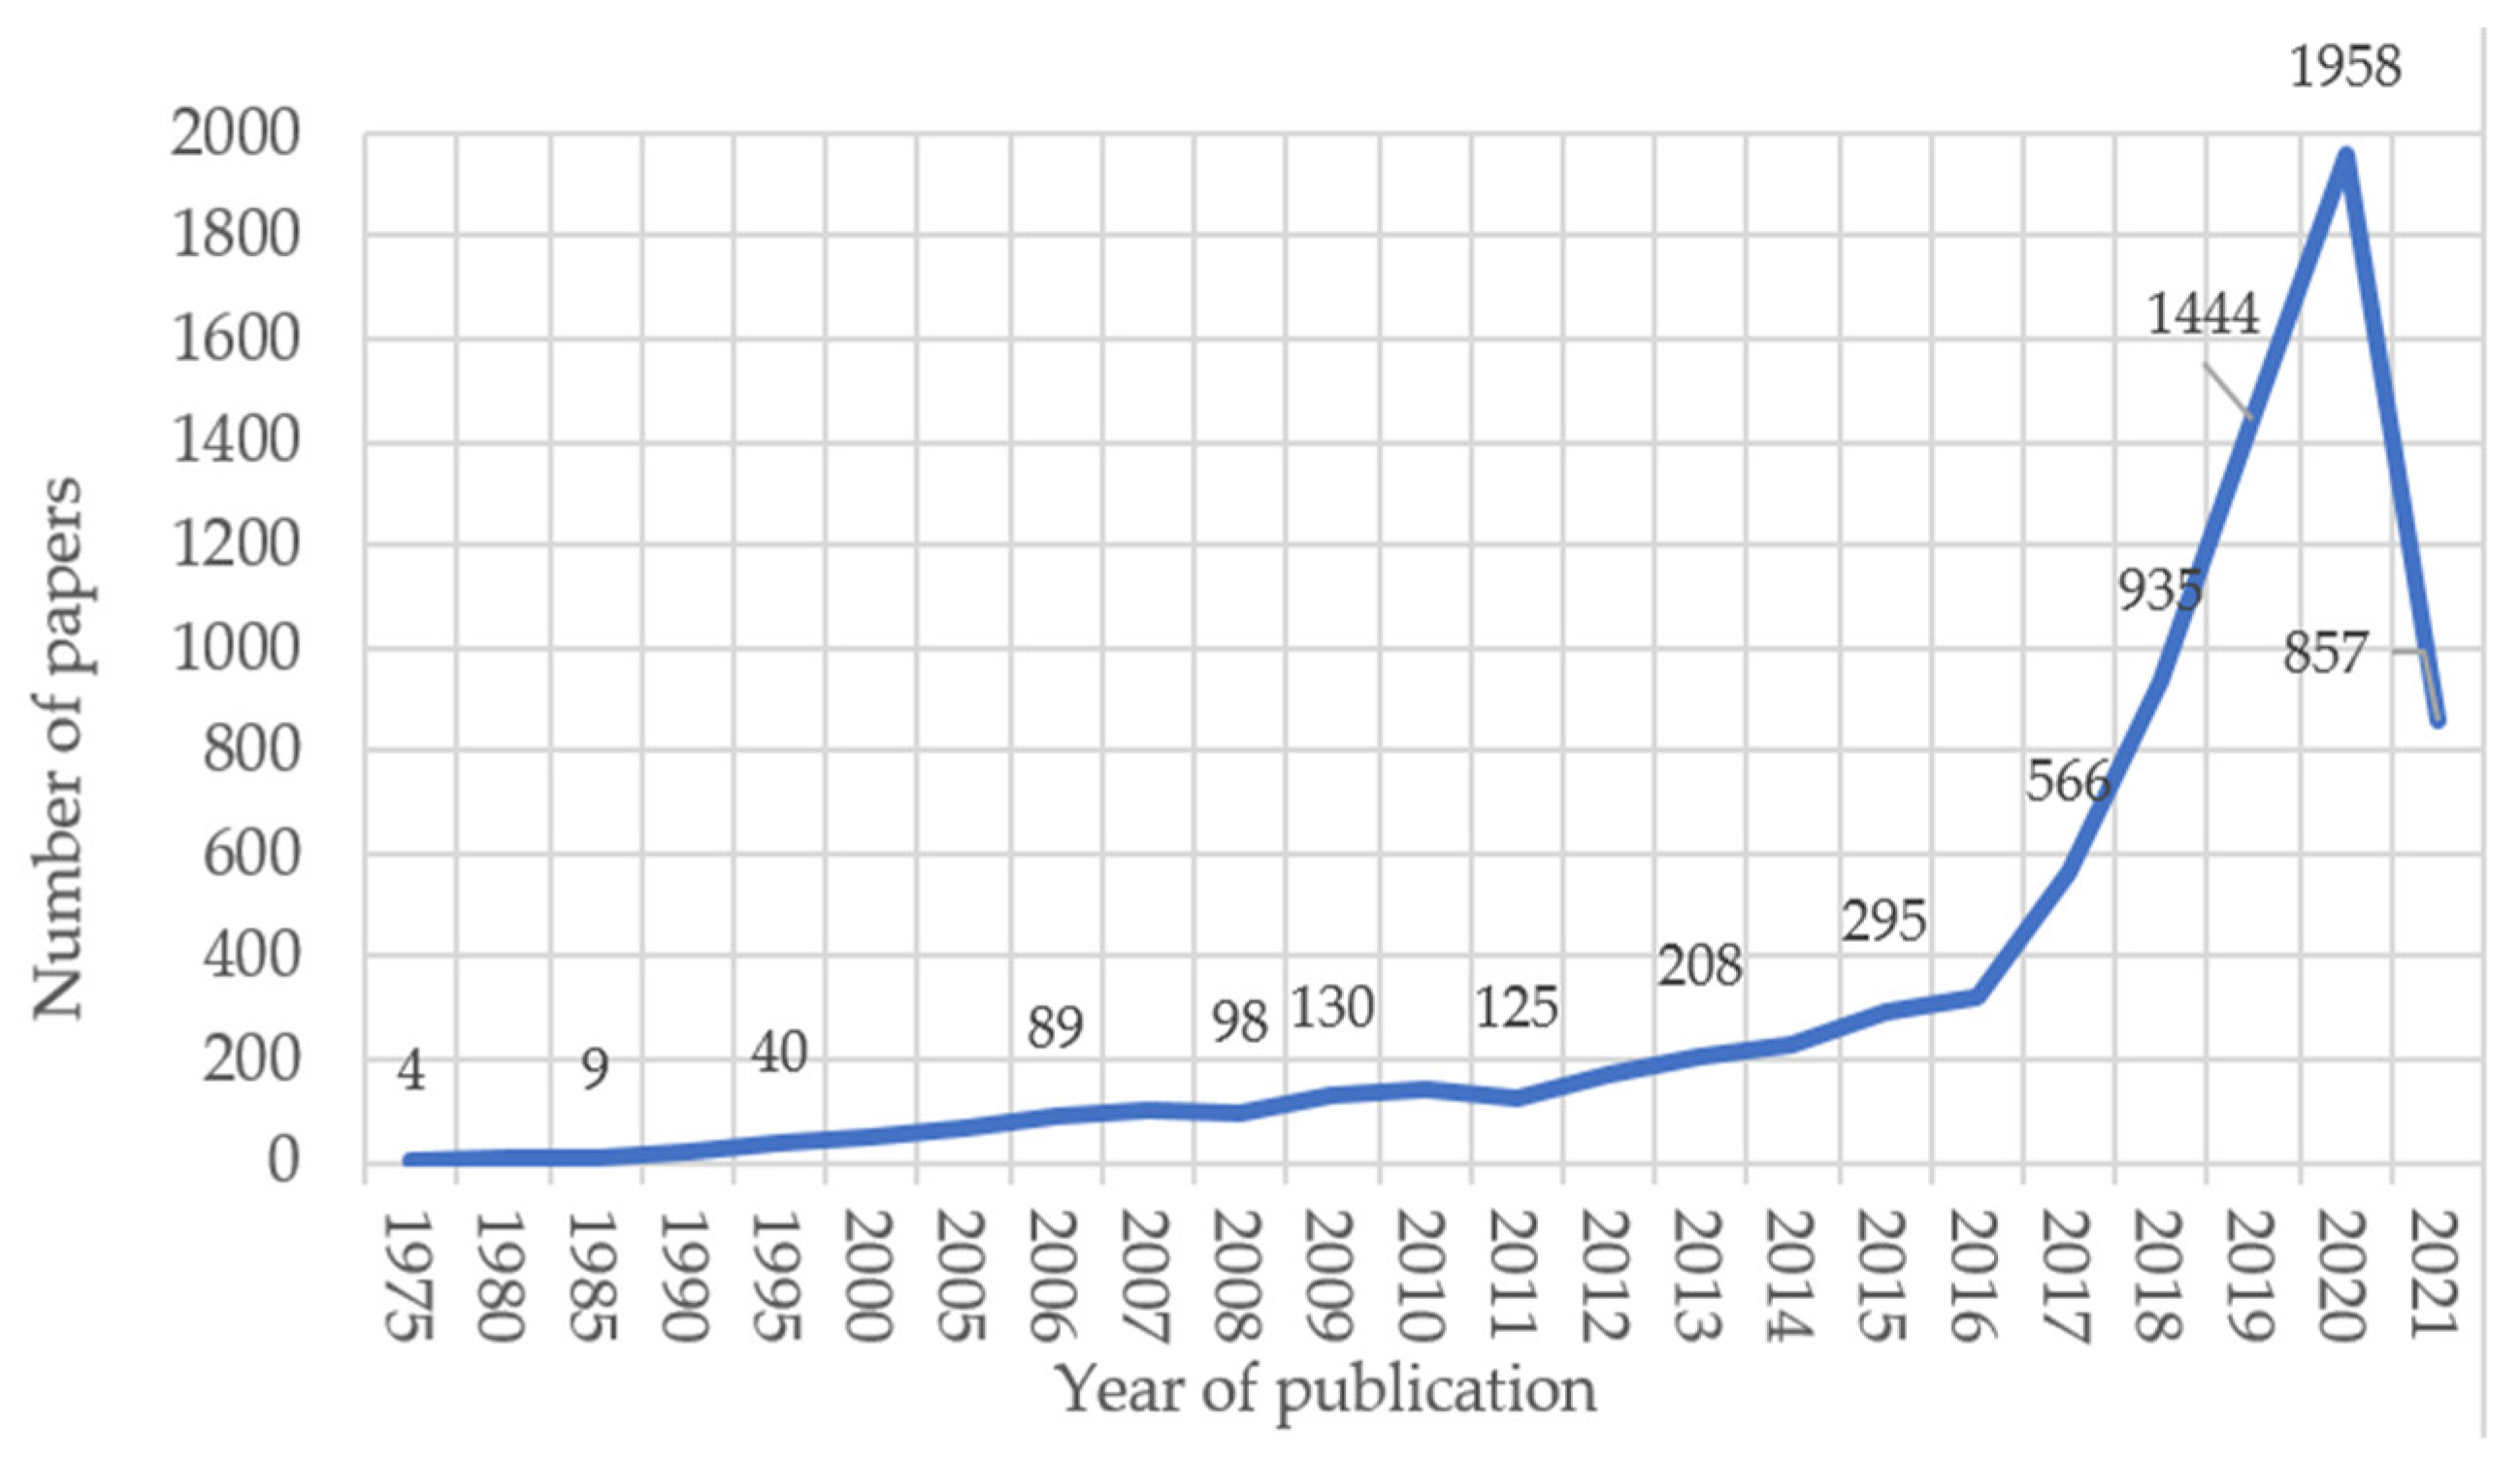
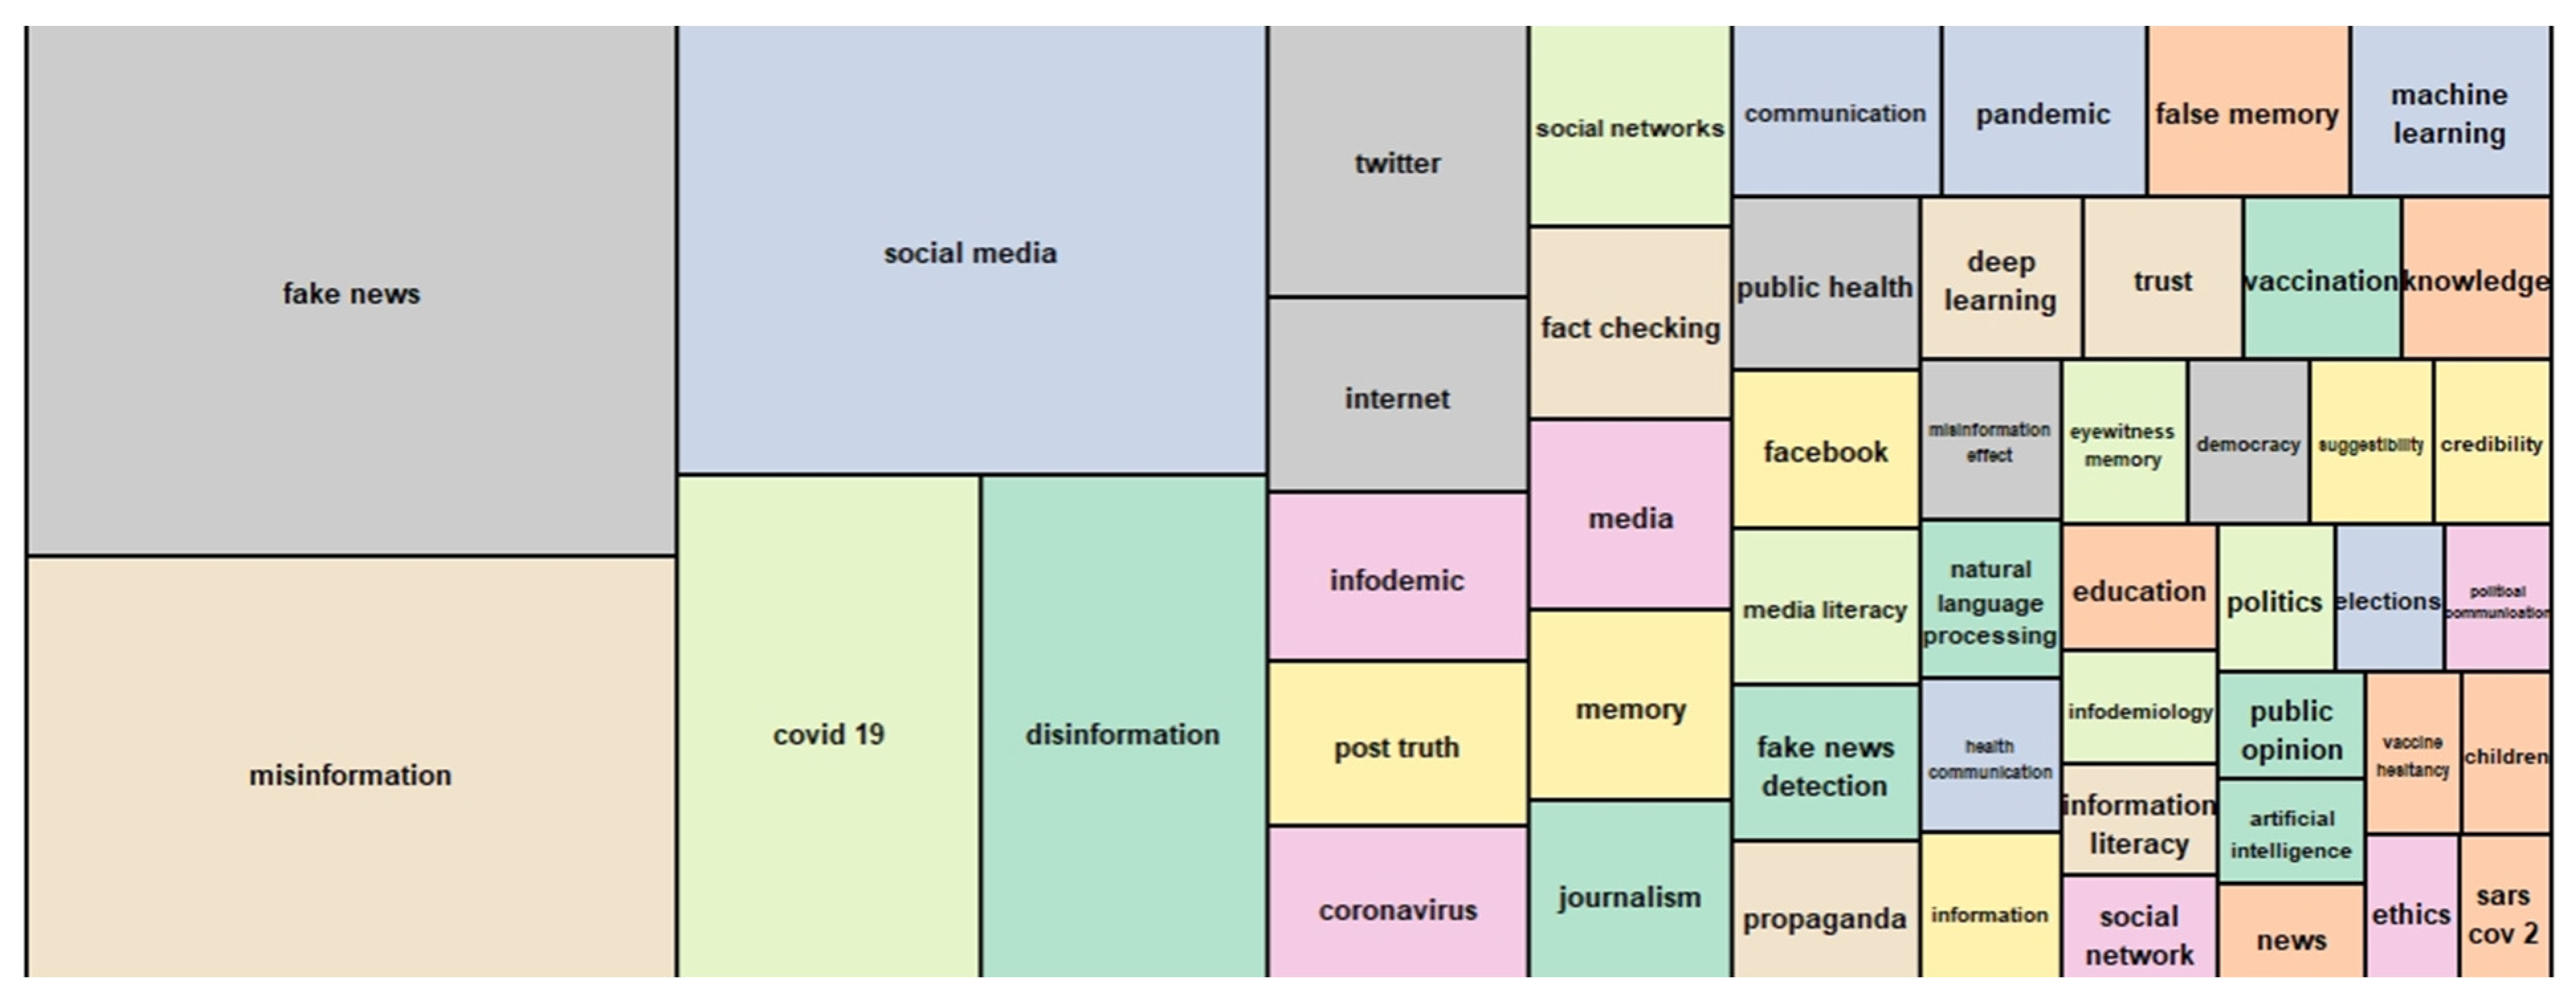
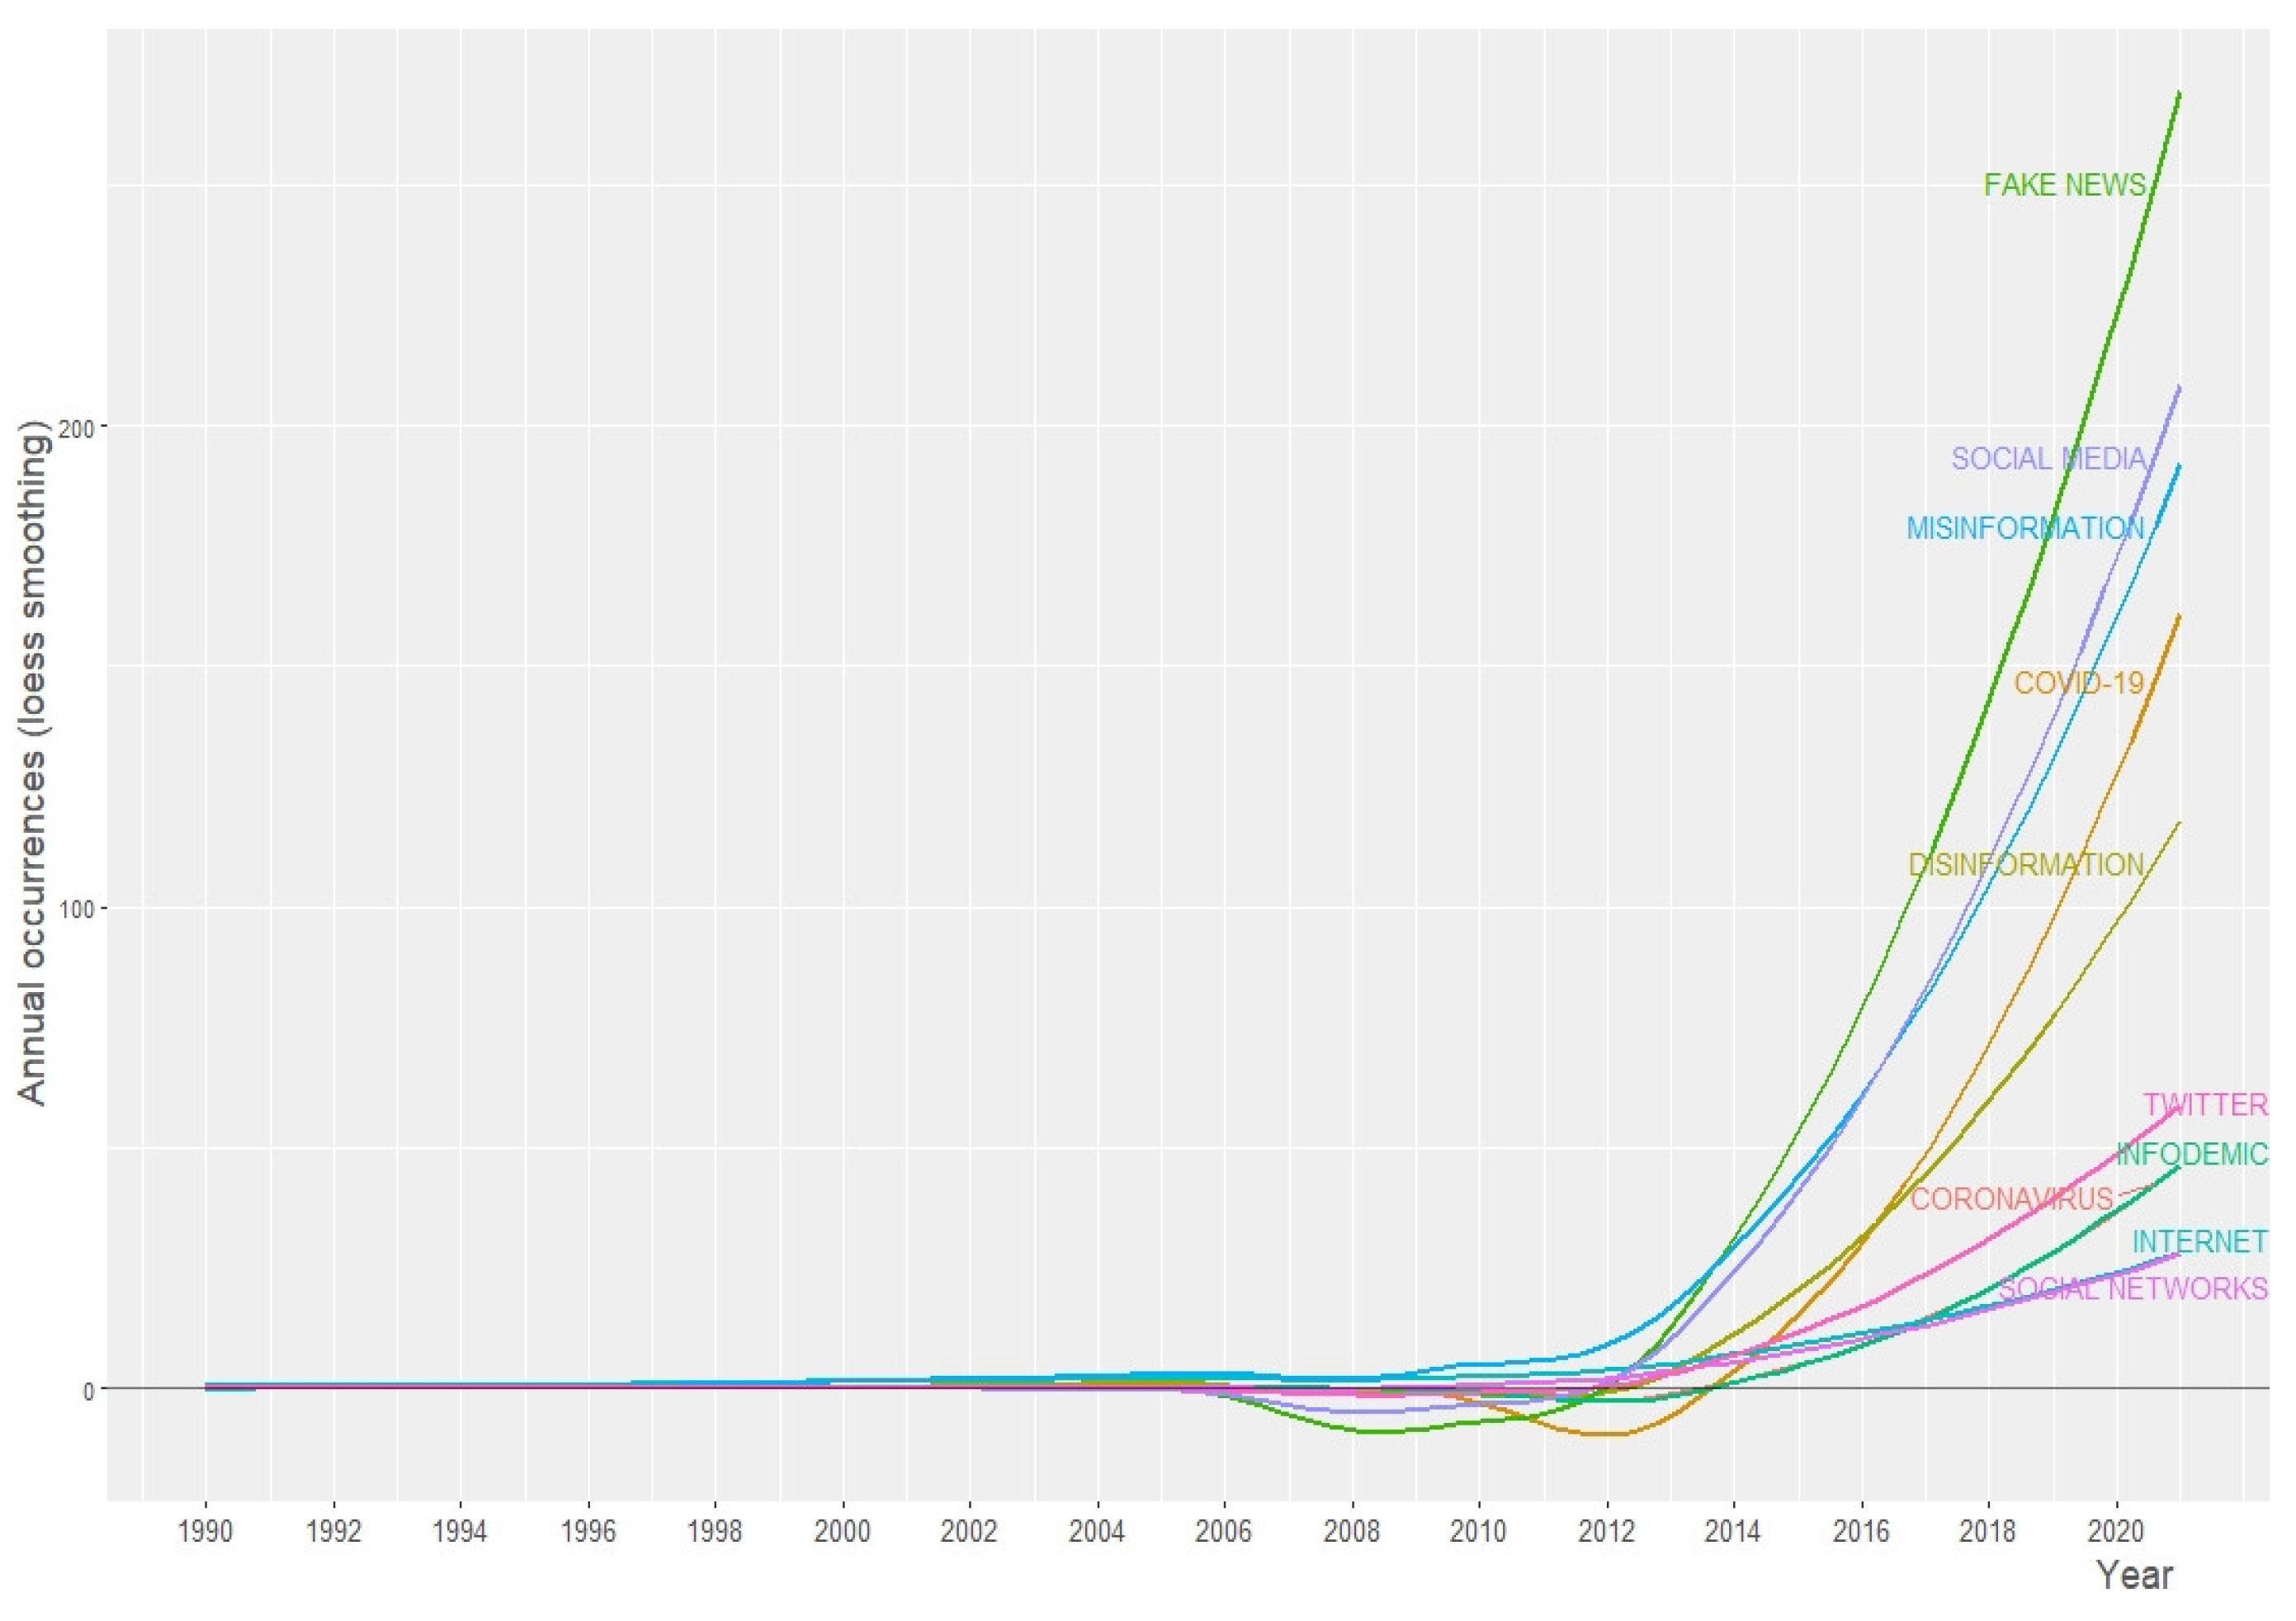
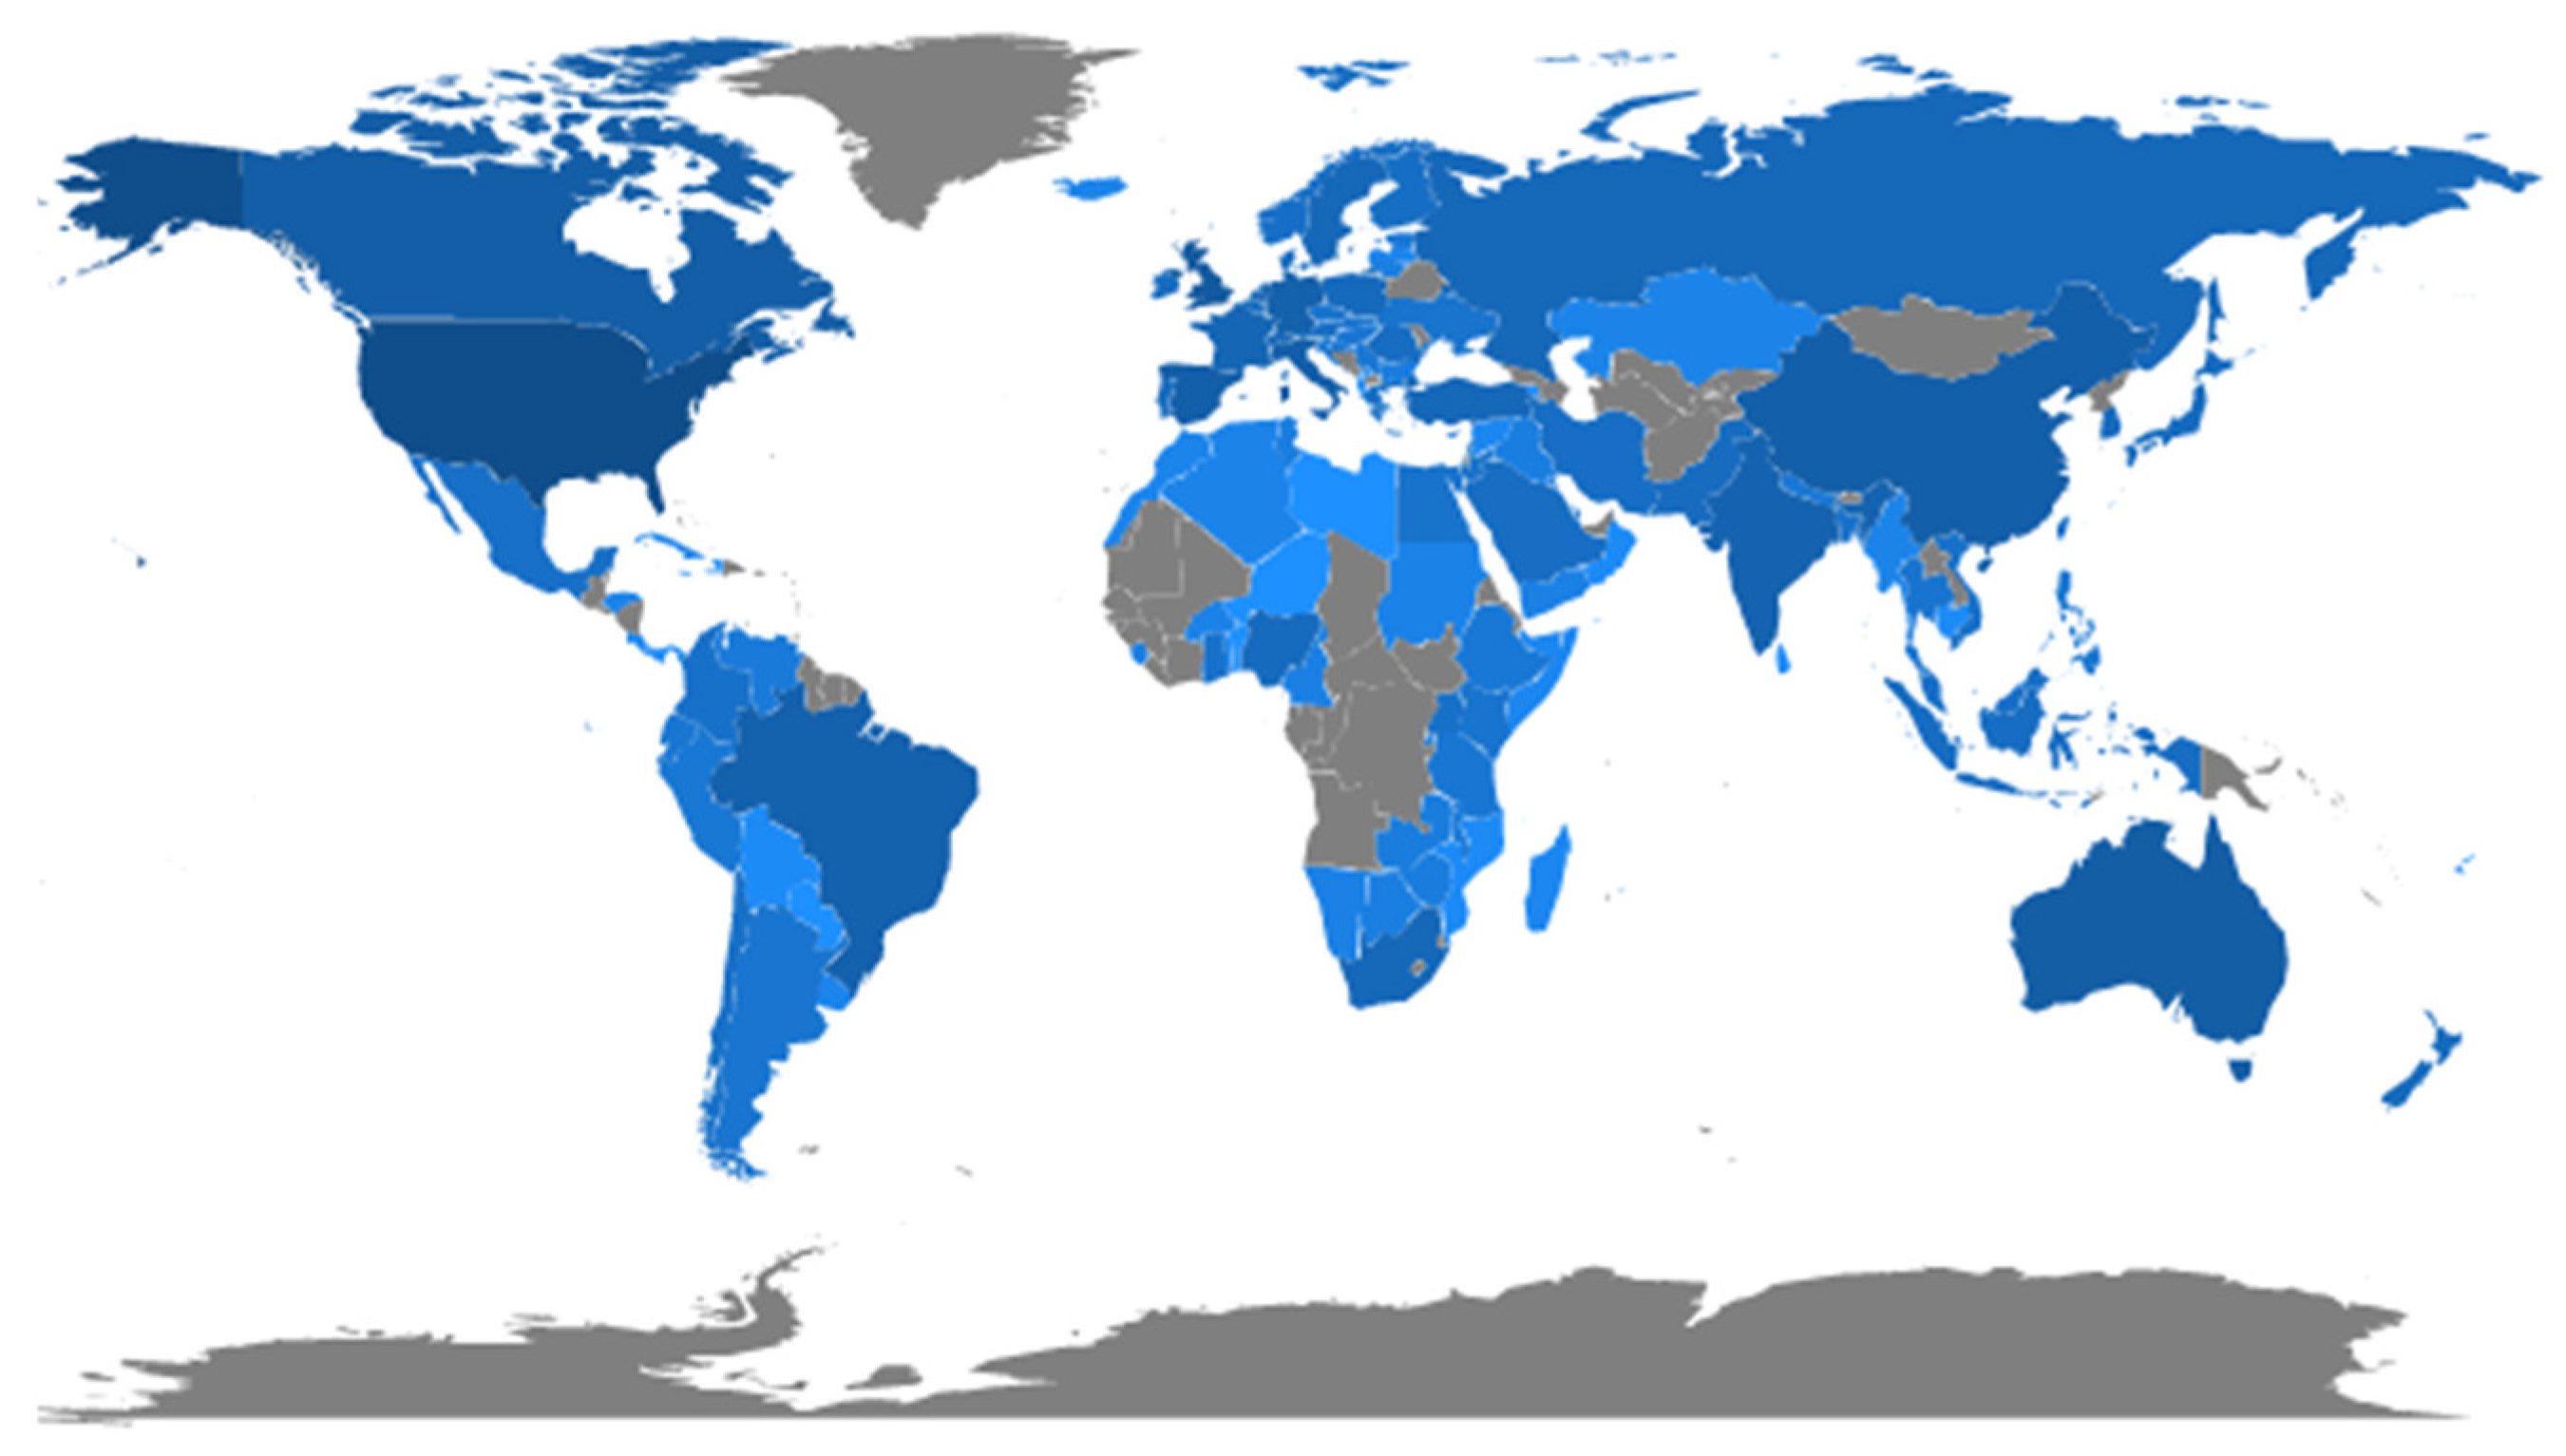
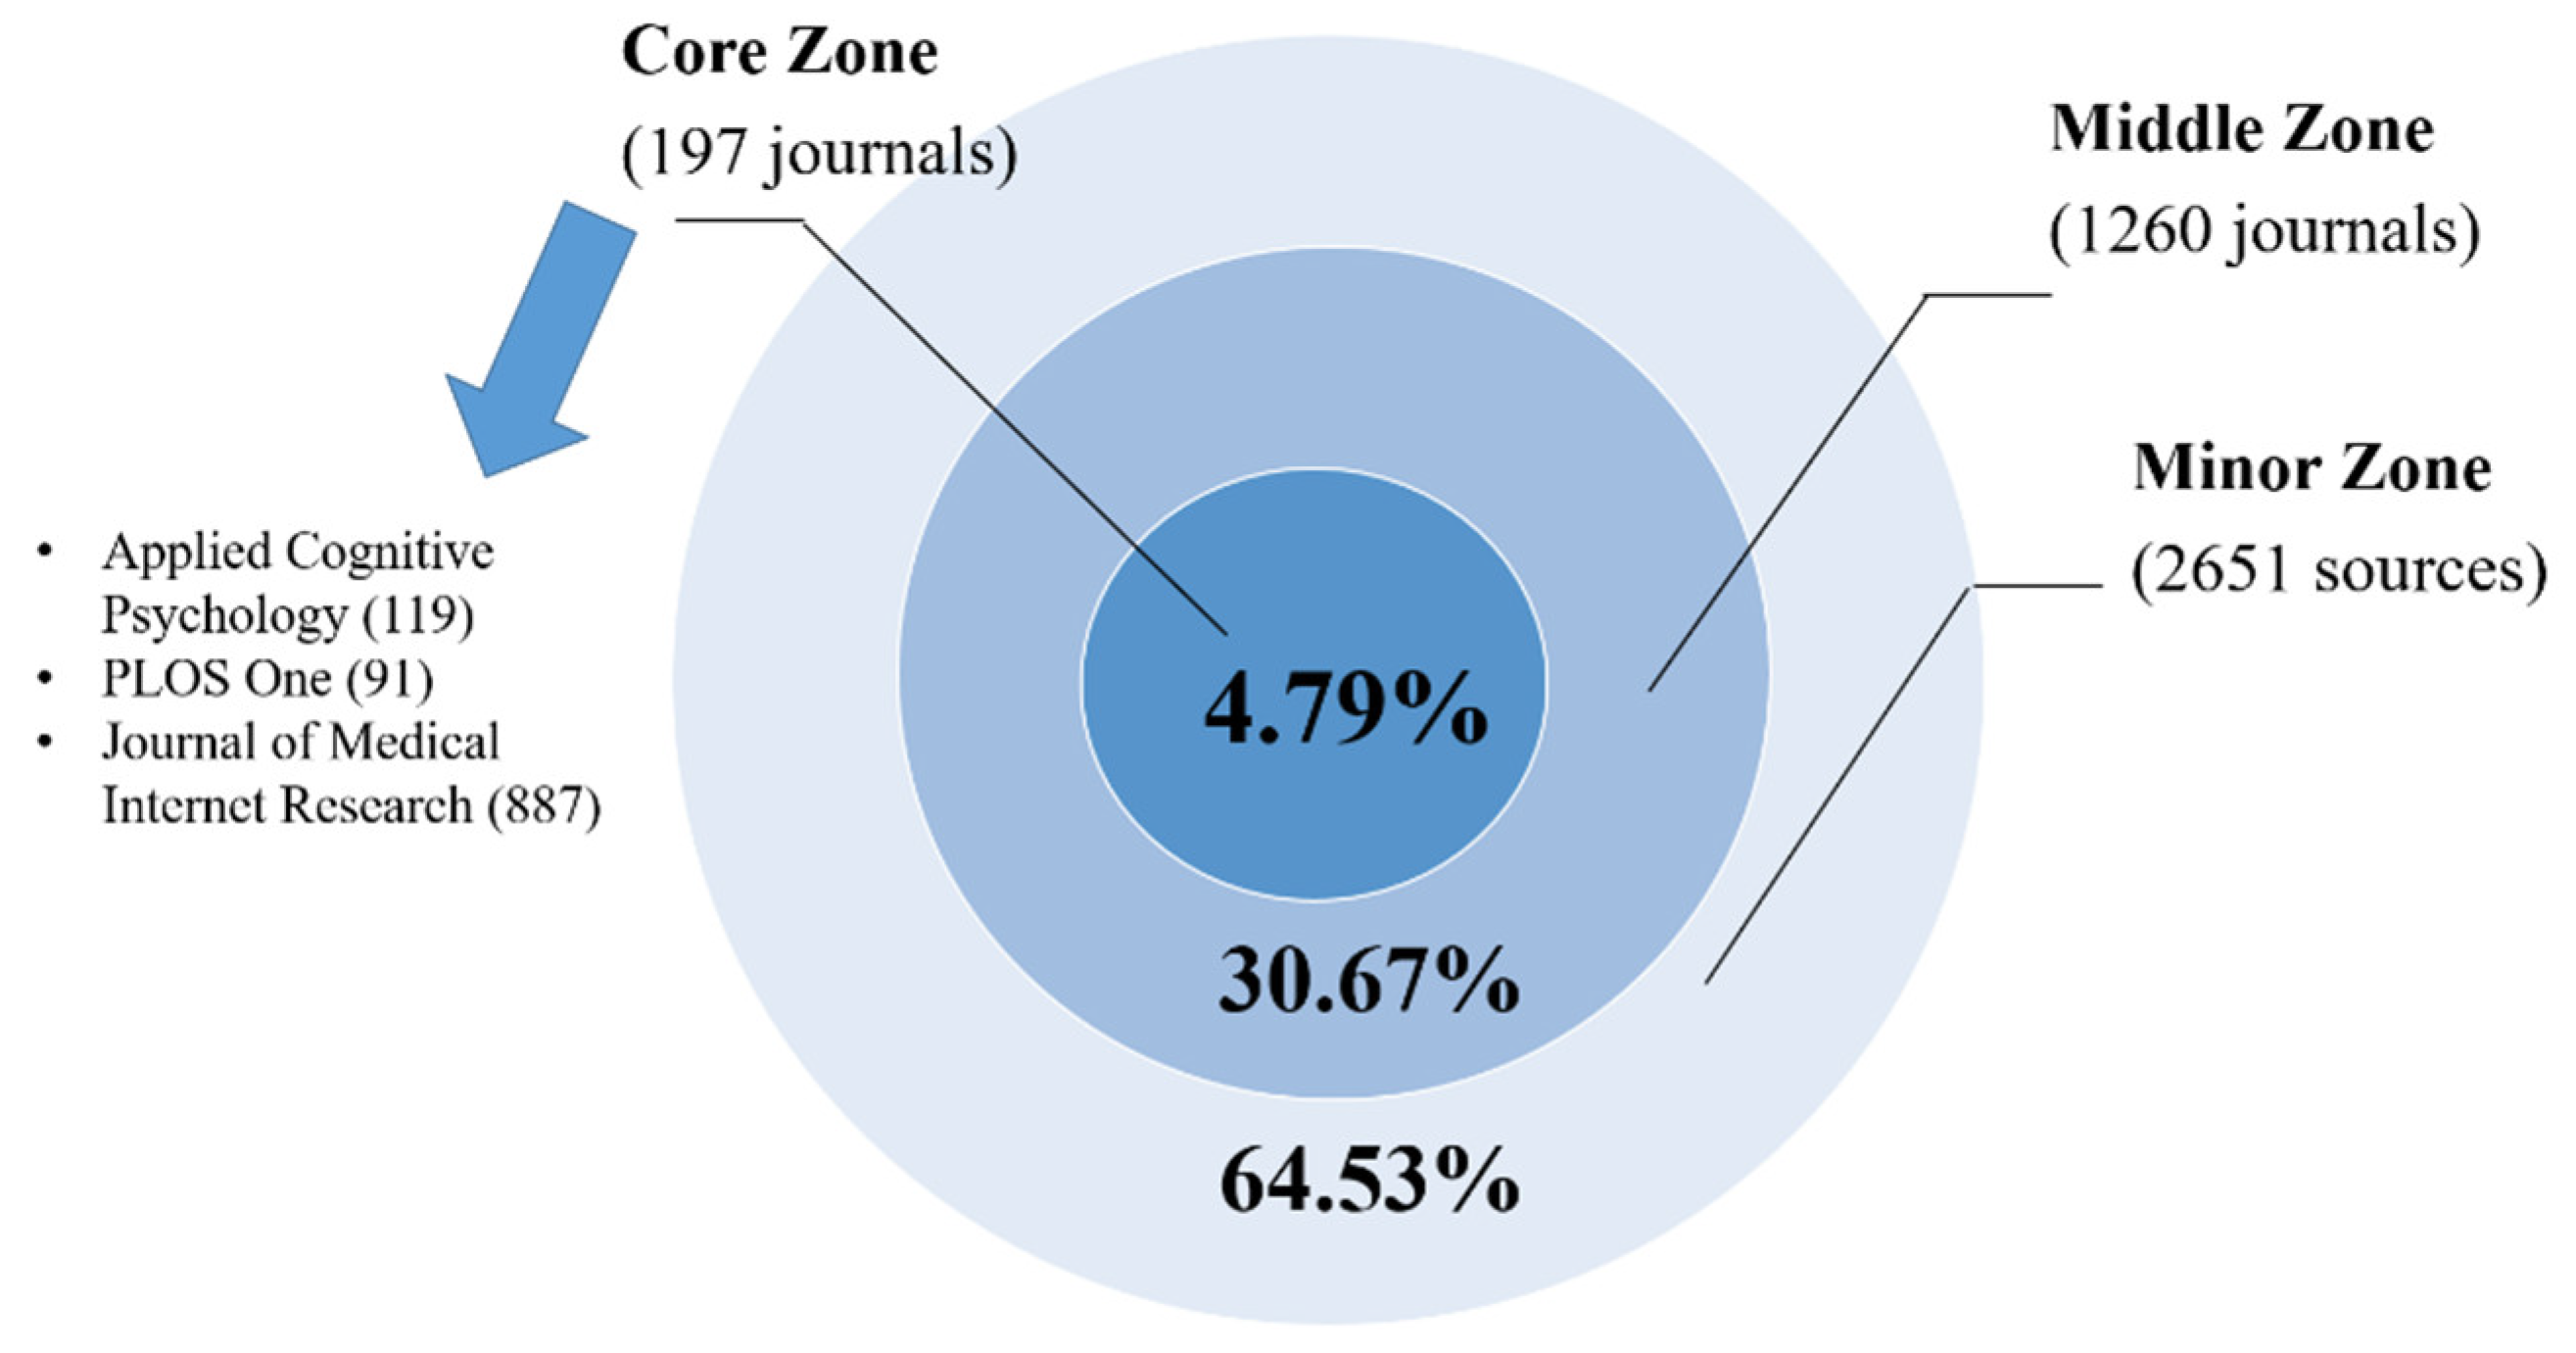
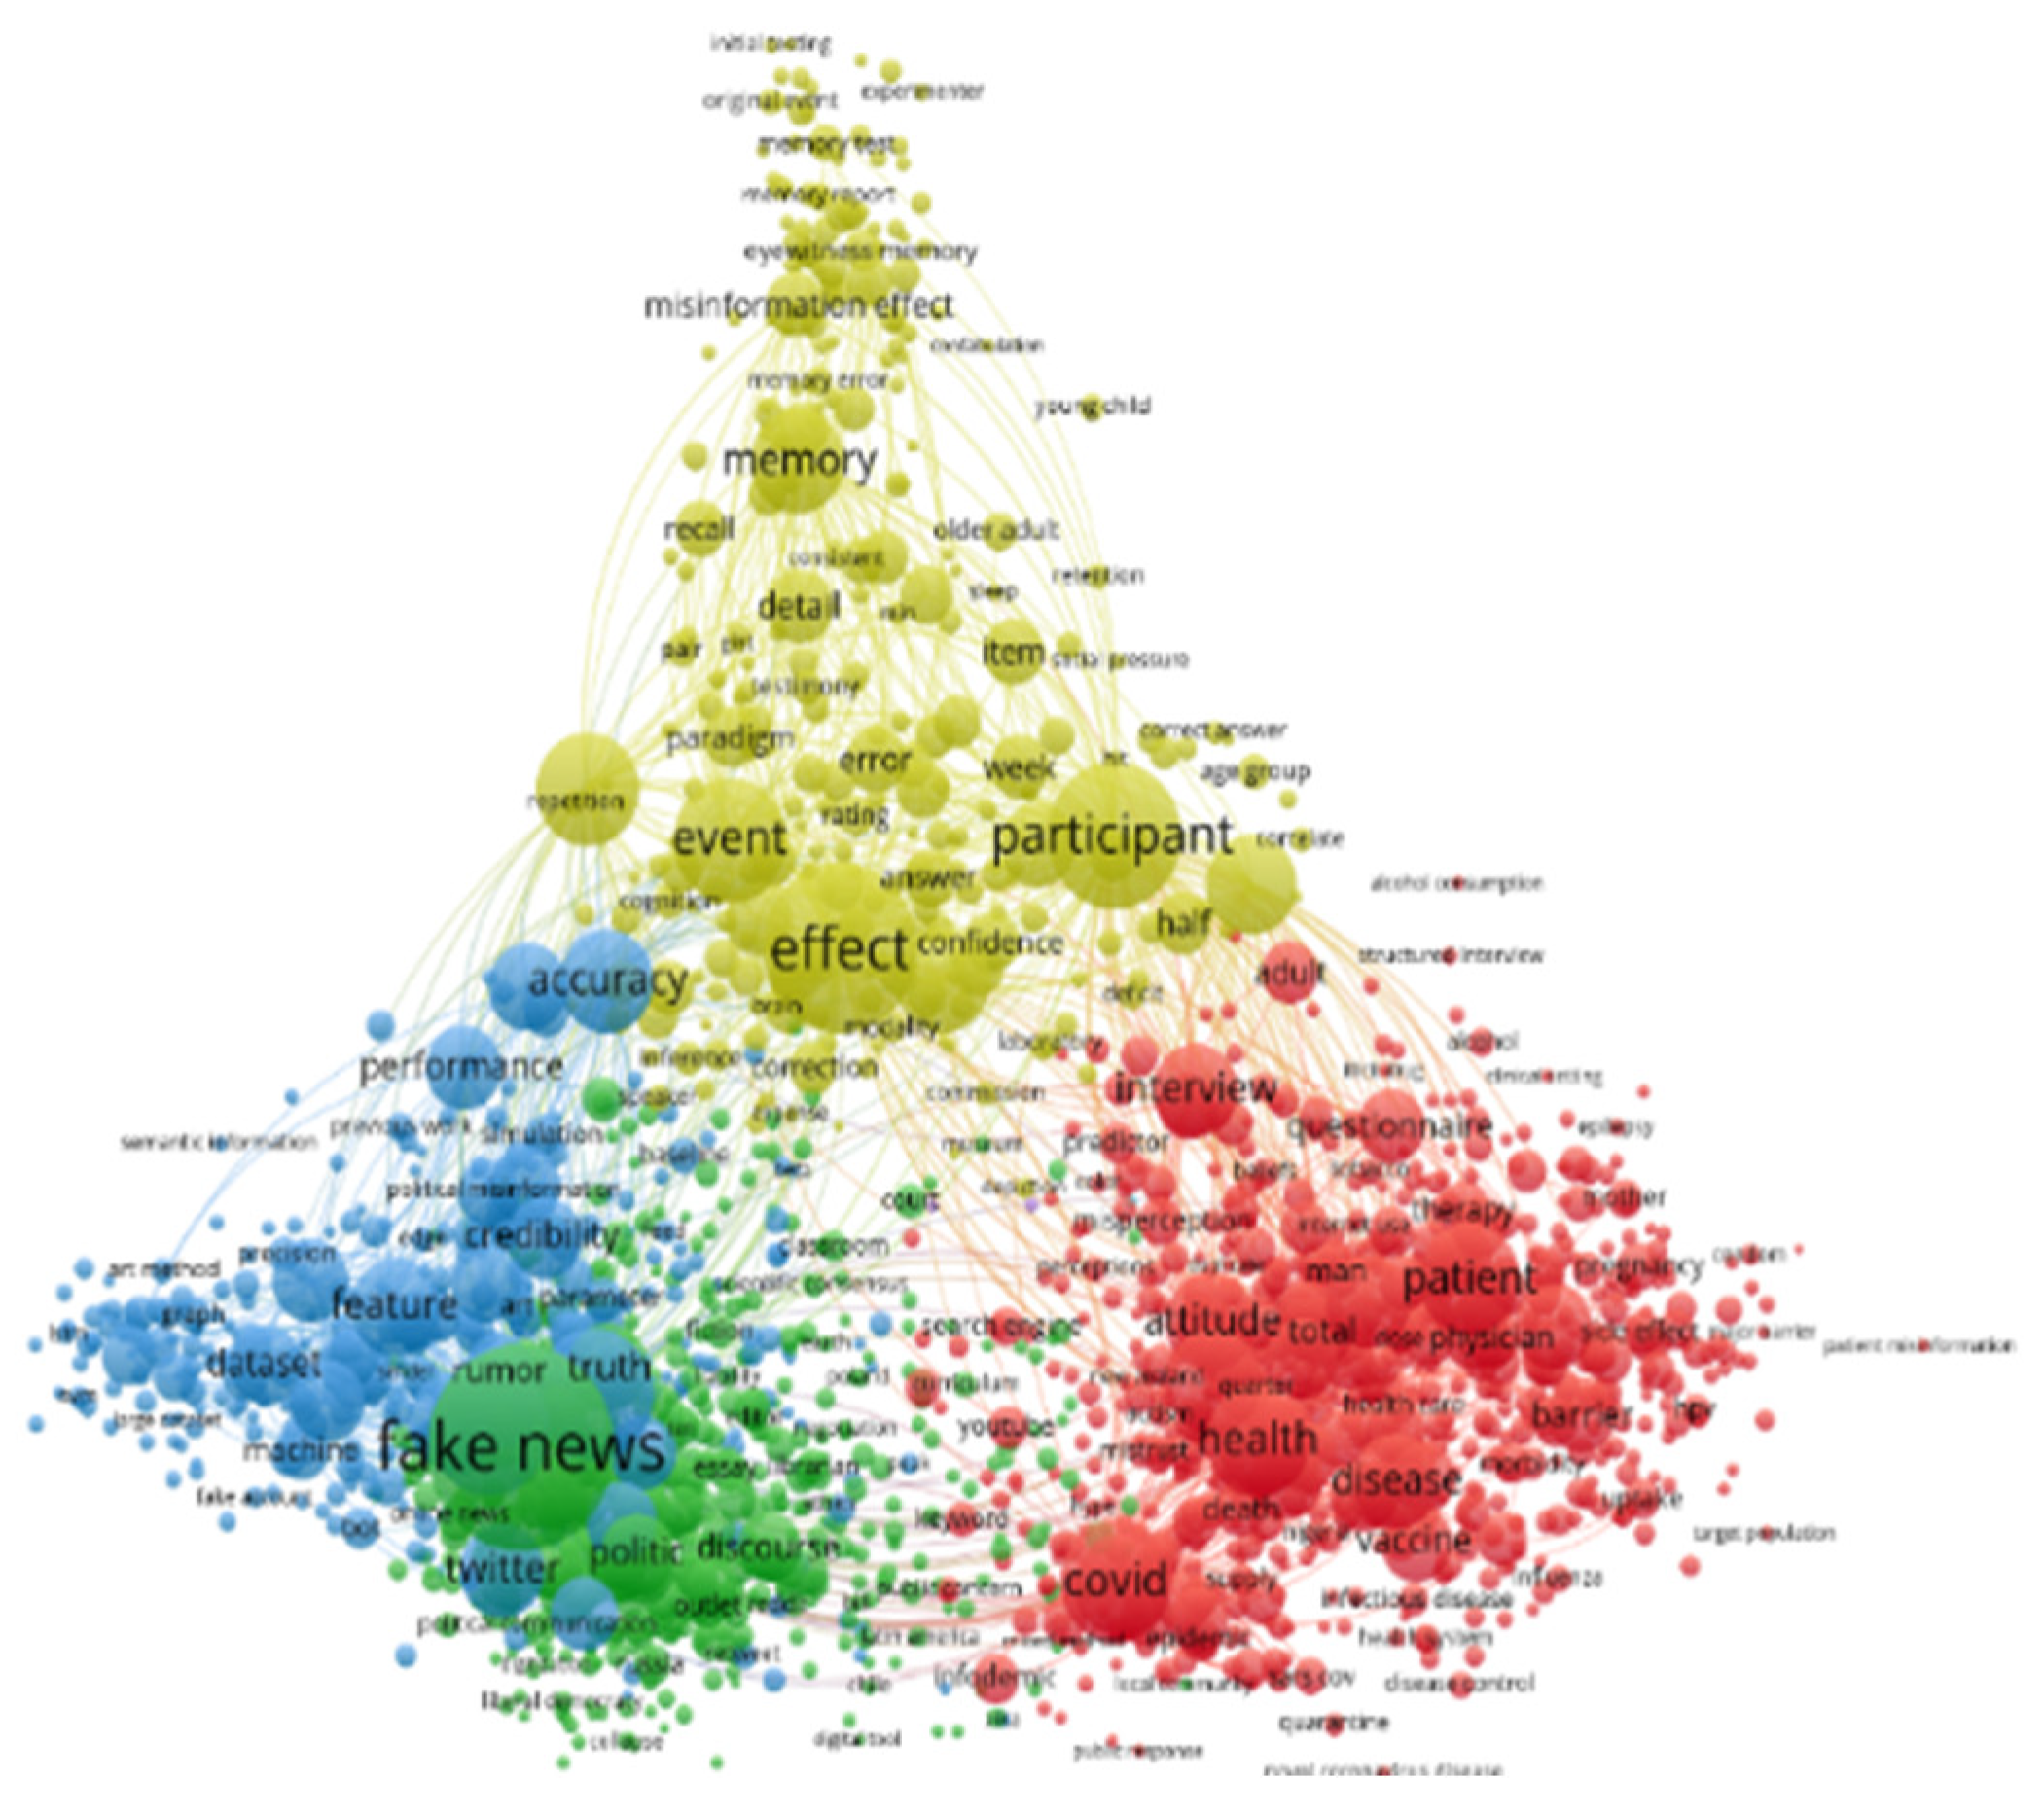
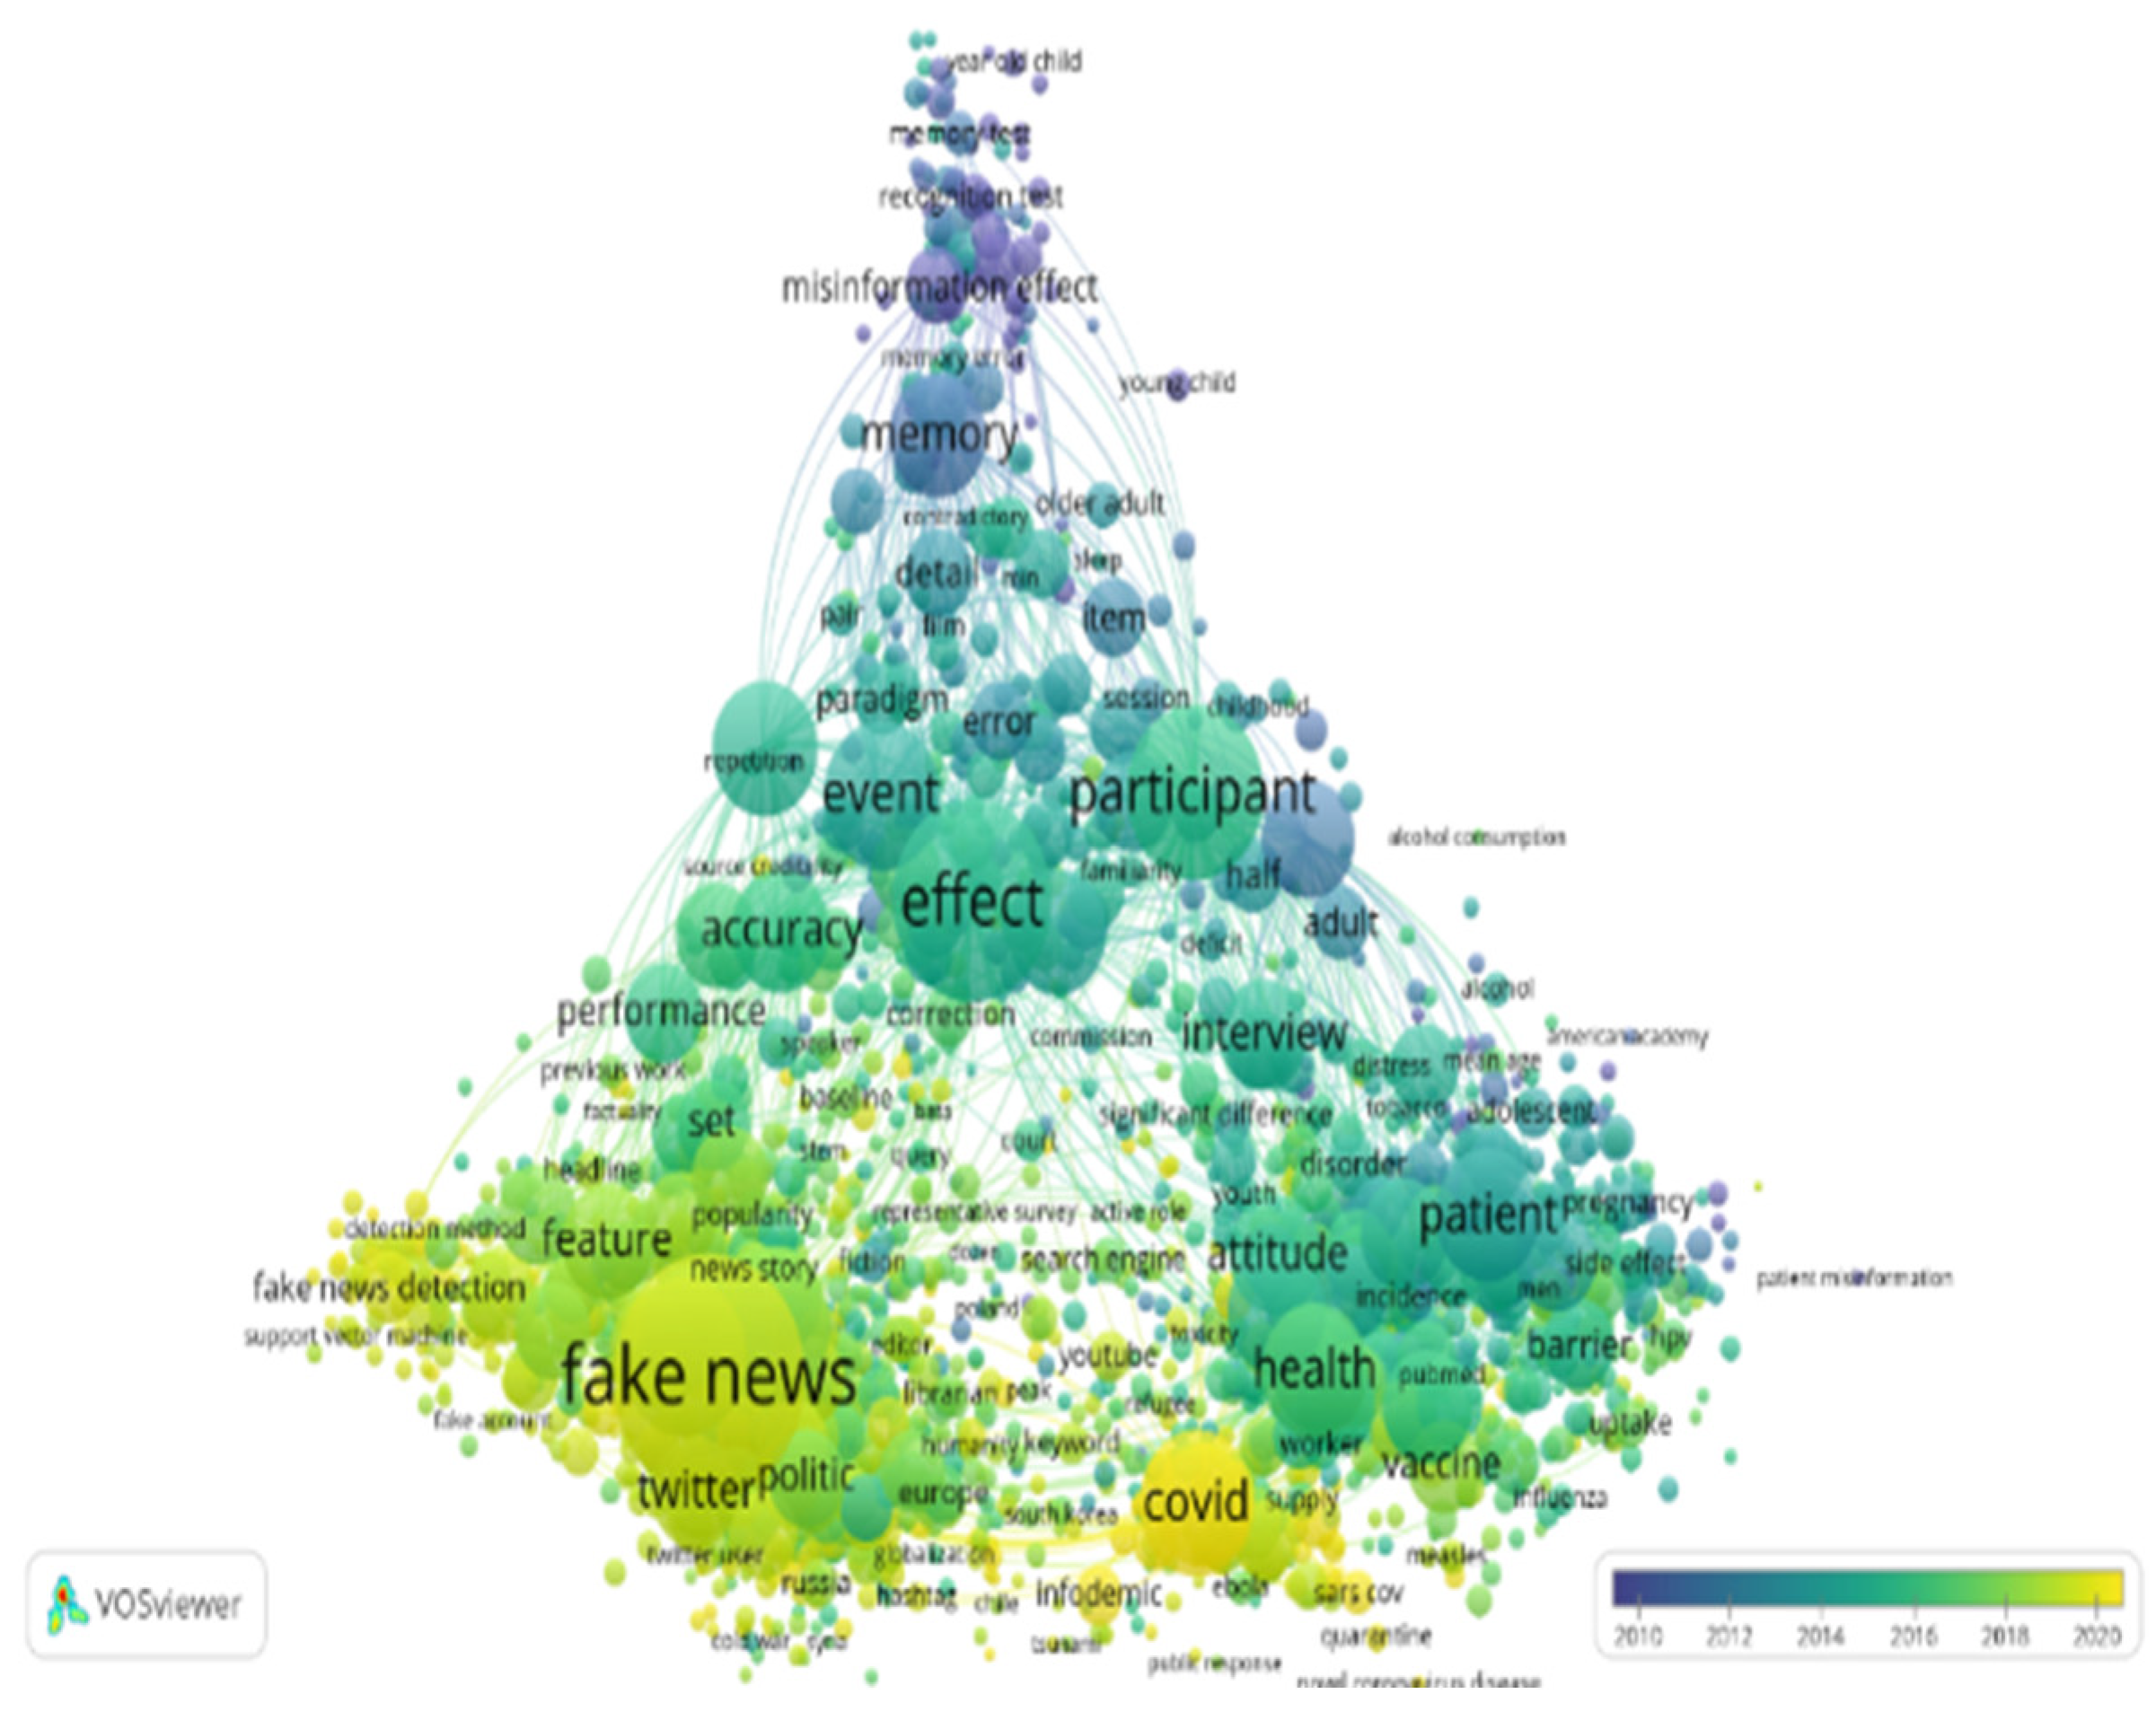
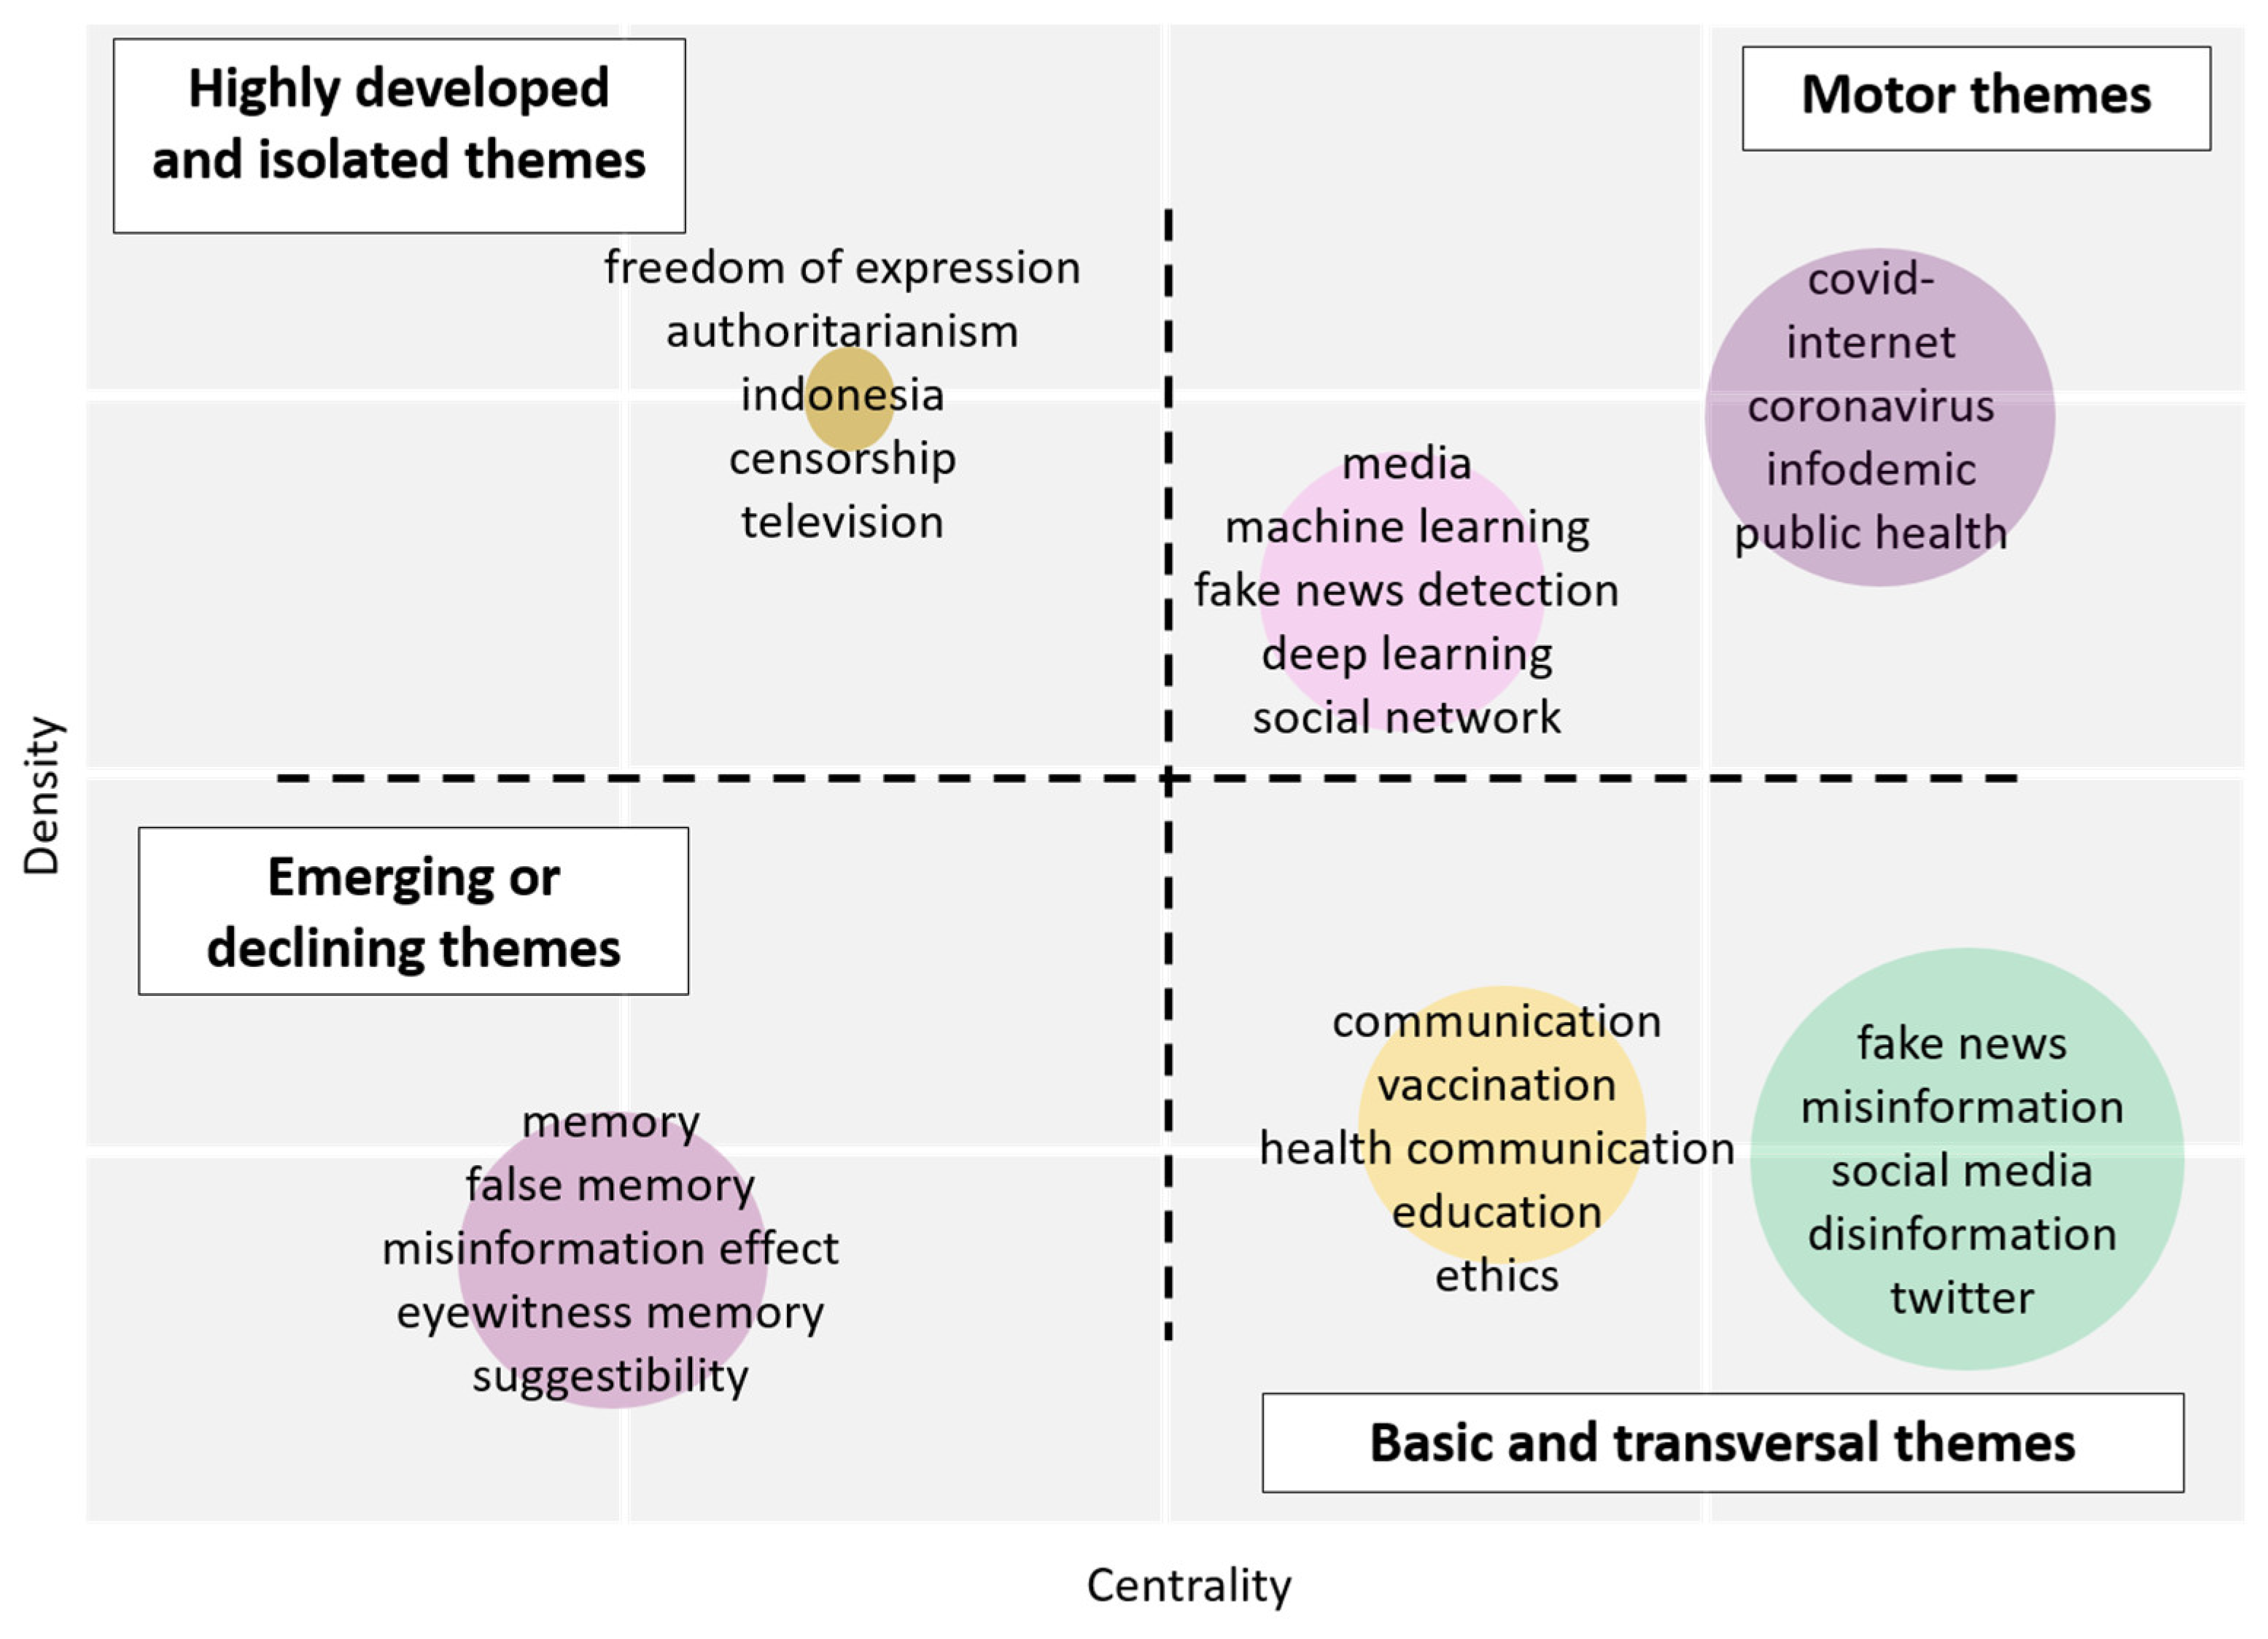
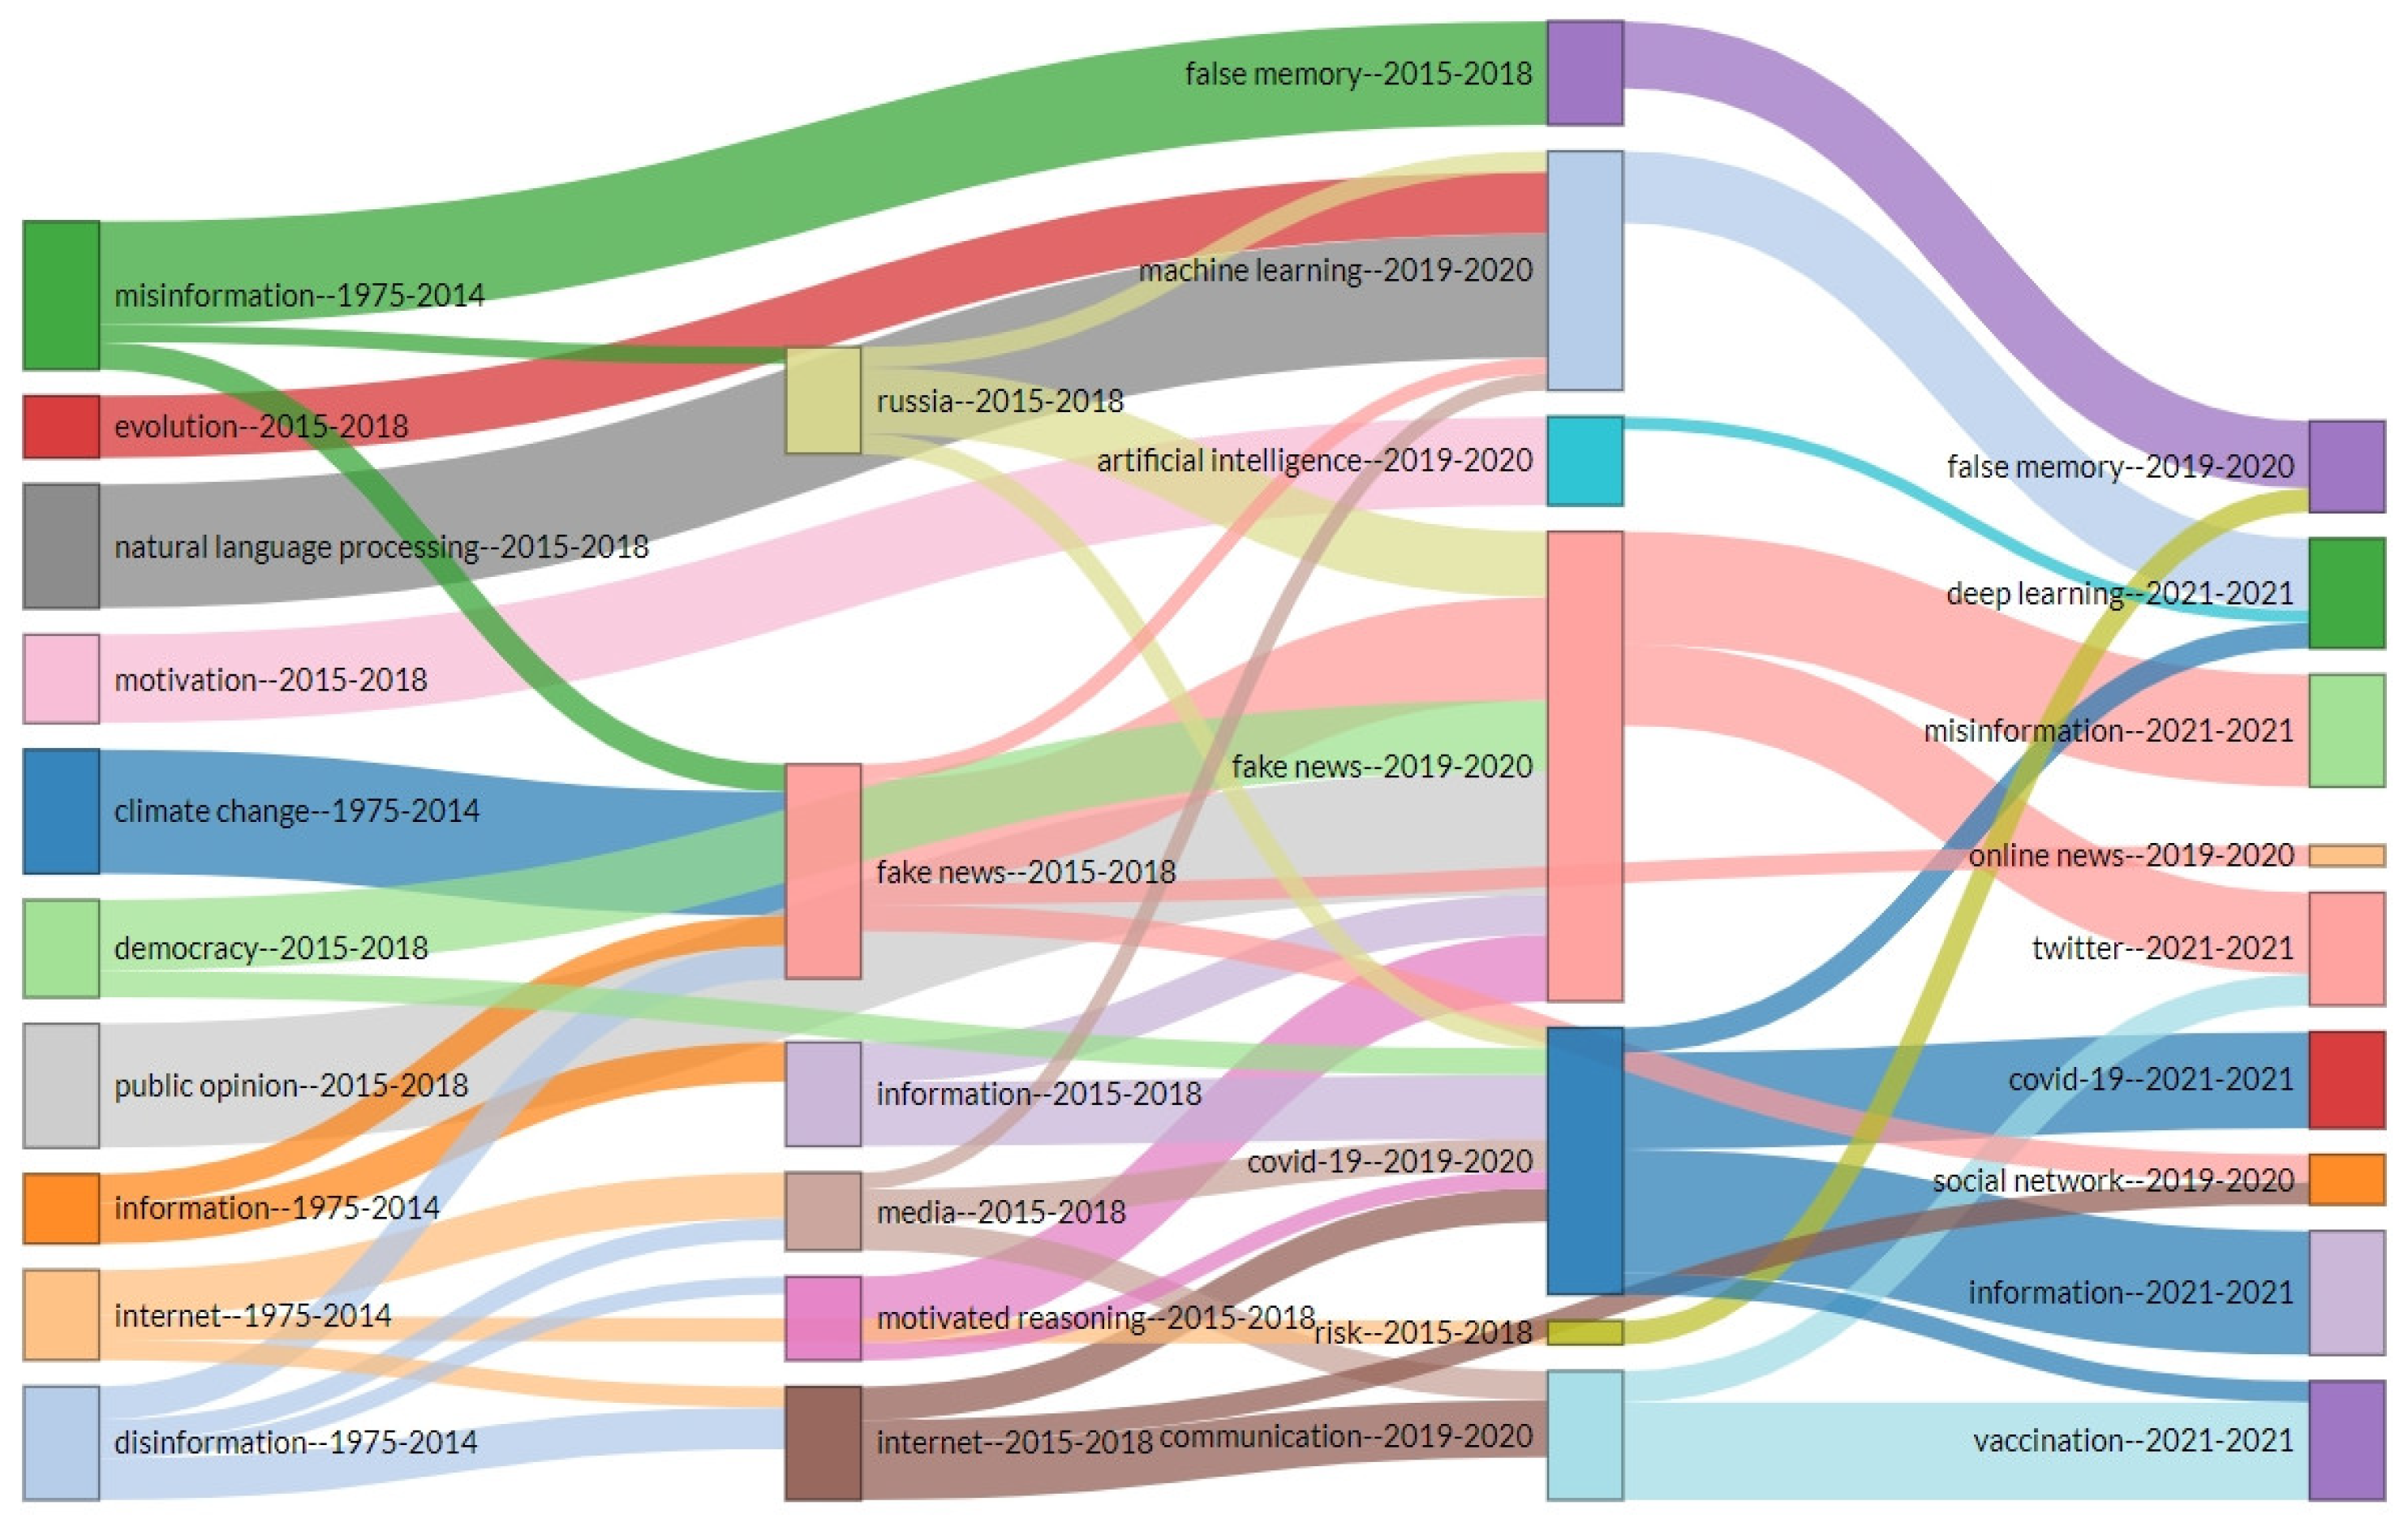
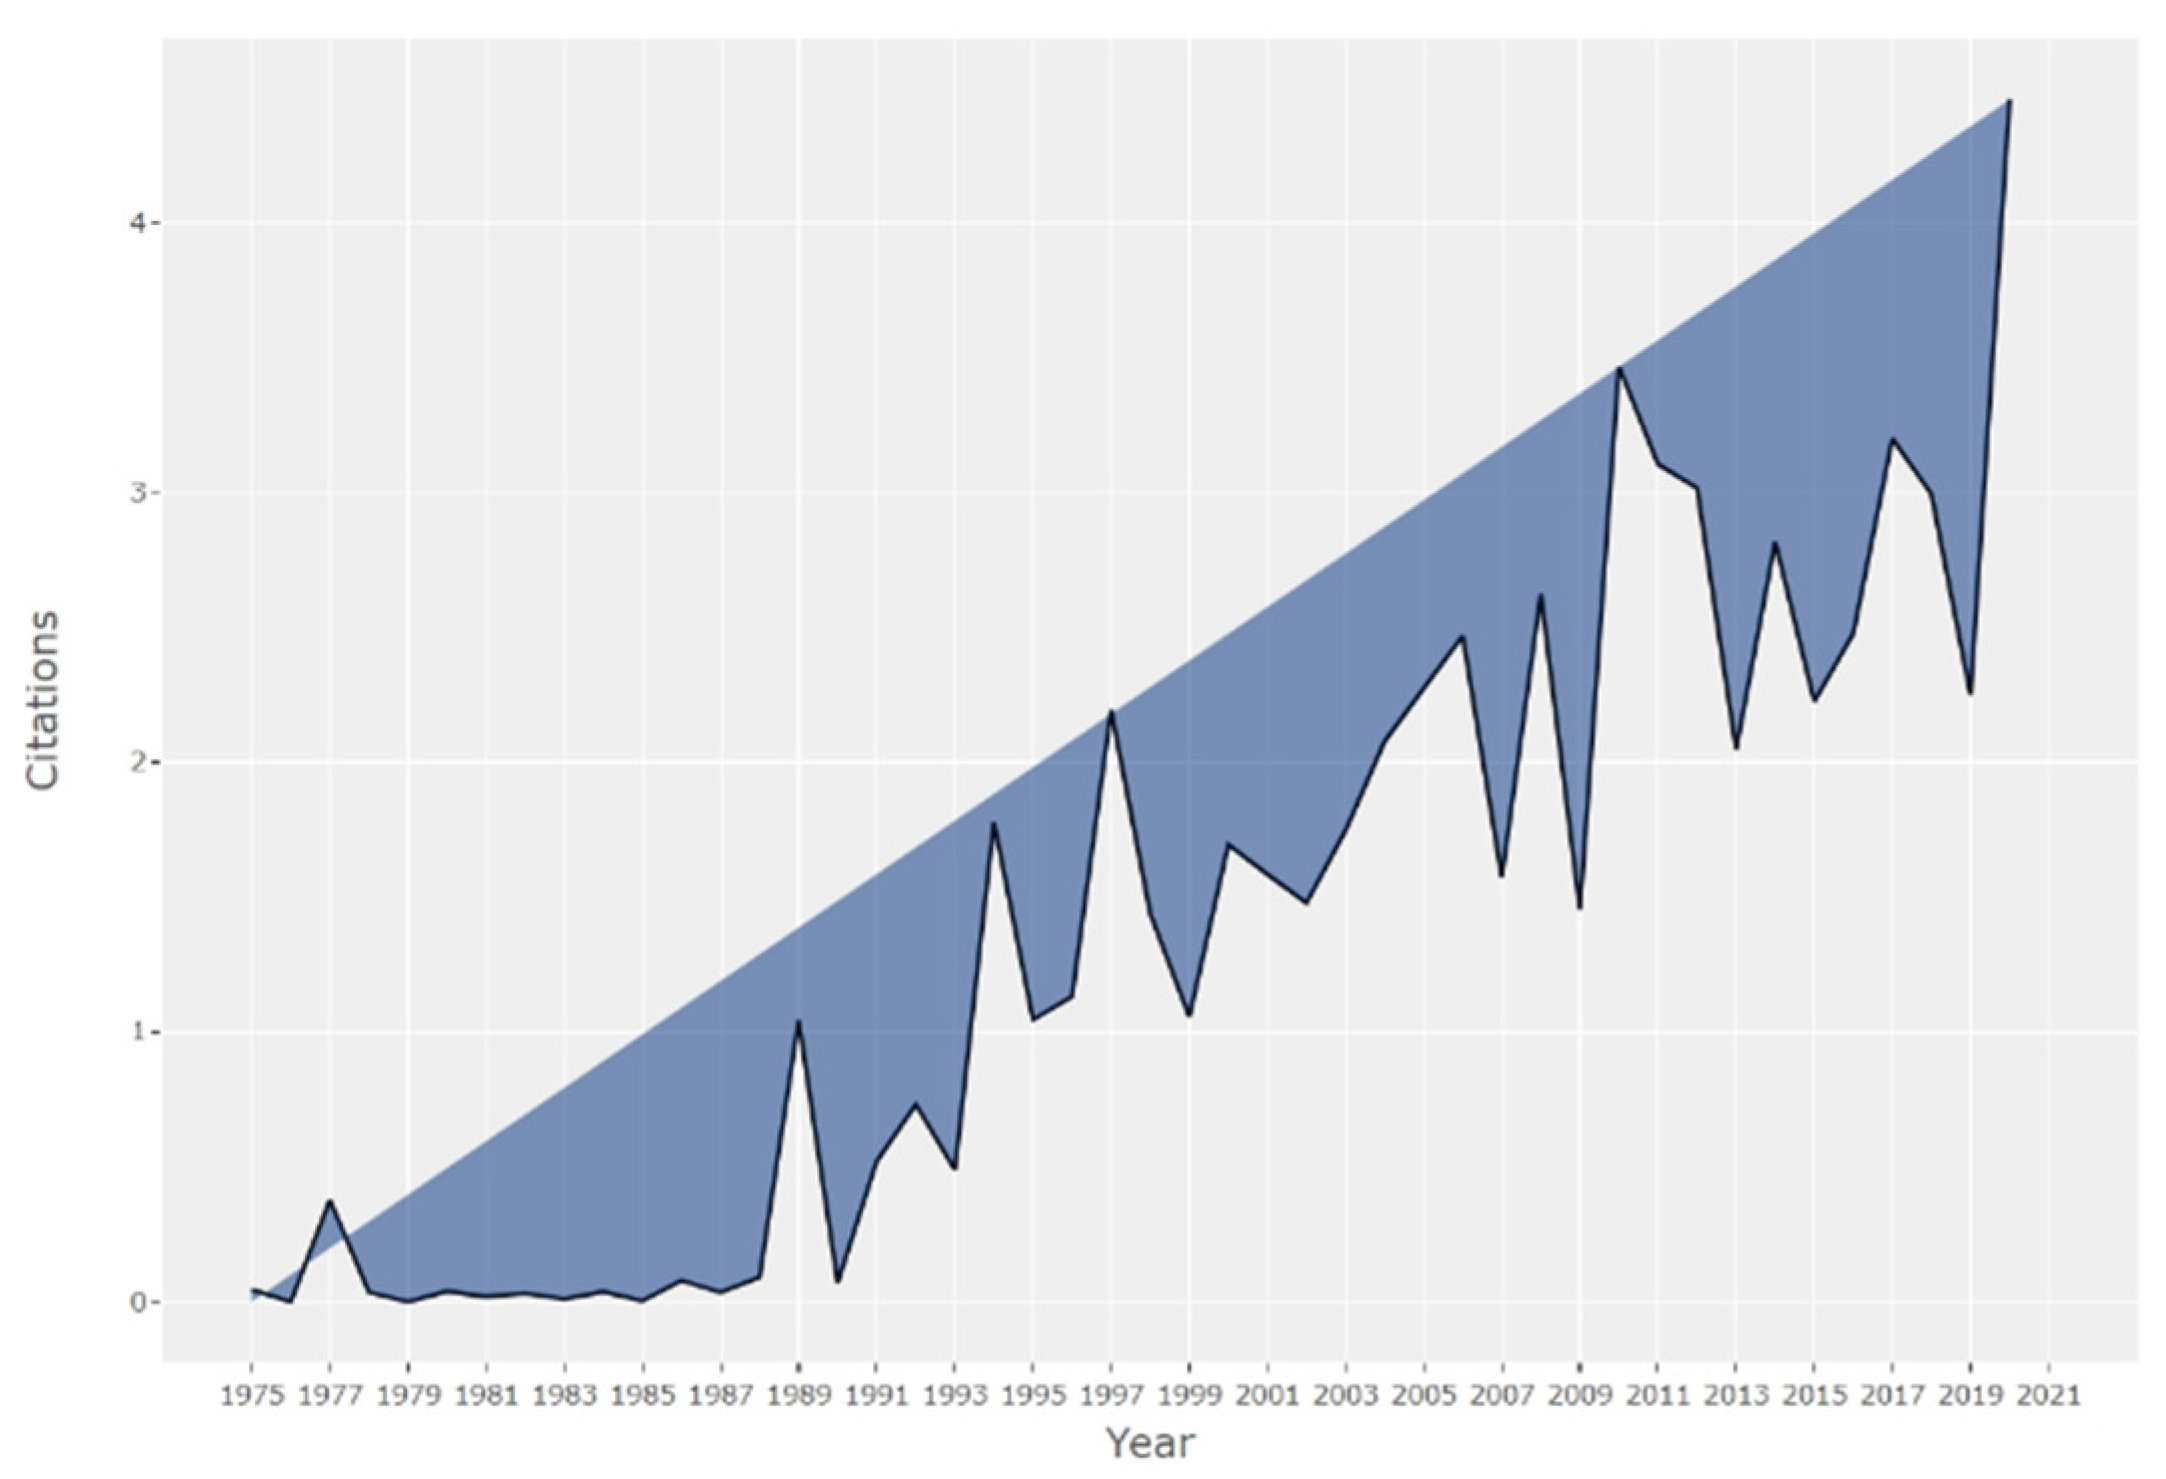
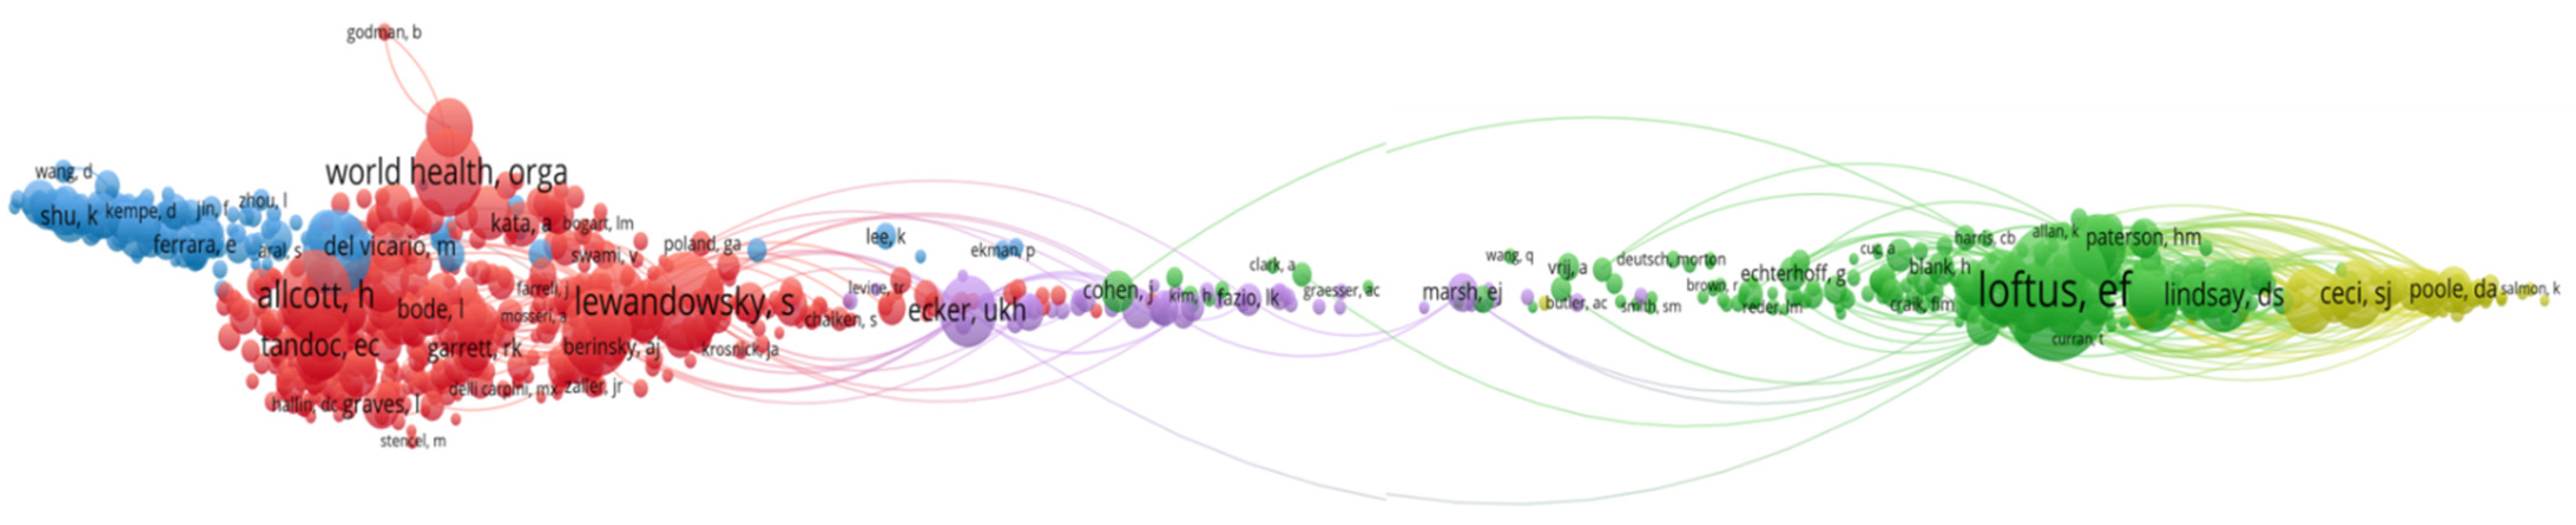
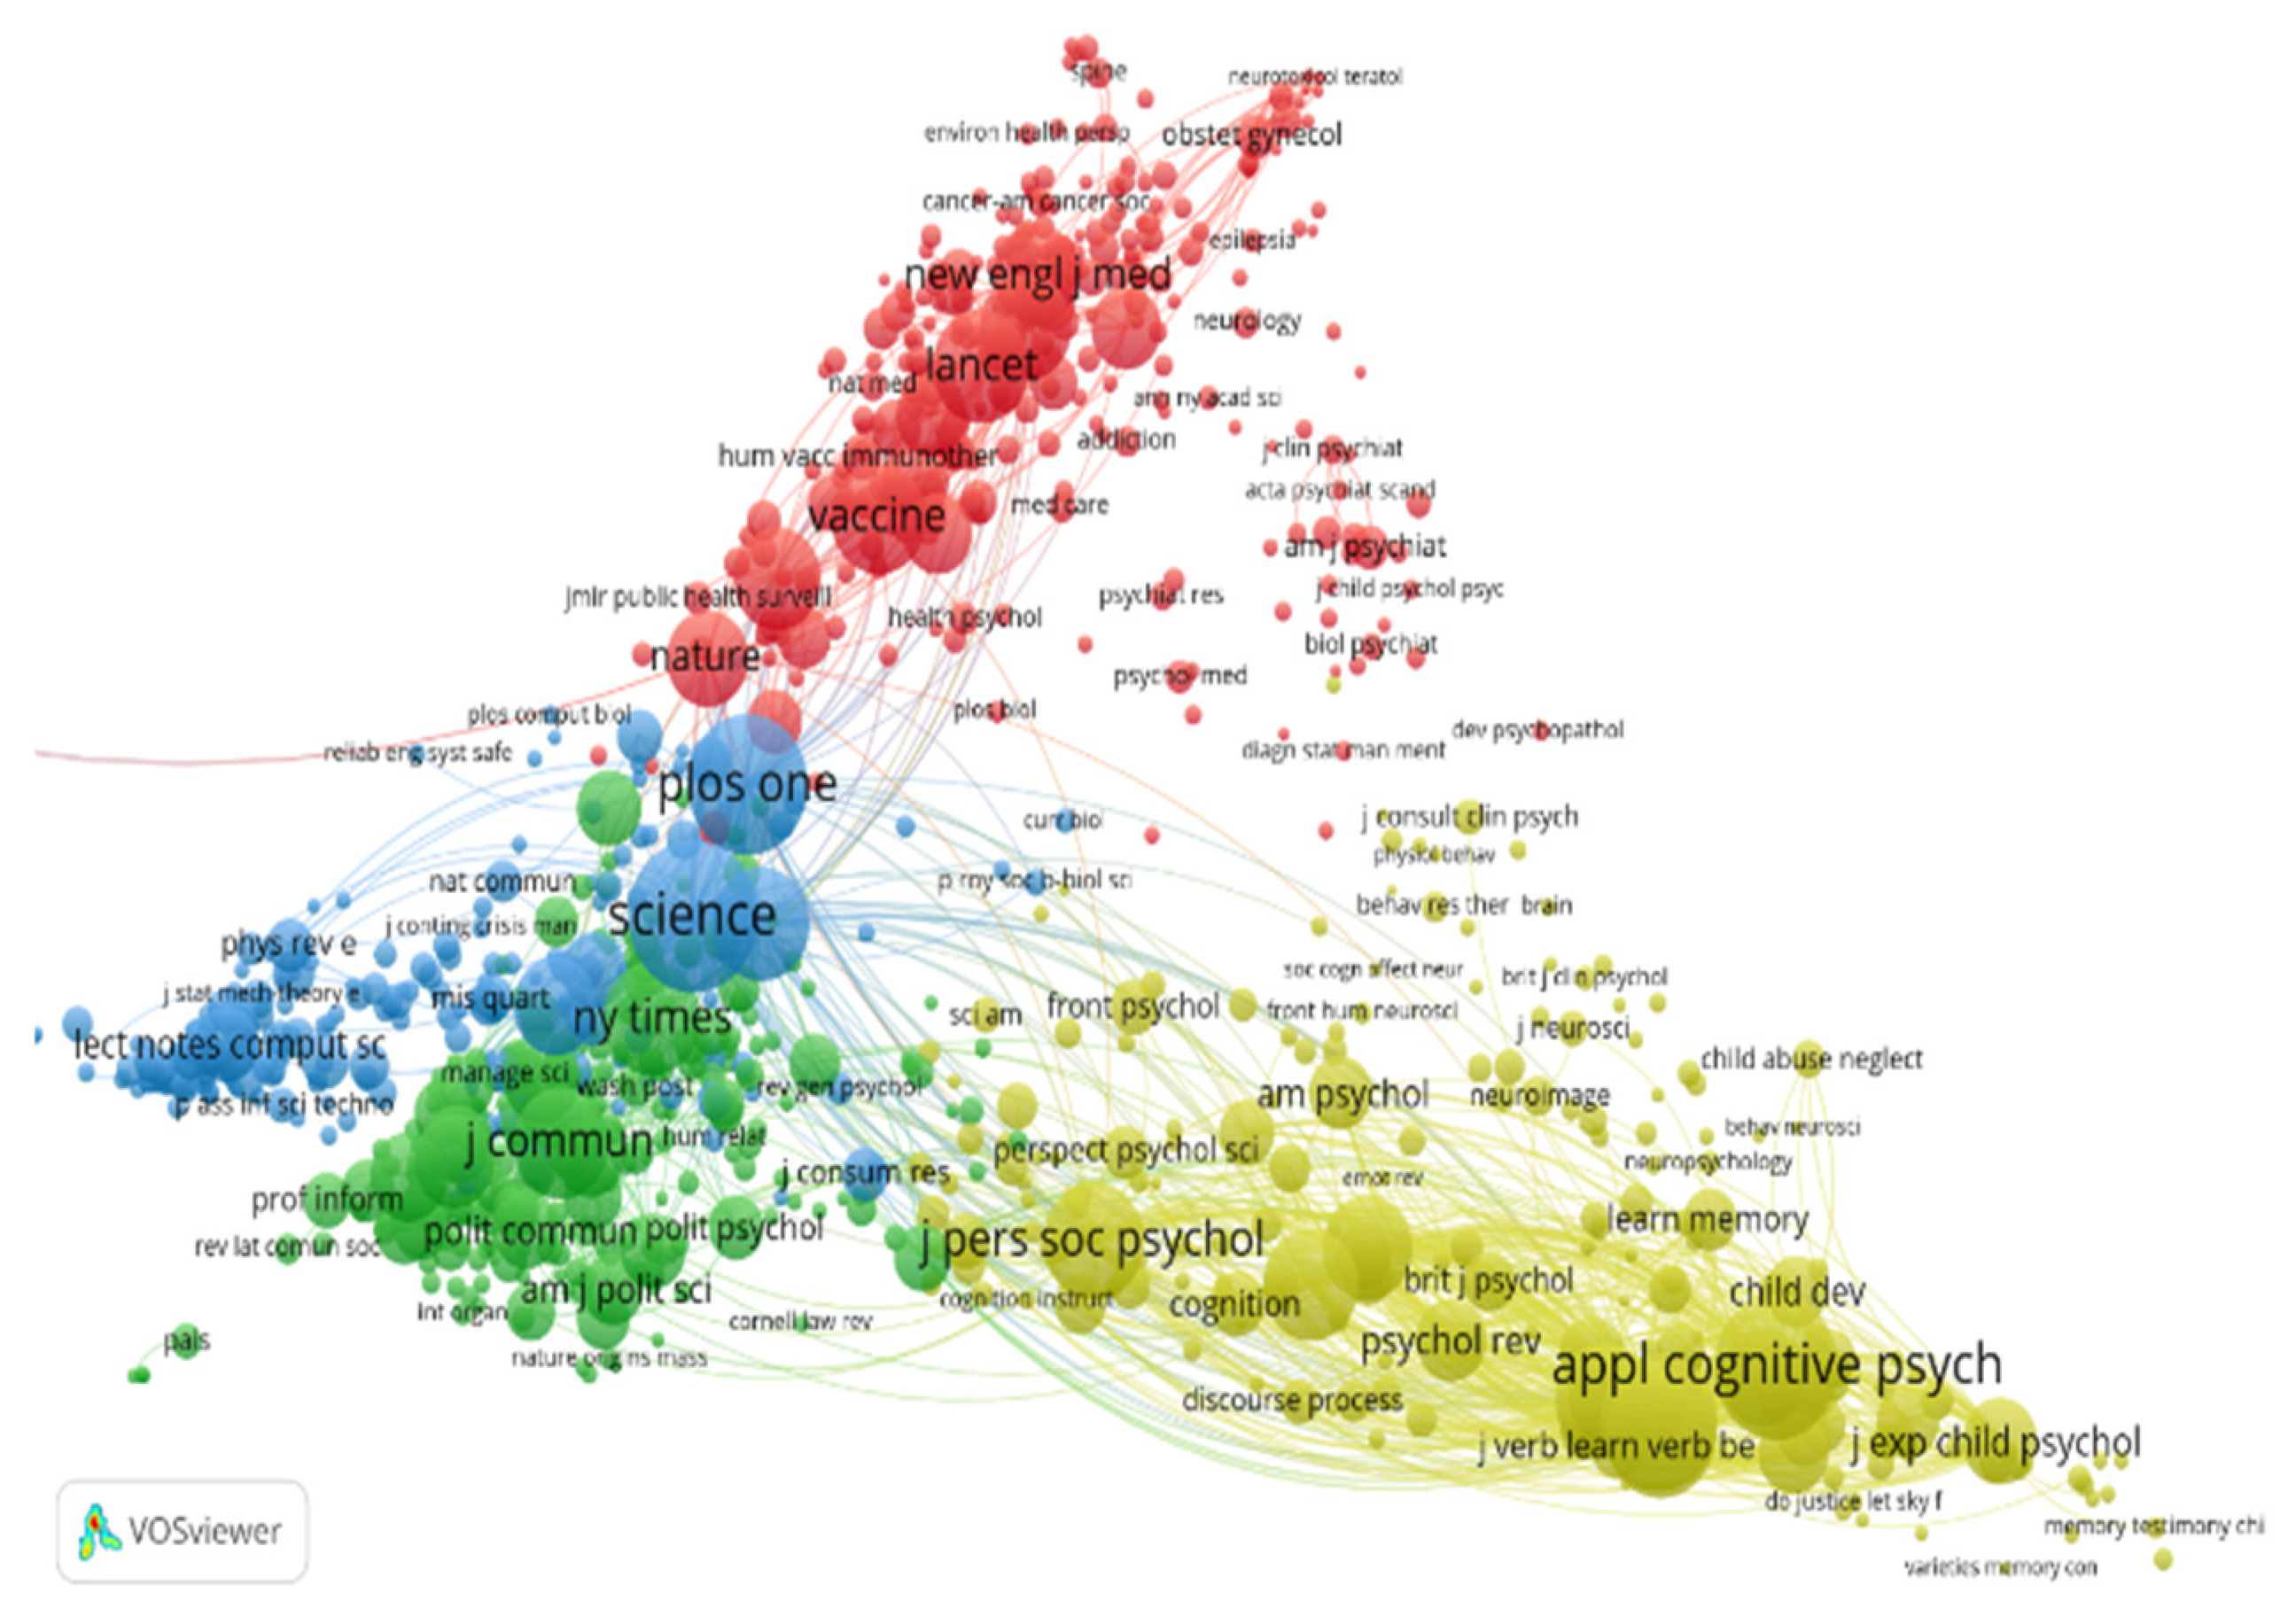
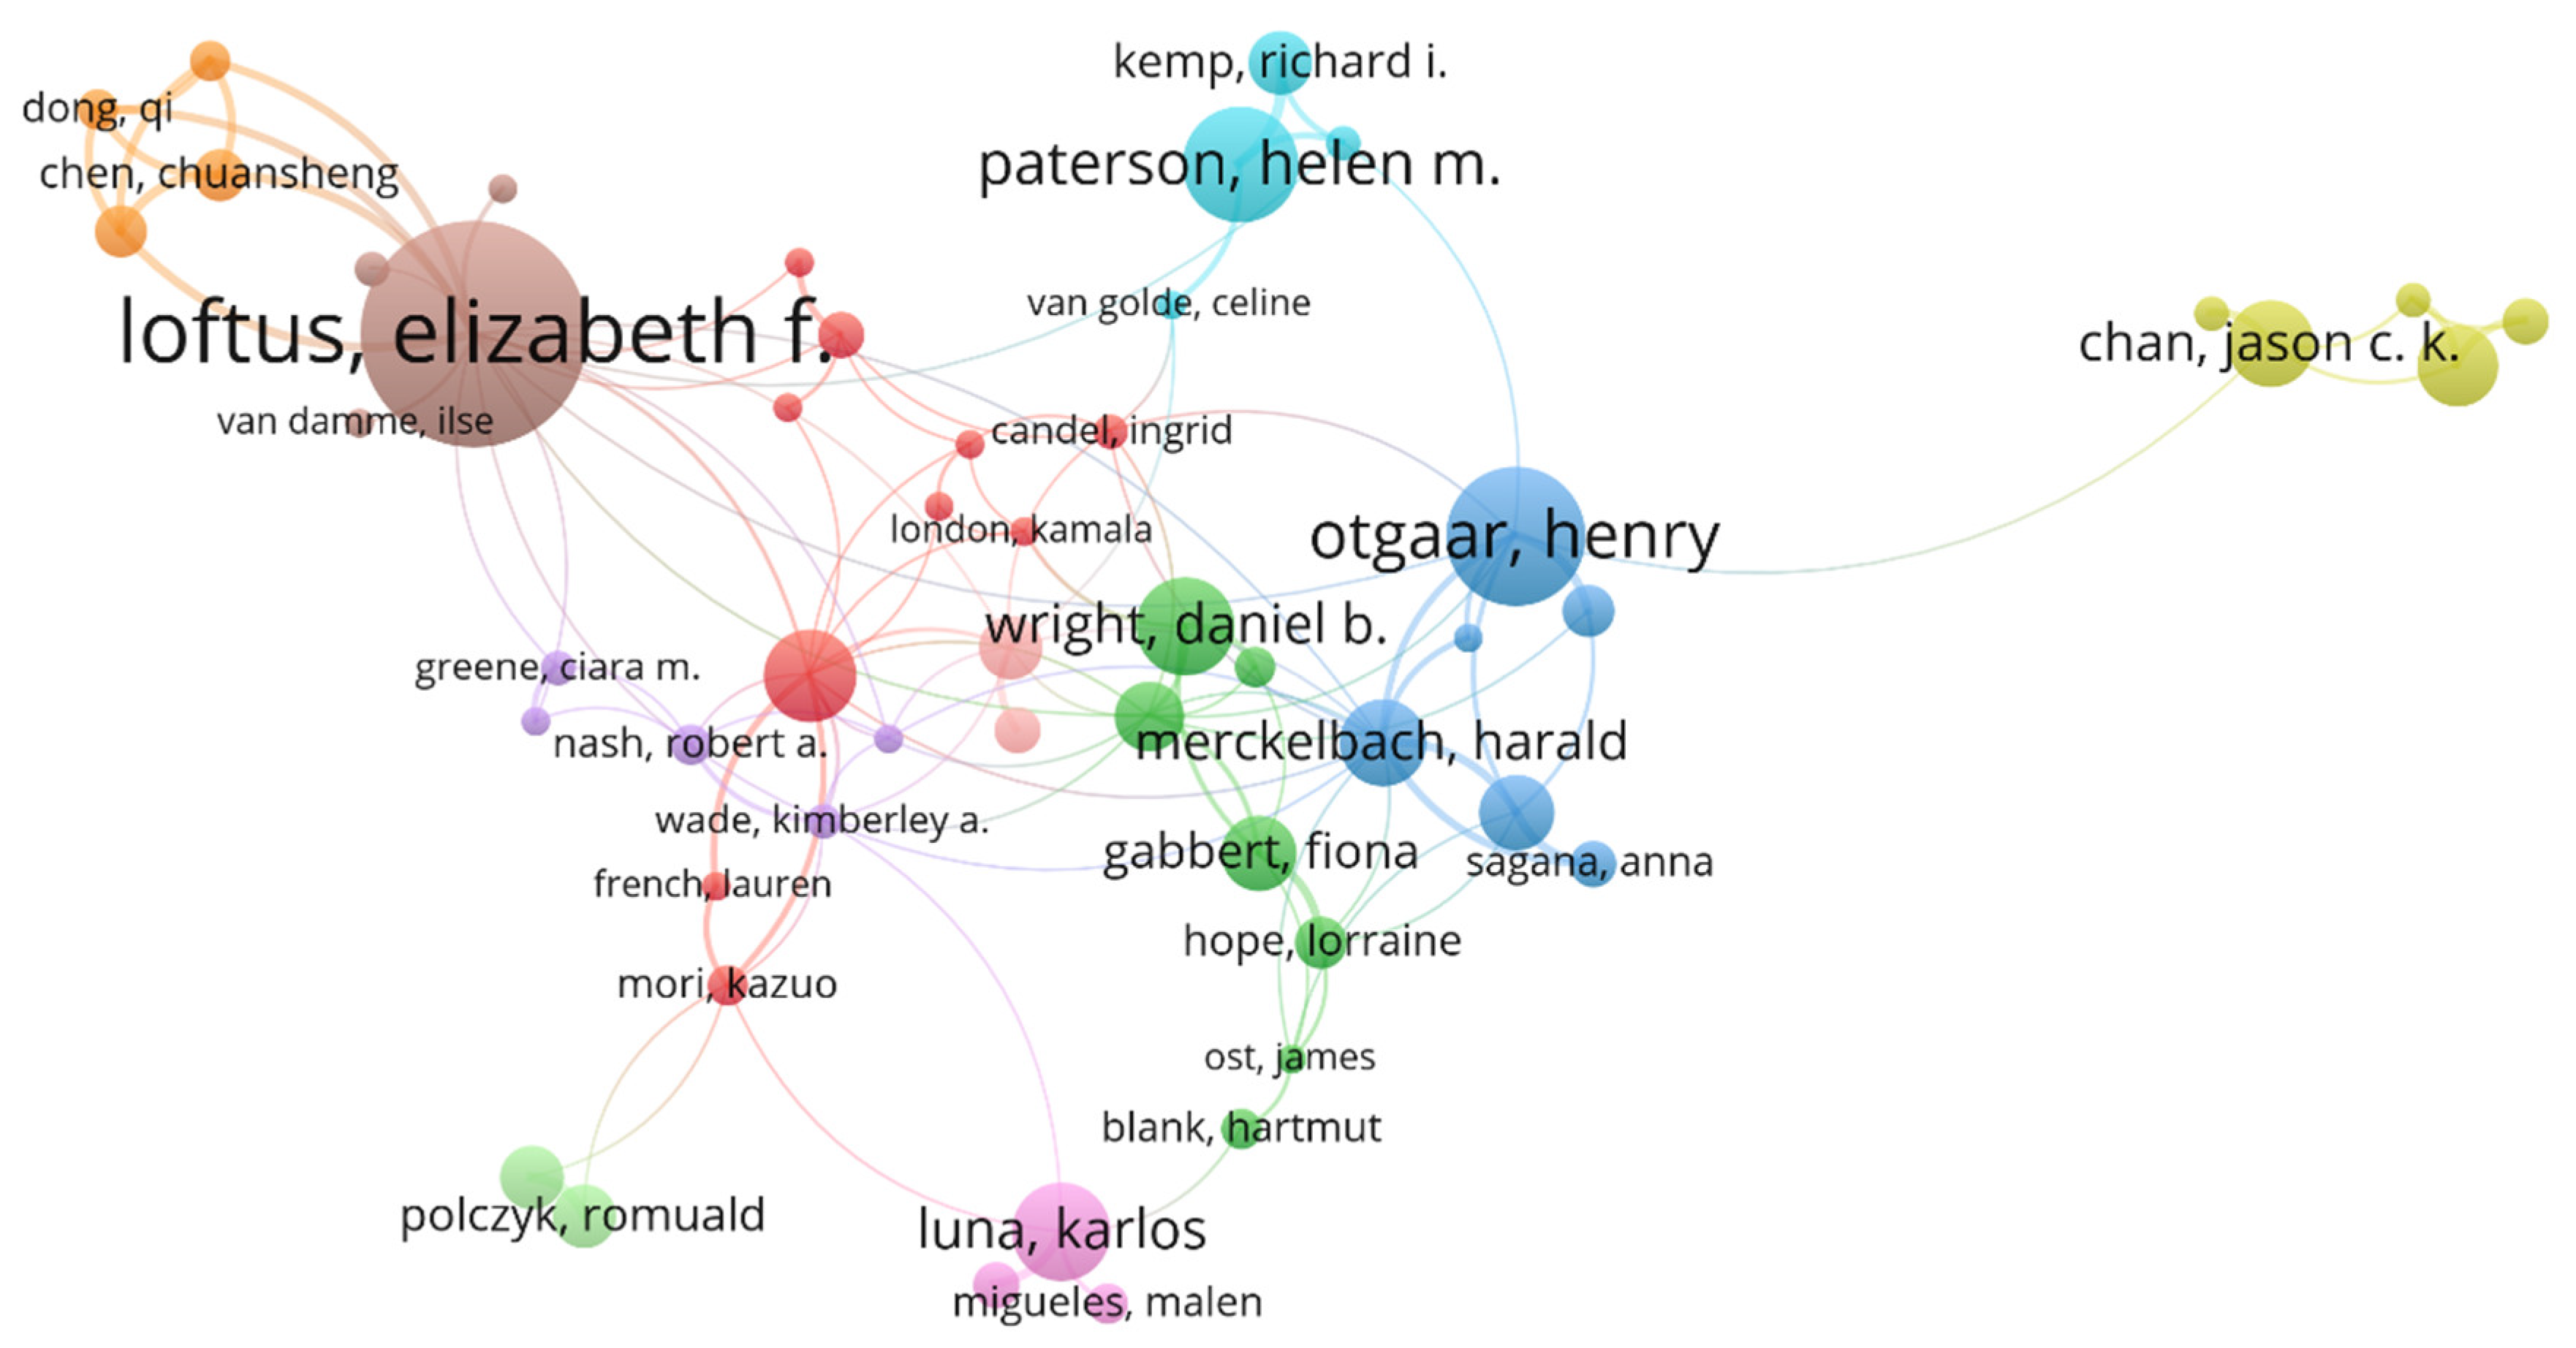
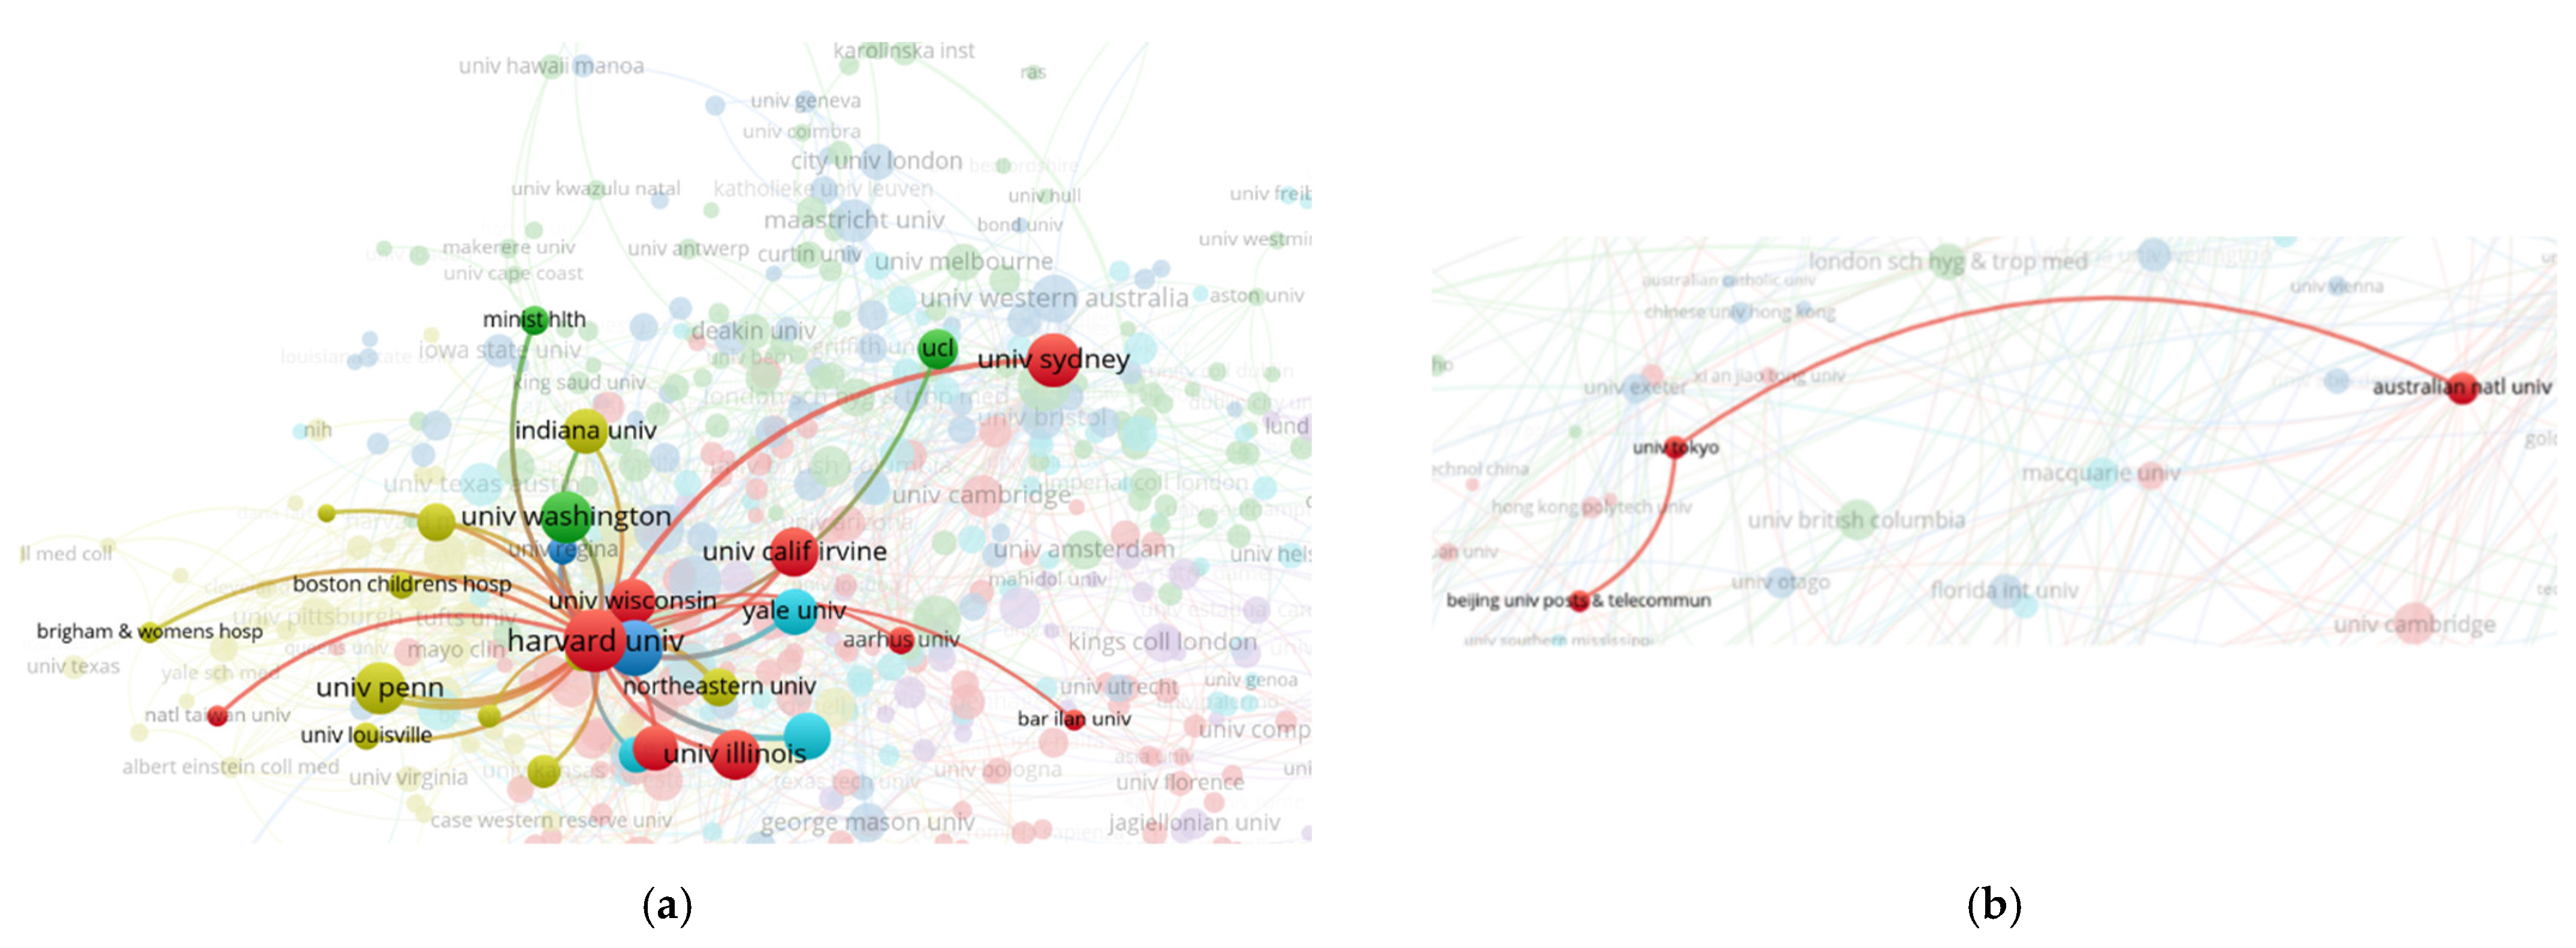
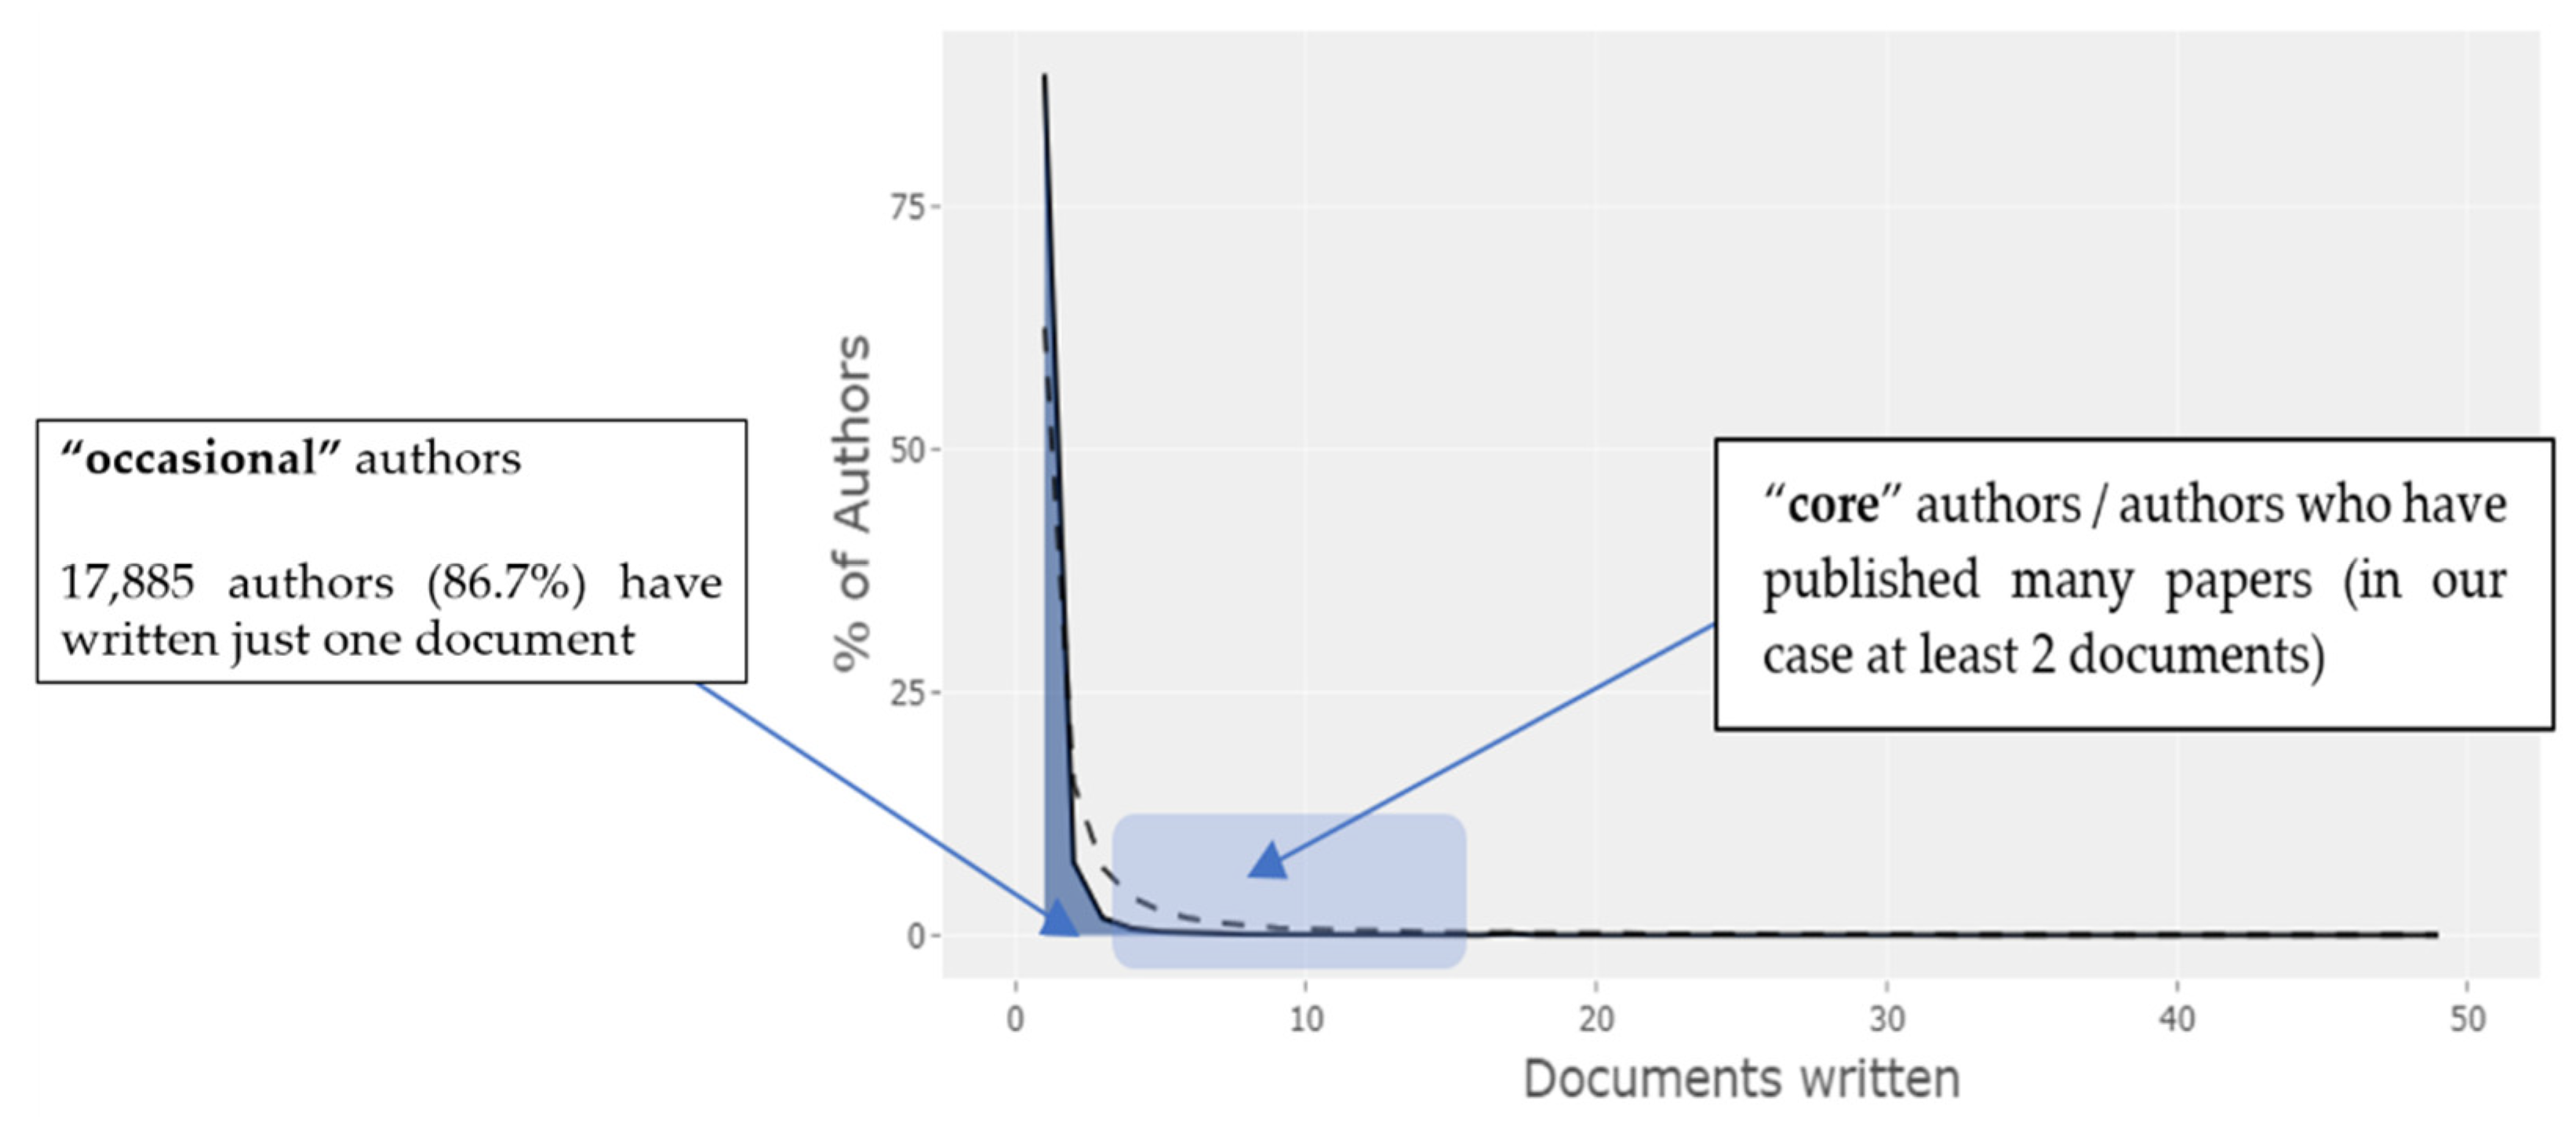
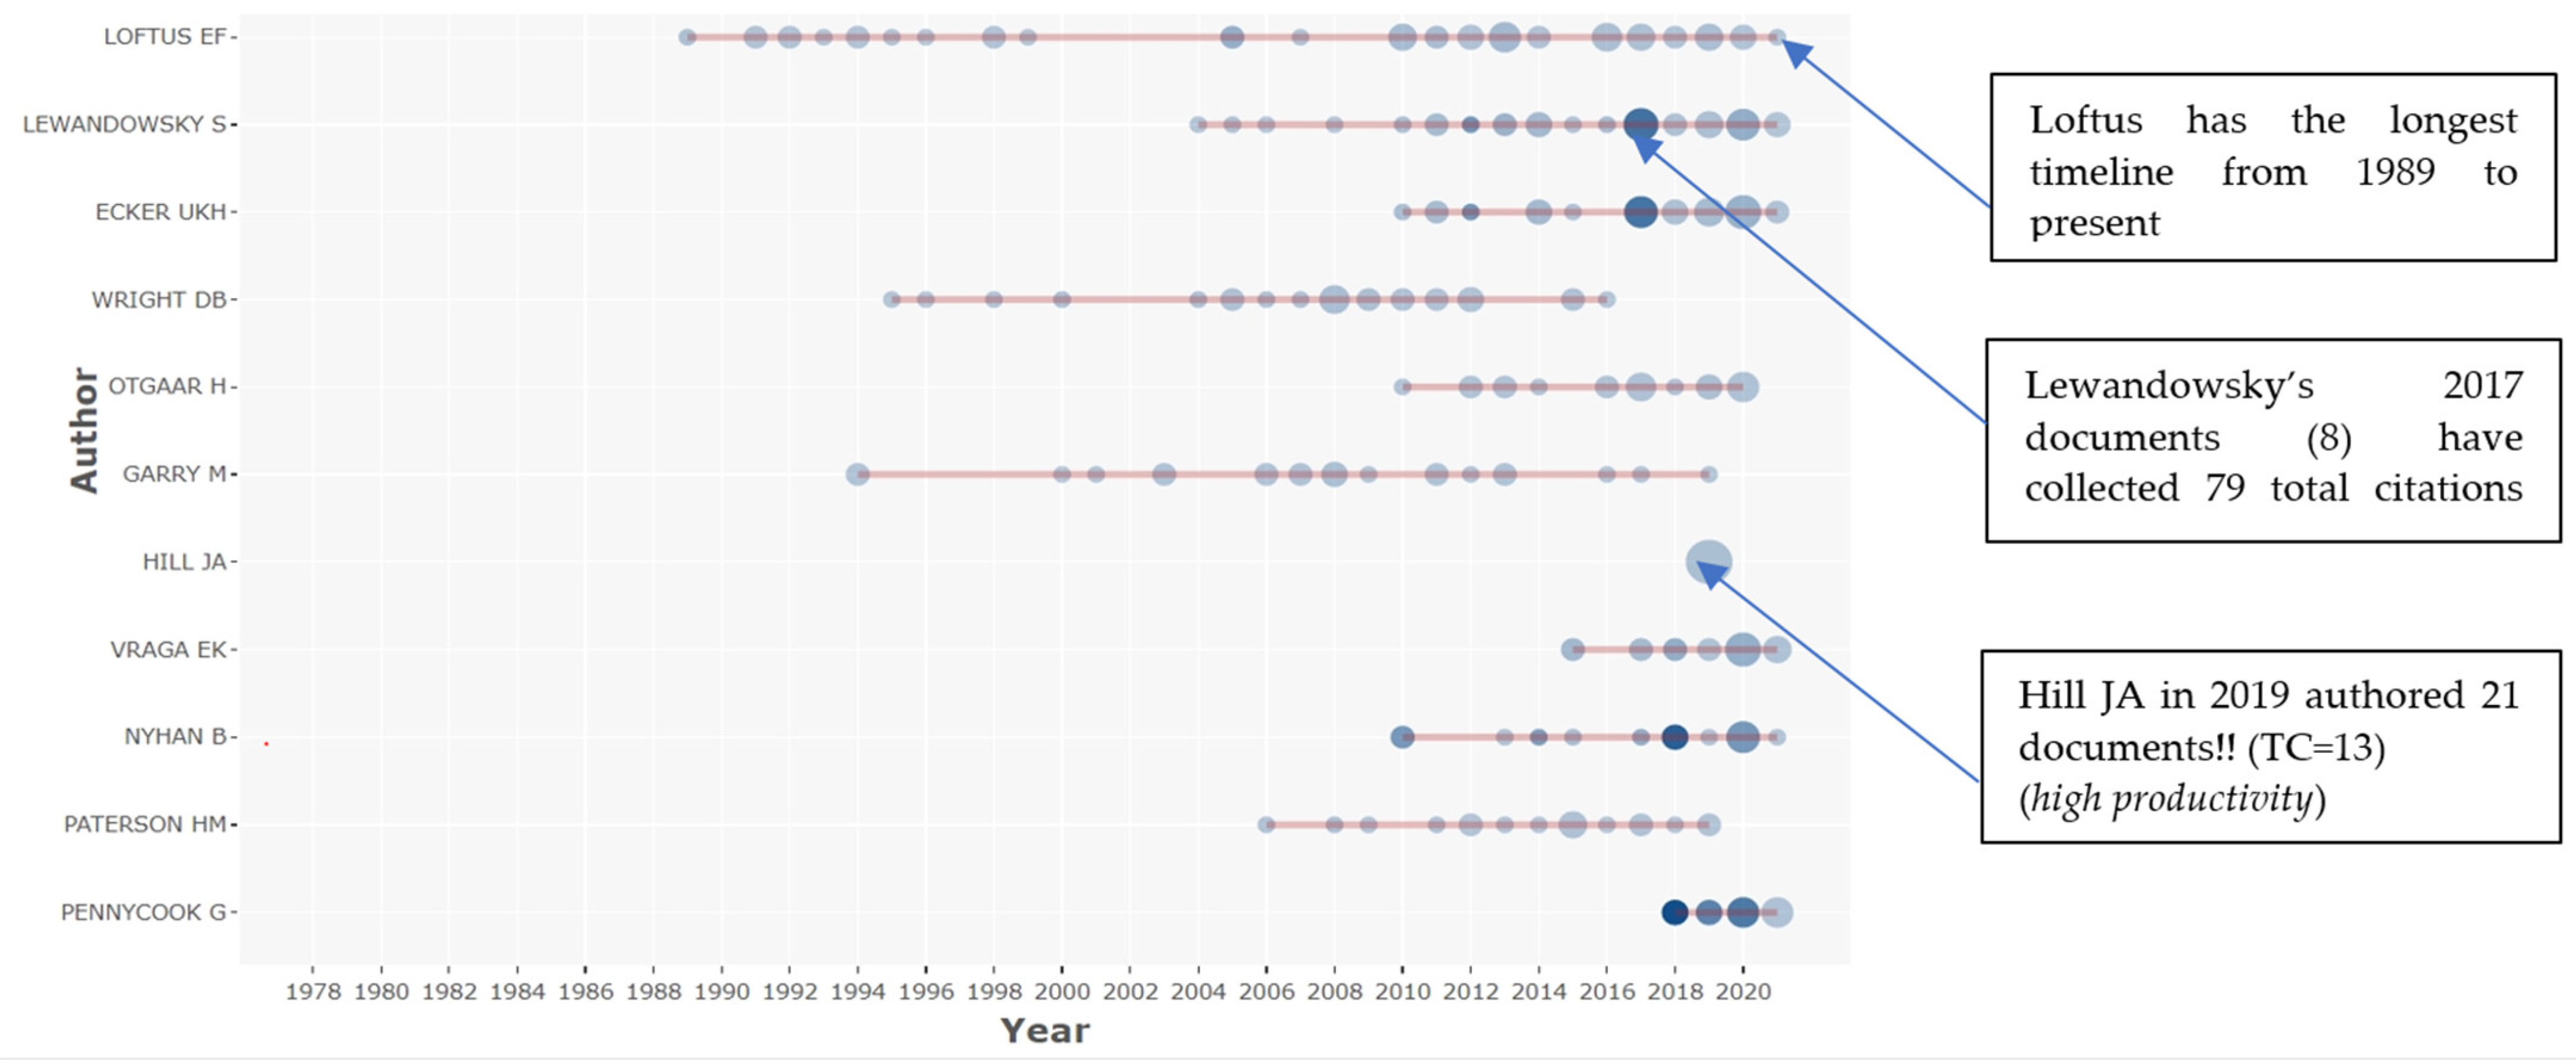
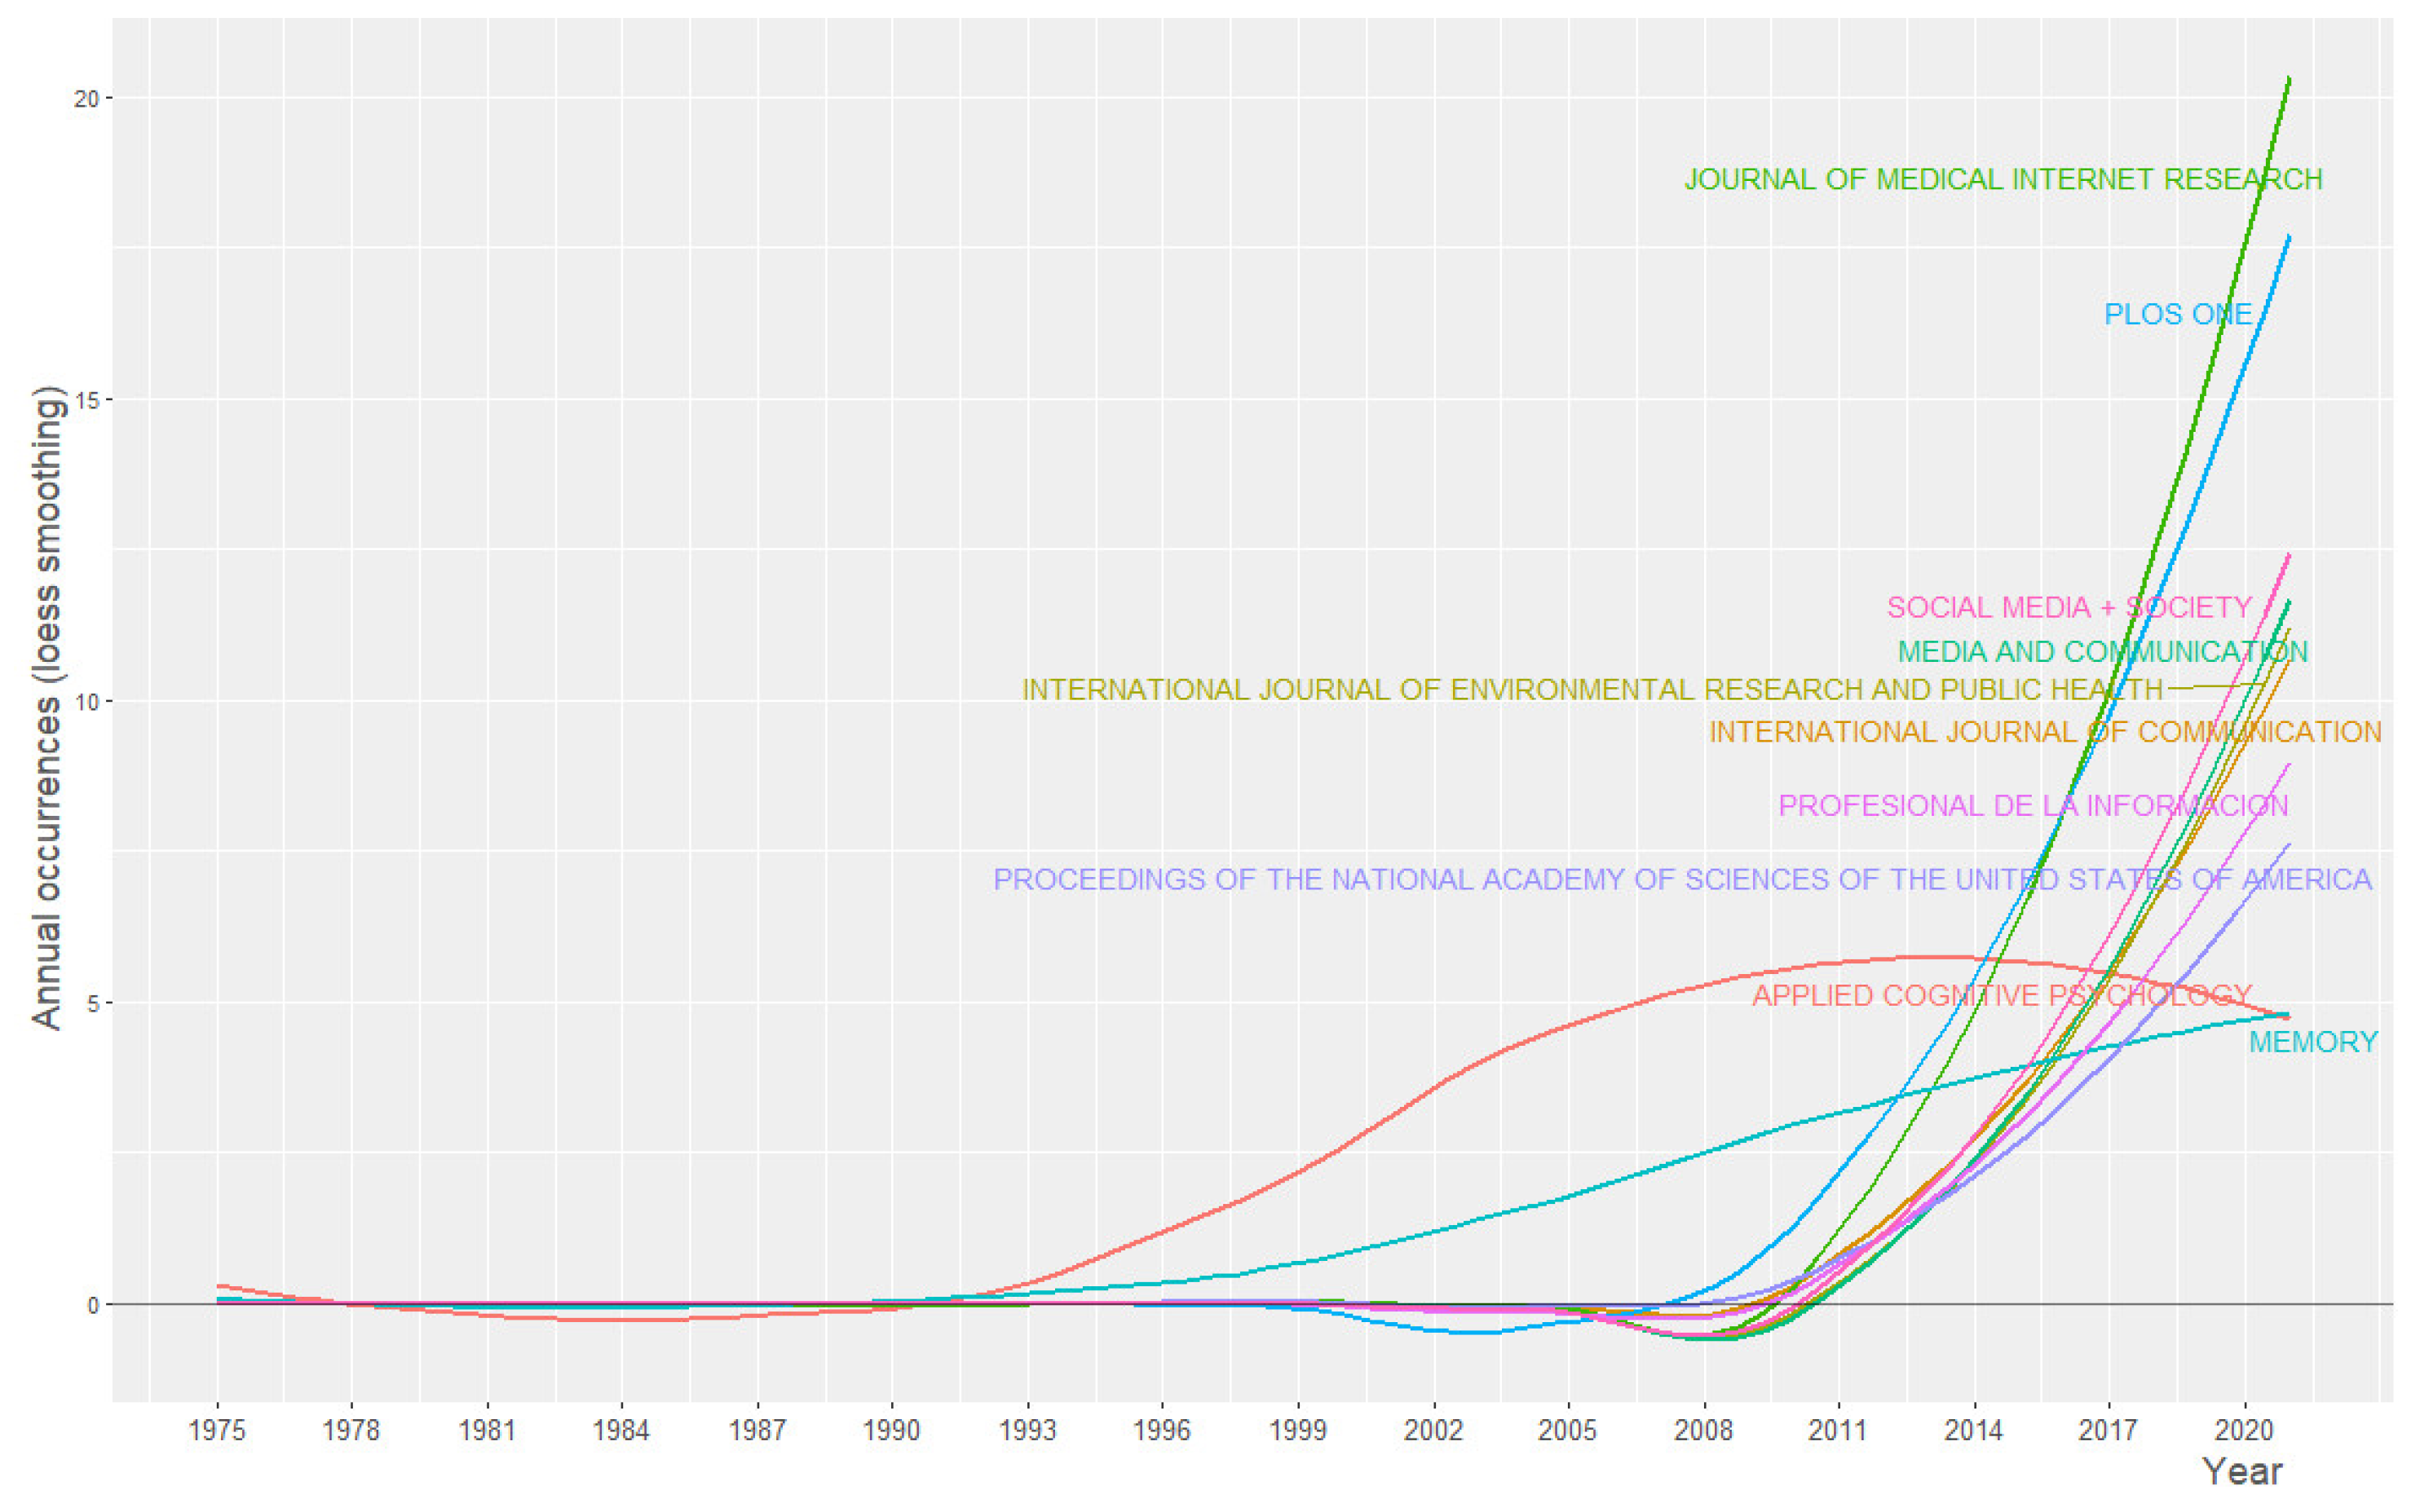
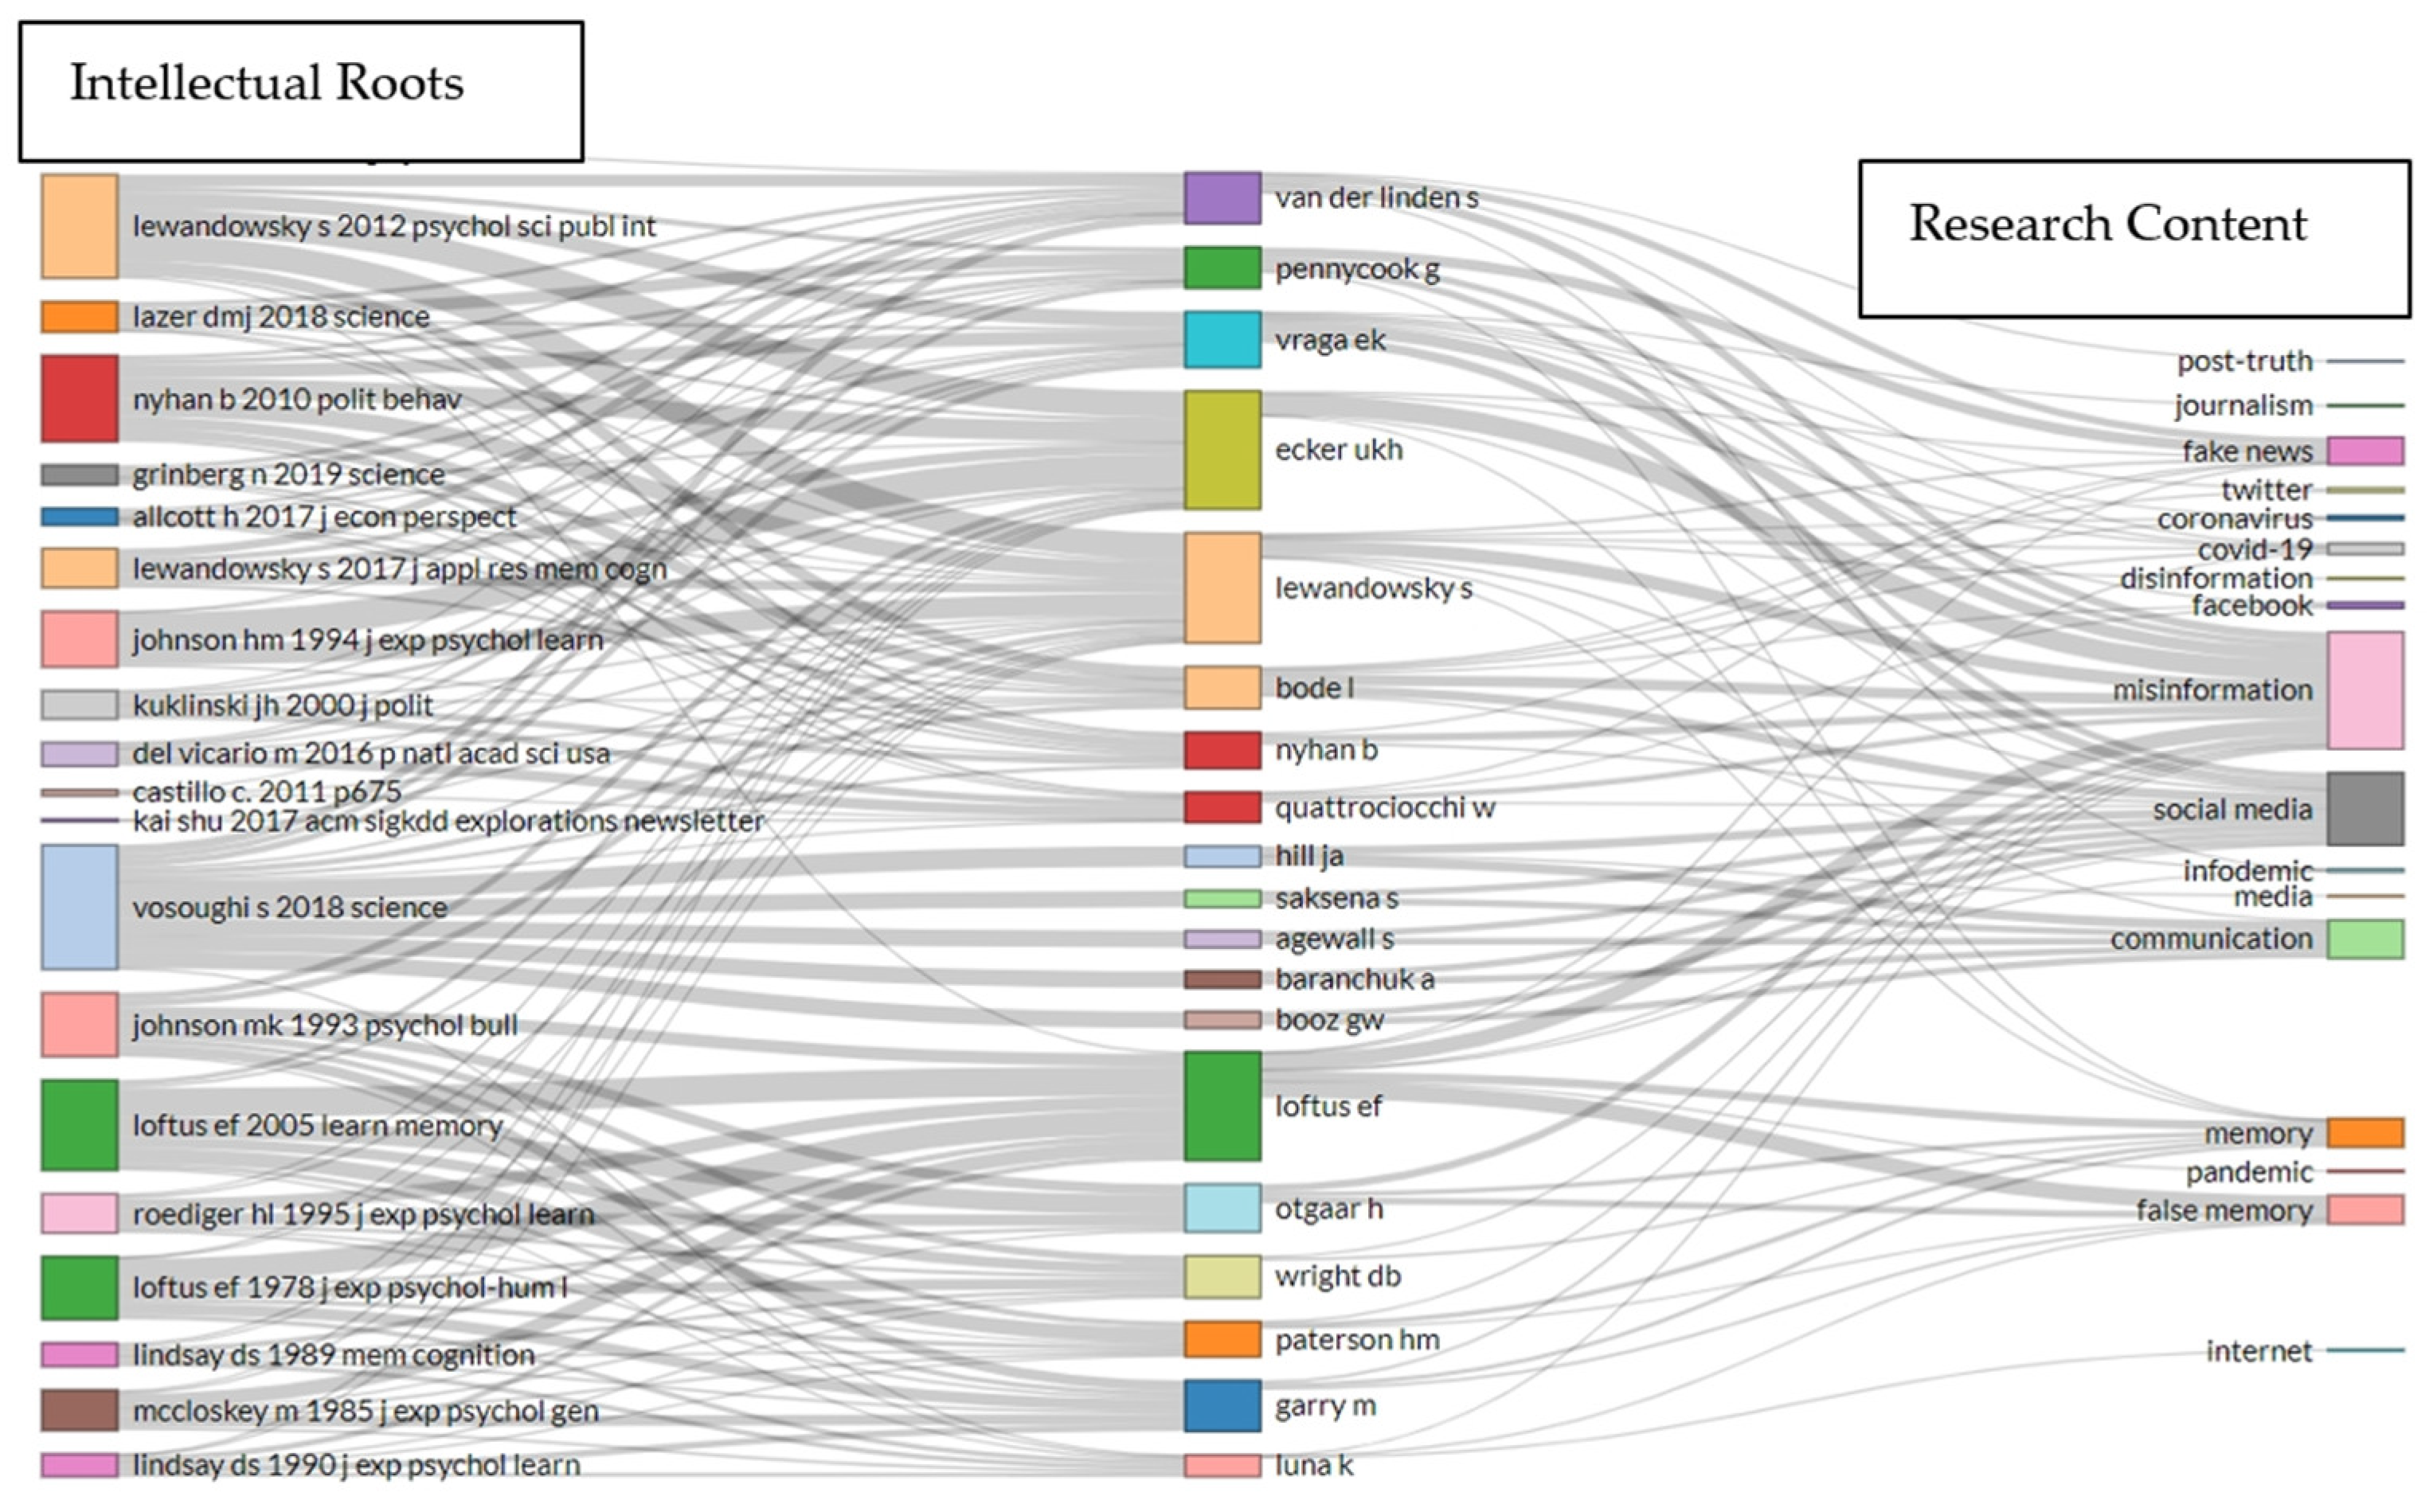
Table 1.
Search criteria.
| Criteria | Details |
|---|---|
| Database | Web of Science Core Collection |
| Citation Index | SCIE (Science Citation Index Expanded) and SSCI (Social Sciences Citation Index) |
| Topics | “disinformation”, “dis-information”, “misinformation”, “mis-information”, “malinformation”, “mal-information”, “fake news” and infodemic* |
| Time span | 1975–June 2021 |
| Document type | Articles, books, book chapters, proceedings papers, reviews |
| Language | Any language |
Table 2.
Top 10 most cited authors.
| Author | h_Index | g_Index | Citations | Documents |
|---|---|---|---|---|
| Nyhan B. | 12 | 18 | 2513 | 18 |
| Lewandowsky S. | 20 | 40 | 2510 | 40 |
| Ecker U.K.H. | 17 | 35 | 2031 | 35 |
| Loftus E.F. | 21 | 44 | 2012 | 54 |
| Pennycook G. | 9 | 19 | 1345 | 19 |
| Quattrociocchi W. | 13 | 18 | 1096 | 18 |
| Wright D.B. | 15 | 26 | 1023 | 26 |
| Vraga E.K. | 9 | 22 | 504 | 25 |
| Garry M. | 13 | 22 | 491 | 22 |
| Bode L. | 9 | 19 | 459 | 19 |
Table 3.
Top 10 most local cited documents.
| Document | DOI | LC | GC |
|---|---|---|---|
| Allcott H., 2017, J. Econ. Perspect. | 10.1257/JEP.31.2.211 | 570 | 679 |
| Lazer D.M.J., 2018, Science | 10.1126/SCIENCE.AAO2998 | 387 | 648 |
| Lewandowsky S., 2012, Psychol. Sci. Publ. Int. | 10.1177/1529100612451018 | 377 | 771 |
| Loftus E.F., 2005, Learn Memory | 10.1101/LM.94705 | 282 | 601 |
| Tandoc E.C., 2018, Digit. Journal | 10.1080/21670811.2017.1360143 | 272 | 362 |
| Nyhan B., 2010, Polit. Behav. | 10.1007/S11109-010-9112-2 | 264 | 846 |
| del Vicario M., 2016, P. Natl. Acad. SCI. USA | 10.1073/PNAS.1517441113 | 193 | 480 |
| Lewandowsky S., 2017, J. Appl. Res. Mem. Cogn. | NA | 152 | 266 |
| Johnson H.M., 1994, J. Exp. Psychol. Learn. | 10.1037/0278-7393.20.6.1420 | 124 | 214 |
| Kuklinski J.H., 2000, J. Polit. | 10.1111/0022-3816.00033 | 118 | 337 |
Legend: LC = local citations; GC = global citations.
Table 4.
Top 10 most cited institutions.
| Organization | Documents | Citations |
|---|---|---|
| University of Michigan | 75 | 5019 |
| Harvard University | 112 | 3806 |
| The University of Western Australia | 62 | 2635 |
| University of Pennsylvania | 68 | 2471 |
| MIT | 43 | 2310 |
| NYU | 62 | 2101 |
| University of Toronto | 69 | 1913 |
| Yale University | 50 | 1901 |
| Stanford University | 59 | 1769 |
| Georgia State University | 26 | 1733 |
Table 5.
Top 10 impact sources.
| Source | h_Index | g_Index | TC | NP | IF |
|---|---|---|---|---|---|
| Applied Cognitive Psychology | 27 | 48 | 2725 | 119 | 2005 |
| PLoS ONE | 20 | 48 | 2424 | 91 | 3.24 |
| Proceedings of the National Academy of Sciences of the USA | 14 | 37 | 1393 | 37 | 11,205 |
| Vaccine | 14 | 29 | 1332 | 29 | |
| Organic Geochemistry | 1 | 1 | 1294 | 1 | |
| Memory | 21 | 33 | 1260 | 75 | 2.09 |
| Journal of Medical Internet Research | 16 | 33 | 1175 | 87 | 5428 |
| Psychological Science | 16 | 22 | 1141 | 22 | |
| Memory & Cognition | 19 | 33 | 1122 | 36 | 2272 |
| Political Behavior | 5 | 10 | 1092 | 10 |
Legend: TC = total citations; NP = number of papers; IF = impact factor.
Table 6.
The top 10 most co-cited publications.
| Cited Reference | Citations |
|---|---|
| Vosoughi S., 2018, Science, v359, p1146, doi 10.1126/science.aap9559 | 610 |
| Allcott H., 2017, J. Econ. Perspect., v31, p211, doi 10.1257/jep.31.2.211 | 425 |
| Lazer D.M.J., 2018, Science, v359, p1094, doi 10.1126/science.aao2998 | 425 |
| Lewandowsky S., 2012, Psychol. Sci. Publ. Int., v13, p106, doi 10.1177/1529100612451018 | 405 |
| Loftus E.F., 1978, J. Exp. Psychol.-Hum. l, v4, p19, doi 10.1037/0278-7393.4.1.19 | 317 |
| Tandoc E.C., 2018, Digit. Journal, v6, p137, doi 10.1080/21670811.2017.1360143 | 310 |
| Nyhan B., 2010, Polit. Behav., v32, p303, doi 10.1007/s11109-010-9112-2 | 286 |
| Loftus E.F., 2005, Learn Memory, v12, p361, doi 10.1101/lm.94705 | 285 |
| Johnson M.K., 1993, Psychol. Bull., v114, p3, doi 10.1037/0033-2909.114.1.3 | 276 |
| Kai Shu, 2017, ACM Sigkdd Explorations Newsletter, v19, p22, doi 10.1145/3137597.3137600 | 246 |
Table 7.
Most relevant countries by corresponding author.
| Country | Articles | Freq | SCP | MCP | MCP_Ratio |
|---|---|---|---|---|---|
| USA | 3235 | 0.38724 | 2691 | 544 | 0.1682 |
| United Kingdom | 669 | 0.080081 | 447 | 222 | 0.3318 |
| Australia | 378 | 0.045248 | 266 | 112 | 0.2963 |
| Spain | 356 | 0.042614 | 302 | 54 | 0.1517 |
| Canada | 346 | 0.041417 | 245 | 101 | 0.2919 |
| Germany | 269 | 0.0322 | 193 | 76 | 0.2825 |
| China | 260 | 0.031123 | 156 | 104 | 0.4 |
| Italy | 250 | 0.029926 | 183 | 67 | 0.268 |
| Brazil | 209 | 0.025018 | 186 | 23 | 0.11 |
| India | 186 | 0.022265 | 158 | 28 | 0.1505 |
Legend: MPC = multiple country publications; SCP = single country publication. MPC indicates for each country the number of documents in which there is at least one co-author from a different country. MCP measures the international collaboration intensity of a country.
Publisher’s Note: MDPI stays neutral with regard to jurisdictional claims in published maps and institutional affiliations. |
© 2021 by the authors. Licensee MDPI, Basel, Switzerland. This article is an open access article distributed under the terms and conditions of the Creative Commons Attribution (CC BY) license (https://creativecommons.org/licenses/by/4.0/).
Share and Cite
MDPI and ACS Style
Bran, R.; Tiru, L.; Grosseck, G.; Holotescu, C.; Malita, L. Learning from Each Other—A Bibliometric Review of Research on Information Disorders. Sustainability 2021, 13, 10094. https://doi.org/10.3390/su131810094
AMA Style
Bran R, Tiru L, Grosseck G, Holotescu C, Malita L. Learning from Each Other—A Bibliometric Review of Research on Information Disorders. Sustainability. 2021; 13(18):10094. https://doi.org/10.3390/su131810094
Chicago/Turabian StyleBran, Ramona, Laurentiu Tiru, Gabriela Grosseck, Carmen Holotescu, and Laura Malita. 2021. "Learning from Each Other—A Bibliometric Review of Research on Information Disorders" Sustainability 13, no. 18: 10094. https://doi.org/10.3390/su131810094
Note that from the first issue of 2016, this journal uses article numbers instead of page numbers. See further details here.