
Historical Assessments of Inorganic Pollutants in the Sinkhole Region of Winkler County, Texas, USA


1
Department of Geosciences, University of Texas-Permian Basin, Odessa, TX 79762, USA
2
National Institute of Environmental Research, Hwangyong-ro 42, Seogu, Incheon 22689, Korea
*
Author to whom correspondence should be addressed.
Sustainability 2021, 13(13), 7513; https://doi.org/10.3390/su13137513
Submission received: 19 May 2021
/
Revised: 20 June 2021
/
Accepted: 25 June 2021
/
Published: 5 July 2021
Abstract
:The purpose of this study was to evaluate the public water contamination levels of Winkler County, in West Texas. With water scarcity becoming more prevalent in arid climates like West Texas, it is important to ensure the water quality in these areas. The Dockum and Pecos Valley aquifers were analyzed for inorganic pollutants that could inhibit the water. The parameters such as copper, lead, arsenic, nitrate, chloride, and chromium level reports were provided from 1972 to 2018 to analyze and compare to other studies such as the ones conducted in the Midland/Odessa area. The results were compared to the Environmental Protection Agency (EPA) safety standards, and conclusions were made for the safety consumption of water within the county. We found that inorganic pollutants resulted mainly from the mobilization of the contaminant from anthropogenic activities such as chemical fertilizers, oil and gas developments. This research provides important information for inorganic pollutants in the sinkhole region of Winkler County and contributes to understanding the response to the aquifers. The significance of water quality in West Texas is now more important than ever to ensure that everyone has clean drinking water.
1. Introduction
Water is essential for sustaining life on earth. The earth is made up of about 70% water, covering most of the planet; however, 97.5% of the earth’s water is saltwater, only leaving 2.5% of the water fresh [1,2,3]. With supplies of fresh water becoming more limited, it is imperative to become aware of the pollution of our fresh drinking water and take the necessary steps in keeping our water supply clean. Groundwater comes from precipitation; as the water falls, it seeps into the ground and is stored in permeable bodies of rocks known as aquifers [4,5].
Groundwater is considered a renewable resource; however, in arid climates like West Texas there is little natural recharge to the aquifers [5,6,7]. Groundwater serves an especially important role in West Texas. It is the most important factor regulating ecosystem processes, as a result of which environmental processes are frequently water-stressed [6,8]. With the population rising in recent years, there has been a higher demand for potable water, making groundwater resources even scarcer.
With groundwater being susceptible to pollutants, pollutants can enter an aquifer through numerous ways such as industrialization, mining, agricultural runoff, pesticides applied to crops and road salts. The Environmental Protection Agency (EPA) has determined that a contaminant poses a risk to water quality and can develop a maximum contaminant level (MCL) [2,9,10,11]. Among all the different contaminants, inorganics such as copper, lead, arsenic, nitrate, chromium, and chloride have proven to be the most detrimental for human health, apart from chloride [12,13,14,15,16]. Although these inorganics can be found naturally in water bodies, it is agriculture, littering, and industrialization that cause the inorganic levels to rise to harmful effects in water [12,17].
There have been numerous research studies about groundwater qualities and contaminations in Texas [15,18,19]. Previous studies [15,20] conducted a study on the concentrations of nitrate, chloride, and dissolved solids in the Ogallala Aquifer, which is one of the most prominent aquifers in the state of Texas. While in the study they state that, West Texas illustrates widespread areas of poor groundwater quality, likewise, one of those studies being from the University of Texas at Austin, Reedy et al. [18], led an extensive analysis report covering groundwater contamination across the state of Texas. The study evaluated the harm of groundwater contamination to human health and also recommended solutions to prevent it.
Some studies have been undertaken to evaluate the groundwater quality in West Texas according to anthropogenic influences such as oil production or agriculture [12,21,22,23,24,25]. Researchers [22,23,26] led studies about the relation to human activities and groundwater contamination in West Texas, concluding that human activities have an undeniable effect on drinking water, especially in agriculture and the oil industry. In addition, Hudak [15] conducted a study of the concentrations of nitrate, arsenic, and selenium in the Pecos Valley Aquifer, one of the aquifers analyzed in this study. He concluded that natural geology, inter-aquifer flow, oilfield brine, and agriculture sources likely contributed to the elevated concentration levels [24,25]. However, few studies have monitored groundwater quality in West Texas related to the sinkhole regions.
With everything mentioned above about the importance of groundwater, the purpose of this study was to evaluate the groundwater quality in Winkler County, Texas, USA. Levels of copper, lead, arsenic, nitrate, chloride, and chromium in groundwater were analyzed to produce a conclusion about the safety consumption of water in the county. This research contributes to an understanding of the response of groundwater qualities in the Sinkhole Region. Therefore, this study can provide important information for groundwater qualities in making decision and developing plans for the groundwater resources in the future.
2. Study Area
The area of study is located in the southwestern part of the United States, in the Permian Basin of West Texas. The area extends across two small towns in Texas: Kermit and Wink. For this study, we focused on the aquifers of Pecos Valley and Dockum located in the same county (Figure 1). The county has an area of 841 square miles of land, 0.2 square miles of water, and a population of 7720 and growth population of 12.7%. The land area is characterized by grasses, shrubs, and brushes, with developed areas and crops, followed by barren lands and rocky grounds [23,26]. This area is predominately arid and temperature widely ranges from below freezing to over 40 °C [27]. Precipitation averages 4 to 12 inches per year, which shows the highest in the spring and fall seasons [27]. The hottest temperatures in the U.S. continent are often recorded in lower elevations near the Pecos River. These dry arid conditions add to the scarcity of water bodies, which makes groundwater that more imperative.
The region is set on the western side of the Monument Draw trough on the shelf margin between the Central Basin platform and the Delaware Basin [28,29,30]. The main source of water comes from the Pecos Valley Aquifer and Dockum Aquifer. The Pecos Valley is a major aquifer in West Texas and it is unconfined with 6829 square miles and it is divided into two troughs formed by subsidence within the area [3]. Dockum is a minor aquifer in West Texas and it is both confined and unconfined with 3525 square miles [4]. The area has little to no mantle soil, and due to karst formations within the surrounding area, subsidence has occurred, forming two massive and unstable sinkholes called the Wink sink [21].
The area is also known for high volumes of oil and gas exploration where a technique called hydraulic fracturing is being practiced. This technique is also known to cause pollution to groundwater aquifers. The Permian Basin, since 1920, has recovered over 30 billion barrels of oil and it is estimated that the basin still has over 92 billion barrels of recoverable oil to drill [31]. With no sight of the Permian Basin slowing down on oil production and with the technology of hydraulic fracturing, the Permian Basin is one of the top producers of hydrocarbons in the world.
3. Data and Methods
To ensure safe drinking water to the public, the Safe Drinking Water Act (SDWA) was implemented in the United States. The EPA is responsible for setting the maximum contaminant levels (MCLs) for quality drinking water, and oversees all states and water suppliers that implement these standards. The Texas Commission of Environmental Quality (TCEQ), also enforces these rules to ensure water safety. We collected all historically available data in our study area from the United States Geological Survey (USGS) and the Texas Water Development Board (TWDB). All groundwater data were obtained from the USGS and TWDB, which are open databases provided by the US government. Cities must annually test their water supply and report the results to each agency and the public. In this study, we will be using the reports produced by the towns of Kermit and Wink. These reports contain yearly averages of water contamination levels with parameters, such as (but not limited to) copper, lead, arsenic, nitrate, chloride, and chromium.
These parameters were chosen because they were proven to be the most present pollutants in the water and, if consumed at high levels, there could be serious health problems [9,14,32]. The total dissolved solids (TDS) were also analyzed from each well; the TDS is the weight of the remaining material after evaporation. These reports were analyzed in Pecos Valley from 1987 to 2018 and Dockum was analyzed from 1972 to 2008. Tables and Figures were made from the report to compare the two aquifers pollutant levels. Table 1, Table 2 and Table 3 demonstrate the contaminant levels of both aquifers, while Figure 2, Figure 3, Figure 4, Figure 5, Figure 6, Figure 7 and Figure 8 display each parameter contaminant level. The values in Tables were chosen from the USGS and TWDB reports. The report had a numerous amount of wells tested, but the data chosen came from wells that were tested throughout the years. The data availability was low considering that most wells had unavailable data to compare and analyze to other wells. Conclusions were drawn about the water quality of each aquifer.
4. Results and Discussion
4.1. Copper
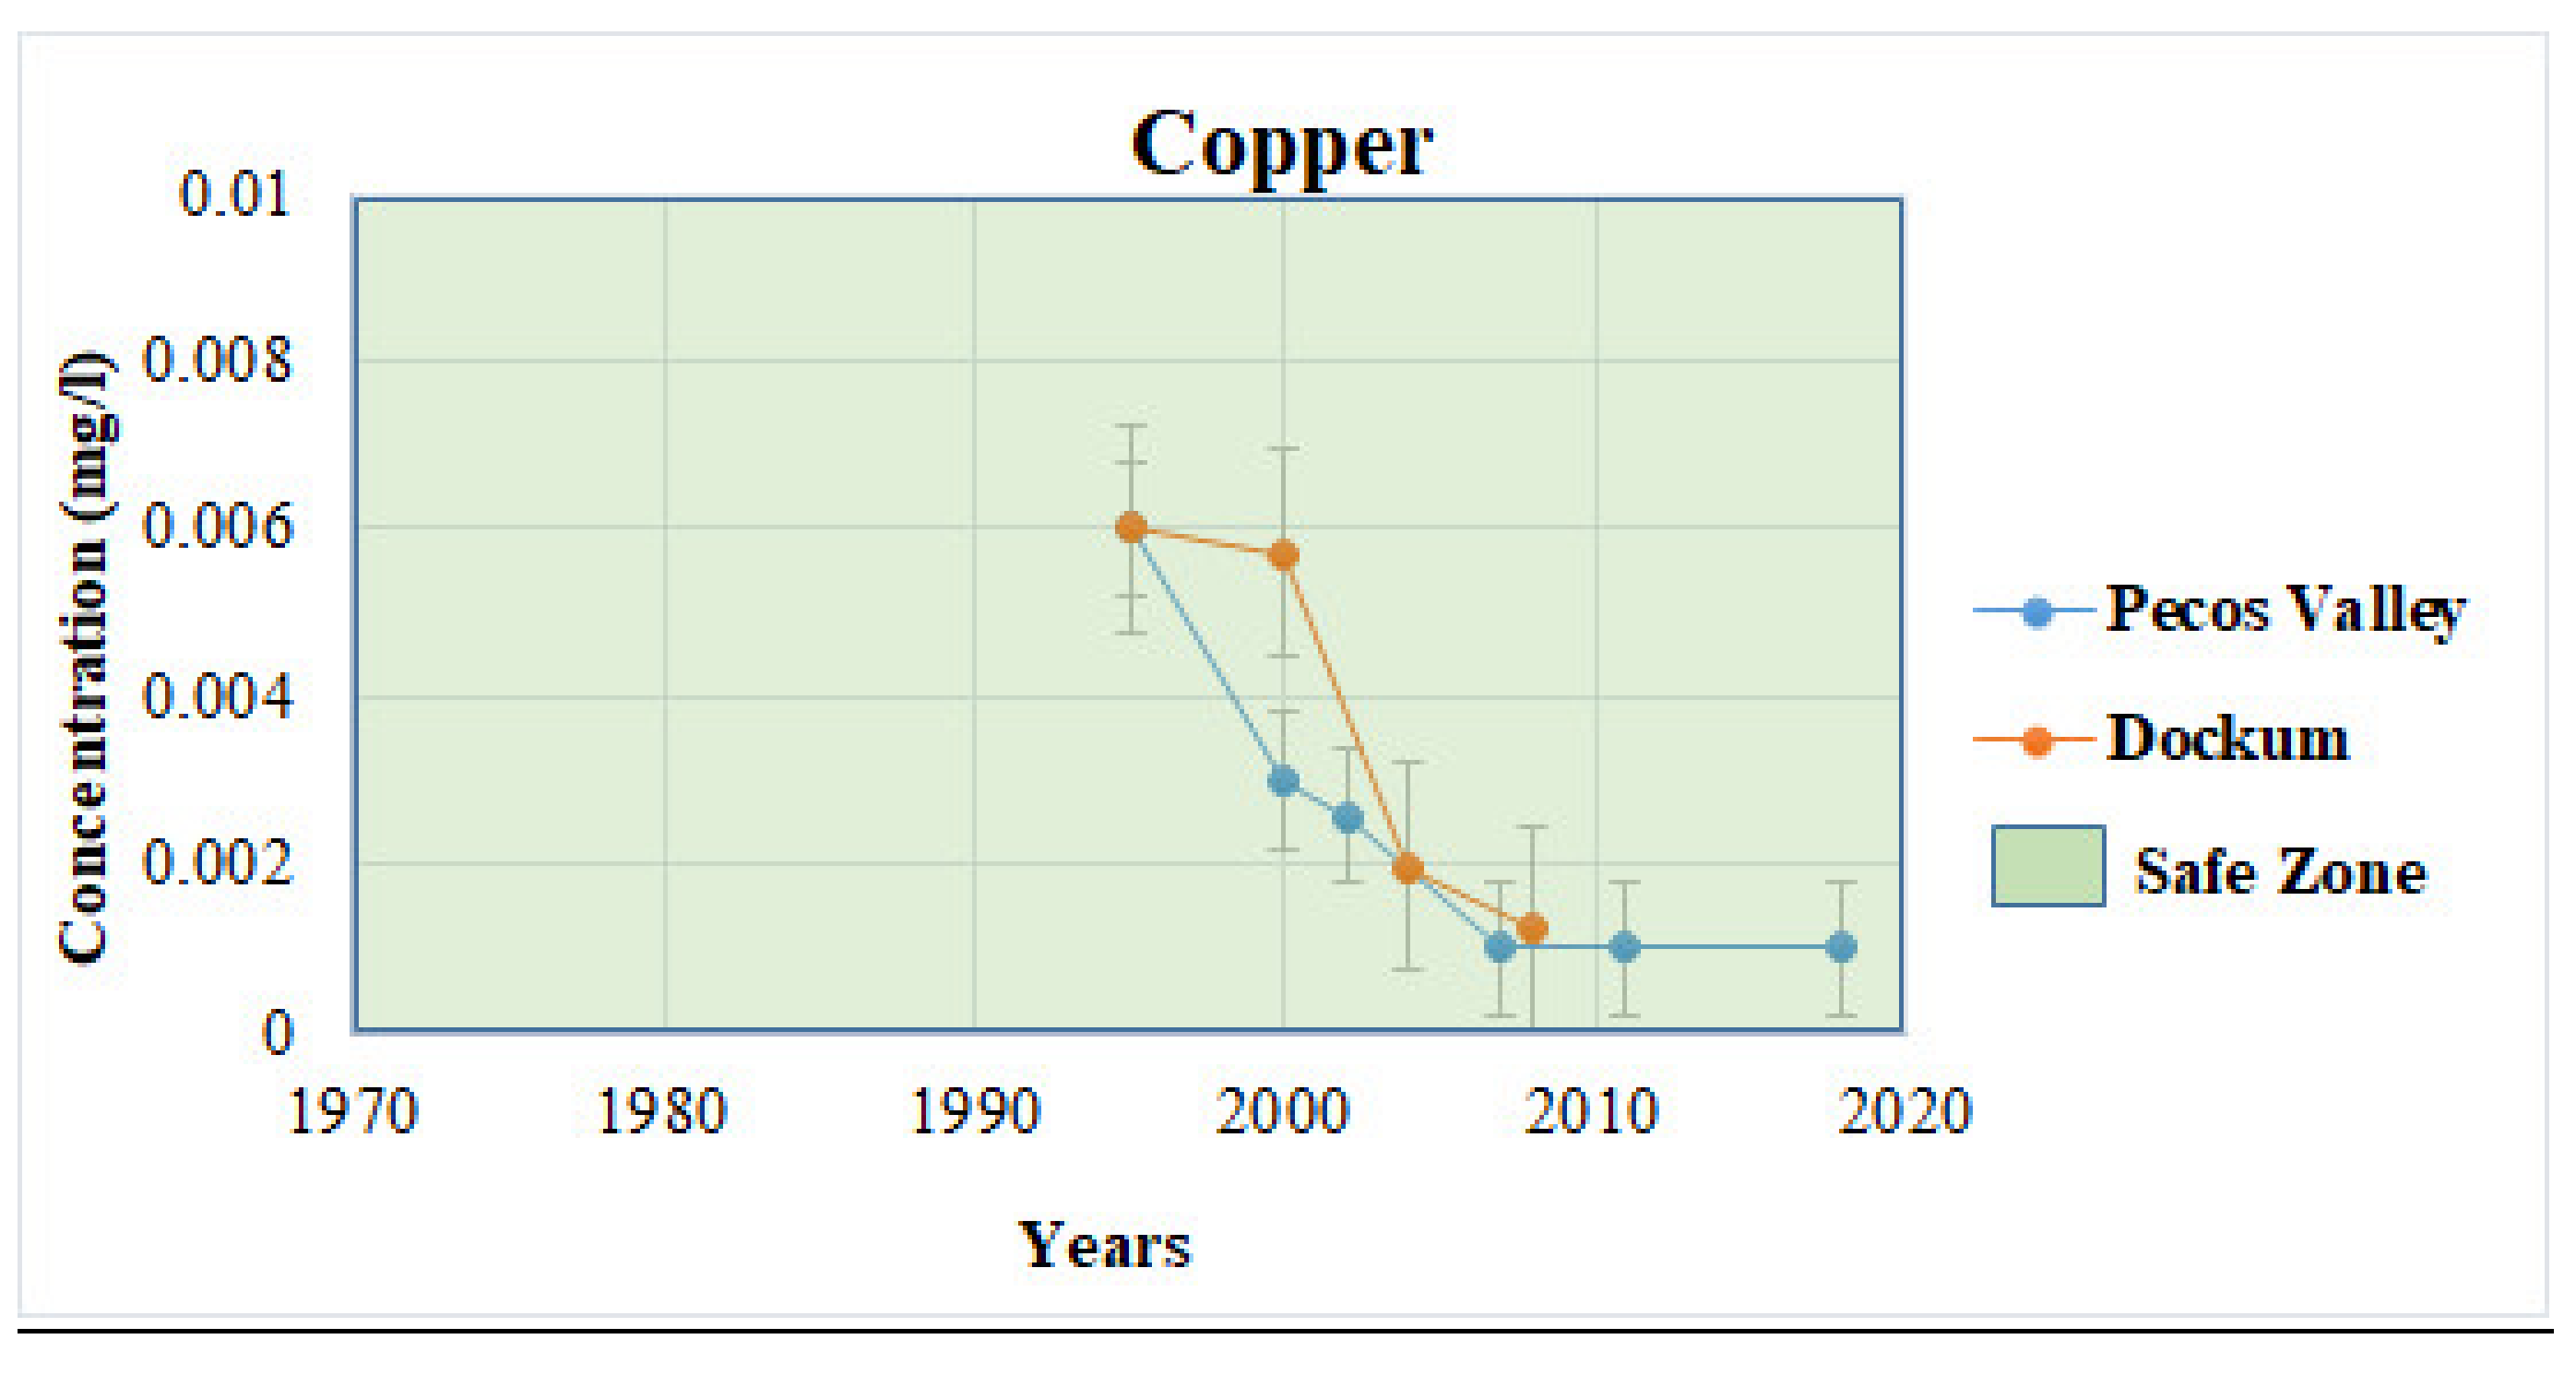
Copper is a reddish metal that naturally occurs in nature. It is commonly found at low levels in natural water bodies. In many countries around the world, copper pipes are used extensively in plumbing systems. Normally, the level of copper in groundwater and surface water is about 4 ppb [2,10]. In Dockum and Pecos Valley (Figure 2), there are very low levels of copper, the highest being in 1995 at 6 ppb and, over time, the concentration lowered, and by 2018 the copper level was at 1 ppb. High levels of copper occur in our drinking water when corrosive water comes in contact with the copper plumbing. If the corrosive water sits motionless in the plumbing system, then the copper levels may exceed 1000 ppb [10]. However, copper is necessary in our everyday diet for good health. We normally eat or drink about 1000 ppm a day and drinking water contributes 150 ppb.
However, according to the EPA, it has been determined that copper levels may not exceed 1300 ppb [2]. Effects from drinking water with over 1300 ppb may include vomiting, diarrhea, stomach cramps, nausea, and some long-term negative health effects [9,33]. In the study area, the levels of all the parameters looked at are significantly lower today, where in the study, copper was found at 192 ppb, not exceeding the MCL but higher than the concentration Winkler has today. Some researchers [12,22] analyzed the water quality from the cities of Midland/Odessa located in Ector County, east adjacent to Winkler County. The concentration levels of copper in Ector County were similar to Winkler; however, they stated that low exposure to copper over a long period of time like the ones reported in both Winkler and Ector counties are proven to cause health effects.
4.2. Lead
Lead is a grayish metal that can naturally occur in small amounts in nature, but if found in large amounts, it is most likely linked to human activities. Lead can be found in all parts of our environment but most of it comes from mining, manufacturing, and the burning of fossil fuels. It is also found in a great variety of household products. Lead rarely occurs naturally in water and is normally found in water systems because of the corrosion of household plumbing and leakage of chemicals to the underground [13,33]. It is also a contaminant associated with hydraulic fracturing. In the Dockum Aquifer (Figure 3), the lead concentrations were calculated to be stable for the 12 years of analysis. However, in the Pecos Valley Aquifer, there was a large amount of lead recorded at 50 ppb in 2007, after having relatively low concentrations previously. The concentration of lead went down by 2011, recording at only 1 ppb, and has never exceeded its peak since. Possible explanations for the increase of lead for the year 2007 could be from an increase of precipitation that West Texas was experiencing in the mid-2000s [26].
This increase of precipitation in an arid climate like West Texas comes from climate change. For lead’s high toxicity, the EPA has set the maximum allowable concentration of lead at 15 ppb with the safe zone being 10 ppb or less [2]. Health problems for consumption over the MCL may include physical and mental disease for infants and renal problems for adults [9,13]. Reedy et al. [18] reported that lead was found at 177 ppb, way above the MCL in Texas. Today lead is found at significantly lower levels. Previous studies [12,23,25] suggested that Ector County generally has lower levels of lead than Winkler; however, they still stated that, although the concentration levels are below the MCL due to lead’s high toxicity, it can still represent a hazard for consumption. Consequently, the same can be said about Winkler County’s concentration of lead due to high concentrations in previous years.
4.3. Arsenic
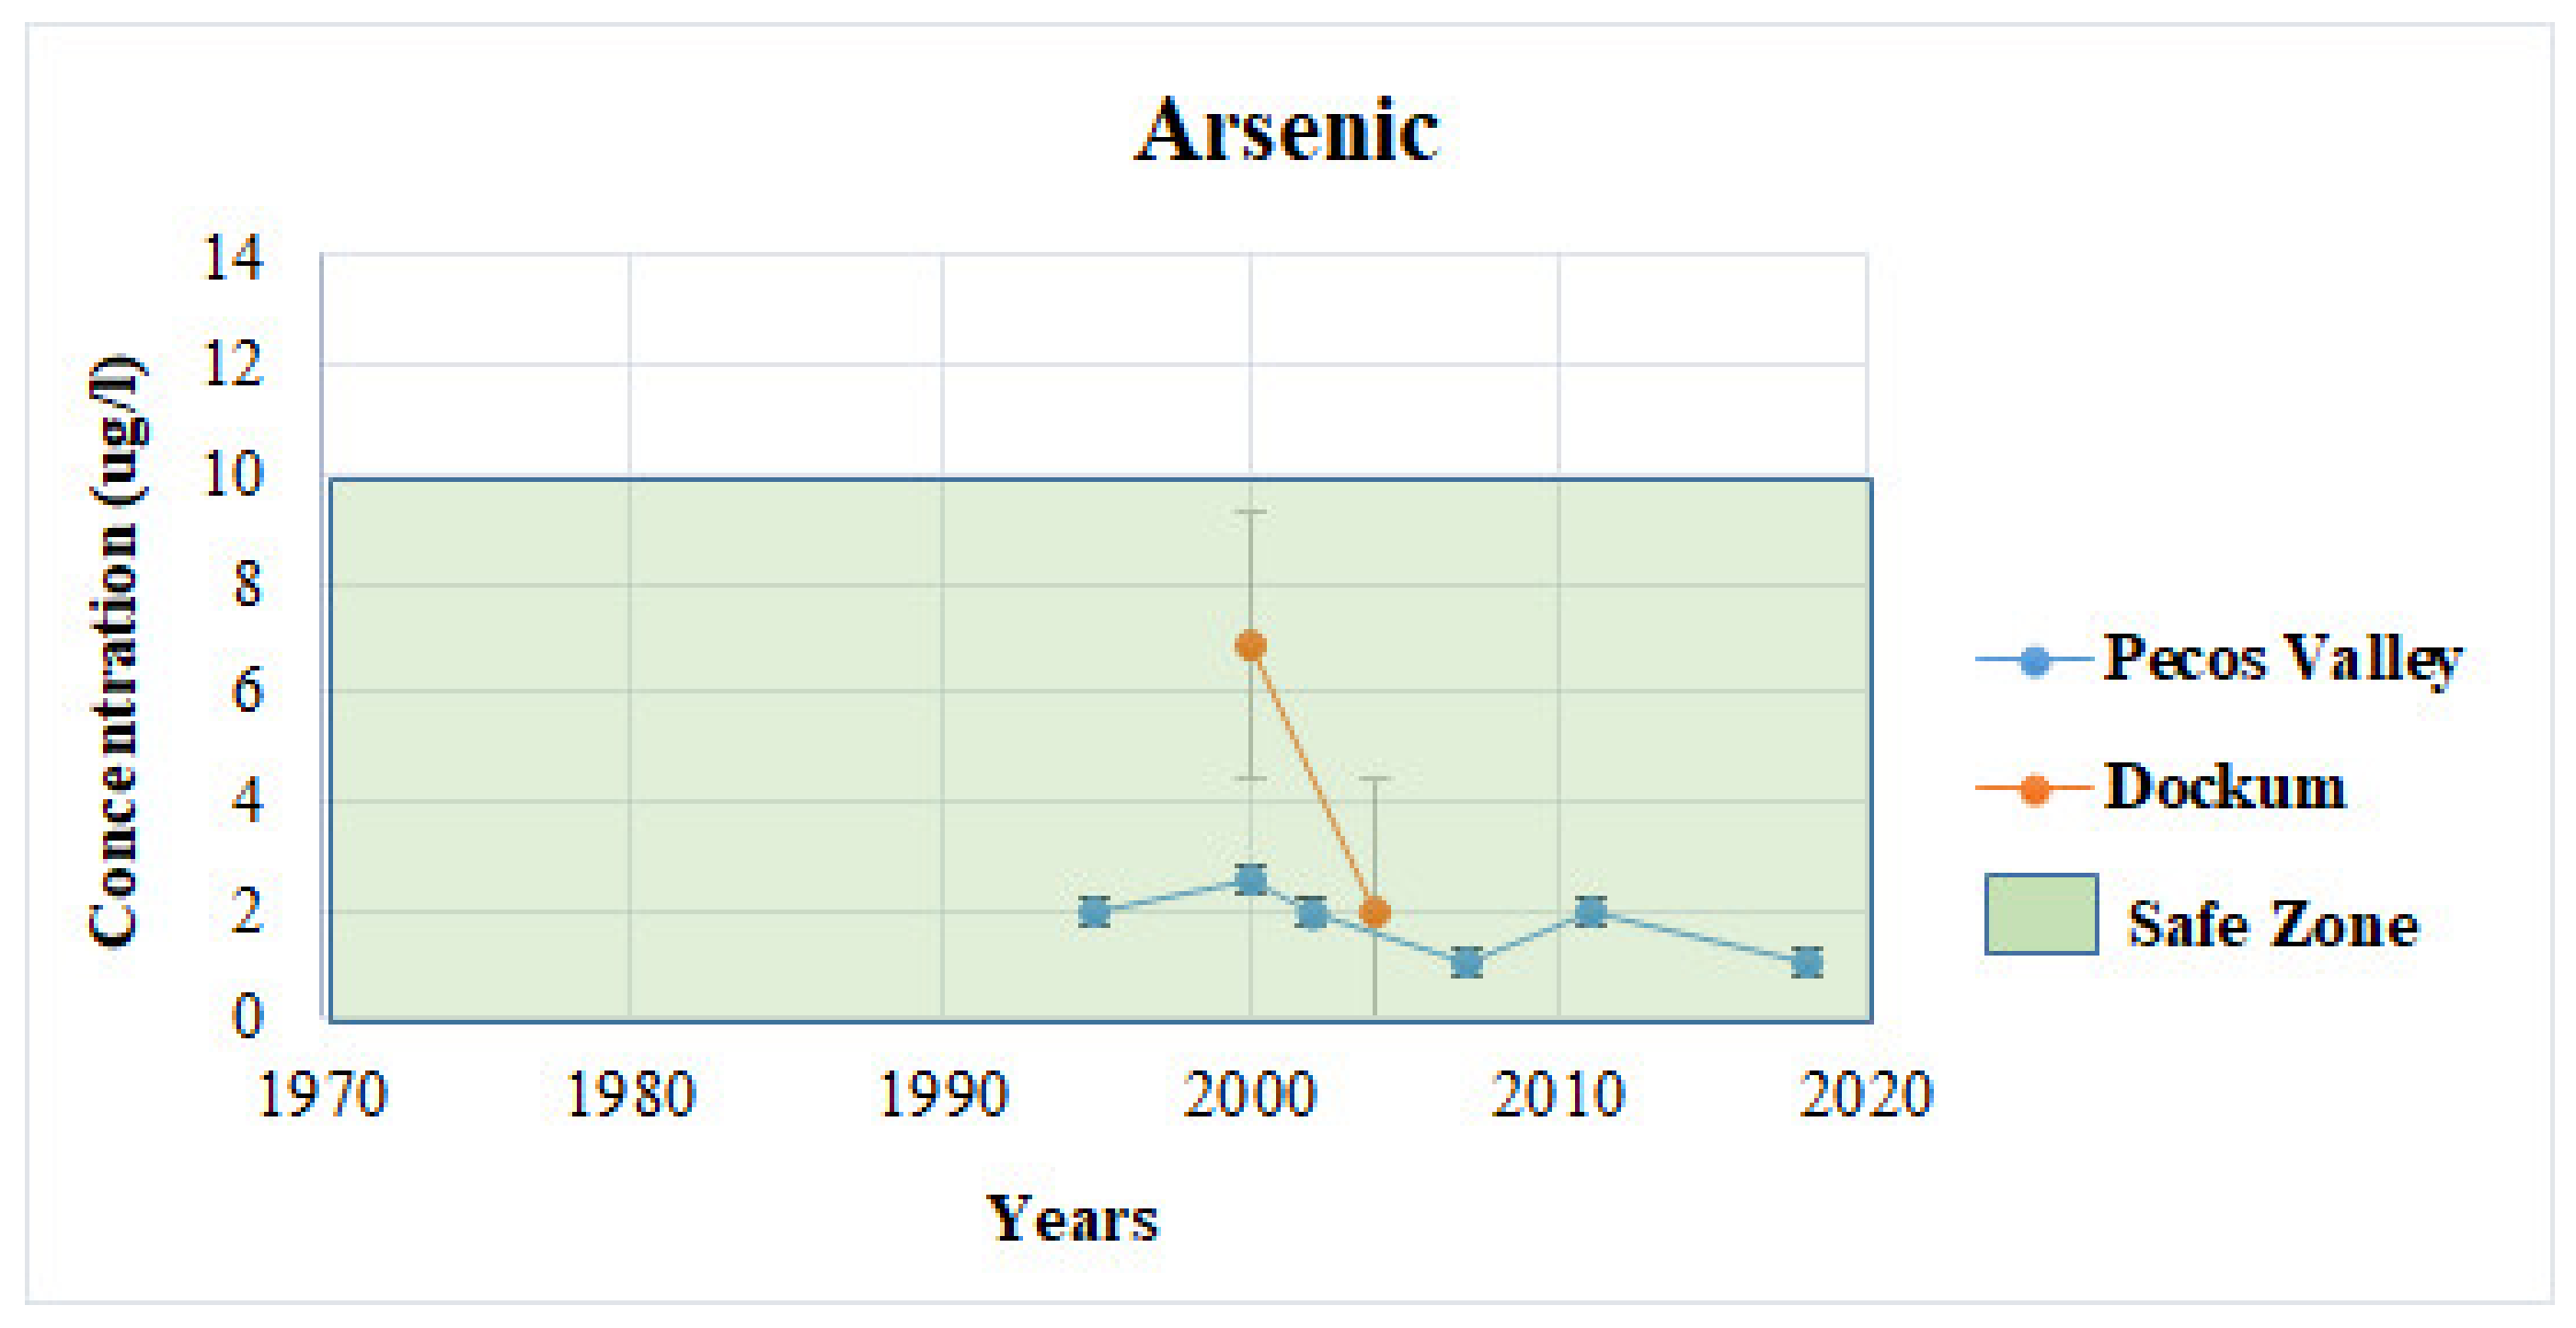
Arsenic is a naturally occurring element in rocks and soil. It is used in activities such as mining and agricultural and it is a very toxic substance that is commonly found in nature. Arsenic enters a water system by rocks that contain arsenic or through mining and agriculture, which can deposit arsenic into water systems. Arsenic is widely distributed throughout Earth’s crust, most often as arsenic sulfide or as metal arsenates. In water, it is most likely to be present as arsenate/As(V), with an oxidation state of 5, if the water is oxygenated. However, under reducing conditions, it is more likely to be present as arsenite/As(III), with an oxidation state of 3 [14]. Some industries such as agriculture release thousands of pounds of arsenic into the environment every year. When released, arsenic remains in the environment for a long time [14,15]. The arsenic levels in the Pecos Valley aquifer (Figure 4) never reached above 5 ppb and the Dockum aquifer never exceeded 8 ppb during its 23 years of study. Arsenic is highly toxic for human consumption and for that reason the EPA has set the safety standard for arsenic in drinking water at 10 ppb [2]. Anything above 10 ppb can be dangerous and it increases the risk of long-term health effects; some chronic health problems can include circulatory problems and some various forms of cancer of the skin, lungs, bladder, and kidney [11].
Another potential input for arsenic contaminating the groundwater comes from petroleum hydrocarbon releases, through the process of horizontal drilling and hydraulic fracturing. Previous researchers estimated that arsenic was found at ~200 ppb, which is significantly higher than what was observed in this study and exceeding the MCL in West Texas [15,22,23]. When comparing to their studies, the arsenic levels are elevated compared to Winkler; however, arsenic is hard to compare considering the amount of missing data we have from the Dockum aquifer.
4.4. Nitrate
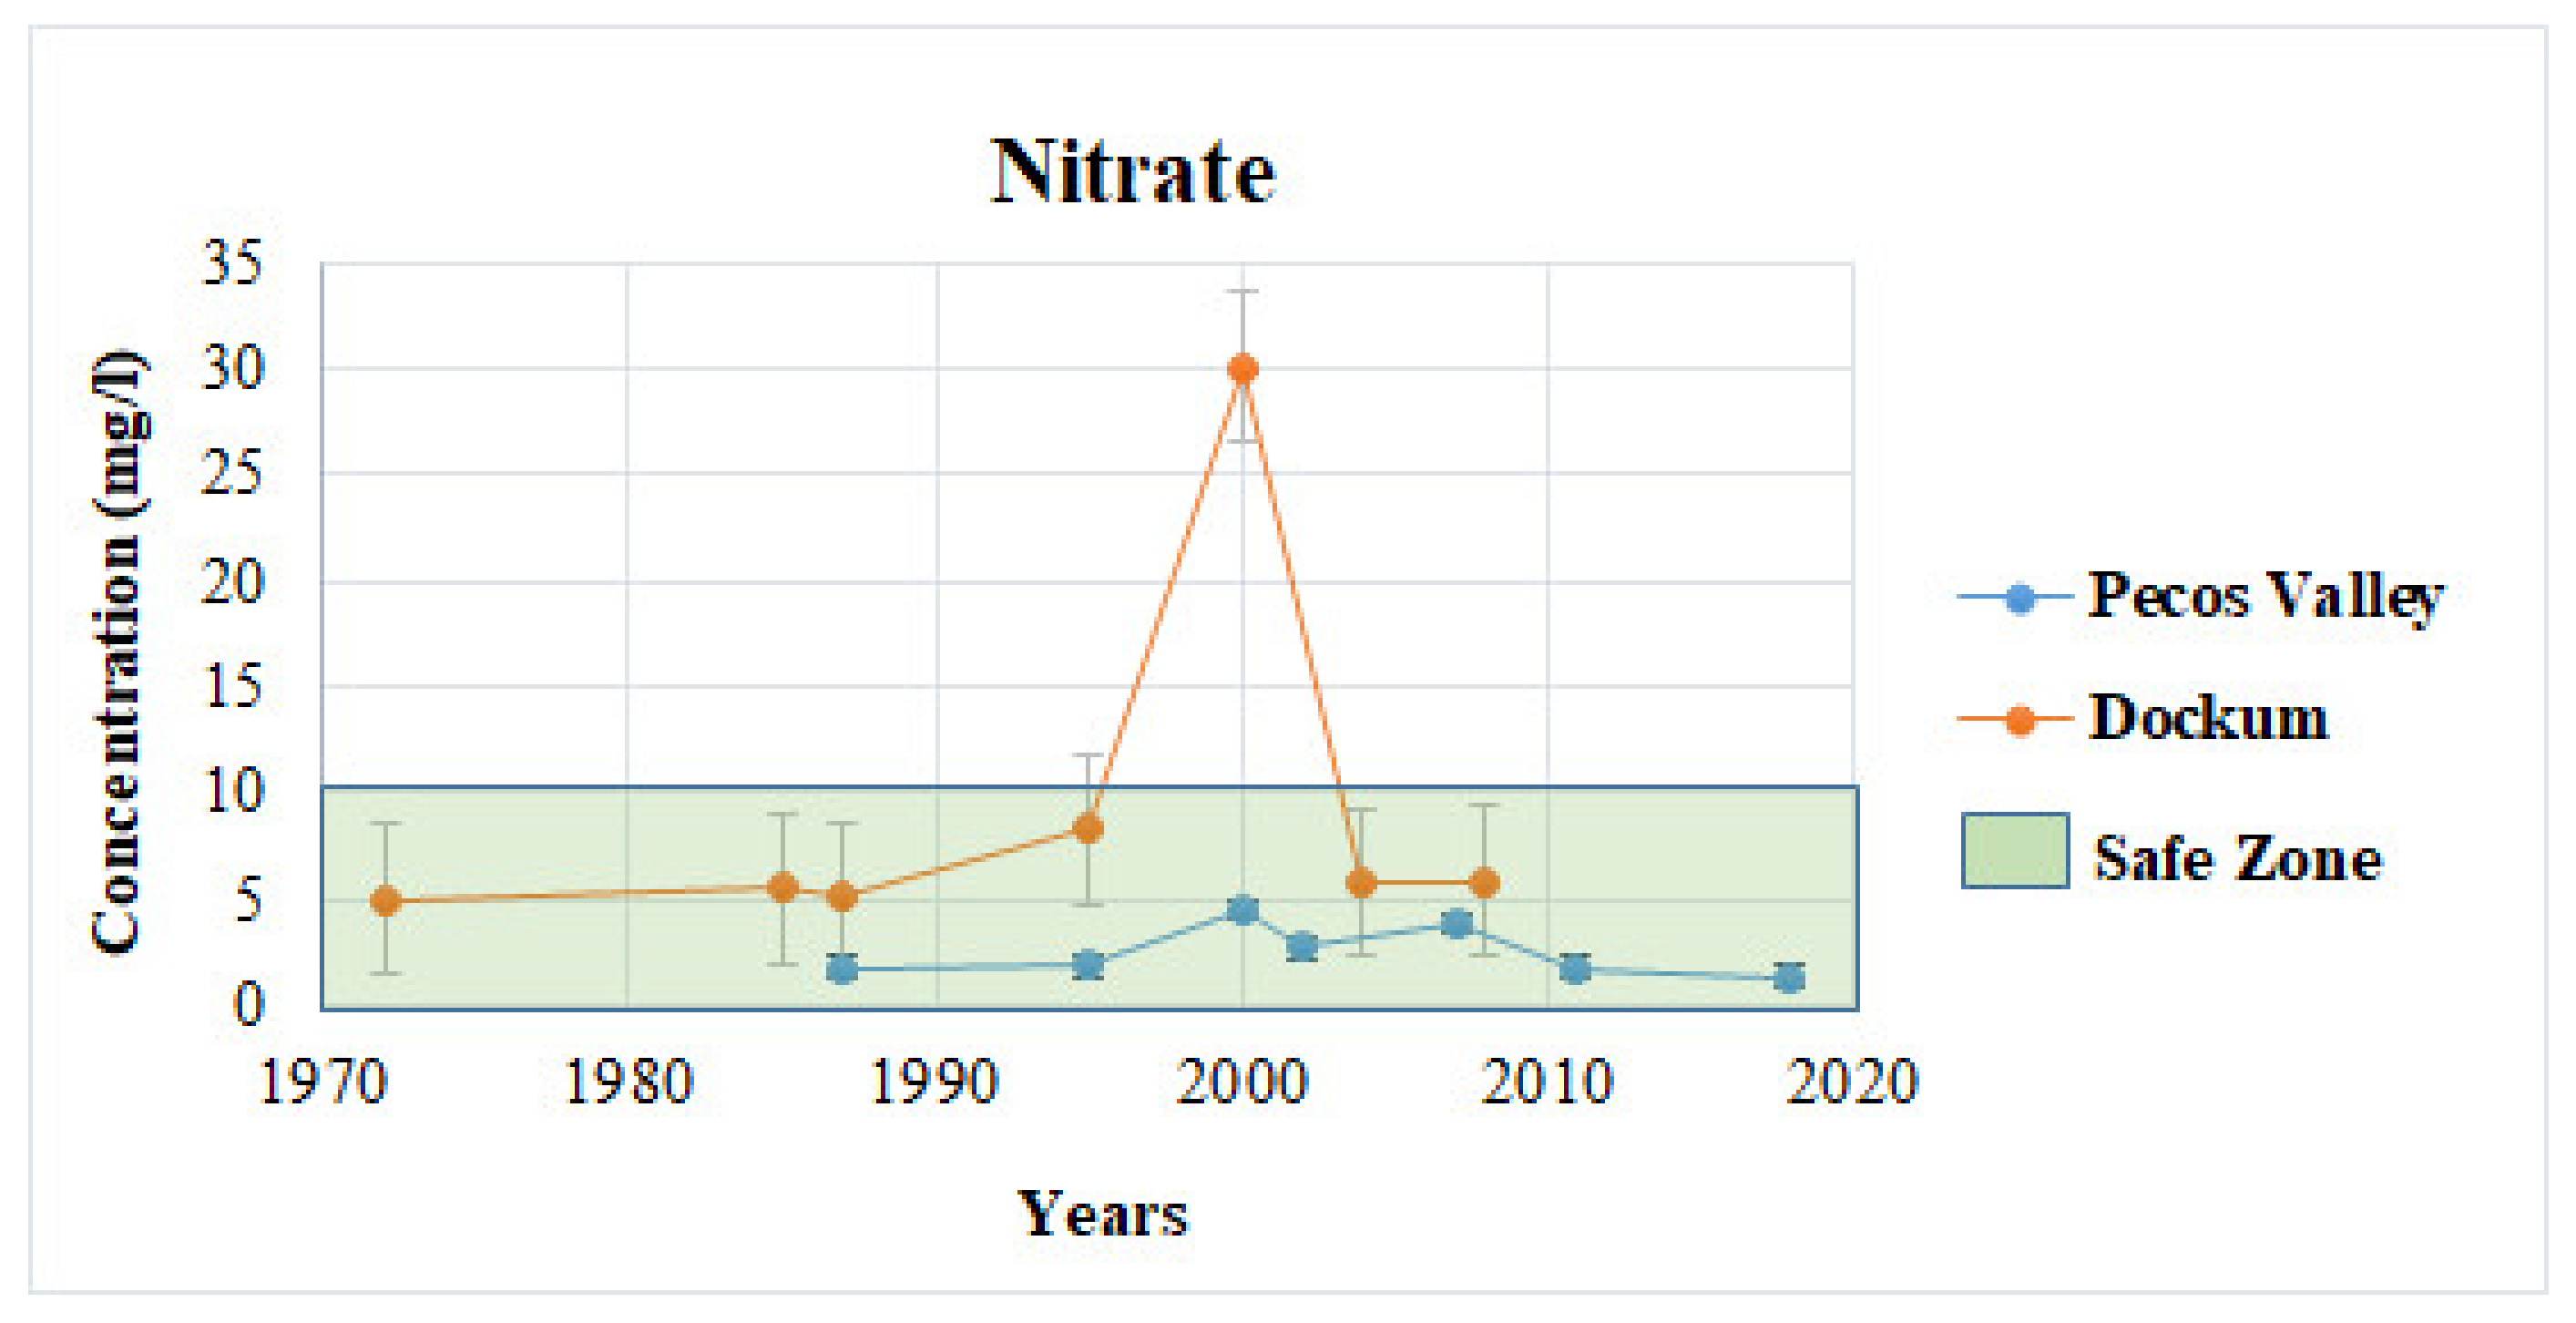
Nitrate is a compound with the chemical formula NO3− that forms from the element nitrogen. Nitrogen gas (N2) makes up about 78% of the earth’s atmosphere. Through the nitrogen cycle, nitrate is formed through the process of nitrification, where soil bacteria converts ammonia (NH3) into nitrogen dioxide (NO2), and another type of soil bacterium would add a third oxygen atom to form nitrate [34]. The cycle then comes in full circle under reducing conditions through the process of denitrification, to convert nitrate back into nitrogen gas. It is crucial for all living things and it can be found naturally in surface and groundwater at a level where it will not cause health problems, but high levels of nitrate in drinking water is a safety concern. High concentrations of nitrate in groundwater can occur from the result of an improper well location, overuse of chemical fertilizers, construction, etc. [20,34].
In Pecos Valley (Figure 5), the level of nitrate from 1987 to 2018 has remained below 5 ppm, However, the same cannot be said for the Dockum aquifer. In Dockum, from 1972 to 2008, it was recorded that the level of nitrate in 2000 was at 30 ppm, a dangerously high concentration. In 2004, the levels of nitrate went down to about 6 ppm. The high concentrations of nitrates in 2004 could have been from agricultural runoff from either animal waste or inorganic fertilizers (Figure 6). However, the concentrations could have also been from weathering, which can increase nitrate levels in water systems. The EPA has set the safety standard for nitrate in drinking water at 10 ppm [2]. If ingested at high levels, the nitrates will turn into nitrites, which is a more toxic form and could result in brain damage having long-term effects [15,16]. Reedy et al. [18] evaluated that nitrate was found at ~190 ppm in Texas, exceeding the MCL. Nitrates in Winkler County’s groundwater today is significantly lower. Compared to other studies [12,22,23], Winkler County has a higher concentration of nitrates than the cities of Odessa and Midland, with never exceeding the MCL.
4.5. Chromium
Chromium is a tasteless and odorless metallic element. It is found naturally in animals, plants, rocks, volcanic dust and soil. It is a very important industrial metal and it can get into drinking water systems through discharges of dye paint pigments, chrome plating wastes, leaching from hazardous sites and wood preservatives, all sources advent from human activities [17]. Chromium is not naturally found in water systems, and the main reason for chromium appearing in water comes from the discharge of steel factories [35]. Chromium levels in Pecos Valley and Dockum (Figure 7) are relatively low, with both never exceeding 50 ppb in the 23 years of study. However, there was very limited data availability from the Dockum aquifer with the data only being available from 2000 to 2004 in the study area. Therefore, an accurate comparison of the two aquifers for this parameter is not possible.
The EPA has set the safety standard for chromium at 100 ppb [2]. Unlike the other parameters looked at in this study, chromium is not excessively harmful to human health, but if ingested too much it can cause severe health effects such as reproductive harm and cancer, long- and short-term exposures can lead to respiratory and eye irritation, nasal ulcers, asthma attacks, and other health problems [35]. Previous studies [17,18] reported that chromium was found at ~190 ppb, exceeding the MCL in Texas. The levels of chromium in our study area are safer today than in others area of Texas. While looking at their studies [12,17,18], it is difficult to compare chromium with missing data from both studies; however, both counties never exceeded the MCL with the available data.
4.6. Chloride
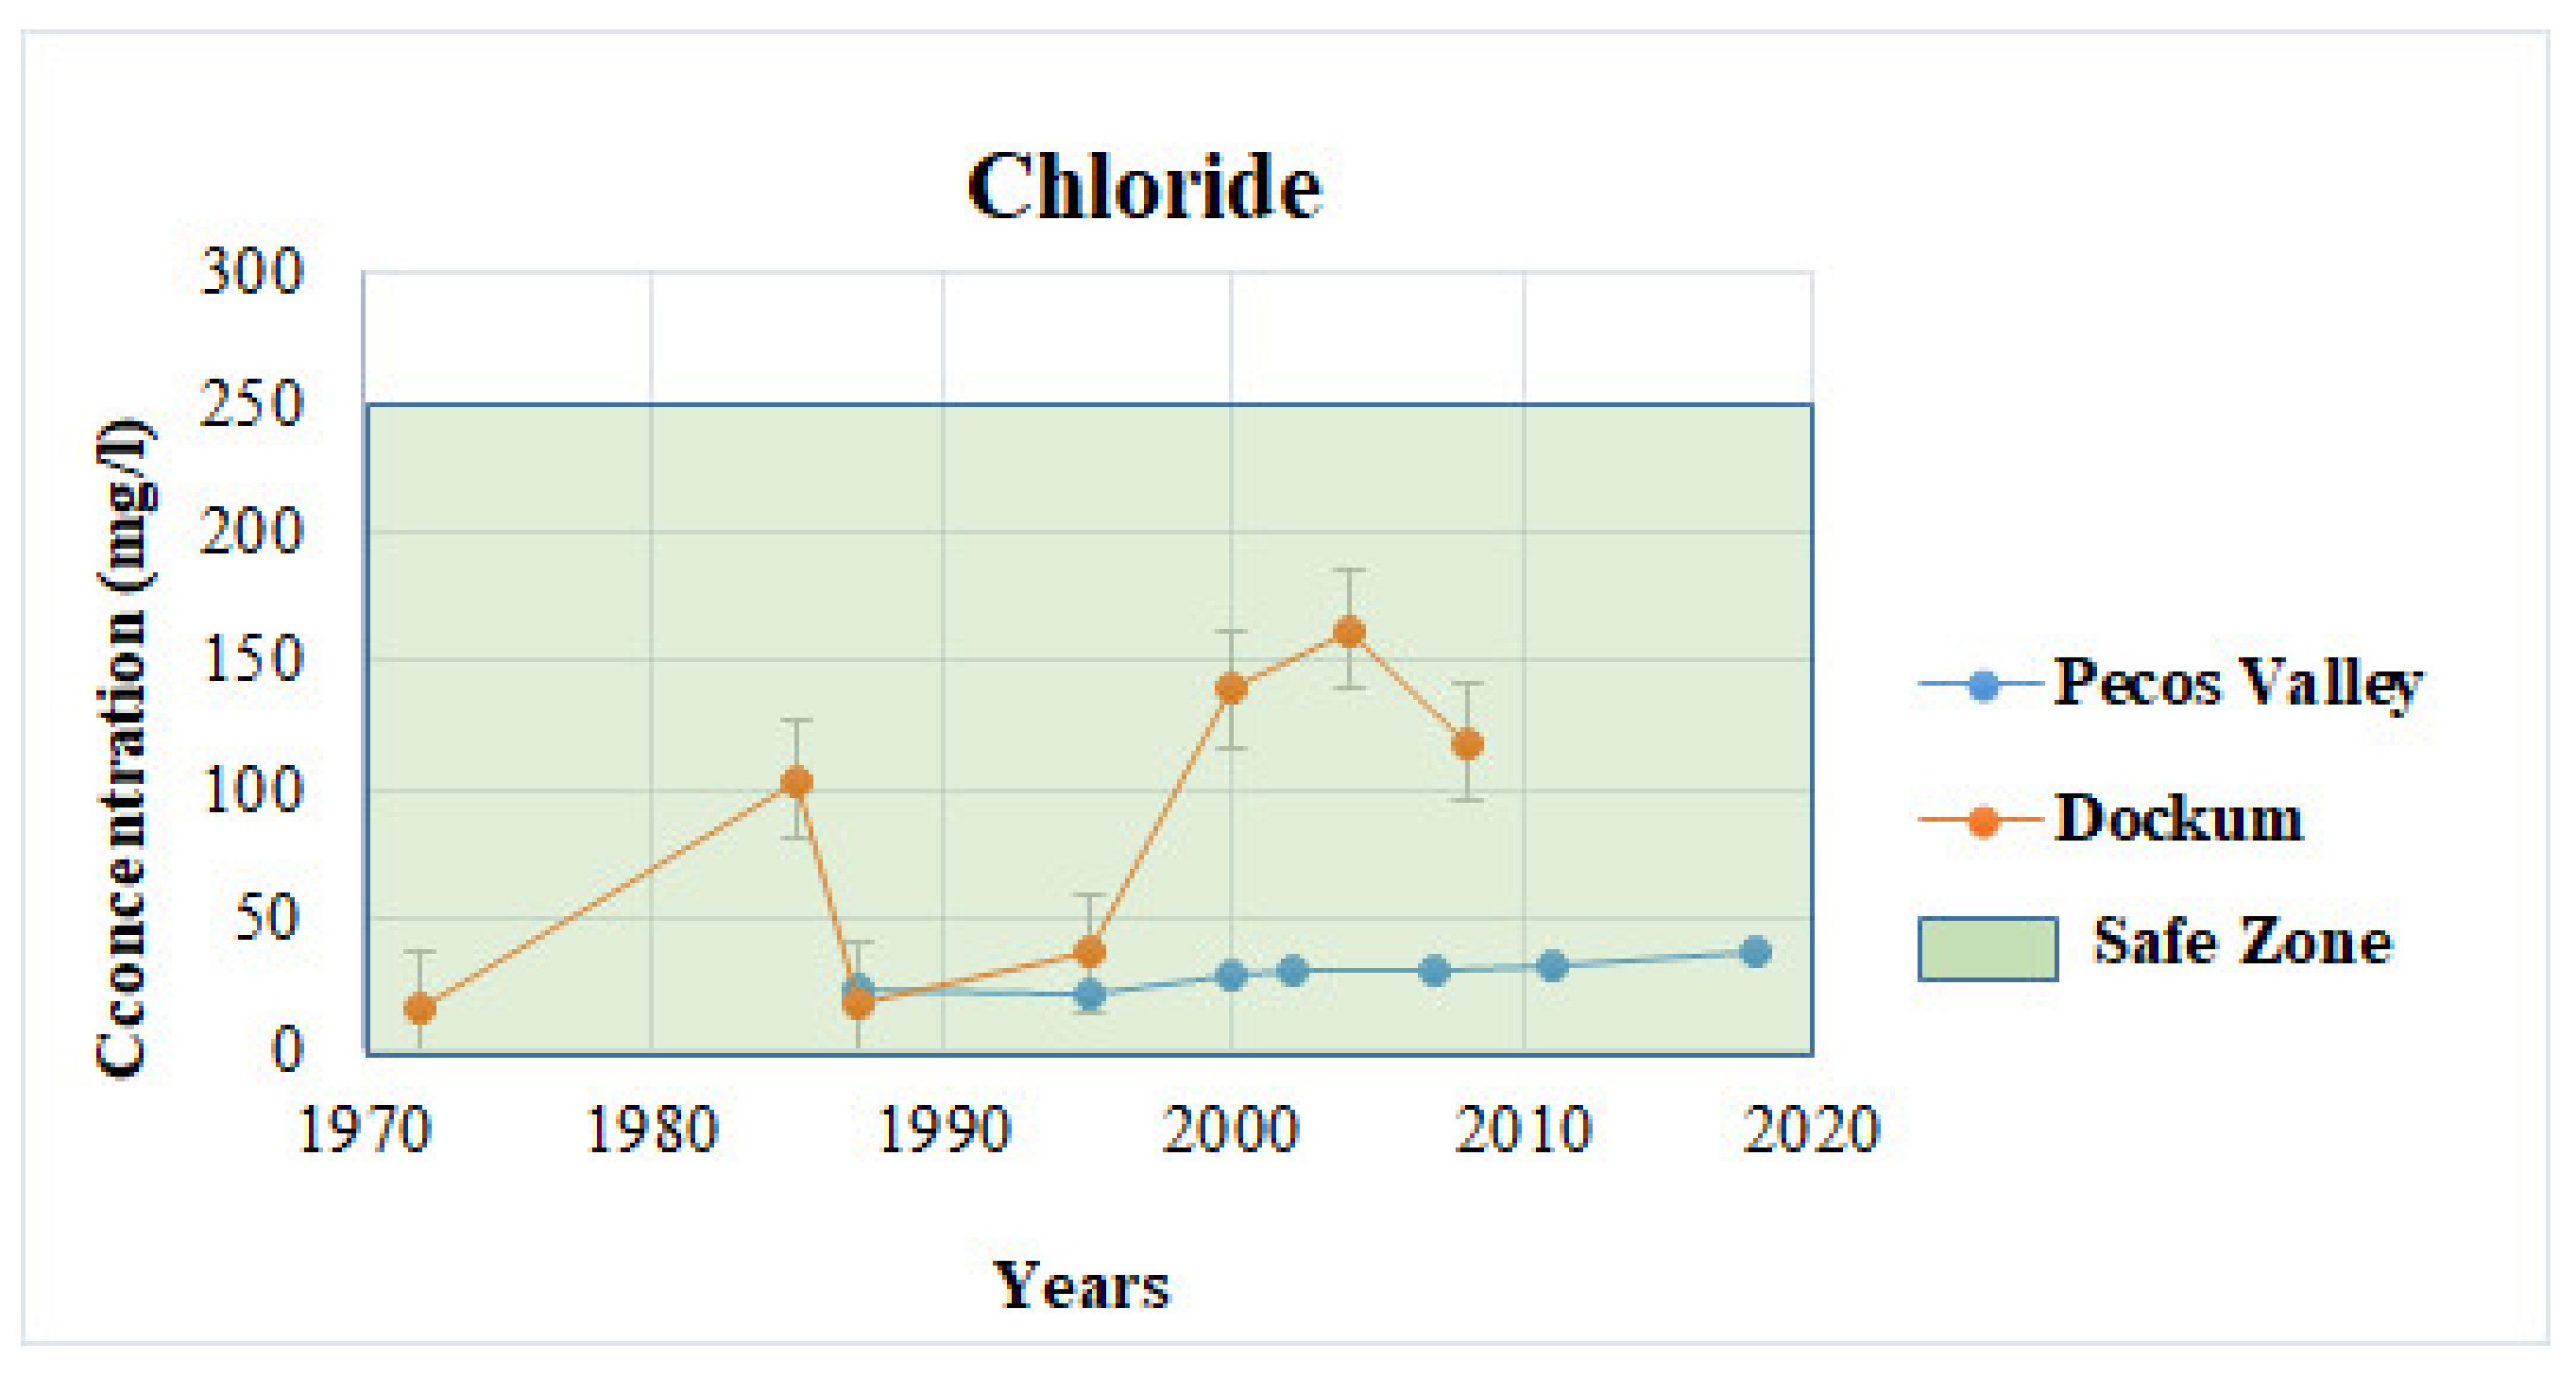
Chloride is a naturally occurring substance that is often soluble in water. Chloride is an essential electrolyte located in all body fluids responsible for maintaining acid/base, transmitting nerve impulses and regulating fluid in and out of cells [20]. All natural waters contain chloride, but their concentrations are low. Excessive concentrations of chloride can make water unpleasant to drink.16 It can enter surface water from agricultural runoff, waste water from industry and municipalities, and road salting. In both Dockum and Pecos Valley (Figure 8), the levels of chloride were low, never exceeding 200 ppm. The EPA has set a secondary standard for chloride with its concentration in water.
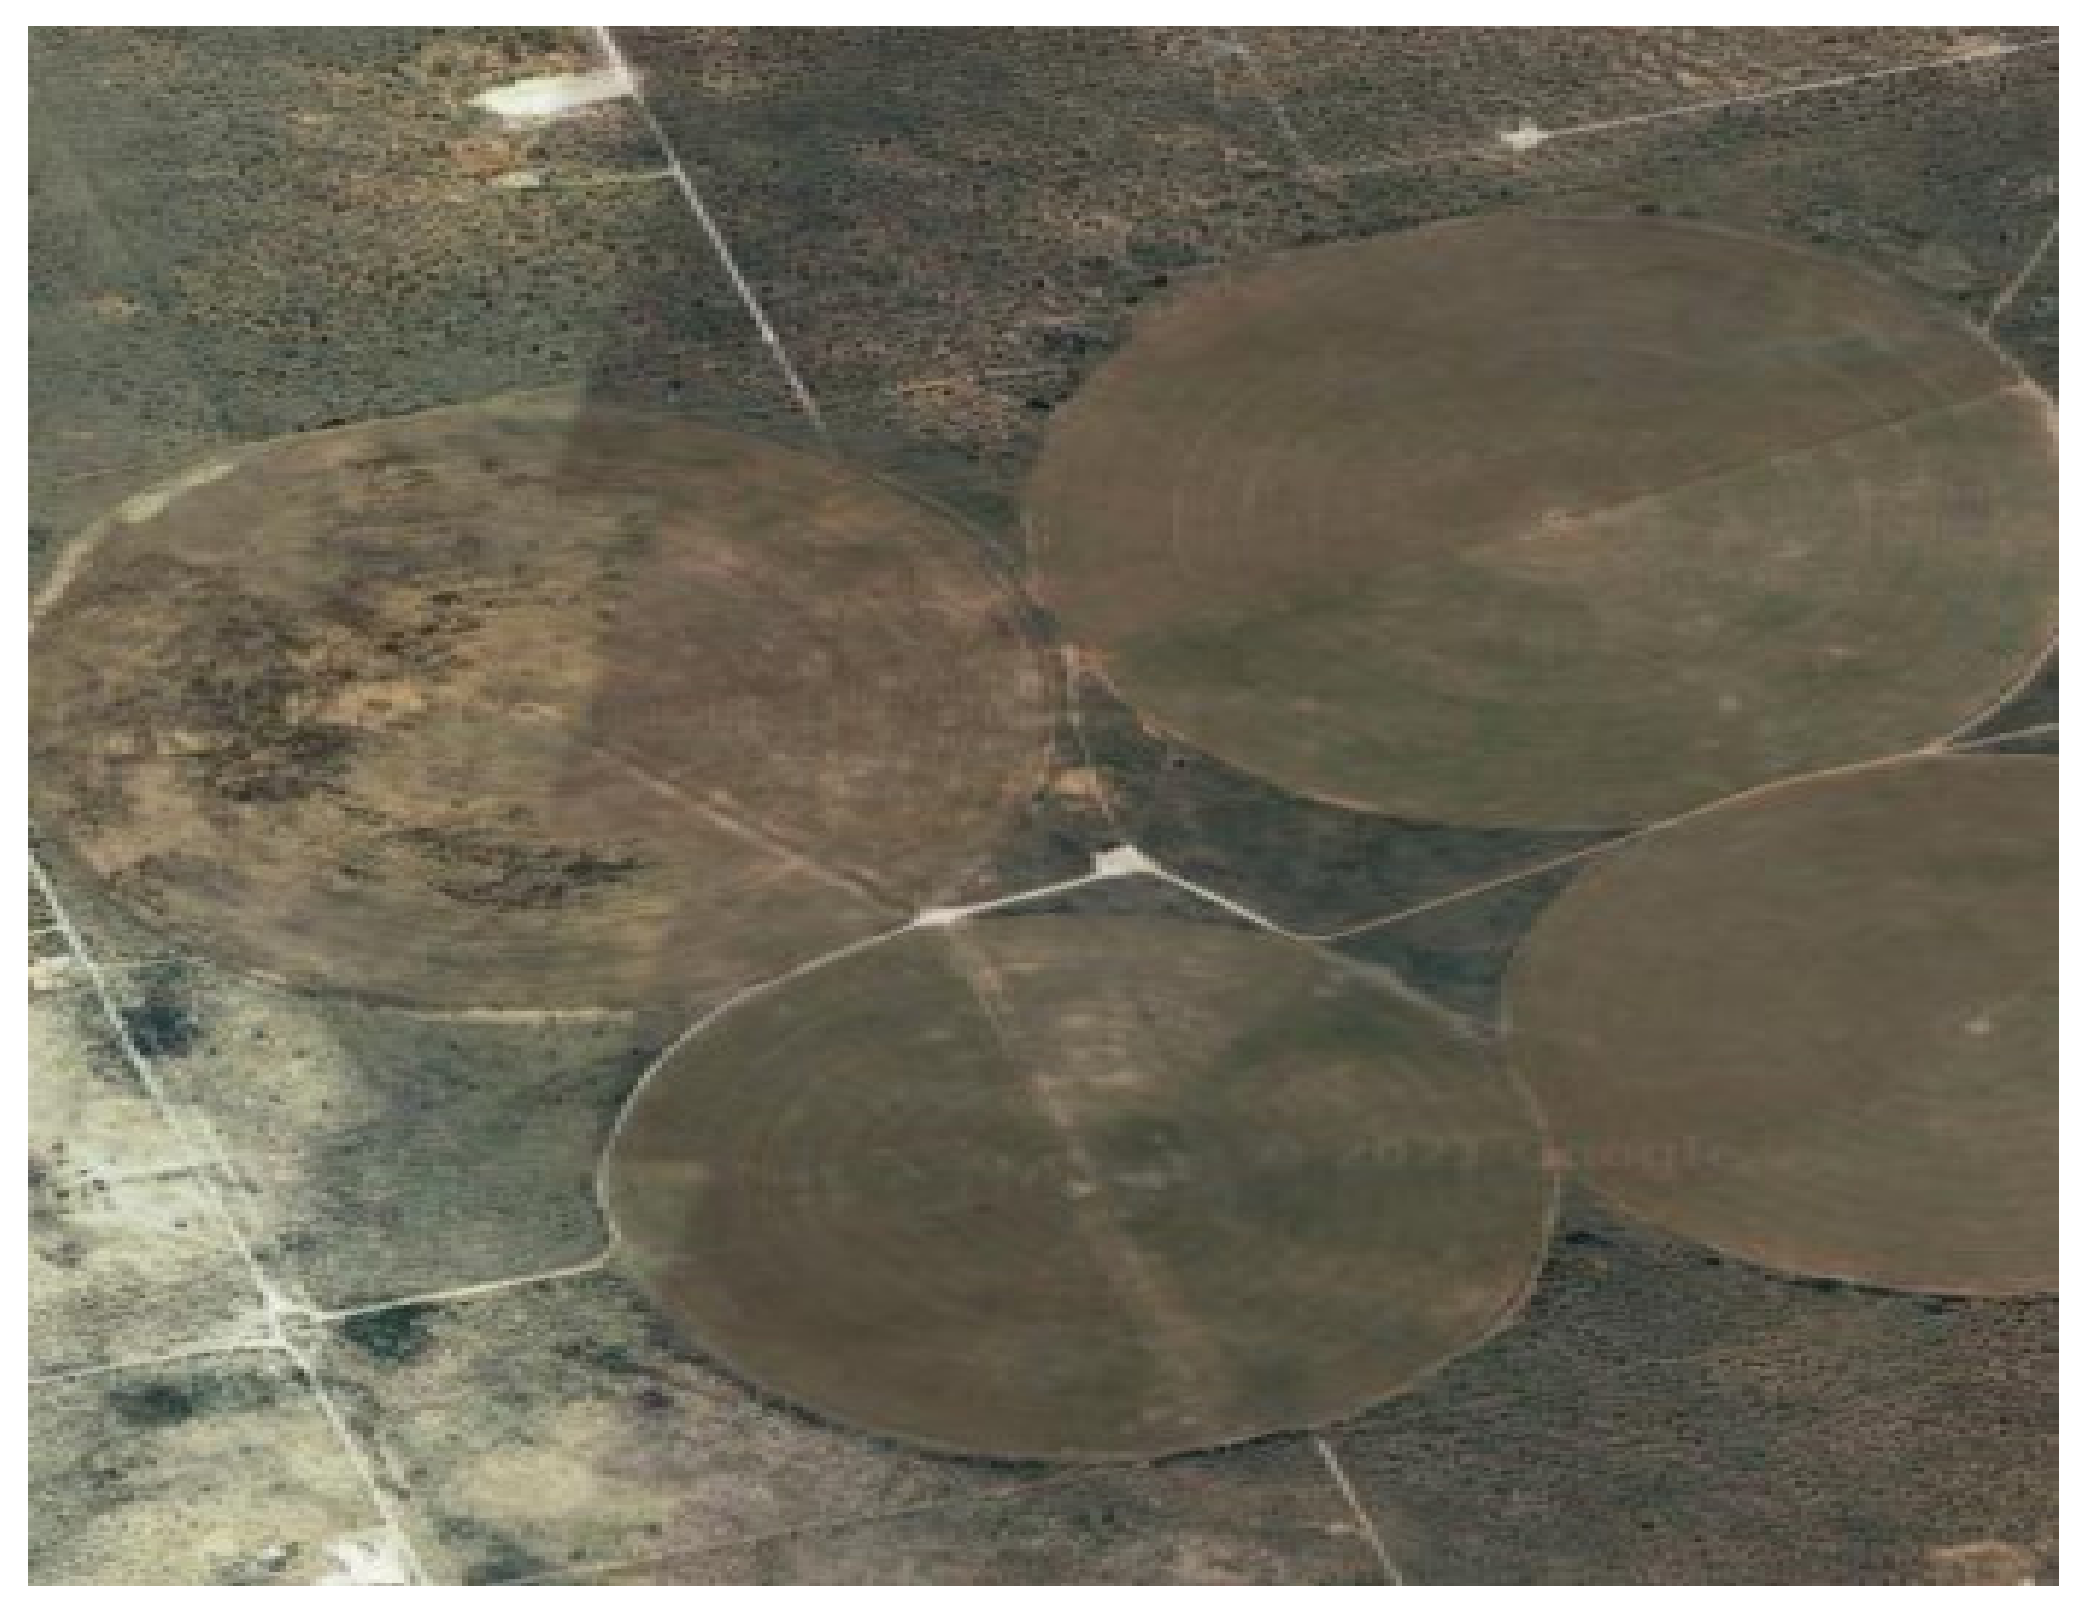
These secondary standards are not enforced by the EPA but are established guidelines to assist public water systems for aesthetic purposes such as taste and color; large amounts of chloride in water can appear salty [16]. These contaminants are typically not health threatening and the EPA has set the secondary standard for chloride in drinking water at 250 ppm [2]. However, if ingested at abnormally high levels, symptoms may include fluid retention, high blood pressure, spasms, irregular heart rate, confusion and seizures [9,36]. Researchers suggested that chloride was found at ~196 ppm, not exceeding the MCL [18]. There are plenty of crop practices near the study area, which shows an overview of the amount of crop circles where irrigation occurs [25,26]. We suspect that our study area has a higher level of chloride than other areas, because Winkler County has relatively high human interventions such as agriculture, and oil and gas productions. Baumgardner et al. [28] went on to confirm that halite contamination in shallow groundwater systems is impacted by road salts and the dissolution of natural halite invading aquifers, but discharge from water softening systems in houses affects groundwater.
4.7. Site Characterization
The Pecos Valley aquifer is an unconfined aquifer and ranges in depth from a few feet to 1500 feet in depth [15,37]. The Pecos Valley aquifer is characterized by unconsolidated and eolian sediments consisting of sand, silt, clay, and gravel. Average hydraulic conductivity was calculated to be 8.6 feet per day with estimated transmissivity values of less than 1.0 to greater than 14,000 feet per day [3,4]. Pecos Valley is primarily utilized for agricultural and industrial purposes with some in the public water supply. Although highly variable, the groundwater quality is higher than average within the Monument Draw Trough, with total dissolved solids under 1000 mg/L.
The Dockum aquifer is a confined sandstone aquifer. The Dockum aquifer locally produces fresh to saline groundwaters and is utilized for domestic purposes along with oil and gas productions [37]. It is the basal member of the Dockum formation, with the upper layers being mainly siltstone and claystone. In areas where these confining groups have been eroded away, the Pecos Valley and Dockum aquifers are hydraulically connected. The Dockum aquifer ranges in depth from 120 feet to 1300 feet [3,4]. Within the study area, the Dockum aquifer regularly demonstrated higher groundwater quality parameters than the Pecos Valley aquifer.
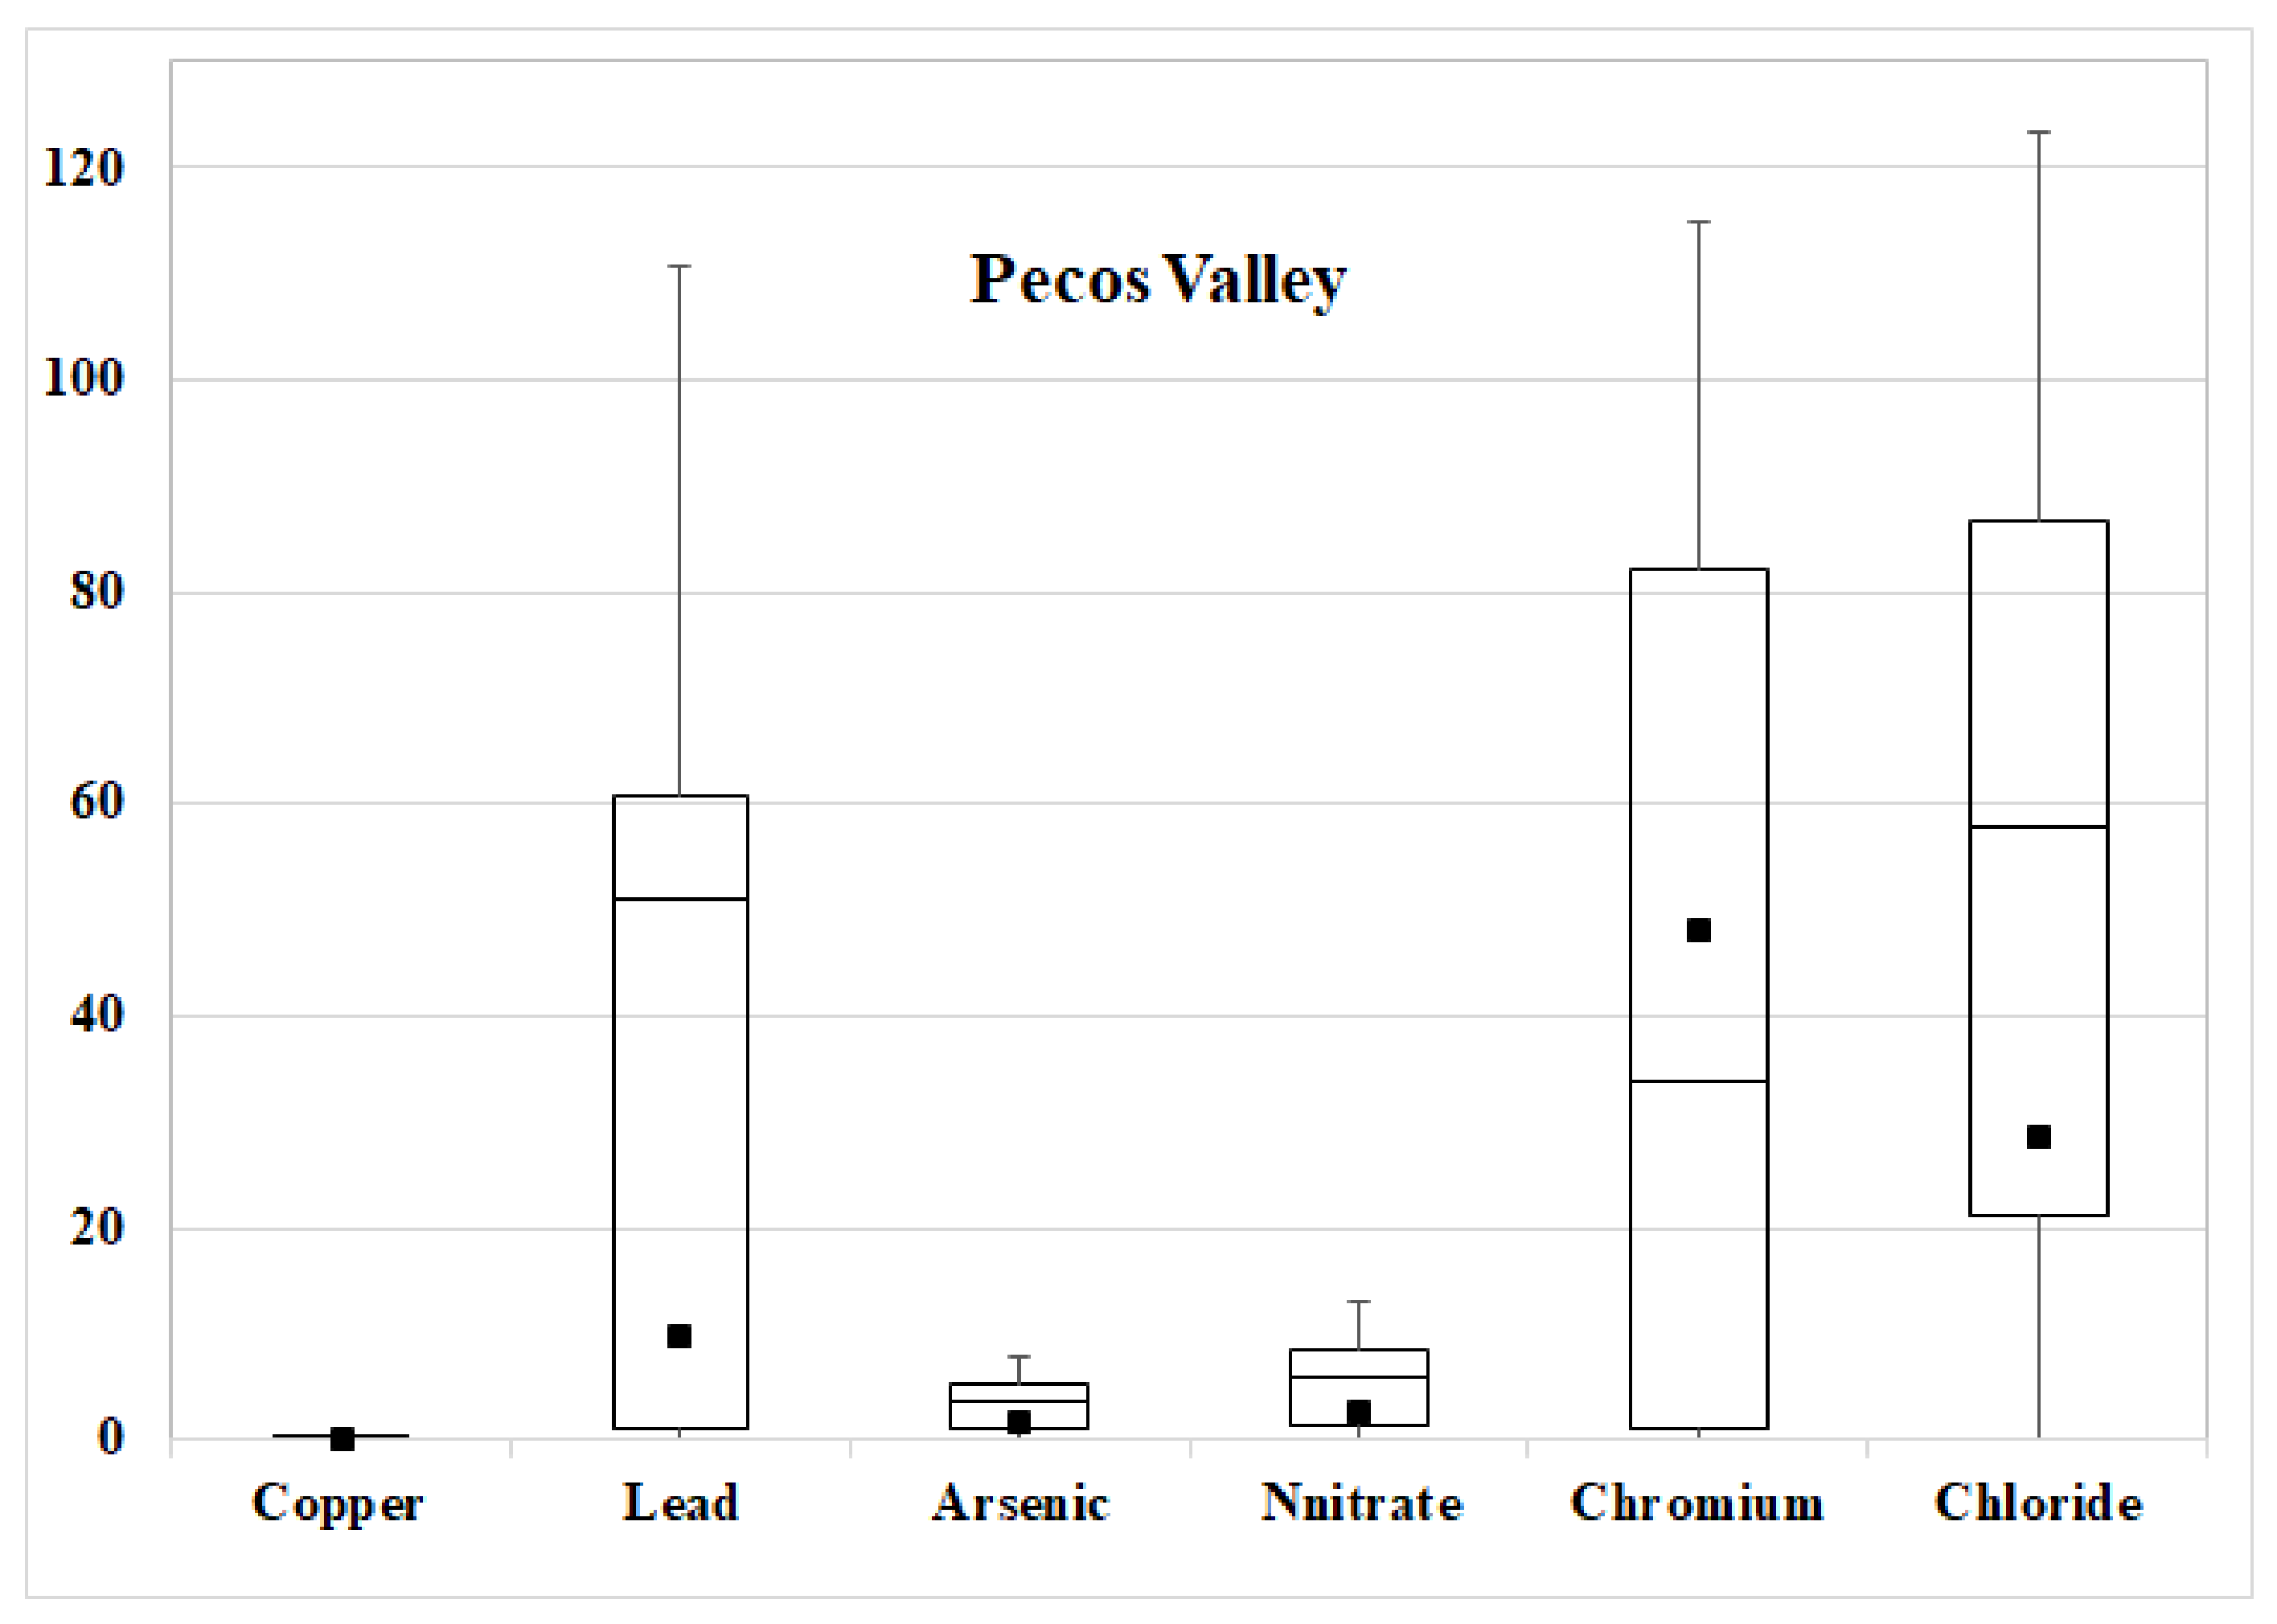
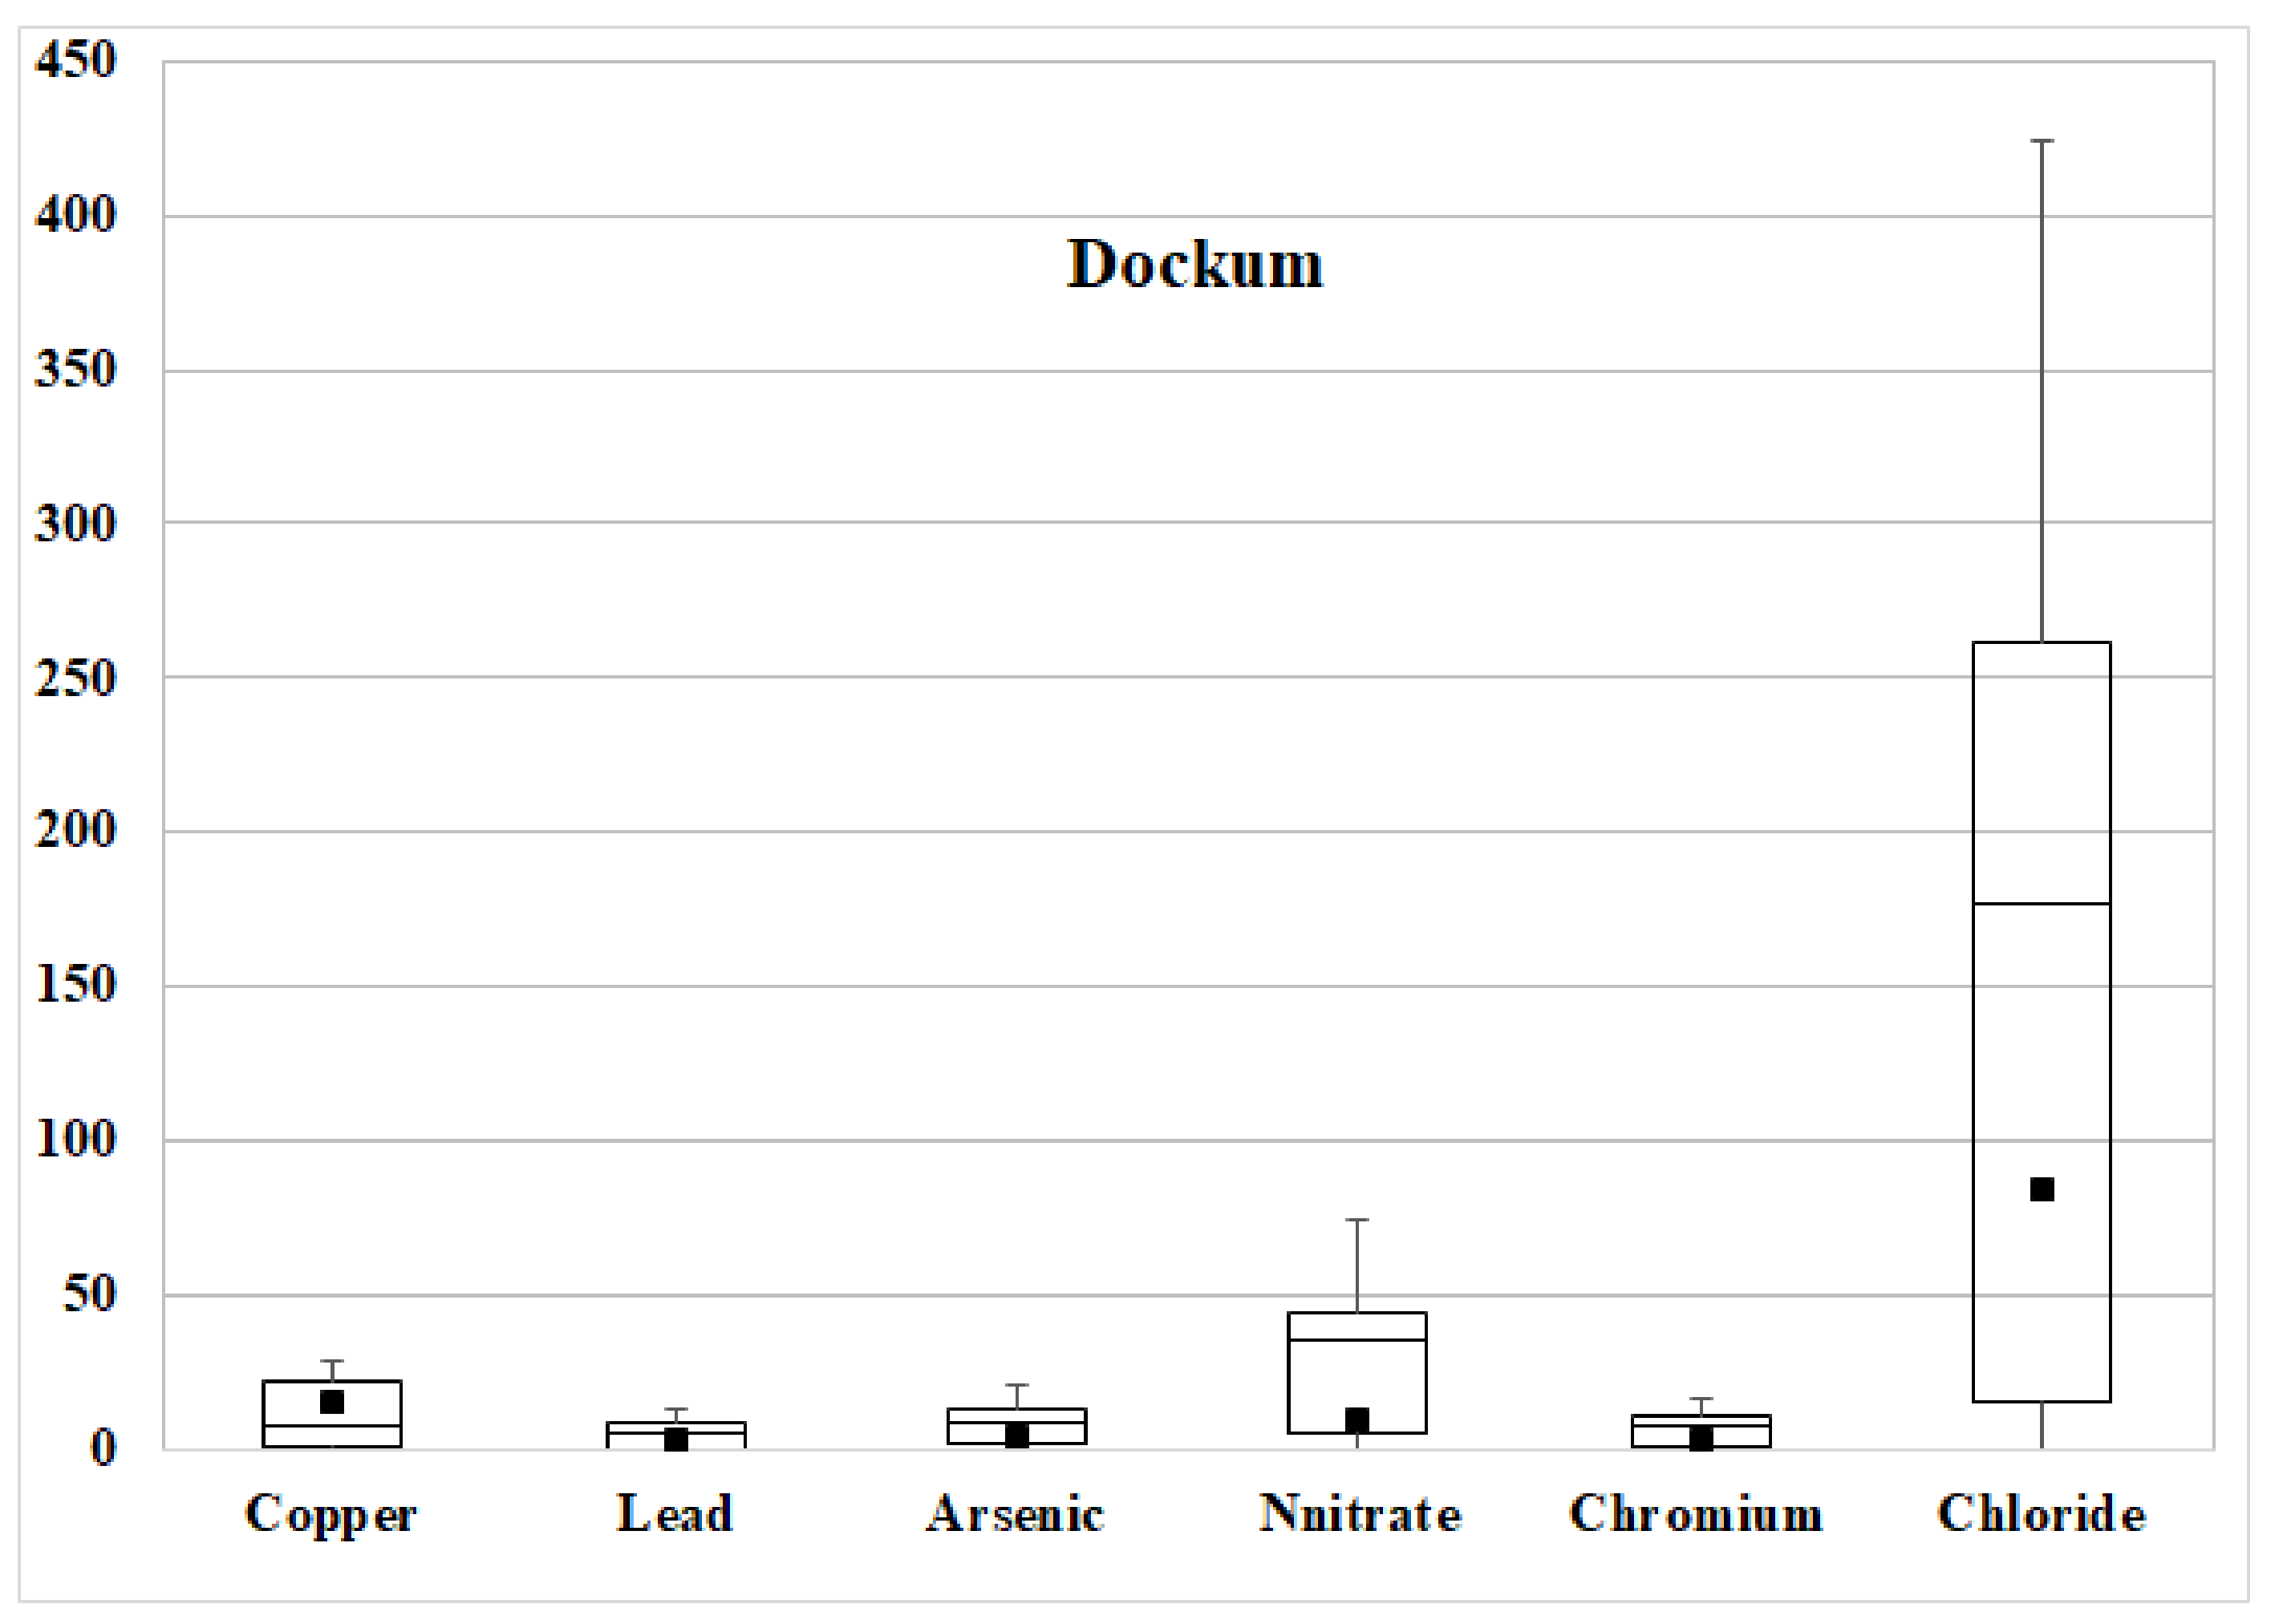
The continuing development of new sinkholes may be expected, particularly in our study area that the subsidence process has already started (Figure 9). Evidence of this occurring to the East and North of Wink Sink #2 has been found, showing a rate of subsidence of up to ~13 cm per year [21,28]. This could be the development and location of a new sinkhole. In conjunction with this finding, additional subsidence has been occurring around Wink Sink #1, indicating that a future growth of a sinkhole may be imminent [21]. Table 4 and Table 5 present the statistical analysis for the Pecos Valley and Dockum aquifers in the study area. Figure 10 and Figure 11 show information about the median, 25th and 75th percentiles, and extreme data present in each dataset by parameter, which shows the distribution and dispersion of the groundwater quality data acquired.
5. Conclusions
Water in West Texas is scarce, which is why it is imperative to preserve it. This study has evaluated the public water contamination in Wink, Texas, looking at the Pecos Valley and Dockum aquifers from 1972 to 2018. Based on the data collected for both aquifers, it was difficult to make an accurate comparison, for there were very limited data presented in the Dockum data set. Nevertheless, when comparing the TDS level of both aquifers, it appears that Dockum has a higher concentration level on average. Therefore, Dockum is presenting higher contamination levels than the Pecos Valley aquifer, but according to the EPA safety guidelines, both aquifers are safe for consumption. However, based on the parameters that exceeded the MCL in previous years, there is no certainty that this quality of water will last due to high human activities in the area. Thus, further research within the area is recommended to properly analyze the variance of contaminant levels. For future research, a more complete data set will be needed to improve the effectiveness of predicting the behavior of contaminant levels in water. All the parameters analyzed are proven to be mainly from human activities such as agriculture and hydraulic fracturing. Therefore, it is fair to conclude that human activities are a significant contributor to the contamination of the aquifers in Winkler County.
Author Contributions
J.L. data collection, formal analysis, investigation, writing—original draft preparation. J.H. conceptualizatoin, supervision, project administration, writing—original draft preparation. M.S. data curation, writing—review & edit. All authors have read and agreed to the published version of the manuscript.
Funding
This work was supported by a Rising STAR (Science and Technology Acquisition and Retention) Program from the University of Texas System.
Institutional Review Board Statement
Not applicable.
Informed Consent Statement
Not applicable.
Data Availability Statement
Not applicable.
Conflicts of Interest
The authors declare no conflict of interest.
References
- Hamer, A. 70% of Earth’s Freshwater Is Frozen. Available online: https://www.discovery.com/nature/Earths-Fresh-Water-Frozen (accessed on 1 August 2019).
- United States Environmental Protection Agency (US EPA). National Primary Drinking Water Regulations. 2017. Available online: https://www.epa.gov/ground-water-and-drinking-water/national-primary-drinking-water-regulations (accessed on 9 March 2019).
- United States Geological Survey (USGS). Geology and Ground Water Resources of Winkler County, Texas. Texas Water Science Center. 1993. Available online: https://pubs.er.usgs.gov/publication/wsp1582 (accessed on 1 January 2021).
- Garret, G.; Edwards, R. Aquifers of West Texas. Texas Water Development Board (TWDB). 2001. Available online: https://www.twdb.texas.gov/publications/reports/numbered_reports/doc/R356/356_AquifersofWestTexas.pdf (accessed on 10 March 2020).
- Heo, J.; Yu, J.; Giardino, J.R.; Cho, H. Water resources response to climate and land-cover changes in a semi-arid watershed, New Mexico, USA. Terr. Atmos. Ocean. Sci. 2015, 26, 463–474. [Google Scholar] [CrossRef] [Green Version]
- Johnson, K.S. Development of the Wink Sink in West Texas, U.S.A., Due to Salt Dissolution and Collapse. Environ. Geol. Water Sci. 1989, 14, 81–92. [Google Scholar] [CrossRef]
- Seckler, D.; Barker, R.; Amarasingh, U. Water Scarcity in the Twenty-First Century. Water Resour. Dev. 1999, 15, 29–42. [Google Scholar] [CrossRef]
- Blandford, T.N.; Blazer, D.J. Hydrologic Relationships and Numerical Simulations of the Exchange of Water between the Southern Ogallala and Edwards-Trinity Aquifers in Southwest Texas. 2019. Available online: https://www.twdb.texas.gov/publications/reports/numbered_reports/doc/R360/Ch05.pdf (accessed on 21 March 2020).
- World Health Organization (WHO). Guidelines for Drinking-Water Quality, 4th ed.; Incorporating the first addendum; World Health Organization: Geneva, Switzerland, 2017; pp. 1–564. Available online: https://www.who.int/publications/i/item/9789241549950 (accessed on 1 March 2021).
- National Research Council (NRC). Copper in Drinking Water. 2000. Available online: https://www.nap.edu/catalog/9782/copper-in-drinking-water (accessed on 11 May 2020).
- Alarcon, S. Consumer Confidence Report for Public Water System, city of Kermit. Center for Disease Control and Prevention (CDC). 2017. Available online: https://www.cdc.gov/healthywater/drinking/public/understanding_ccr.html (accessed on 13 December 2020).
- Rodriguez, J.; Heo, J.; Park, J.; Lee, S.S.; Miranda, K. Inorganic Pollutants in the Water of Midland and Odessa, Permian Basin, West Texas. Air Soil Water Res. 2019, 12, 1–7. [Google Scholar] [CrossRef]
- Sharpe, W.; Amy, G. Lead in Drinking Water. Pennsylvania State University Extension. 2020. Available online: https://extension.psu.edu/lead-in-drinking-water (accessed on 21 February 2021).
- Nickson, R.T.; McArthur, J.M.; Shrestha, B.; Kyaw-Myint, T.; Lowry, D. Arsenic and Other Drinking Water Quality Issues, Muzaffargarh District, Pakistan. Appl. Geochem. 2005, 20, 55–68. [Google Scholar] [CrossRef]
- Hudak, P.F. Nitrate, arsenic and selenium concentrations in the Pecos Valley Aquifer, West Texas, USA. Int. J. Environ. Res. 2010, 4, 229–236. [Google Scholar]
- United States Environmental Protection Agency (US EPA). Parameters of Water Quality—Interpretation and Standards Wellhead Protection; EPA: Washington, DC, USA, 2001. [Google Scholar]
- Honeycutt, M.E. Hexavalent chromium in Texas drinking water. Toxicol. Sci. 2011, 119, 423–424. [Google Scholar] [CrossRef] [Green Version]
- Reedy, R.; Scanlon, B.; Walden, S.; Strassberg, G. Naturally Occurring Groundwater Contamination in Texas Final Contract Report Prepared for the Texas Water Development Board. Available online: http://www.twdb.texas.gov/publications/reports/contracted_reports/doc/1004831125.pdf (accessed on 3 December 2020).
- Manz, L.R.; Sarkar, D.; Hammond, W.W., Jr. Water resources and water quality in the Rio Grande Valley of Texas: Current status and future projections. Environ. Geosci. 2005, 12, 193–206. [Google Scholar] [CrossRef]
- Reeves, C.C., Jr.; Miller, W.D. Nitrate, Chloride and Dissolved Solids, Ogallala Aquifer, West Texas. Groundwater 1978, 16, 167–173. [Google Scholar] [CrossRef]
- Shi, Y.; Tang, Y.; Lu, Z.; Kim, J.W.; Peng, J. Subsidence of sinkholes in wink, Texas from 2007 to 2011 detected by time-series InSAR analysis. Geomat. Nat. Hazards Risk 2019, 10, 1125–1138. [Google Scholar] [CrossRef]
- Rodriguez, J.; Heo, J.; Kim, K.H. The Impact of Hydraulic Fracturing on Groundwater Quality in the Permian Basin, West Texas, USA. Water 2019, 12, 796. [Google Scholar] [CrossRef] [Green Version]
- Nelson, R.; Heo, J. Monitoring environmental parameters with oil and gas developments in the Permian Basin, USA. Int. J. Environ. Res. Public Health 2020, 17, 4026. [Google Scholar] [CrossRef] [PubMed]
- Meng, Q. The impact of fracking on the environment: A total environmental study paradigm. Sci. Total Environ. 2017, 580, 953–957. [Google Scholar] [CrossRef] [PubMed]
- Land, L. Geophysical Records of Anthropogenic Sinkhole Formation in the Delaware Basin Region, Southeast New Mexico and West Texas, USA. Carbonates Evaporties 2013, 28, 183–190. [Google Scholar] [CrossRef]
- English, S.; Heo, J.; Won, J. Investigation of Sinkhole Formation with Human Influence: A Case Study from Wink Sink in Winkler County, Texas. Sustainability 2020, 12, 3537. [Google Scholar] [CrossRef]
- Kimmel, T.M., Jr.; Nielsen-Gammon, J.; Rose, B.; Mogil, H.M. The weather and climate of Texas: A big state with big extremes. Weatherwise 2016, 69, 25–33. [Google Scholar] [CrossRef]
- Baumgardner, R.W., Jr.; Hoadley, A.D.; Goldstein, A.G. Formation of the Wink Sink, a salt dissolution and collapse feature, Winkler County, Texas. Virtual Landsc. Tex. 1982, 114, 1–38. [Google Scholar]
- Ackers, A.L.; Dechicchis, R.; Smith, R.H. Hendrick Field, Winkler County, Texas. AAPG Bull. 1930, 14, 923–944. [Google Scholar]
- Janks, J.S.; Yusas, M.R.; Hall, C.M. Clay Mineralogy of an Interbedded Sandstone, Dolomite, and Anhydrite: The Permian Yates Formation, Winkler County, Texas. The Society for Sedimentary Geology (SEPM). 1992. Available online: https://pubs.geoscienceworld.org/books/book/1098/chapter/10549911/Clay-Mineralogy-of-an-Interbedded-Sandstone (accessed on 5 March 2021).
- Apergis, N.; Ewing, B.T.; Payne, J.E. A time series analysis of oil production, rig count and crude oil price: Evidence from six U.S. oil producing regions. Energy 2016, 97, 339–349. [Google Scholar] [CrossRef]
- Ahlfeld, D.P.; Pinder, G.F. Solving stochastic groundwater problems using sensitivity theory and hermite interpolating polynomials. Dev. Water Sci. 1988, 35, 179–184. [Google Scholar]
- Sharma, S.; Bhattacharya, A. Drinking water contamination and treatment techniques. Appl. Water Sci. 2017, 7, 1043–1067. [Google Scholar] [CrossRef] [Green Version]
- Buckley, G. Nitrogen Cycle. Biology Dictionary. Available online: Biologydictionary.net (accessed on 16 May 2020).
- Collins, B.J.; Stout, M.D.; Levine, K.E.; Kissling, G.E.; Melnick, R.L.; Fennell, T.R.; Walden, R.; Abdo, K.; Pritchard, J.B.; Fernando, R.A.; et al. Exposure to hexavalent chromium resulted in significantly higher tissue chromium burden compared with trivalent chromium following similar oral doses to male F344/N rats and female B6C3F1 mice. Toxicol. Sci. 2010, 118, 368–379. [Google Scholar] [CrossRef] [PubMed] [Green Version]
- Swigart, J.; Heo, J.; Wolf, D. Soil contamination assessments from drilling fluids and produced water using combined field and laboratory investigations: A case study of Arkansas, USA. Int. J. Environ. Res. Public Health 2021, 18, 2421. [Google Scholar] [CrossRef]
- Anaya, R.; Jones, I. Groundwater Availability Model for the Edwards-Trinity (Plateau) and Pecos Valley Aquifers of Texas. Texas Water Development Board (TWDB). Report 373; 2009. Available online: https://www.twdb.texas.gov/groundwater/models/alt/eddt_p_2011/ETP_PV_One_Layer_Model.pdf (accessed on 18 November 2020).
Figure 1.
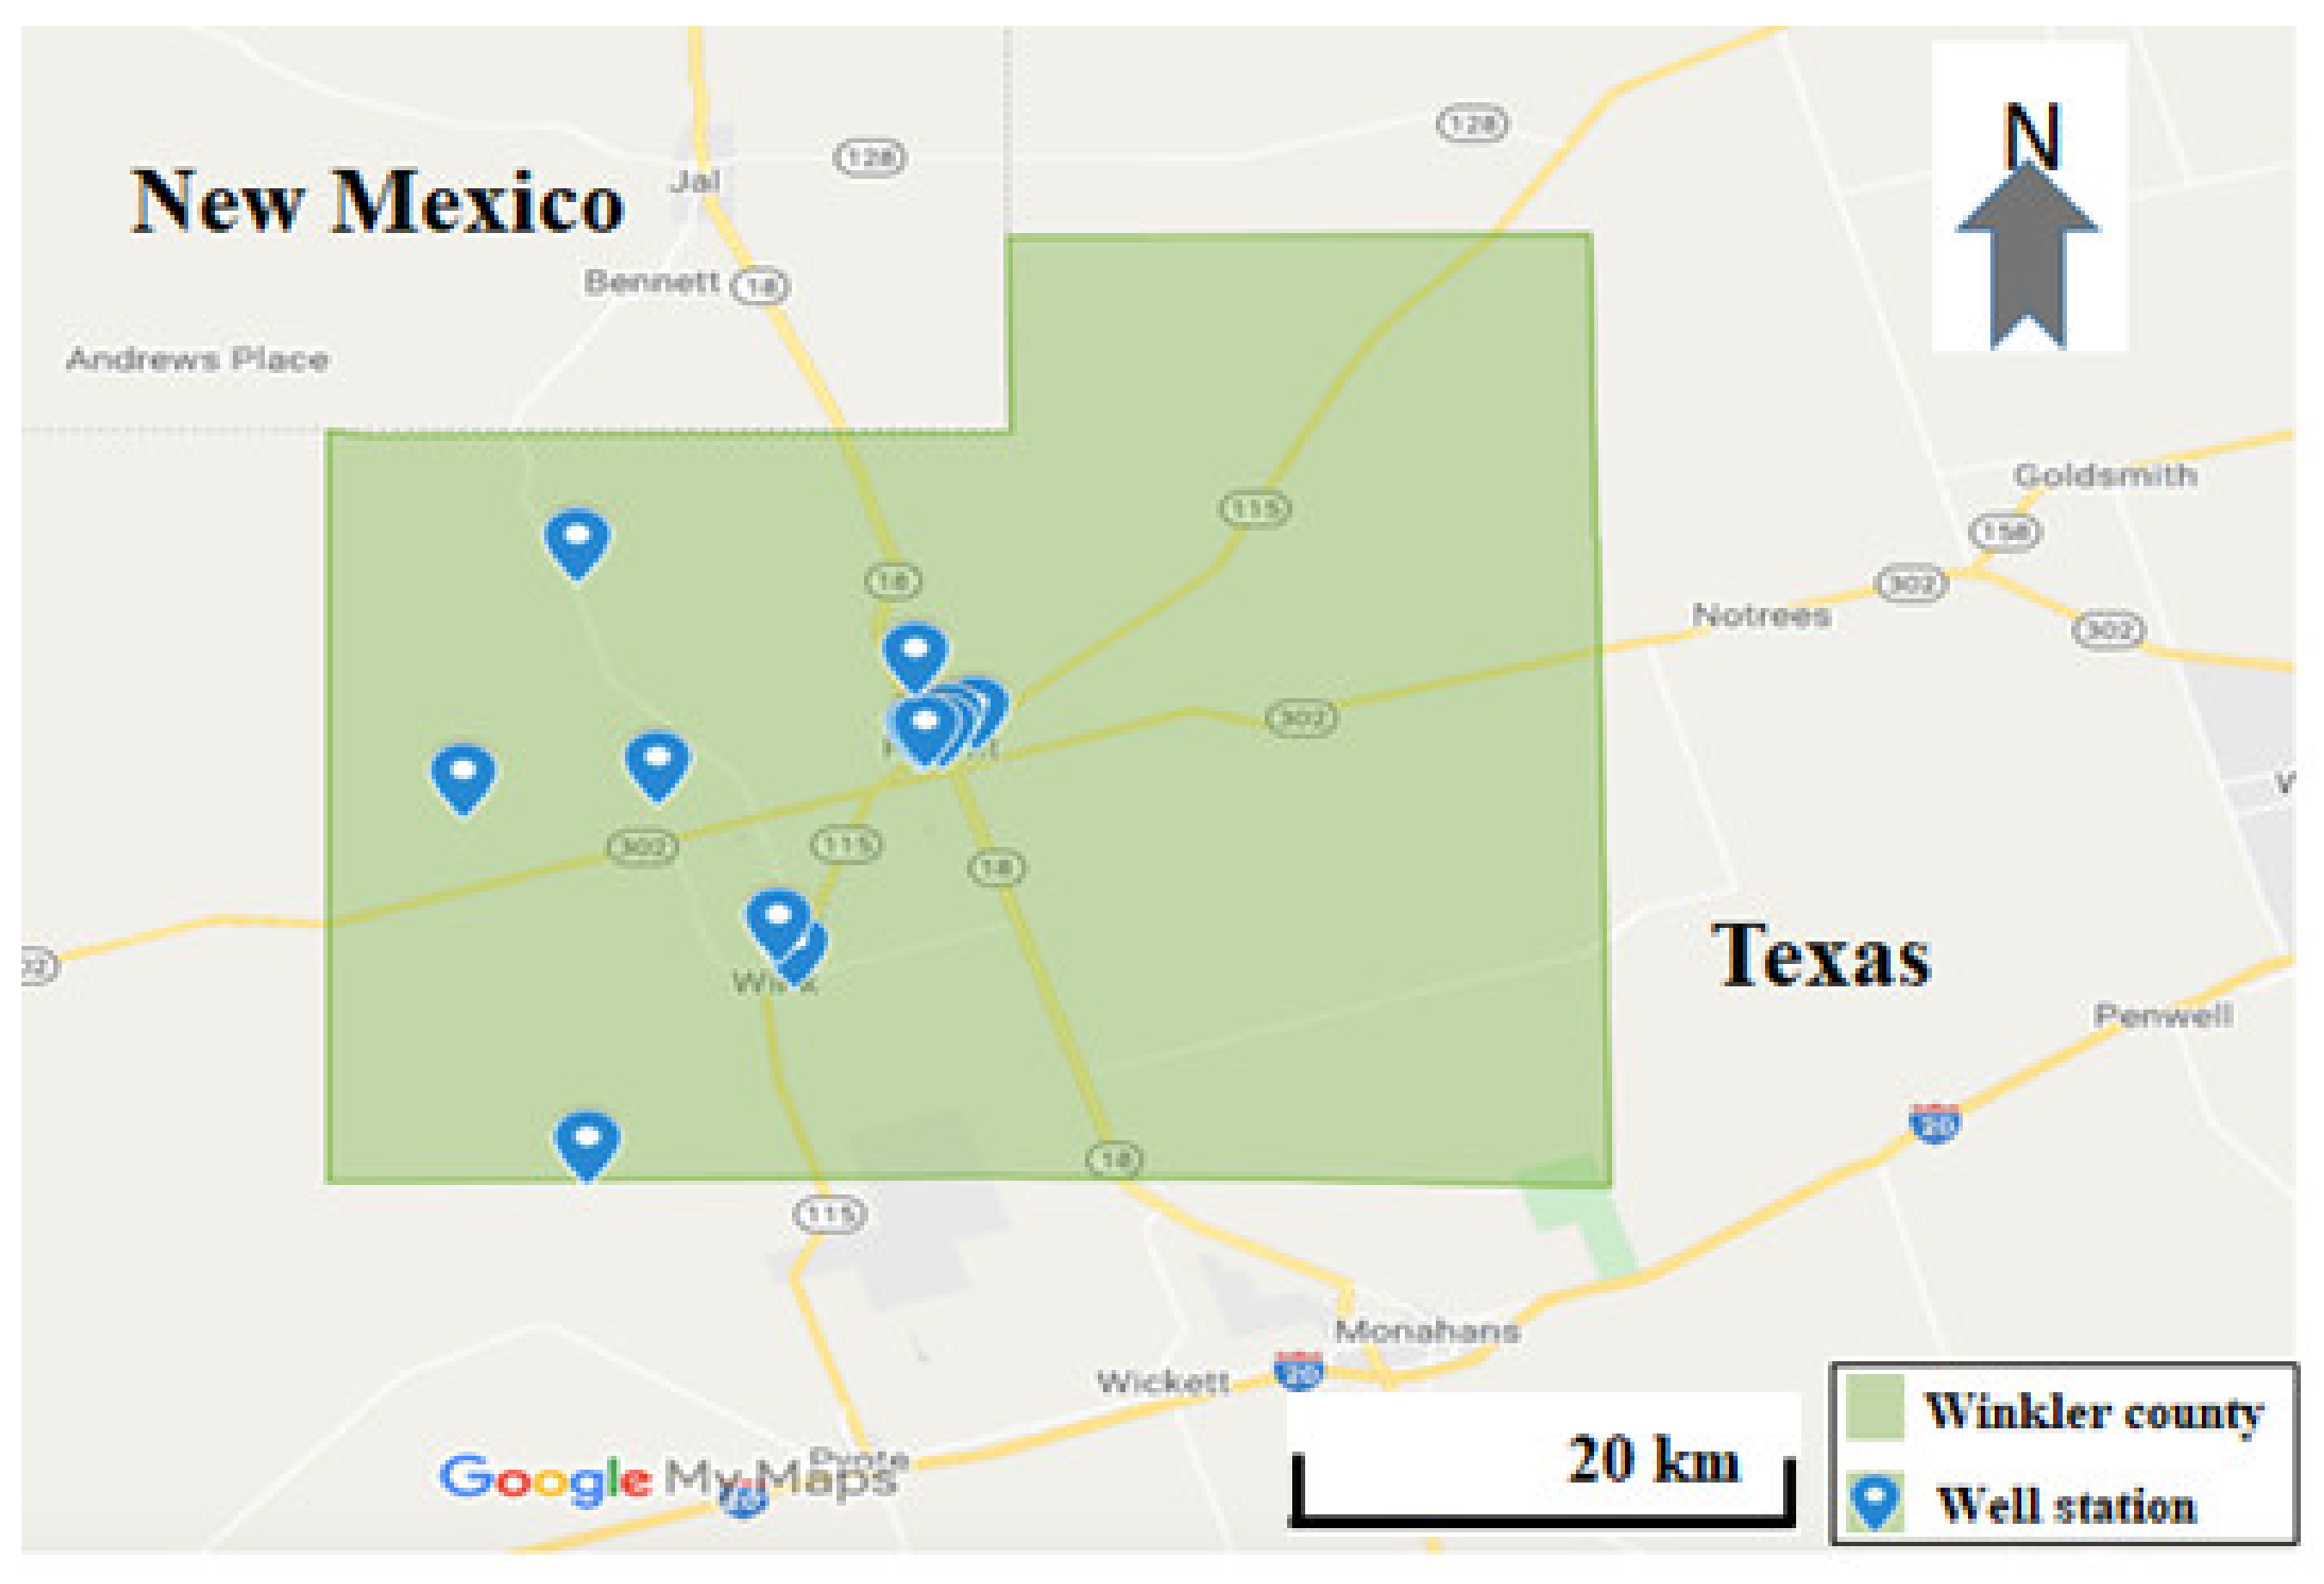
Area of study, Winkler County with well locations (images from Google Map).

Figure 2.
Copper levels in Pecos Valley and Dockum aquifer.

Figure 3.
Lead levels in Pecos Valley and Dockum aquifers.
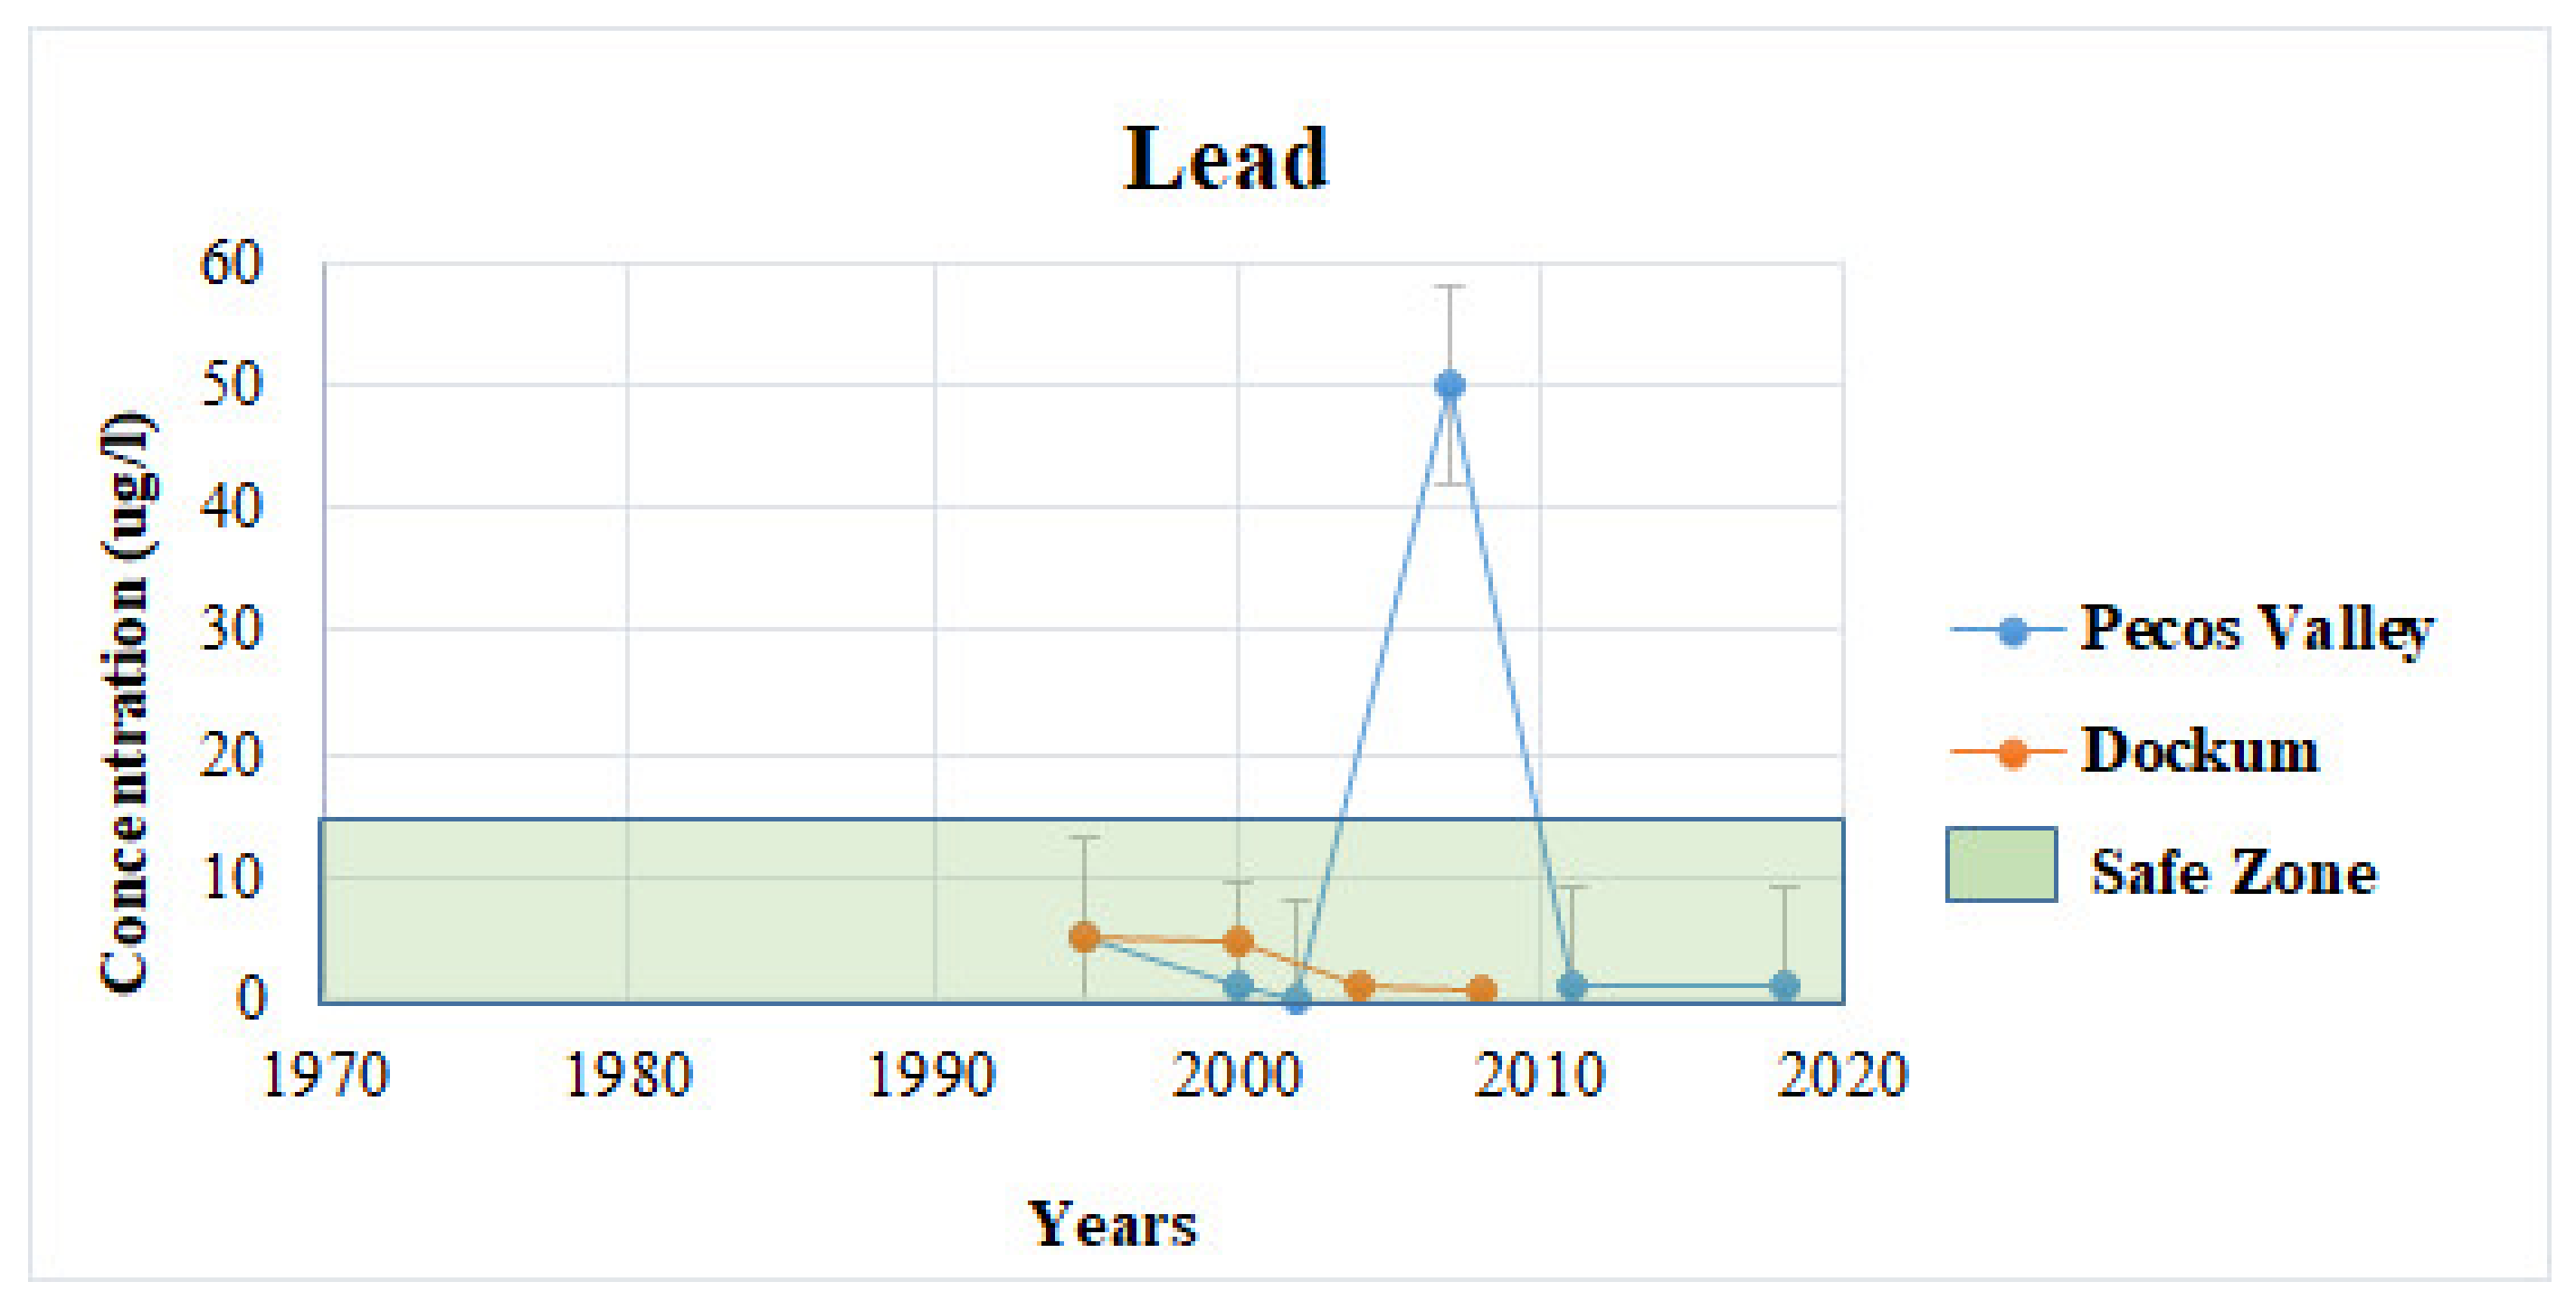
Figure 4.
Arsenic levels in Pecos Valley and Dockum aquifers.

Figure 5.
Nitrate levels in Pecos Valley and Dockum aquifers.

Figure 6.
Crop circles in Winkler County, Texas (images from Google Earth).

Figure 7.
Chromium levels in Pecos Valley and Dockum aquifers.
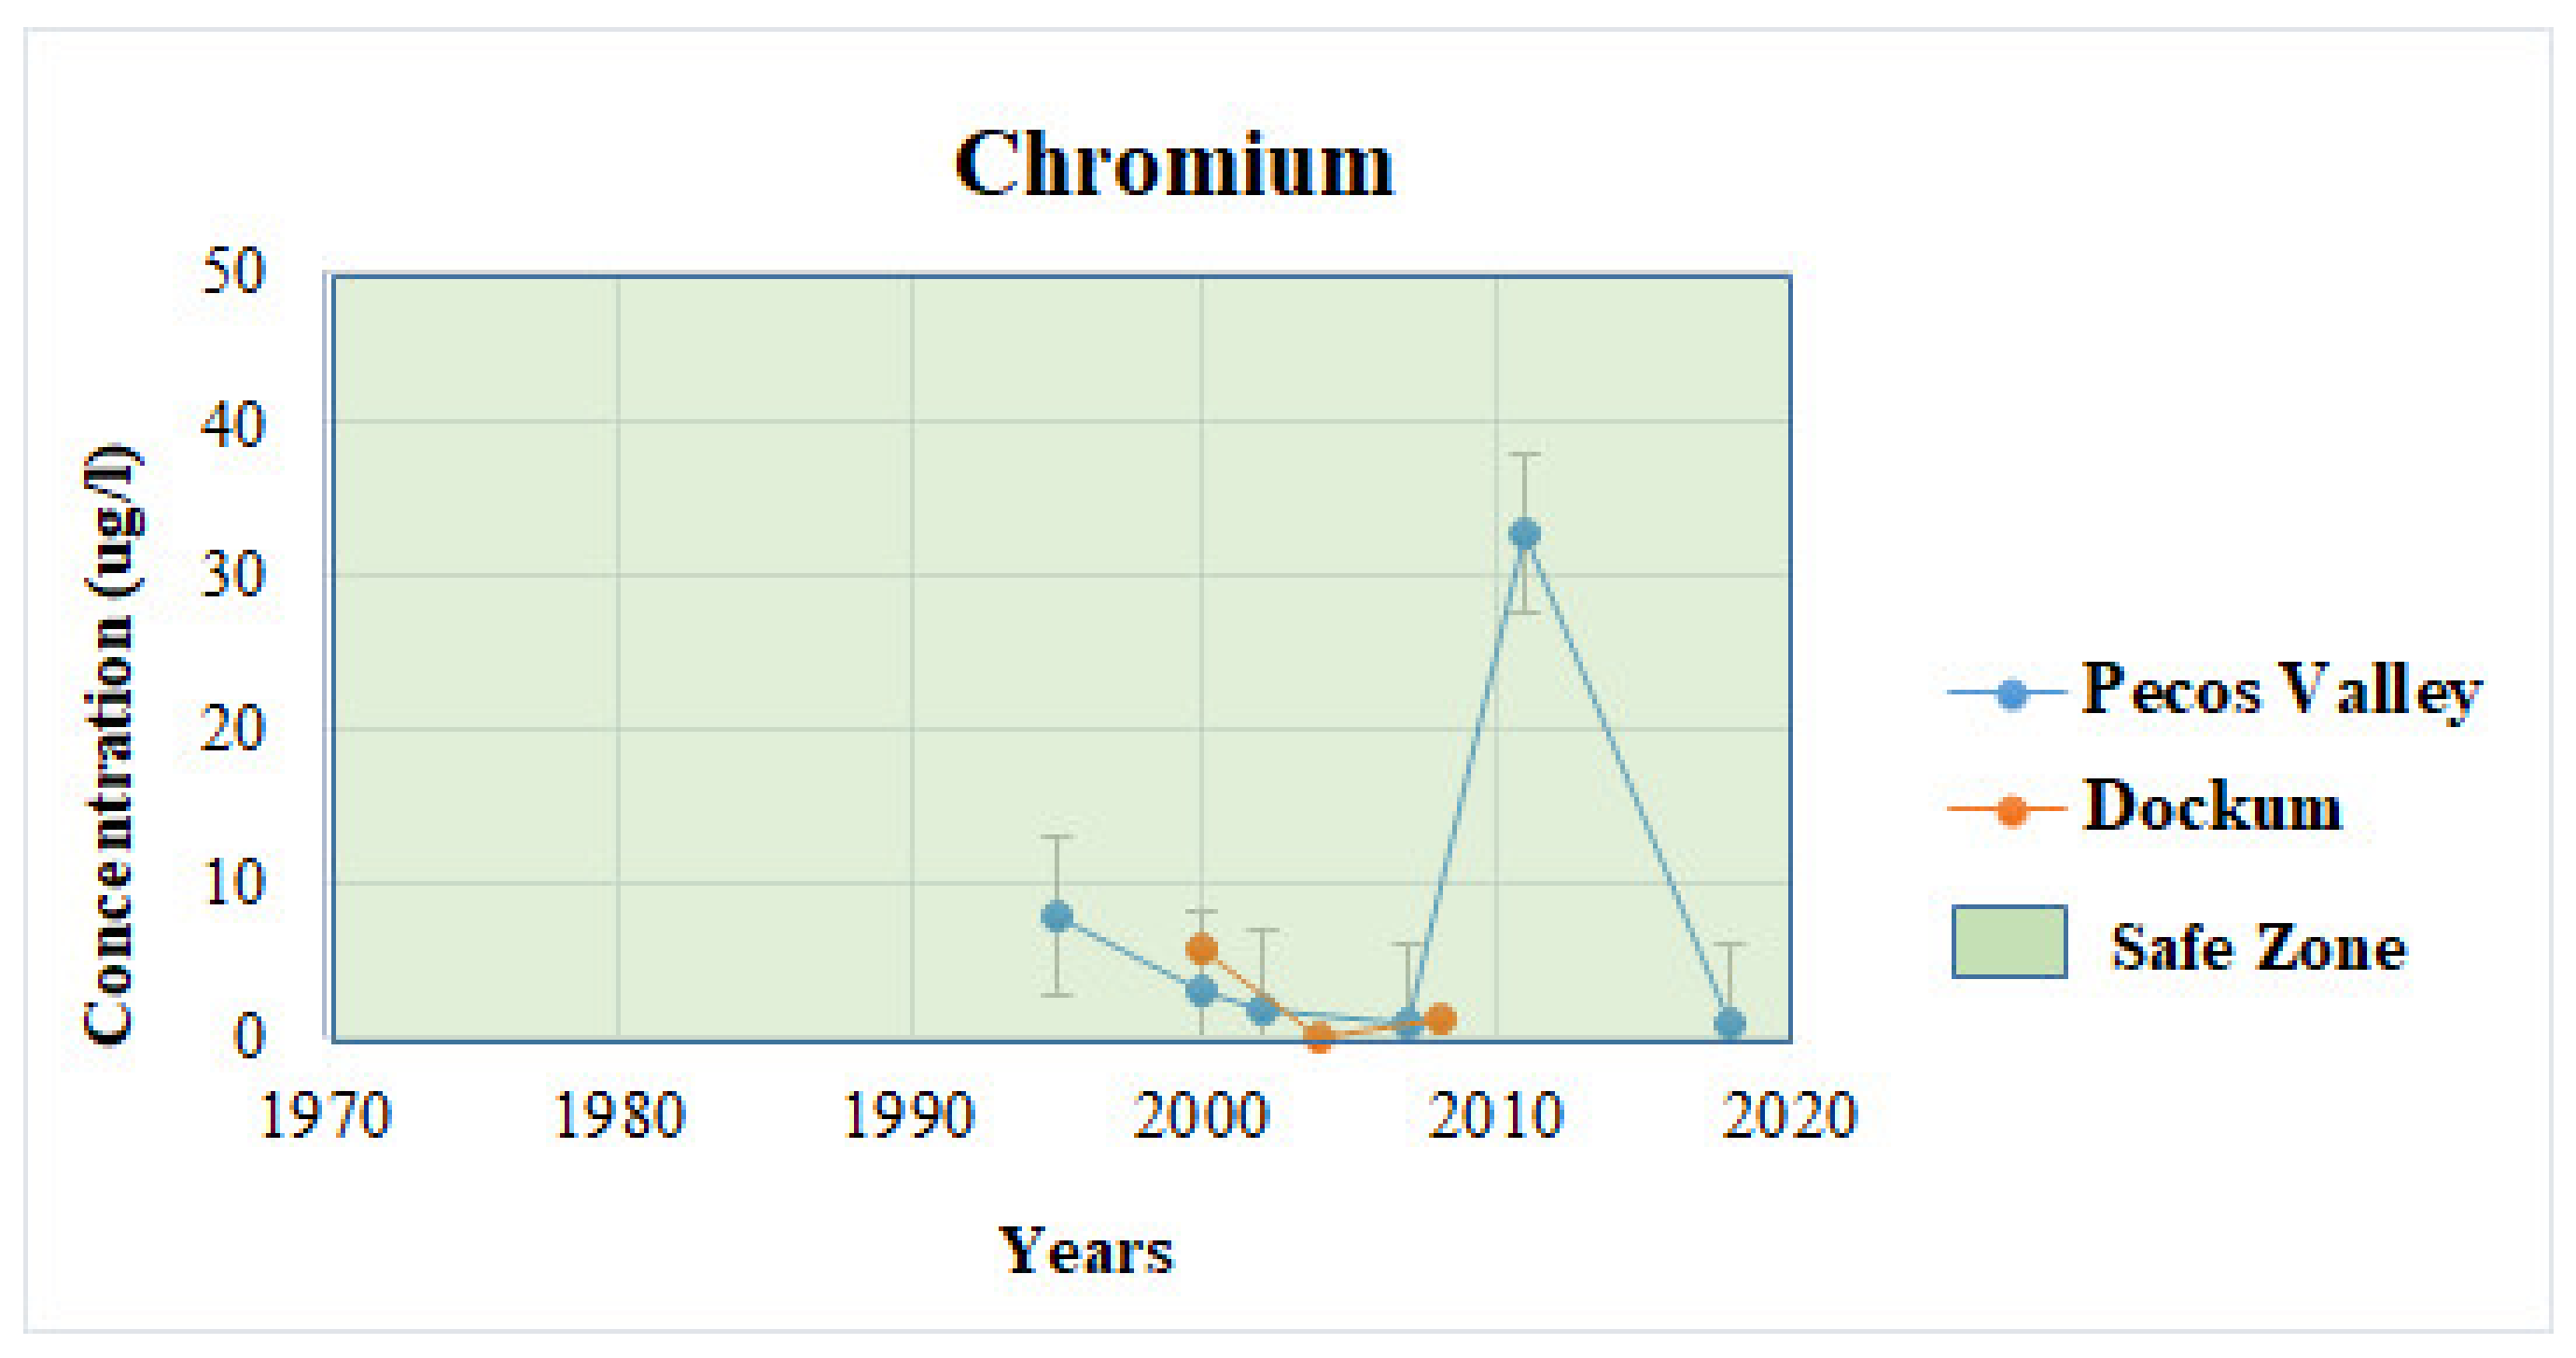
Figure 8.
Chloride levels in Pecos Valley and Dockum aquifers.

Figure 9.
Two sinkholes in Winkler County, Texas (images from Google Earth).
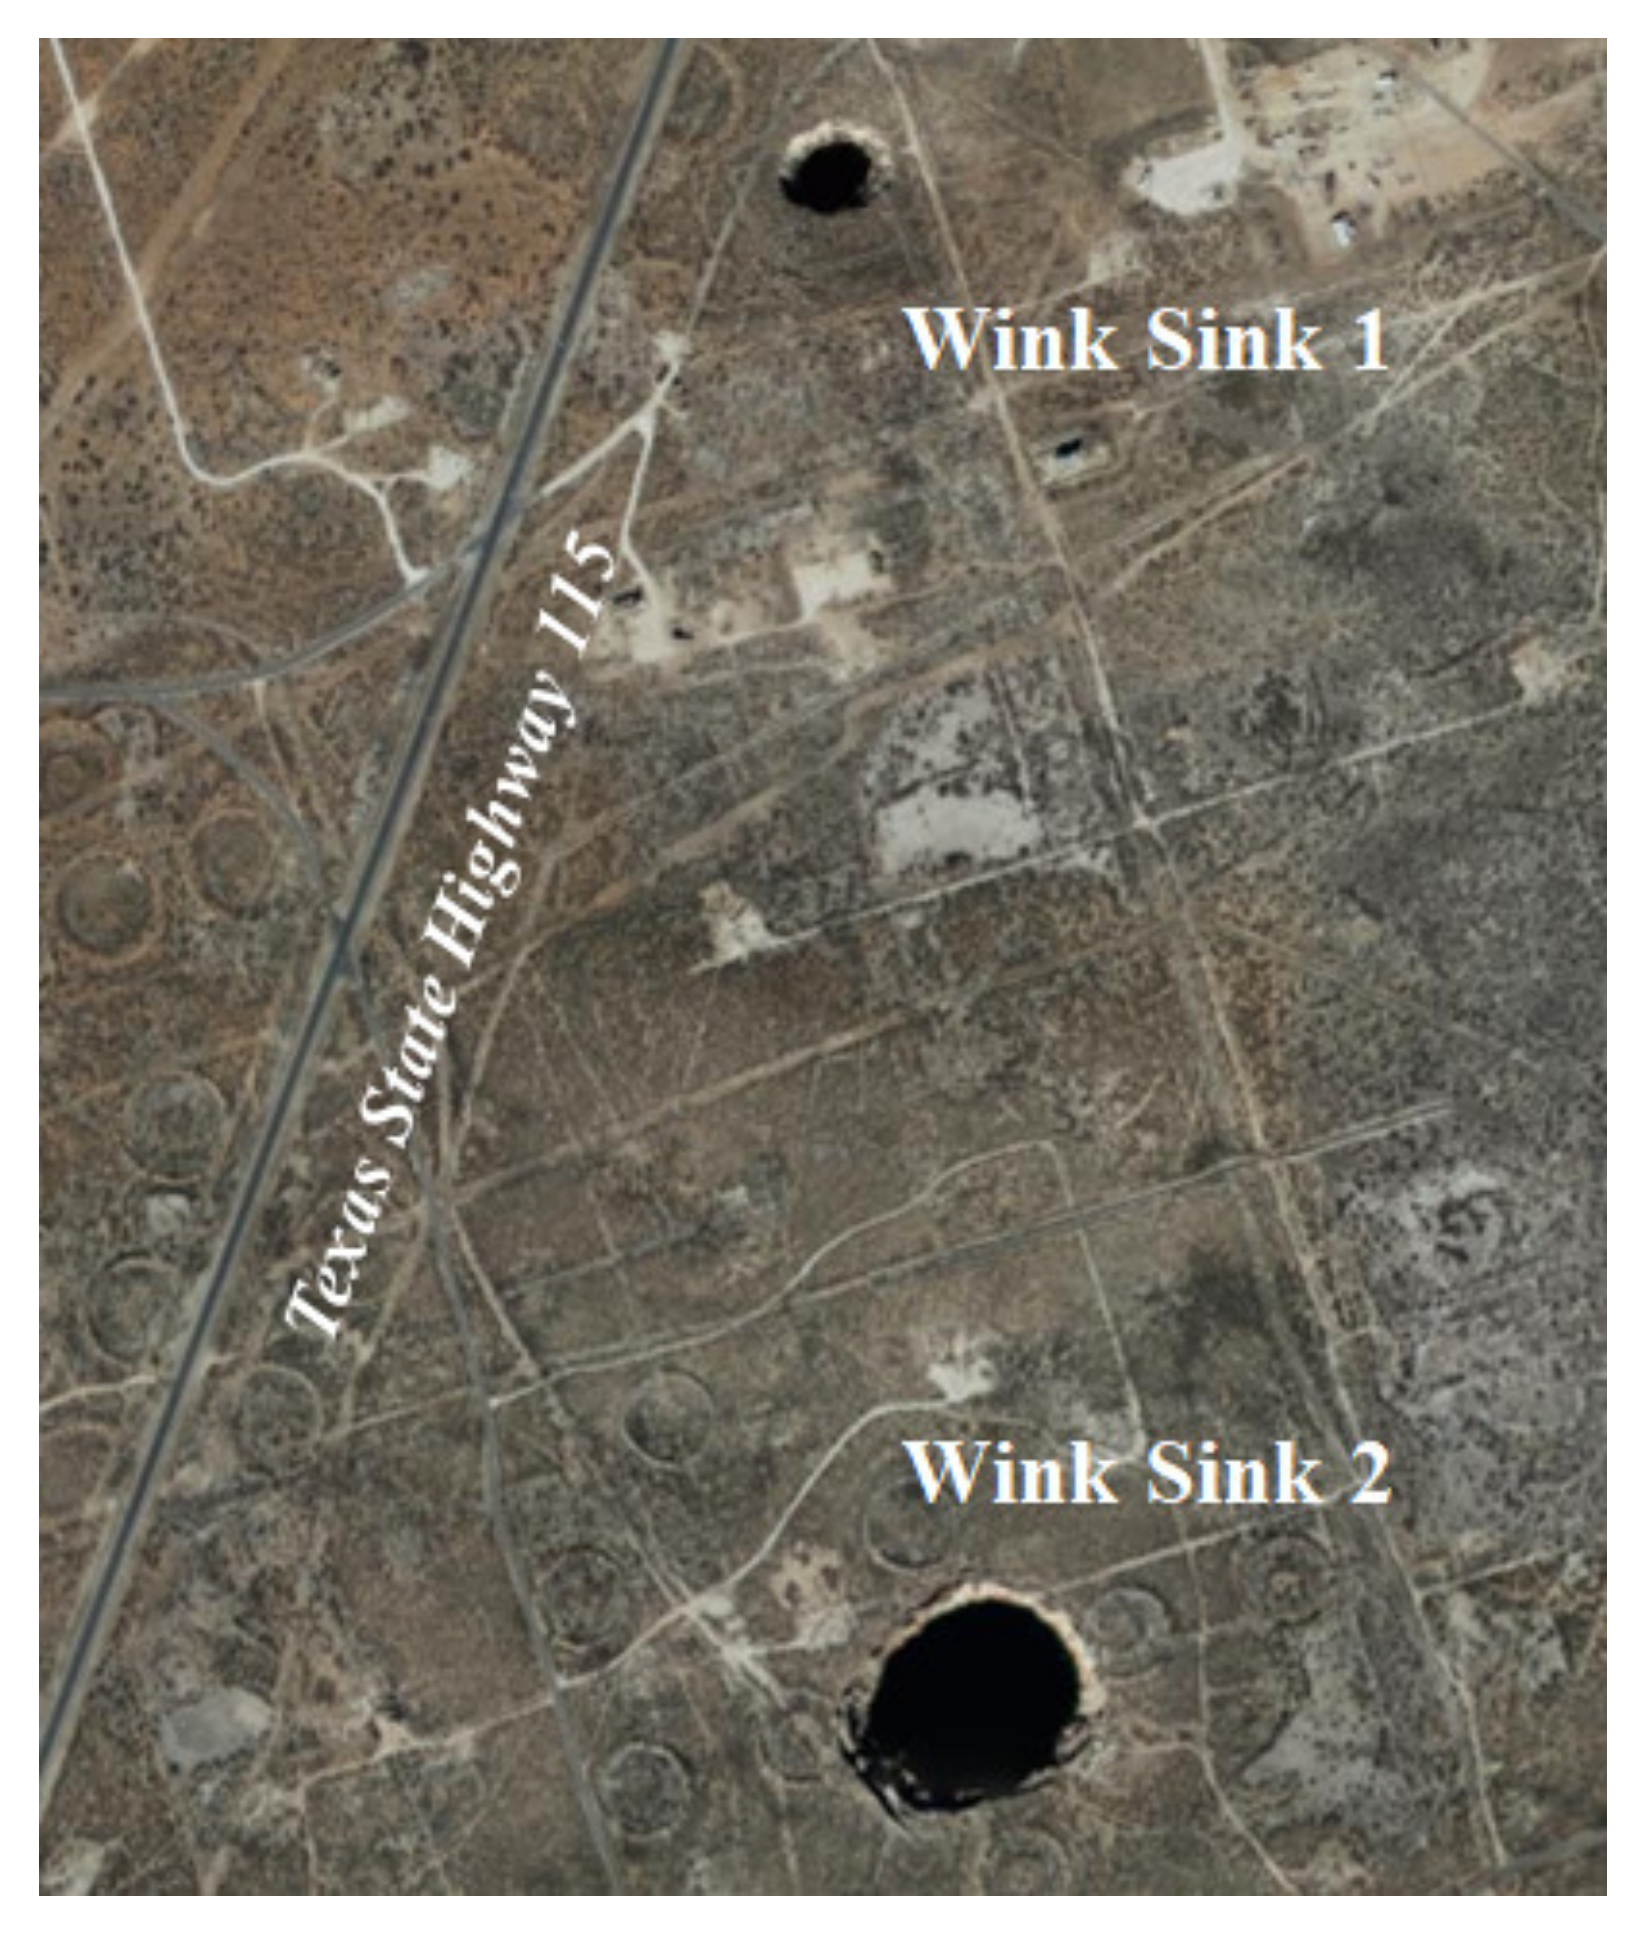
Figure 10.
The minimum, maximum and average of each parameter in the Pecos Valley aquifer (unit: ppm).
Figure 10.
The minimum, maximum and average of each parameter in the Pecos Valley aquifer (unit: ppm).

Figure 11.
The minimum, maximum and average of each parameter in the Dockum aquifer (unit: ppm).


Table 1.
Pollutant levels from 1987 to 2018 in Pecos Valley (ppb: parts per billion, ppm: parts per million, and N/A: not available).
Table 1.
Pollutant levels from 1987 to 2018 in Pecos Valley (ppb: parts per billion, ppm: parts per million, and N/A: not available).
| Year | Copper (ppb) | Lead (ppb) | Arsenic (ppb) | Nitrate (ppm) | Chromium (ppb) | Chloride (ppm) | TDS (ppm) |
|---|---|---|---|---|---|---|---|
| 1987 | N/A | N/A | N/A | 1.83 | N/A | 22.00 | 302.00 |
| 1995 | 6.00 | 5.00 | 2.00 | 1.84 | 8.00 | 21.00 | 4.00 |
| 2000 | 3.04 | 1.28 | 2.53 | 4.56 | 3.23 | 28.40 | 317.00 |
| 2002 | 2.58 | 0.00 | 2.00 | 2.71 | 1.99 | 29.90 | 316.00 |
| 2007 | 1.00 | 50.00 | 1.00 | 3.80 | 1.00 | 30.00 | 326.00 |
| 2011 | 1.00 | 1.00 | 2.00 | 1.82 | 32.90 | 32.90 | 329.00 |
| 2018 | 1.00 | 1.00 | 1.00 | 1.40 | 1.00 | 36.80 | 353.76 |
Table 2.
Pollutant levels from 1972 to 2018 in Dockum (ppb: parts per billion, ppm: parts per million, and N/A: not available).
Table 2.
Pollutant levels from 1972 to 2018 in Dockum (ppb: parts per billion, ppm: parts per million, and N/A: not available).
| Year | Copper (ppb) | Lead (ppb) | Arsenic (ppb) | Nitrate (ppm) | Chromium (ppb) | Chloride (ppm) | TDS (ppm) |
|---|---|---|---|---|---|---|---|
| 1972 | N/A | N/A | N/A | 5.00 | N/A | 15.00 | 224.00 |
| 1985 | N/A | N/A | N/A | 5.49 | N/A | 104.00 | 513.00 |
| 1987 | N/A | N/A | N/A | 5.05 | N/A | 18.00 | 251.00 |
| 1995 | 6.00 | 5.00 | N/A | 8.30 | N/A | 37.00 | 320.00 |
| 2000 | 5.70 | 4.80 | 6.90 | 30.10 | 5.80 | 139.00 | 812.00 |
| 2004 | 1.96 | 1.00 | 2.00 | 5.84 | 0.00 | 162.00 | 656.00 |
| 2008 | 1.23 | 0.84 | N/A | 5.89 | 1.17 | 118.00 | 625.00 |
Table 3.
Aquifer properties in the study area (STD: Standard Deviation).
| Aquifer Name | Aquifer Type | Description | Thickness (ft) | Average pH (STD) |
|---|---|---|---|---|
| Pecos Valley | Unconfined, Alluvial | Aeolian and eolian sediments consisting with beds of clay, silt, sand, gravel, and caliche | 0~1500 (top~bottom) | 7.60 (0.41) |
| Dockum | Confined and Unconfined, Sandston | Fine grained sandstone. | 160~1300 (top~bottom) | 7.59 (0.60) |
Table 4.
The statistical analysis of each parameter in the Pecos Valley aquifer (STD: Standard Deviation, CV: Coefficient of Variation, unit: ppm).
Table 4.
The statistical analysis of each parameter in the Pecos Valley aquifer (STD: Standard Deviation, CV: Coefficient of Variation, unit: ppm).
| Minimum | Maximum | Average | STD | CV | |
|---|---|---|---|---|---|
| Copper | 0.001 | 0.006 | 0.001 | 0.002 | 1.371 |
| Lead | 1.000 | 50.000 | 9.713 | 19.812 | 2.040 |
| Arsenic | 1.000 | 2.530 | 1.755 | 0.620 | 0.353 |
| Nitrate | 1.395 | 4.560 | 2.565 | 1.191 | 0.464 |
| Chromium | 1.000 | 32.900 | 48.120 | 12.465 | 0.259 |
| Chloride | 21.000 | 36.800 | 28.714 | 5.637 | 0.196 |
Table 5.
The statistical analysis of each parameter in the Dockum aquifer (STD: Standard Deviation, CV: Coefficient of Variation, unit: ppm).
Table 5.
The statistical analysis of each parameter in the Dockum aquifer (STD: Standard Deviation, CV: Coefficient of Variation, unit: ppm).
| Minimum | Maximum | Average | STD | CV | |
|---|---|---|---|---|---|
| Copper | 1.230 | 6.000 | 14.890 | 0.002 | 0.000 |
| Lead | 0.084 | 5.000 | 2.911 | 2.299 | 0.790 |
| Arsenic | 2.000 | 6.900 | 4.450 | 3.465 | 0.779 |
| Nitrate | 5.000 | 30.100 | 9.380 | 9.204 | 0.981 |
| Chromium | 1.170 | 5.800 | 3.485 | 3.067 | 0.880 |
| Chloride | 15.000 | 162.000 | 84.714 | 60.536 | 0.715 |
Publisher’s Note: MDPI stays neutral with regard to jurisdictional claims in published maps and institutional affiliations. |
© 2021 by the authors. Licensee MDPI, Basel, Switzerland. This article is an open access article distributed under the terms and conditions of the Creative Commons Attribution (CC BY) license (https://creativecommons.org/licenses/by/4.0/).
Share and Cite
MDPI and ACS Style
Lozano, J.; Heo, J.; Seo, M. Historical Assessments of Inorganic Pollutants in the Sinkhole Region of Winkler County, Texas, USA. Sustainability 2021, 13, 7513. https://doi.org/10.3390/su13137513
AMA Style
Lozano J, Heo J, Seo M. Historical Assessments of Inorganic Pollutants in the Sinkhole Region of Winkler County, Texas, USA. Sustainability. 2021; 13(13):7513. https://doi.org/10.3390/su13137513
Chicago/Turabian StyleLozano, Joshua, Joonghyeok Heo, and Mijin Seo. 2021. "Historical Assessments of Inorganic Pollutants in the Sinkhole Region of Winkler County, Texas, USA" Sustainability 13, no. 13: 7513. https://doi.org/10.3390/su13137513
Note that from the first issue of 2016, this journal uses article numbers instead of page numbers. See further details here.