Article

Is Agent-Based Simulation a Valid Tool for Studying the Impact of Nature-Based Solutions on Local Economy? A Case Study of Four European Cities

by
Rembrandt Koppelaar
1,
Antonino Marvuglia
2,*,
Lisanne Havinga
3,
Jelena Brajković
4 and
Benedetto Rugani
2
1
EcoWise Ekodenge Ltd., London SE1 8ND, UK
2
Luxembourg Institute of Science and Technology (LIST), 41, rue du Brill, L-4422 Belvaux, Luxembourg
3
Architectural History and Theory Unit, Built Environment Group, Eindhoven University of Technology, Postbus 513, 5600 MB Eindhoven, The Netherlands
4
Faculty of Architecture, University of Belgrade, Kralja Aleksandra Blvd. 73/II, 11120 Belgrade, Serbia
*
Author to whom correspondence should be addressed.
Sustainability 2021, 13(13), 7466; https://doi.org/10.3390/su13137466
Submission received: 22 May 2021 / Revised: 24 June 2021 / Accepted: 29 June 2021 / Published: 4 July 2021

Abstract

:
Implementing nature-based solutions (NBSs) in cities, such as urban forests, can have multiple effects on the quality of life of inhabitants, acting on the mitigation of climate change, and in some cases also enhancing citizens’ social life and the transformation of customer patterns in commercial activities. Assessing this latter effect is the aim of this paper. An agent-based model (ABM) was used to assess change in commercial activities by small and midsize companies in retail due to the development of parks. The paper focuses on the potential capacity of NBS green spaces to boost retail companies’ business volumes, thus increasing their revenues, and at the same time create a pleasant feeling of space usability for the population. The type of NBS is not specified but generalized into large green spaces. The simulation contains two types of agents: (1) residents and (2) shop owners. Factors that attract new retail shops to be established in an area are simplified, based on attractor points, which identify areas such as large green spaces within and around which shops can form. The simulations provided insights on the number of retail shops that can be sustained based on the purchasing behavior of citizens that walk in parks. Four European cities were explored: Szeged (Hungary), Alcalá de Henares (Spain), Çankaya Municipality (Turkey) and Milan (Italy). The model allowed analyzing the indirect economic benefit of NBSs (i.e., large green spaces in this case) on a neighborhood’s economic structure. More precisely, the presence of green parks in the model boosted the visits of customers to local small shops located within and around them, such as cafés and kiosks, allowing for the emergence of 5–6 retail shops (on average, for about 800 walking citizens) in the case of Szeged and an average 12–14 retail shops for a simulated population of 2900 persons that walk in parks in the case of Milan. Overall, results from this modeling exercise can be considered representative for large urban green areas usually visited by a substantial number of citizens. However, their pertinence to support for local policies for NBS implementation and other decision-making related activities of socioeconomic nature is hampered by the low representativeness of source data used for the simulations.

1. Introduction

A recent analysis by the United Nations [1] highlighted that the current share of the world population living in cities and urban areas (around 55%) is expected to increase steadily to 68% by 2050. At the same time, in Europe, the number of people living in urban areas will considerably grow from approximately 73% today to over 80% by 2050. New techniques and approaches are thus required to design sustainable cities for future dense populations in narrower areas [2]. Population growth has pushed cities to adopt new revitalization schemes, forcing market dynamics to reshape the landscape of retail businesses, with retailers attempting to adopt innovative strategies in order to keep up with the new patterns arising in a changing society [3]. In this framework, the concept of biophilia has emerged. This concept is based on the acknowledgement that connection with nature (not only on a physical level, but also mentally and at a social level) is an innate biological need of humans, and that this connection affects our personal wellbeing, productivity and societal relationships. In this sense, several studies show the stress relief properties derived from the ability to directly access nature and the many positive influences of the natural environment on various human psychological states [4,5]. In addition, the connection of natural stimuli coming from nature with significant and positive effects on emotional responses in retail-store settings has also been demonstrated [6].
Urban green and blue spaces, such as urban parks, forests, gardens, water streams, green roofs and green facades, not only result in multiple co-benefits for health, the economy, society and the environment but also provide habitats for several species [7]. These are all nature-based solutions (NBSs), which are defined by the European Commission (EC) as “solutions inspired and supported by nature, which are cost-effective, simultaneously provide environmental, social and economic benefits and help build resilience. Such solutions bring more and more diverse natural features and processes into cities, landscapes and seascapes, through locally adapted, resource-efficient and systemic interventions” (https://ec.europa.eu/info/research-and-innovation/research-area/environment/nature-based-solutions_en (accessed on 15 June 2021)) The EC has developed a framework to assist member states in mapping and assessing the “urban ecosystem”, which consists of both built and green infrastructure and delivers a wide range of social, economic and ecological services [8].
The concept of NBSs has been extensively studied, with a broad range of literature reviews synthesizing existing knowledge on NBSs in relation to urban contexts being published in recent years [9,10]. According to a recent literature review on stakeholders’ engagement in NBSs [11], most studies have focused on the social and environmental benefits of NBSs. The social benefits most often investigated are related to access or proximity to nature, physical and mental wellbeing and exercise. The most studied environmental aspects are related to air quality, climate regulation, biodiversity and wildlife. Studies focusing on economic benefits remain lacking, though some exist that include wood provision [12,13], increase in property value [14,15,16] and food provision [17,18,19]. This identified bias toward social and environmental benefits is also highlighted by Parker and co-authors [20]. In addition, a recent literature review on key enablers and barriers to the uptake and implementation of NBSs in urban settings [21] identified five publications [22,23,24,25,26] that included economic opportunities and jobs as part of the objectives evaluated in mostly integrated evaluations of case study applications.
More specifically, in Chen et al. [22], the socioeconomic benefits of farm ponds in Southern China are roughly estimated. These benefits stem from the hydrological regulation and flood alleviation services that ponds provide, contributing to social stability, and the improved nutrient cycling beneficial for agricultural production and the farm economy. Especially in the case of the city of Wuhan, the authors reported a generated profit from fish production between USD 1.96 and 2.55 per square meter and an estimated benefit for the entire city, coming from the industry of pond aquaculture, of approximately USD 145 million. In Liquete et al. [23], a multi-criteria analysis (MCA) is used to assess the environmental, social and economic benefits provided by the Gorla Maggiore water park in Northern Italy. Although an estimation of the costs associated with the alternatives assessed in the MCA is provided, conclusions from this study do not prove that economic benefits actually arise from the transition from an alternative grey infrastructure and from the previous situation (a poplar plantation) to the proposed green infrastructure. Relying on figures reported in Terrapin [27], Santiago Fink [24] provides instead some estimates of the potential economic benefits arising from access (even just visual) to green spaces and simply daylight. The benefits, which are only based on expert-based judgements, range from reduced stress and increased productivity of employees in businesses and offices to faster recovery after surgery in hospitals, improved test scores of students in schools and consequent reduction in school dropout rates, reduction in healthcare insurance premium expenses due to better physiological and mental state induction and finally reduction in criminal acts (violence and aggression). While the flood and coastal erosion risk management (FCRM) Partnership Calculator (https://www.gov.uk/guidance/partnership-funding (accessed on 15 June 2021)) developed by Short et al. [25] is used to estimate the economic benefits of protecting some river catchment properties in the United Kingdom from single rainfall events using natural flood management interventions, the approach used takes an economic-based perspective typical of the insurance sector. Finally, van der Jagt and co-authors [26] make the point that gardeners of large plots need to organize themselves in a company, meet food handling regulation and pay tax. This helps to create proper green jobs and revenue. However, no quantification of this job creation potential is given, even for the few European cities that are reported as examples of communal urban gardening (CUG) in the paper.
Despite this diversity of successful achievements and findings, none of these examples presents a computational tool to simulate and quantify the economic advantages associated with the future implementation of NBS scenarios. In other words, to the best of the authors’ knowledge, the recent and growing NBS literature still does not offer examples of computational tools that allow simulating NBS implementation models with the possibility of tweaking parameters of interest. A gap regarding such aspects therefore exists in NBS research, which this paper has the ambition to, at least partially, address. Accordingly, the paper aims at creating quantitative simulations of the effects of developing large NBSs in cities, such as parks, on the change in commercial activities based on small and midsize companies in retail. The research hypothesis is that an NBS (or collection of NBSs), such as an urban park, can attract people in areas previously not frequented by outsiders. Such an increase (and the possible diversification) of daytime and sometimes nighttime human activities can potentially favor the growth of pre-existent commercial activities and attract new hospitality and retail activities in a certain urban area. An agent-based modeling approach, as illustrated in the section, is used to accomplish the objective of this study. The developed agent-based model (ABM) furthers NBS assessments from two perspectives: firstly, to explore the dynamics between NBSs and socioeconomic development as a deductive process. Beyond developing an understanding of what factors are relevant or not in this context, it also informs regarding what data to collect to establish inductive evidence on the relationship between the existence of NBSs in an area and socioeconomic indicators, using statistical analyses to validate relationships. Secondly, the model is used as a quantitative tool for urban planners to assess socioeconomic benefits once the relationships in the model have been validated by inference of relationships using real-world observations. This paper concerns the first exploratory aspect.

2. State of the Art

The economic attributes of NBSs have mostly been studied in relation to the economic effects of climate change mitigation and adaptation, e.g., in the recent report by the United Nations Environment Programme [28]. However, the potential economic co-benefits of NBSs can also go beyond these core objectives of NBSs, thereby providing even more economic reasons to implement them. Providing insight to practitioners and decision makers about these additional economic benefits is critical. As stressed in Babí Almenar et al. [10], in order to facilitate the operationalization of the NBS concept, the added value of NBSs and the potential co-benefits that they provide need to be easily understood by practitioners and decision makers. Those authors argue that practitioners and decision makers need more studies exploring the relationship between specific urban NBS and specific benefits.
Several studies [29,30,31,32,33,34,35,36] have underlined financial constraints and a lack of funding as part of the challenges identified by citizens and stakeholders in the implementation of NBSs. Additional studies [37,38,39] indicate that a lack of financial incentives and strong business models is an important barrier to the implementation of NBSs. As such, current literature reviews highlight that there is a lack of studies focusing on the economic benefits of NBSs [40,41]. Therefore, this paper contributes to the discourse on quantitatively evaluating and modeling the potential of NBSs from an economic perspective that goes beyond the economic benefits directly related to climate change mitigation or adaptation.
One of the benefits of NBSs, in particular urban green parks, is that new retail and hospitality companies/firms tend to move into such areas. With the foreseen increase in the number of people in urban areas, one of the possible boundary conditions for the willingness of companies to establish a presence in these areas is change in popularity. The rates of vacant spaces [42] and firm population can also be considered boundary conditions. There are several such factors mentioned in the literature. For instance, companies can move into an area in different ways: new companies may enter the market, or an existing chain may wish to open a new facility or relocate. Studies show that old firms prefer to stay at their home region or fixed locations [43], while new entrepreneurs often treat their hometown as a natural start-up location [44]. Van Dijk and Pellenbarg [45] used data from the Netherlands and showed that firm internal factors such as the economic sector, firm size and previous migration behavior are good predictors that can explain a firm’s decision to relocate. Similar results can be found in other studies [43,46]. The relationship between a firm and other organizations in its environment has been shown to significantly enhance the explanatory power of firms’ relocation models, and this effect varies depending on the strength and geographical distance of their relationships [47]. Bodenmann and Axhausen [48] showed that local taxes have a very positive effect on firm relocation; they also found that distance is an important indicator, and significant differences exist between sectors. Location selection models for firms in urban areas and details of the simulations can be found in De Bok and Bliemer [49] and Waddell et al. [42].
The design of ecological spaces and environments has a potential effect on visiting and shopping intentions [50]. This is in line with the increase in the likelihood of making a retail drink or food purchase for a person during a visit or recreational activity in large green spaces (either enroute in travel or at the NBS site). The effects of the ecological design of hotels on behavioral intentions and the resulting competitive advantage in terms of intention to revisit and willingness to pay more are discussed in Lee et al. [51]. Service and commercial environments offering natural settings have been studied and analyzed in terms of comfort, customer behavior and psychological responses in Purani and Kumar [52]. Some studies investigated nature-based applications as a variable of attraction [50], while other studies suggest that natural settings in retail areas support attention and bring cognitive benefits [53,54].
Biophilic design offers many possibilities through its attributes and elements [55], beyond the benefits of access to nature, for enhancing social life or commercial activities in urban environments. Within its element of place-based relationships [55], biophilic design recognizes attributes such as geographical, historic, ecological and cultural connection to a place, as well as integration of culture and ecology, avoiding placelessness, as well as creating a spirit of place. By recognizing these attributes, biophilic design emphasizes the importance of the issue of identity of place and unique site-specific values within urban locations. Integrating the abovementioned attributes in the planning of urban sites and NBS spaces can enrich the overall quality of space and create specific site values that offer unique, memorable and positive experiences to people. In terms of branding and marketing, a properly curated identity and spirit of a place (in line with biophilic guidelines) presents a unique site value which can be marketed and exploited, resulting in enhanced social and commercial activities and therefore boosting the place’s attractiveness.
To examine the relationship between NBSs and socioeconomic development, this paper deploys a simulation approach. In particular, an ABM is used to assess change in commercial activities by small and midsize companies in retail due to the development of large NBSs, such as parks. This concept is based on the notion that an NBS (or collection of NBSs), such as an urban park, can attract people to areas previously not frequented by outsiders. The increase (and possible diversification) in daytime and sometimes nighttime activities potentially favors the growth of pre-existing commercial activities and attracts new hospitality and retail activities in an area.
The choice of simulation to study this relationship in a dynamic manner, as opposed, for example, to a static statistical evaluation of time–series datasets, was made.
An ABM (in its purest form) is made up of “objects”, which from a computer science standpoint are “computational entities that encapsulate some state, are able to perform actions, or methods, on this state, and communicate by message passing” [56]. An ABM allows the representation of individual objects (agents) with their specific characteristics. Agent-based simulations are bottom-up: at the lowest level, agents interact and, as a result, the macro behavior of the system (not from superposition, but from the interaction of micro level behaviors) might emerge at a higher level [57]. This is why, in de Marchi and Page [58], ABMs are defined as consisting of “autonomous, interacting computational objects, called agents, often situated in space and time”, and in Macy and Flache [59], it is stated that an ABM “replaces a single integrated model of the population with a population of models, each corresponding to an autonomous decision maker”.
For this reason, ABMs make it possible to simulate agents belonging to different societal groups, which differ in terms of factors such as age, lifestyle, economic status, preferences and motivation. Moreover, in ABMs, spatial information and its interaction with agents can be readily incorporated based on a geographical information system (GIS) support map. In the context of the application described in this paper, this is meaningful for evaluating heterogeneity between NBS spaces, interactions between NBSs and local retailers and other structures associated with urban NBS networks. As described in Marvuglia et al. [60], an ABM comprises a set of agents which can belong to certain classes and are characterized by the asset of attributes defining their characteristics. These attributes can be static or vary in the course of the simulation as a result of the actions undertaken by the agents. The latter are regulated by a set of decision rules that steer agents’ behavior. Agents operate within a certain environment, which not only is determined by the spatial context but, in a larger sense, also comprises time and exogenous events [60].
The property of emergence discussed above differentiates ABMs from other single-level simulation system models. In Laurenti et al. [61], it is clarified that system models can be either quantitative or qualitative: quantitative models are system dynamics (SD) models, while qualitative models are causal loop diagrams (CLDs). SD models are focused on dynamic behavior over time, have stocks and flows, represent feedback loop structures and require specific parameters, equations and computer simulations to run. A typical CLD, in contrast, consists of a set of symbols describing a dynamic system’s causal structure: variables, causal links (between the variables) with a polarity and symbols that identify feedback loops with their polarity. Causal links have a direction and a polarity; they also sometimes have a delay mark. More details on CLDs and the concepts behind them can be found in Schaffernicht [62].
The SD society defines SD as “a computer-aided approach to policy analysis and design. It applies to dynamic problems arising in complex social, managerial, economic or ecological systems–literally any dynamic systems characterized by interdependence, mutual interaction, information feedback, and circular causality” (http://www.systemdynamics.org/what-is-s/ (accessed on 15 June 2021)).
Gilbert and Troitzsch [63] argued that SD simulations only have a single level: they model the individual, the firm, the organization or society; they cannot model interactions between scales or levels and so do not exhibit emergent behavior. Compared to SD, ABMs allow the modeling of more complex dynamics because system structure can also change during simulation. In SD, a fixed interaction structure is defined and maintained, which means that connections between different actors/elements have to be defined before starting the simulation. Using an ABM, one only defines an interaction space in the form of the types of interactions that agents are allowed to have [64]. Both SD and ABM approaches are capable of representing temporal aspects of dynamic systems, but ABM approaches are more appropriate for modeling spatially explicit complex systems because they can handle spatial heterogeneity in individual attributes and simulate their mobility [65]. ABM is also a better approach for modeling heterogeneity in individual attributes and in the network of interactions among population elements; however, this means that AB modeling requires the collection of more data at the level of individuals, which in turn leads to a slower modeling process, higher computational costs and more difficult calibration in ABM compared to the SD approach.
This paper investigates, via the agent concept, the number of retail shops that can be sustained through NBS green spaces and the potential revenues and profits that can be boosted by these spaces. The simulation utilizes a causal chain layering modeling approach [66] and draws from neoclassical economics theory about profit maximization. The type of NBS is not specified but generalized into large green spaces. In future versions of the model, this could be further subdivided into specific NBSs such as large urban parks, heritage gardens, green cemeteries, woods and so forth.

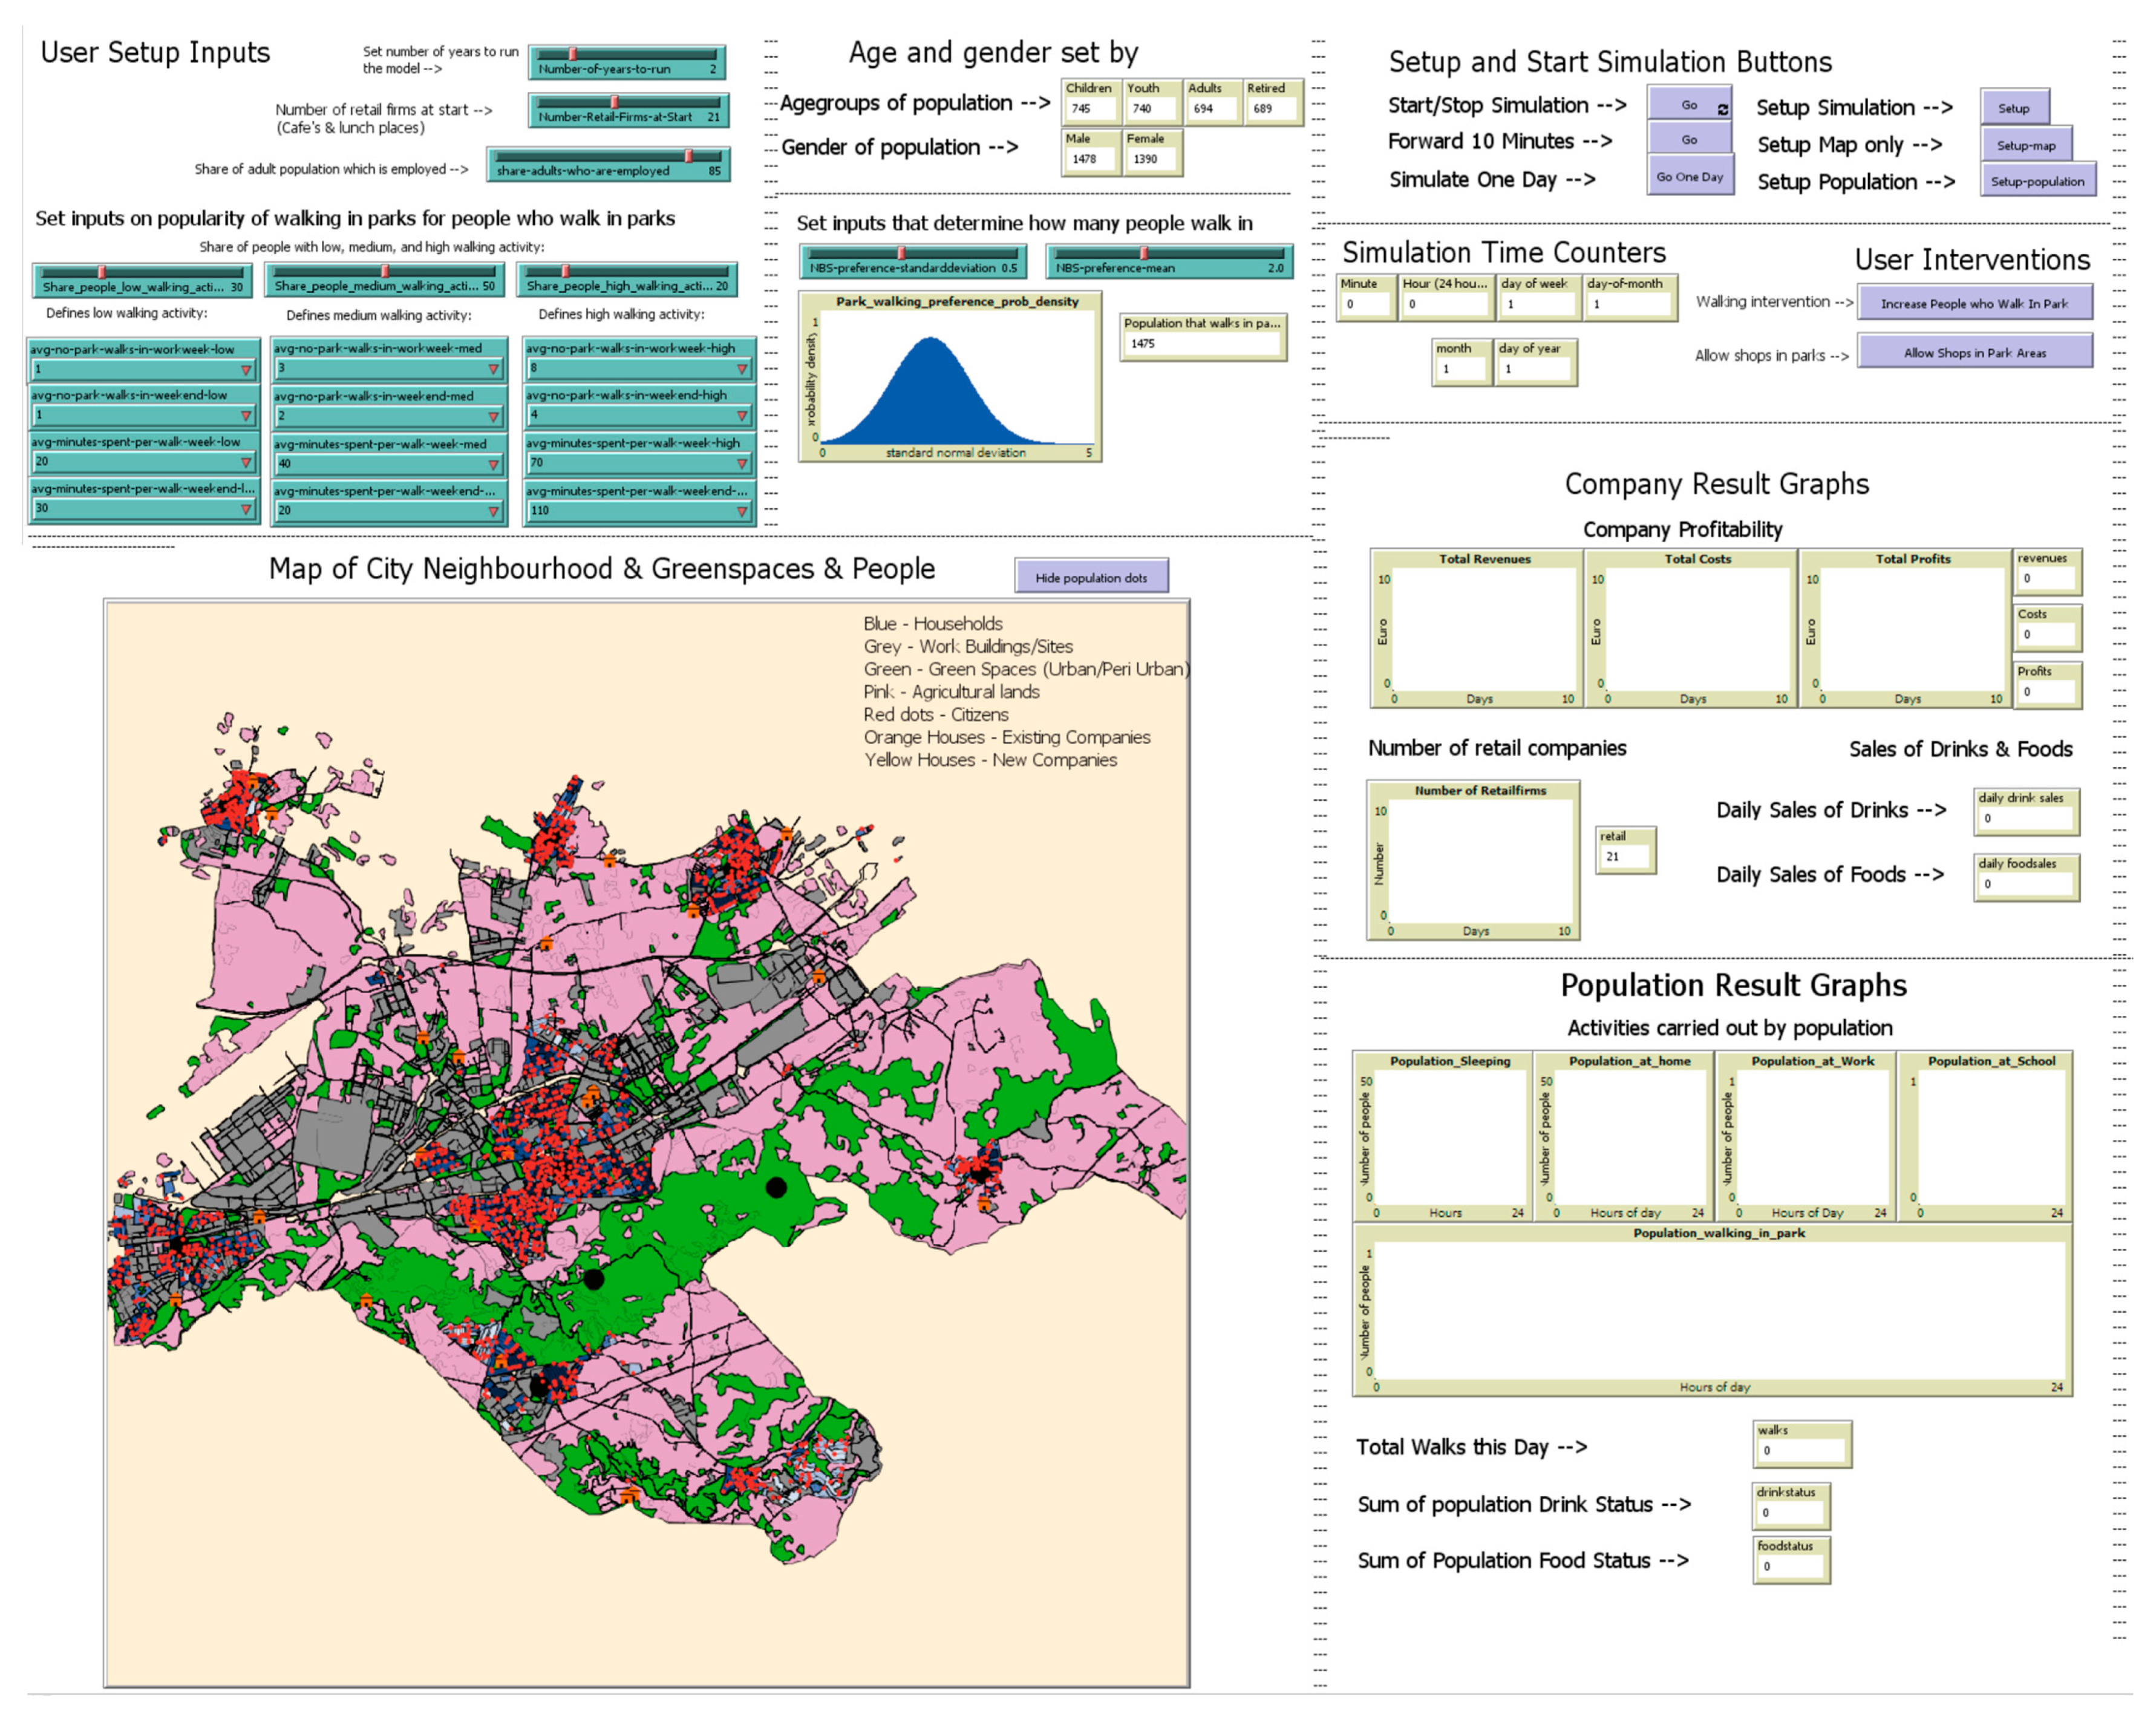
3. Materials and Methods

An ABM, implemented in the popular Netlogo (https://ccl.northwestern.edu/netlogo/ (accessed on 15 June 2021)) platform (version 6.0.4) [67,68], was applied in this paper. Figure 1 shows a screenshot of the user interface of the model. For an overview of ABM modeling platforms in the context of simulation modeling, please refer to Abar et al. [69]. The Netlogo platform was selected for its versatility and robustness in deploying a wide range of modeling rules for this use case. To this end, it is highly suitable for exploratory academic research such as the one carried out in this paper. Its limitations are its computational scalability and inability to be integrated in modern cloud computation, because of which it is not suitable for large-scale simulations or exploitation as a commercial service.
The simulation contains two types of agents: (1) residents, some of whom carry out activities in green spaces and as such sometimes purchase drinks and food items; and (2) shop owners, who establish shops across the city. The simulation is initialized with a number of initial shops as set by the user, and new shops are created while running the model. Factors that attract new retail shops to establish a presence in an area are simplified based on attractor points, which identify areas such as large green spaces within and around which shops can emerge.
Population agents are further segmented based on two characteristics: (1) the share of agents who walk in green spaces and (2) purchasing behavior, i.e., buying a drink and/or food item. Walking characteristics are initialized by a probability setting as an initial input. A Gaussian probability density function is used for this purpose. The user can set the mean and standard deviation to modify the population share that walks in the park.
The user can further divide those who walk in green spaces into:
  • The proportion that has a low walking activity, with 1 walk during the workweek of 20 min on average and 1 during the weekend of 30 min on average;
  • The proportion that has a medium walking activity, with 3 walks during the workweek of 30 min on average and 2 during the weekend of 60 min on average;
  • The proportion that has a high walking activity, with 8 walks during the workweek of 40 min on average and 4 walks during the weekend of 80 min on average.
The share of the population that is employed can also be set to influence the population that stays at home during the day and thereby has more propensity to walk in green spaces (if that agent does walk in green spaces as described above). In addition, the number of initial shops and the number of years that the model should be run for (ranging from 1 to 10 years) can be set.

3.1. Agent Activities

Population agents in the simulation carry out three main categories of activities:
  • Daily routine activities (sleep, school or work or stay at home, leisure);
  • Walking in green spaces;
  • Purchasing a drink or food.
The population is initialized with a set of activities, such that not all agents have the same activity “set”. The switch between activities as dependent variables takes place for each agent across the day based on an activity transition probability. At a set interval during which a transition can occur, such as between 6 a.m. and 9 a.m., a probability roll is made at a 10-minute timestep interval, resulting in 18 probability rolls during the time interval. A Gaussian probability distribution is assumed. Since it is not modeled what influences this probability, as this lies outside of the scope of the model, no additional independent variables are included.
Varying standard deviations can be provided for each transition. In total, the model contains eight transitions:
  • Sleeping to awake at home;
  • Awake at home to school (for population members who attend school);
  • School to home (for population members who attend school);
  • Awake at home to work (for population members who work);
  • Work to home (for population members who work);
  • Home to walk in park;
  • Walk in park to home;
  • At home to sleep.
Based on the set of transitions, a daily pattern emerges, which determines at what time residents are in green spaces or elsewhere. In addition, the difference between weekends and weekdays is considered, such that there are no to/from work and to/from school transitions during weekends.

3.2. Purchasing Behavior, Firm Financial Flows and Firm Disappearance

Resident agents are characterized by a daily food status and a daily drink status, which indicates the extent to which, for a given day, they need a food or drink item. If they have already consumed a food or drink item, the status of consumption is set to “saturated”, and they will no longer seek to purchase any food or drinks. If their status is not yet “saturated”, there is a probability that a food or drink item may be purchased. The occurrence of a purchase is based on a uniform probability roll from 0 to 1, with a 0.90 or higher probability threshold for drink item purchases and a 0.97 or higher probability threshold for food item purchases. These rolls are made in every 10-minute timestep, such that the longer the time a person spends in an NBS space, the higher the likelihood of a purchase. For example, a 50 min time spent in an NBS green space results in a 50% probability of a purchase. In the current version of the model, due to the lack of data, there is no distinction between those who never purchase any drinks and/or food items, those who rarely purchase drinks and/or food items and those who frequently purchase drinks and/or food items.
Once a drink purchase is made, it yields additional revenue for the shop where it is made. Prices are assumed based on a generic “drink” and generic “food item” and set to a randomized value per shop. The price value for drinks is set to vary between 2 and 3 euros, and food prices between 4 and 5 euros. Variable costs, including food costs and labor cost and other consumables, are assumed to be 50% of the price level, and fixed costs are introduced at 20,000 euros per year assuming space rental, financing, taxes and electricity and water charges at 1667 euros per month. The difference between revenues and costs results in the net profit or loss of the shop, which indicates its financial sustainability (or lack thereof).
It is assumed that a purchase is always made at the retail shop that is closest to the resident agent in terms of spatial distance. To this end, spatial distance is estimated for each purchase that is made to assign the purchase to the closest retail shop, which is critical in order to evaluate which retail shops survive because they make enough sales and which close down because of a lack of revenue.
If shops make a substantial loss that is equivalent to half of their fixed costs per annum, it is assumed that they disappear and are removed from the simulation. Thus, the only shops that survive are those that make a profit on a sustained basis, based on the number of customers they can obtain by being in a location close to a large number of customers who are local residents.

3.3. New Firm Appearance and Location Choice

The simulation also allows new shops to appear with similar rules for revenues, costs and profits. The locations in which new shops can appear are fixed as an initial input based on “attractor points”. New shops can appear only near these attractor points, which denote either city center areas or the center of large green spaces in the simulation. The idea is that companies do not randomly set up shop somewhere but are attracted to particular locations based on their characteristics, such as population density and visitor popularity. The idea behind attractor points was developed by Arentze and Timmermans [70], who studied firm location choice in urban settings based on a specific value per spatial cell for a company.
The probability that a new shop will emerge is based on a uniform probability roll between 0 and 10, with a 5% probability that a new shop will establish a presence per probability roll. The periodicity at which a probability roll is made for a new shop to emerge can be on a daily, weekly or monthly basis.

4. Results

The model was run for four different European cities: Szeged (Hungary), Alcalá de Henares (Spain), the Metropolitan City of Milan (Italy) and Çankaya Municipality (Turkey). A total of six model runs were established for each city. Each of these runs covered a five-year period for which daily population activities at 10 min intervals were simulated, including park walking for weekdays and weekends. The input variations were the number of initial shops at the start of each model run, set to 1, 5 or 10 retail shops randomly allocated across the city. Each run was carried out twice to give a course understanding of variability across model runs.

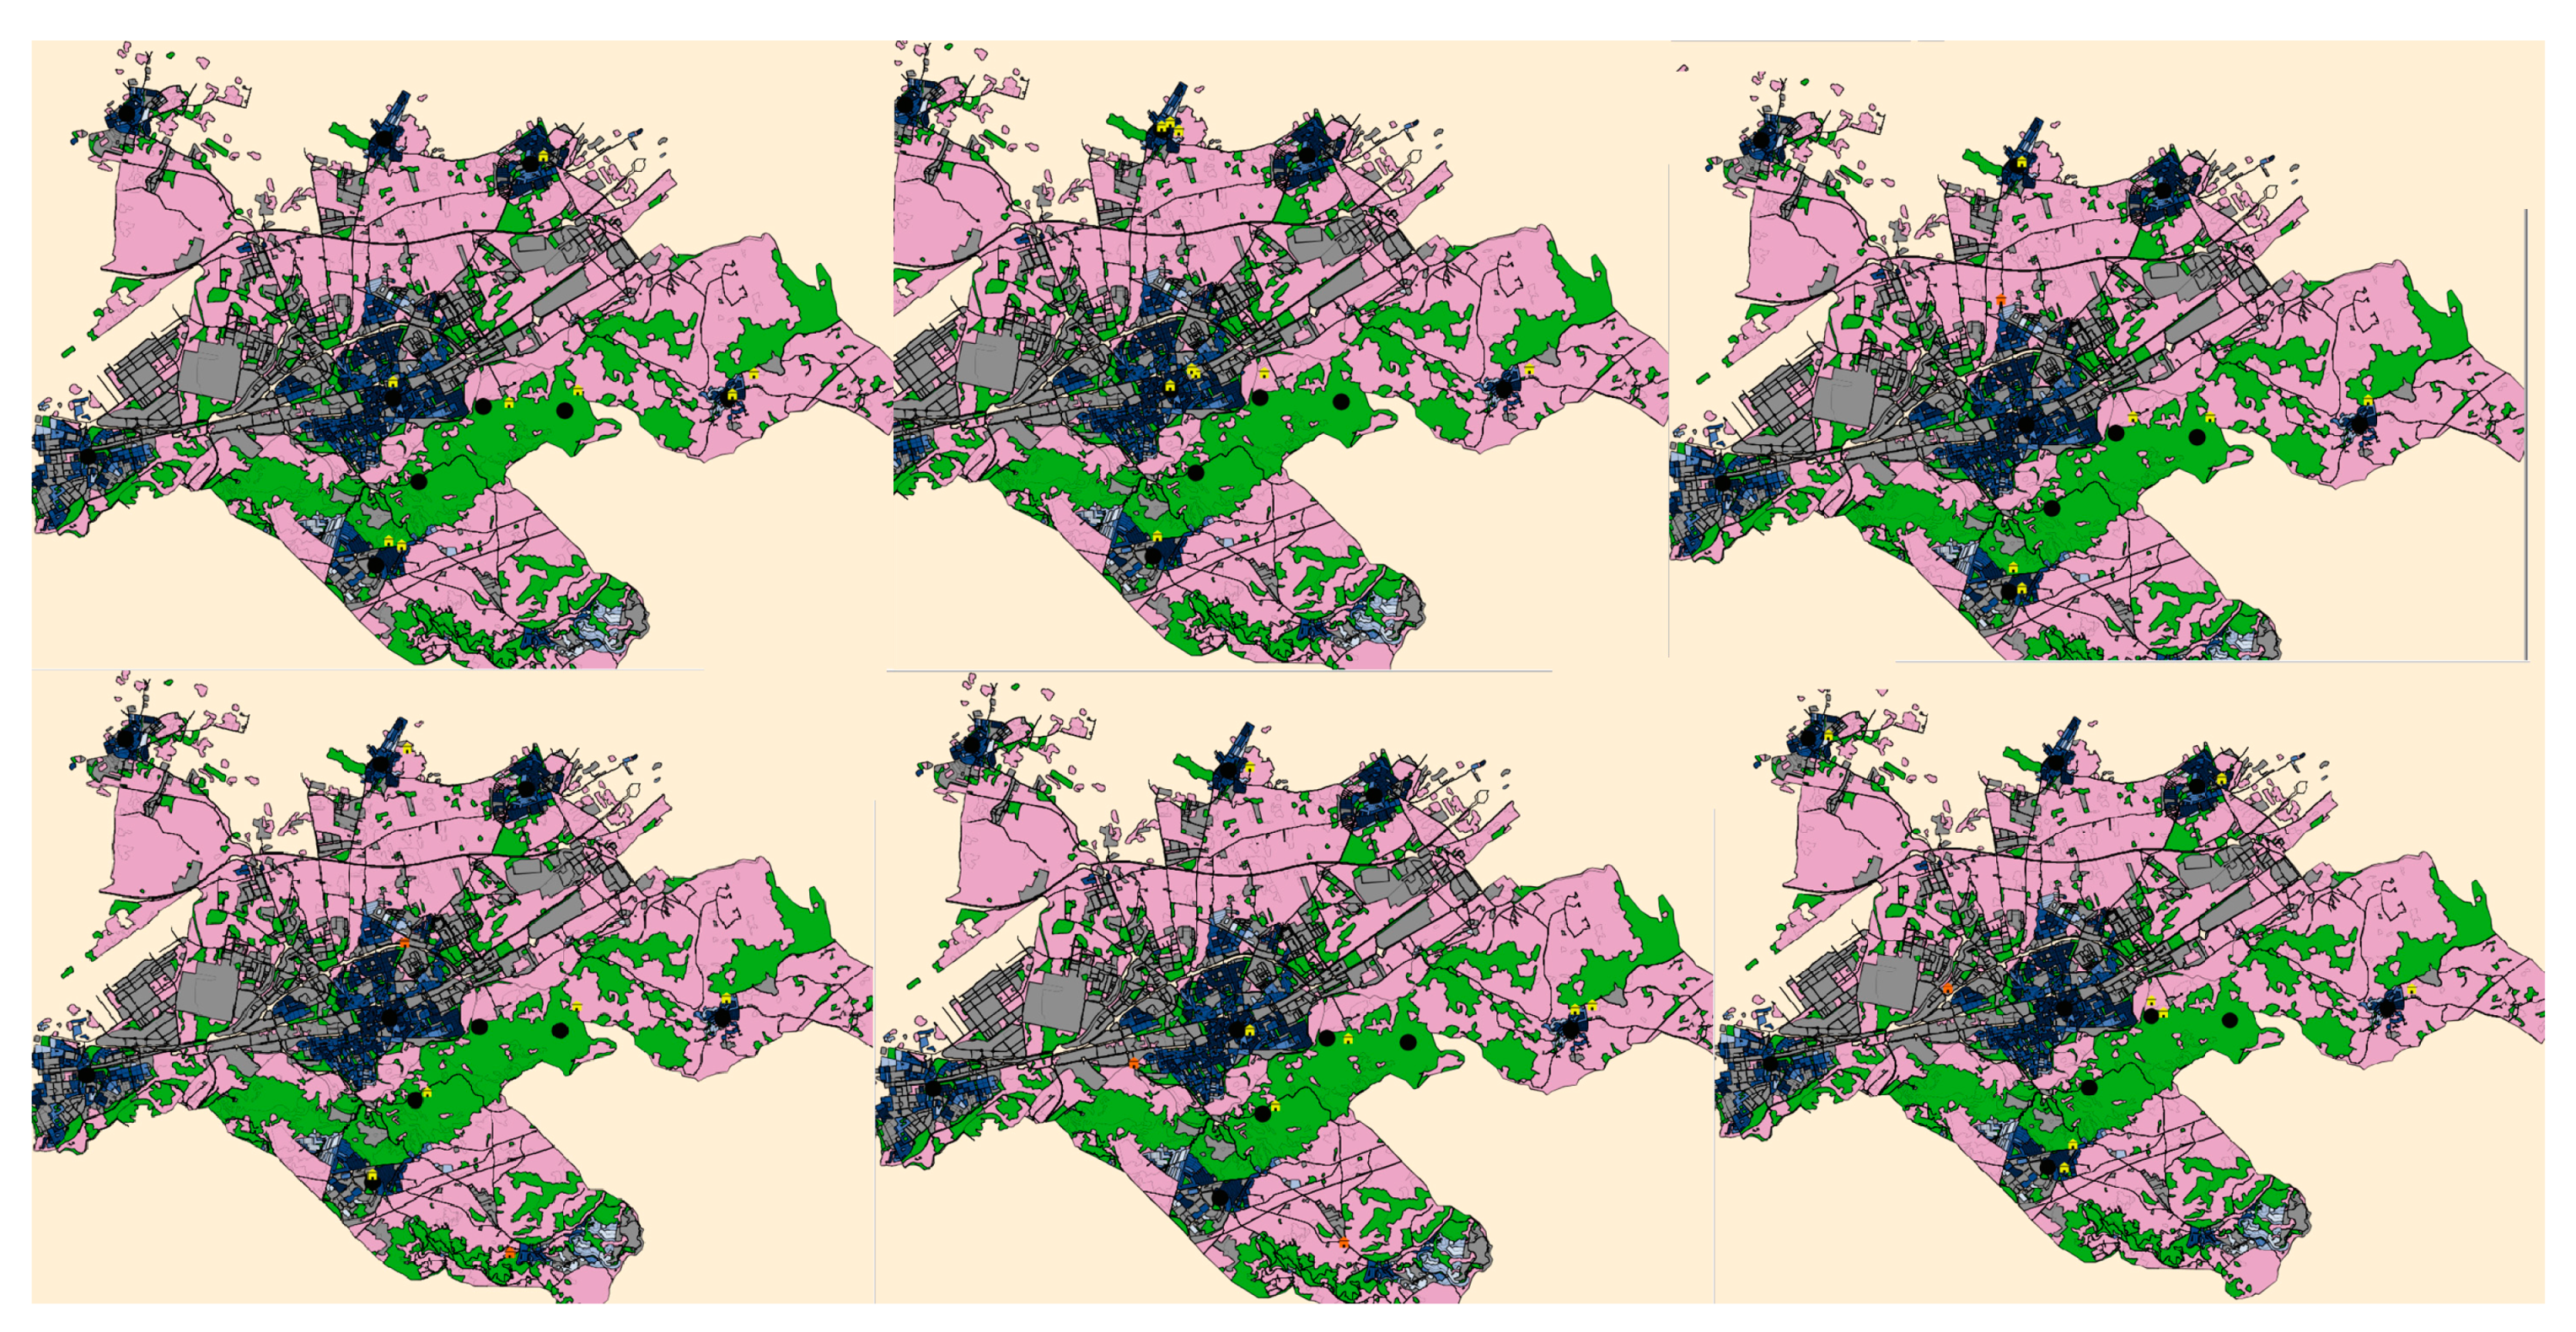
4.1. Results for Szeged (Hungary)

The simulation area was selected to cover the center of Szeged with surrounding areas and satellite peri-urban areas. The model runs for Szeged showed that for a simulated population of approximately 800 citizens who walk in parks (out of 1583 citizens), a total of 5 to 6 retail shops can be supported based on drink and food purchases associated with time spent in green spaces (Table 1). The final number of shops at the end of the 5-year simulation varied substantially between 3 and 8. No substantial difference was found between different initial numbers of retail shops. The location of the shops was found to be closely related to green spaces. At least 50% of the shops were located within or at the edge of green space areas, and in most cases, 75% of shops were located in green spaces. In one simulation run, all retail shops were in green spaces (see Figure 2).

4.2. Results for Alcalá de Henares (Spain)

The simulation area was selected to include the center of Alcalá de Henares with surrounding areas and satellite peri-urban areas. The model runs for Alcalá de Henares showed that for a simulated population of approximately 1500 citizens who walk in parks (out of 2900 citizens), a total of 7 to 9 retail shops can be supported based on drink and food purchases associated with time spent in green spaces (Table 2). The final number of shops at the end of the 5-year simulation was quite stable at 7 or 8. No substantial difference was found between different initial numbers of retail shops, which varied between 1 and 10 across the 6 model runs. The location of the shops was mostly in residential centers far from larger green spaces. Approximately 25% to 50% of shops were located within or at the edge of green space areas. At maximum, half of all retail shops were in green spaces (see Figure 3).

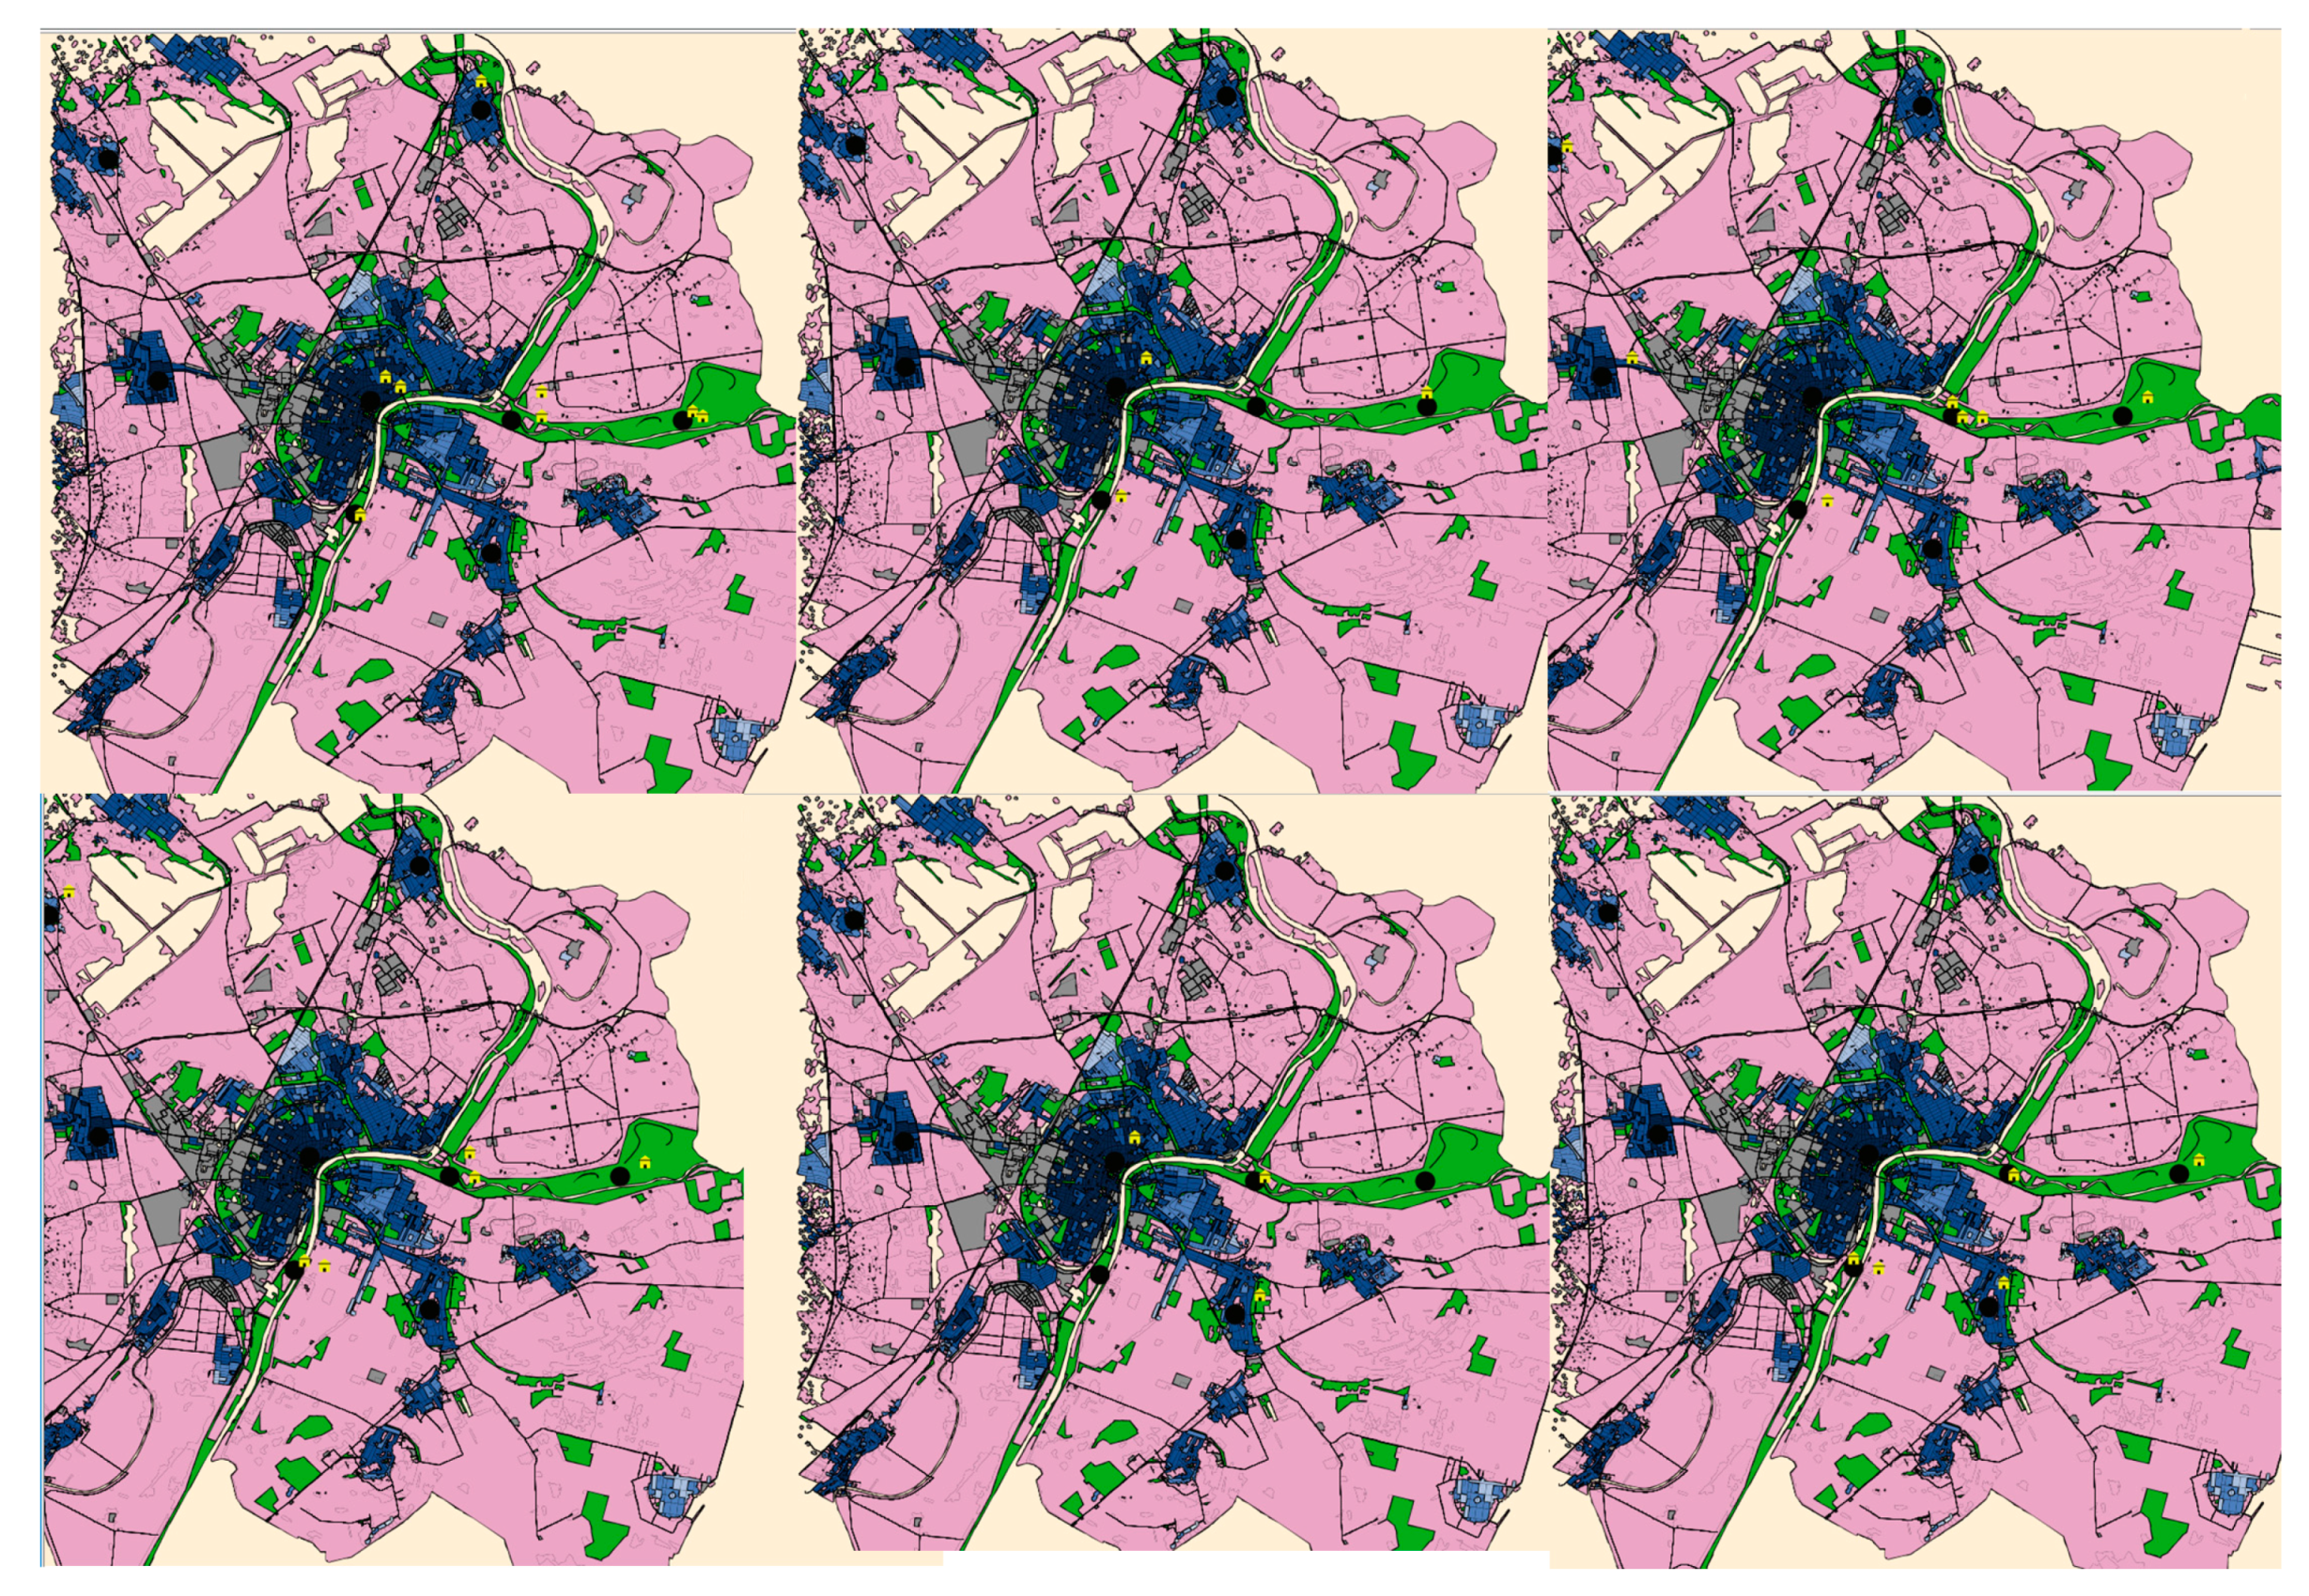
4.3. Results for the Metropolitan City of Milan (Italy)

The simulation area was based on a portion of the Northern Milan Metropolitan Area centered on the quarry restoration site in Parco Lago Nord selected with surrounding neighborhoods.
The model runs for the Metropolitan City of Milan showed approximately 3000 walks in parks for a simulated population of approximately 5600 citizens, and as a result, a total of 12 to 14 retail shops can be supported based on drink and food purchases associated with time spent in green spaces (Table 3). The final number of shops at the end of the 5-year simulation was quite stable at 13 or 14. No substantial difference was found between different initial numbers of retail shops, which varied between 1 and 10 across the 6 model runs. The location of the shops was mostly in residential centers at a reasonable distance from larger green spaces. Approximately 33% to 40% of shops were located within or at the edge of green space areas. At maximum, half of all retail shops were in green spaces (see Figure 4).

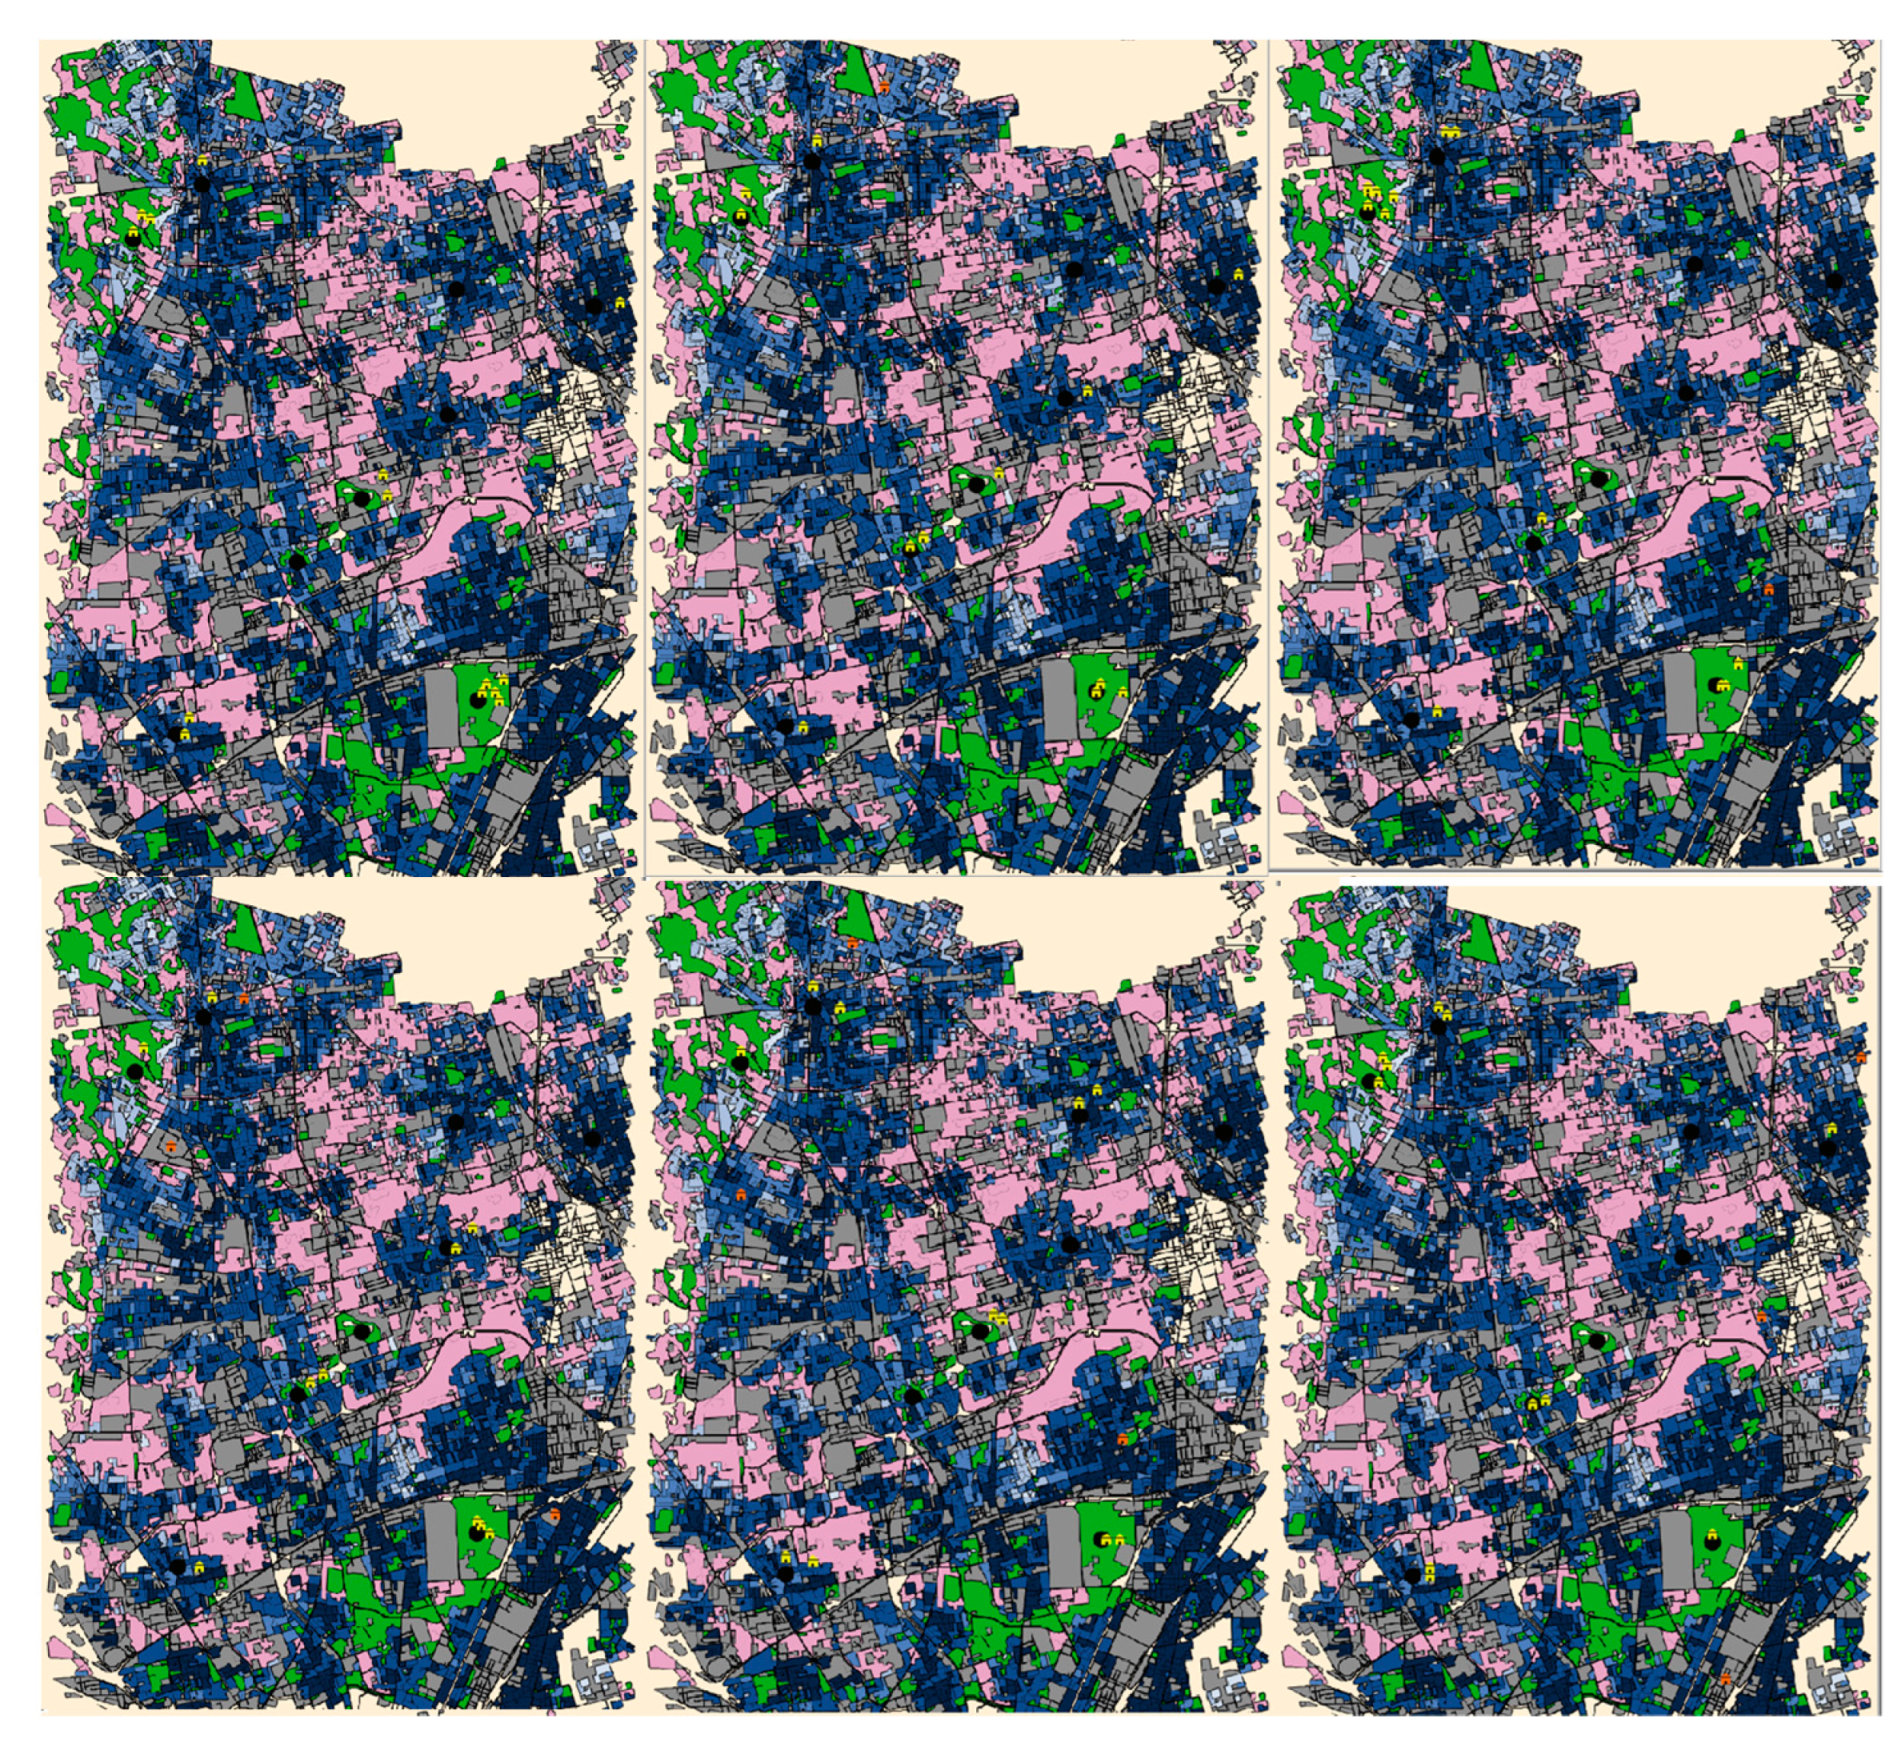
4.4. Results for Çankaya Municipality (Turkey)

The simulation area was based on the southeast area of Ankara, where Çankaya Municipality is located.
The model runs for Çankaya Municipality showed close to 1600 walks in parks for a simulated population of approximately 3000 citizens, and as a result, a total of 7 to 9 retail shops can be supported based on drink and food purchases associated with time spent in green spaces (Table 4). The final number of shops at the end of the 5-year simulation varied significantly between 5 and 11. No substantial difference was found for the average number of retail shops, based on the initial number of retail shops, which varied between 1 and 10 across the 6 model runs. The location of the shops was primarily in residential centers quite far away from larger green spaces. In five out of six model runs, only approximately 12.5% of the shops were located within or at the edge of green space areas. At maximum, 25% of retail shops were in green spaces (see Figure 5).

5. Discussion

The results of the model can be interpreted to be valid for large NBS park spaces which are visited by a substantial number of citizens. Insights are thereby derived for such spaces based on how much revenue can be generated locally by allowing for retail places within or close to NBS park spaces.
The main limitation of the model relates to the absence of data on the preferences of park visitors in terms of frequency of purchases and the amount spent on purchases. At present, the model assumes a standard probability that does not change over time, while purchases will in reality differ depending on the type of visitor, weekday or weekend day, weather and other factors. The effect of this lack of information can cause a mismatch between the purchases predicted by the model and real ones. A survey among park visitors and/or observational results on purchases, if existing retail establishments are in place, would be required to fill this data gap.
The second limitation of the model lies in the fact that more factors, in addition to distance, can play a role in purchasing behavior, such as price and type of drink or food available at a retail shop, versus the generic drink and food item currently provided in the model. This is especially relevant for food items in cases where there are different dietary segments of the population, as non-alcoholic drinks are relatively universally available across retail shops. Moreover, a fixed ratio between profits, operational costs and a fixed investment cost per shop was assumed, to allow focusing entirely on how many shops emerged per size of the population that is walking and their location.
A third limitation consists in the selection of the number of locations where shops can be established, which was constrained to a few in order to understand differences between establishing shops in NBS park spaces or in city centers near or further away from NBS park spaces. The number of areas where retail shops can be established is much larger, and a much more complex locational option model would be needed if the aim is to predict specific locations. For the purposes of understanding the number of shops and the extent to which additional revenues can be generated by NBS green parks, this level of locational detail is instead unnecessary.
A fourth limitation is that only baseline data were available from the cities involved in the Nature4Cities project, due to which it was not possible to calibrate and parameterize the model based on real-world observations. In a future research design bespoke to examining NBSs and socioeconomic factors, significant funding and effort would be needed to further advance the field to also include on-site surveys. Such surveys would have to cover at least 1000 members of the local population in a city to establish activity–time–use patterns, walking propensity, purchasing behaviors and relevant socioeconomic drivers.
The model described in this paper is based on a much simpler structure, and the results are less detailed than those from other literature models. For example, Tsekeris and Vogiatzoglou [71] developed a model which takes into account various exogenous elements (migration and relocation, commuting, costs of households and firms, transport costs and agglomeration economics), whereas the model of De Bok and Bliemer [49] considers firm-specific behavior and quantifies the effects of spatial and transport planning on firm population and mobility. The model applied in this paper is further based on much lower information and data requirements and does not involve the use of complex economic or transport models. Moreover, it deals only with local retailer shops and not with large industrial firms, which thus makes it unnecessary to build an accurate model of the job market or of transport policies. Nonetheless, the model can serve as a preliminary screening tool to assess the possible impacts of urban green parks on the economic sustainability of neighborhood-level small shops.

6. Conclusions

The agent-based simulation model developed in this paper simulated the change in commercial activities by small and midsize companies in retail due to the development of large green parks, which are a specific example of an NBS. Simulations were performed for four European cities taken as case studies. The number of shops, scaled based on the size of the population, was simulated using a 5-year simulation with a 10-minute interval. In the case of Szeged (Hungary), approximately 5–6 retail shops emerged on average for approximately 800 walking citizens, with no variation if there were differences in new retail shops. In the cases of Alcalá de Henares (Spain) and Çankaya Municipality (Turkey), approximately 7–9 retail shops emerged for around 1500 walking citizens. The simulation with Alcalá de Henares showed a lower number of shops in the case of 10 initial shops (approximately 7 on average across the simulation) and higher in the case of 1 initial shop (9 across the simulation), which may be a random result given the limited number of simulations of 5 years and given that this result did not emerge in the simulations for other municipalities/cities. The simulation for the Metropolitan City of Milan (Italy) provided an average number of retail shops of 12–14 for a simulated population of 2900 that walks in parks.
The results are generated using a combination of the number of people walking in parks, the probability of a purchase, the number of purchases that need to be made for shops to run breakeven given investment cost and the ratio between revenues and operational costs. Since these were chosen based on educated estimates and not on local evaluations, the results demonstrate the potential of such a model but cannot be used for a real implementation of investment choices. If the model were built to concretely support decision making in that sense, it would need to be informed based on local surveys to better reflect the actual frequency of people who walk in parks and the segments they belong to (in the simulation set as low, medium and high park walkers), as well as their purchasing behavior in relation to socioeconomic factors, such as income. The simulation would then allow for testing different variations in segments and their changes over time, in terms of how many retail shops can be sustained.
Another established result was the location of retail shops in the simulations because of the proximity between the place where a person is walking and the place where the purchase happens.
It is further worth mentioning that the layout of the municipality and location of green spaces have a substantial influence on where retail shops emerge and are maintained because they can make sufficient profit to survive. The simulations showed that in cases where there are limited large continuous green spaces, such as in the case of Szeged, it is more likely that retail shops can be sustained in a concentrated green area, compared to situations where there is a large fairly continuous area of green NBS space across the city center, such as in the case of Alcalá de Henares and Çankaya Municipality. In the latter case, walking behavior is more scattered, and it is more likely that retail shops will emerge at the edge or closer to built-up residential areas. However, the simulations did not consider asymmetrical attractiveness of green areas. In other words, the model did not account for the possibility that certain green areas could be frequented more often than others for walking purposes. This could nonetheless have substantial influence on the outcome.
The added value of the model presented here essentially lies in the capacity to analyze the indirect economic benefit of NBSs on a neighborhood’s economic structure—more specifically on the ability for large green spaces to provide revenue for their maintenance and upkeep, through cafés within and around the NBS. Through the model, this benefit in terms of commercial revenues that spring from NBSs can be quantified and thus provide a basis for establishing NBS infrastructure on a healthier financial basis. In future versions of the model, this could be further subdivided into specific NBSs such as large urban parks, heritage gardens, green cemeteries, woods and so forth.

Author Contributions

Conceptualization, A.M. and R.K.; methodology, A.M. and R.K.; software, R.K. and A.M.; validation, R.K.; formal analysis, R.K. and A.M.; investigation, R.K. and A.M.; resources, A.M. and R.K.; data curation, R.K.; writing—original draft preparation, A.M. and R.K.; writing—review and editing, A.M., R.K., L.H., J.B. and B.R.; visualization, R.K.; supervision, B.R.; project administration, B.R.; funding acquisition, B.R. All authors have read and agreed to the published version of the manuscript.

Funding

This work has received funding from the European Union's Horizon 2020 Research and Innovation Programme under grant agreement No 730468 (www.nature4cities.eu) for the project “Nature4Cities”, which is gratefully acknowledged by R.K., A.M. and B.R.

Institutional Review Board Statement

Not applicable.

Informed Consent Statement

Not applicable.

Data Availability Statement

Not applicable.

Acknowledgments

The authors gratefully acknowledge the COST Action CA16114 “RESTORE: Rethinking Sustainability towards a Regenerative Economy”, thanks to which the networking opportunities were created to develop this joint work.

Conflicts of Interest

The authors declare no conflict of interest.

References

  1. United Nations. World Urbanization Prospects: The 2018 Revision (ST/ESA/SER.A/420); United Nations, Department of Economic and Social Affairs, Population Division: New York, NY, USA, 2019; p. 126. [Google Scholar]
  2. Pataki, D.E.; Carreiro, M.M.; Cherrier, J.; Grulke, N.E.; Jennings, V.; Pincetl, S.; Pouyat, R.V.; Whitlow, T.H.; Zipperer, W.C. Coupling biogeochemical cycles in urban environments: Ecosystem services, green solutions, and misconceptions. Front. Ecol. Environ. 2011, 9, 27–36. [Google Scholar] [CrossRef]
  3. Ozuduru, B.H.; Guldmann, J.-M. Retail Location and Urban Resilience: Towards a New Framework for Retail Policy. Surv. Perspect. Integr. Environ. Soc. 2013, 6, 1–13. [Google Scholar]
  4. Grahn, P.; Stigsdotter, U.K. The relation between perceived sensory dimensions of urban green space and stress restoration. Landsc. Urban Plan. 2010, 94, 264–275. [Google Scholar] [CrossRef]
  5. Beute, F.; Andreucci, M.B.; Lammel, A.; Davies, Z.; Glanville, J.; Keune, H.; Marselle, M.; O’Brien, L.; Olszewska-Guizzo, A.; Remmen, R.; et al. Types and Characteristics of Urban and Peri-Urban Green Spaces Having an Impact on Human Mental Health and Wellbeing. EKLIPSE Expert Working Group. 2020. Available online: https://eklipse.eu/wp-content/uploads/website_db/Request/Mental_Health/EKLIPSE_HealthReport-Green_Final-v2-Digital.pdf (accessed on 15 June 2021).
  6. Brengman, M.; Willems, K.; Joye, Y. The Impact of In-Store Greenery on Customers. Psychol. Mark. 2012, 29, 807–821. [Google Scholar] [CrossRef]
  7. Niemelä, J. Ecology and urban planning. Biodivers. Conserv. 1999, 8, 119–131. [Google Scholar] [CrossRef]
  8. European Commission. Mapping and Assessment of Ecosystems and Their Services; European Commission: Brussels, Belgium, 2016. [Google Scholar]
  9. Li, L.; Cheshmehzangi, A.; Chan, F.K.S.; Ives, C.D. Mapping the Research Landscape of Nature-Based Solutions in Urbanism. Sustainability 2021, 13, 3876. [Google Scholar] [CrossRef]
  10. Babí Almenar, J.; Elliot, T.; Rugani, B.; Philippe, B.; Navarrete Gutierrez, T.; Sonnemann, G.; Geneletti, D. Nexus between nature-based solutions, ecosystem services and urban challenges. Land Use Policy 2021, 100, 104898. [Google Scholar] [CrossRef]
  11. Ferreira, V.; Barreira, A.P.; Loures, L.; Antunes, D.; Panagopoulos, T. Stakeholders’ Engagement on Nature-Based Solutions: A Systematic Literature Review. Sustainability 2020, 12, 640. [Google Scholar] [CrossRef] [Green Version]
  12. Meyer, M.A.; Schulz, C. Do ecosystem services provide an added value compared to existing forest planning approaches in Central Europe? Ecol. Soc. 2017, 22. [Google Scholar] [CrossRef] [Green Version]
  13. Popoola, L.; Ajewole, O. Public perceptions of urban forests in ibadan, nigeria: Implications for environmental conservation. Arboric. J. 2001, 25, 1–22. [Google Scholar] [CrossRef]
  14. Jim, C.; Chen, W. Perception and Attitude of Residents Toward Urban Green Spaces in Guangzhou (China). Environ. Manag. 2006, 38, 338–349. [Google Scholar] [CrossRef] [PubMed]
  15. Panagopoulos, T.; Tampakis, S.; Karanikola, P.; Karipidou-Kanari, A.; Kantartzis, A. The Usage and Perception of Pedestrian and Cycling Streets on Residents’ Well-being in Kalamaria, Greece. Land 2018, 7, 100. [Google Scholar] [CrossRef] [Green Version]
  16. Yen, Y.; Wang, Z.; Shi, Y.; Soeung, B. An Assessment of the Knowledge and Demand of Young Residents regarding the Ecological Services of Urban Green Spaces in Phnom Penh, Cambodia. Sustainability 2016, 8, 523. [Google Scholar] [CrossRef] [Green Version]
  17. Barau, A.S. Perceptions and contributions of households towards sustainable urban green infrastructure in Malaysia. Habitat Int. 2015, 47, 285–297. [Google Scholar] [CrossRef]
  18. Guenat, S.; Dougill, A.J.; Kunin, W.E.; Dallimer, M. Untangling the motivations of different stakeholders for urban greenspace conservation in sub-Saharan Africa. Ecosyst. Serv. 2019, 36, 100904. [Google Scholar] [CrossRef]
  19. Gwedla, N.; Shackleton, C.M. Perceptions and preferences for urban trees across multiple socio-economic contexts in the Eastern Cape, South Africa. Landsc. Urban Plan. 2019, 189, 225–234. [Google Scholar] [CrossRef]
  20. Parker, J.; De Baro, M.E.Z. Green Infrastructure in the Urban Environment: A Systematic Quantitative Review. Sustainability 2019, 11, 3182. [Google Scholar] [CrossRef] [Green Version]
  21. Ershad Sarabi, S.; Han, Q.; Romme, A.G.L.; De Vries, B.; Wendling, L. Key Enablers of and Barriers to the Uptake and Implementation of Nature-Based Solutions in Urban Settings: A Review. Resources 2019, 8, 121. [Google Scholar] [CrossRef] [Green Version]
  22. Chen, W.; He, B.; Nover, D.; Lu, H.; Liu, J.; Sun, W.; Chen, W. Farm ponds in southern China: Challenges and solutions for conserving a neglected wetland ecosystem. Sci. Total Environ. 2019, 659, 1322–1334. [Google Scholar] [CrossRef] [PubMed]
  23. Liquete, C.; Udias, A.; Conte, G.; Grizzetti, B.; Masi, F. Integrated valuation of a nature-based solution for water pollution control. Highlighting hidden benefits. Ecosyst. Serv. 2016, 22, 392–401. [Google Scholar] [CrossRef]
  24. Santiago Fink, H. Human-Nature for Climate Action: Nature-Based Solutions for Urban Sustainability. Sustainability 2016, 8, 254. [Google Scholar] [CrossRef] [Green Version]
  25. Short, C.; Clarke, L.; Carnelli, F.; Uttley, C.; Smith, B. Capturing the multiple benefits associated with nature-based solutions: Lessons from a natural flood management project in the Cotswolds, UK. Land Degrad. Dev. 2019, 30, 241–252. [Google Scholar] [CrossRef]
  26. Van der Jagt, A.P.N.; Szaraz, L.R.; Delshammar, T.; Cvejić, R.; Santos, A.; Goodness, J.; Buijs, A. Cultivating nature-based solutions: The governance of communal urban gardens in the European Union. Environ. Res. 2017, 159, 264–275. [Google Scholar] [CrossRef]
  27. Terrapin Bright Green. Terrapin The Economics of Biophilia; Terrapin Bright Green LLC: New York, NY, USA, 2015. [Google Scholar]
  28. Simpson, D. The Economics of Nature-Based Solutions: Current Status and Future Priorities; United Nations Environment Programme (UNEP): Nairobi, Kenia, 2020. [Google Scholar]
  29. Di Marino, M.; Tiitu, M.; Lapintie, K.; Viinikka, A.; Kopperoinen, L. Integrating green infrastructure and ecosystem services in land use planning. Results from two Finnish case studies. Land Use Policy 2019, 82, 643–656. [Google Scholar] [CrossRef]
  30. Furlong, C.; Phelan, K.; Dodson, J. The role of water utilities in urban greening: A case study of Melbourne, Australia. Util. Policy 2018, 53, 25–31. [Google Scholar] [CrossRef]
  31. Girma, Y.; Terefe, H.; Pauleit, S. Urban green spaces use and management in rapidly urbanizing countries:-The case of emerging towns of Oromia special zone surrounding Finfinne, Ethiopia. Urban For. Urban Green. 2019, 43, 126357. [Google Scholar] [CrossRef]
  32. Keeley, M.; Koburger, A.; Dolowitz, D.P.; Medearis, D.; Nickel, D.; Shuster, W. Perspectives on the Use of Green Infrastructure for Stormwater Management in Cleveland and Milwaukee. Environ. Manag. 2013, 51, 1093–1108. [Google Scholar] [CrossRef] [PubMed]
  33. Khoshkar, S.; Balfors, B.; Wärnbäck, A. Planning for green qualities in the densification of suburban Stockholm – opportunities and challenges. J. Environ. Plan. Manag. 2018, 61, 2613–2635. [Google Scholar] [CrossRef]
  34. Lamichhane, D.; Thapa, H.B. Participatory urban forestry in Nepal: Gaps and ways forward. Urban For. Urban Green. 2012, 11, 105–111. [Google Scholar] [CrossRef]
  35. Rall, E.L.; Kabisch, N.; Hansen, R. A comparative exploration of uptake and potential application of ecosystem services in urban planning. Ecosyst. Serv. 2015, 16, 230–242. [Google Scholar] [CrossRef]
  36. Živojinović, I.; Wolfslehner, B. Perceptions of urban forestry stakeholders about climate change adaptation – A Q-method application in Serbia. Urban For. Urban Green. 2015, 14, 1079–1087. [Google Scholar] [CrossRef]
  37. Davis, M.; Naumann, S. Making the Case for Sustainable Urban Drainage Systems as a Nature-Based Solution to Urban Flooding. In Nature-Based Solutions to Climate Change Adaptation in Urban Areas: Linkages between Science, Policy and Practice; Kabisch, N., Korn, H., Stadler, J., Bonn, A., Eds.; Springer International Publishing: Cham, Switzerland, 2017; pp. 123–137. ISBN 978-3-319-56091-5. [Google Scholar]
  38. Li, C.; Peng, C.; Chiang, P.-C.; Cai, Y.; Wang, X.; Yang, Z. Mechanisms and applications of green infrastructure practices for stormwater control: A review. J. Hydrol. 2019, 568, 626–637. [Google Scholar] [CrossRef]
  39. Zuniga-Teran, A.A.; Staddon, C.; De Vito, L.; Gerlak, A.K.; Ward, S.; Schoeman, Y.; Hart, A.; Booth, G. Challenges of mainstreaming green infrastructure in built environment professions. J. Environ. Plan. Manag. 2020, 63, 710–732. [Google Scholar] [CrossRef]
  40. Raymond, C.M.; Frantzeskaki, N.; Kabisch, N.; Berry, P.; Breil, M.; Nita, M.R.; Geneletti, D.; Calfapietra, C. A framework for assessing and implementing the co-benefits of nature-based solutions in urban areas. Environ. Sci. Policy 2017, 77, 15–24. [Google Scholar] [CrossRef]
  41. Lafortezza, R.; Sanesi, G. Nature-based solutions: Settling the issue of sustainable urbanization. Environ. Res. 2019, 172, 394–398. [Google Scholar] [CrossRef]
  42. Waddell, P.; Borning, A.; Noth, M.; Freier, N.; Becke, M.; Ulfarsson, G. Microsimulation of Urban Development and Location Choices: Design and Implementation of UrbanSim. Netw. Spat. Econ. 2003, 3, 43–67. [Google Scholar] [CrossRef]
  43. Brouwer, A.E.; Mariotti, I.; Van Ommeren, J.N. The firm relocation decision: An empirical investigation. Ann. Reg. Sci. 2004, 38, 335–347. [Google Scholar] [CrossRef] [Green Version]
  44. Van Dijk, J.; Pellenbarg, P.H. Firm Migration. In International Encyclopedia of Geography; American Cancer Society: Atlanta, GA, USA, 2017; pp. 1–12. ISBN 978-1-118-78635-2. [Google Scholar]
  45. Van Dijk, J.; Pellenbarg, P.H. Firm relocation decisions in The Netherlands: An ordered logit approach. Pap. Reg. Sci. 2000, 79, 191–219. [Google Scholar] [CrossRef]
  46. De Bok, M.; van Oort, F. Agglomeration Economies, Accessibility, and the Spatial Choice Behavior of Relocating Firms. J. Transp. Land Use 2011, 4, 5–24. [Google Scholar] [CrossRef] [Green Version]
  47. Knoben, J.; Oerlemans, L.A.G. Ties that Spatially Bind? A Relational Account of the Causes of Spatial Firm Mobility. Reg. Stud. 2008, 42, 385–400. [Google Scholar] [CrossRef] [Green Version]
  48. Bodenmann, B.R.; Axhausen, K.W. Destination choice for relocating firms: A discrete choice model for the St. Gallen region, Switzerland. Pap. Reg. Sci. 2012, 91, 319–341. [Google Scholar] [CrossRef]
  49. De Bok, M.; Bliemer, M.C.J. Infrastructure and Firm Dynamics: Calibration of Microsimulation Model for Firms in the Netherlands. Transp. Res. Rec. 2006, 1977, 132–144. [Google Scholar] [CrossRef]
  50. Ortegón-Cortázar, L.; Royo-Vela, M. Attraction factors of shopping centers. Eur. J. Manag. Bus. Econ. 2017, 26, 199–219. [Google Scholar] [CrossRef] [Green Version]
  51. Lee, J.-S.; Hsu, L.-T.; Han, H.; Kim, Y. Understanding how consumers view green hotels: How a hotel’s green image can influence behavioural intentions. J. Sustain. Tour. 2010, 18, 901–914. [Google Scholar] [CrossRef]
  52. Purani, K.; Kumar, D.S. Exploring restorative potential of biophilic servicescapes. J. Serv. Mark. 2018, 32, 414–429. [Google Scholar] [CrossRef]
  53. Amérigo, M.; García, J.A.; Sánchez, T. Attitudes and Behavior towards Natural Environment. Environmental Health and Psychological Well-Being. Univ. Psychol. 2013, 12, 845–856. [Google Scholar]
  54. Berman, M.G.; Jonides, J.; Kaplan, S. The Cognitive Benefits of Interacting With Nature. Psychol. Sci. 2008, 19, 1207–1212. [Google Scholar] [CrossRef]
  55. Kellert, S. Dimensions, Elements, and Attributes of Biophilic Design. In Biophilic Design: The Theory, Science, and Practice of Bringing Buildings to Life; Kellert, S.R., Heerwagen, J., Mador, M., Eds.; John Wiley & Sons: Hoboken, NJ, USA, 2008. [Google Scholar]
  56. Wooldridge, M. An Introduction to MultiAgent Systems, 2nd ed.; John Wiley & Sons: Chichester, UK, 2009. [Google Scholar]
  57. Marks, R. Validating Simulation Models: A General Framework and Four Applied Examples. Comput. Econ. 2007, 30, 265–290. [Google Scholar] [CrossRef]
  58. De Marchi, S.; Page, S.E. Agent-Based Models. Annu. Rev. Political Sci. 2014, 17, 1–20. [Google Scholar] [CrossRef]
  59. Macy, M.; Flache, A. Social Dynamics from the Bottom-Up: Agent-based Models of Social Interaction. In The Oxford Handbook of Analytical Sociology; Oxford University Press: Oxford, UK, 2009. [Google Scholar]
  60. Marvuglia, A.; Navarrete Gutiérrez, T.; Baustert, P.; Benetto, E. Implementation of Agent-Based Models to support Life Cycle Assessment: A review focusing on agriculture and land use. AIMS Agric. Food 2018, 3, 535–560. [Google Scholar] [CrossRef]
  61. Laurenti, R.; Lazarevic, D.; Poulikidou, S.; Montrucchio, V.; Bistagnino, L.; Frostell, B. Group Model-Building to identify potential sources of environmental impacts outside the scope of LCA studies. J. Clean. Prod. 2014, 72, 96–109. [Google Scholar] [CrossRef] [Green Version]
  62. Schaffernicht, M. Causal loop diagrams between structure and behaviour: A critical analysis of the relationship between polarity, behaviour and events. Syst. Res. Behav. Sci. 2010, 27, 653–666. [Google Scholar] [CrossRef]
  63. Gilbert, N.; Troitzsch, K.G. Simulation for the Social Scientist, 2nd ed.; Open University Press: Buckingham, UK, 2005. [Google Scholar]
  64. Davis, C.; Nikolić, I.; Dijkema, G.P.J. Integration of Life Cycle Assessment Into Agent-Based Modeling. J. Ind. Ecol. 2009, 13, 306–325. [Google Scholar] [CrossRef] [Green Version]
  65. Ahmadi Achachlouei, M. Exploring the Effects of ICT on Environmental Sustainability: From Life Cycle Assessment to Complex Systems Modeling; KTH Royal Institute of Technology: Stockholm, Sweden, 2015. [Google Scholar]
  66. Morgan, S.L.; Winship, C. Counterfactuals and Causal Inference. Methods and Principles for Social Research; Cambridge University Press: New York, NY, USA, 2015. [Google Scholar]
  67. Tisue, S.; Wilensky, U. NetLogo: A Simple Environment for Modeling Complexity. In Proceedings of the International Conference on Complex Systems, Boston, MA, USA, 16–21 May 2004. [Google Scholar]
  68. Tisue, S.; Wilensky, U. Design and Implementation of a Multi-Agent Modeling Environment. In Proceedings of the Agent 2004 Conference on Social Dynamics: Interaction, Reflexivity and Emergence, Chicago, IL, USA, 7–9 October 2004. [Google Scholar]
  69. Abar, S.; Theodoropoulos, G.K.; Lemarinier, P.; O’Hare, G.M.P. Agent Based Modelling and Simulation tools: A review of the state-of-art software. Comput. Sci. Rev. 2017, 24, 13–33. [Google Scholar] [CrossRef]
  70. Arentze, D.T.; Timmermans, D.H. A Multi-Agent Activity-Based Model of Facility Location Choice and Use. disP Plan. Rev. 2007, 43, 33–44. [Google Scholar] [CrossRef]
  71. Tsekeris, T.; Vogiatzoglou, K. Spatial agent-based modeling of household and firm location with endogenous transport costs. Netnomics Econ. Res. Electron. Netw. 2011, 12, 77–98. [Google Scholar] [CrossRef]
Figure 1. Screenshot of Netlogo model’s interface for socioeconomic and commercial development resulting from NBS changes.
Sustainability 13 07466 g001
Figure 2. Final map location results for Szeged of retail shops across six model runs. Initial retail shops (if still existing) in orange; new retail shops in yellow. Land use is depicted based on green spaces (green), households (blue), agriculture (pink) and commercial spaces (grey).
Sustainability 13 07466 g002
Figure 3. Final map location results for Alcalá de Henares of retail shops across six model runs. Initial retail shops (if still existing) in orange; new retail shops in yellow. Land use is depicted based on green spaces (green), households (blue), agriculture (pink) and commercial spaces (grey).
Sustainability 13 07466 g003
Figure 4. Final map location results of retail shops across six model runs for the Metropolitan City of Milan. Initial retail shops (if still existing) in orange; new retail shops in yellow. Land use is depicted based on green spaces (green), households (blue), agriculture (pink) and commercial spaces (grey).
Sustainability 13 07466 g004
Figure 5. Final map location results of retail shops across six model runs for Çankaya Municipality. Initial retail shops (if still existing) in orange; new retail shops in yellow. Land use is depicted based on green spaces (green), households (blue), agriculture (pink) and commercial spaces (grey).
Sustainability 13 07466 g005
Table 1. Szeged: simulation results for socioeconomic and commercial development resulting from NBS changes.
Run Set #Population (# People)Population Walking in Parks (# People)Number of Retail Shops
At Start of Model RunAt End of Model RunAverage across Model Run
11583827186
21583783135
31583818576
61583873565
515838101035
615838451055
Table 2. Alcalá de Henares: simulation results for socioeconomic and commercial development resulting from NBS changes.
Run Set #Population (# People)Population Walking in Parks (# People)Number of Retail Shops
At Start of Model RunAt End of Model RunAverage across Model Run
128681559189
228681498189
328681511576
628681440578
5286814481087
6286814611087
Table 3. Metropolitan City of Milan: simulation results for socioeconomic and commercial development resulting from NBS changes.
Run Set #Population (# People)Population Walking in Parks (# People)Number of Retail Shops
At Start of Model RunAt End of Model RunAverage across Model Run
15592292911414
25592295011312
35592291951413
65592294351313
555922921101413
655922815101412
Table 4. Çankaya Municipality: simulation results for socioeconomic and commercial development resulting from NBS changes.
Run Set #Population (# People)Population Walking in Parks (# People)Number of Retail Shops
At Start of Model RunAt End of Model RunAverage across Model Run
130001569189
2300015961118
330001545577
630001553568
5300016081058
63000161010118
Publisher’s Note: MDPI stays neutral with regard to jurisdictional claims in published maps and institutional affiliations.

