
An Investigation on the Effects of Input Parameters on the Dynamic and Electric Consumption of Electric Motorcycles

1
School of Mechanical Engineering, University of Ulsan, San 29, Mugeo2-dong, Nam-gu, Ulsan 44610, Korea
2
Faculty of Automobile Technology, HaNoi University of Industry, No.298, Cau Dien Street, Bac Tu Liem District, Ha Noi 100000, Vietnam
*
Author to whom correspondence should be addressed.
Sustainability 2021, 13(13), 7285; https://doi.org/10.3390/su13137285
Submission received: 7 May 2021
/
Revised: 19 June 2021
/
Accepted: 25 June 2021
/
Published: 29 June 2021
(This article belongs to the Collection Sustainable Development of Electric Vehicle)
Abstract
:The purpose of this paper is to study how input parameters affect the dynamic characteristics and electric consumption characteristics of an electric motorcycle. To achieve this goal, a simulation model of the electric motorcycle, including dynamic models and battery models were established based on mathematical models and using the MATLAB SIMULINK software (Parnas Tower 14th Floor521 Teheran-street Gangnam-district Seoul 06164 Korea). The simulation model was used to determine the velocity, propulsion torque, electric consumption characteristics with variable electric motorcycle mass, driver mass, wheel radius, frontal area, and transmission ratio. Through the simulation study, the paper found that when the electric motorcycle mass was increased from 60 kg to 100 kg, the maximum velocity decreased by 5.45%, the moving distance was reduced by 5.89%, and electric consumption increased by 0.11%. Following increased driver mass from 48 kg to 88 kg, the velocity and moving distance decreased by 5.45% and 5.89%, respectively, while also increasing electric consumption by 0.11%. When the wheel radius was changed from 0.205 m to 0.245 m, the maximum velocity increased by 11%, the moving distance increased by 11.2%, and electric consumption increased by 0.11%. When the frontal area was increased from 0.52 m2 to 0.92 m2, the velocity and moving distance decreased by 2.43% and 2.06%, respectively, while electric consumption increased by 0.04%. When the transmission ratio was increased from 2.66 to 4.94, the velocity and moving distance increased from 30.74 km/h to 70.7 km/h and from 303.12 m to 710.44 m, respectively, while electric consumption increased by 0.16%. Finally, an experimental study is conducted to examine the dynamics of the electric motorcycle. The experimental results have the same trend with simulation in the same initial condition. Through combination simulation and experiment, the researcher can optimize the dynamic and electric consumption of an electric motorcycle.
1. Introduction
One of the major concerns of many counties in the world is environmental pollution. The toxic emissions of the internal combustion engine are one of the main pollution sources through using fossil fuels such as diesel and gasoline [1,2,3]. Furthermore, the toxic emission from internal combustion engines such as hydrocarbons (HC), carbon monoxide (CO), nitrogen oxides (NOx), and particulate matter (PM) directly affect human health [4,5]. Another issue is energy security; because of concerns regarding fossil fuel supply and undesirable economic impact by fluctuating fuel price, alternative fuel, and new vehicles have become a focus for worldwide researchers [6,7,8]. One promising choice is electric vehicles (EVs), which have significant advantages such as boosting energy efficiency, decreasing toxic emissions, and reducing noise compared with an internal combustion engine [9,10,11]. One potential electric vehicle is electric motorcycles [12], which are not only appropriate for moving a short distance over diverse terrains but also utilitarian compared with other electric vehicles with reasonable prices, maintenance, and repair expenditure [13,14,15,16,17].
Behzad Asaei et al. [18] presented the performance, fuel consumption, and emission characteristics of a hybrid electric motorcycle integrated with a brushless DC motor on the front wheel. Through simulating detailed design manufacturing of hybrid electric motorcycles on the road, they found that the acceleration time from 0 to 60 km/h was optimized by approximately 46%, fuel consumption was decreased by 22%, and toxic emission was decreased, such as NOx 7%, HC 22%, and CO 22%. Joerg Dieter Weigl et al. [19] developed an electric motorcycle using a hydrogen fuel cell (H2Motive), which was evaluated at the South African Solar Challenge. The results show that an electric motorcycle using a hydrogen fuel cell is capable of traveling 2400 km. The electric motorcycle was based upon a converted Motorcycle-CBR400, which can travel 1600 km at the World Advanced Vehicle Expedition. Rabiatuladawiah Abu Hanifah et al. [20] studied the kinematics and dynamic models of a motorcycle with two driving cycles, including the Worldwide Motorcycle Test Cycle (WMTC) and New European Driving Cycle (NEDC). The results of the paper concluded that: the moving distance of a developed model could be effectively determined, and the enhanced battery control modeling can be applied for an electric motorcycle in future research. Alireaz Farzanh et al. [21] reported a smart energy management system on a pure electric motorcycle using the cuckoo optimization algorithm to optimize consumed energy. The smart energy management strategy was applied on a real test road with a third scenario, and the results found that the consumed energy was decreased by 36% compared with the first scenario, while the consumed energy was decreased by 26.8% in the second scenario compared with the first scenario. Alireza Farzaneh et al. [22] presented the energy consumption on straight and curved parts of a road for an electric motorcycle using a simulation model. They found that total energy consumption during the drive cycle decreased from 1.3728 × 10⁵ J to 4.1459 × 10⁴ J by the optimized speed with the curved portion, which demonstrated that speed optimization by a curve has a certain potential to decrease energy consumption while reducing the required powertrain traction force and total power requirement during transit through the curve.
Finally, through a brief summary of previous research in the electric motorcycle field, we found that almost all prior research focused on building a simulation model and analysis of energy consumption. Very few studies examined the dynamic and effective performance of electric motorcycles through key parameters, but not the actual motorcycle particularly. This paper investigates in detail the effect of key parameters, including operational and structural parameters, on the effective performance area of an electric motorcycle.
2. Simulation Study
2.1. Simulation Study of Electric Motorcycle
The free-body diagram of an electric motorcycle is described in Figure 1, which was the basis to simulate the electric motorcycle dynamic.
Newton’s second law in terms of an object’s acceleration can be described by:
Appling Newton’s second law to the motion of an electric motorcycle, which is described by:
where:
Fpf is the propulsion force,
Fsf is the slope resistance force, ,
Fwf is the wind resistance force, ,
Frf is the rolling resistance force, .
A DC motor was used for the motivation of an electric motorcycle, which was installed on the rear wheel, as shown in Figure 1. When the electric motorcycle operates, the DC motor uses electricity from a Li-ion battery as an energy source to create propulsion torque; the propulsion torque can be calculated as follows:
where Tp is the propulsion torque, Rw is the wheel radius.
By combining Equations (2) and (3). The propulsion torque can be re-sated as follows:
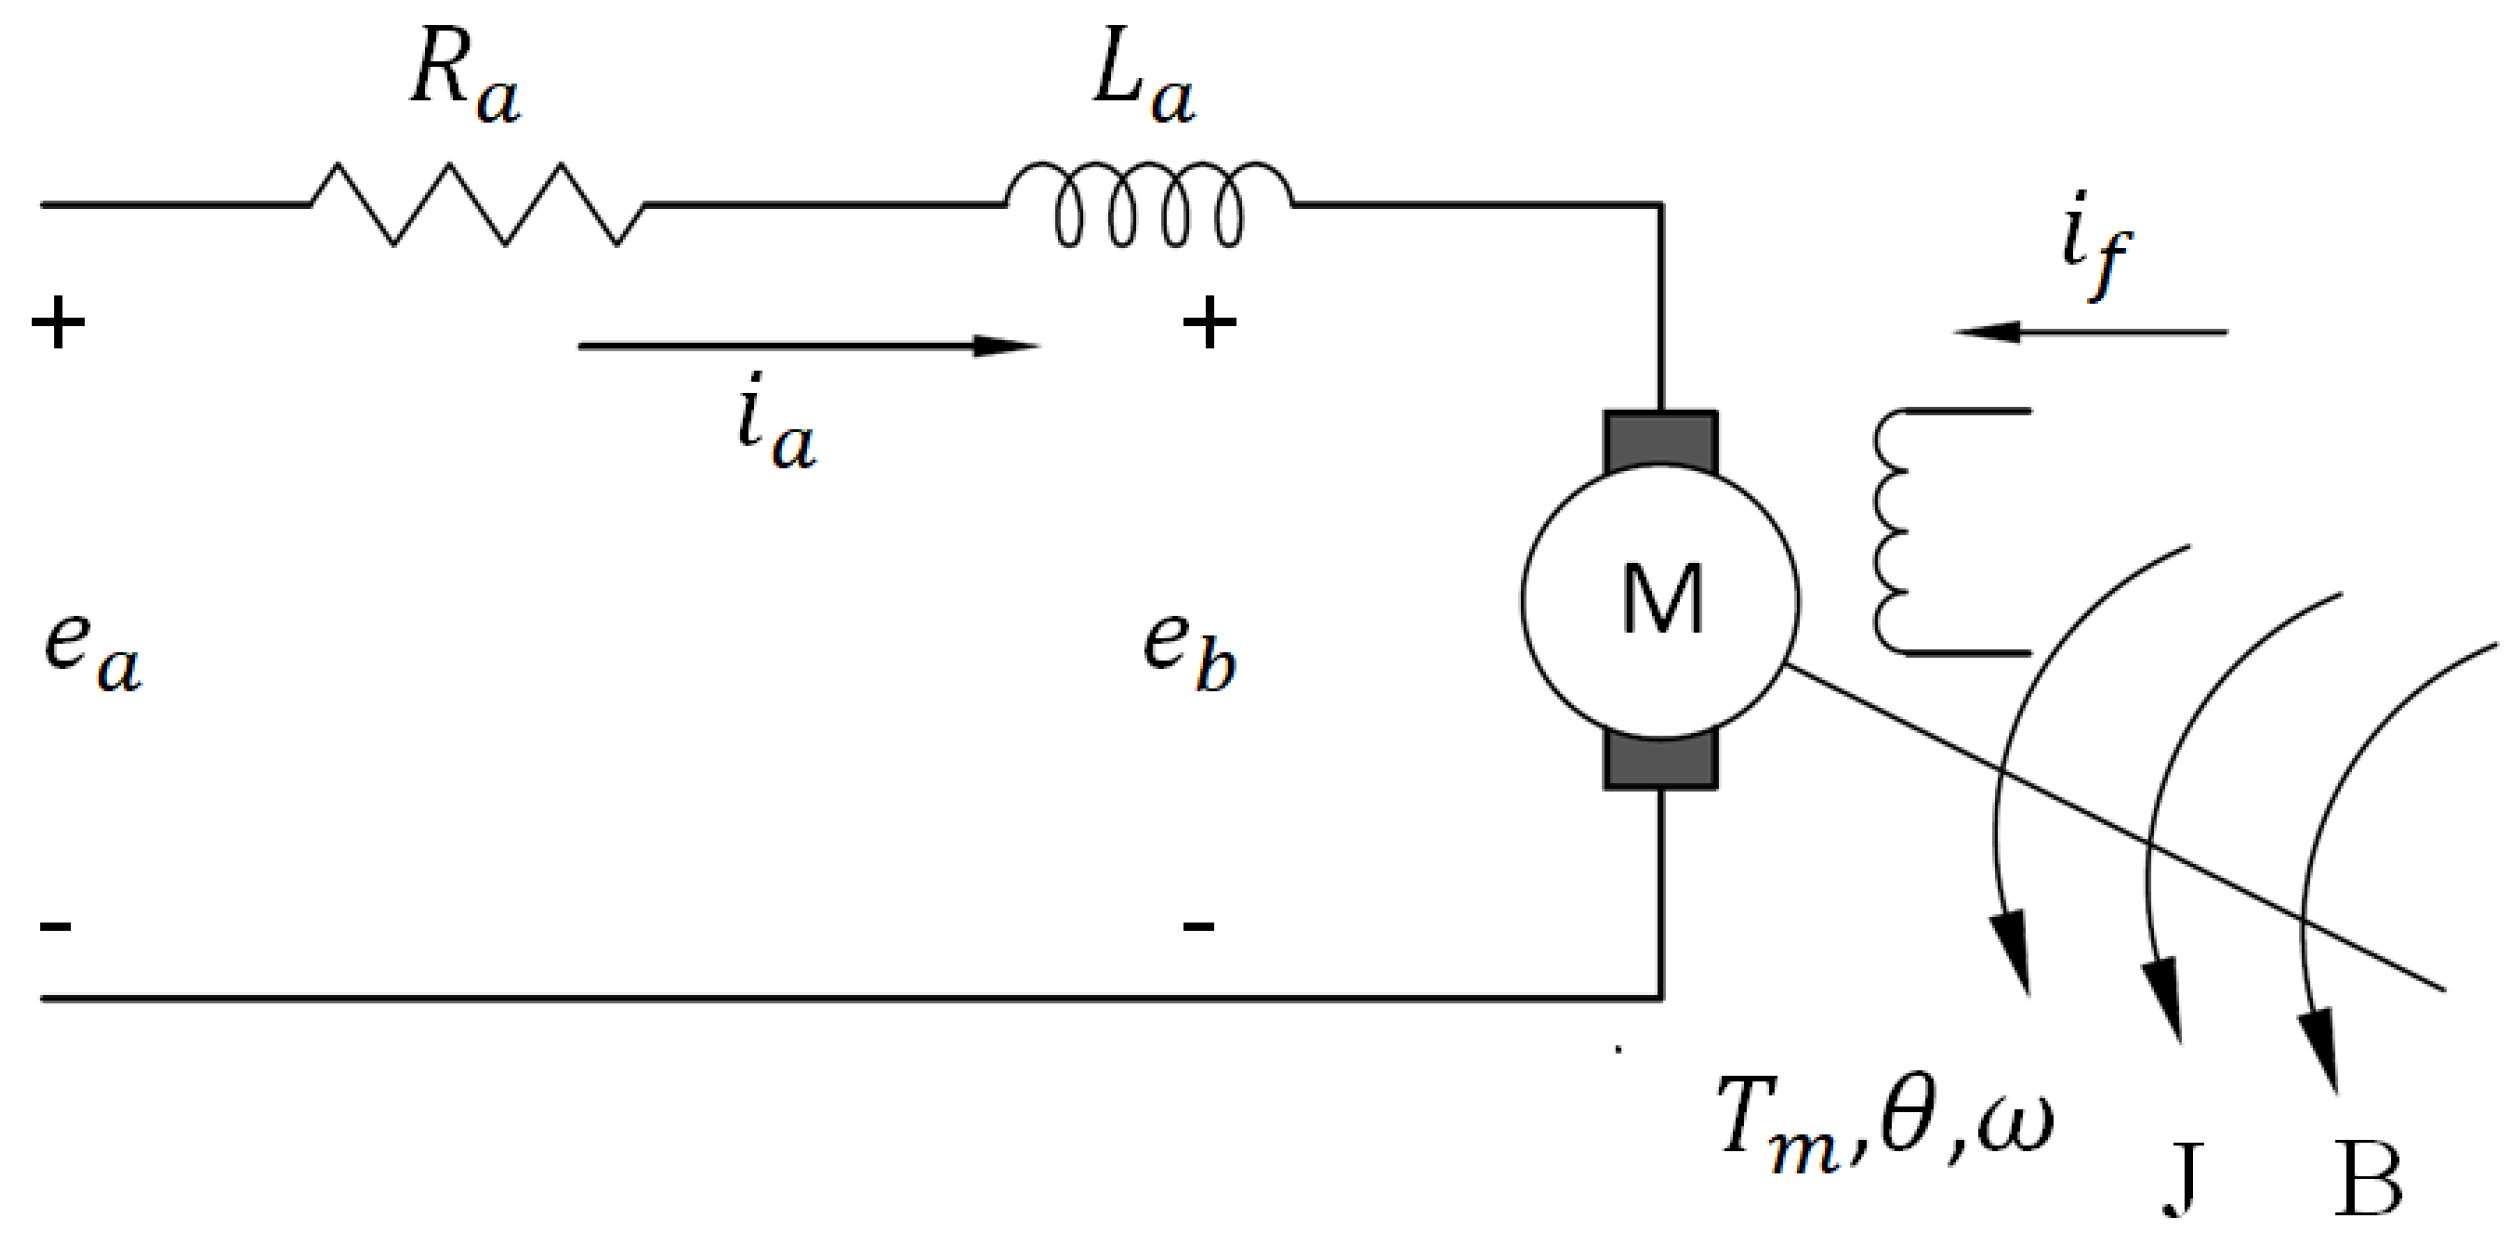
Figure 2 shows the continuous-time electromechanical equations of a separately excited DC motor circuit.
From Figure 2, the electromechanical equations related to excited DC motor circuit was described by:
The electrical variable DC motor is the armature current, and the mechanical variable is speed. The back emf (Ec) is proportional to speed, the produced torque (Te) is proportional to armature current:
By combining Equations (5)–(8), we can obtain Equations (9) and (10), which are the electrical behavior and mechanical behavior, respectively, of the DC motor [23,24].
By combining Equations (4)–(10), the propulsion force can be calculated as follows:
2.2. Electric Motorcycle Performance
The total power is used to help a driver and electric motorcycle overcome air resistance, slope, and rolling friction.
Here, Pair is the consumed power to overcome the air resistance. It can be calculated as the equation below:
The consumed power to overcome the slope resistance (Pslope) can be calculated as the equation below:
The consumed power required to overcome the rolling friction (Pfriction) can be calculated as the equation below:
2.3. Battery Models
The electric motorcycle was equipped with a Li-Ion battery, which was used as the power supply for the DC motor. The Li-Ion battery discharges to transfer energy to the DC motor during electric motorcycle operation. When the Li-Ion battery discharges, the battery voltage can be written as follows [25]:
The transmission ratio of gearbox is presented in the Table 1.
3. Results and Discussion
3.1. Model Validation
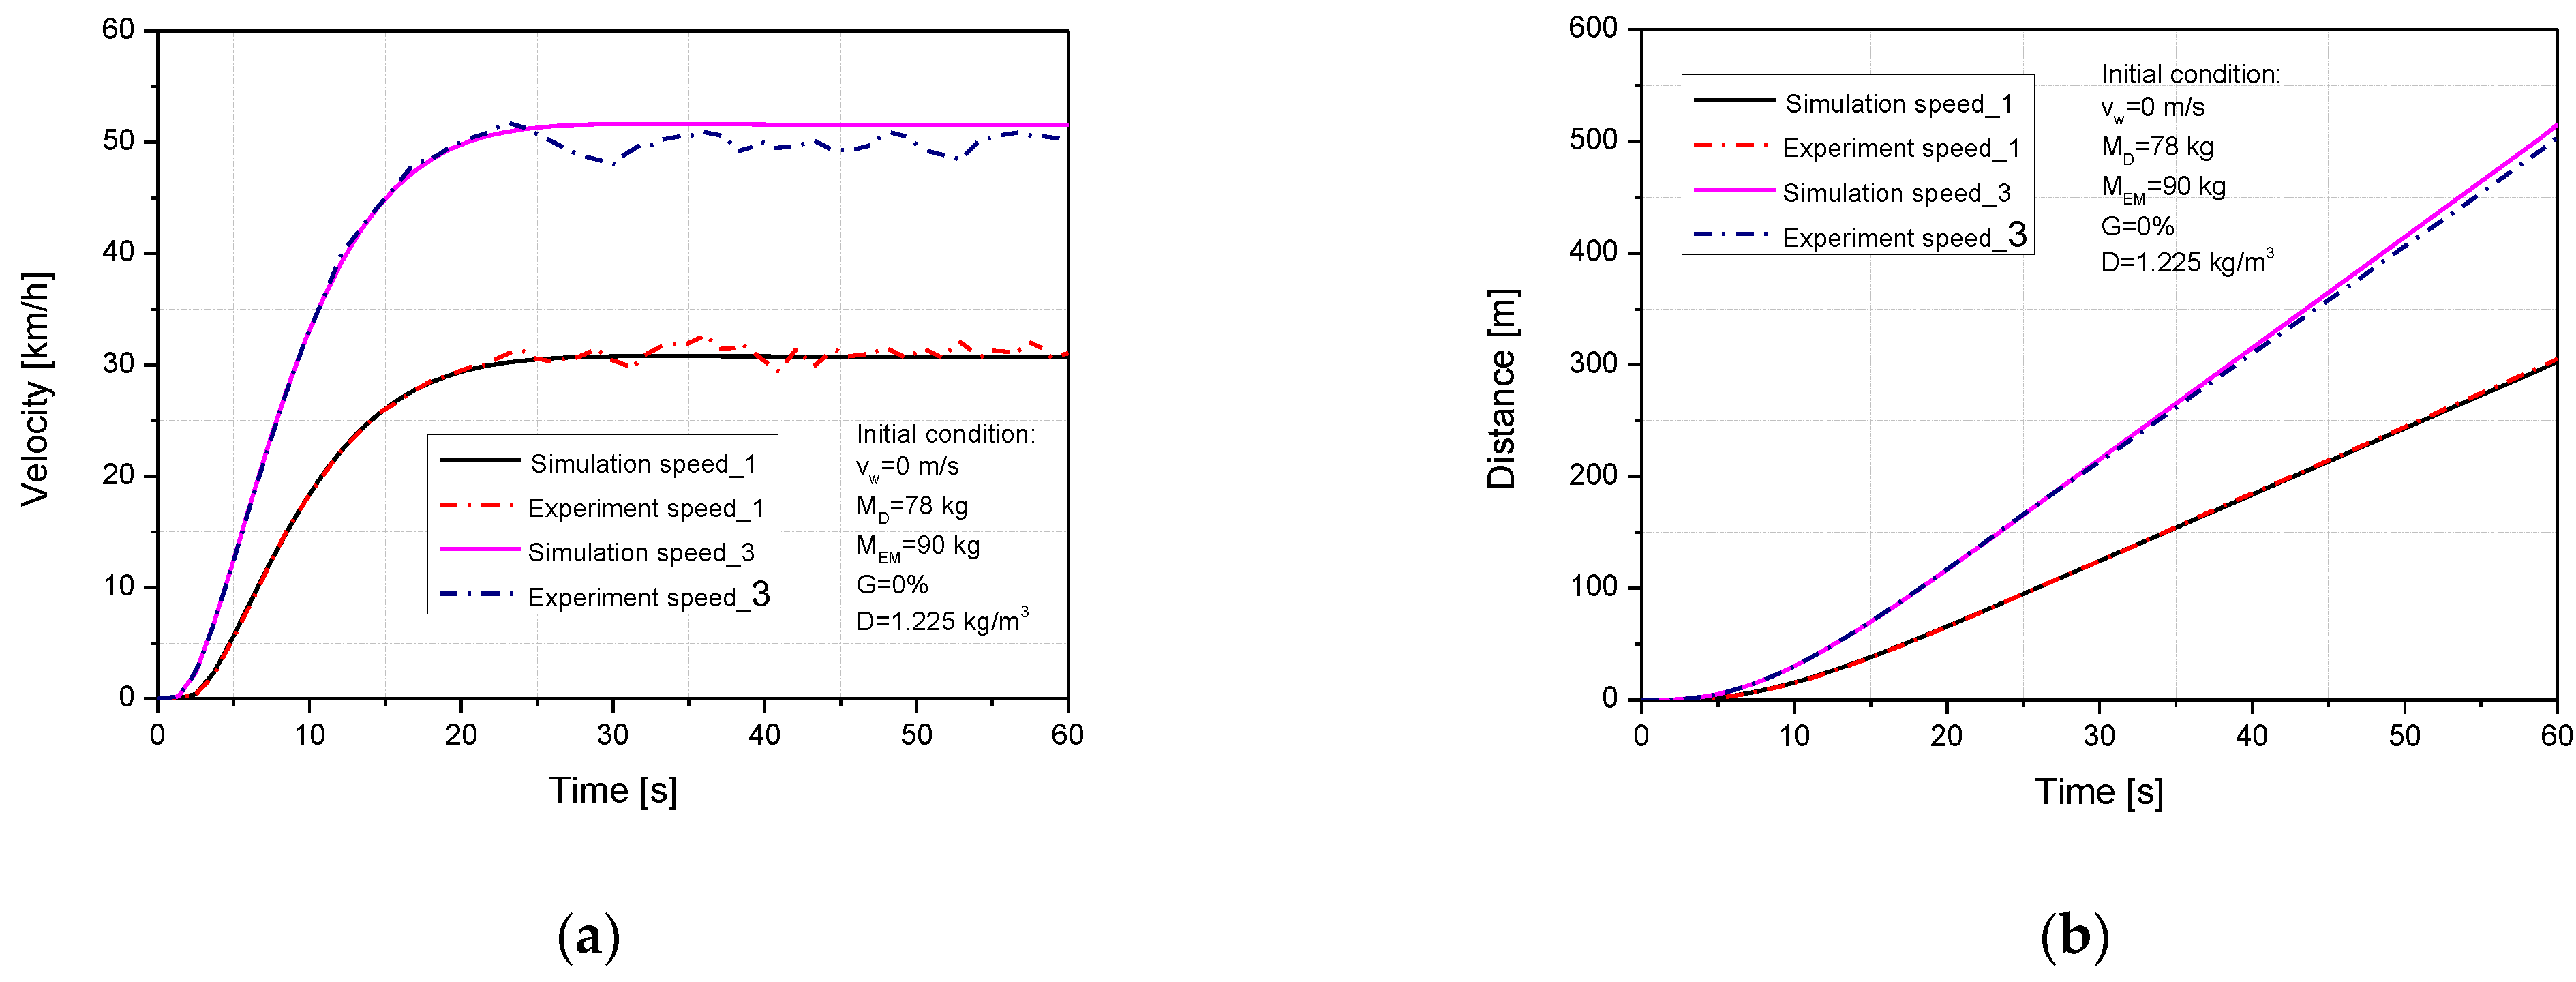
The experiment was conducted on an electric motorcycle with a motor power of 3600 W. The rider to drive the motorcycle had a mass of 78 kg. The experiment was conducted under initial conditions including: a rider mass of MD = 78 kg, a motorcycle mass of MEM = 90 kg, a wind speed Vw = 0 km/h, and a slope ratio of G = 0%. The electric motorcycle was run within 60 s. Figure 3a compares the simulation velocity and experiment velocity. The same trends can be observed in the experimental and simulation. The velocity increased when the transmission ratio increased; the maximum difference of velocity of 7.475 was notified at 28.9 s. Figure 3b shows that the moving distance increased with the increase in transmission ratio. We can see that the simulation and experiment have the same trend when increasing the transmission ratio. The maximum difference between simulation and experiment is 2.27%. The velocity and moving distance are an average of experimental values and are thus acceptable. Based on the comparison between experiments and simulation results, the confidence of the simulation is confirmed, and this simulation model can be used for further study. The experimental system was installed on the motorcycle and includes a photo sensor to detect motion and a computer to collect data through the LabVIEW program, as shown in Figure 4.
3.2. Effect of Electric Motorcycle Mass
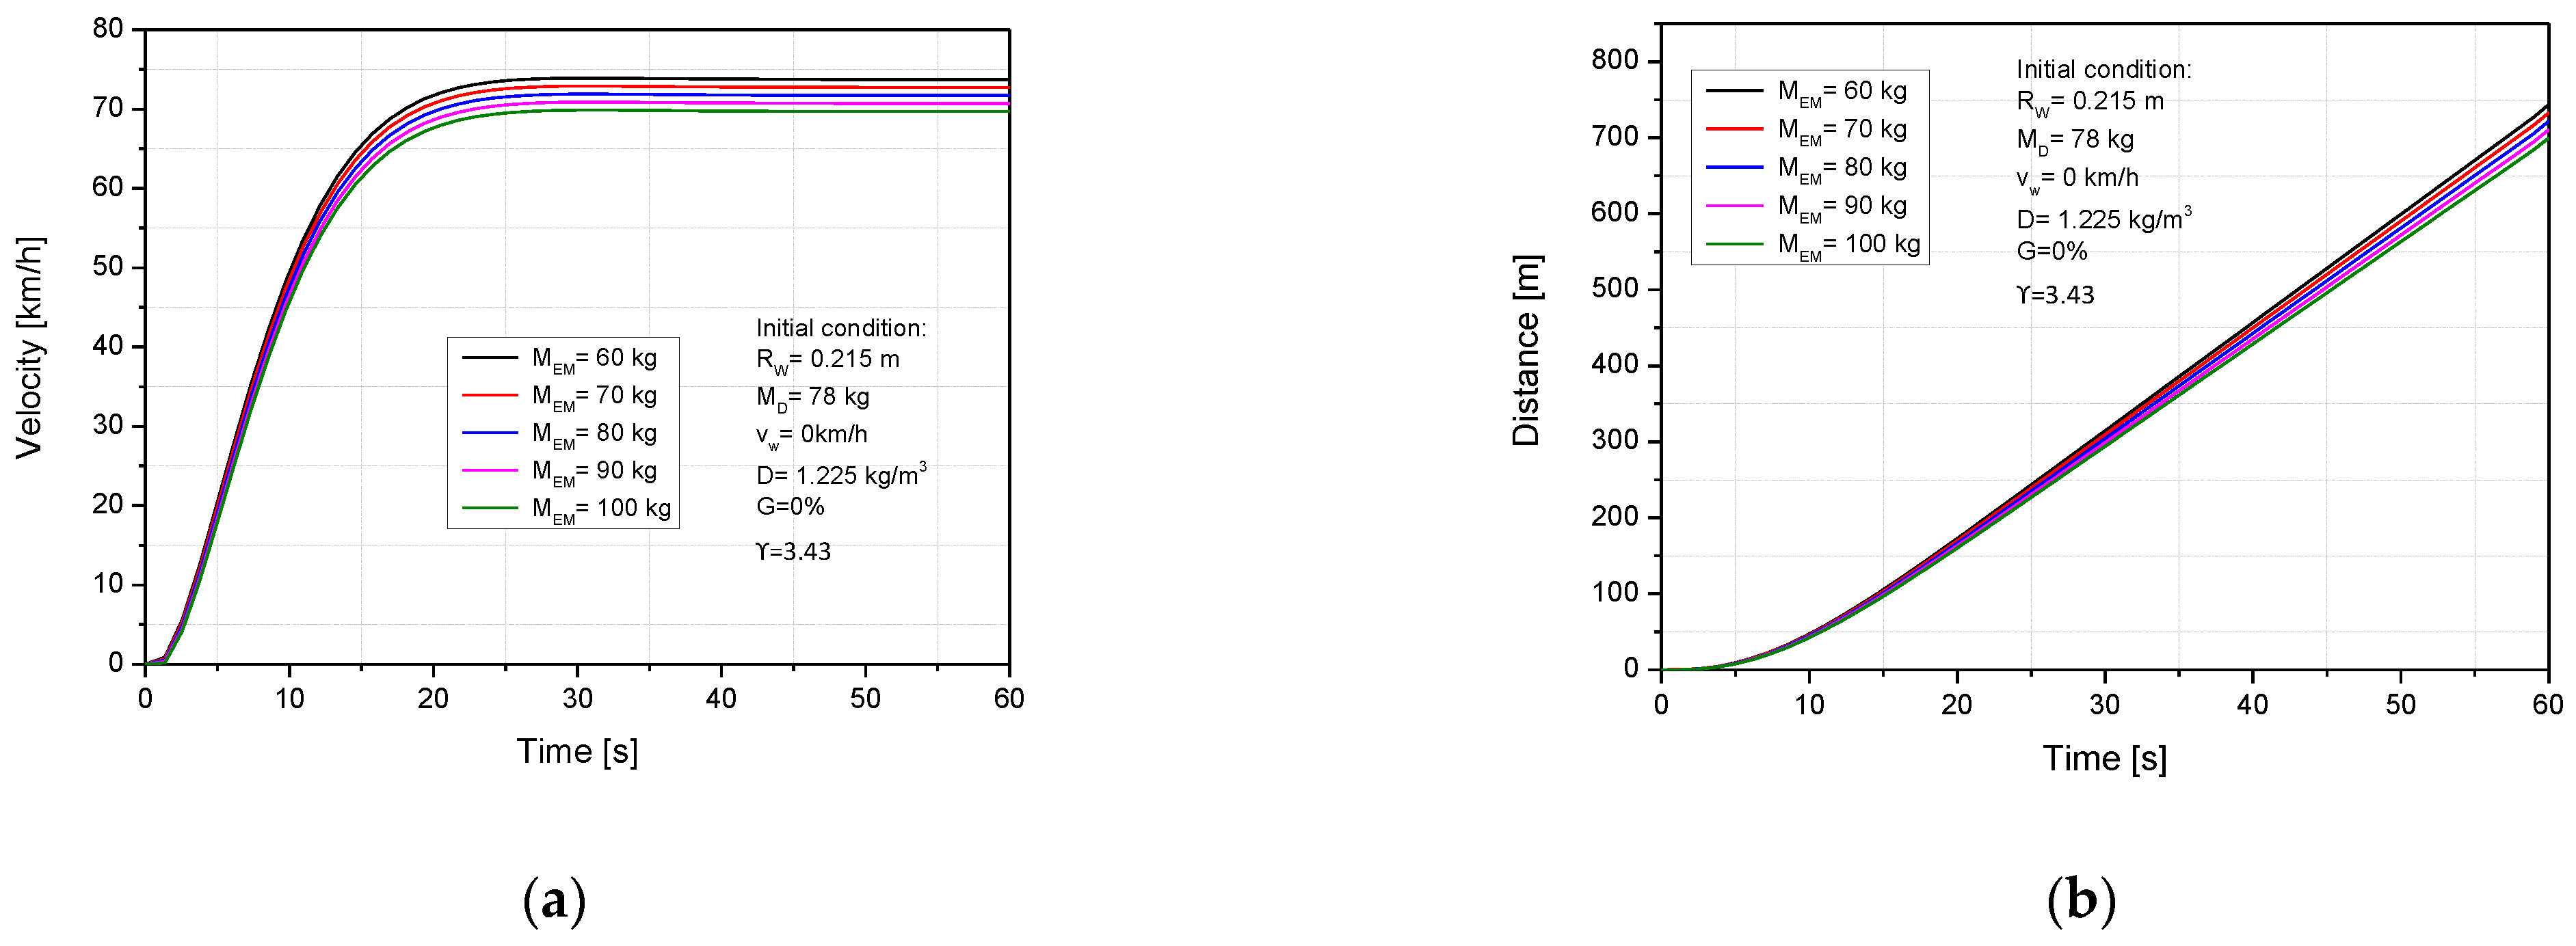
In order to generate data for this research, the simulation was conducted under the initial condition of a 78 kg driver mass, 0.215 m wheel radius, 2.66 transmission ratio, 0 km/h wind speed, and 0% slope ratio, while the electric motorcycle mass was changed from 60 kg to 100 kg. Figure 5a,b show that the velocity and moving distance decreases from 73.73 km/h to 69.71 km/h (5.45%) and from 743.68 m to 699.82 m (5.89%), respectively, when the electric motorcycle mass was increased from 60 kg to 100 kg. This is explained by the increased electric motorcycle mass, which led to an increased rolling resistance force. The wind resistance force and slope resistance force are constant, so the total resistance force is increased, and this led to the velocity and moving distance decrease.
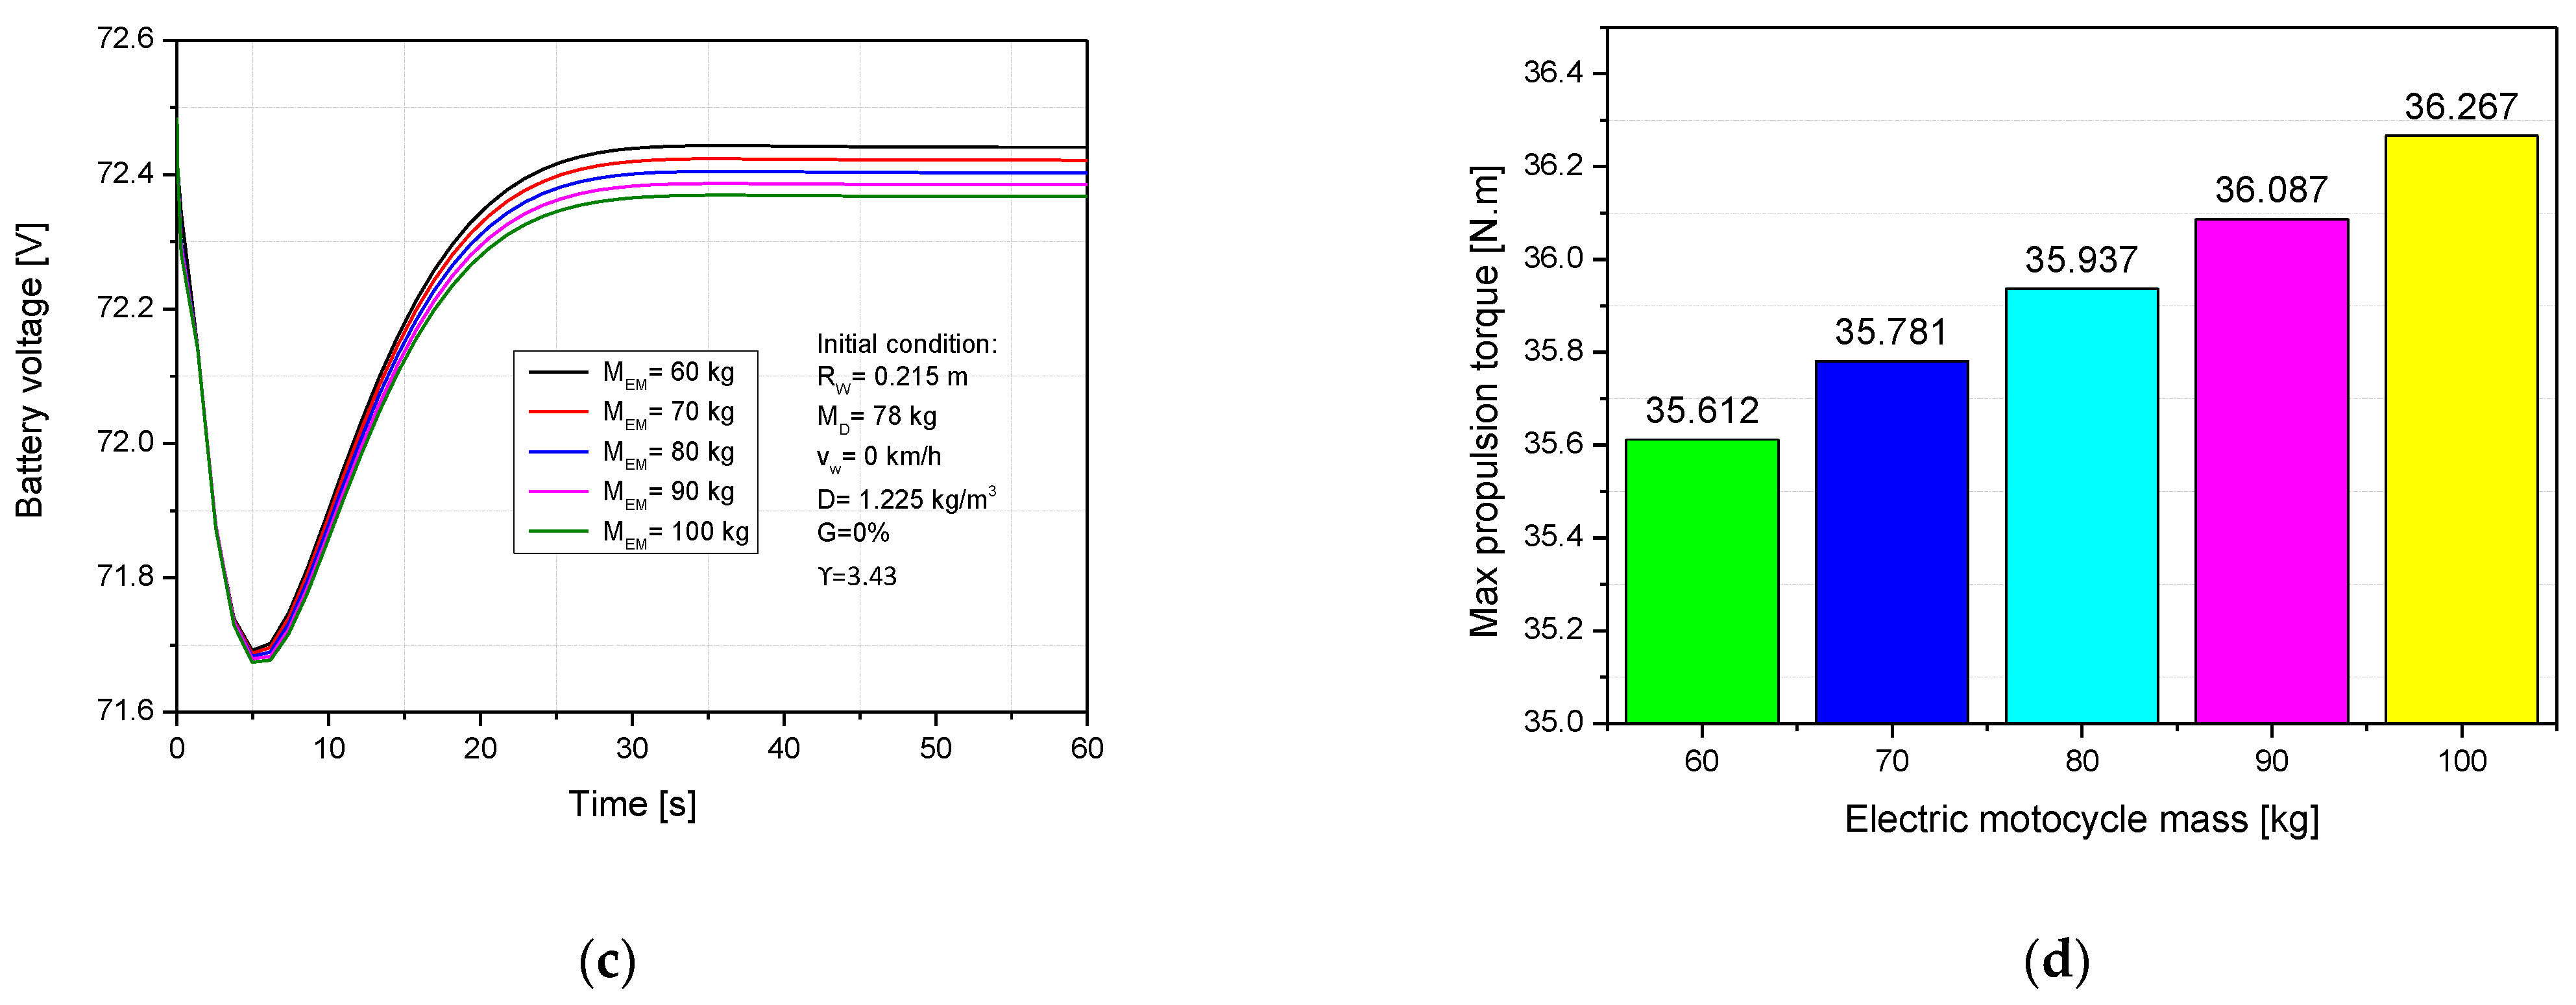
Figure 5c shows the effect of the electric motorcycle mass on electricity consumption. The electric consumption increased by 0.11% when the electric motorcycle mass was adjusted from 60 kg to 100 kg. Furthermore, the propulsion torque increased from 35.612 N.m to 36.267 N.m, as shown in Figure 5d. This can be explained by the increased electric motorcycle mass leading to an increase in rolling resistance force. This caused the total resistance force to increase, so the load to the motor increased. This explains the increase in electricity consumption and propulsion torque.
3.3. Effect of Driver Mass
To generate data for this research, the diver mass was increased from 48 kg to 88 kg, while the other input parameters were kept constant, including 90 kg electric motorcycle mass, 0.215 m wheel radius, 0% slope ratio, 2.66 transmission ratio, and 0 km/h wind speed. Figure 6a,b presents the effect of driver mass on the velocity and moving distance. Here, the driver mass rose from 48 kg to 88 kg, and the velocity and moving distance decreased from 73.73 km/h to 69.71 km/h (5.45%) and from 743.68 m to 699.82 m (5.89%), respectively. The increased driver mass led to an increased rolling resistance force requiring increased motor load. The wind resistance force and slope resistance are constant, so the total resistance force increased, thereby it reduced the velocity and moving distance.
Figure 6c shows the effect of driver mass on electricity consumption. Electricity consumption increased by 0.11% when the driver mass was changed from 48 kg to 88 kg. Besides that, the propulsion torque increased from 35.621 N.m to 36.267 N.m with the same initial condition. This could be explained by the increase in rolling resistance force leading to an increased motor load; hence the energy demand for the motor also increases. This is why the velocity and moving distance decreased.
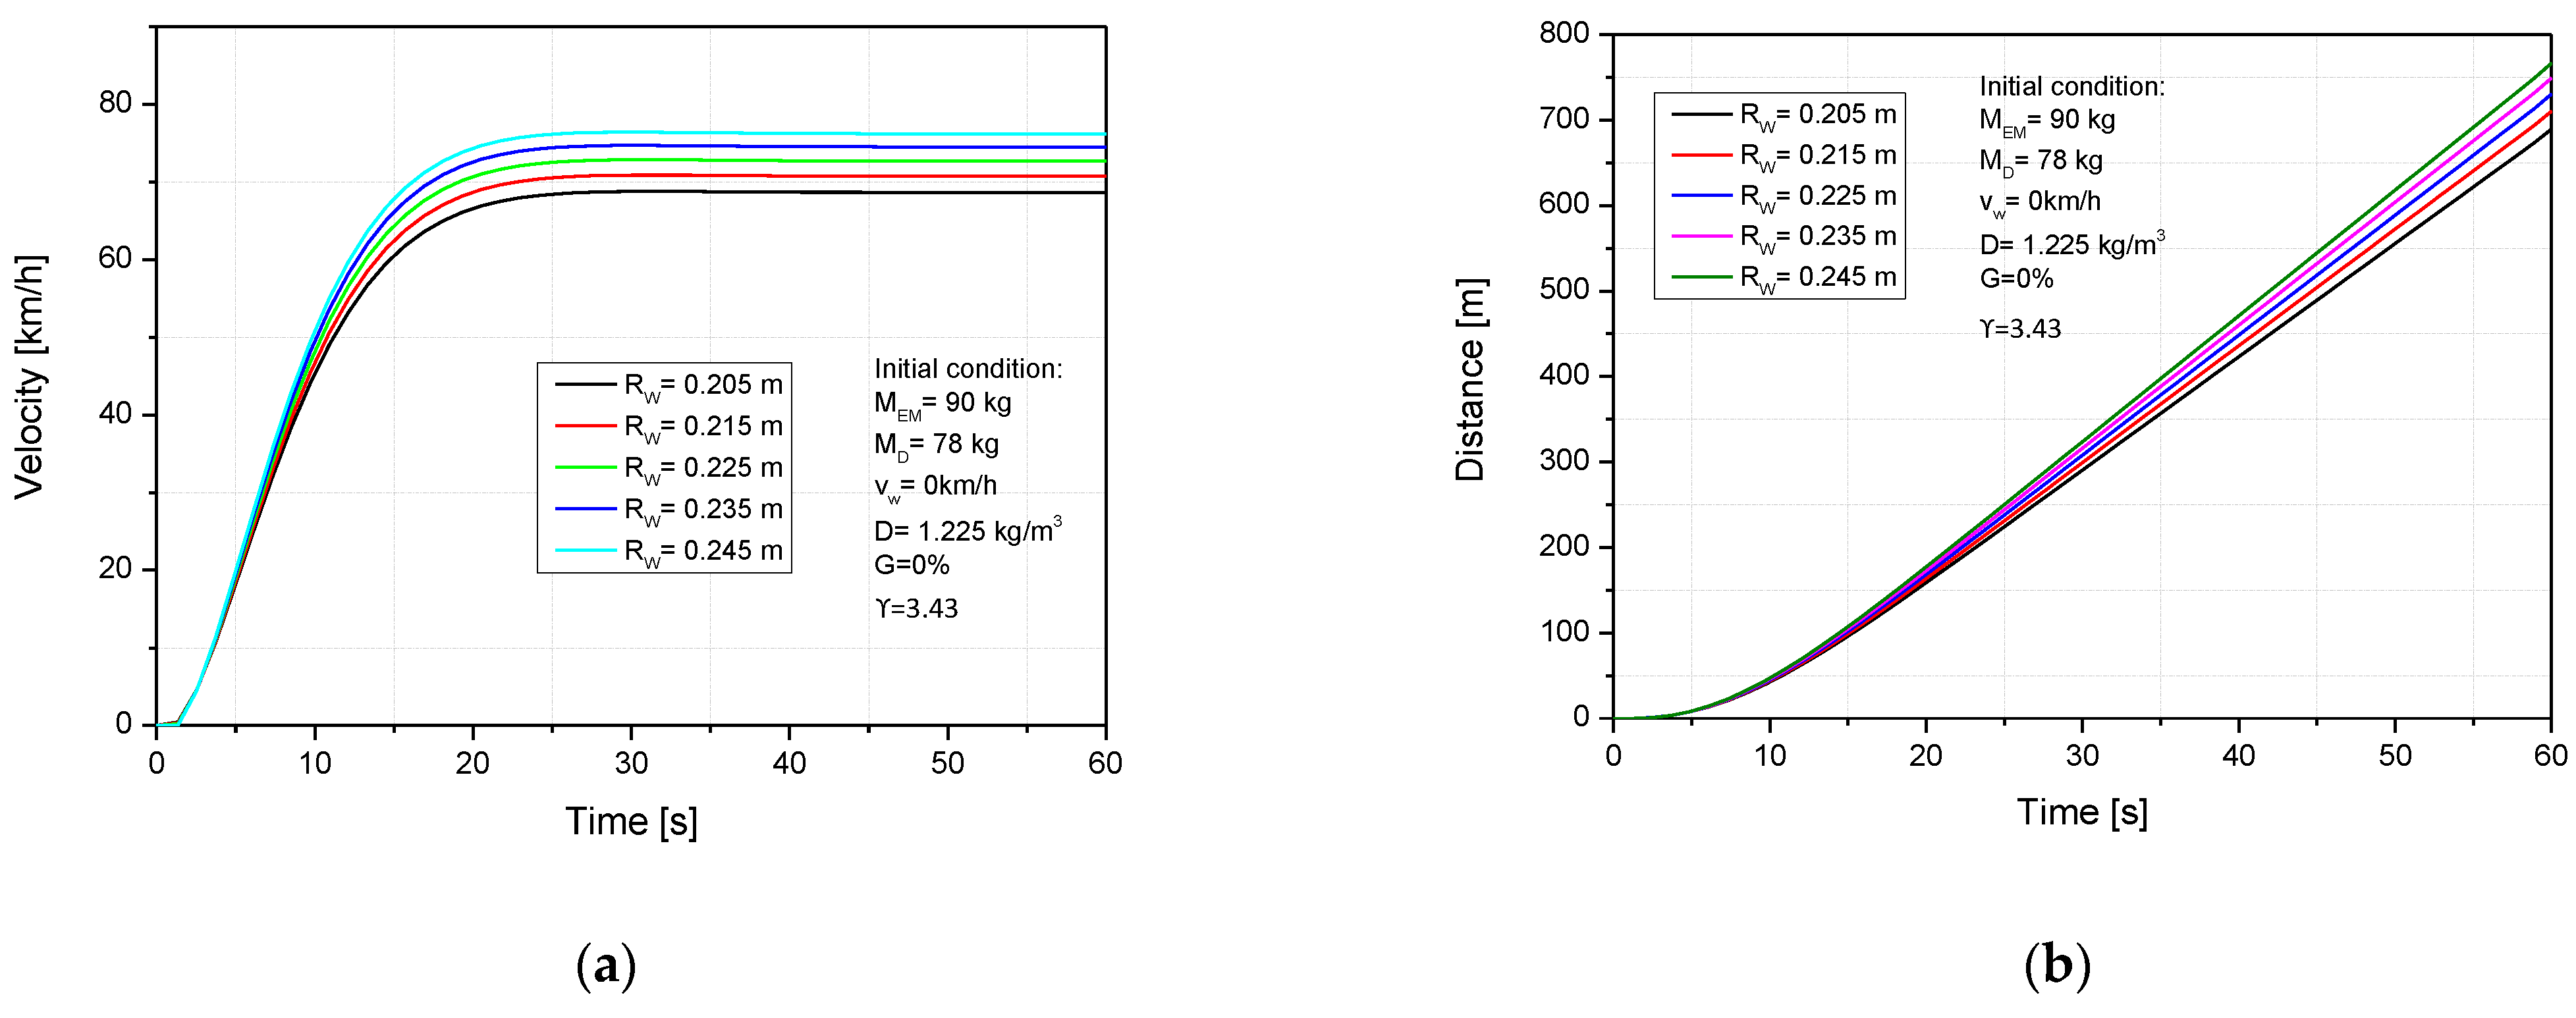
3.4. Effect of Wheel Radius
One of the structural parameters that directly affects the electric motorcycle dynamic is the wheel radius. To understand its effects on the dynamic and power consumption of an electric motorcycle, the simulation was conducted under the initial condition of a 90 kg electric motorcycle mass, 78 kg driver mass, 0 km/h wind speed, 2.66 transmission ratio, and 0% slope ratio, while the wheel radius was varied. Figure 7a,b show that the velocity and moving distance increased from 68.62 km/h to 76.2 km/h (11%) and from 689.47 m to 766.75 m (11.2%), respectively, when the wheel radius was increased from 0.205 m to 0.245 m. This can be explained by increasing the wheel radius, which led to an increase in the rotational inertial. Furthermore, power consumption was increased by 0.11%, and the propulsion torque increased from 35.769 N.m to 36.51 N.m. The increased wheel radius led to an increase in rotational inertial, so the energy demand for the motor increased. This is why electric consumption is increased.
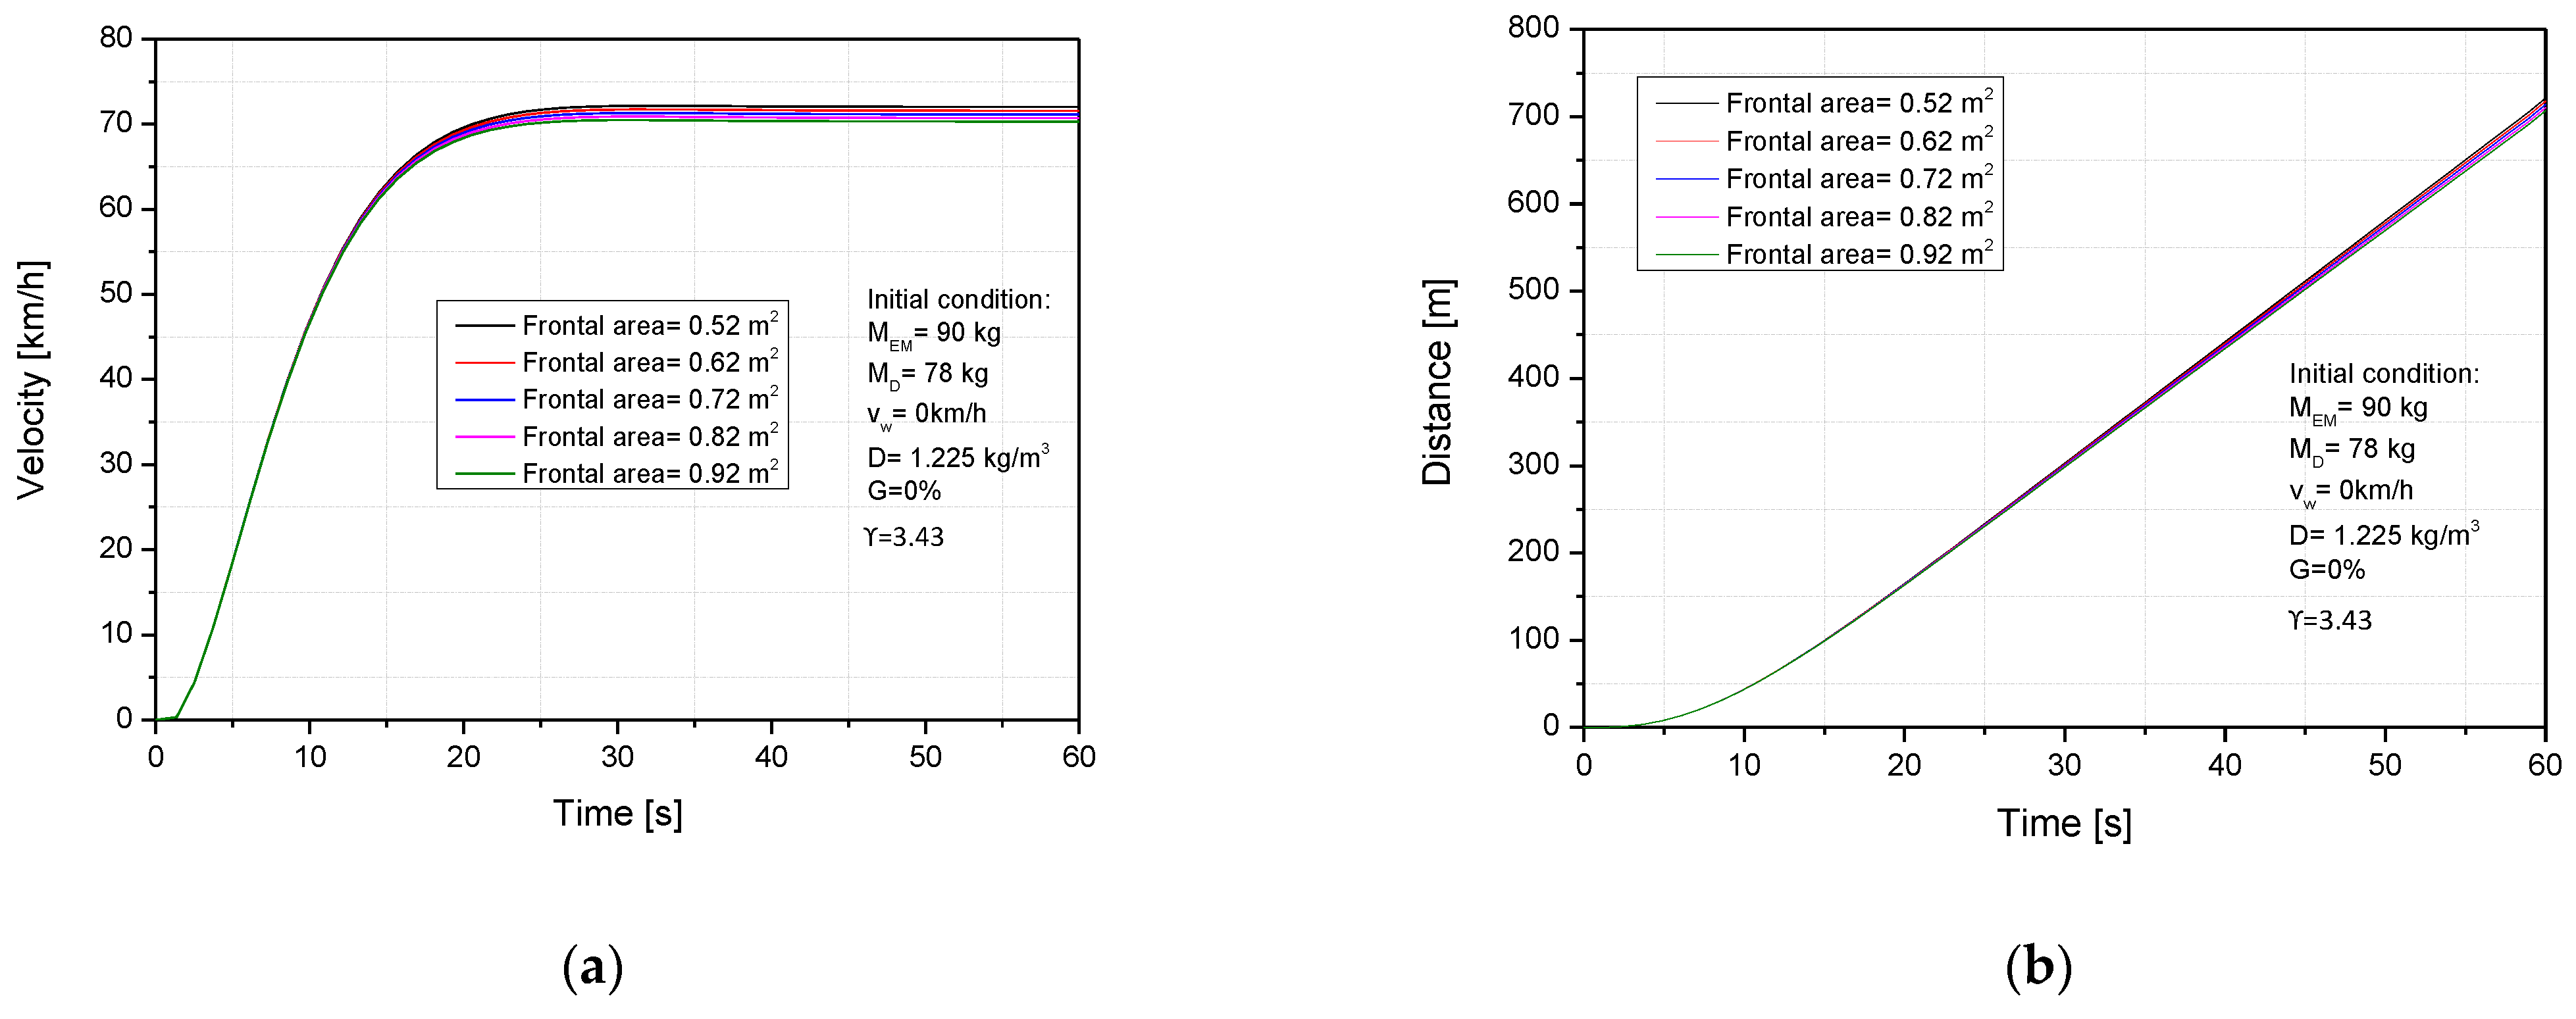
3.5. Effect of Frontal Area
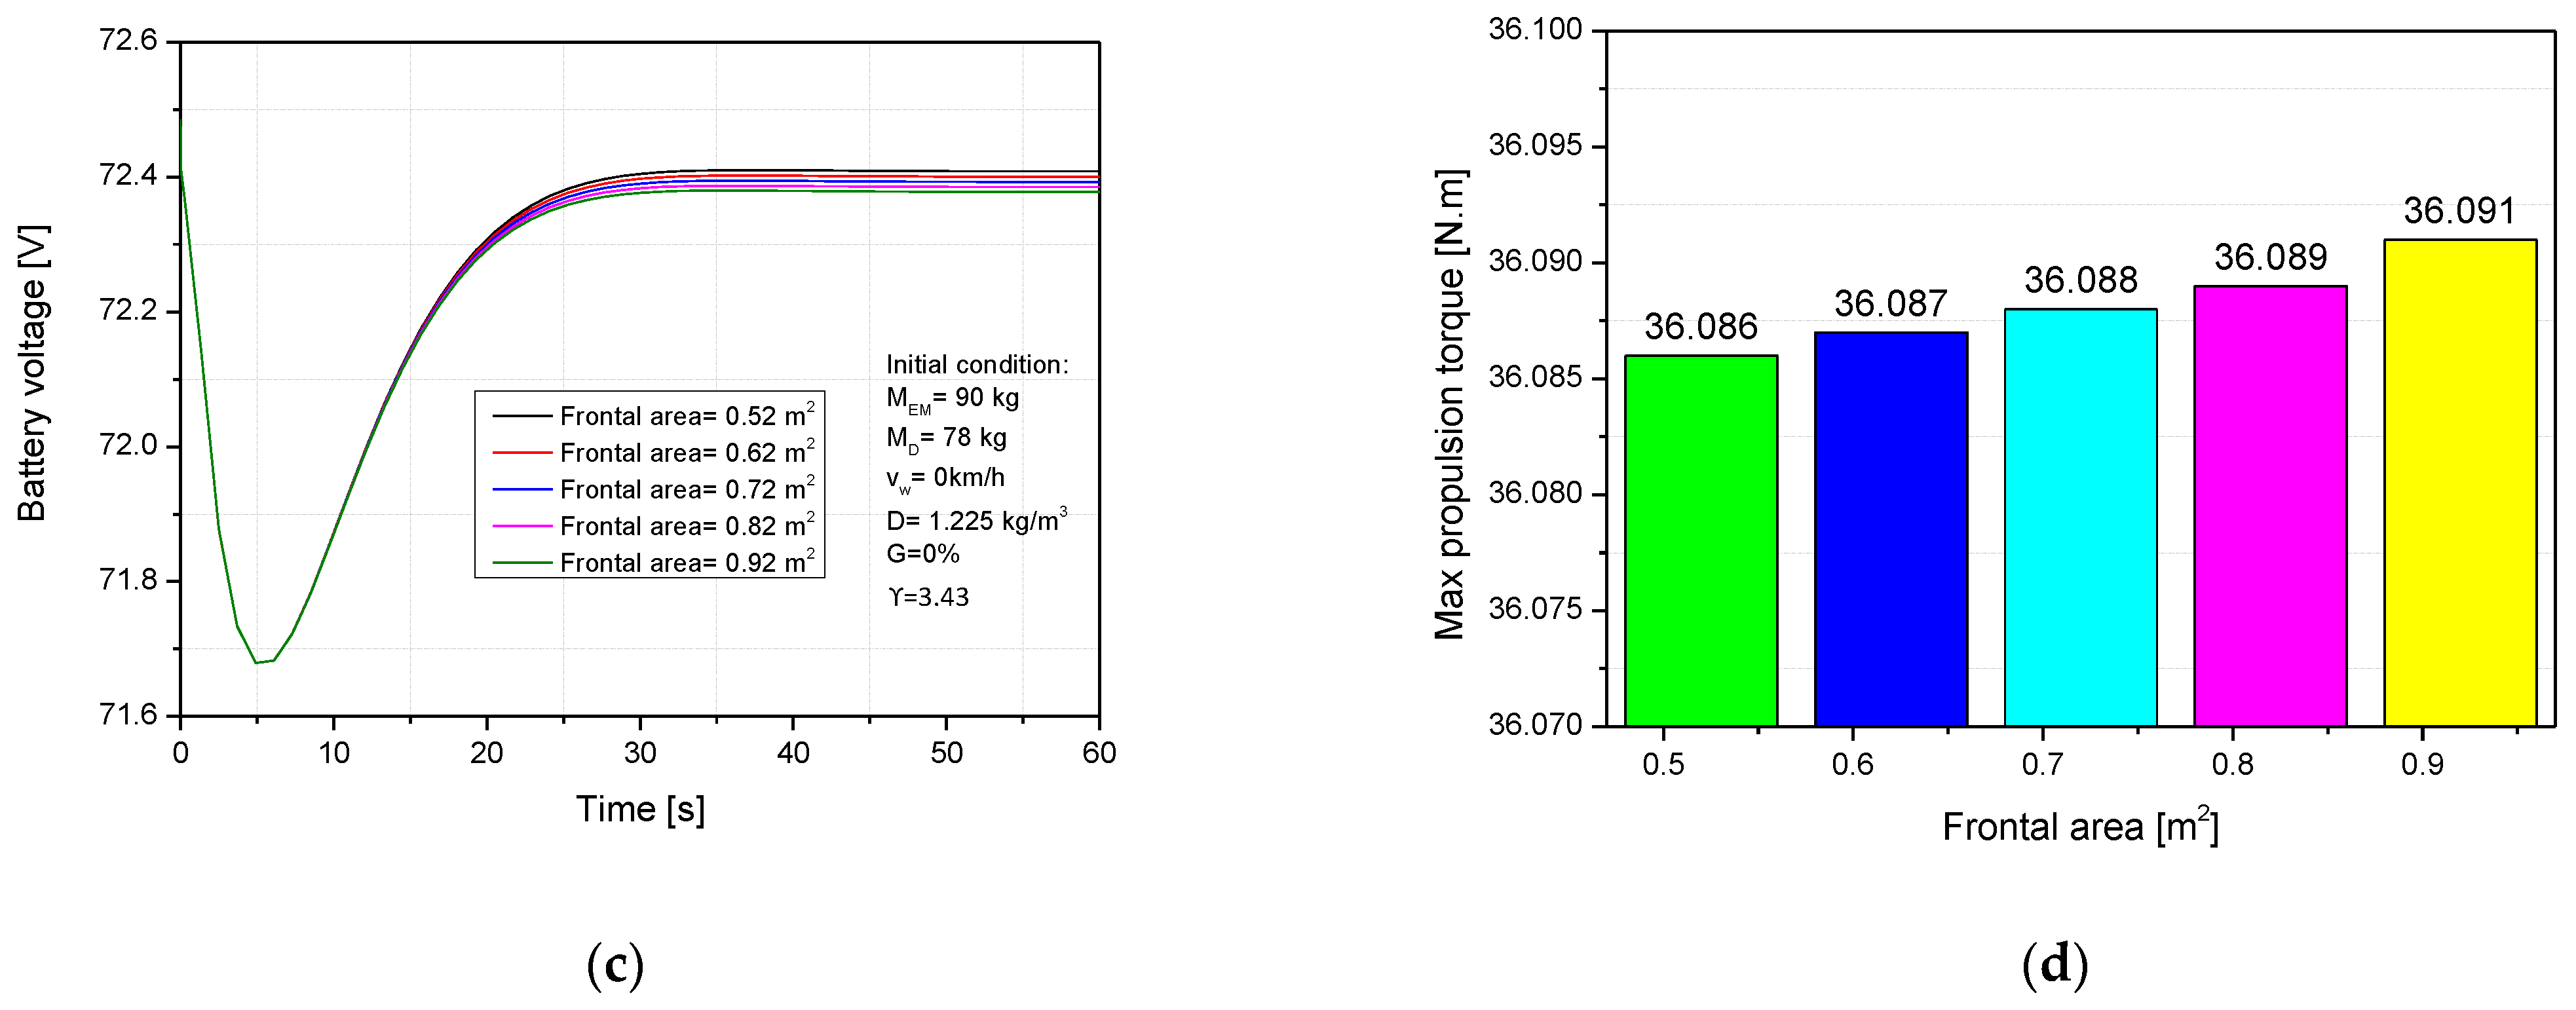
The frontal area directly affects the dynamic and electric consumption characteristics of an electric motorcycle. The effect of the frontal area on the velocity, moving distance, power consumption, and propulsion torque are presented in Figure 8a–d. The frontal area was varied from 0.52 m2 to 0.92 m2, while other parameters were kept constant (Mr = 78 kg, MEM = 90 kg, vw = 0 km/h, G = 0%, γ = 2.66). As shown in Figure 8a,b, the velocity and moving distance decreased when the frontal area increased. This is because the increased frontal area led to an increase in the wind resistance force. While the rolling resistance and slope resistance force are constant, so the total resistance force was increased. This explains why the velocity and moving distance decreased. As a result, when the frontal area rose from 0.52 m2 to 0.92 m2, the velocity and moving distance decreased from 72.01 km/h to 70.3 km/h (2.43%) and from 721.47 m to 706.9 m (2.06%), respectively.
Figure 8c,d presents the effect of frontal area on electric consumption and propulsion torque. It can be observed that when the frontal area rose from 0.52 m2 to 0.92 m2, the electricity consumption increased by 0.04%, and propulsion torque increased from 36.08 N.m to 36.09 N.m. This observation can be explained by the increased wind resistance force leading to greater motor torque; thus, the battery voltage decreases with the increasing frontal area, as shown in Figure 8c.
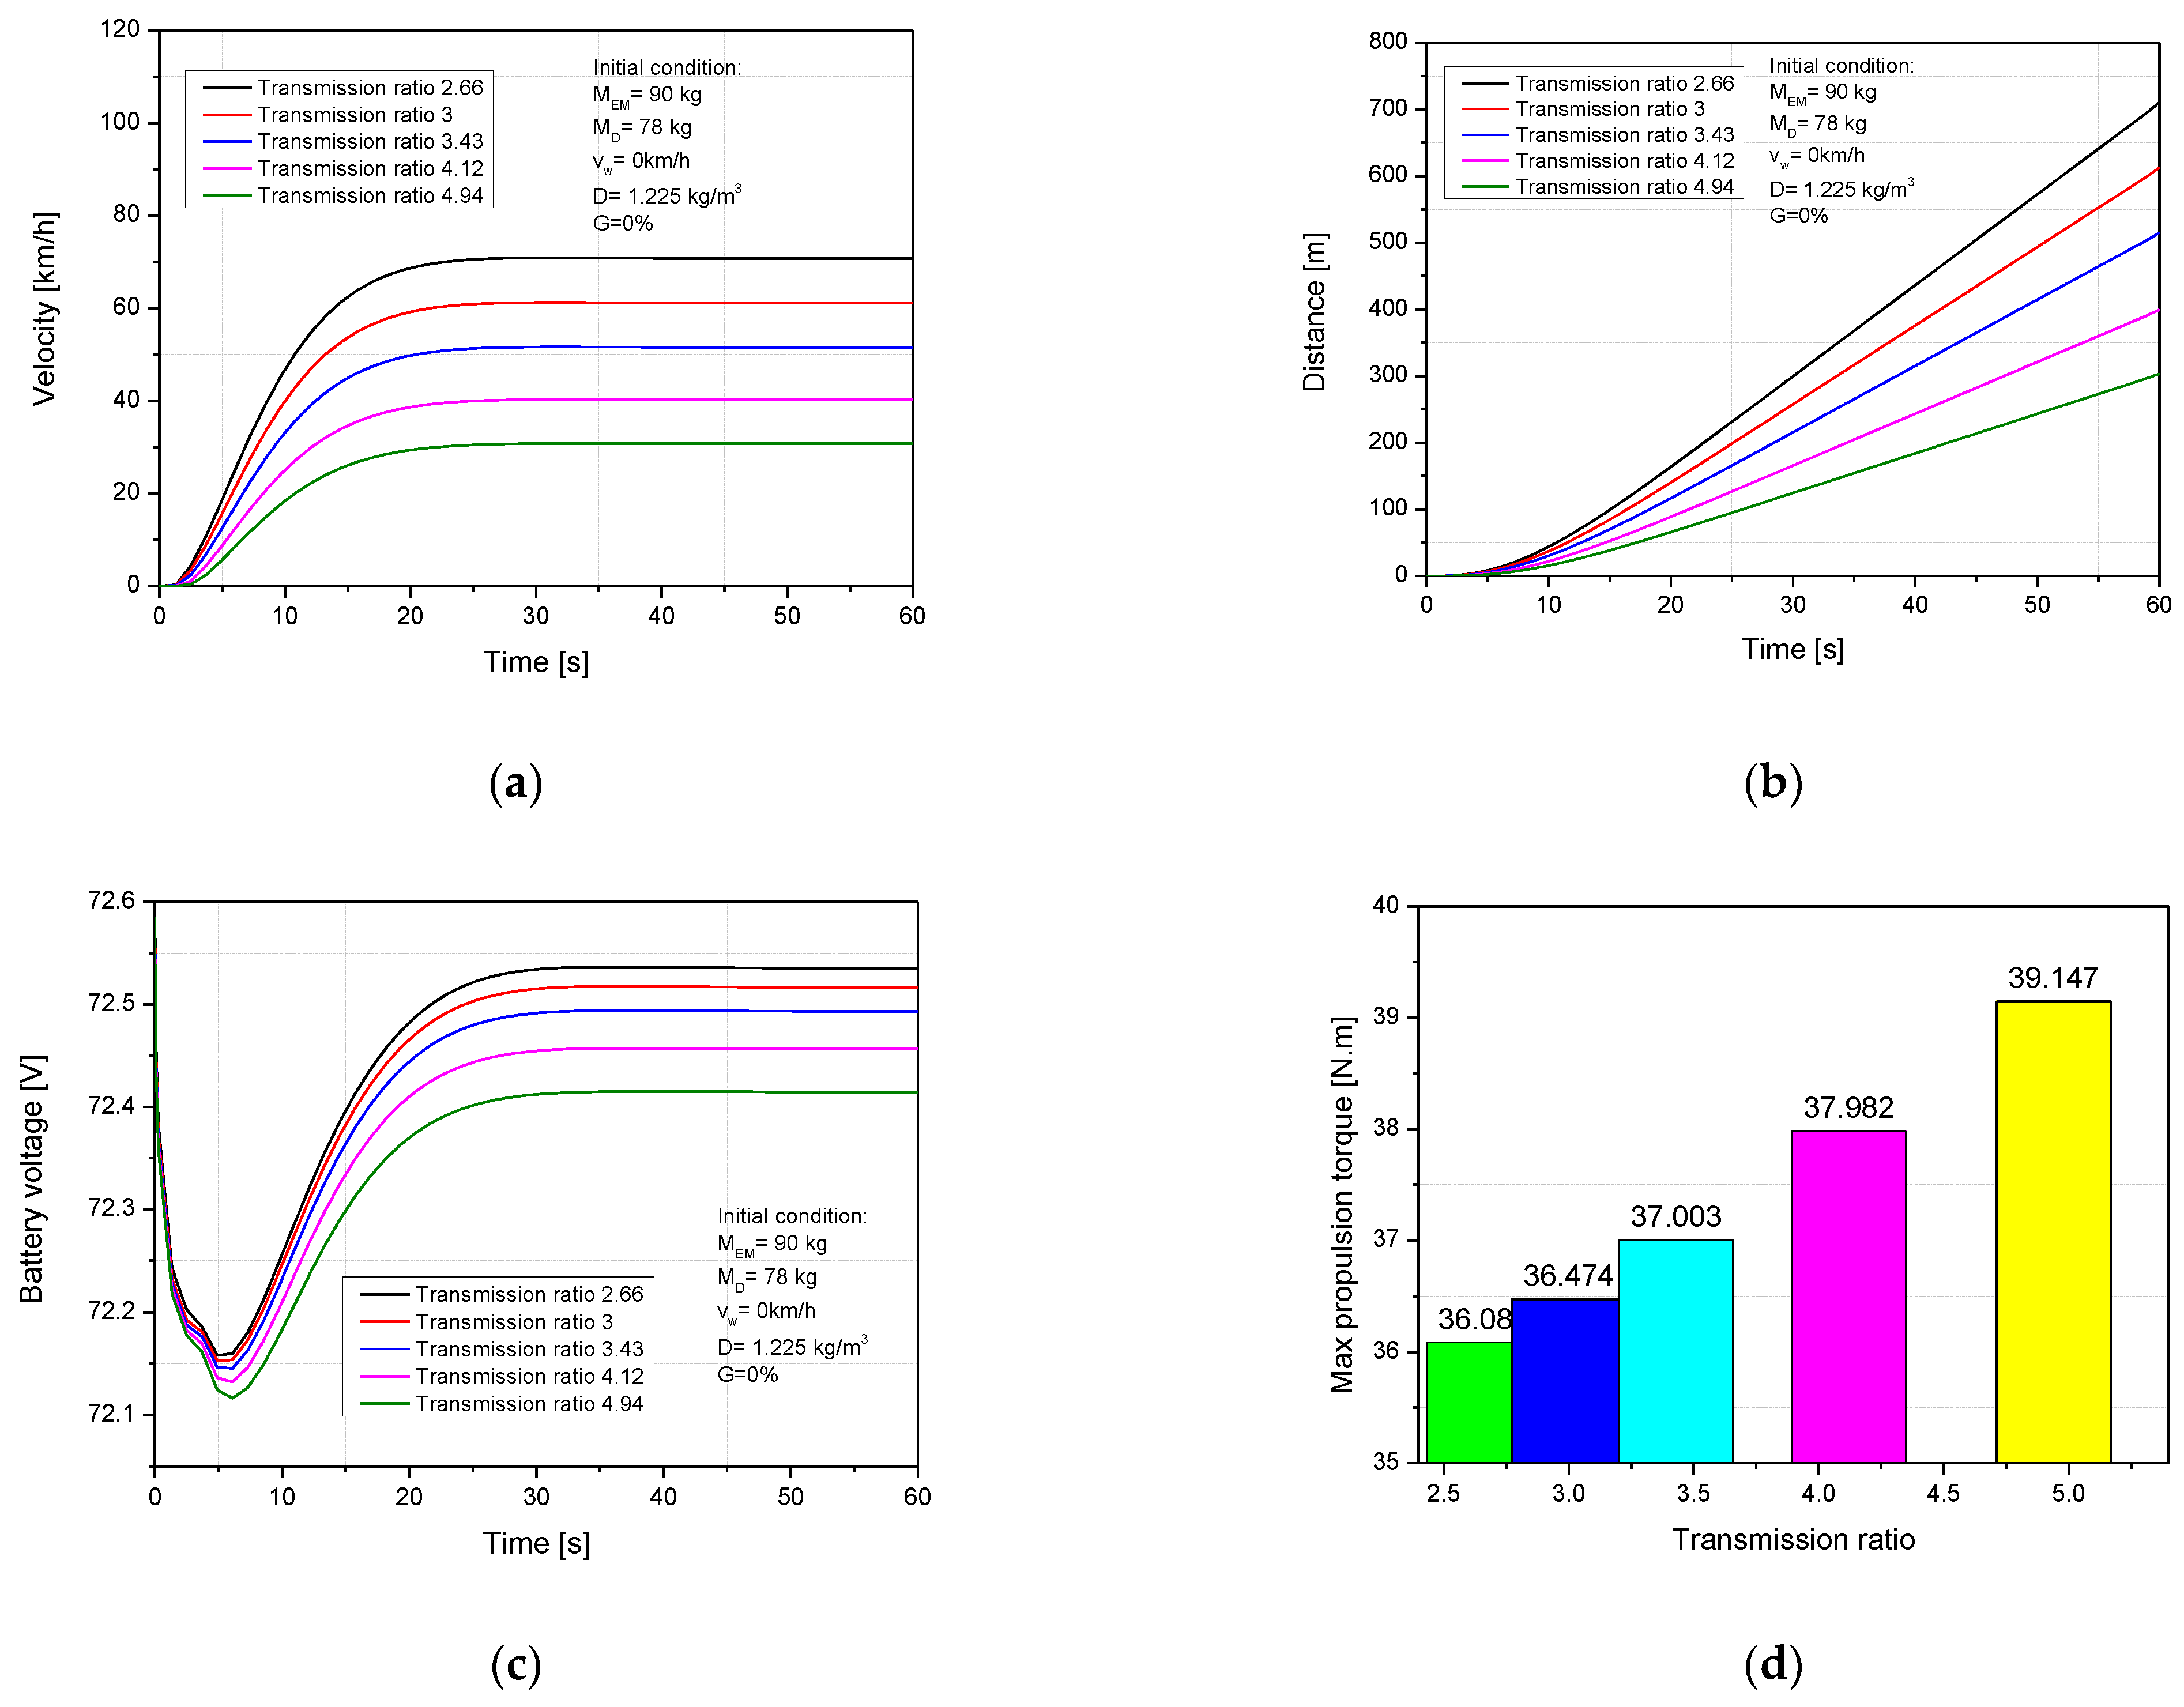
3.6. Effect of Transmission Ratio
Figure 9 shows the simulation results for the velocity, moving distance, power consumption, and propulsion torque as functions of transmission ratio. The simulation conditions included: driver mass of 78 kg, electric motorcycle mass of 90 kg, wheel radius of 0.215 m, wind speed 0 km/h, and a slope of 0%.
Figure 9a,b show the effect of transmission ratio on the velocity and moving distance. When the increasing transmission ratio, the velocity and moving distance decreases. The maximum velocity and moving distance at a transmission ratio of 2.66 were 70.7 km/h and 710.44 m, while the maximum velocity and moving distance at a transmission ratio of 4.94 were 30.74 km/h and 303.12 m, respectively. This can be explained by its relationship with the propulsion force; the increase in propulsion force led to an increase in the velocity of an electric motorcycle. Figure 9c presents the effect of the transmission ratio on electricity consumption. By increasing of transmission ratio from 2.66 to 4.94, the electricity consumption increased by 0.16%. The increased transmission ratio led to an increase in required propulsion torque, and velocity led to an increased load on the motor, so the energy demand for the motor is high, thereby increasing electricity consumption.
4. Conclusions
The operation of an electric motorcycle was modeled and simulated based on the dynamic DC motor and battery model resolved by a written program in MATLAB-Simulink. The effect of input parameters, such as electric motorcycle mass, driver mass, wheel radius, frontal area, and transmission ratio on electric motorcycle dynamics and electric consumption, were investigated. The study results showed that the dynamic performance and electricity consumption of an electric motorcycle could be optimized by adjusting input parameters.
The study results are summarized below:
- When the electric motorcycle mass was increased from 60 kg to 100 kg, the maximum velocity decreased from 73.73 km/h to 69.71 km/h (5.45%), the moving distance was reduced from 743.68 m to 699.82 m (5.89%), and electricity consumption increased by 0.11%, respectively;
- Following an increased driver mass from 48 kg to 88 kg, the velocity and moving distance decreased from 73.73 km/h to 69.71 km/h (5.45%) and from 743.68 m to 699.82 m (5.89%), respectively, while electricity consumption increased by 0.11%;
- When the wheel radius was changed from 0.205 m to 0.245m, the maximum velocity increased from 68.62 km/h to 76.2 km/h (11%), the moving distance increased from 689.47 m to 766.75 m (11.2%), and electricity consumption increased by 0.11%;
- When the frontal area was increased from 0.52 m2 to 0.92 m2, the velocity and moving distance decreased from 72.01 km/h to 70.3 km/h (2.43%), and from 721.47 m to 706.9 (2.06%), respectively, electricity consumption increased;
- When the transmission ratio was increased from 2.66 to 4.94, the velocity and moving distance increased from 30.74 km/h to 70.7 km/h, and from 303.12 m to 710.44 m, respectively, the electric consumption increased by 0.16%.
Author Contributions
Conceptualization, L.-T.H. and N.X.K.; methodology, L.-T.H. and N.X.K.; software, L.-T.H.; validation, L.-T.H. and N.X.K. formal analysis, L.-T.H.; investigation, N.X.K.; resources, L.-T.H.; data curation, L.-T.H.; writing—original draft preparation, L.-T.H.; writing—review and editing, L.-T.H. and N.X.K.; supervision, O.L.; project administration, O.L. All authors have read and agreed to the published version of the manuscript.
Funding
This work was supported by Upbringing Business with Innovative Urban Public Institutions by the Ministry of Trade, Industry and Energy (MOTIE, Korea) [Project Name: Establishment of Battery/Ess-Based Energy Industry Innovation Ecosystem].
Data Availability Statement
Not applicable.
Conflicts of Interest
The authors declare no conflict of interest.
Nomenclature
| M | Total mass including driver and electric motorcycle mass (kg) |
| Cs | Slope resistance coefficient (Cs = sin(α)), |
| Afa | Frontal area (m2) |
| Ca | Aerodynamic drag coefficient |
| Air density, kg/m3 | |
| vw | Velocity of wind, km/h |
| vEM | Electric motorcycle velocity, km/h |
| g | Gravitational of Earth, m/s2 |
| Crr | Rolling resistance coefficient |
| x | Moving distance (m) |
| a | The acceleration (m/s2) |
| Rw | Wheel radius (m) |
| Transmission ratio | |
| Tm | The motor torque (N.m) |
| La | The motor inductance (H) |
| I | The motor current (A) |
| t | The time (s) |
| Ra | The motor electrical resistance |
| Kb | The back-emf constant |
| wm | The motor shaft angular velocity |
| Ka | The amplification coefficient of motor |
| u | The input voltage |
| J | The inertia moment of motor (N.m) |
| B1 | The friction coefficient of motor |
| Vb | The battery voltage (V) |
| E0 | The battery constant voltage (V) |
| K | The polarization constant (V/Ah) |
| Q | The battery capacity (Ah) |
| R | The internal resistance |
| A | The exponential zone amplitude (V) |
| Ec | The back EMF |
| Te | The produced torque |
References
- Khoa, N.X.; Nhu, Y.Q.; Lim, O. Estimation of parameters affected in internal exhaust residual gases recirculation and the influence of exhaust residual gas on performance and emission of a spark ignition engine. Appl. Energy 2020, 278, 115699. [Google Scholar] [CrossRef]
- Khoa, N.X.; Lim, O. The effects of combustion duration on residual gas, effective release energy, engine power and engine emissions characteristics of the motorcycle engine. Appl. Energy 2019, 248, 54–63. [Google Scholar] [CrossRef]
- Szwaja, S.; Ansari, E.; Rao, S.; Szwaja, M.; Grab-Rogalinski, K.; Naber, J.D.; Pyrc, M. Influence of exhaust residuals on combustion phases, exhaust toxic emission and fuel consumption from a natural gas fueled spark-ignition engine. Energy Convers. Manag. 2018, 165, 440–446. [Google Scholar] [CrossRef]
- Bhandarkar, S. Vehicular Pollution, Their Effect on Human Heatlh and Mitigation Measures. Veh. Eng. 2013, 1, 33–40. [Google Scholar]
- Coronado, C.R.; de Carvalho, J.A., Jr.; Yoshioka, J.T.; Silveira, J.L. Determination of ecological efficiency in internal combustion engines: The use of biodiesel. Appl. Therm. Eng. 2009, 29, 1887–1892. [Google Scholar] [CrossRef]
- Dou, X.; Linn, J. How do US passenger vehicle fuel economy standards affect new vehicle purchases? J. Environ. Econ. Manag. 2020, 102, 102332. [Google Scholar] [CrossRef]
- Xing, H.; Stuart, C.; Spence, S.; Chen, H. Alternative fuel options for low carbon maritime transportation: Pathways to 2050. J. Clean. Prod. 2021, 297, 126651. [Google Scholar] [CrossRef]
- Prussi, M.; Scarlat, N.; Acciaro, M.; Kosmas, V. Potential and limiting factors in the use of alternative fuels in the European maritime sector. J. Clean. Prod. 2021, 291, 125849. [Google Scholar] [CrossRef]
- Ibrahim, A.; Jiang, F. The electric vehicle energy management: An overview of the energy system and related modeling and simulation. Renew. Sustain. Energy Rev. 2021, 144, 111049. [Google Scholar] [CrossRef]
- Lin, J.; Zhou, W.; Wolfson, O. Electric vehicle routing problem, Transportation research procedia 2016. In Proceedings of the 9th International Conference on City Logistics, Tenerife, Spain, 17–19 June 2015. [Google Scholar]
- Hung, N.B.; Lim, O. A review of history, development, design and research of electric bicycles. Appl. Energy 2020, 260, 114323. [Google Scholar] [CrossRef]
- Liu, Y.; Lai, I.K.W. The Effects of Environmental Policy and the Perception of Electric Motorcycles on the Acceptance of Electric Motorcycles: An Empirical Study in Macau. SAGE Open 2020, 10, 1–14. [Google Scholar] [CrossRef]
- Propfe, B.; Redelbach, M.; Santini, D.J.; Friedrich, H. Cost analysis of Plug-in Hybrid Electric Vehicles including Maintenance & Repair Costs and Resale Values. World Electr. Veh. J. 2012, 5, 886–895. [Google Scholar] [CrossRef] [Green Version]
- Noori, M.; Tatari, O. Development of an agent-based model for regional market penetration projections of electric vehicles in the United States. Energy 2016, 96, 215–230. [Google Scholar] [CrossRef]
- Riesz, J.; Sotiriadis, C. Daisy Ambach, Stuart Donovan. uantifying the costs of a rapid transition to electric vehicles. Appl. Energy 2016, 180, 287–300. [Google Scholar] [CrossRef]
- Gass, V.; Schmidt, J.; Schmid, E. Analysis of alternative policy instruments to promote electric vehicles in Austria. Renew. Energy 2014, 61, 96–101. [Google Scholar] [CrossRef]
- Wu, J.-H.; Wu, C.-W.; Lee, C.-T.; Lee, H.-J. Green purchase intentions: An exploratory study of the Taiwanese electric motorcycle market. J. Bus. Res. 2015, 68, 829–833. [Google Scholar] [CrossRef]
- Asaei, B.; Habibidoost, M. Design, simulation, and prototype production of a through the road parallel hybrid electric motorcycle. Energy Convers. Manag. 2013, 71, 12–20. [Google Scholar] [CrossRef]
- Weigl, J.D.; Henz, M.; Saidi, H. Converted battery-powered electric motorcycle and hydrogen fuel cell-powered electric motorcycle in South East Asia: Development and performance test. In Proceedings of the Joint International Conference on Electric Vehicular Technology and Industrial, Mechanical, Electrical and Chemical Engineering (ICEVT & IMECE), Surakarta, Indonesia, 4–5 November 2015; Institute of Electrical and Electronics Engineers (IEEE): Manhattan, NY, USA; pp. 1–4. [Google Scholar]
- Abu Hanifah, R.; Toha, S.F.; Hanif, N.H.H.M.; Kamisan, N.A. Electric Motorcycle Modeling for Speed Tracking and Range Travelled Estimation. IEEE Access 2019, 7, 26821–26829. [Google Scholar] [CrossRef]
- Farzaneh, A.; Farjah, E.; Farzaneh, A. A Novel Smart Energy Management System in Pure Electric Motorcycle Using COA. IEEE Trans. Intell. Veh. 2019, 4, 600–608. [Google Scholar] [CrossRef]
- Farzaneh, A.; Farjah, E. Analysis of Road Curvature’s Effects on Electric Motorcycle Energy Consumption. Energy 2018, 151, 160–166. [Google Scholar] [CrossRef]
- Yildiz, A.B. Electrical equivalent circuit based modeling and analysis of direct current motors. Int. J. Electr. Power Energy Syst. 2012, 43, 1043–1047. [Google Scholar] [CrossRef]
- Abagnale, C.; Cardone, M.; Iodice, P.; Strano, S.; Terzo, M.; Vorraro, G. Derivation and Validation of a Mathematical Model for a Novel Electric Bicycle. In Proceedings of the World Congress on Engineering, London, UK, 1–3 July 2015. [Google Scholar]
- Tremblay, O.; Dessaint, L.-A. Experimental Validation of a Battery Dynamic Model for EV Applications. World Electr. Veh. J. 2009, 3, 289–298. [Google Scholar] [CrossRef] [Green Version]
Figure 1.
The model of the electric motorcycle.
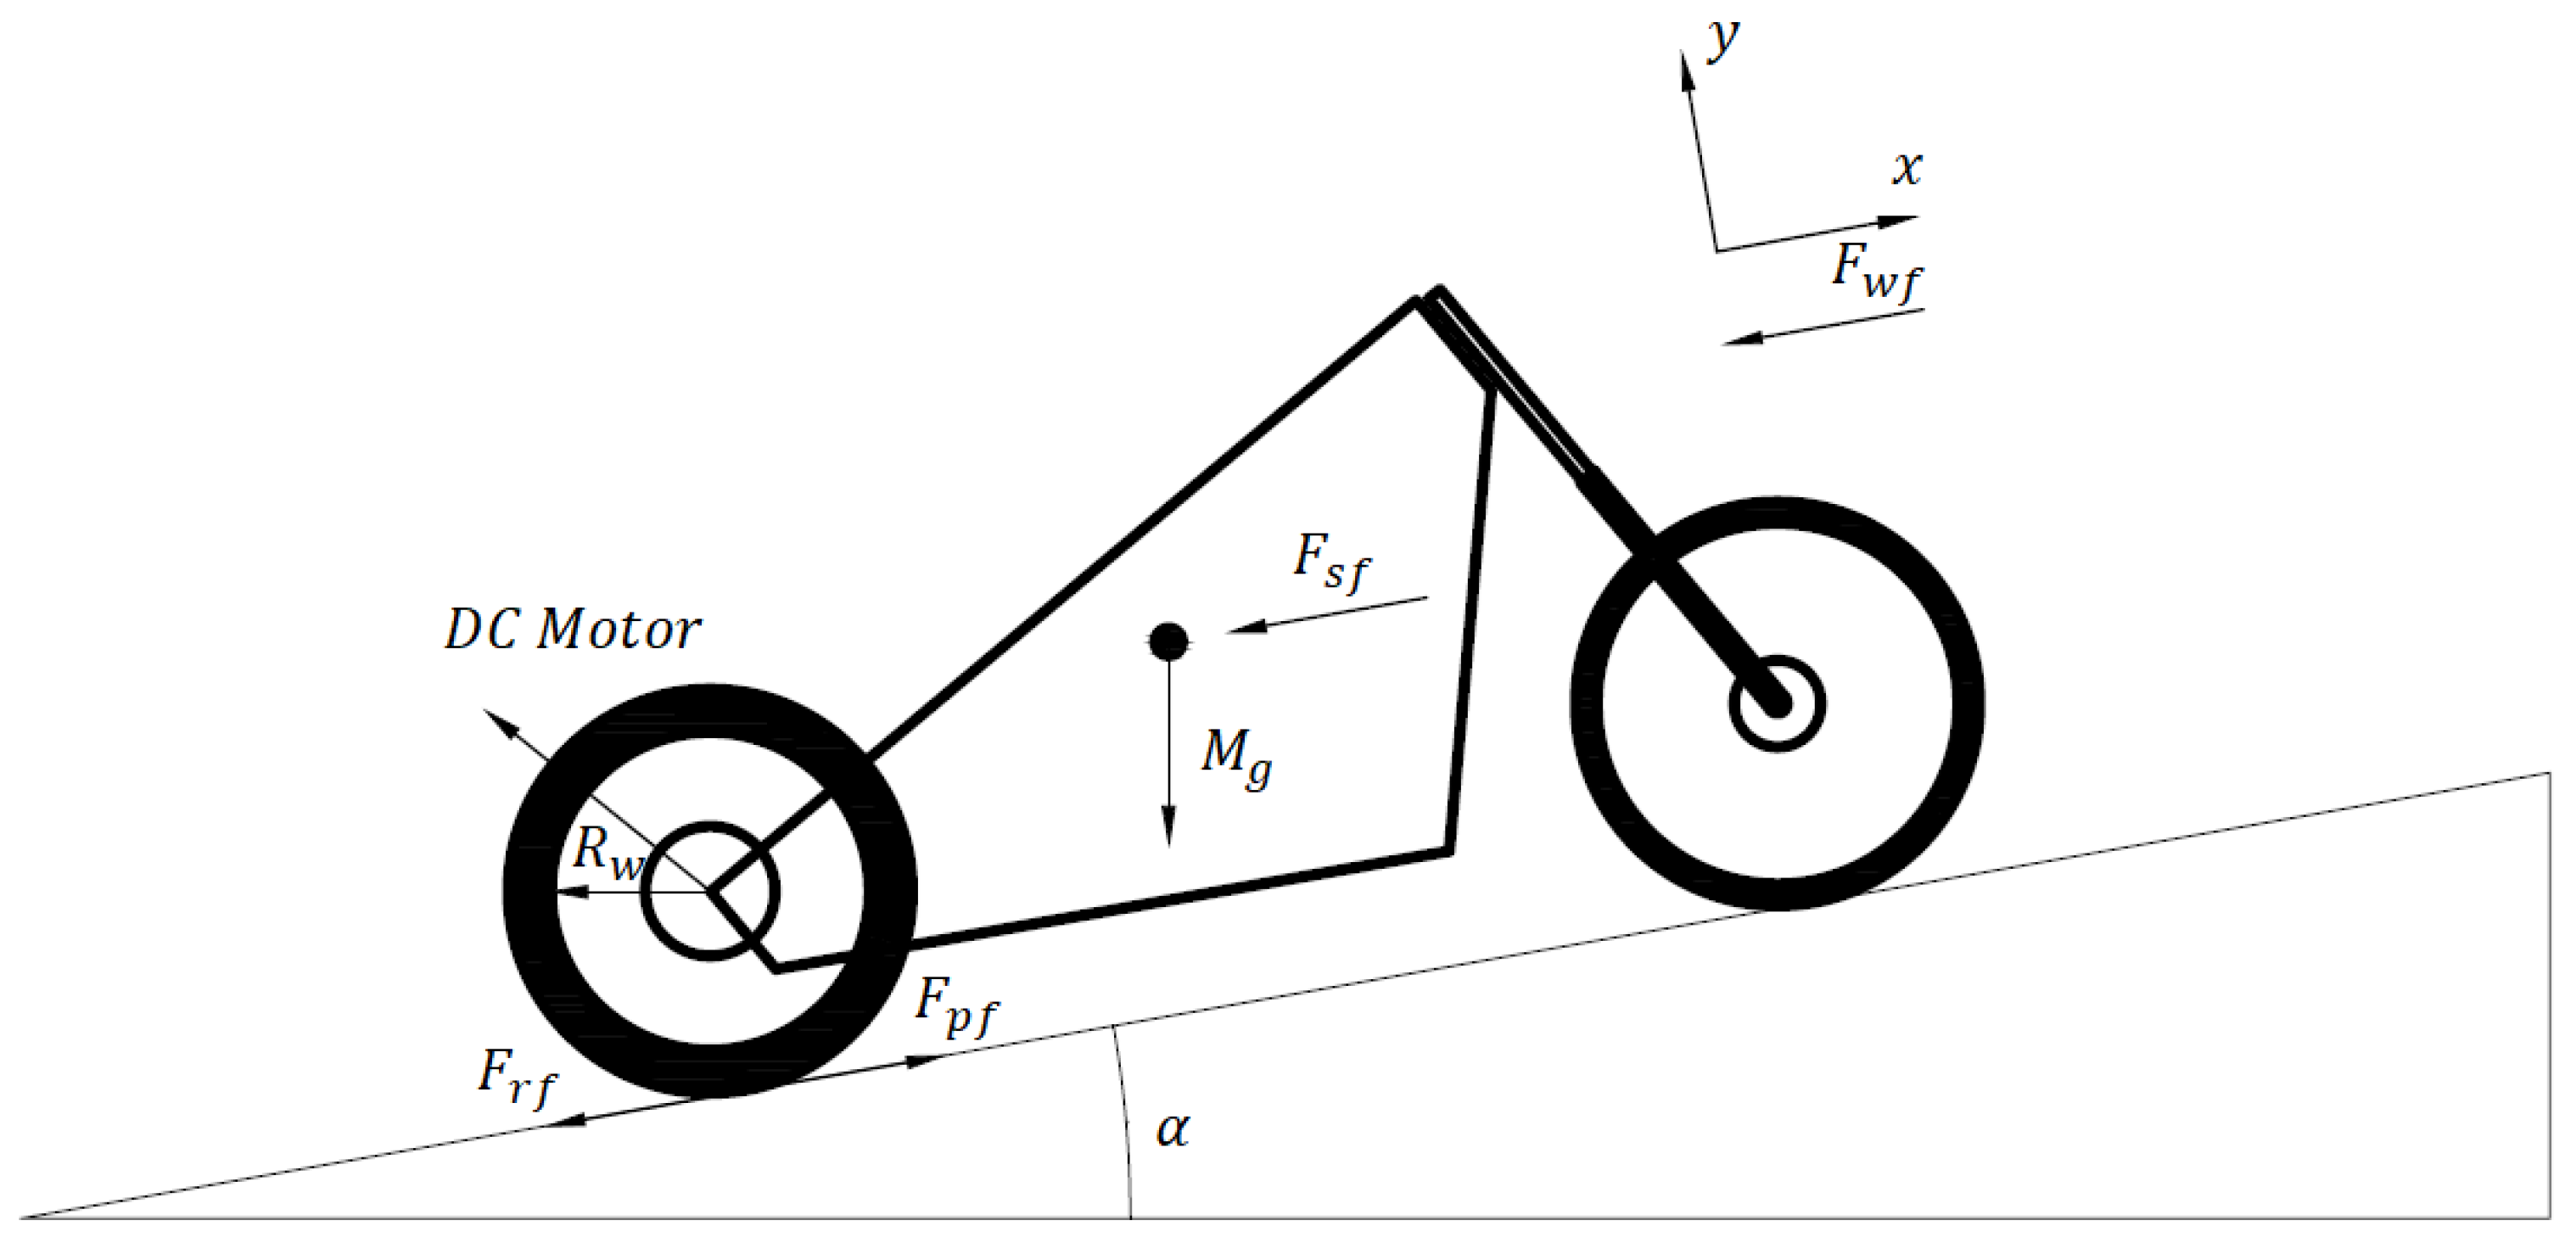
Figure 2.
The armature equivalent circuit of the DC motor.

Figure 3.
Compare to the (a) velocity, (b) distance when changing the transmission ratio.

Figure 4.
The experimental system setup on EM.
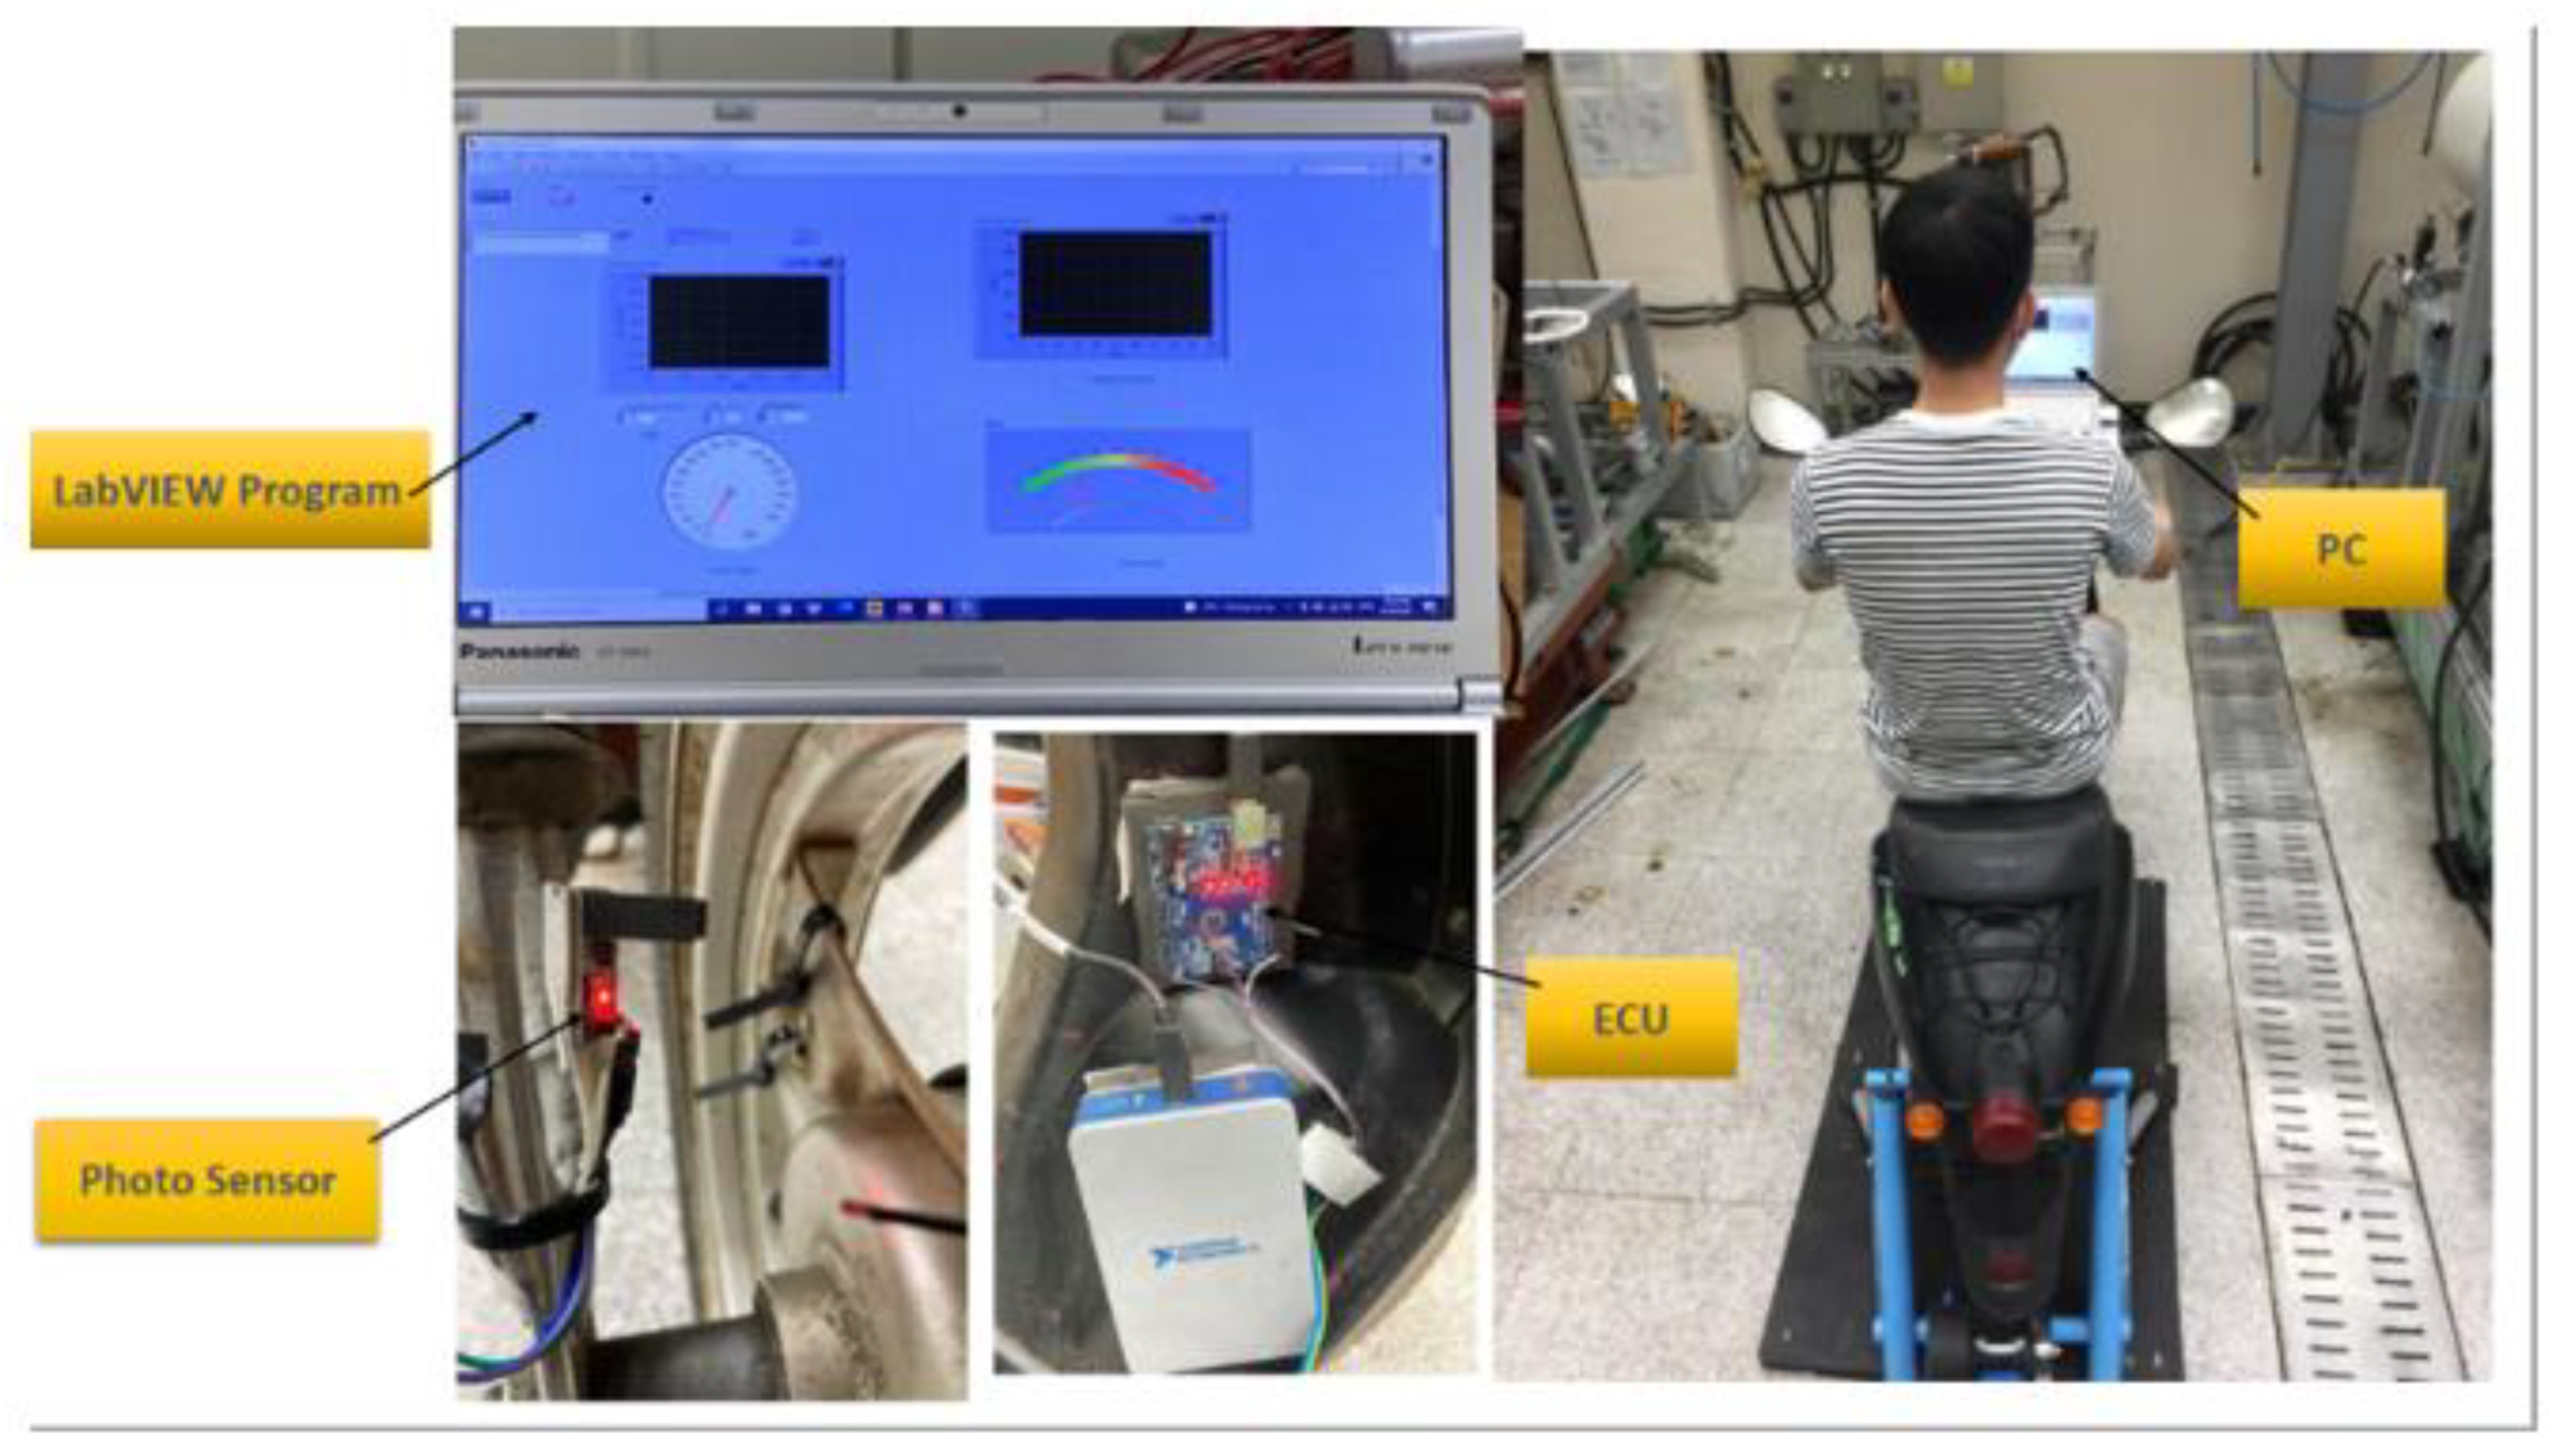
Figure 5.
Impact of electric motorcycle mass to (a) velocity, (b) distance, (c) battery voltage, (d) propulsion torque.
Figure 5.
Impact of electric motorcycle mass to (a) velocity, (b) distance, (c) battery voltage, (d) propulsion torque.


Figure 6.
Impact of driver mass to (a) velocity, (b) distance, (c) battery voltage, (d) propulsion torque.
Figure 6.
Impact of driver mass to (a) velocity, (b) distance, (c) battery voltage, (d) propulsion torque.
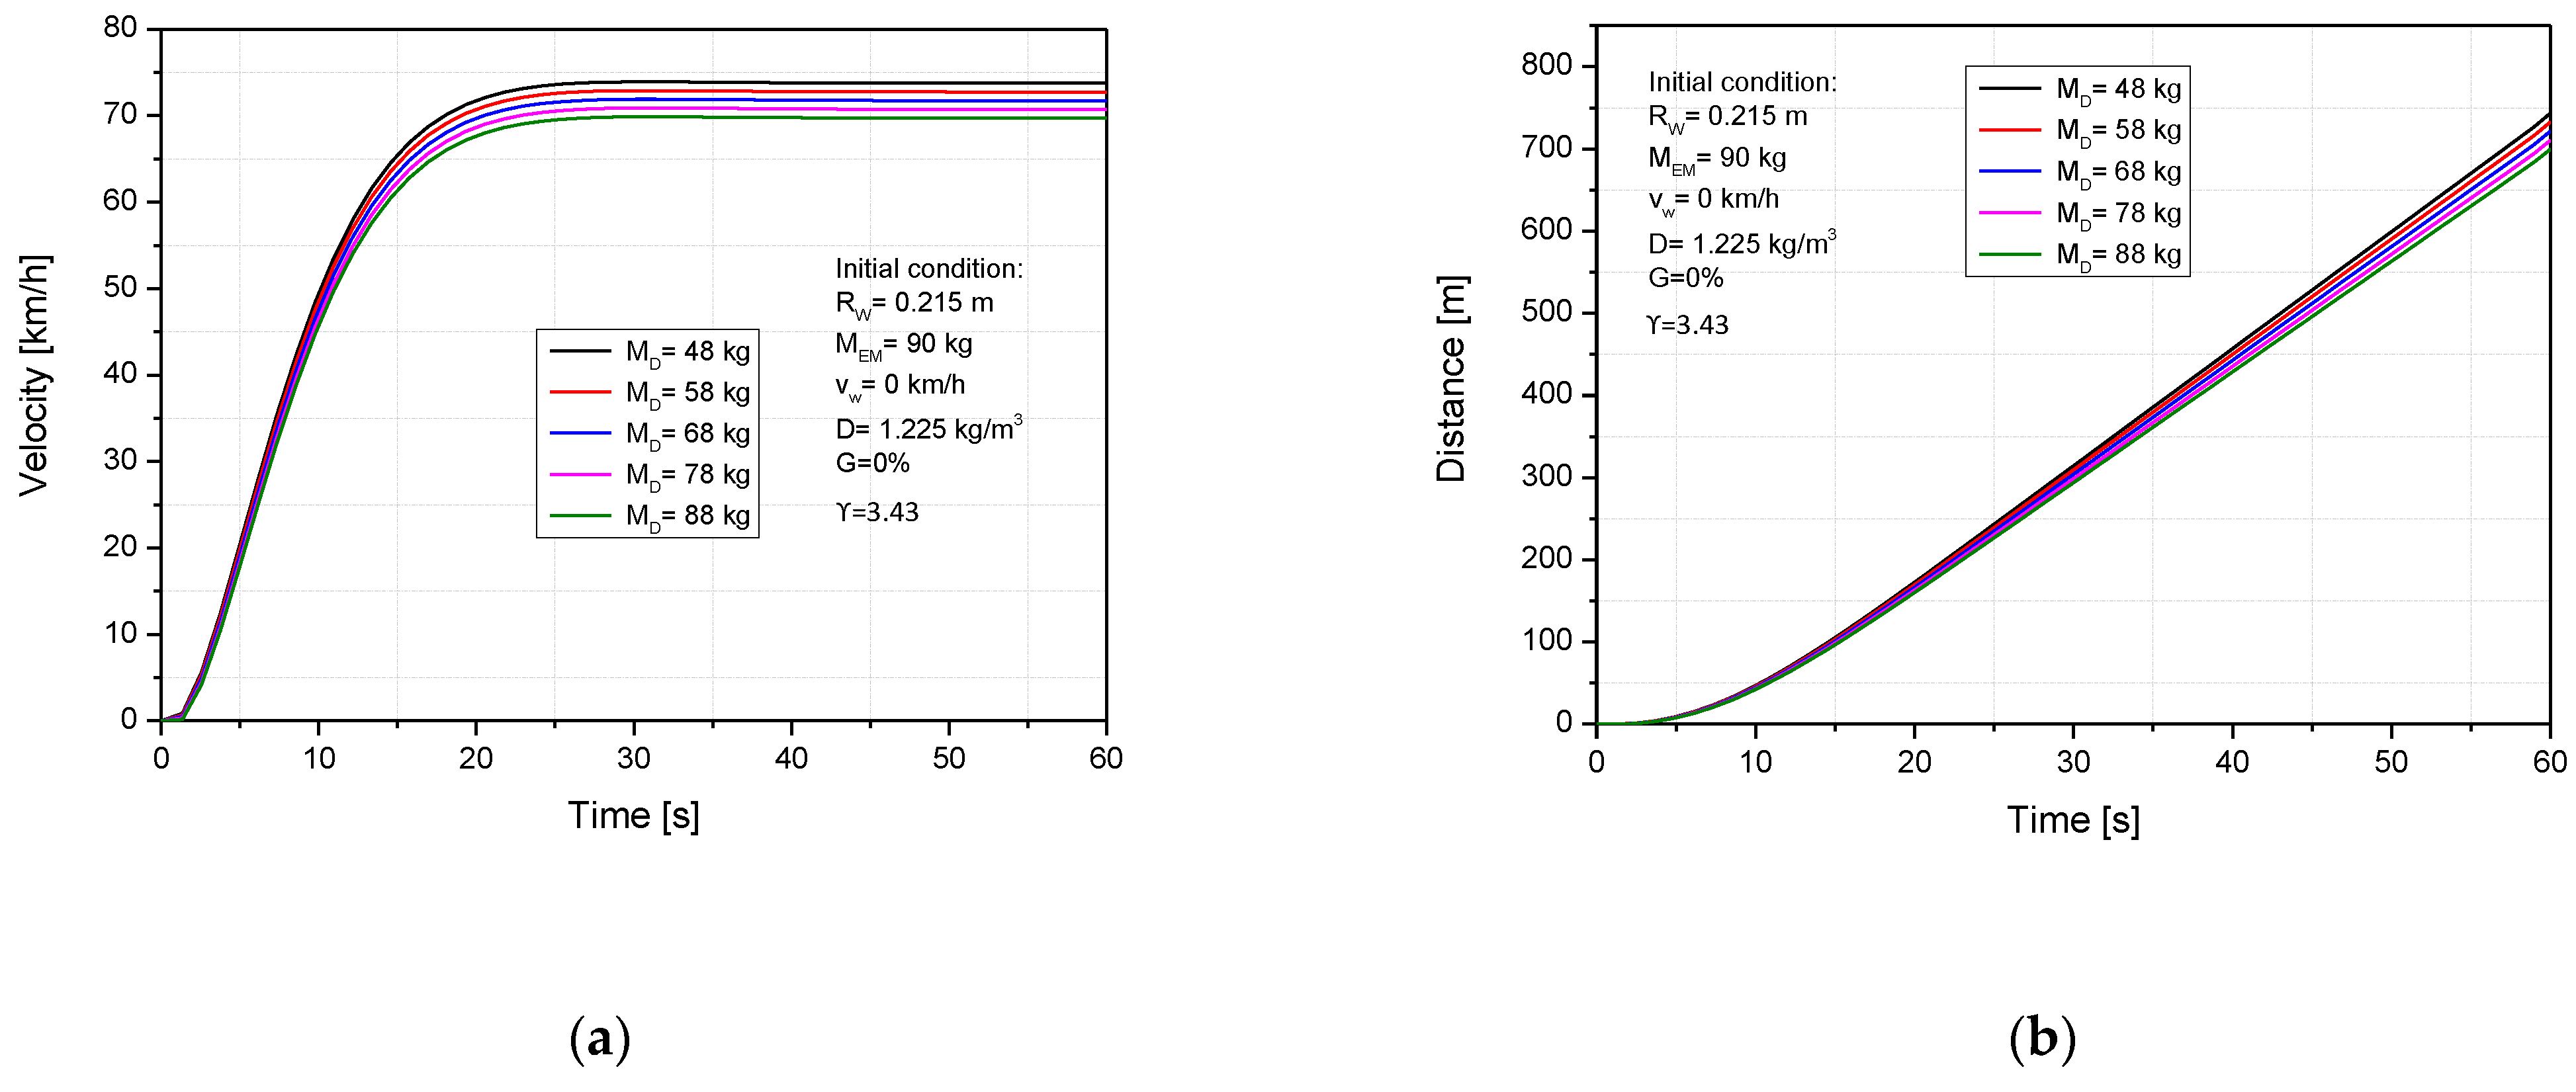
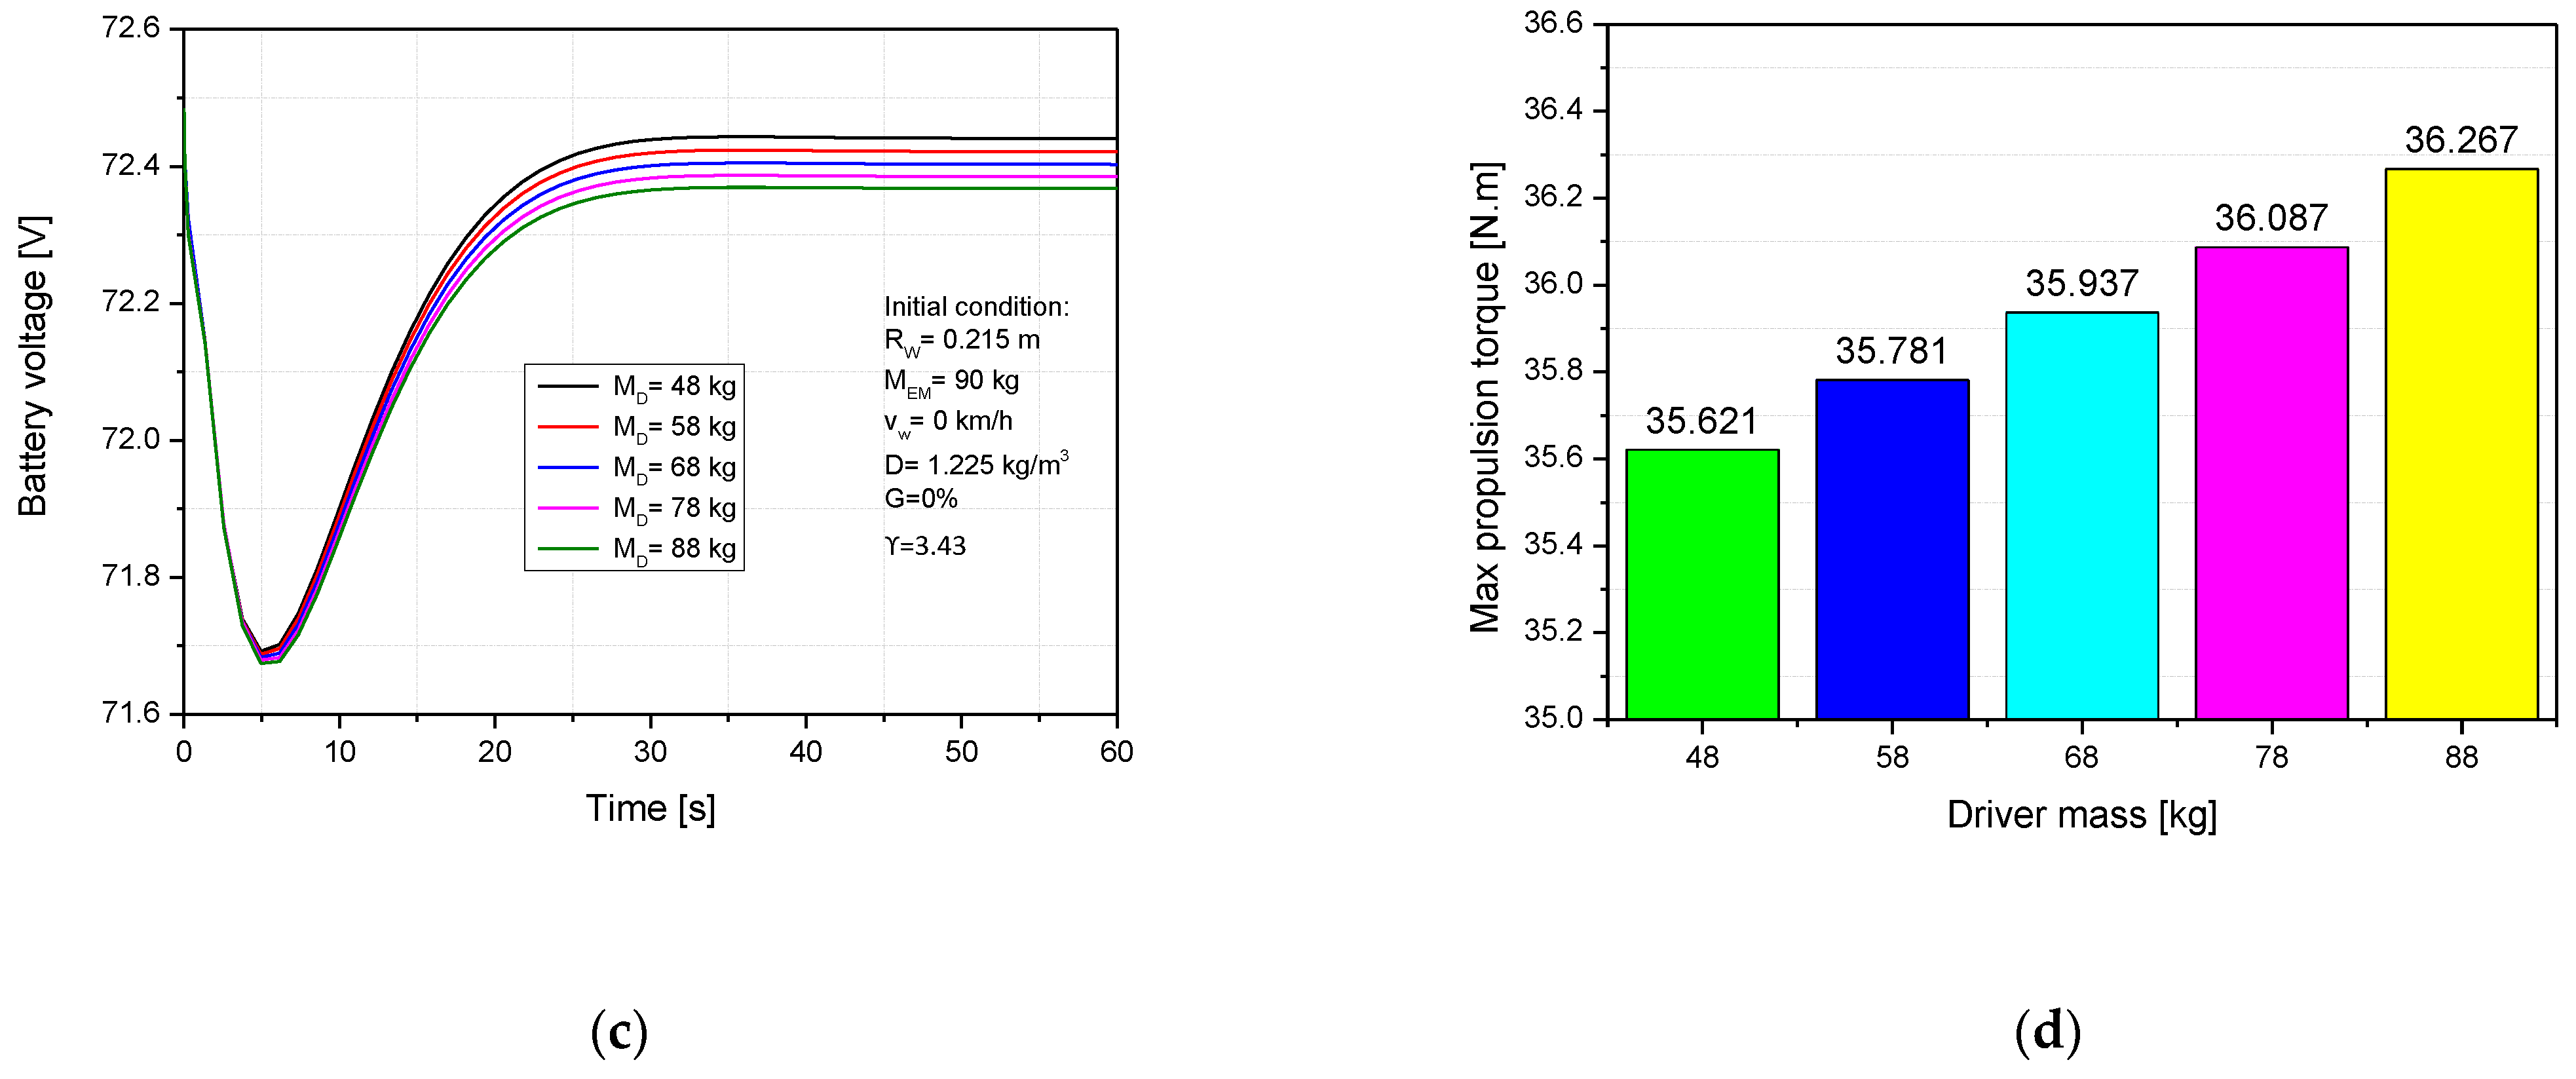
Figure 7.
Impact of wheel radius to (a) velocity, (b) distance, (c) battery voltage, (d) propulsion torque.
Figure 7.
Impact of wheel radius to (a) velocity, (b) distance, (c) battery voltage, (d) propulsion torque.


Figure 8.
Impact of frontal area to (a) velocity, (b) distance, (c) battery voltage, (d) propulsion torque.
Figure 8.
Impact of frontal area to (a) velocity, (b) distance, (c) battery voltage, (d) propulsion torque.


Figure 9.
Impact of transmission ratio to (a) velocity, (b) distance, (c) battery voltage, (d) propulsion torque.
Figure 9.
Impact of transmission ratio to (a) velocity, (b) distance, (c) battery voltage, (d) propulsion torque.


Table 1.
Transmission ratio of gearbox.
| Speed Levels | Transmission Ratio Value (ϒ) |
|---|---|
| Speed_1 | 2.66 |
| Speed_2 | 3 |
| Speed_3 | 3.43 |
| Speed_4 | 4.12 |
| Speed_5 | 4.94 |
Publisher’s Note: MDPI stays neutral with regard to jurisdictional claims in published maps and institutional affiliations. |
© 2021 by the authors. Licensee MDPI, Basel, Switzerland. This article is an open access article distributed under the terms and conditions of the Creative Commons Attribution (CC BY) license (https://creativecommons.org/licenses/by/4.0/).
Share and Cite
MDPI and ACS Style
Hieu, L.-T.; Khoa, N.X.; Lim, O. An Investigation on the Effects of Input Parameters on the Dynamic and Electric Consumption of Electric Motorcycles. Sustainability 2021, 13, 7285. https://doi.org/10.3390/su13137285
AMA Style
Hieu L-T, Khoa NX, Lim O. An Investigation on the Effects of Input Parameters on the Dynamic and Electric Consumption of Electric Motorcycles. Sustainability. 2021; 13(13):7285. https://doi.org/10.3390/su13137285
Chicago/Turabian StyleHieu, Le-Trong, Nguyen Xuan Khoa, and Ocktaeck Lim. 2021. "An Investigation on the Effects of Input Parameters on the Dynamic and Electric Consumption of Electric Motorcycles" Sustainability 13, no. 13: 7285. https://doi.org/10.3390/su13137285
Note that from the first issue of 2016, this journal uses article numbers instead of page numbers. See further details here.