Modeling Supply Chain Integration in an Integrated Project Delivery System


1
School of Civil Construction, Pontificia Universidad Católica de Chile; Santiago 7810000, Chile
2
Department of Civil, Environmental and Architectural Engineering, University of Colorado Boulder, Boulder, CO 80309-0422, USA
3
Department of Construction Engineering and Management, Pontificia Universidad Católica de Chile, Santiago 7810000, Chile
*
Author to whom correspondence should be addressed.
Sustainability 2020, 12(12), 5092; https://doi.org/10.3390/su12125092
Submission received: 6 May 2020
/
Revised: 13 June 2020
/
Accepted: 19 June 2020
/
Published: 23 June 2020
(This article belongs to the Special Issue Lean Design and Building Information Modelling)
Abstract
:The supply chain relationship is an essential factor in the performance of Integrated Project Delivery (IPD). The IPD system encourages the early involvement of key participants in the design stage. Consequently, this early involvement requires a new configuration of the supply chain relationship in the IPD system. However, there is a lack of knowledge in understanding the performance of the supply chain relationship in the IPD system. To fill this gap, we applied a simulation model, Virtual Design Team (VDT), to explore the dynamics of the supply chain integration in terms of project organization and project delivery process in design. This study presents a conceptual and qualitative analysis of the VDT model applied in two IPD projects. The results explored different behaviors of integration at inter-organizational and project levels throughout project organization, contractual and technological mechanisms of coordination. The project organization characteristics influence the performance of the construction supply chain.
1. Introduction
The popularity of Integrated Project Delivery (IPD) in the construction industry has grown significantly in recent years. IPD encourages a collaborative environment among key participants in order to achieve better performance [1,2,3,4]. One of the IPD principles is the early involvement of the constructor and some key subcontractors with the owner, the architect, and key consultants in the early stages of design [4,5,6,7]. This IPD principle supposes a significant change in the way key participants are organized and how they work in the project delivery process. Consequently, this change means a new configuration of the supply chain relationships in the IPD system.
According to Mesa et al. [1], the IPD system encourages greater integration of supply chain relationships than design-bid-build (DBB), construction management at risk (CMR), and design-build (DB) systems. This is because IPD more positively impacts communication, alignment of interests and objectives, trust, gain/pain sharing, and teamwork among key participants. However, this research does not explore the performance of the supply chain relationship in the IPD system and what integration mechanisms should be applied to support this integration.
Aside from a few case studies [8,9,10], the relevant literature does not explore the supply chain relationship in IPD projects. In fact, few IPD research studies have focused on comparing the performance of IPD and a traditional project delivery system at all [1,2,11]. While the IPD system is a response to poor project performance in the design and construction industry, there is a knowledge gap surrounding the performance of the supply chain relationship in the IPD system, arguably one of the most important drivers of project performance. The purpose of this research is to contribute to this gap in knowledge by exploring how supply chain integration impacts direct work, coordination work, and waste work in an IPD project. We explore this relationship by modeling the configuration of the supply chain relationship through a computational organization model called Virtual Design Team (VDT) [12,13]. The VDT model was applied to two building projects with the purpose to model their project organization and project delivery process in the definition and preconstruction stages. The VDT model does not analyze the construction stage. This research will add to the body of knowledge in IPD system research and help the construction industry to understand the performance of the supply chain integration in an IPD system.
This study addresses the following research question: How does supply chain integration work in the early stages of an IPD project? To understand the dynamics of the supply chain integration in the IPD system, we will focus on analyzing the interaction between the IPD organizational structure and the project delivery process. In other words, we will study how the owner, the architect, the construction manager/general contractor (CM/GC), key consultants and key subcontractors are organized and how the owner works with the architect, the CM/GC, key consultants and key subcontractors in terms of direct work, coordination work, and waste work in the definition and preconstruction stages of an IPD project.
The paper is organized into seven sections. In the second section, we introduce basic concepts of the research, construction supply chain, waste in the design, and VDT. We then explain our research methodology to collect data from two IPD projects and develop the VDT model. In the fourth section, we introduce the information gathered from the two IPD projects regarding the project organization and project delivery process. Next, we describe and analyze the VDT conceptual model for both projects. In the sixth section, we present an analysis and discussion of the VDT simulation results and a sensitivity analysis of the main organizational characteristics. We finish with a summary of the conclusions and discuss the contributions, limitations, and suggestions for future research.
2. Background
This section introduces primary concepts to the research. The first concept introduces the construction supply chain and its characteristics. The second one explains the implication and level of integration in the supply chain. The third one introduces the concept of waste in design. The last one addresses the definition of VDT and its main characteristics.
2.1. Construction Supply Chain
According to Cristopher [14], a supply chain is a network of organizations involved through upstream and downstream linkages in the different processes that deliver value in the form of products and services to end users. In the context of the construction supply chain, the upstream linkages consist of design activities and tasks, leading to the definition of the product. The downstream linkages consist of construction activities and tasks leading to the delivery of the product.
The supply chain in the construction industry is often more complex than in other industries. It involves a larger number of key participants such as owners, designers, consultants, general contractors, subcontractors, and suppliers [15,16], resulting in a supply chain relationship that changes from organization to organization and from project to project [15]. These participants are joined together, sometimes only once, for the design and construction of a complex product that is one-of-a-kind [17].
The construction supply chain is characterized by fragmentation both vertical (i.e., between participants of different phases, such as designers and contractors) and horizontal (i.e., between participants in the same project phase, such as different design specialists) [18]. This fragmentation throughout the project lifecycle has affected project performance because it can lead to adversarial relationships, low rates of productivity, and lack of communication and coordination between the stakeholders, causing delays, cost overruns, low quality work, and claims [16,17,19]. The high fragmentation and project-based nature of the industry pose a significant challenge to the inter-organization integration of construction supply chains [20].
For this research, the construction supply chain consists of multiple organizations that are connected by interfaces embracing knowledge transfer, information exchange, financial and contractual relationships [21], and conceived to deliver a construction project [22]. In this context, it is relevant to address the organization’s properties and not the individual’s properties for describing and understanding inter-organizational integration [22].
2.2. Supply Chain Integration
In the construction industry, supply chain integration often refers to the involvement of downstream key participants in the upstream process and vice versa. This integration seeks to remove the traditional barriers of fragmentation that separate the design process from the construction process through collaborative working practices, methods, and behaviors that promote an environment where information is freely exchanged among the project participants [23,24,25].
The direct implication of integration is that it requires an exchange of information and knowledge among the key participants [18]. This interdependence of information and knowledge among the key participants creates a need for integration at different levels. Integration can occur at an inter-organizational and project level through time via organizational, contractual, and technological mechanisms of coordination. The inter-organizational level addresses integration among project organizations. The project level addresses integration between project participants. Across time refers to integration within the project delivery process or project-to-project [18,26,27].
For the purpose of this research, integration is defined as “the merging of different disciplines or organizations with different goals, needs, and cultures into a cohesive and mutually supporting unit with collaborative alignment of processes and cultures” [28].
2.3. Waste in Design
Design by nature is an iterative, generative, and complex process because it involves thousands of decisions with numerous task interdependencies and under a highly uncertain environment, sometimes over a period of years [29].
In design, value is generated through the fulfillment of customer needs and requirements [30]. According to Ballard [31], iteration is essential for generating value in design processes. However, not all iterations generate value. Iterations have both positive and negative effects on value creation [32]. Hence, negative iterations can be eliminated without loss of value.
According to Wynn and Eckert [32], there are three distinct iterative functions: (1) Progressive iteration that seeks to create information and knowledge to progress towards completion of a design or problem-solving activity. (2) Corrective iteration that responds to issues arising later in the life cycle or to correct errors introduced earlier or to implement a change. (3) Coordinative iteration that is associated with structures and approaches intended to make a process more effective, efficient, and predictable.
Waste in design is what is unnecessary for task completion and value generation [31]. Hence, corrective iteration is generally undesirable because it would not be required if those adverse events had not manifested (e.g., to correct design errors or to implement a change), and can be eliminated without loss of value or causing failure to complete the project.
For the purpose of this study, we will focus on analyzing corrective iterations as waste work; that is, corrective iteration is a rework that occurs when an exception or adverse events in one task (the driver task) requires work already completed on another task (the dependent task) to be redone. The driver task is usually upstream of, or roughly parallel with, the dependent task in the chain of task precedence [33].
2.4. Virtual Design Team
The VDT is a discrete event simulation model of project organizations. The VDT approach explicitly models actors, activities, communication tools, and organizations [13]. The VDT model is built upon an information-processing view of the organization [34,35]. In this view, an organization is an information-processing and communication system, structured to achieve a specific set of tasks, and comprised of limited capacity, “bounded rationality” information processors (individuals or sub-teams). These information processors send and receive messages along specific lines of communication (e.g., formal lines of authority) via communication tools with limited capacity (e.g., memos, voice mail, meetings) [12].
According to Galbraith [36], the basic assumption in the information-processing view is that “the greater the uncertainty of the task, the greater amount of information that must be processed among decision-makers during the task execution in order to achieve a given level of performance.” In this context, Galbraith [36] stated that “the basic effect of uncertainty is to limit the ability of the organization to preplan or to make decisions about activities in advance of their execution.” Hence, the organization can implement a set of different mechanisms [35,36] to increase its ability to handle uncertainties, whether by reducing the information flow or increasing the ability to process information [37].
In VDT, the information-processing view has two implications. First, one can model project teams as information-processing structures that are composed of tasks generating information to be processed, actors processing and communicating information, communication tools linking actors for communication, and an organization structure that constrains actors’ information-processing behavior. Second, for a project team, both primary production work (e.g., design) and coordination work (i.e., communication and decision-making carried out to facilitate design) can be viewed as information processing, so that one can model the amount of information being processed or to be processed in terms of work volume [12].
3. Methodology
To answer the research questions related to the performance of the supply chain integration in the IPD system, this research uses simulation modeling to explore the project organization and project delivery process. Simulation modeling can take advantage of professional experience where aggregate project data are not available. It can also provide a richer understanding of the variables that drive performance [1]. Due to the nature of this research and the characteristics of the variables under analysis, we chose the VDT model as an appropriate methodology of analysis. The simulation framework of the VDT model has been developed over the past 20 years to help project managers design work processes and project organization. VDT modeling has also been extensively validated and used as an analysis tool for designing project organizations [37,38,39,40,41,42,43,44]. The VDT model is a unique modeling tool particularly appropriate to model project organizational performance, and therefore, it provides modeling elements that are appropriate to model the project delivery process, such as rework and communication links among activities. It also provides tools and a simple language to represent the interaction graphically among project participants and the connection of the project organization and the project delivery process.
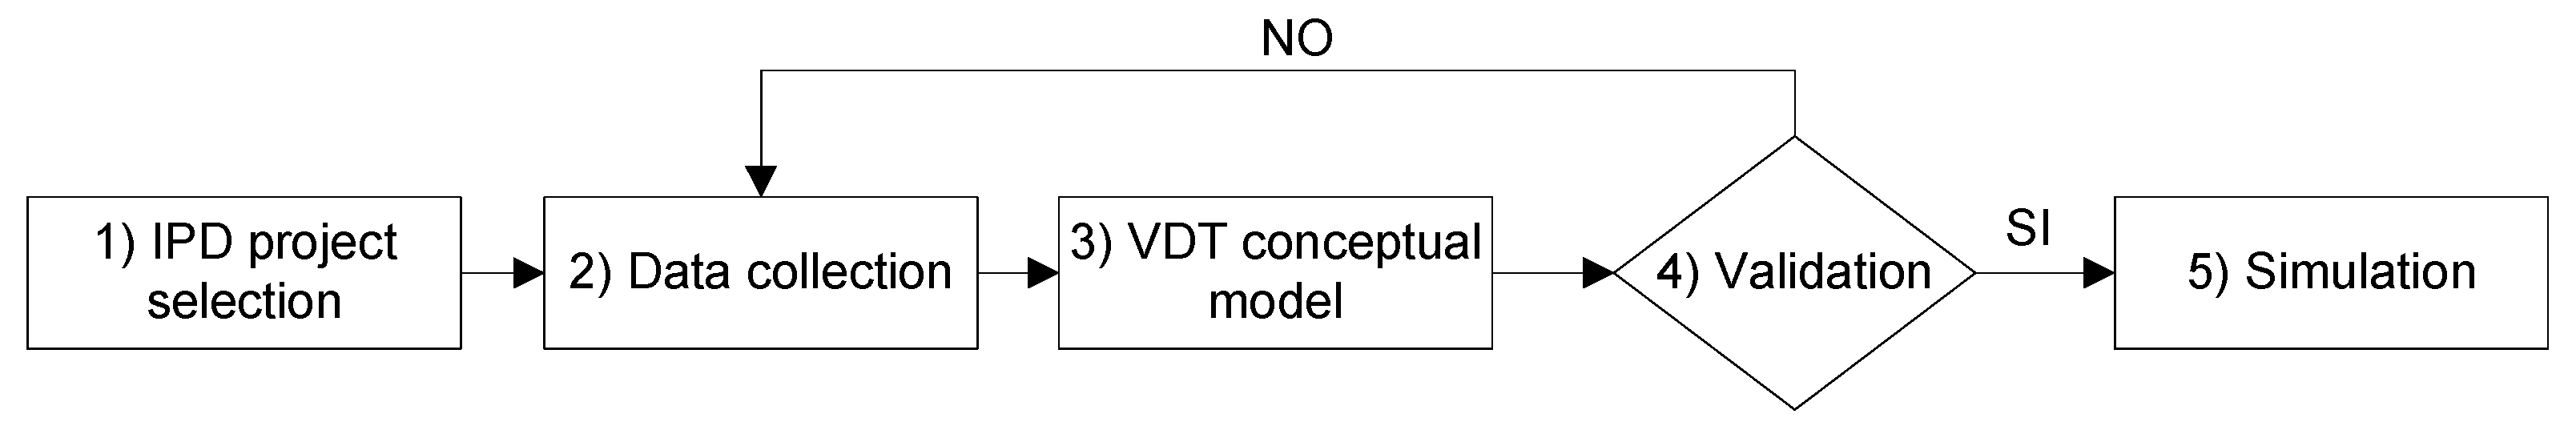
The process for building the VDT model unfolds as an iterative process of interviews with key participants of IPD projects in order to get information and validate the VDT conceptual model (Figure 1). The process that was applied to each project comprises the following steps: IPD project selection, data collection, VDT conceptual model, model validation, and simulation. The following paragraphs explain in detail the process of the methodology.
To select IPD projects for analysis, this research applied the following criteria: (a) the project must use a type of agreement that is signed at least by the owner, architect, and constructor (i.e., multi-party IPD agreement); (b) the project should be a vertical building with extensive supply chain relationships; and (c) the authors must have access to key participants who are willing to share their experience and information. Two building projects with these characteristics were selected after an extensive search: a healthcare project and a conference center.
The data collection consisted of guided interviews that focused on getting information of the design and preconstruction stage about how the owner, the architect, the CM/GC, key consultant and key subcontractor were organized (project organization), how the owner works with the architect, the CM/GC, key consultants and key subcontractors (project delivery process), and the connection between the project organization and the delivery process in these stages (Table 1). The data collection was also complemented with literature (e.g., papers, reports, theses), especially for the healthcare project.
Then, with this information, we worked individually on the development of the VDT conceptual model. The VDT conceptual model is developed through a graphical representation of the project organization and project delivery processes. The VDT model approach uses a graphic language of shapes and links. The shapes are a set of color-coded objects that represent projects, milestones, tasks, positions, organizations, and meetings. The links are a set of color-coded arrows that represent the relationship between shapes [33].
Once we had a graphical representation of the model, we set up another interview with the key participants to validate the VDT conceptual model. The main objective is to introduce the VDT conceptual model in order to achieve a consensus on whether all suggested variables are enough to represent the problem and to answer the research question. That is, this process will seek to determine if the model is requisite [45]. Hence, validation of the VDT conceptual model determines if the model captured the underlying features and characteristics of the project organization and project delivery process. For that purpose, we defined a procedure that was used in the interviews with the key participants to validate the graphical representation. The procedure comprised the following two steps:
- Step 1—Explanation of the VDT conceptual model: This step aimed to introduce first the VDT graphic language; that is, explaining the meaning of each shape and link that represents the project organization and project delivery process. Then, we explained the representation of the VDT conceptual model. For that purpose, we focused on explaining the structure of the project organization, links among project participants or groups, types of meetings, links between project participants and activities, the sequence of the project delivery process, and links among activities of the project delivery process.
- Step 2—Comparison between the VDT conceptual model and the actual project events: From the first step, key participants understood how to interpret the VDT conceptual model. Thus, the key participants were able to compare the actual project events relating to the project organization and project delivery process with the graphical representation of the VDT conceptual model. For the comparison process, we led an open discussion where the key participants validated the structure of the project organization, links among project participants or groups, types of meetings, links between project participants and activities, the sequence of the project delivery process and links among activities of the project delivery process. If the key participant disagreed with the graphical representation, changes were made, and Step 2 was repeated.
On average, six interviews were conducted for each project to obtain the final VDT conceptual model. Each interview took 90 minutes on average. Having the VDT conceptual model, the last step was the simulation and calibration of the simulation results in terms of direct work, coordination work, and waste work. The simulation process consisted of modeling the performance of the project organization, specifically actors such as the owner, architect, and constructor working on their assigned activities, such as design and engineering, sharing information, attending meetings, and handling design “exceptions”.
The calibration process aims to illustrate a possible scenario of project performance in terms of these types of work, rather than to obtain a completely accurate prediction of the project organization performance. The calibration process consisted of the following two steps:
- Definition of the values of direct work, coordination work, and waste work: due to the lack of information that supports the values of these types of work in both building projects, these values were defined based on the experience and knowledge of the key participants that participated in these building projects. Hence, the key participants defined a relative percentage for these types of work, considering the duration of each stage, definition, and preconstruction.
- Calibration of direct work, coordination work, and waste work: we used the suggested values from the user guide of the software SimVision to determine information exchange probability and project error probability [33]. These values were calibrated in order to get the relative percentage defined in the first step. In other words, the values of these two probability values were changed based on the range suggested by the user guide until obtaining an approximation to a relative percentage for each type of work.
4. Case Illustrations
This section aims to describe the case illustration projects and present the information that was collected in the interviews. This information introduces the main characteristics of the two building projects regarding their project organization and project delivery process. This information is the basis for creating the VDT model.
4.1. Case Study 1: Healthcare Project
The healthcare project, located in California, consists of 555 patient beds and 18 operating rooms, 14 floors, and 79,710 m2 approximately.
4.1.1. Project Organizational Structure
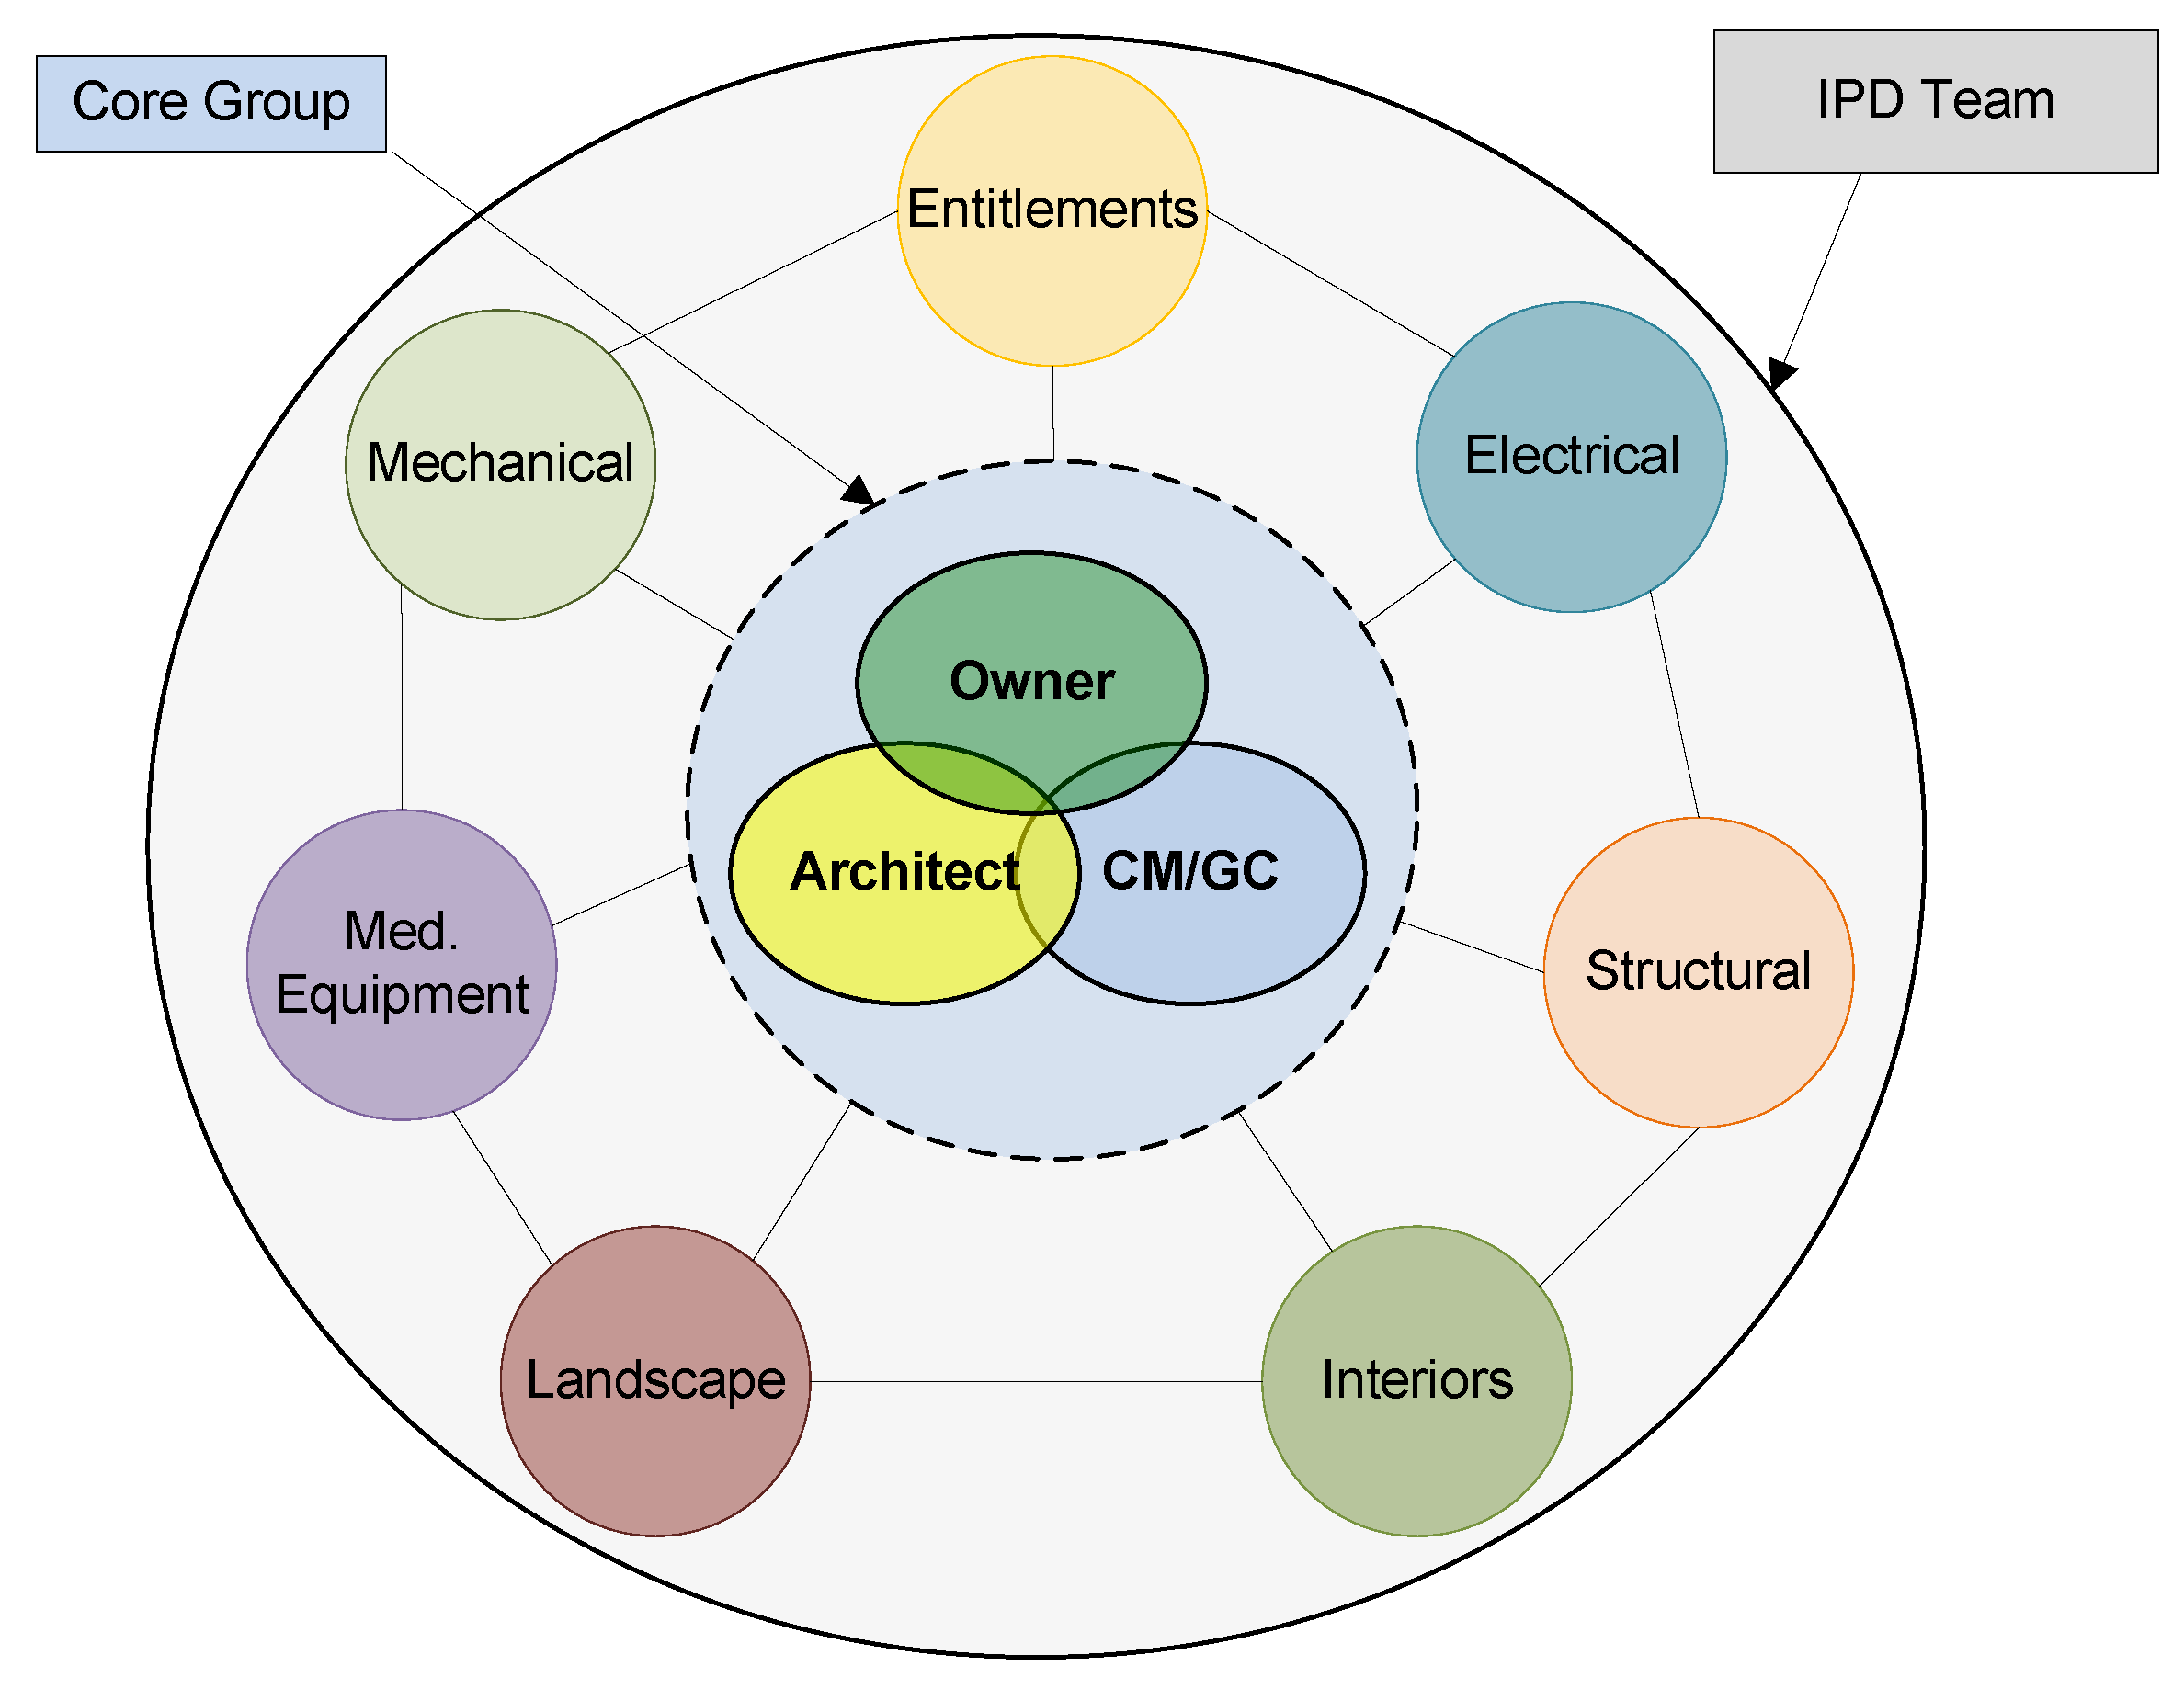
Figure 2 shows how the project organization is structured around an IPD team. The healthcare project implemented an IPD team in order to support and achieve integration at the inter-organizational and project levels. This level of integration is encouraged by a relational contract called Integrated Form of Agreement (IFOA) [46].
The IPD Team is comprised of the owner, the architect, the CM/GC, key consultants, and subcontractors. According to the IFOA [46], the purpose of the IPD team is to facilitate collaborative design, construction, and commissioning of the project. IPD team members are required to work together and individually to achieve a transparent and cooperative exchange of information in all matters relating to the project. They are also required to share ideas for improving project delivery, as contemplated in the project evaluation criteria.
The owner, the architect, and the CM/GC who sign the relational contract form an integrated governance, called the Core Group. The Core Group is responsible for the coordination and overall management and administration of the project. In this case, the management and administration were consistent with Lean Project Delivery principles. The Core Group is also required to exercise its authority in the best interest of the project [46].
The IPD team is organized into interdisciplinary Cluster Groups. The Cluster Groups are separated by design areas, (e.g., structural, interior, medical equipment). Each group is responsible for coordinating their design area both internally and between other Cluster Groups. These groups have a designated leader; however, everybody is empowered to act as a leader in a logical and reasonable way. These groups are a dynamic group of people; the people who form a cluster change over time according to the needs or requirements of the design tasks.
The healthcare project in Case Study 1 set up regular meetings for formal cross-functional coordination and co-location of the entire IPD team and individual Cluster Groups. Four types of meetings were defined: Target Value Design (TVD), Last Planner System (LPS), cluster, and subcommittee meetings. The IPD team met in a “big room” [47] two times per week for approximately two hours each meeting: once for the TVD meeting and once for the LPS meeting. The Cluster Groups individually met two or three hours per week. These meetings were scheduled at different times so that team members could attend other cluster meetings. Additionally, a Core Group meeting was scheduled weekly [47].
4.1.2. Project Delivery Process
The healthcare project’s delivery process was defined to facilitate the TVD process. In comparison with the traditional delivery process, this delivery process first establishes the target cost and constraints in the definition phase. Then, the IPD team designs to the target cost and constraints [48].
4.2. Case Study 2: Conference Center Project
The conference center project is a building project that consists of a conference center and a multimedia resource center. The conference center is approximately 7014 m2 and provides 50 individual rooms, living rooms, gardens, and an area for administration with a center for professional development. The multimedia resource center includes a chapel for meditation, auditorium, interactive audiovisual library, a scale model of Jerusalem, exposition of biblical artifacts, and an area for relaxation and meals. The project is located in Jerusalem.
4.2.1. Project Organizational Structure
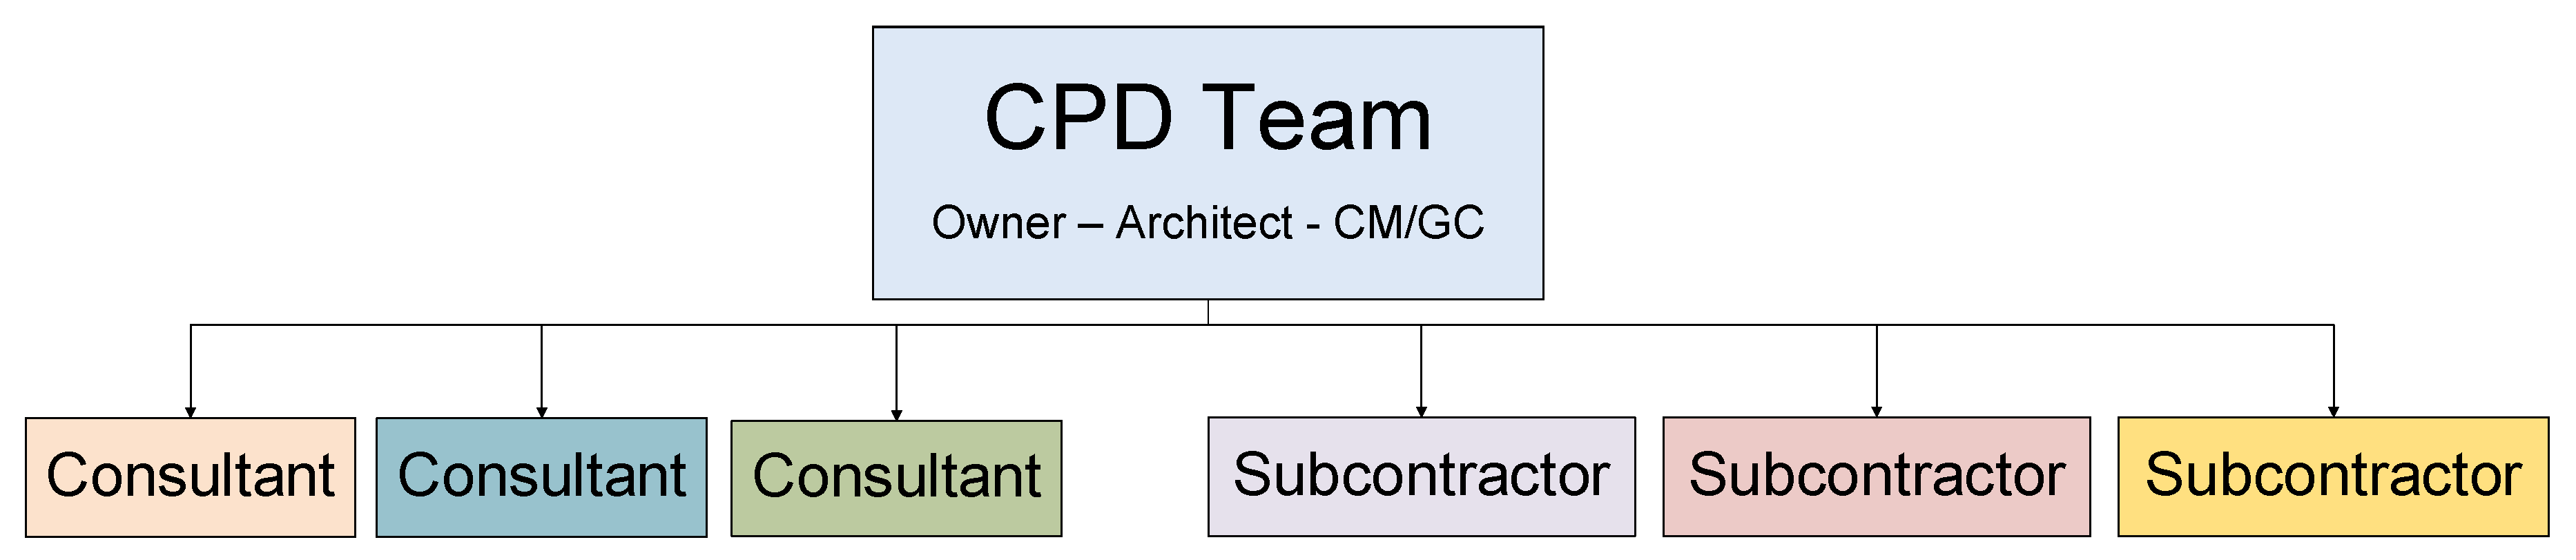
Figure 3 shows the project organization that is structured around a Collaborative Project Delivery (CPD) team. The CPD team included the owner, the architect, and the CM/GC. The CPD team was in charge of coordinating key consultants and key subcontractors. They were involved in different stages and worked individually as functional groups.
4.2.2. Project Delivery Process
The conference center’s project delivery process facilitated the definition and preconstruction. The definition stage comprises the necessities’ programming and basic design. The target cost and constraints are defined in this stage. The preconstruction stage comprises detailed engineering. The key participants design to the target cost and constraints.
5. VDT Model
This section describes the VDT conceptual model of the two building projects. The first part describes the graphical representation of the VDT model for both projects. The second part presents a conceptual analysis of the VDT model. The VDT models were created based on the information collected in the interviews (Section 4). According to this information, the authors’ purpose was to capture the reality for both building projects in the simplest VDT model. For this reason, we assumed that the VDT models only consider key activities and participants using a generic name. The VDT model is read from top to bottom and from left to right. The project organization is at the top, and the project process is at the bottom. The project process is from left to right. The VDT model is also divided by stages to allow an easy interpretation and graphic representation of the evolution of the project organization throughout the project delivery process.
5.1. Description of VDT Conceptual Model
This section presents a description of the graphical representation of the VDT model for both projects. This conceptual model corresponds to the presentation of the interaction of the project organization and the project delivery process. Hence, the description of each VDT model explains how project participants are organized, the sequence of activities in the delivery process, and the connection between the project participants and the delivery process.
5.1.1. Healthcare Project
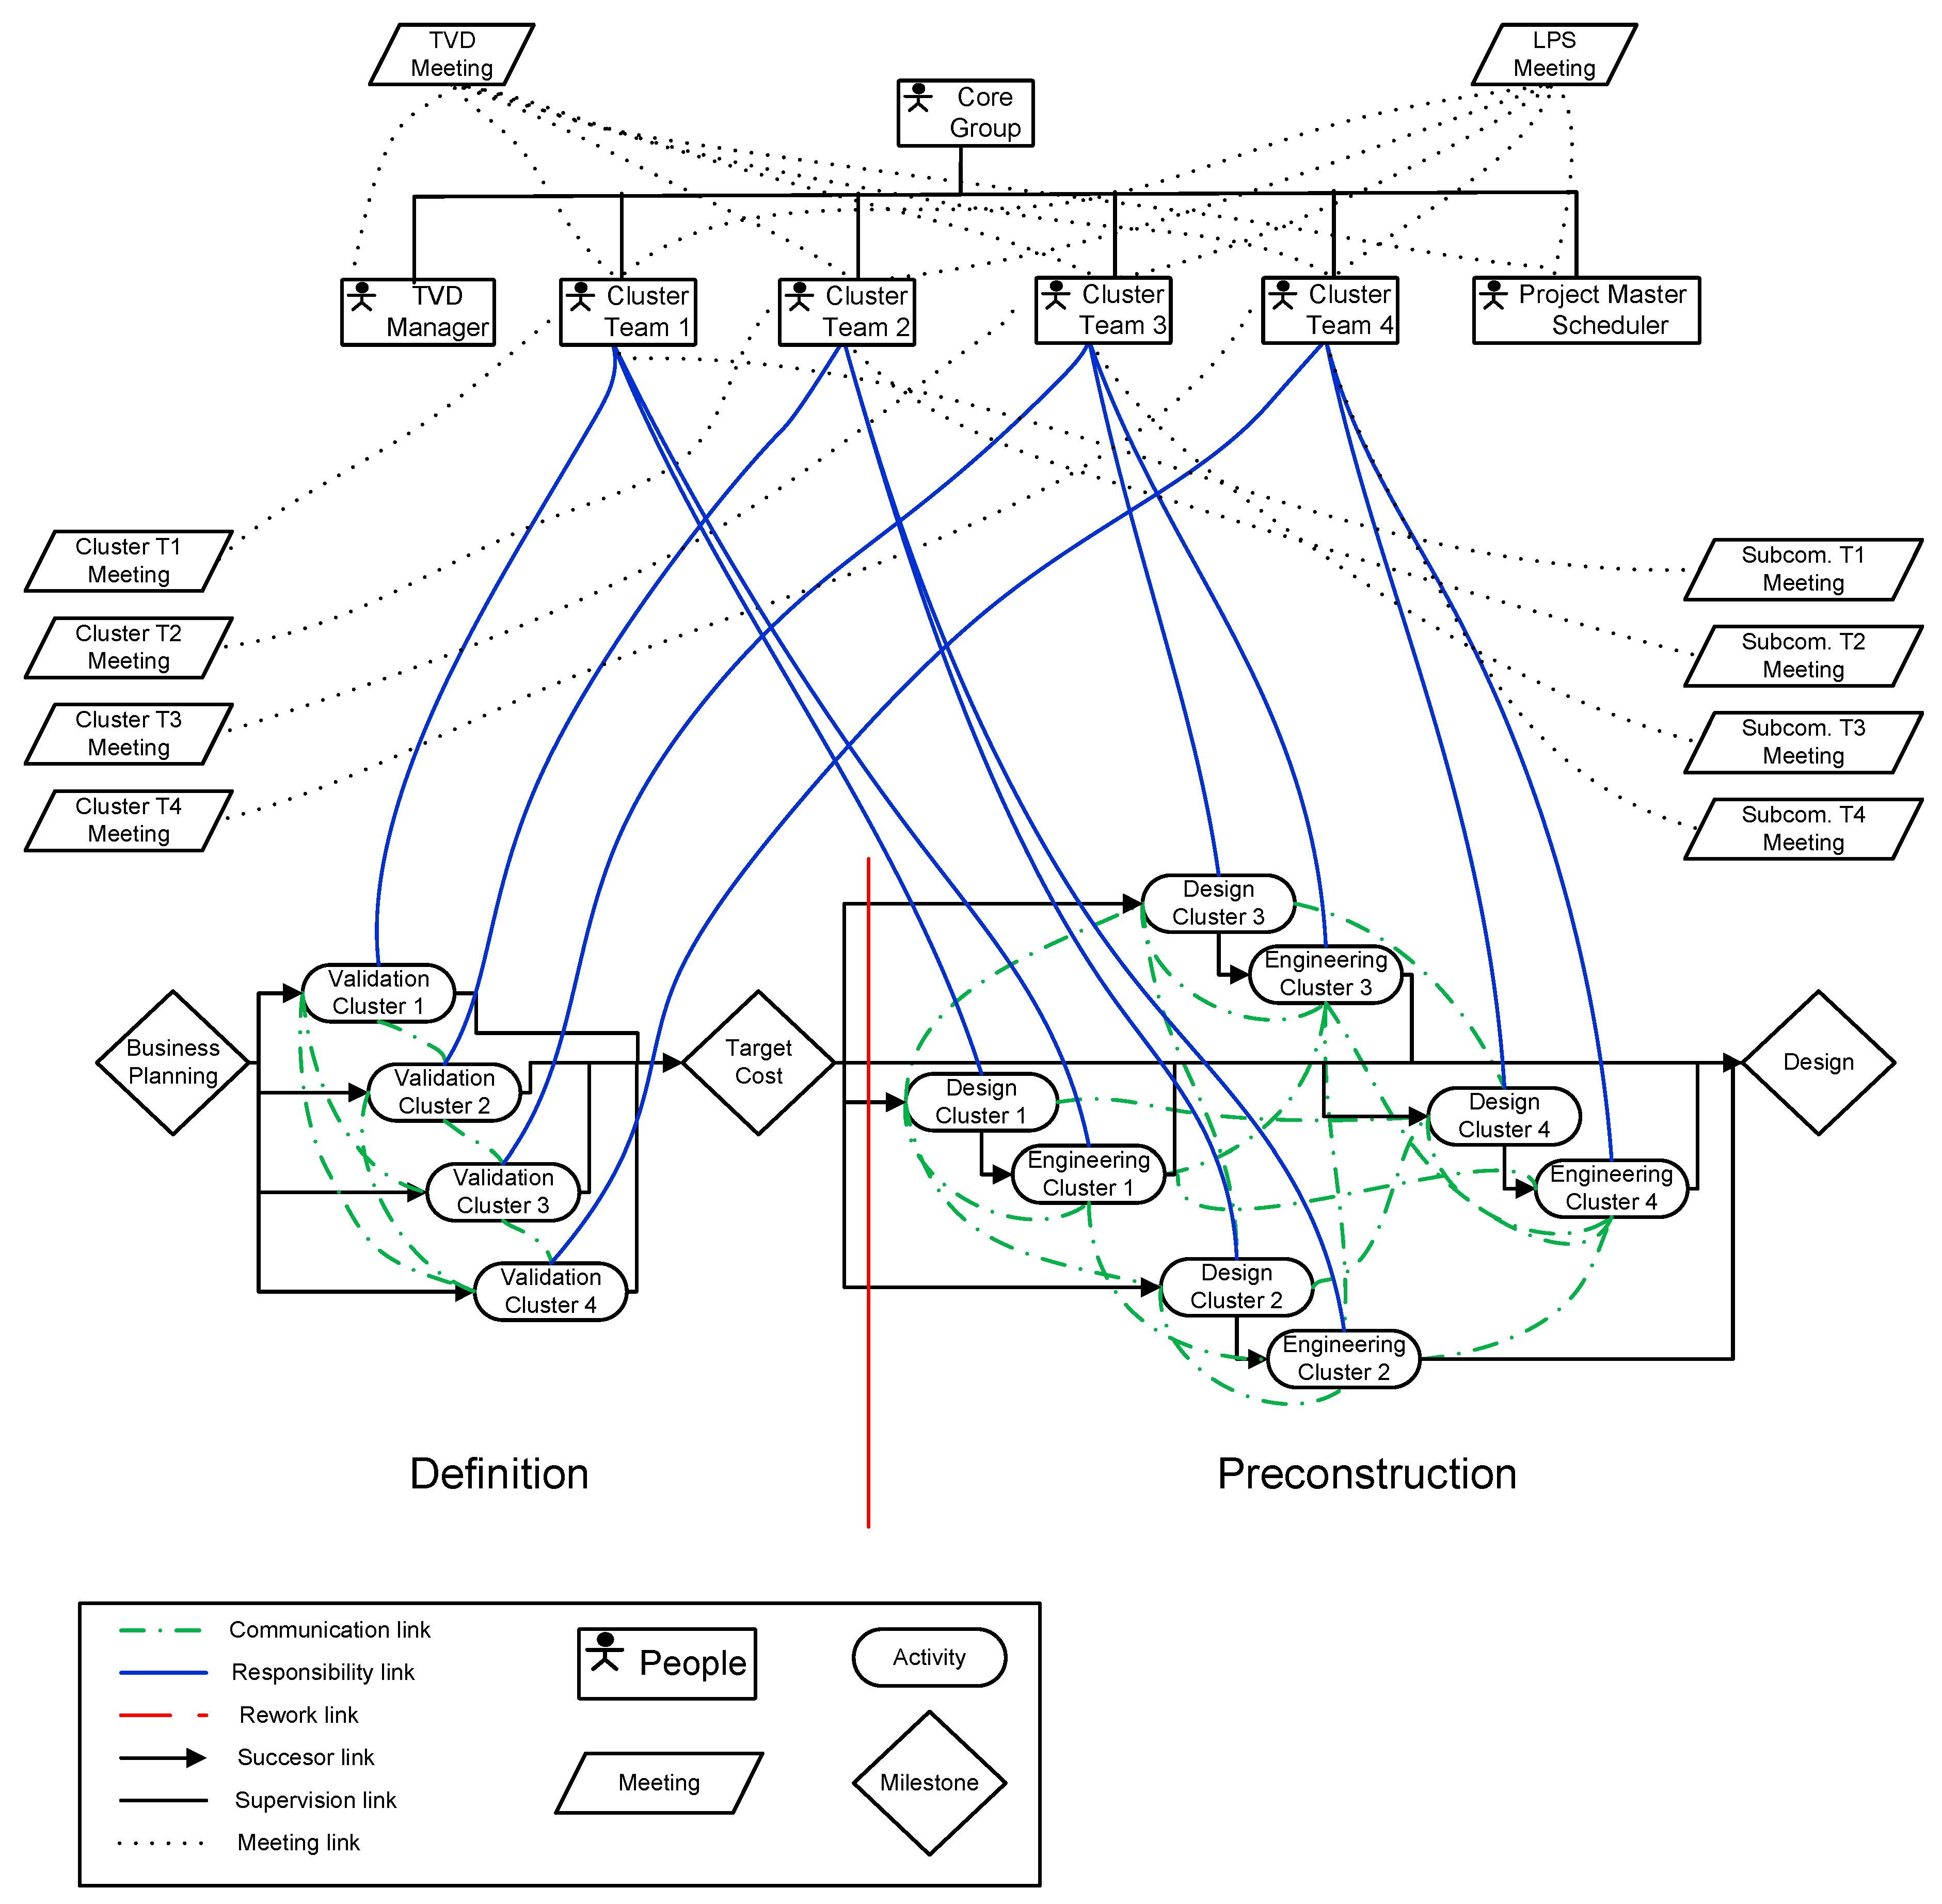
Figure 4 shows the VDT model of the healthcare project. The model is divided into two parts. The first part comprises the definition stage that consists in validating the business planning. The second part comprises the preconstruction stage that consists of designing to the target cost and other general constraints. In the following paragraphs, we will explain the project organization and project delivery process through each stage.
The project organization is defined by the relationship between the Core Group and the Cluster Groups. These groups are linked to each other with supervision links (black line). These links define which position a group or individual would go to for information or to report an exception (e.g., design change, error detected). These links do not represent the rank of groups or individuals within the organization. The Cluster Groups are linked to the project delivery process with blue assignment links. These links signify which group is responsible for which task. Additionally, the Cluster Groups and the Core Groups are linked to TVD, LPS, cluster, and subcommittee meetings with meeting participant links (black dotted lines). These meetings are scheduled throughout the project delivery process, according to the description in Section 4.
The project delivery process that is defined by the TVD process begins with the definition stage. This stage comprises the validation process of the business planning that was presented by the owner. The business planning milestone defines the start of the validation process. In this process, the IPD team defines the target cost and constraints for the project. The Cluster Groups develop activities in the validation process in parallel, considering information and work reciprocal dependency [49]. A reciprocal information relationship (communication link) represents a mutual information requirement dependency between two activities (green dashed line). Work reciprocal relationship (rework link) describes whether an exception (e.g., design change, error detected) generated within one activity will have any impact on the work of another (red dashed line). Due to the early involvement of key participants, the regular meetings for formal cross-functional coordination, and the co-location of the entire IPD team and co-location of individual Cluster Groups, the authors assumed that this environment would encourage progressive and coordinative iterations than corrective iterations.
Once the target cost and constraints have been defined, the IPD team begins to work on the preconstruction stage that is comprised of development design (e.g., architecture) and detailed engineering. During the preconstruction stage, the IPD team designs to the target cost and constraints. Like the validation process, activities of design and engineering are developed in parallel by Cluster Groups, considering information and work reciprocal dependency. As a result of the preconstruction stage, the IPD team defines the design that can be built within the target cost and constraints.
5.1.2. Conference Center Project
Figure 5 shows the conference center project’s VDT model. The VDT model is divided into two parts. The first part comprises the definition stage that establishes the basic design. The second part comprises the preconstruction stage that defines the detailed design. In the following paragraphs, we will explain the project organization and project delivery process through each stage.
The conference center’s project organization changes over the project delivery process, as different key participants are involved. In the definition stage, project organization is defined by the relationship between the owner and the architect. In the preconstruction stage, project organization is defined by the relationship between the CPD team and key consultants. The CPD team is comprised of the owner, the architect, and the CM/GC.
The owner, the architect, the CM/GC, key consultants, and subcontractors are linked to each other with supervision links (black line). These links define which position a group or individual would go to for information or to report an exception. They are also linked to the project delivery process with blue assignment links. These links signify which group or specialist is responsible for which task. Additionally, the CPD team and key consultants and subcontractors are linked to meetings with meeting participant links (black dotted lines).
The project delivery process begins with the definition stage. This stage comprises the definition of the necessities program and the basic design. The owner develops the necessities program, and the architect develops the basic design according to the owner’s requirements that have been established in the necessities program. These activities are developed considering a successor relationship (start-to-start) with a lag. These activities are also linked to each other with communication links (green dashed line) and rework links (red dashed line). As a result of the definition stage, the owner and the architect define the basic design within a target cost and constraints. Once the basic design has been defined, the CPD team begins to work on the detailed design.
In the preconstruction stage, the CPD team coordinates the design and the key consultants design to the target cost and constraints. The design coordination and each of the engineering activities are developed in parallel. The engineering activities are linked to the design coordination with communications links (green dashed line) and rework links (red dashed line). There is not a direct connection between the engineering tasks. As a result of the preconstruction stage, the CPD team and key consultants define the detailed design that can be built within the target cost and constraints.
5.2. Conceptual Analysis of VDT Models
Even though the healthcare and conference center projects are IPD projects, they exhibit different behaviors of integration at the inter-organizational and project levels, especially via organizational and technological mechanisms of coordination (Table 2).
The healthcare project integrated key participants at an inter-organizational and project level. At the inter-organizational level, the healthcare project used the integrated form of agreement (IFOA) as a mechanism of integration. This mechanism allowed involving the CM/GC and key subcontractors with the owner, the architect, and key consultants from the validation phase.
At the project level, the early involvement of the key participants allowed to design the project organization around an IPD team that was organized into a Core Group and Cluster Groups. In order to coordinate the interdependence among the key participants, the healthcare project created cross-functional teams and co-located them in the same office to maximize collaboration, as well as to facilitate informal and formal interaction. The healthcare project also encouraged the use of BIM and lean tools and set up an intensive plan for regular meetings for formal cross-functional work.
The healthcare project defined the project delivery process based on the process of Target Value Design (TVD). During this validation process, the healthcare project defined the target cost and constraints for the project and confirmed if the project that was defined in the business planning could be delivered for the target cost and constraints. Then, in the preconstruction stage, the healthcare project was designed to the target cost and constraints.
On the other hand, the conference center project only integrated key participants at the inter-organizational level by the agreement ConsensusDocs 300 [50] in the preconstruction phase. At the project level, the conference center’s project organization evolved as the key participants became involved. In the definition phase, the owner and the architect were the only key project participants. The owner was in charge of coordinating the basic design. Then, in the preconstruction phase, the CM/GC started working with the owner and the architect. They formed a CPD team. Despite having this integrated project team, the key consultants worked separately in the preconstruction phase. The CPD team was in charge of coordinating design and engineering through a traditional activity of design coordination. Key subcontractors did not participate in the early stages but started working in the construction phase.
The conference center project defined the project delivery process based on the process of Target Value Design (TVD) without the validation process. During the definition stage, the conference center project defined a basic design within a target cost and constraints. Then, in the preconstruction stage, the conference center project made the detailed design.
The difference in project organization stems from the involvement of the key project participants in the early stages and the coordination mechanisms. The number of links among the key participants reflects this difference (Figure 4 and Figure 5). In the healthcare project, there is a large number of links of communication and group meetings among the key participants; however, in the conference center project, the number of links is smaller, especially in the preconstruction stage. Key consultants are not connected to each other. They are connected through the coordination of the CPD team.
In summary, we found two IPD projects with different styles of project organization, project delivery processes, and levels of integration. The main conclusion from this conceptual analysis is about how both the healthcare and conference center projects were organized and integrated into the early stages, especially in the preconstruction stage. The healthcare project created an integrated environment among the key project participants, using coordination mechanisms such as a cross-functional team, lean tools, co-location, and a big room to manage the information flow. However, the conference center project was more traditional, creating a hierarchical environment. Each key consultant worked individually under the coordination of the CPD team with Traditional Project Management.
6. VDT Simulation Model
In the previous section, we described a conceptual analysis that allowed for an understanding of how each IPD project works in terms of the project organization and project delivery process. In this section, we present a VDT model that simulates the interaction between the project organization and project delivery process in order to measure the volume of work (time); that is, the sum of direct work, coordination work, and waste work, and to explore how the key participants work specifically in terms of these types of works. For this research, direct work is the primary production work, e.g., design work for a design team or construction work for a construction team. Coordination work is the information flow among the project participants. It considers two types of communication: one-to-one information exchange between project participants and group meetings [33]. Waste work is the work that has to be redone because of corrective iterations and decision waiting time to report and how to deal with the exceptions. These types of work are expressed in units of time (e.g., days, months).
Using the VDT conceptual model (Figure 4 and Figure 5), simulations were made with the computer software SimVision 4.4 [33]. The software requires some basic inputs about the project organization in order to run the simulation. For this study, we consider the following main inputs [33]:
- Team experience: defines the relative degree to which the project team has successfully performed the related project. The team experience can be set up in the range of low, medium, or high for different levels of team experience.
- Centralization: defines the qualitative degree to which decision-making and exception-handling responsibilities are decentralized to the individual responsible (low), or centralized to senior project managers (high).
- Formalization: defines the relative degree to which communication among project participants takes place informally (low), or through formal meetings and memos (high).
- Matrix strength: defines the extent to which project participants are located in skill-based functional departments or areas and supervised directly by functional managers (low), or co-located with other skilled specialists in dedicated project teams and with project supervision from a project manager (high).
- Information exchange probability: measures the level of communication in the project among project participants that are responsible for activities linked by communications (green) links. The information exchange probability can be set up in the range of 0.2 (low) to 0.9 (high) for different levels of communication.
- Project error probability: defines the probability that an activity will fail and generate rework for all dependent activities connected to it by rework links. Project error probability can be set up in the range of 0.05 (low) to 0.10 (significant but common) for different probabilities.
- Project complexity: defines the degree of complexity and uncertainty of activities of the project delivery process. Activity complexity defines the number of internal project requirements that the activity must satisfy and the amount of communication across communications links that are required to perform a task. Project complexity can be set up in the range of low, medium, or high for different levels of complexity.
Table 3 presents the project organizational characteristics for both projects. With the exception of team experience, centralization, formalization, and matrix strength characteristics, the data for information exchange, project error probability, and project complexity were gathered from the user guide of the software SimVision [33].
The principal differences between the projects are centralization and matrix strength. The healthcare project’s organization has a decentralized tendency, whereas the conference center’s organization has a more centralized tendency. The level of matrix strength is high in the healthcare project because key participants were co-located in the same place. However, in the conference center project, the level of matrix strength is low because participants worked in separate locations.
The following sections present an analysis and discussion of the simulation results and a sensitivity analysis of the main organizational characteristics.
6.1. Analysis of the VDT Simulation Results
This section presents the volume of direct, coordination, and waste work in the definition and preconstruction stages. The volume of work is the result of the simulation of the project organization characteristics, activities, and all links such as communication, responsibility, and meetings that define the interaction between the project organization and the project delivery process (Figure 4 and Figure 5). For example, coordination work is the result of simulating communication links (green dashed line) and meeting links (gray dashed line) or the activity of design coordination. The following paragraphs explain the level of direct work, coordination work, and waste work at each stage. Due to the difference in coordination mechanisms between both projects, the coordination work was divided into cross-functional work and design coordination work to interpret the results easily.
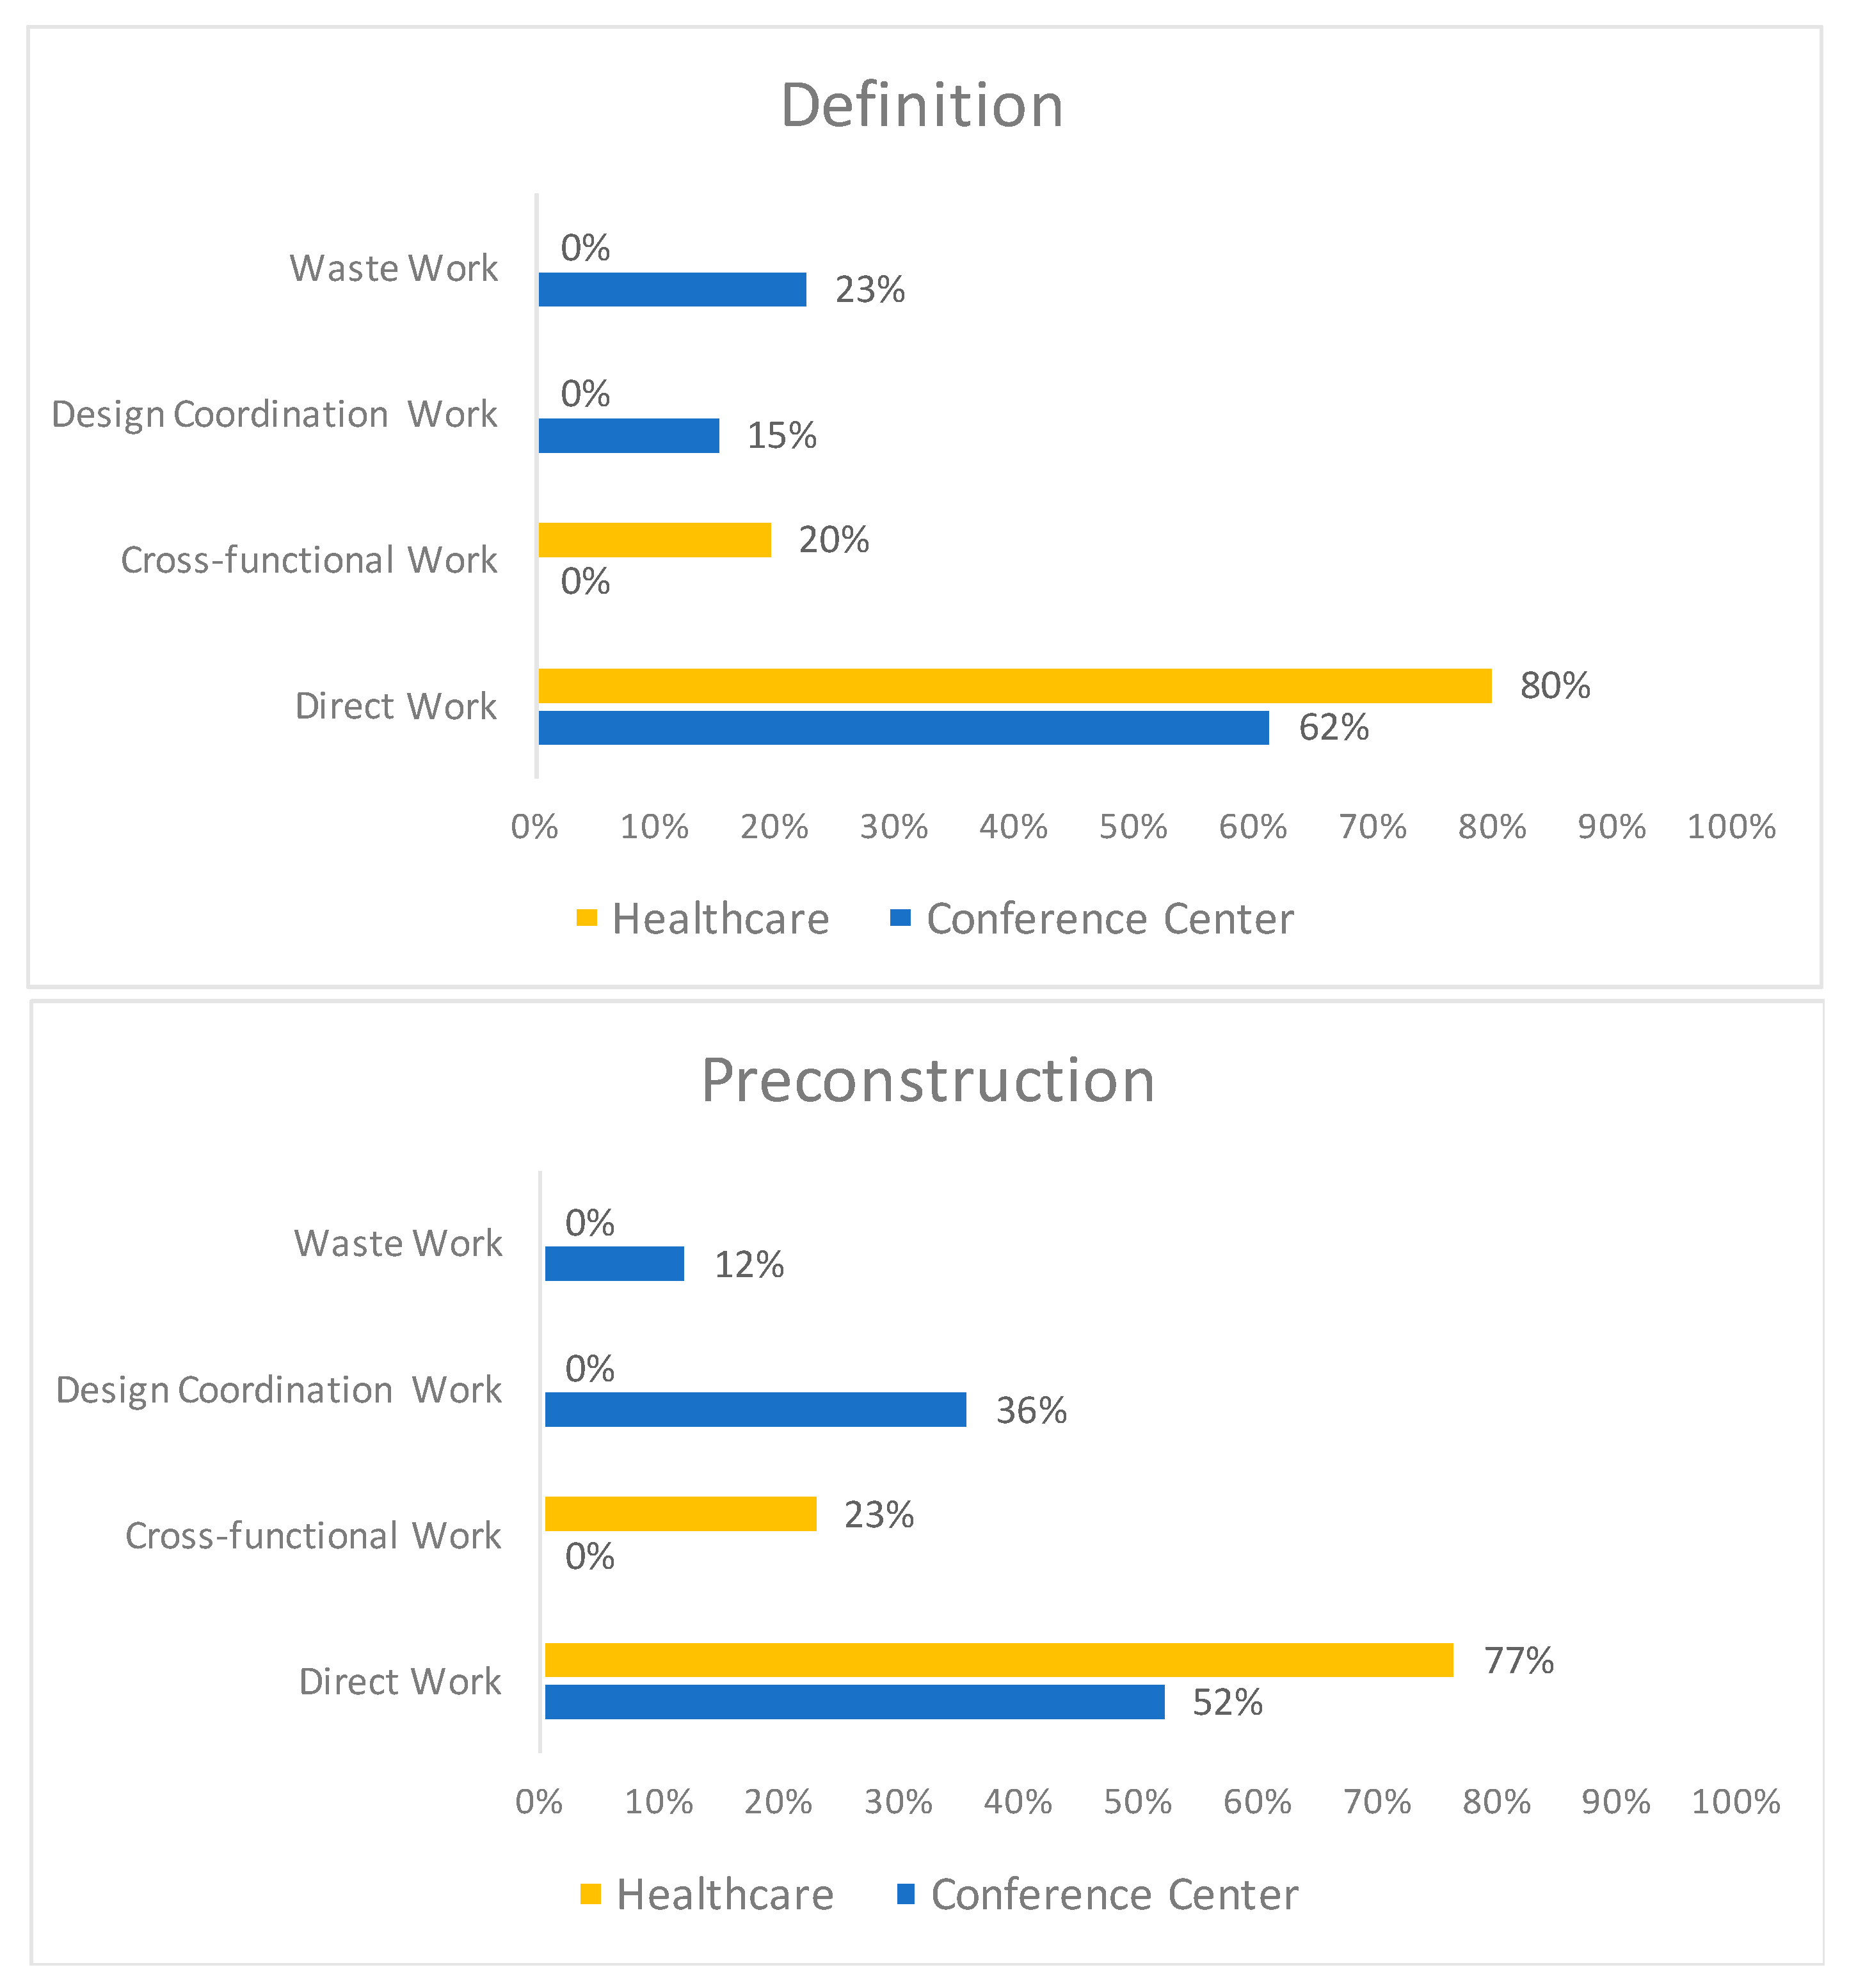
Figure 6 shows the total work in terms of the level of direct work, design coordination work, cross-functional work, and waste work in the definition and preconstruction stages for both projects. For the definition stage in the healthcare project, direct work was 80% of the total work volume, whereas cross-functional work was 20%, and waste work was 0%. This last case seems to be a very extreme and unrealistic result. However, we will discuss the reason for this result in the next section. In the conference center project, direct work was 62%, design coordination work was 15%, and waste work was 23%.
For the preconstruction stage in the healthcare project, direct work was 77% of the total work volume, whereas cross-functional work was 23%, and waste work was 0%. In the previous case, we will discuss this result in the next section. In the conference center project, direct work was 52%, design coordination work was 36%, and waste work was 12%.
The results in Figure 6 provide insights into how the key participants worked in terms of direct work, coordination work, and waste work in the definition and preconstruction stages. These results complement the conceptual analysis from a quantitative point of view since each type of work expresses a quantitative result of the links used in the conceptual model. In the next section, we will discuss these results considering the previous conceptual analysis.
6.2. Discussion of the VDT Simulation Results
From the conceptual analysis, we know that the healthcare project’s key participants were co-located and worked together in cross-functional teams in the definition and preconstruction stages. However, in the conference center project, the architect worked individually under the coordination of the owner in the definition stage. Then, in the preconstruction stage, the key consultants worked individually under the coordination of the CPD team. These organizational and operational differences between the healthcare and the conference center project created a different performance of the project organizations; the projects have different types of coordination work and different levels of direct work, coordination work, and waste work in the definition and preconstruction stages. The next paragraphs explain the performance of the project organization for both projects.
The simulation results showed that the healthcare project presents levels of direct work, cross-functional work, and a theoretical elimination of waste work. This project does not have design coordination work. The level of direct work represents the primary work of validation and design and engineering at the definition and preconstruction stages, respectively. The level of cross-functional work represents the one-to-one exchange of information among the cross-functional teams and the intensive plan of group meetings (i.e., cluster, subcommittee, TVD, and LPS meetings). That is, the level of cross-functional work corresponds to progressive and coordinative iterations. The theoretical elimination of the level of waste work represents the reduction of corrective iterations.
From the simulation point of view, this extreme result occurred because the activities in the definition and preconstruction stages do not have rework links (red dashed line in Figure 4). The fact that there are no rework links in the VDT conceptual model is due to the healthcare project’s use of different lean tools, cross-functional teams, and co-location to eliminate corrective iteration and decision waiting time and encourage progressive and coordinative iterations [31]. However, in our opinion, this result should be validated in future research.
The simulation results showed that the conference center project features levels of direct work, design coordination work, and waste work. This project does not feature cross-functional work. The level of direct work represents the primary work of basic design in the definition stage and detailed design in the preconstruction stage. The level of design coordination work represents the owner’s activities to manage the development process of design at the definition stage, as well as CPD’s activities to manage the same process in the preconstruction stage (progressive and coordinative iterations). The level of waste work represents the corrective iterations and the decision waiting time in the development process of the design. This amount of waste work is produced by different factors, such as the coordination mechanisms used by the CPD team and the lack of integration at the project level. The key consultants for design and engineering worked separately in the preconstruction phase under the coordination of the CPD team through a traditional activity of design coordination.
In summary, the simulation results showed that the healthcare and conference center projects show different performance regarding the type of work that each project developed in the definition and preconstruction stages, especially regarding coordination work. The healthcare and conference center projects have different types of coordination work; two types of coordination work that demand different requirements. In the healthcare project, the core of the coordination work is the one-to-one exchange of information and the cluster meetings. Hence, coordination efficiency in the definition and preconstruction stages depends on the efficiency of key participants in the process of sharing information and making decisions and solving problems in the cluster meetings. In the conference center project, the core of the coordination work is the activity of design coordination. Hence, the role of the owner coordinating the architect is crucial in getting the basic design at the definition stage. The role of the CPD team coordinating the key consultants is crucial in getting the detailed design at the preconstruction stage.
6.3. Sensitivity Analysis
The VDT model provides advantages in studying the design and the performance of the project organization. Although we do not have enough information to make a deep analysis of the healthcare project’s and the conference center project’s organization, we will use the available information to study how some main characteristics impact the performance of these project organizations. We chose variables of centralization and matrix strength for the sensitivity analysis because they are the project organization characteristics that differ between the two IPD projects. We also considered the impact of project error probability and project complexity on project organization performance, as they are independent variables of the project organization characteristics.
To illustrate this analysis, we will use the project organization of the conference center project at the preconstruction stage. The analysis will focus on studying how the level of centralization, matrix strength, project error probability, and project complexity impact the project organization’s performance.
Table 4 shows the project organization performance considering different scenarios, in which we changed the level of centralization, matrix strength, project error probability, and project complexity. The initial characteristics of the conference center project’s organization (Table 3) serve as the baseline scenario, and they will be used to compare it with the other scenarios (Scenario 1).
Scenario 1 reduced the level of centralization from high to low. Under this scenario, the volume of direct work increased by 2%, design coordination work had the same performance, and waste work decreased by 3%. Additionally, the duration of the preconstruction stage decreased by one month.
Scenario 2 increased the level of matrix strength from low to high. Under this scenario, the project organization had the same performance as the baseline scenario, except for the volume of waste work, which decreased by 2%.
Scenario 3 reduced the level of project error probability from medium to low. Under this scenario, the volume of direct work increased by 5%, design coordination work increased by 1%, and waste work decreased by 6%. Additionally, the duration of the preconstruction stage decreased by two months.
Scenario 4 combined the changes in Scenarios 1 to 3. Under this scenario, the volume of direct work increased by 5%, design coordination work increased by 2%, and waste work decreased by 7%. Additionally, the duration of the preconstruction stage decreased by 2.5 months.
Scenario 5 increased the level of project complexity from medium to high. Under this scenario, the project organization had the worst performance. The volume of direct work decreased by 2%, design coordination work had the same performance, and waste work increased by 2%. Additionally, the duration of the preconstruction stage increased by one month.
Scenario 6 combined the changes in Scenarios 1 to 3 and Scenario 5. Under this scenario, the volume of direct work increased by 5%, design coordination work increased by 2%, and waste work decreased by 7%. Additionally, the duration of the preconstruction stage decreased by 2.5 months.
In summary, the simulation results showed that centralization, project error probability, and project complexity are the most sensitive variables because they significantly impact the projects’ organizational performance. The conference center project’s organizational performance could be improved by reducing the level of project error probability and centralization and increasing the level of matrix strength.
The project error probability is related to waste work (Scenario 3). The higher level of project error probability, the higher the volume of waste work in terms of corrective iterations and decision waiting time. For example, the project error probability is medium (0.075) in the baseline, which means there is a 7.5% chance of corrective iterations and decision waiting time occurring in the project. If the conference center reduces the project error probability to low (<0.05), the volume of waste work decreases. In other words, there is a 5% chance of corrective iterations and decision waiting time occurring in the project. This reduction in the project error probability also reduces the duration of the preconstruction stage (Scenario 3). Similarly to the healthcare project, the conference center project could use lean tools, cross-functional teams, and co-location to eliminate corrective iteration and decision waiting time. This is a practical way to reduce project error probability in a construction project.
Centralization is related to which level of the organization structure makes the decisions in a project (Scenario 1). In the case of the conference center project, a high centralization in the baseline implies that the CPD team makes the most decisions. Thus, when a key consultant detects an “exception,” the key consultant reports the exception to the CPD team for a decision. This decision-making process among the CPD team and key consultants becomes a scenario that generates waste work in terms of corrective iterations and decision waiting time. Moreover, if the CPD team becomes backlogged, they do not attempt to decide about exceptions fast enough. According to Pikas et al. [51], the main problems in the design process are related to poor coordination, the inherent uncertainty in information flows, and the lack of timely responses from clients. Therefore, if the conference center reduces the level of centralization (i.e., the key consultants have more participation in the decision-making process), the duration of the preconstruction stage and the volume of waste work significantly decrease (Scenario 1).
Along with these previous alternatives, the conference center could also increase the level of matrix strength (Scenario 2). The matrix strength is related to the extent to which project participants are located in skill-based functional areas (low) or co-located with other skilled specialists in dedicated project teams (high). In the case of the conference center project, a low matrix strength in the baseline implies that key consultants were not co-located and worked individually in their functional area. As previously discussed, the conference center project created a hierarchical environment in which each key consultant worked individually under the coordination of the CPD team. Therefore, to improve the project’s organizational performance, the CPD team could co-locate the key consultants in order to maximize collaboration, as well as to facilitate formal and informal interaction [52]. Thus, corrective iterations and decision waiting time could be reduced.
The conference center project could also consider the level of project complexity as an important factor within the analysis of organizational performance (Scenario 5). Because of the initial characteristics of the project organization, a high level of project complexity has a negative effect on performance due to an increase in the duration and waste work (Scenario 5). The project complexity is related to the number of internal project requirements that the activity must satisfy and the amount of communication among project participants that is required to perform an activity. The higher the project complexity, the higher the number of internal project requirements and the amount of communication. For example, a routine activity with low complexity and uncertainty take less time to complete than a highly optimized design with high complexity and uncertainty. Increasing project complexity increases the number of exceptions.
Consequently, this affects activity duration and waste work [33]. One of the alternatives that the conference center could consider to address project complexity is to reduce the level of centralization and project error probability and increase the level of matrix strength (Scenario 6). The low level of centralization and the high level of matrix strength allow for improving teamwork and maximize collaboration to address the activity complexity and uncertainty. The low level of project error probability allows a reduction in the volume of waste work in terms of corrective iterations and decision waiting time.
7. Conclusions
This study presents a VDT conceptual model for studying the performance of the construction supply chain in an IPD system. The VDT conceptual model captures, in a simple way, the reality of these two IPD projects in terms of project organization and project process. This VDT model allowed us to understand how key project participants are organized and how they work in the early stages of an IPD project. In addition to this graphical representation, the VDT simulation allowed us to do a quantitative analysis of the performance of the construction supply chain in terms of three types of work: direct work, coordination work, and waste work.
The conceptual analysis of the VDT model showed different internal dynamics of integration and performance of the construction supply chain between these two IPD projects, which means that the IPD system can be structured in different ways from organizational and operational points of view. Each configuration of the construction supply chain has its characteristics and requirements regarding project organization, coordination mechanisms, and project delivery processes to support the integration at the inter-organizational and project levels.
The integration at the inter-organizational and project levels requires adequate mechanisms to support and encourage this integration. The use of a type of relational contracts, such as IFOA or ConsensusDocs 300, enables the early involvement of key participants in the definition and preconstruction stages. These contracts allow integration at the inter-organizational level; that is, the relational contract creates a cohesive unit of different organizations with collaborative alignment of process and cultures.
On the other hand, the use of lean principles and lean tools enables integration at the project level. Additionally, lean principles and lean tools could be useful to improve the performance of the construction supply by encouraging progressive and coordinative iterations and reducing the corrective iterations.
The VDT simulation results showed how the project organization’s characteristics (e.g., centralization, matrix strength) influenced the performance of the construction supply chain. This conclusion is consistent with Christiansen’s statement, “the organization can implement a set of different mechanisms to increase their ability to handle uncertainties, whether by reducing the information flow or increasing the ability to process information” [37].
This research has limitations. The VDT conceptual model is a generic model that was built from the experience of project participants in two IPD projects. The VDT model does not consider other organizational characteristics, such as the roles and responsibilities of the key participants that influence the design and the performance of the project organization in an IPD project. Furthermore, the VDT model does not analyze the construction stage. It only analyzes the project organization and delivery process in the definition and preconstruction stage. In future research, it would be advisable to study, in more detail, other characteristics in the design of the project organization in an IPD project. Additionally, it would be advisable to study the project organization and delivery process in the construction stage and how the types of project organization identified in this research affect the performance in the construction stage.
Another research limitation is the fact that this study only considers the corrective iterations as waste in design. There are other factors, such as design errors and non-value adding activities in information and workflows, that negatively impact the maximization of value in design. Future research should study how this kind of IPD project organization impacts the value generation and waste reduction in the early stages.
Another research limitation is that the healthcare project supposes that there are no rework links between activities. We assumed that there are not corrective iterations and decision waiting time due to the application of different coordination mechanisms that avoid this type of waste work. Theoretically, it could be true; however, future research should study the waste work that is generated by cross-functional work.
The Architecture, Engineering, and Construction (AEC) industry is innovating in strategies to integrate the supply chain in an attempt to achieve more collaboration and improve the process of value creation. The servitization approach is a strategy that seeks to add a service component to increase the value of their products [53,54,55]. As future research, we suggest studying how the construction industry can incorporate the servitization strategy to integrate the construction supply chain and improve the relationship between the client and specialized AEC firms during the development of the project.
Author Contributions
The authors confirm contribution to the paper as follows: Conceptualization, H.A.M., K.R.M. and L.F.A.; methodology, H.A.M., K.R.M. and L.F.A.; software, H.A.M.; validation, H.A.M., K.R.M. and L.F.A.; formal analysis, H.A.M., K.R.M. and L.F.A.; investigation, H.A.M.; data curation, H.A.M.; writing—original draft preparation, H.A.M.; writing—review and editing, H.A.M., K.R.M. and L.F.A. All authors have read and agreed to the published version of the manuscript.
Funding
This research was funded by Pontificia Universidad Católica de Chile, University of Colorado Boulder, and MECESUP program.
Acknowledgments
The authors gratefully acknowledge the experienced professionals who shared the information and knowledge of the two case illustrations. The authors also acknowledge the support provided by The Pontifical Catholic University of Chile, University of Colorado Boulder, and MECESUP program.
Conflicts of Interest
The authors declare no conflict of interest.
References
- Mesa, H.A.; Molenaar, K.R.; Alarcón, L.F. Exploring performance of the integrated project delivery process on complex building projects. Int. J. Proj. Manag. 2016, 34, 1089–1101. [Google Scholar] [CrossRef]
- El Asmar, M.; Hanna, A.S.; Loh, W.Y. Quantifying performance for the integrated project delivery system as compared to established delivery systems. J. Constr. Eng. Manag. 2013, 139, 04013012. [Google Scholar] [CrossRef] [Green Version]
- American Institute of Architects. AIA Minnesota. School of Architecture—University of Minnesota IPD Case Studies; American Institute of Architects: Minneapolis, MN, USA, 2012; pp. 1–114. [Google Scholar]
- American Institute of Architects. AIA California Council Integrated Project Delivery: Case Studies; McGraw Hill Construction: Sacramento, CA, USA, 2010; pp. 1–62. [Google Scholar]
- Sødal, A.H.; Lædre, O.; Svalestuen, F.; Lohne, J. Early Contractor Involvement: Advantages and Disadvantages for the Design Team. In Proceedings of the IGLC 2014-22th Conference of the International Group for Lean Construction, Oslo, Norway, 25–27 June 2014; pp. 519–531. [Google Scholar]
- Ashcraft, H.W. IPD Teams: Creation, Organization and Management. Available online: https://www.hansonbridgett.com/-/media/Files/Publications/IPD-Teams.pdf (accessed on 1 May 2013).
- Tillmann, P.; Berghede, K.; Ballard, G.; Tommelein, I. Developing a Production System on IPD: Considerations for a Pluralistic Environment. In Proceedings of the 22nd Annual Conference of the International Group Lean Construction, Oslo, Norway, 25–27 June 2014; pp. 317–328. [Google Scholar]
- Vrijhoef, R.; Koskela, L. The four roles of supply chain management in construction. Eur. J. Purch. Supply Manag. 2000, 6, 169–178. [Google Scholar] [CrossRef]
- Rauniar, R.; Rawski, G. Organizational structuring and project team structuring in integrated product development project. Int. J. Prod. Econ. 2012, 135, 939–952. [Google Scholar] [CrossRef]
- Yeo, K.T.; Ning, J.H. Integrating supply chain and critical chain concepts in engineer-procure-construct (EPC) projects. Int. J. Proj. Manag. 2002, 20, 253–262. [Google Scholar] [CrossRef]
- Cho, S.; Ballard, G. Last Planner and Integrated Project Delivery. Lean Constr. J. 2011, 2, 67–78. [Google Scholar]
- Jin, Y.; Levitt, R.E. The virtual design team: A computational model of project organizations. Comput. Math. Organ. Theory 1996, 2, 171–195. [Google Scholar] [CrossRef]
- Levitt, R. Overview of the Virtual Design Team (VDT) Research Program: 1988–2010. Available online: https://gpc.stanford.edu/sites/g/files/sbiybj8226/f/wp052_0.pdf (accessed on 6 May 2020).
- Christopher, M. Logistics and Supply Chain Management: Strategies for Reducing Cost and Improving Service (Second Edition). Int. J. Logist. Res. Appl. 1999, 2, 103–104. [Google Scholar] [CrossRef]
- Meng, X. The effect of relationship management on project performance in construction. Int. J. Proj. Manag. 2012, 30, 188–198. [Google Scholar] [CrossRef]
- Behera, P.; Mohanty, R.P.; Prakash, A. Understanding Construction Supply Chain Management. Prod. Plan. Control 2015, 26, 1332–1350. [Google Scholar] [CrossRef]
- Xue, X.; Shen, Q.; Ren, Z. Critical Review of Collaborative Working in Construction Projects: Business Environment and Human Behaviors. J. Manag. Eng. 2010, 26, 196–208. [Google Scholar] [CrossRef]
- Mitropoulos, P. Management-Driven Integration; Center for Integrated Facility Engineering, Stanford: Stanford, CA, USA, 1994. [Google Scholar]
- Chan, A.P.C.; Chan, D.W.M.; Chiang, Y.H.; Tang, B.S.; Chan, E.H.W.; Ho, K.S.K. Exploring Critical Success Factors for Partnering in Construction Projects. J. Constr. Eng. Manag. 2004, 130, 188–198. [Google Scholar] [CrossRef]
- Cheng, J.C.P.; Law, K.H.; Bjornsson, H.; Jones, A.; Sriram, R. A service oriented framework for construction supply chain integration. Autom. Constr. 2009, 19, 246–260. [Google Scholar] [CrossRef]
- Le, P.L.; Elmughrabi, W.; Dao, T.M.; Chaabane, A. Present focuses and future directions of decision-Making in construction supply chain management: A systematic review. Int. J. Constr. Manag. 2018, 20, 490–590. [Google Scholar] [CrossRef]
- Isatto, E.L.; Formoso, C.T. The inter-firm coordination of the construction project supply chain. In Proceedings of the 14th Annual Conference of the International Group for Lean Construction, IGLC-14, Santiago, Chile, July 2006; pp. 293–308. [Google Scholar]
- Austin, S.A.; Baldwin, A.N.; Steele, J.L. Improving building design through integrated planning and control. Eng. Constr. Archit. Manag. 2002, 9, 249–258. [Google Scholar] [CrossRef]
- Baiden, B.K.; Price, A.D.F.; Dainty, A.R.J. Looking beyond processes: Human factors in team integration. In Proceedings of the 19th Annual ARCOM Conference, Brighton, UK, 3–5 September 2003; pp. 233–242. [Google Scholar]
- Baiden, B.K.; Price, A.D.F. The effect of integration on project delivery team effectiveness. Int. J. Proj. Manag. 2011, 29, 129–136. [Google Scholar] [CrossRef]
- Fergusson, K. Impact of Integration on Industrial Facility Quality; Center for Integrated Facility Engineering, Stanford: Stanford, CA, USA, June 1993. [Google Scholar]
- Mitropoulos, P.; Tatum, C. Management-Driven Integration. J. Manag. Eng. 2000, 16, 48–58. [Google Scholar] [CrossRef]
- Baiden, B.K.; Price, A.D.F.; Dainty, A.R.J. The extent of team integration within construction projects. Int. J. Proj. Manag. 2006, 24, 13–23. [Google Scholar] [CrossRef]
- Freire, J.; Alarcón, L.F. Achieving Lean Design Process: Improvement Methodology. J. Constr. Eng. Manag. 2002, 128, 248–256. [Google Scholar] [CrossRef] [Green Version]
- Lauri, K. An Exploration towards a Production Theory and Its Application to Construction. Doctoral Thesis, Helsinki University of Technology, Espoo, Finland, 2000. [Google Scholar]
- Ballard, G. Positive vs Negative Iteration in Design. In Proceedings of the 8th Annual Conference of the International Group for Lean Construction, Brigthon, UK, 17–19 July 2000; pp. 1–8. [Google Scholar]
- Wynn, D.C.; Eckert, C.M. Perspectives on iteration in design and development. Res. Eng. Des. 2017, 28, 153–184. [Google Scholar] [CrossRef]
- ePM. SimVision Tutorial: User Guide; ePM LLC: Austin, TX, USA, 2005; p. 444. Available online: http://www.epm.cc/downloads/UserGuide_v11.pdf (accessed on 6 May 2020).
- March, J.G.; Simon, H.A.; Guetzkow, H.S. Organizations; Blackwell: New York, NY, USA, 1993; ISBN 9780631186311. [Google Scholar]
- Galbraith, J.R. Organization Design; Addison-Wesley Pub. Co: Boston, MA, USA, 1977; ISBN 0201025582. [Google Scholar]
- Galbraith, J.R. Organization Design: An Information Processing View. Interfaces 1974, 4, 28–36. [Google Scholar] [CrossRef]
- Christiansen, T.R. The Virtual Design Team: Using Simulation of Information Processing to Predict the Performance of Project Teams; Center for Integrated Facility Engineering: Stanford, CA, USA, 1992. [Google Scholar]
- Levitt, R.E.; Nissen, M.E. The virtual design team (VDT): A multi-Agent analysis framework for designing project organizations. In Proceedings of the IEMC ‘03 Proceedings. Managing Technologically Driven Organizations: The Human Side of Innovation and Change (IEEE Cat. No.03CH37502), Albany, NY, USA, 2–4 November 2003; pp. 115–120. [Google Scholar]
- Concha, M.; Mourgues, C.; Alarcón, L.F. Reference virtual design team (vdt) probabilities to design construction project organizations. Rev. Constr. 2015, 14, 29–34. [Google Scholar] [CrossRef] [Green Version]
- Ibrahim, R.; Nissen, M. Simulating environmental contingencies using SimVision®. In Proceedings of the North American Association for Computational Social and Organizational Science, Pittsburgh, PA, USA, 27–29 June 2004. [Google Scholar]
- ePM. ePM VDT Case Study: Design-Build Biotech Plant Case; ePM LLC: Austin, TX, USA, 2002. [Google Scholar]
- Kunz, J.C.; Levitt, R.E.; Thomsen, J. Intervention studies using the virtual design team. In Proceedings of the IEEE International Conference on Systems, Man and Cybernetics, Bari, Italy, 6–9 October 2019; Volume 5, pp. 4483–4487. [Google Scholar]
- Kunz, J.; Fischer, M. Virtual Design and Construction: Themes, Case Studies and Implementation Suggestions; Center for Integrated Facility Engineering: Stanford, CA, USA, 2012. [Google Scholar]
- Levitt, R.; Kunz, J. Design Your Project Organization as Engineers Design Bridges; Center for Integrated Facility Engineering: Stanford, CA, USA, 2002. [Google Scholar]
- Phillips, L.D. A theory of requisite decision models. Acta Psychol. 1984, 56, 29–48. [Google Scholar] [CrossRef]
- Lichtig, W.A. Integrated Agreement for Lean Project Delivery between Owner, Architect & CM/GC 2008. In Improving Healthcare through Built Environment Infrastructure; Kagioglou, M., Tzortzopoulos, P., Eds.; Wiley-Blackwell: London, UK, 2012. [Google Scholar]
- Rybkowski, Z. The Application of Root Cause Analysis and Target Value Design to Evidence-Based Design in the Capital Planning of Healthcare Facilities; University of California: Berkeley, CA, USA, 2009. [Google Scholar]
- Ballard, G. The Lean Project Delivery System: An Update. Lean Constr. J. 2008, 2, 1–19. [Google Scholar]
- Thompson, J.D. Organizations in Action: Social Science Bases of Administrative Theory; Transaction Publishers: New Brunswick, NJ, USA, 1967. [Google Scholar]
- ConsensusDocs Consensusdocs 300: Standard Tri-Party Agreement for Integrated Project Delivery. Available online: https://www.consensusdocs.org/Catalog/collaborative (accessed on 13 April 2013).
- Pikas, E.; Koskela, L.; Seppänen, O. Improving Building Design Processes and Design Management Practices: A Case Study. Sustainability 2020, 12, 911. [Google Scholar] [CrossRef] [Green Version]
- Silveira, S.; Alves, T. Target Value Design Inspired Practices to Deliver Sustainable Buildings. Buildings 2018, 8, 116. [Google Scholar] [CrossRef] [Green Version]
- Robinson, W.; Chan, P.; Lau, T. Finding New Ways of Creating Value: A Case Study of Servitization in Construction. Res. Technol. Manag. 2016, 59, 37–49. [Google Scholar] [CrossRef]
- Galera-Zarco, C.; Morales-Gallego, M.; Pérez-Aróstegui, M.N. Servitization in Project-Based Firms. Strateg. Chang. 2014, 23, 329–340. [Google Scholar] [CrossRef]
- Zarco, C.G.; Bustinza, O.; Perez, V.F. Adding value: How to develop a servitisation strategy in civil engineering. Proc. Inst. Civ. Eng. Civ. Eng. 2016, 169, 35–40. [Google Scholar] [CrossRef]
Figure 1.
Iterative process of data collection and validation for building the VDT conceptual model.
Figure 1.
Iterative process of data collection and validation for building the VDT conceptual model.

Figure 2.
Integrated Project Delivery team (IPD team).

Figure 3.
Project Organization—conference center project.

Figure 4.
The healthcare project’s VDT model.

Figure 5.
The conference center project’s VDT model.
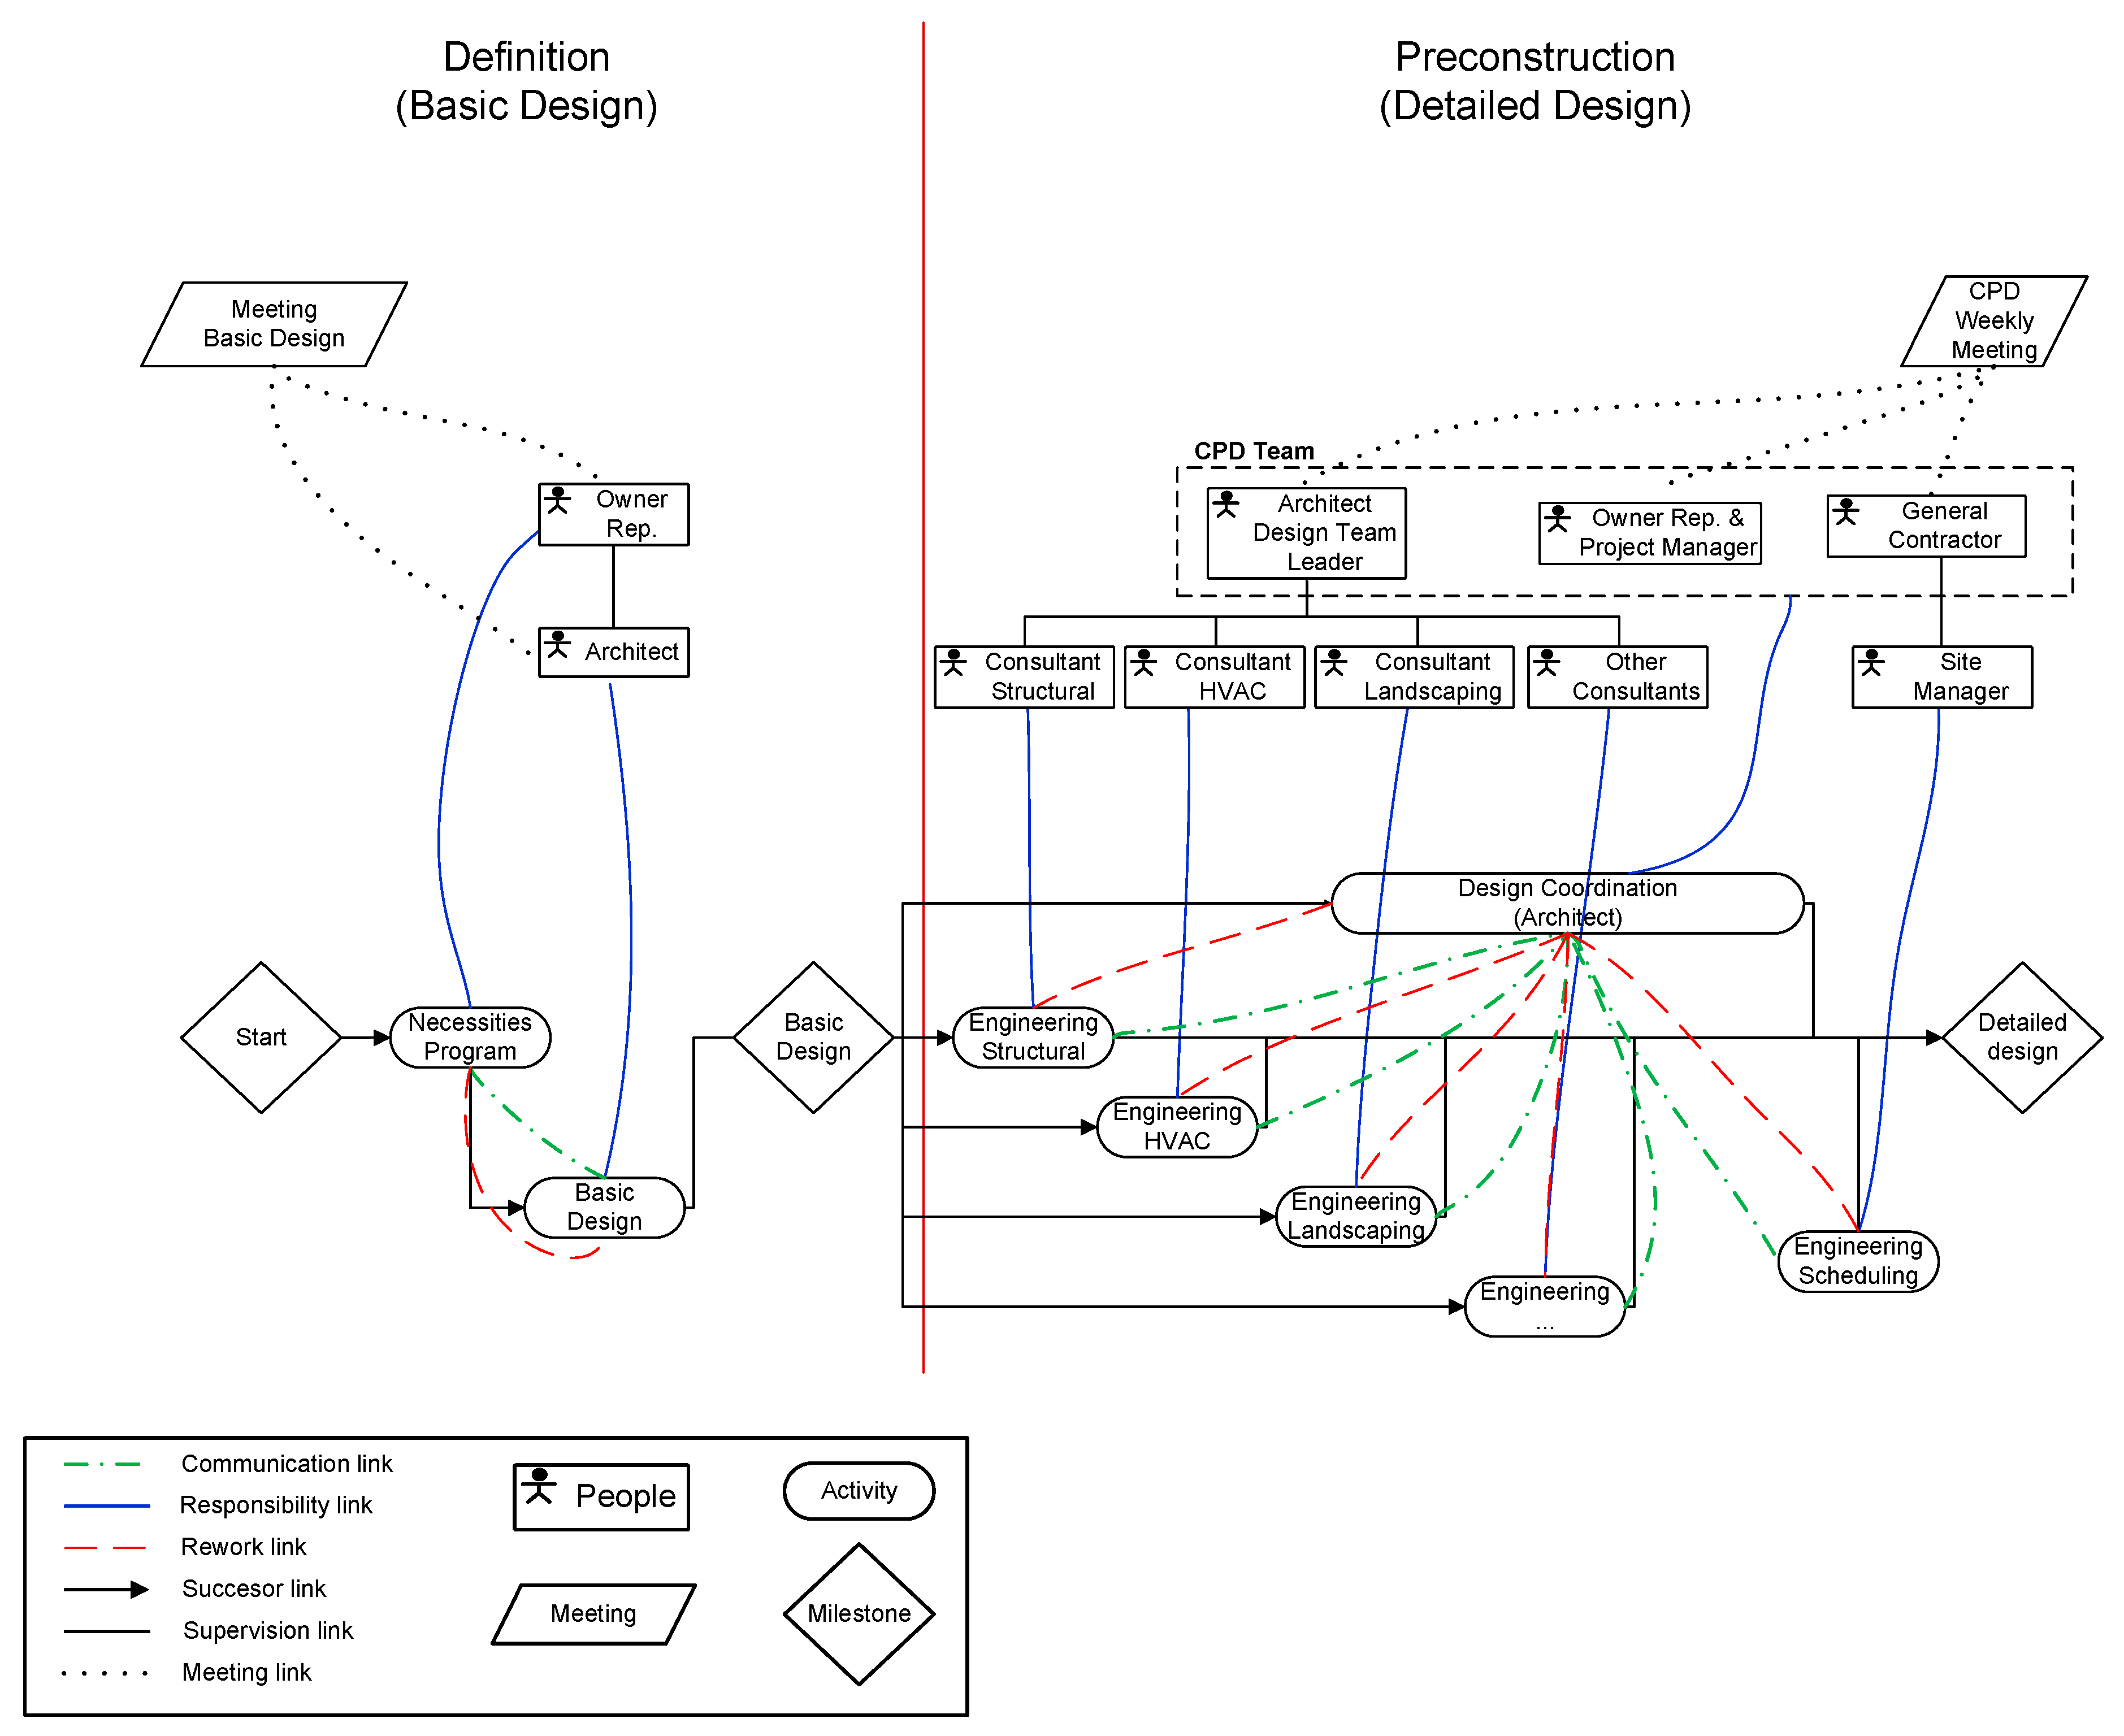
Figure 6.
Levels of direct work, cross-functional work, design coordination work, and pure waste work in the definition and preconstruction stages.
Figure 6.
Levels of direct work, cross-functional work, design coordination work, and pure waste work in the definition and preconstruction stages.


Table 1.
Interview questions to create the VDT conceptual model.
|
Table 2.
Difference and similarities of the construction supply chains of the healthcare and conference center projects.
Table 2.
Difference and similarities of the construction supply chains of the healthcare and conference center projects.
| Healthcare | Conference Center | |
|---|---|---|
| Project organization | Integrated Governance—Core Group | Integrated Governance—CPD Team |
| Cluster Groups—interdisciplinary and cross-functional groups | Functional or specialized areas | |
| Early participation of CM/GC and key subcontractors from definition stage | Early participation of CM/GC on engineering phase | |
| Coordination mechanisms | Co-location | No co-location |
| TVD, LPS, cluster and subcommittee meetings | CPD and design coordination meetings | |
| Level of integration | Integration at inter-organizational level | Integration at inter-organizational level |
| Integration at project level | No integration at project level | |
| Contractual relationship | Relational contract (IFOA) with lean principles | Relational contract (Consensus 300) without lean principles |
| Project delivery process | Process of TVD with Validation phase | Process of TVD without Validation phase |
| Operational system | Lean Project Management | Traditional Project Management |
| Tools: Target Value Design, Last Planner System, Set-based design, A3 reports, BIM | - |
Table 3.
Project organization characteristics.
| Inputs | Healthcare | Conference Center |
|---|---|---|
| Team experience | Medium | Medium |
| Centralization | Medium | High |
| Formalization | Medium | Medium |
| Matrix strength | High | Low |
| Information exchange probability | High | High |
| Project error probability | Medium | Medium |
| Project complexity | Medium | Medium |
Table 4.
Sensitivity analysis of the conference center project’s organization at the preconstruction stage.
Table 4.
Sensitivity analysis of the conference center project’s organization at the preconstruction stage.
| Project Org. Characteristics | Baseline | Scenario 1 | Scenario 2 | Scenario 3 | Scenario 4 | Scenario 5 | Scenario 6 | |
|---|---|---|---|---|---|---|---|---|
| Inputs | Team experience | Medium | Medium | Medium | Medium | Medium | Medium | Medium |
| Centralization | High | Low | High | High | Low | High | Low | |
| Formalization | Medium | Medium | Medium | Medium | Medium | Medium | Medium | |
| Matrix Strength | Low | Low | High | Low | High | Low | High | |
| Info. exchange prob. | High | High | High | High | High | High | High | |
| Project error prob. | Medium | Medium | Medium | Low | Low | Medium | Low | |
| Project complexity | Medium | Medium | Medium | Medium | Medium | High | High | |
| Outputs | Duration (months) | 24 | 23 | 24 | 22 | 21.5 | 25 | 22 |
| Direct work | 52% | 54% | 53% | 57% | 57% | 50% | 57% | |
| Design coord. work | 35% | 35% | 36% | 36% | 37% | 35% | 37% | |
| Waste work | 13% | 10% | 11% | 7% | 6% | 15% | 6% |
© 2020 by the authors. Licensee MDPI, Basel, Switzerland. This article is an open access article distributed under the terms and conditions of the Creative Commons Attribution (CC BY) license (http://creativecommons.org/licenses/by/4.0/).
Share and Cite
MDPI and ACS Style
Mesa, H.A.; Molenaar, K.R.; Alarcón, L.F. Modeling Supply Chain Integration in an Integrated Project Delivery System. Sustainability 2020, 12, 5092. https://doi.org/10.3390/su12125092
AMA Style
Mesa HA, Molenaar KR, Alarcón LF. Modeling Supply Chain Integration in an Integrated Project Delivery System. Sustainability. 2020; 12(12):5092. https://doi.org/10.3390/su12125092
Chicago/Turabian StyleMesa, Harrison A., Keith R. Molenaar, and Luis F. Alarcón. 2020. "Modeling Supply Chain Integration in an Integrated Project Delivery System" Sustainability 12, no. 12: 5092. https://doi.org/10.3390/su12125092
Note that from the first issue of 2016, this journal uses article numbers instead of page numbers. See further details here.