Article

Connected Vehicle Technology for Improved Multimodal Winter Travel: Agency Perspective and a Conceptual Exploration

1
School of Automobile and Traffic Engineering, Wuhan University of Science and Technology, Wuhan 430081, Hubei, China
2
Department of Civil and Environmental Engineering, Washington State University, Pullman, WA 99164, USA
3
Department of Civil and Environmental Engineering, West Virginia University, Morgantown, WV 26506, USA
4
Department of Civil and Environmental Engineering, University of Washington, Seattle, WA 98195, USA
*
Authors to whom correspondence should be addressed.
Sustainability 2020, 12(12), 5071; https://doi.org/10.3390/su12125071
Submission received: 5 June 2020 / Revised: 17 June 2020 / Accepted: 20 June 2020 / Published: 22 June 2020

Abstract

:
Accurate and real-time traffic and road weather information acquired using connected vehicle (CV) technologies can help commuters perform safe and reliable trips. A nationwide survey of transit operation managers/supervisors was conducted to assess the suitability for CV transit applications in improving the safety and mobility during winter weather. Almost all respondents expressed positive attitudes towards the potential of CV applications in improving winter transit travel and voiced their concerns over the safety consequences of CV equipment failure, potential of increased driver distraction, and reliability of system performance in poor weather. A concept of operations of CV applications for multimodal winter travel was developed. In the conceptual framework, route-specific road weather and traffic flow data will be used by the transit managers/supervisors to obtain real-time operational status, forecast operational routes and schedules, and assess operational performance. Subsequently, multimodal commuters can receive the road-weather and traffic-flow information as well as transit routes and schedule information.

1. Introduction

Winter weather conditions reduce the safety and mobility performance of the surface transportation system and negatively impact the economy and sustainability. According to the estimation of the Federal Highway Administration (FHWA), snowy regions cover over 70% of the nation’s roads, and nearly 70% of the U.S. population lives in these regions [1]. Snow and ice on roads reduce roadway friction and increase traffic crashes and associated property damages, injuries, and death. Nationally, snowy, slushy, or icy pavement conditions represent about 27% (over 300,000 crashes annually) of weather-related crashes [2]. Many studies have reported increased traffic crashes and fatalities due to icy/snowy conditions, where some studies found increased crash severity at the beginning of winter season [3,4,5]. Drivers tend to drive slower during winter weather, and become more focused and conservative over the course of the winter season [6].
Connected vehicle (CV) applications can be deployed to enhance the existing intelligent transportation system (ITS) strategies by supplementing or complementing current roadway sensing components (e.g., smart snowplows, road weather information systems (RWIS), dynamic message signs (DMS), and traveler information systems), thus improving the effectiveness of the system operations to react to changing road weather conditions. Smart snowplows have been increasingly used as a mobile data collection platform for enhanced winter operations, featuring automatic vehicle location (AVL) and other sensors. The 360° awareness of snowplow operators reduces the risk of crashes with vehicles, pedestrians, etc. and enhances operational efficiency. Road weather data collection will be improved by utilizing weather sensors in CVs and by transferring collected data through vehicle-to-vehicle (V2V) and vehicle-to-infrastructure (V2I) communication, which has been demonstrated in the U.S. Department of Transportation’s (USDOT’s) Weather-Responsive Traffic Management (WRTM) [7] and the European WiSafeCar project [8]. The Architecture Reference for Cooperative and Intelligent Transportation (ARC-IT) developed by the FHWA [9] has defined how CVs can contribute to road weather management data collection and information dissemination. The enhanced road weather condition information can be communicated to the general public so that they can adjust travel plans or stay home in light of inclement weather. In this context, there is an urgent need to develop the operational scenarios in which CV technologies can be deployed to improve winter road surface condition monitoring and traveler information, with a focus on multimodal travel. In this study, a nationwide survey of transit operation managers/supervisors was conducted to assess the suitability for CV transit applications in improving safety and mobility during winter weather. Using CV transit applications, transit authorities can obtain transit operational statuses, forecast route conditions, operational routes, and schedules, assess transit operational performance, and enrich winter road weather and travel information to facilitate improved multimodal winter travel. To collect, process, distribute, and communicate real-time road weather and traffic information, a concept of operations of CV applications has been developed.

2. Literature Review

This section provides a review and synthesis of the state-of-the-art and state-of-the-practice literature on CV applications for winter road weather management and CV applications for multimodal travel.

2.1. CV Applications for Winter Road Weather Management

RWIS stations at fixed locations and manual patrolling are widely adopted by Departments of Transportation (DOTs) to understand and forecast winter weather and pavement surface conditions for the implementation of proper maintenance activities (e.g., plowing, deicing, anti-icing). However, pointwise RWIS data and manual patrolling are inadequate when it comes to detecting and forecasting the surface conditions of the huge road network maintained by DOTs [10,11]. Thus, there is an interest in “filling in the gaps” between RWIS stations by using mobile sensors mounted onto patrol vehicles and plows [12]. The broad availability of road weather data from an immense fleet of mobile sources will vastly improve the ability to detect and forecast road weather and pavement conditions [13]. CV technologies can provide connectivity and communication between data from mobile sensors, such as vehicle probes, and data from fixed RWIS stations [5]. The combination of CV data and RWIS data has the potential to collect a rich temporal and spatial data set of road and atmospheric conditions for the meteorological and transportation agencies [9].
Many researchers and transportation communities have explored how to capitalize on CV technologies to enhance safety and mobility, but few are specifically geared towards implementing CV technologies to improve winter travel. Two winter-specific topic areas that can be improved by CV technologies are winter road maintenance operations and road weather advisories/warnings for travelers. The U.S. FHWA and state DOTs have jointly conducted a series of pilot CV projects to promote the effectiveness of the winter road maintenance program. For example, both the Michigan DOT and the Iowa DOT have used smartphones to take snapshots at predetermined intervals to estimate winter road conditions [14,15]. A road weather management solution/program known as Integrated Mobile Observations (IMO) under the FHWA Every Day Counts program has been working with 23 state DOTs to collect weather and road condition data from government fleet vehicles, such as snowplows with ancillary sensors installed on the vehicles [16]. Similar CV applications have also been piloted in other countries, including France and Sweden [5]. To predict road surface conditions during winter, Linton and Fu [17] combined road surface images collected through smartphone devices with the nearby road weather information system (RWIS) stations’ data through a CV platform. The authors reported an average improvement of 18% over a smartphone-based road surface classification system. Li et al. [18] used CV speed data to measure winter maintenance performance on Interstate 80 for a snowstorm on 2–3 February 2016.
Additionally, CV technologies can better inform drivers about the real-time road weather information and provide travel advisories and warnings pertaining to snow, ice, and other severe weather and roadway conditions. The Minnesota DOT (MnDOT) has installed network video dash cameras and ceiling-mounted cameras on one-quarter of MnDOT’s total snowplow fleet. These cameras automatically captured snapshots of road conditions during plowing, and the images were shared with the traveling public in near-real-time through the MnDOT travel information website and MnDOT 511 mobile app [5]. The Clarus system, a one-stop-shop project, integrates weather and road condition information and displays the informain in a website for a four-state region (i.e., California, Oregon, Washington, and Nevada) using closed-circuit television (CCTV), national weather service (NWS), and other data sources [19]; CV data are envisioned to contribute to the quality and effectiveness of such projects.

2.2. CV Applications for Multimodal Travel

The ITS Joint Program Office of the USDOT focused on the transit CV safety research area by studying transit vehicle collision characteristics [20]. The six application areas recommended for development, in order of priority, are: (i) Transit-Vehicle/Pedestrian Warning Application, (ii) Bus Stop Warning Application, (iii) Left-Turn Assist Warning Application, (iv) Forward Collision Warning Application, (v) Blind-Spot Warning/Lane-Change Warning Application, and (vi) Angle Collision at Intersections Warning Application. The top-priority transit CV application (Transit Bus Stop Pedestrian Warning (TSPW)) was subsequently funded for the development of a Concept of Operations with detailed scenarios of the transit bus and pedestrian positioning and the anticipated hardware, software, and equipment needed for implementation [21]. The application is geared towards alerting pedestrians at bus stops of approaching and departing transit vehicles, as well as alerting transit vehicles and other CVs of pedestrians in danger of collision with the vehicles.
The USDOT launched three CV pilot programs in Wyoming state, Tampa in Florida state, and New York City (NYC) in NY state by establishing cooperative agreements with the Wyoming Department of Transportation (WYDOT), Tampa Hillsborough Expressway Authority, and New York City Department of Transportation (NYCDOT), respectively. The CV pilot deployment program of WYDOT was focused on developing CV applications (i.e., travel guidance, travel advisories, roadside alerts, and parking notifications) to reduce the impact of adverse weather on truck travel on the I-80 corridor [22]. On-board CV applications included forward collision warning, I2V (infrastructure to vehicle) situational awareness, distress notification, work zone warnings and spot weather impact warning. Pilot deployment reported a reduction of crashes and speed limit violation on the I-80 corridor [23]. The CV pilot deployment program of the Tampa Hillsborough Expressway Authority (THEA) was focused on enhancing mobility, increasing safety, and reducing emissions. CV applications included travel advisories, roadside alerts, transit mobility enhancements, and pedestrian safety [24]. Approximately one thousand privately owned vehicles, eight streetcar trolleys, and ten buses were equipped with CV technology to enable communication between each other and forty seven roadside units mounted on existing roadside infrastructures. A total of 88% of safety warnings issued to CV drivers were reported to be accurate [25]. The goal of the NYCDOT pilot project was to deploy CV applications in the dense NYC urban transportation system to improve the safety of travelers and pedestrians. CV applications to assist pedestrian movement included alerting drivers on the pedestrian crossings at signalized intersections and assisting visually impaired pedestrians by informing about crosswalk orientation and pedestrian signal status [23,26]. The preliminary results reported highly reliable CV-supported communication in urban canyon conditions [27].
In exploring an operational concept for transit travelers in a CV world, Gabriel Lopez-Bernal [28] provided a vision of more direct communication from the transit agency to the traveler with enhanced service details (e.g., seat availability, bike rack availability, fare information). In addition to the roadside and transit vehicle communication hardware, the system requires standardized messages to be shared with users. Smart transit stops, kiosks, and other infrastructures would be particularly beneficial to travelers without the transit application installed on their personal mobile devices. The improved mobility of this vision was predicated on data exchange from transit vehicles to multiple centers (e.g., traffic management centers, transit management centers, and emergency management centers), as detailed in [28]. Yang et al. [29] developed a transit signal priority algorithm to control multimodal traffic using CV data. In addition to minimizing delay due to signal or schedule delay for buses, the algorithm can reduce delays for other vehicles as well. The performance of the developed algorithm was found to be sensitive to the bus passenger occupancy and bus dwell time. Ahn et al. [30] demonstrated a multimodal intelligent traffic signal system, where information was integrated from CVs, nomadic devices (e.g., smartphone), and existing infrastructure. This system included transit signal priority, emergency vehicle priority, freight signal priority, and mobile-accessible pedestrian signal system applications. Applying the system, a reduction of overall vehicle delays of up to 35% and an increase of traffic speed of up to 27% were observed.
Despite the fact that 17% of all motor vehicle fatalities were related to bicyclists, pedestrians, and other non-vehicle occupants in 2013, there are only a few studies on the interactions of CVs with pedestrians and bicyclists [31]. Hashimoto et al. [32] assumed the availability of pedestrian and CV connectivity to model pedestrian crossing behavior at signalized intersections. CVs were anticipated to assess pedestrian states (i.e., position, motion type, and crossing decision) and intersection context information (e.g., number of signal phases, state of traffic signal). With the available information, the proposed model was able to estimate pedestrians’ crossing decisions in a few seconds (i.e., two seconds to recognize the crossing decision and three to four seconds to determine the decision to wait for the next pedestrian phase). Notably, the Pedestrian and Bicycle Information Center has listed ten key challenges that will need to be overcome to ensure the safe mobility of pedestrians and cyclists in the CV environment [33]. The challenges identified regarding V2X (vehicle to everything) communication are: (i) Designing a CV environment that will be beneficial even if the penetration of CV technology is not ubiquitous, and (ii) preventing the occurrence of new blind spots or any unintentional consequences (e.g., obscuring sight distances by roadside objects, or excluding commuters who do not carry connected devices, such as children and low-income population). The Texas DOT and U.S. FHWA developed a concept of operation plan for a CV Test Bed to improve transit, bicycle, and pedestrian safety [34]. In addition, a small business innovation research (SBIR) grant has led to the development and testing of hardware and software for a connected bicycle to communicate with infrastructure and CVs, and is currently conducting pilot tests [35].

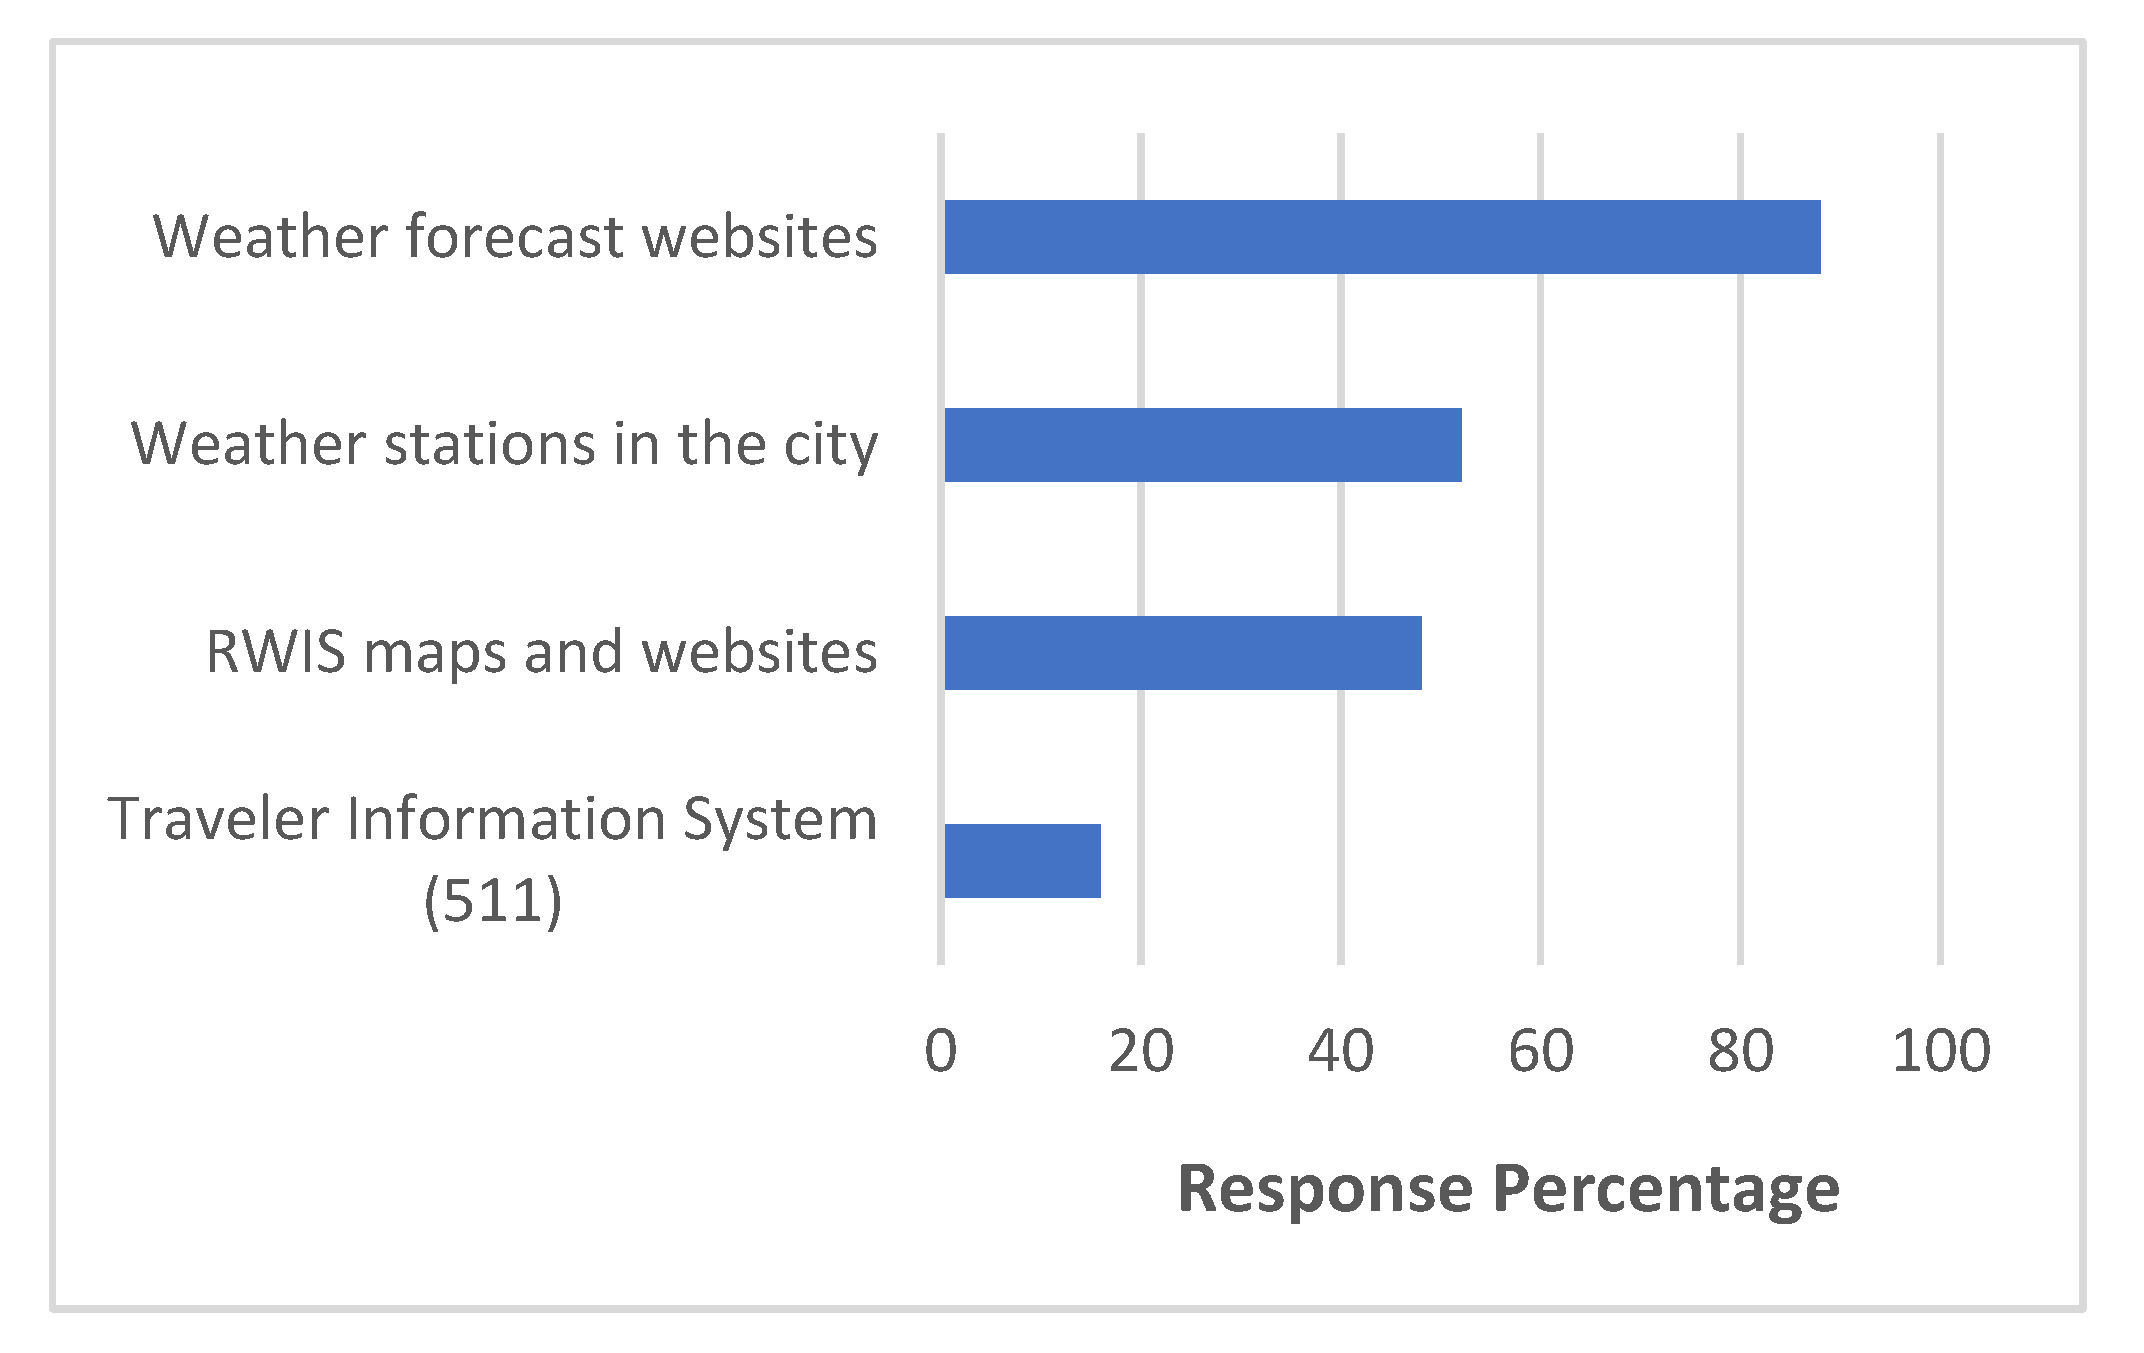
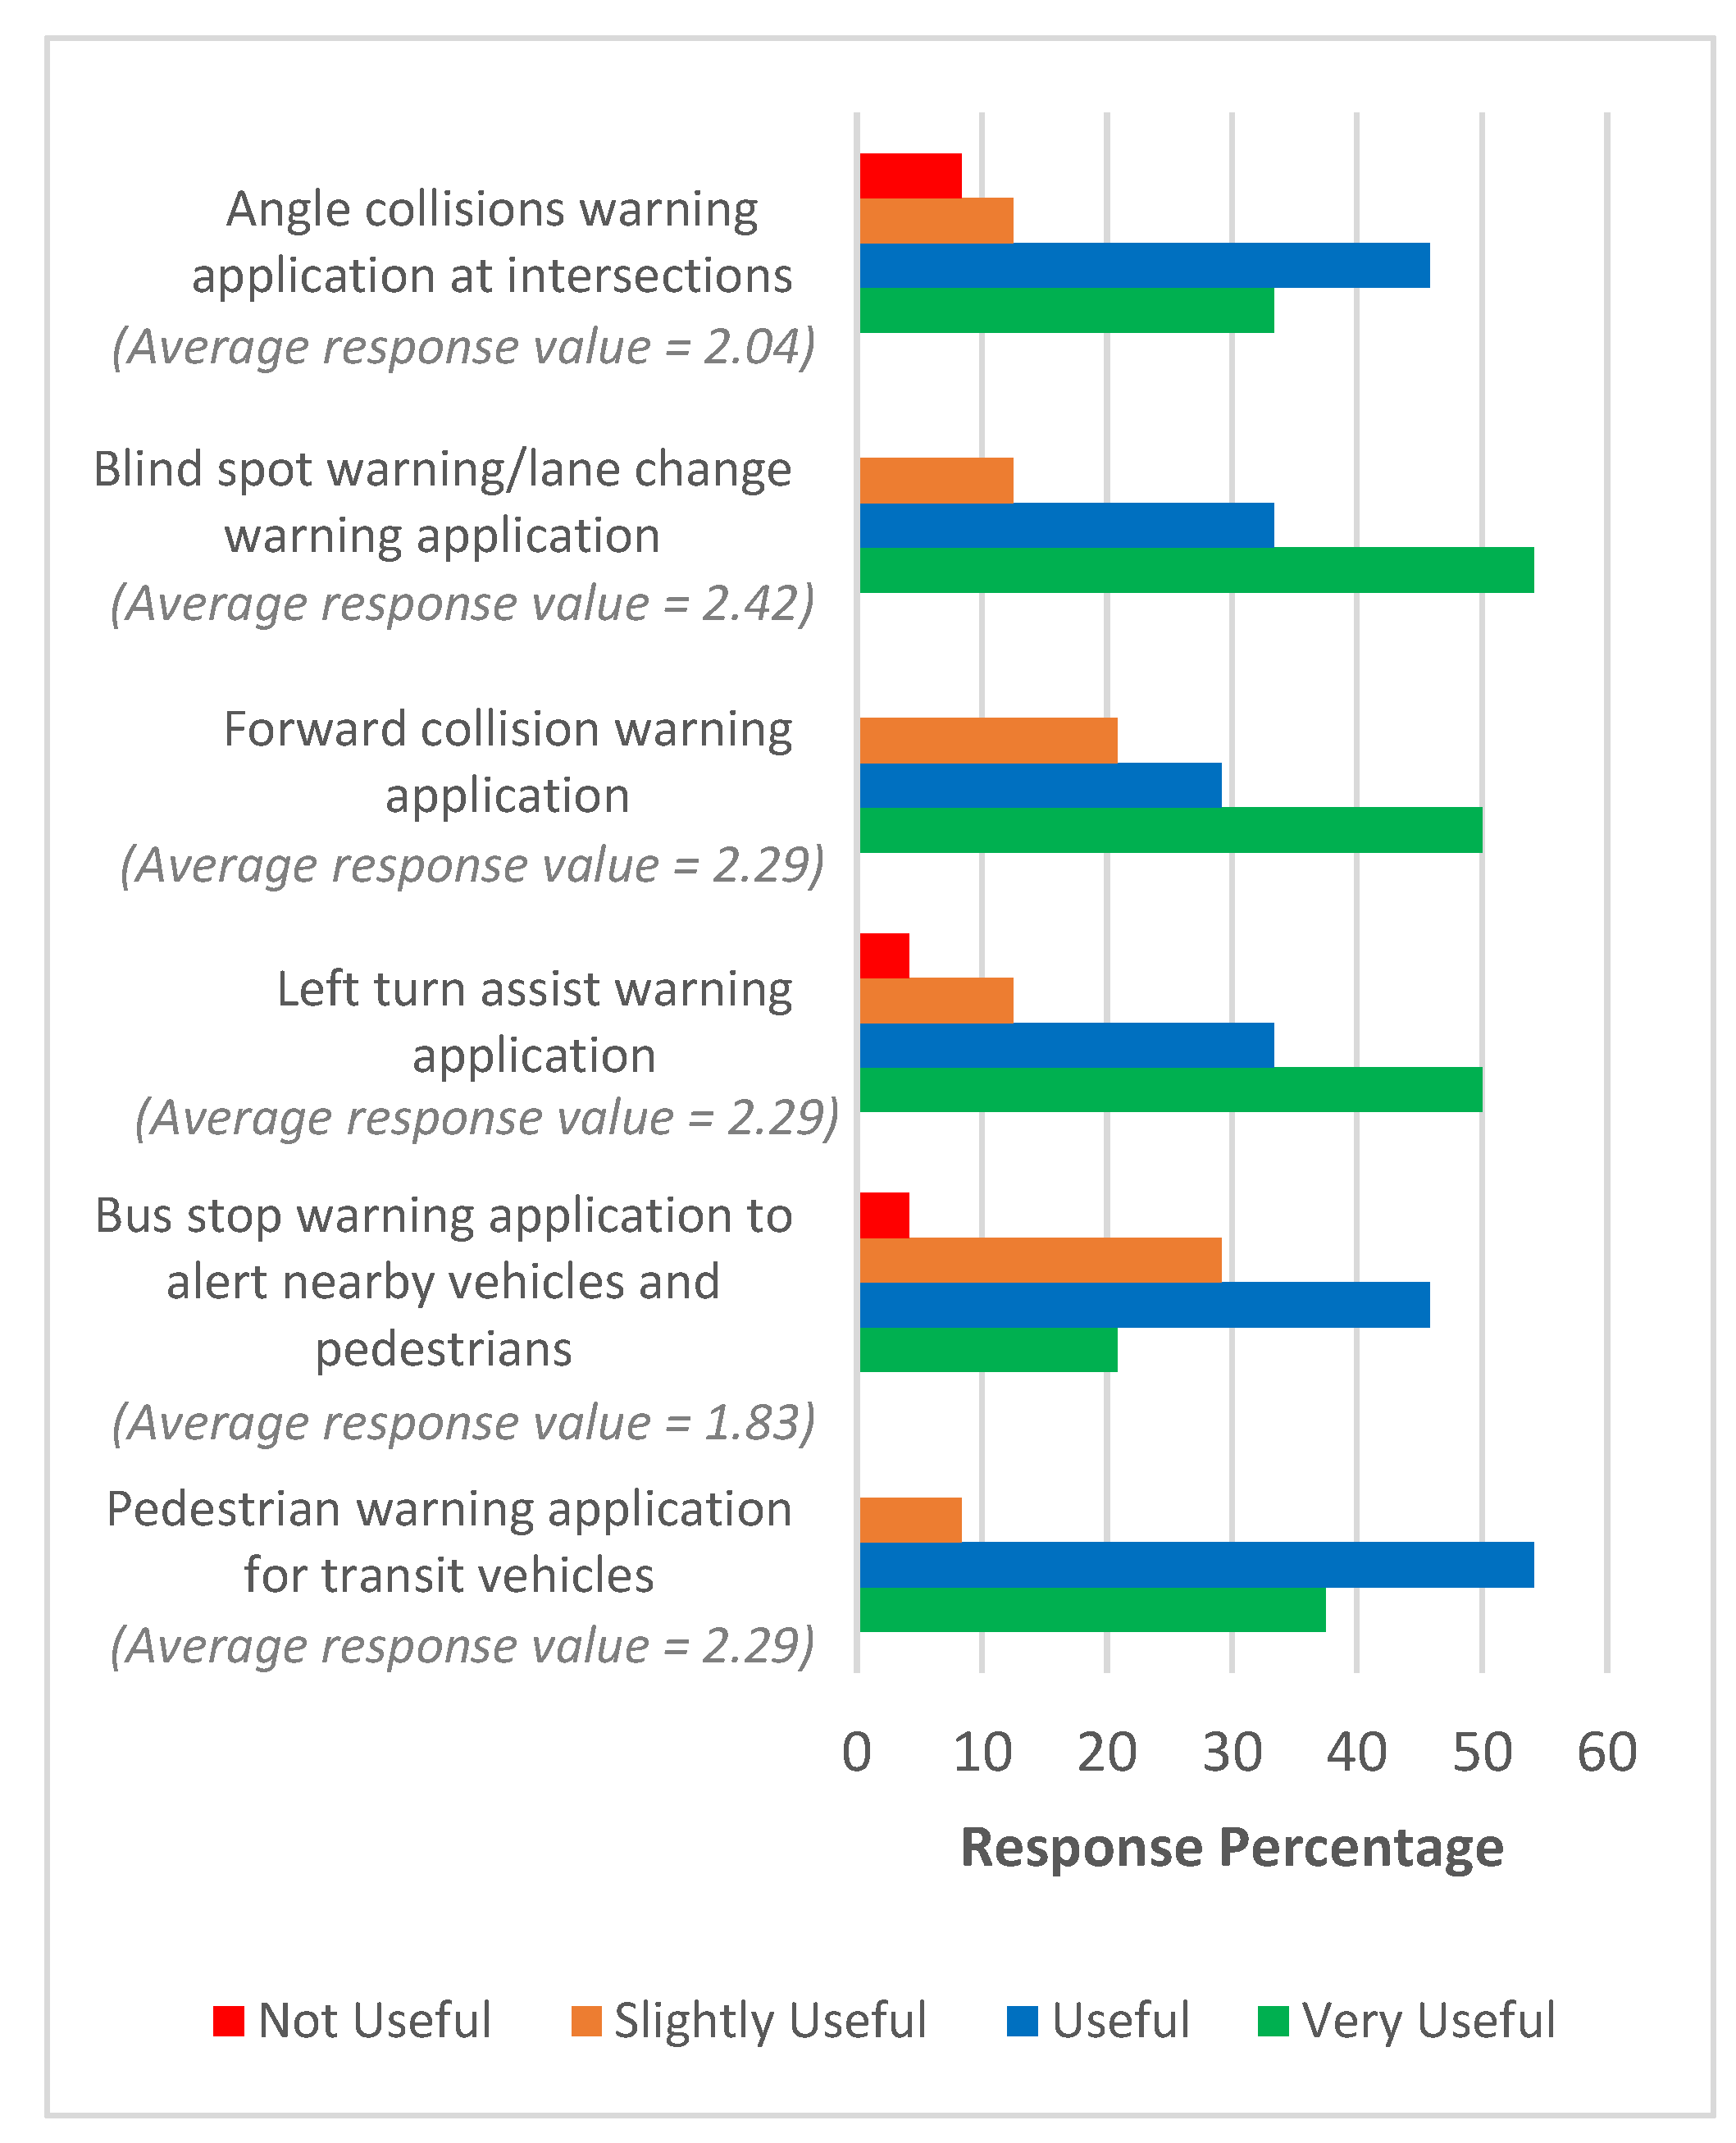
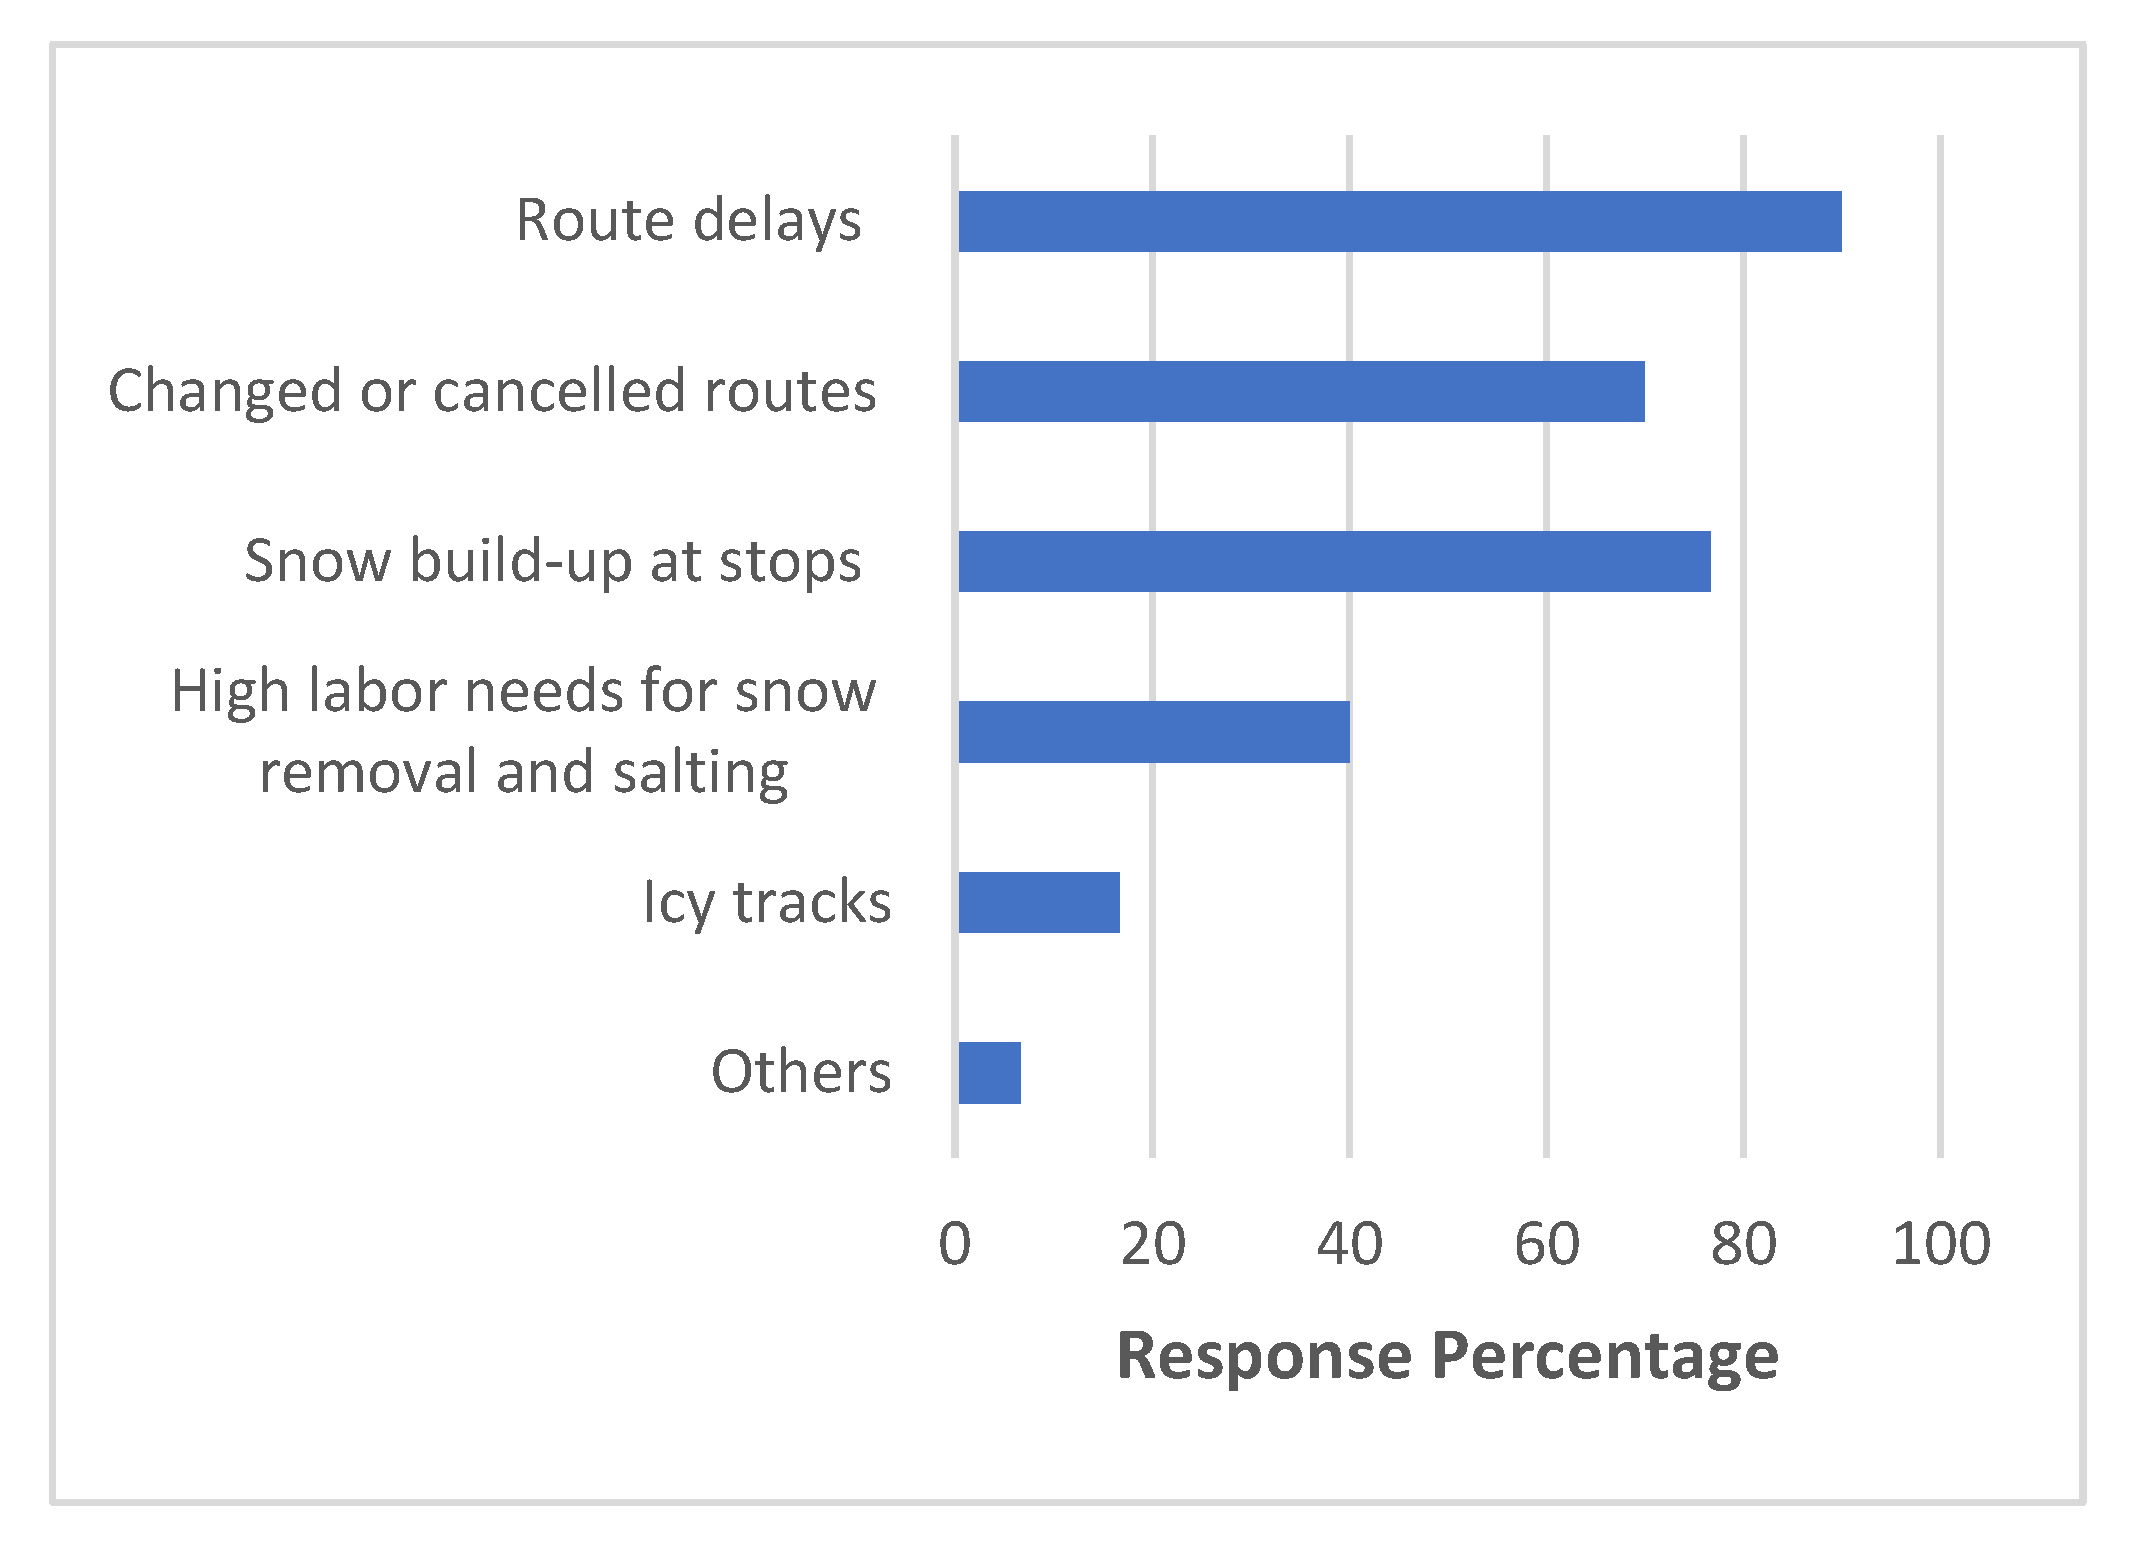
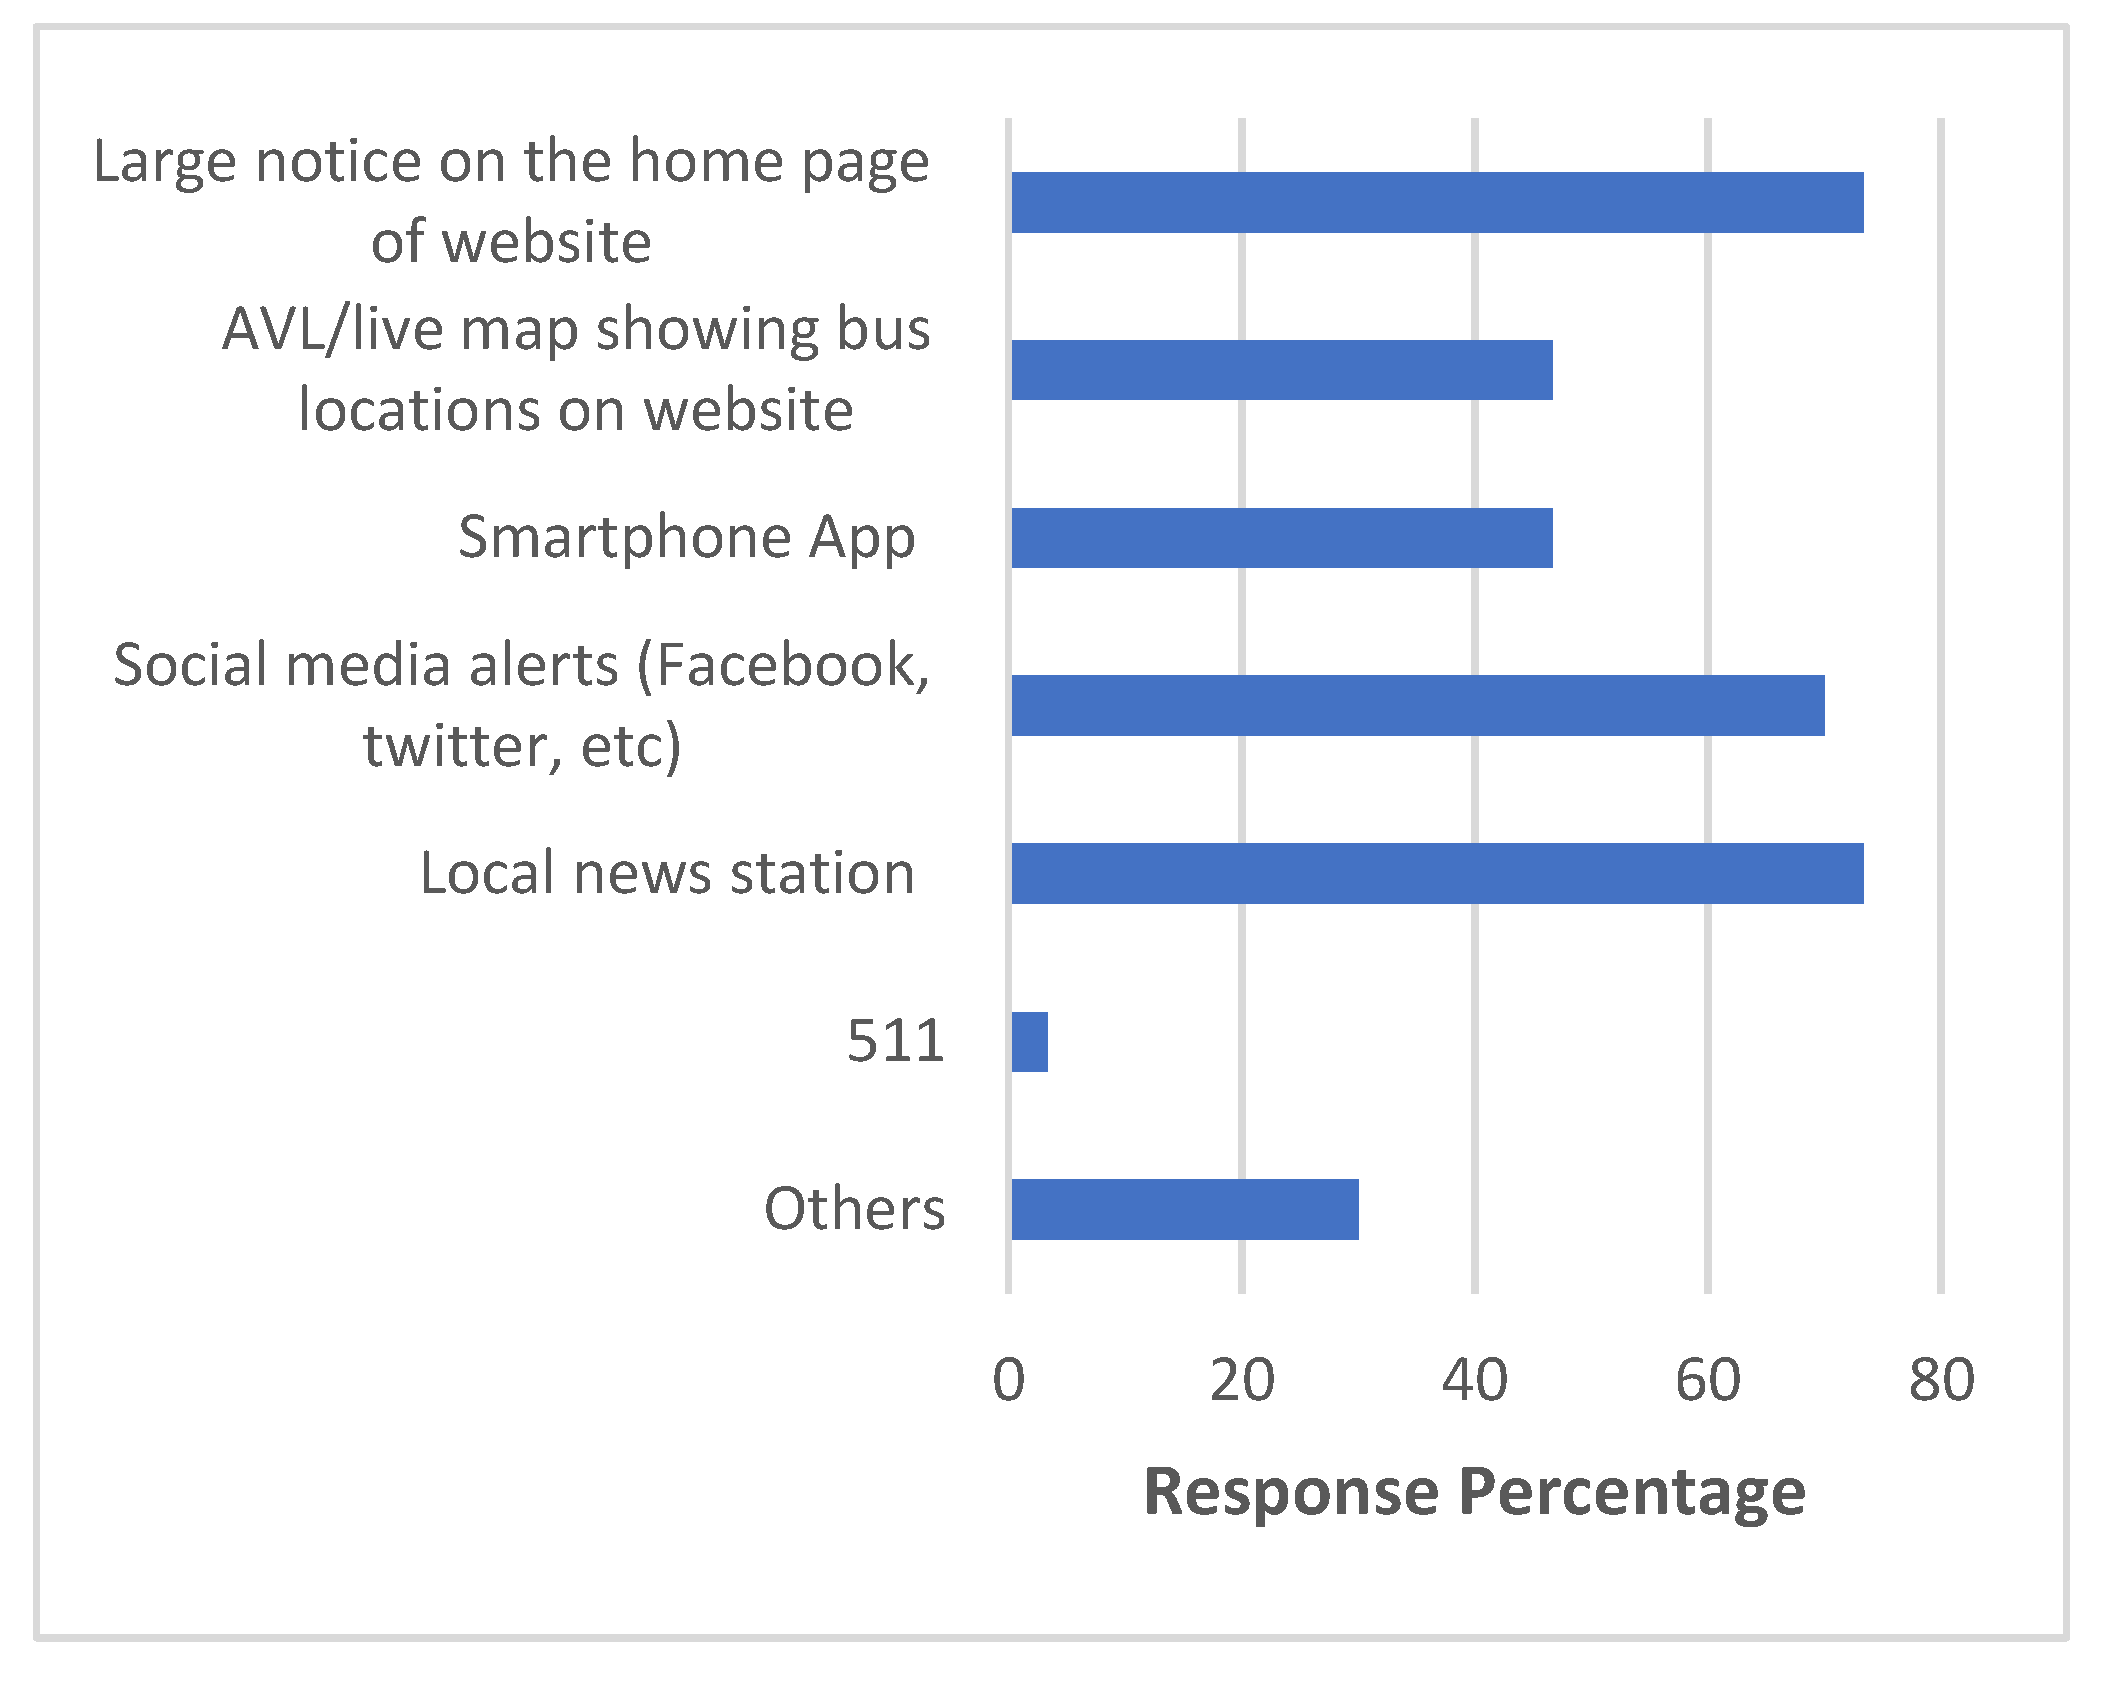
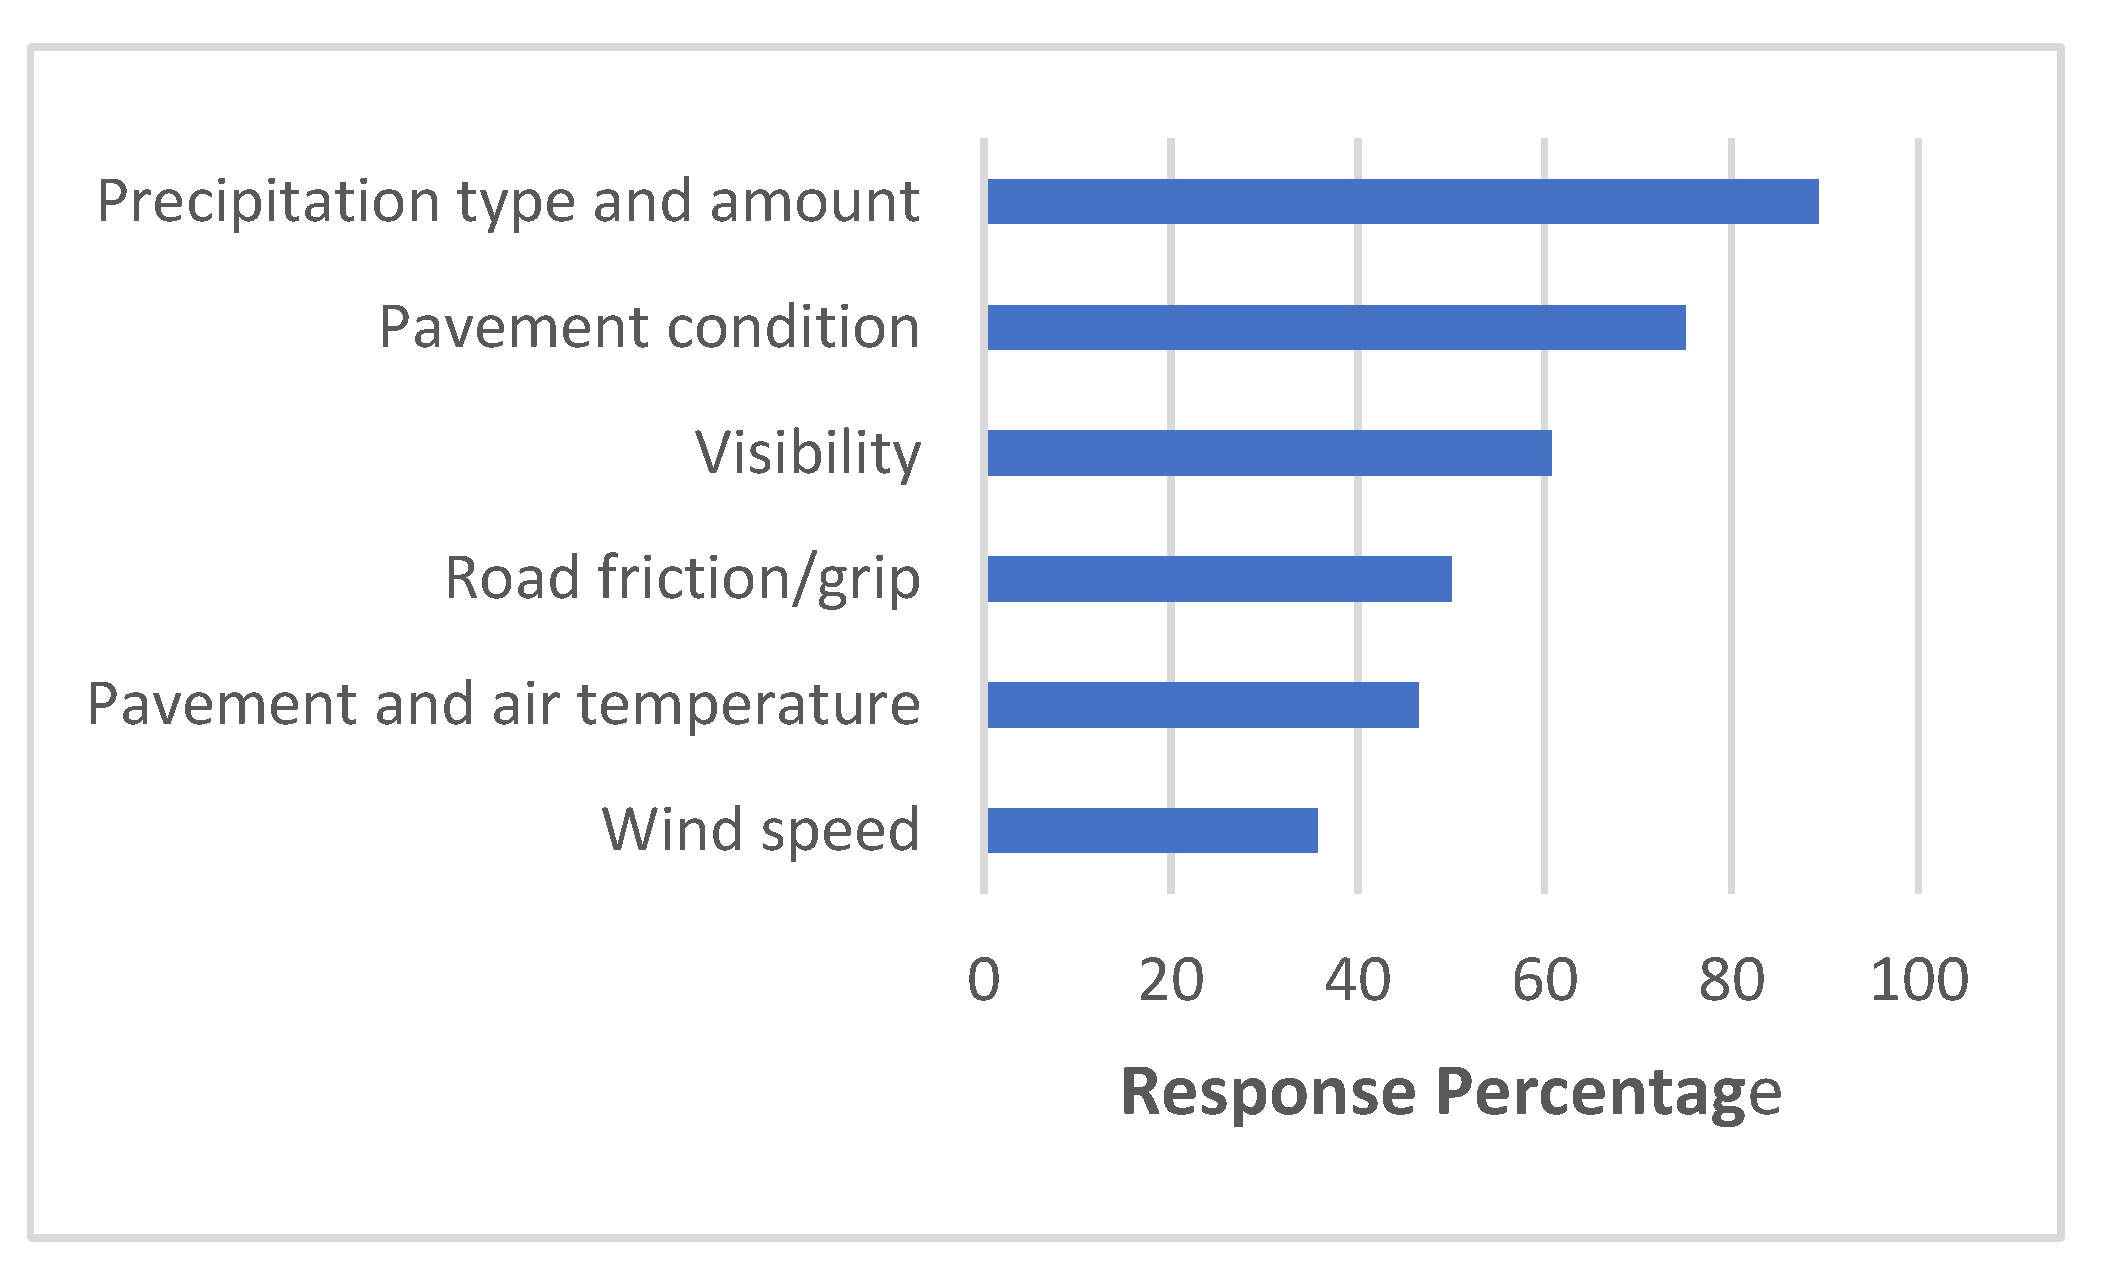
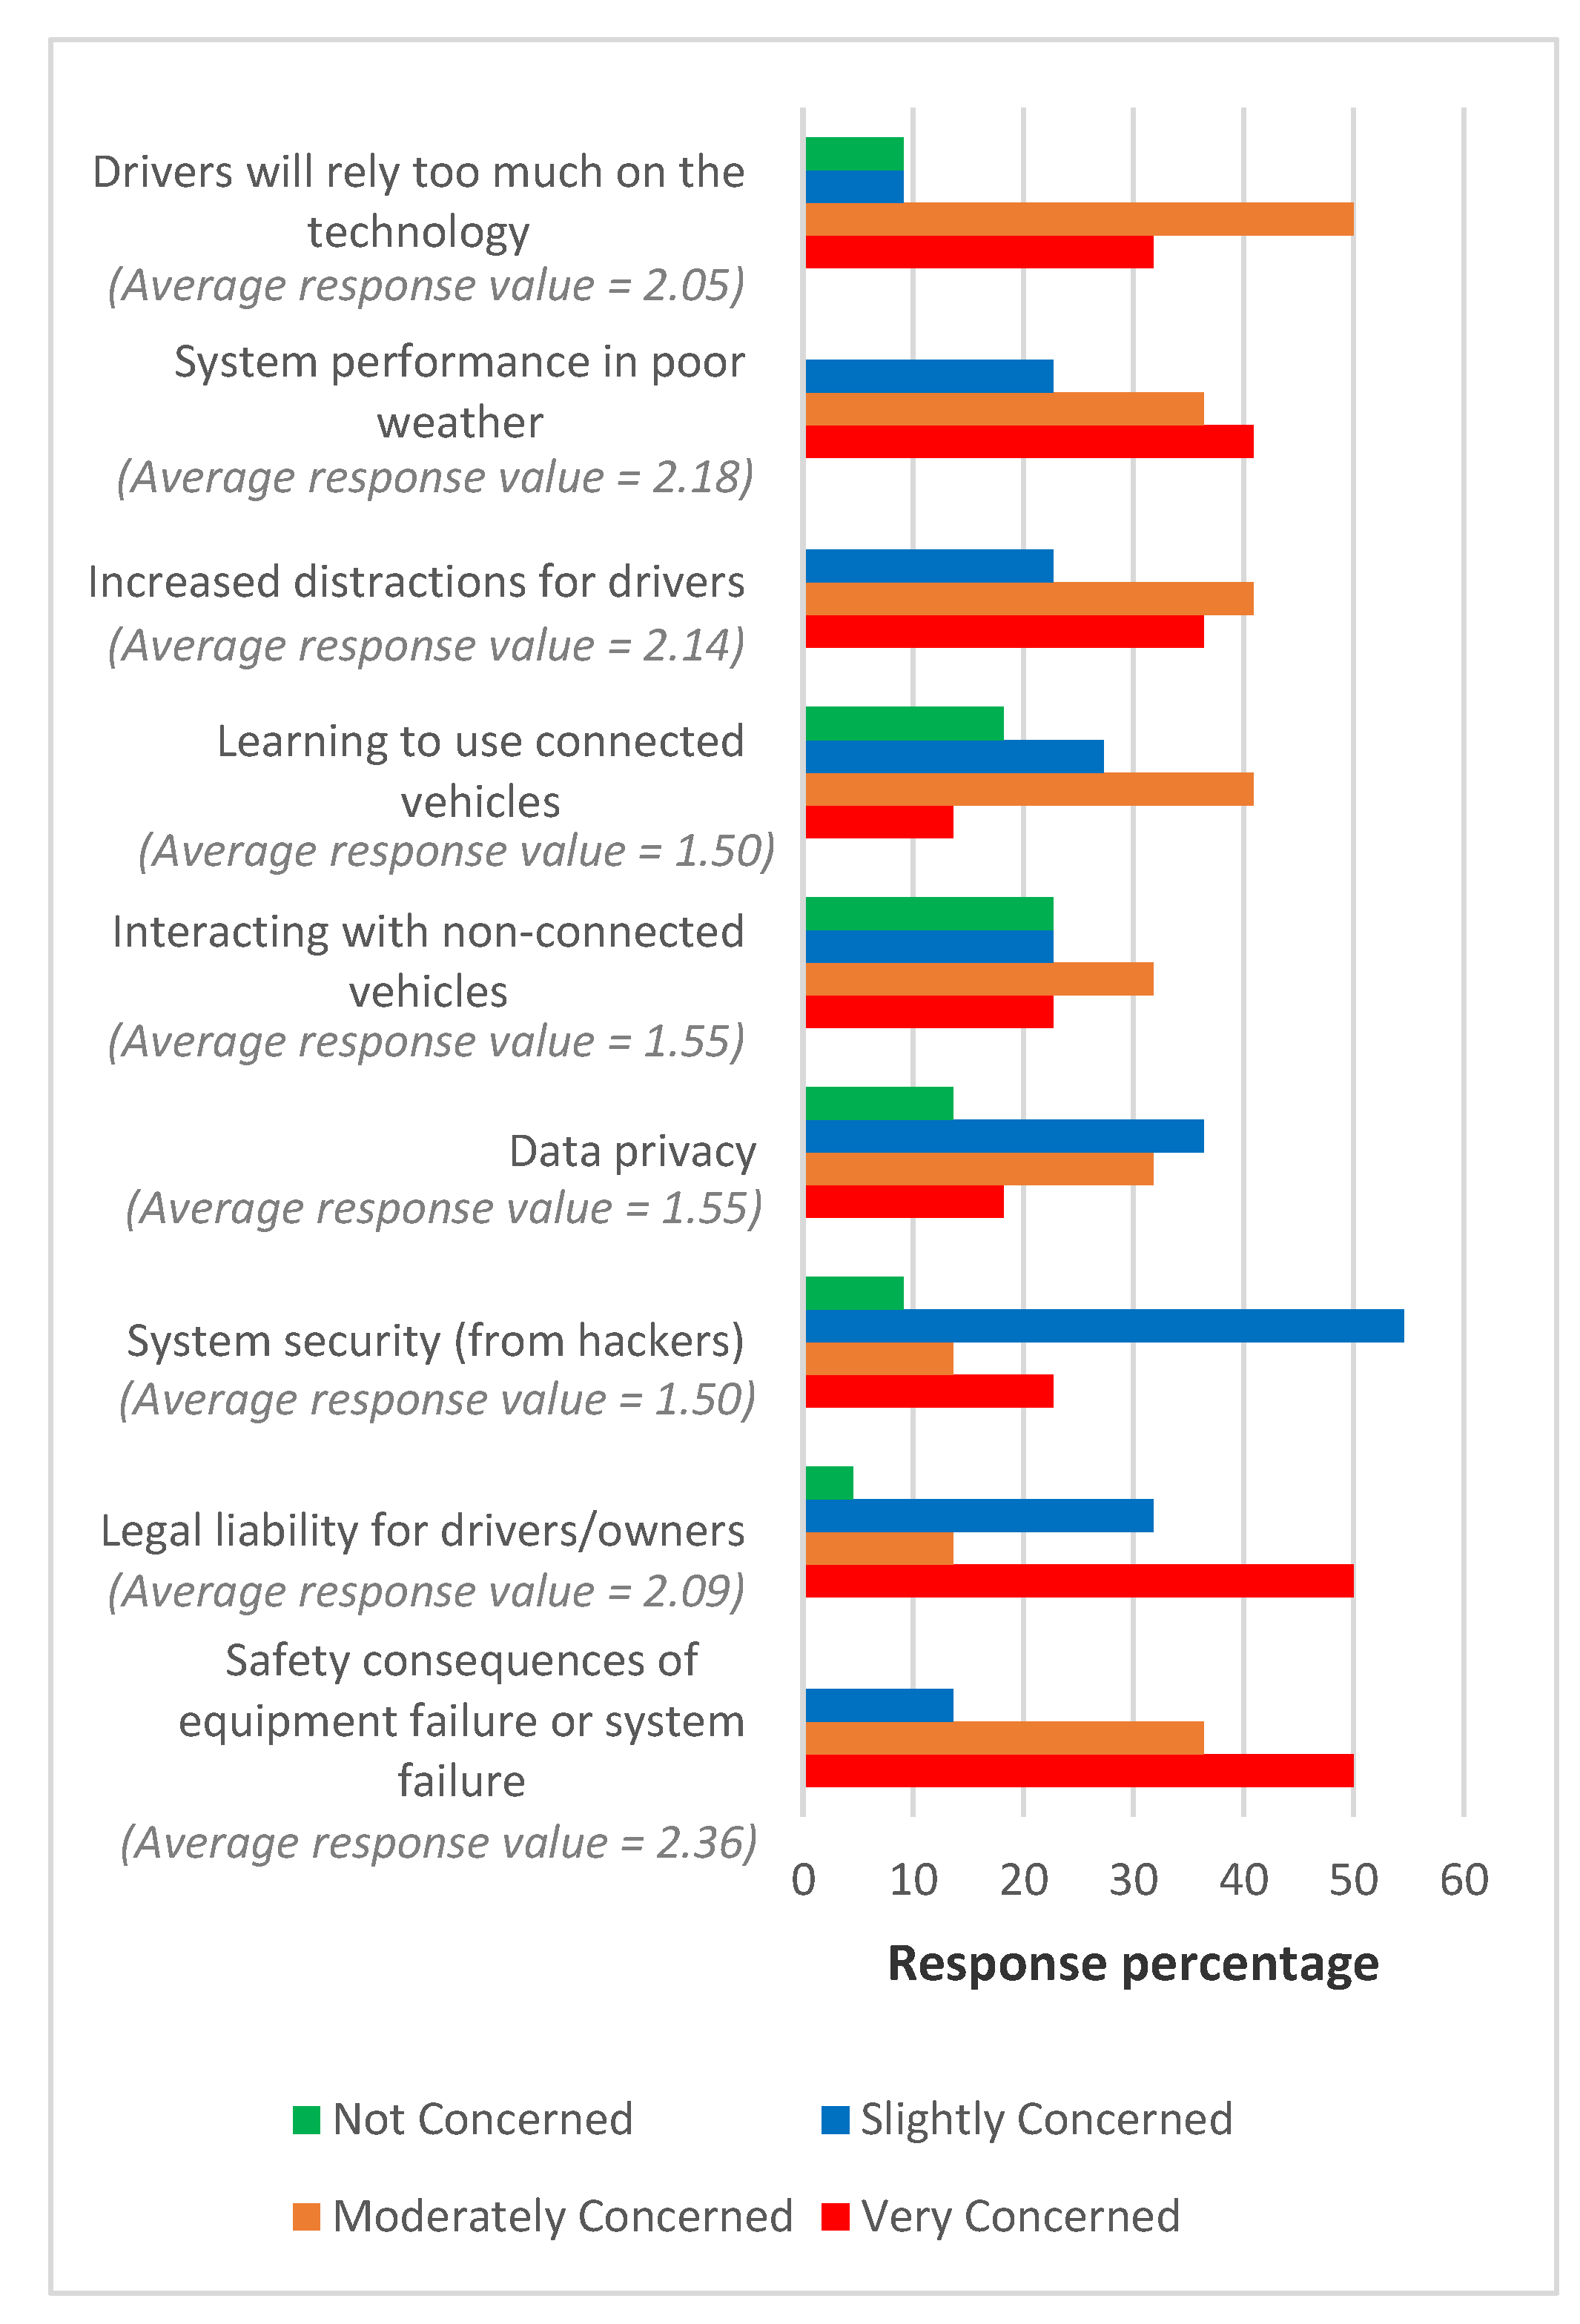
3. National Survey of Transit Agencies

City fleet vehicles, transit vehicles, and voluntary private vehicles can be equipped with CV technologies to gather mobile road weather data. In this study, a survey was designed to gather information from transit operation managers/supervisors on their relevant insights about CV-supported transit operations considering the potential of connected transit vehicles to enrich winter road weather data, where transit CVs will assist multimodal commuters with real-time transit schedules, transit routes, and other information (e.g., seat availability, fare information, and bike rack availability), as the users of other modes of transportation depend on transit during bad weather conditions (e.g., blizzards) [36]. The survey assessed the priorities of transit operation managers/supervisors for transit CV applications and technology implementation concerns. Analysis of this survey revealed the needs, priorities, and concerns of transit operation managers/supervisors on transit CV technologies and the importance of road weather data collected through the implementation of CV technologies. Table 1 summarizes the questions asked in the survey.
The online survey questionnaire was distributed to over 50 large transit agencies in the U.S. In total, the research team collected 30 effective responses from city transit authorities in Washington State, Idaho, Montana, North Dakota, South Dakota, California, Nevada, Iowa, Kansas, Utah, Colorado, Missouri, Michigan, Indiana, Illinois, Pennsylvania, Virginia, Maine, New Hampshire, Massachusetts, and Connecticut (Figure 1).
Respondents were asked to select impacts of winter weather on transit operations from several pre-defined options, and were provided an open-ended option to capture additional factors beyond the pre-defined options. The provided pre-defined options were route delays, changed or canceled routes, snow build-up at stops, high labor needs for snow removal and salting, and icy tracks. Route delays and snow build-up at stops were identified as the most significant impacts (90% and 77% of respondents selected these, respectively) of winter weather, followed by changed or canceled routes (70%) and high labor needs for snow removal and salting (40%) (Figure 2). Only a few agencies identified icy tracks as a concern, as not all respondents have rail transit. Absence of employees due to extreme winter weather conditions was found most notable among the impacts listed in the open-ended option.
Transit authorities use a variety of means to communicate with transit users when winter storms cause delays or cancellations of service, including a large notice on the homepage of the corresponding transit website (73%), local news stations (73%), social media alerts (70%), AVL/live map showing bus locations (47%), and smartphone apps (47%) (Figure 3). Thirty percent of the respondents used additional means of communication beyond the listed options. Those communication mediums include variable message signs at transit stations, text and email updates to registered transit users, and customer service hotline numbers. One transit agency notifies large employers and resorts in the service area to communicate service information to transit users.
The useful road weather information during winter storms, in order from high priority to low priority, included precipitation type and amount, pavement condition, visibility, road friction/grip, pavement and air temperature, and wind speed (Figure 4). Precipitation type and amount greatly influence transit operations. For example, light rain/snow reduces free-flow speed by 2–13% and capacity by 4–11%, while heavy snow reduces free-flow speed by 5–64% and capacity by 12–27% [2]. In addition, precipitation type and amount also affect pavement condition, visibility, road friction, road and air temperature, and wind speed, which prompted transit operations managers/supervisors to consider precipitation type and amount as the most important road weather information.
Sources of weather and road condition monitoring data used by most transit agencies, in order from high priority to low priority, are weather forecast websites, weather stations in the city, road weather information system (RWIS) maps and websites, and traveler information systems (511) (Figure 5). Twenty-eight percent of the transit agencies that responded depend on field personnel reports (e.g., reports from transit drivers, law enforcement officers, public works department personnel, and local news station reporters), where the reports from the field personnel are often biased and lack consistency [37]. CV technology can reduce these limitations and bridge gaps in continuous availability of information used for transit operation decision-making.
According to 83% of respondents, CV weather data will be useful in improving the winter transit operations, where 29%, 33%, and 21% of respondents believed that CV weather data will be slightly, moderately, and extremely useful, respectively, and 13% of the respondents had a neutral opinion. Only one respondent believed that CV weather data will be useless for winter transit operation. Overall, transit operation managers/supervisors expressed positive attitudes towards the usefulness of CV weather data to improve winter transit operations, though perceived level of usefulness varied among respondents due to the lack of lessons learned from real-world deployments. Consensus/buy-in among transit managers or supervisors can be achieved by demonstrating the usefulness of CV weather data through pilot deployments.
This survey also assessed the usefulness of the six USDOT-identified CV transit safety applications: (i) Pedestrian warning for transit vehicles, (ii) bus stop warning to alert nearby vehicles and pedestrians, (iii) left-turn assist warning, (iv) forward collision warning, (v) blind-spot/lane change warning, and (vi) angle collision warning at intersections. Respondents ranked the usefulness of these applications on a scale of 0 to 3 (i.e., 0—not useful, 1—slightly useful, 2—useful, 3—very useful). Brief descriptions of these applications were provided to ensure sufficient understanding among respondents. Among the six applications, the blind-spot/lane-change warning application was perceived as the most useful, where 54% of transit operation managers/supervisors rated this application as very useful and 33% responded as useful (Figure 6).
As transit drivers face difficulty in watching blind spots, which could cause crashes [38], respondents perceived the most usefulness in blind-spot warning application. Other CV applications were deemed useful (average response values were greater than 2.0), except for the bus stop warning application to alert nearby vehicles and pedestrians. Though the perceived usefulness of a bus stop warning application to alert nearby drivers and pedestrians was the least preferred application, on average, annually, 19% of the transit collisions at bus stops involved motor vehicles or pedestrians, according to the 2009–2014 National Transit Database [20]. Thus, irrespective of the lowest perceived usefulness among respondents, this CV application feature can help in reducing crashes at bus stops.
Various implementation and operational challenges related to CV transit applications could hinder successful deployment. The concern of survey respondents on relevant issues of CV technologies in winter transit operation was assessed using a scale of 0 to 3 (i.e., 0—not concerned, 1—slightly concerned, 2—moderately concerned, and 3—very concerned), as presented in Figure 7.
Safety consequences of equipment failure or system failure were the biggest concerns, with 50% very concerned and 36% moderately concerned. Both system performance in poor weather (41% very concerned and 36% moderately concerned) and increased distraction for drivers (36% very concerned and 41% moderately concerned) were also concerning. Other notable concerns were drivers’ overreliance on the technology (32% very concerned and 50% moderately concerned) and legal liability for drivers/owners (50% very concerned and 14% moderately concerned). In contrast, respondents had fewer concerns about system security, data privacy, interacting with non-CVs, and knowledge about CV technologies. Lack of awareness/knowledge on those critical issues could be one of the reasons for their relatively fewer concerns about these topics. For example, a robust cyber security system is critical to build trust in transit CVs and connected systems, equipment, and services [39]. A lack of comprehensive security and privacy protocol might affect driving control and compromise privacy, safety, and security [40]. Hackers might exploit vulnerabilities of unsecured or insufficiently secured systems, which could lead to partial or complete shutdown of the systems. There were many instances where hackers accessed unsecured systems of many organizations and compromised personal information, such as social security numbers. The chance of revealing the personal identification information of transit riders and other information can compromise transit operations. Demonstration of CV security and privacy issues is critical to improve the knowledge/trust of transit personnel in CV technology.
The last survey question asked was open-ended in order to solicit any comments or thoughts regarding CV technologies for improving the safety and mobility of transit during winter storms. Respondents acknowledged the potential of CV technologies in assisting transit drivers in all weather conditions. One respondent indicated that the CV technologies will enable drivers to put a second set of eyes on the road. However, several respondents reiterated concerns of drivers’ over-reliance on the technology. This concern is evident, as the investigation of recent connected and automated vehicle (CAV) crashes involving Tesla’s Autopilot pointed out the disengagement of drivers for longer durations as the main crash-contributing factor [41]. Moreover, respondents were not sure whether CV technologies are mature enough for routine transit operations. A pilot program/study prior to incorporating CV technologies in their system was expected to evaluate the performance of CV application features. According to one respondent, a pilot program would be beneficial, considering the high cost of full-scale system-level implementation.
Currently, the roles of different stakeholders involved in the planning, development, deployment, operations, and maintenance of the CV technology and the systems are not defined [23]. In this section, the needs, perspectives, and expectations of transit operation managers/supervisors on CV technology applications are documented using the responses from a national survey, as transit vehicles must be equipped with CV technology to implement CV applications for multimodal winter travel. The perspectives of transit operation managers/supervisors on CV applications revealed important insights that will play a critical role in the planning, development, deployment, operations, and maintenance of a CV-supported transit system at an institutional level. In Section 4, a conceptual framework of CV applications for multimodal winter travel is presented to aid policymakers to determine the technical and investment needs of implementing such systems in the future.

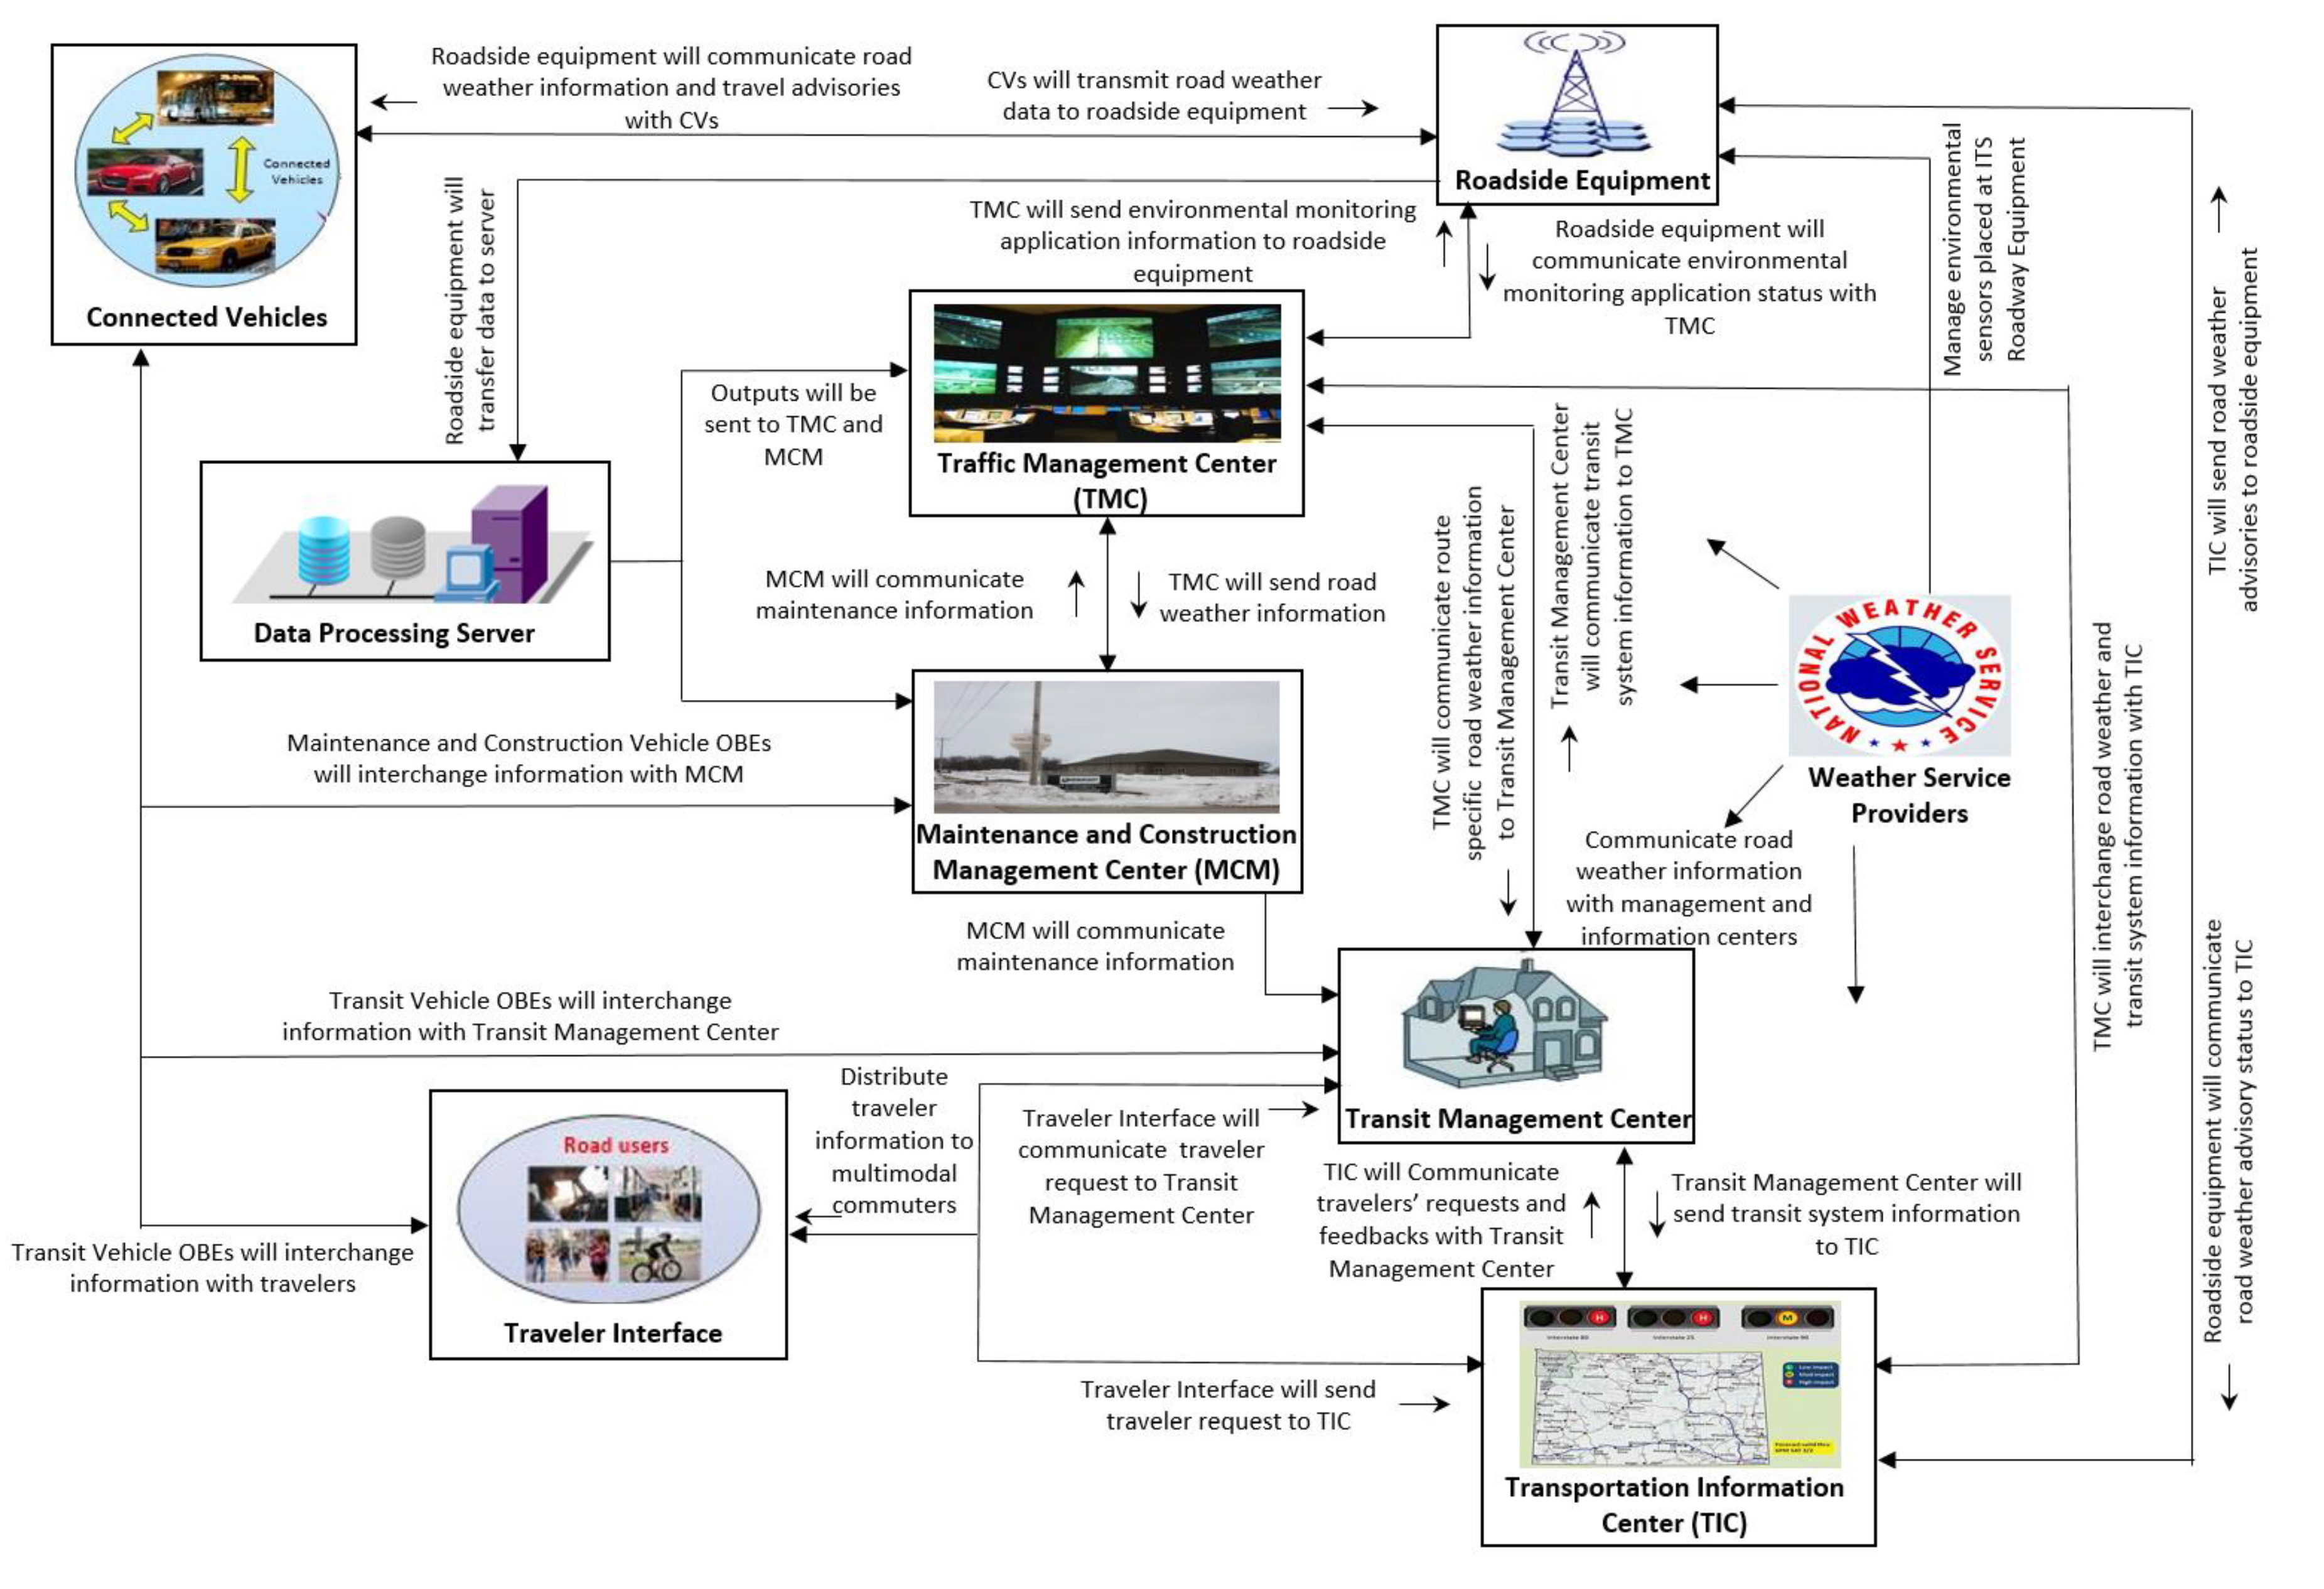
4. CV Application for Multimodal Winter Travel

4.1. Concept Description of CV Applications for Multimodal Travel

State and local transportation departments and transit agencies aim to maintain normal transit service operations even when facing winter weather events. The transit operation strategies are developed according to local winter transit plans and rely heavily on experienced transit managers/supervisors. In decision-making, gathering accurate road weather information is critical. RWIS is extremely useful for collecting road weather data, including pavement temperature, pavement condition, wind speed, and precipitation amount. However, fixed RWIS only gathers point-specific road weather data. Route-specific road weather data is more important for identifying road weather conditions on a network. The survey responses discussed in Section 3 support this concern of transit agencies. Twenty-eight percent of the transit agencies that participated in the survey depend on field personnel for road condition data collection. In addition, deploying field personnel for tracking the road condition change over time is resource-intensive and inefficient [37]. The application of CV technologies in the multimodal winter travel concept will reduce these drawbacks by providing expanded road weather data from CVs. The Architecture Reference for Cooperative and Intelligent Transportation (ARC-IT) provides a reference framework for the planners and engineers on a diverse set of CV applications [9]. The objective of the ARC-IT reference architecture is to adopt a common language to conceive, design, and implement CV applications. The ARC-IT includes three service packages (applications) for road weather data collection: Processing and communication of weather data collection (service package WX01), weather information processing and distribution (service package WX02), and spot weather impact warning (service package WX03). The weather data collection service package collects weather and road condition data from CVs’ on-board systems, CV roadside equipment, and roadway environmental sensors, and sends the collected information to the Traffic Management Center and the Maintenance and Construction Management Center. The weather information processing and distribution service package processes the collected information (e.g., surface condition, wind speed, visibility, temperature), detects roadway environmental hazards (e.g., snowy or icy road conditions and dense fog), and develops transit operational decisions. The resulting road weather information is sent to Traffic Management Center, Transit Management Center, and Transportation Information Center. The spot weather impact warning service package uses information collected from environmental sensor stations (ESSs/RWIS), other roadway environmental sensors, and vehicle-based sensors to communicate warnings to CVs and personal information devices, and to display warnings on roadways and roadside signs. This study develops a combined framework for multimodal winter travel by incorporating connected transit vehicle operations, CV-technology-provided road weather information in transit operation decisions, and operational transit information dissemination to management and information centers as well as to multimodal commuters. Figure 8 presents a schematic diagram of the CV infrastructure in supporting multimodal winter travel CV applications.
In this proposed CV-supported multimodal travel/transit operations framework, mobile road-weather-related data and traffic flow data will be collected from CV-technology-enabled vehicles (e.g., city fleet vehicles, transit vehicles, and other voluntary private vehicles) through controller area network bus (CAN-Bus), AVL, and sensors mounted on the vehicles. These route-specific data gathered using CV Roadside Equipment will be combined with point data collected from ITS Roadway Equipment (e.g., traffic cameras, RWIS). Collected data will be processed and analyzed in a server (i.e., data center) to generate useful route-specific road weather information. Information will be shared with the Traffic Management Center and the Maintenance and Construction Management Center for traffic operations and maintenance decision-making. The Traffic Management Center will share route-specific road weather and traffic information with the Transit Management Center and Transportation Information Center (representing any traveler information distribution service). At the management and information centers, commercial cloud platforms (e.g., Amazon AWS, Microsoft Azure) can be used instead of maintaining the center-owned server, as, often, maintaining this infrastructure requires a specialized workforce that is not available at the agencies. Transit operation strategies will be communicated to transit drivers through the CV driver–vehicle interface (e.g., Transit Vehicle On-board Equipment (OBE)) by analyzing the route-specific road weather and traffic information. Transit routes, schedules, and transit vehicle information will be shared with the Traffic Management Center. The Traffic Management Center and Transit Management Center will share transit system information with the Transportation Information Center to communicate with multimodal commuters through Vehicle OBEs, dynamic message signs, traveler support equipment, and personal information devices. Personal information devices will enable travelers to use smartphone applications, websites (e.g., 511 website), social media, etc. Communicated information will help commuters to adjust travel plans (e.g., trip time, trip modes, and trip routes). Transit Vehicle OBEs will also communicate transit vehicle location and motion, transit route information, and transit vehicle information (e.g., seat availability, fare information, bike rack availability) with multimodal commuters through personal information devices and traveler support equipment.

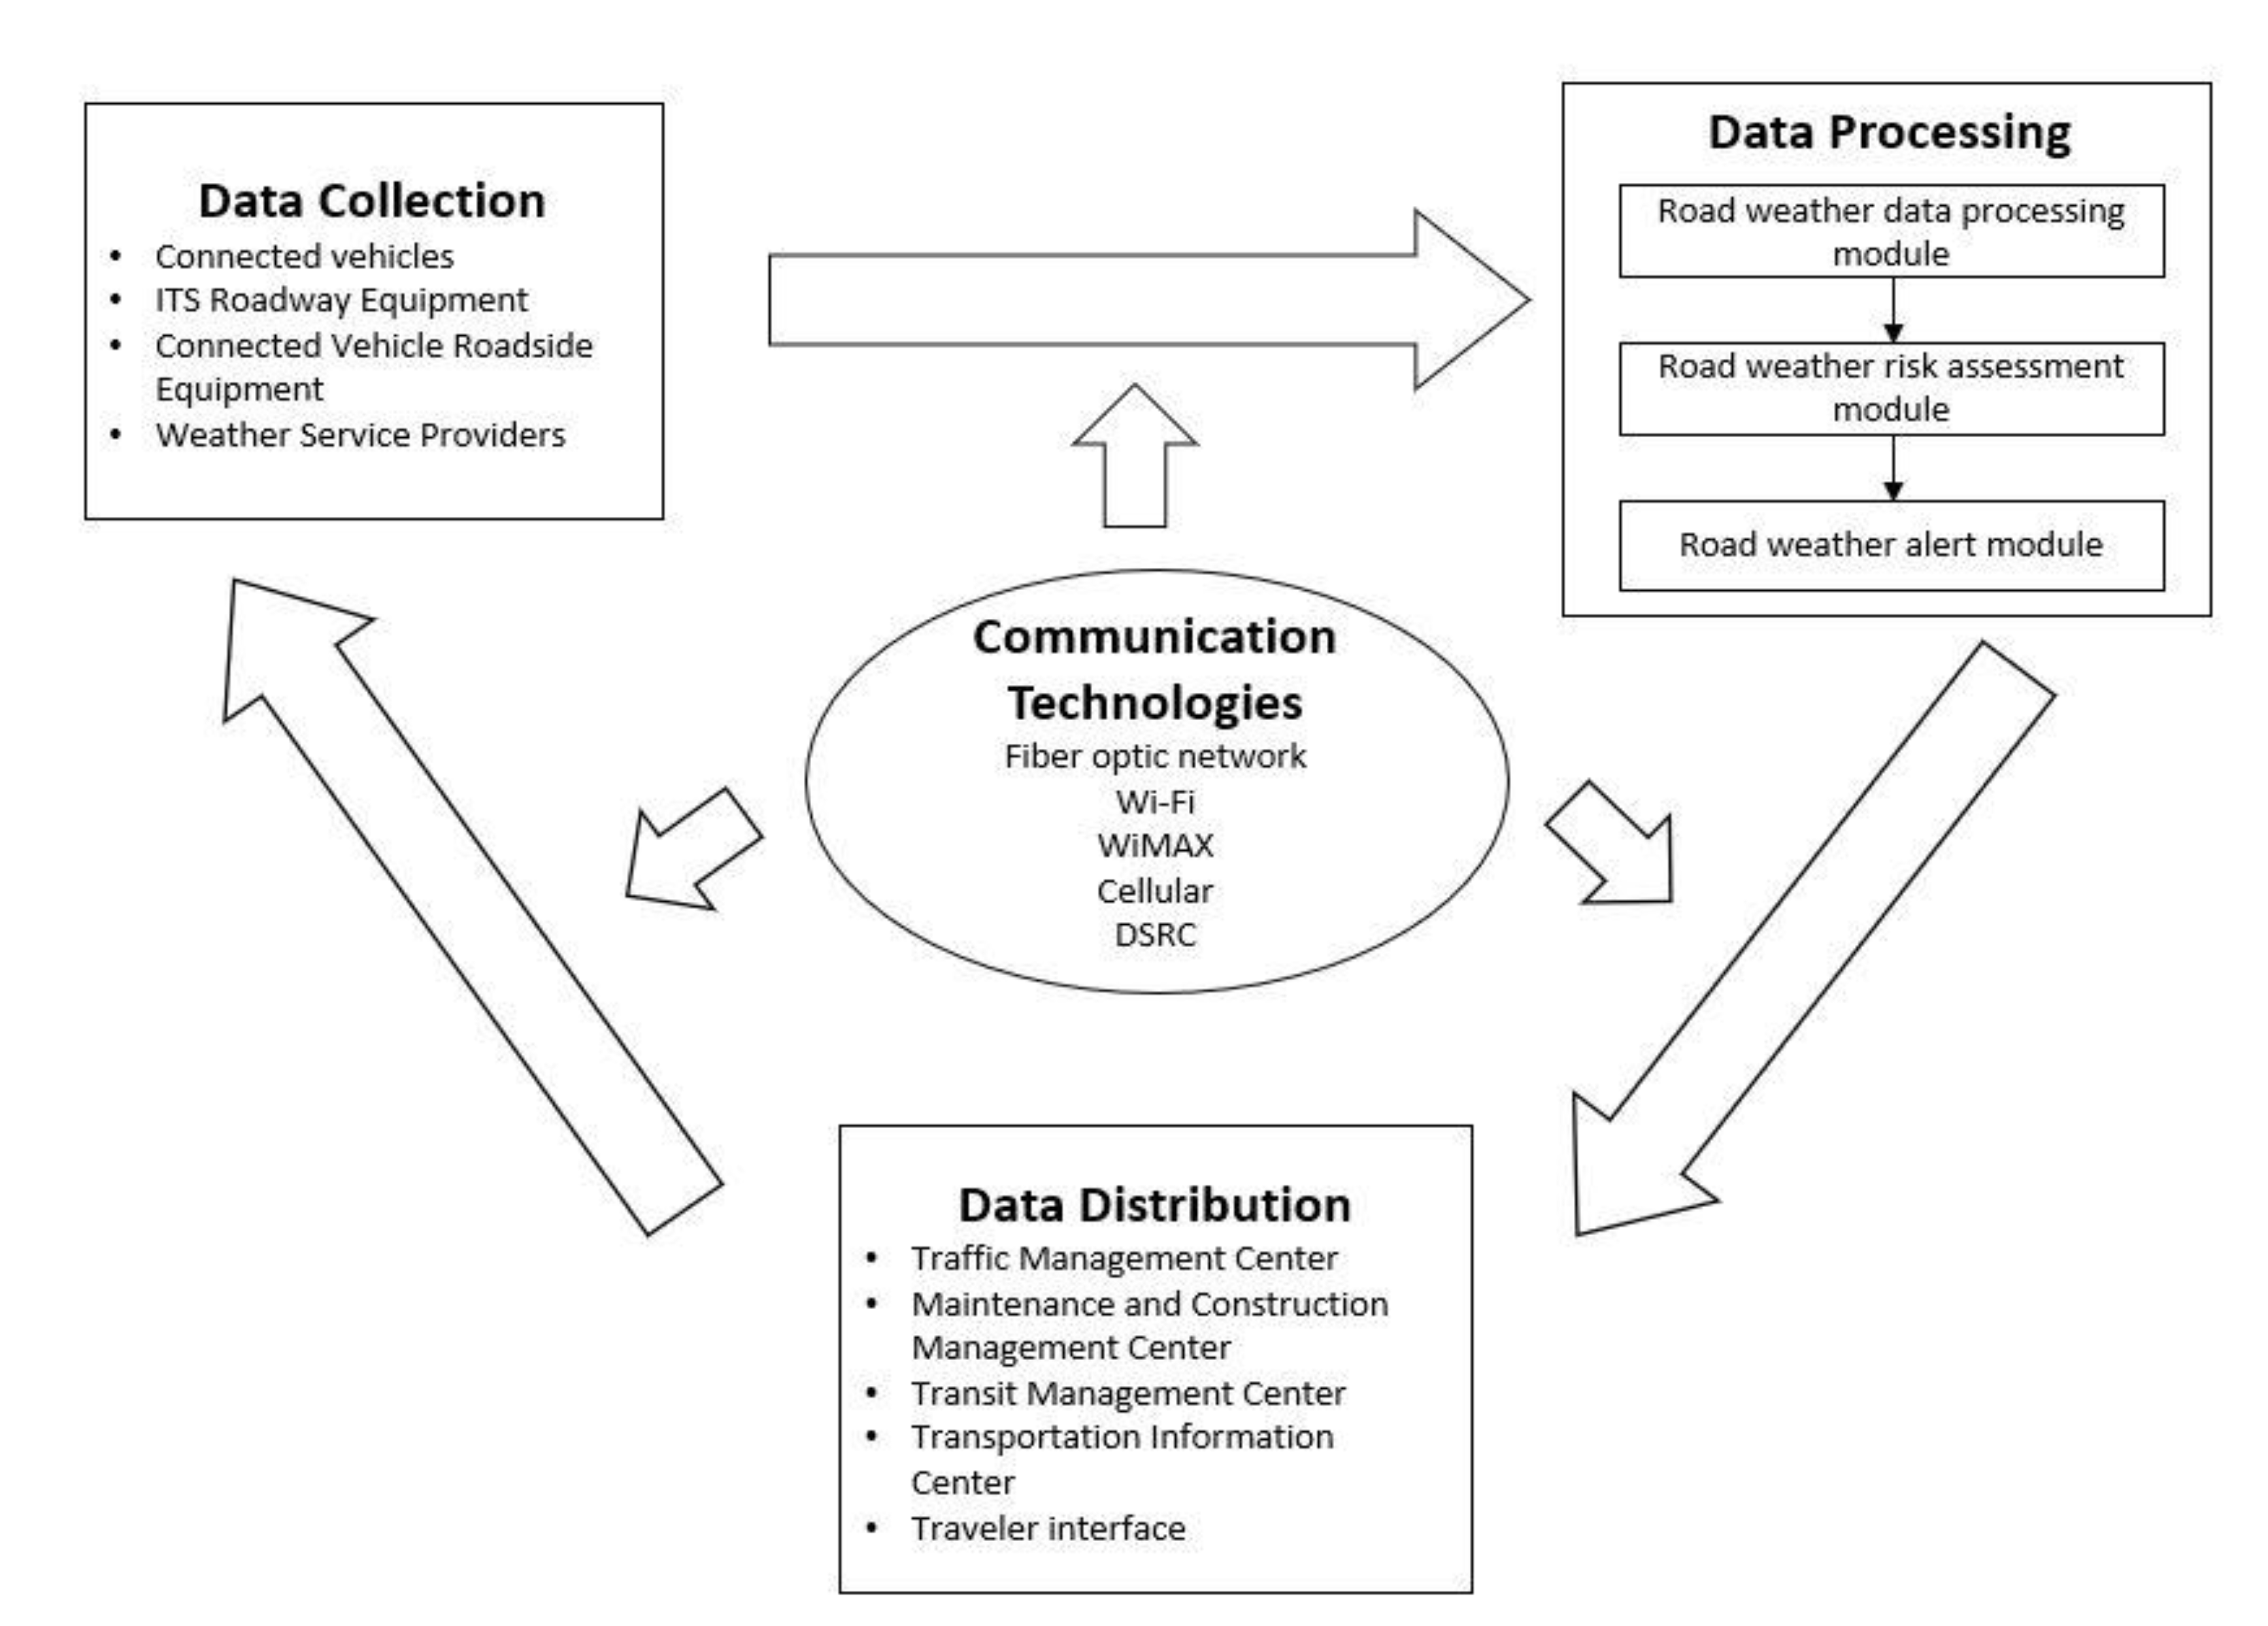
4.2. Subsystems and Communication Technologies for the Proposed CV Application Framework

The CV application framework for multimodal winter travel is composed of nine subsystems (Figure 8) (i.e., CVs, CV Roadside Equipment, ITS Roadway Equipment, Data Processing Server, Traffic Management Center, Maintenance and Construction Management Center, Transit Management Center, Transportation Information Center, and Traveler Interface). These subsystems collectively perform three necessary functions: (i) Data collection, (ii) data processing, and (iii) data distribution. Communication of data among the subsystems will use different suitable communication mediums. Figure 9 depicts the roles of different subsystems in performing these basic functions and the available communication technologies for communication between subsystems.

4.2.1. Data Collection

Roadside units, such as CV Roadside Equipment (e.g., roadside DSRC unit) and ITS Roadway Equipment (e.g., RWIS, traffic cameras), and CVs will facilitate data collection. In addition, the management and information centers will collect road weather data from weather service providers.
CVs: CVs will mainly consist of city fleet vehicles, transit vehicles, and voluntary private CVs that will collect data using the controller area network bus (CAN-Bus) and the mounted road weather sensors. In addition, the in-vehicle devices or OBEs in CVs can receive and transmit the data from and to other CVs and roadside CV units. In-vehicle devices will also provide drivers with updates on road weather advisories collected from the Transit Management Center or Transportation Information Center. Transit in-vehicle devices will send information (e.g., schedule, performance, vehicle conditions) with the Transit Management Center. In-vehicle devices in maintenance and construction vehicles will communicate in-vehicle road weather sensor data (e.g., surface temperature, moisture, icing, treatment status, precipitation amount, visibility) with the Maintenance and Construction Management Center. The collected data through CVs include: (a) Data collected by on-board equipment and GPS, e.g., average vehicle speeds, location (latitude, longitude), ABS (Anti-lock Braking System) activation events, vehicle stability, traction control activation events, windshield wiper blade speed, headlight status, and other basic safety messages; (b) data collected by external road weather sensors mounted on vehicles, e.g., road surface condition, water layer thickness, and surface temperature.
ITS Roadway Equipment: The road weather information system (RWIS) is composed of advanced sensors and communication technologies designed to gather weather information [45]. They are mainly installed at strategic fixed roadside locations and only obtain point road weather data, including air temperature, barometric pressure, dew point, pavement temperature, surface condition, wind speed, and precipitation. Other types of roadside equipment, such as cameras and sensors, also collect road weather condition (e.g., pavement surface condition) or traffic condition (e.g., traffic speed, traffic volume) information. For example, a camera placed at a transit stop can detect the snow cover in addition to traffic surveillance. The Traffic Management Center and weather service providers will manage environmental sensors placed at the ITS Roadway Equipment, and data will be collected from these devices. The ITS Roadway Equipment will exchange road weather information with the CV Roadside Equipment. The ITS Roadway Equipment will send the collected environmental sensor data from RWIS or other roadside devices to the Traffic Management Center and the Maintenance and Construction Management Center after analyzing and processing on a remote server/cloud platform.
CV Roadside Equipment: The CV roadside units will consist of infrastructures that can receive and transmit data from and to CVs and other roadside infrastructures (e.g., ITS Roadway Equipment). CV Roadside Equipment will communicate the environmental monitoring operational status (i.e., operational state and status and a record of system operation) and speed warning application status with the Traffic Management Center. Road weather data will be analyzed and processed on a remote server/cloud platform, which will send the processed data to the Traffic Management Center and Maintenance and Construction Management Center. The information flows associated with all subsystems of data collection are summarized in Table 2.

4.2.2. Data Processing

Data processing consists of a data storage and processing server platform that accepts data from all data collection sources (e.g., CVs, ITS, and CV roadside equipment, sensors/cameras). After processing and analyzing information, route-specific road weather information will be available to the Traffic Management Center and Maintenance and Construction Management Center. Data processing will include three modules: (i) Road weather data processing module, (ii) road weather risk assessment module, and (iii) road weather alert module. The details of an operational framework of the CV data processing server were presented in [46].
The road weather data processing module will handle data gathered by roadside equipment. The data will be ingested, quality checked, and matched to a road segment using GPS location and timestamp information [47]. The road weather risk assessment module will determine the risk of each road segment using an algorithm model based on the data received from the road weather data processing module. For example, precipitation will be forecasted based on precipitation type, precipitation intensity, and air temperature, as well as vehicle-based data (e.g., wiper blade speed, travel speed, headlight status). Road surface conditions can be estimated based on precipitation outputs, pavement temperature, roadway surface condition reported from RWIS, and ABS/traction activation information, and can be classified into bare, partly snow-covered, and fully snow-covered. Visibility can be also assessed based on precipitation outputs, humidity, headlight status, vehicle speed, and visibility. The road weather alert module will transform the outputs generated from the road weather risk assessment module into actual travel alerts or advisories. Travelers may be more concerned with the overall road weather condition than the condition of each section of the route. Hence, in this module, the overall road weather condition will be obtained to generate an alert or travel advisory for travelers through the Transportation Information Center.
The Traffic Management Center, Maintenance and Construction Management Center, Transit Management Center, and Transportation Information Center can further process data received from the server according to their operational decision-making requirements. For example, the Maintenance and Construction Management Center can combine information of all road surface conditions to forecast maintenance resources to reach bare pavement. The Transportation Information Center can process data to generate customized travel advisories for a specific location or event.

4.2.3. Data Distribution

Data distribution includes a number of subsystems: Traffic Management Center, Maintenance and Construction Management Center, Transportation Information Center, Transit Management Center, and Traveler Interface. The subsystems and traveler interfaces will communicate among themselves to facilitate information exchange.
The Traffic Management Center monitors and controls the traffic and roadway networks. The Traffic Management Center will take the central role in data distribution. The Traffic Management Center’s environmental monitoring function will communicate with the ITS Roadway Equipment and CV Roadside Equipment to send environmental monitoring information to control the roadside sensor systems remotely (e.g., application reset or restart and control of the filtering, aggregation, and range of collected and reported parameters). The Traffic Management Center also will send road weather information and traffic conditions to the Maintenance and Construction Management Center, Transit Management Center, and Transportation Information Center.
The Maintenance and Construction Management Center represents public agencies and private contractors performing winter road maintenance activities. This subsystem/center will manage maintenance vehicles (i.e., controls the dispatching and routing of snowplow trucks) and maintenance resources, and execute maintenance activities (e.g., plowing, deicing, anti-icing) based on the information received from maintenance vehicles, roadside equipment, and the Traffic Management Center. In addition, this subsystem will support roadway and roadside equipment (e.g., dynamic message signs, roadside equipment) maintenance activities. The Maintenance and Construction Management Center will communicate roadway maintenance information with the Traffic Management Center, Transportation Information Center, and Transit Management Center.
The Transit Management Center manages transit vehicle fleets, coordinates with other modes and transportation services, and will communicate transit system data (e.g., transit fare schedules, demand-responsive transit plans, transit incident information, and transit schedule adherence information) with the Traffic Management Center and Transportation Information Center. The Transit Management Center will also communicate transit-operation-related information (e.g., transit schedule information, vehicle operator information) via the Transit Vehicle OBEs to transit vehicle operators.
The Transportation Information Center will collect, process, and disseminate transportation information to other subsystem operators and travelling public. Information includes roadway advisories, road weather conditions, transit schedule information, trip requests, and trip feedback information. Usually, the Transportation Information Center can be implemented as a website or web-based application service.
The Traveler Interface consists of a range of platforms through which management and information centers will communicate with multimodal users. Examples of traveler interfaces are 511, smartphone applications, websites, in-vehicle displays, dynamic message signs (DMSs), and traveler support equipment. Traveler interfaces will support traveler input and output in visual and audio form. The Google Maps application might be a valuable tool to exchange information with travelers. A layer of winter road weather information can be added in Google Maps as an information source for travelers. Travelers can also contribute and validate road weather information (e.g., adding road images, providing comments and reviews of maintenance services), similarly to traditional crowdsourcing platforms. Due to the large Google Maps user base, it can generate and share accurate and up-to-date information to support multimodal winter travel. The information flows associated with the subsystems of data distribution are summarized in Table 3.

4.2.4. Communication Technologies

The selection of communication technologies depends on distance, throughput, and latency requirements between connecting subsystems or objects (e.g., CVs, CVs and roadside equipment, roadside equipment and remote servers, subsystems, subsystems and traveler interfaces), and also on cost requirements and the mobility nature of subsystems (i.e., mobile or static). The key communication technologies to facilitate communication in CV applications for multimodal winter travel are briefly discussed below.
Fiber optic networks are often used to enable communication between fixed entities, such as the Traffic Management Center and Transit Management Center, or the CV Roadside Equipment and the Traffic Management Center. Fiber optic technology uses light pulses to transfer data from their origin to their destination. The major advantages of using fiber optic networks are their high bandwidth, low attenuation, low interference, high security, and high reliability [48]. Fiber optic networks are mostly suitable for long distance communication.
Cellular communication provides low-latency and high-range wireless communication between fixed (e.g., Traffic Management Center, Transit Management Center) or mobile entities (e.g., CVs). The evolution of cellular communication technologies (3G->4G->LTE->5G) enhances its potential to facilitate communication in CV technology application [48]. Latency in 5G varies between 0.001 to 0.01 s, which suits the latency requirements of 0.02–1 s for most safety-critical CV applications [48].
DSRC (Dedicated Short Range Communication) has licensed bandwidth and accommodates low-latency and highly reliable wireless communication (i.e., very low error rate) between fixed and mobile objects (e.g., communication between roadside CV equipment and CVs) or between mobile objects (e.g., communication between CVs) [49]. This communication medium was initiated by the USDOT to support a Vehicle Infrastructure Integration (VII) application for an Intelligent Transportation System (ITS). DSRC uses a bandwidth of 75 MHz with a typical range of 0.6 miles [49,50].
Wi-Fi (Wireless Fidelity) provides wireless communication in short ranges (less than 0.4 miles), but accommodates high-bandwidth and low-latency coverage. However, the latency is relatively high for supporting CV safety applications [51]. The bandwidth of a Wi-Fi network can support 600 Mbps using a channel bandwidth of 40 MHz. Wi-Fi communication uses unlicensed frequency bands [49].
WiMAX (Worldwide Interoperability for Microwave Access) supports wireless communication using a wide range of channel bandwidth, from 1.75 to 20 MHz, and its link rate can reach up to 70 Mbps [49]. Unlike Wi-Fi, WiMAX operates in both licensed and unlicensed frequency bands. Again, WiMAX provides a relatively longer range of communication of up to 10 miles [49].

4.3. Uniqueness of the Proposed Conceptual Framework

In the ARC-IT framework, the Transit Management Center has minimum communication with other subsystems (e.g., the Transportation Information Center and Traffic Management Center). The ARC-IT framework enables the Transit Management Center to receive road weather information from the Maintenance and Construction Management Center to support transit system operations. The proposed conceptual framework in this study provides the Transit Management Center with communication links with the Traffic Management Center, Transportation Information Center, and Traveler Interface. Communication with these additional entities will provide transit operation managers/supervisors with access to additional data sets for transit operations. In addition, Transit Vehicle OBEs will assist in executing real-time decisions (e.g., altering routes during adverse weather conditions and supporting demand-responsive trips) made by transit managers or supervisors. The proposed conceptual framework also includes traveler interfaces (e.g., personal information devices, traveler support equipment) to assist multimodal users in winter travel.
The major advantage of incorporating CV applications for transit winter travel is that the transit agencies usually maintain normal transit service operations even when facing adverse winter weather events. Other roadway users (e.g., users of personal vehicles, bicyclists) depend on transit during adverse winter weather [36]. Incorporation of transit vehicles and Transit Management Centers in the framework will assist multimodal users with information of real-time transit operational routes and schedules. In addition, the availability and quality of road weather data will be improved.

4.4. Operational Assumptions and Constraints

The effectiveness of the proposed CV application framework is based on the availability of CV road weather data. A sufficient number of transit vehicles, city fleet vehicles, and private vehicles need to be equipped with onboard CV units and road weather sensors. In addition, installation of CV roadside units is also required. Additional research is needed to identify the levels of transit vehicles, city fleet vehicles, and private vehicles for the CV penetration required to obtain sufficient data for the CV applications and the appropriate spatial resolution (i.e., placement/spacing) of the roadside units. Poor-quality data or poorly functioning algorithms could yield inadequate route-specific road weather information and could hinder decision support for system operators. Thus, data processing of server/cloud platform function requires additional research to develop the most efficient and reliable algorithm. As presented in this paper, the proposed CV application framework assumes the development of algorithms to analyze the road weather data to produce real-time advisories and warnings for multimodal commuters. Users can access the advisories and alerts through a variety of means, including public websites, phone hotlines, and smartphone apps. The development of suitable interfaces will be required for smooth functioning with the existing legacy systems. Lack of training and knowledge of management personnel/supervisors/operators could lead to limited use of CV road weather information. Regarding deployment coverage, an adequately dense network of roadside units with appropriate geographic coverage is required to collect CV road weather data. This will be especially important in areas of complex terrain or where information on smaller roadway segments is desired. Portable (trailer-based) RWIS stations can be deployed as a cheaper alternative to complement the needs of the ITS roadway equipment [52].

4.5. Advantages and Limitations of CV Technology Application Framework in Multimodal Winter Travel

4.5.1. Advantages

The improvements expected by implementing the proposed CV application framework include the accuracy and timeliness of road weather data compared to road weather data acquisition methods currently being used by the management and information centers. The specific advantages are: (1) Distributing information about current and forecasted road weather conditions and transit system information to multimodal commuters will enable commuters to make better trip plans, such as selecting safer and more reliable modes, trip times, trip routes, and rescheduling/cancellations of trips. (2) Providing improved weather and road conditions to drivers, cyclists, and pedestrians will result in reduced road-weather-related crashes and fatalities. (3) Enhancing the ability of transit agencies to maintain the highest level of services during adverse winter weather will improve the mobility and safety of passengers and enhance user satisfaction. (4) Generating accurate, location-specific, real-time information about weather and road conditions for transit agencies will enable transit managers or supervisors to make better decisions about transit operations, such as changing routes or cancelling trips, which could produce high agency efficiency and productivity. Continuous transit-service-related information sharing with multimodal commuters could increase transit ridership, especially during adverse winter weather conditions.

4.5.2. Limitations

The proposed CV application framework has some limitations that need to be addressed to maximize the benefits of CV technology implementation. (1) Certain market penetration and density of vehicles equipped with onboard CV equipment and weather sensors are needed for reliable functioning of the CV applications. There are limited fleets of transit vehicles and other maintenance vehicles owned by transportation agencies, which might not provide sufficient data. The CV pilot deployment along Interstate 80 in Wyoming faced similar issues, where the number of CV-technology-equipped vehicles was significantly lower compared to the total number of vehicles [23]. The Wyoming DOT anticipated fewer observed benefits from the CV applications due to the low volume of CV-technology-equipped vehicles. Thus, encouraging more personal cars to have CV functionality will help agencies obtain sufficient road weather data and generate more accurate information on road weather conditions and traffic conditions. Consistent branding (e.g., through social media), providing monetary incentives (e.g., toll rebate), and communicating with key stakeholders have the potential to increase CV technology adoption [53]. (2) Deployment of a high-performance server/cloud platform can make it possible to handle data processing requirements and enable efficient and effective algorithms to transform raw CV data and other road weather and traffic data into advanced and actionable information. However, the requirement of skilled personnel to operate this high-tech system could require additional investment in workforce development in addition to technology procurement costs. (3) Development of an appropriate user interface is required to distribute the actionable information to CV drivers conveniently without distracting the drivers. Survey participants also raised the concern of driver distraction for CV technology application in transit operations. Ahmed et al. [23] recommended that the messages should be simple and should be delivered to CV drivers with a user-friendly interface. Lerner et al. [54] reported that the presence of multiple active displays in the vehicle (e.g., original equipment manufacturer display and additional portable display for CV applications) increased the drivers’ react time to crash warnings. Drivers showed an improvement in reaction time when warnings were integrated into a single driver interface. (4) As cybersecurity is becoming a critical issue for user-involved systems, improved network transmission encryption technology, firewall technology, and other security means to prevent hackers’ attacks and to protect the vehicles’ privacy is required, and those will increase the cost of CV technology deployment.

5. Conclusions

The concept of operations developed by the USDOT to support road weather CV applications includes an enhanced maintenance decision support system, information for maintenance and fleet management systems, weather-responsive traffic management strategies, a motorist advisory and warning system, information for freight carriers, and an information and routing support system for emergency responders [13]. An enhanced concept of operations for CV application to support multimodal winter travel was developed in this study. The national survey of transit operation managers or supervisors revealed that the transit agencies are generally positive about the potential of CV technology in improving winter transit operations, but have reservations regarding driver distraction, safety consequences of equipment failure, system performance in poor weather, and the deployment and maintenance costs. From the survey, a need for CV weather data was evident, as 28% of surveyed transit agencies currently depend on field personnel to collect road weather data for winter transit operation decision-making. In this study, CV applications for improved multimodal winter travel are compiled, where mobile road-weather-related data and traffic flow data will be collected from CV-technology-enabled city fleet vehicles, transit vehicles, and private vehicles with sensors mounted on the vehicles. These route-specific data will be combined with point data from an RWIS and traffic cameras to develop route-specific road weather data. After processing and analyzing CV road weather data, by segments, current and forecasted road weather as well as traffic information will be communicated to management and information centers. Transit operation managers and supervisors can use these data to decide on transit operational routes and schedules. The road weather information, transit routes, and scheduling information will be shared with multimodal commuters through traveler interfaces to allow commuters to adjust trip behavior (e.g., trip time, trip modes, trip routes).

Author Contributions

Conceptualization, X.S.; Data curation, Y.H.; Formal analysis, Y.H. and M.T.R.; Funding acquisition, X.S.; Investigation, Y.H. and M.A.; Methodology, X.S., K.D., and Y.W.; Project administration, X.S.; Resources, Y.W.; Supervision, X.S. and K.D.; Writing—original draft, Y.H.; Writing—review and editing, M.T.R., K.D. and X.S. All authors have read and agreed to the published version of the manuscript.

Funding

This study was financially sponsored by the U.S. Department of Transportation through the Tier 1 UTC CAMMSE (Center for Advanced Multimodal Mobility Solutions and Education).

Acknowledgments

In addition to the funding by the CAMMSE, the authors are also very grateful for all of the time and effort spent by the DOT and industry professionals to provide project information that was critical for the successful completion of this study.

Conflicts of Interest

The authors declare no conflict of interest.

References

  1. Snow & Ice. Available online: https://ops.fhwa.dot.gov/weather/weather_events/snow_ice.htm (accessed on 28 January 2018).
  2. How Do Weather Events Impact Roads? Available online: https://ops.fhwa.dot.gov/weather/q1_roadimpact.htm (accessed on 19 November 2018).
  3. Andersson, A.K. Winter Road Conditions and Traffic Accidents in Sweden and UK. Ph.D. Thesis, University of Gothenburg, Gothenburg, Sweden, 2010. [Google Scholar]
  4. Saha, S.; Schramm, P.; Nolan, A.; Hess, J. Adverse weather conditions and fatal motor vehicle crashes in the United States, 1994–2012. Environ. Health 2016, 15, 104. [Google Scholar] [CrossRef] [PubMed] [Green Version]
  5. Dey, K.C.; Mishra, A.; Chowdhury, M. Potential of intelligent transportation systems in mitigating adverse weather impacts on road mobility: A review. IEEE Trans. Intell. Transp. Syst. 2015, 16, 1107–1119. [Google Scholar] [CrossRef]
  6. Pisano, P.A.; Goodwin, L.C.; Rossetti, M.A. US Highway Crashes in Adverse Road Weather Conditions; U.S. Department of Transportation: New Orleans, LA, USA, 2008.
  7. U.S. DOT (United States Department of Transportation). Connected Vehicle-Enabled Weather Responsive Traffic Management; Report no FHWA-JPO-18-648; U.S. Department of Transportation: New Orleans, LA, USA, 2018.
  8. Sukuvaara, T.; Nurmi, P. Connected vehicle safety network and road weather forecasting–the WiSafeCar project. In Proceedings of the SIRWEC 2012, 16th International Road Weather Conference, Helsinki, Finland, 23–25 May 2012; pp. 23–25. [Google Scholar]
  9. Architecture Reference for Cooperative and Intelligent Transportation. Available online: https://local.iteris.com/arc-it/ (accessed on 3 March 2020).
  10. Drobot, S.; Chapman, M.; Schuler, E.; Wiener, G.; Mahoney, W., III; Pisano, P.; McKeever, B. Improving road weather hazard products with vehicle probe data: Vehicle data translator quality-checking procedures. Transp. Res. Rec. J. Transp. Res. Board 2010, 128–140. [Google Scholar] [CrossRef]
  11. Shi, X.; O’Keefe, K.; Wang, S.; Strong, C. Evaluation of Utah Department of Transportation’s Weather Operations/RWIS Program: Phase I; Utah Department of Transportation: Taylorsville, UT, USA, 2007.
  12. Nordin, L.; Riehm, M.; Gustavsson, T.; Bogren, J. Road surface wetness variations: Measurements and effects for winter road maintenance. J. Transp. Eng 2013, 139, 787–796. [Google Scholar] [CrossRef]
  13. Hill, C.J. Concept of Operations for Road Weather Connected Vehicle Applications; FHWA: Washington, DC, USA, 2013.
  14. Robinson, R.; Cook, S.J. Slippery Road Detection and Evaluation; Michigan Department of Transportation Research Administration: Ann Arbor, MI, USA, 2012.
  15. Hirt, B.; Petersen, S. Installing Snowplow Cameras and Integrating Images into MnDOT’s Traveler Information System; Minnesota Department of Transportation, Research Services & Library: St Paul, MN, USA, 2017. [Google Scholar]
  16. Belzowski, B.M.; Cook, S.J. The Connected Driver: Integrated Mobile Observations 2.0 (IMO 2.0); University of Michigan Transportation Research Institute: Ann Arbor, MI, USA, 2016. [Google Scholar]
  17. Linton, M.A.; Fu, L. Connected vehicle solution for winter road surface condition monitoring. Transp. Res. Rec. 2016, 2551, 62–72. [Google Scholar] [CrossRef] [Green Version]
  18. Li, H.; Peters, L.; Banuelos, C.; Zaugg, J.; Sharma, A.; Bullock, D.M. Leveraging snowplow dashboards cams and connected vehicle speed data to improve winter operations performance measures. JTRP 2019. [CrossRef]
  19. Alfelor, R.M.; Pisano, P.A.; Galarus, D.; Yohanan, D. Using Clarus data for disseminating winter road weather advisories and other weather-related alerts. In Proceedings of the International Conference on Winter Maintenance and Surface Transportation Weather, Coralville, IA, USA, 30 April–3 May 2012; pp. 223–236. [Google Scholar]
  20. Schneeberger, J.D.; Torng, G.W.; Hardesty, D.; Jacobi, A. Transit Vehicle Collision Characteristics for Connected Vehicle Applications Research: Analysis of Collisions Involving Transit Vehicles and Applicability of Connected Vehicle Solutions; ITS-Joint Program Office: Washington, DC, USA, 2013.
  21. Pierce, B.; Zimmer, R. Transit Bus Stop Pedestrian Warning Application: Concept of Operations; Federal Transit Administration: Washington, DC, USA, 2015.
  22. English, T.; Serulle, N.U.; Stephens, D.; Gopalakrishna, D.; Garcia, V.; Ostroff, R. Connected Vehicle Pilot Deployment Program Phase 2, System Architecture Document-WYDOT CV Pilot; Report no. FHWA-JPO-17-467; FHWA: Washington, DC, USA, 2018.
  23. Ahmed, M.M.; Yang, G.; Gaweesh, S.; Young, R.; Kitchener, F. Performance evaluation framework of Wyoming connected vehicle pilot deployment program: Summary of Phase 2 pre-deployment efforts and lessons learned. J. Intell. Connected Veh. 2019. [Google Scholar] [CrossRef]
  24. THEA (Tampa Hillsborough Expressway Authority). Connected Vehicle Pilot Deployment Program Phase 2-System Architecture Document-Tampa (THEA); Report no. FHWA-JPO-17-459; FHWA: Washington, DC, USA, 2018.
  25. USDOT (United States Department of Transportation). Real-World Deployment of Connected Vehicles: Challenges and Lessons Learned. In Proceedings of the 2020 TRB Annual Meeting, Washington, DC, USA, 12–16 January 2020. [Google Scholar]
  26. New York City, New York Connected Vehicle Pilot Deployment Program. Available online: https://www.its.dot.gov/factsheets/pdf/NYCCVPliot_Factsheet.pdf (accessed on 14 June 2020).
  27. New York City CV Pilot to Use High-accuracy Positioning Techniques. Available online: https://www.its.dot.gov/pilots/nyc_positioning.htm (accessed on 15 June 2020).
  28. Lopez-Bernal, G.; Jacobi, A.; Craig, J.L. Transit Vehicle-to-Infrastructure (V2I) Applications: Near Term Research and Development: Transit Vehicle and Center Data Exchange: Operational Concept; United States Department of Transportation: Washington, DC, USA, 2015.
  29. Yang, K.; Menendez, M.; Guler, S.I. Implementing transit signal priority in a connected vehicle environment with and without bus stops. Transp. B Transp. Dyn. 2019, 7, 423–445. [Google Scholar]
  30. Ahn, K.; Rakha, H.A.; Kang, K.; Vadakpat, G. Multimodal intelligent traffic signal system simulation model development and assessment. Transp. Res. Rec. 2016, 2558, 92–102. [Google Scholar] [CrossRef]
  31. Dopart, K. Connected Vehicles Vehicle-to-Pedestrian Communications; FHWA Vehicle Safety and Automation: Washington, DC, USA, 2015.
  32. Hashimoto, Y.; Gu, Y.; Hsu, L.T.; Iryo-Asano, M.; Kamijo, S. A probabilistic model of pedestrian crossing behavior at signalized intersections for connected vehicles. Transp. Res. Part C Emerging Technol. 2016, 71, 164–181. [Google Scholar] [CrossRef]
  33. Sandt, L.; Owens, J.M. Discussion Guide for Automated and Connected Vehicles, Pedestrians, and Bicyclists; Pedestrian and Bicycle Information Center: Chapel Hill, NC, USA, 2017. [Google Scholar]
  34. Turnbull, K.F. Automated and Connected Vehicle (AV/CV) Test Bed to Improve Transit, Bicycle, and Pedestrian Safety: Concept of Operations Plan; Texas A&M Transportation Institute: College Station, TX, USA, 2017. [Google Scholar]
  35. Jenkins, M.; Duggan, D.; Negri, A. Towards a connected bicycle to communicate with vehicles and infrastructure: Multimodal Alerting Interface with Networked Short-Range Transmissions (MAIN-ST). In Proceedings of the 2017 IEEE Conference on Cognitive and Computational Aspects of Situation Management, Savannah, GA, USA, 27–31 March 2017; pp. 1–3. [Google Scholar]
  36. Guo, Z.; Wilson, N.H.; Rahbee, A. Impact of weather on transit ridership in Chicago, Illinois. Transp. Res. Rec. 2007, 2034, 3–10. [Google Scholar] [CrossRef]
  37. Deeter, D.; Crowson, G.; Roelofs, T.; Schroeder, J.; Gopalakrishna, D. Best Practices for Road Condition Reporting Systems: Synthesis Report; Report no. FHWA-HOP-14-023; FHWA: Washington, DC, USA, 2014.
  38. Eliminating Blind Spots on Buses and Coaches with ADAS and SVS. Available online: https://www.viatech.com/en/2019/08/eliminating-blind-spots-on-buses-coaches-and-trucks/?cn-reloaded=1 (accessed on 15 March 2020).
  39. Top 10 Security Challenges in the Automotive Industry for Connected Cars. Available online: https://www.trustonic.com/news/blog/top-10-security-challenges-for-connected-cars/ (accessed on 24 March 2020).
  40. Siegel, J.E.; Erb, D.C.; Sarma, S.E. A survey of the connected vehicle landscape—Architectures, enabling technologies, applications, and development areas. IEEE Trans. Intell. Transp. Syst. 2017, 19, 2391–2406. [Google Scholar] [CrossRef] [Green Version]
  41. 3 Crashes, 3 Deaths Raise Questions about Tesla’s Autopilot. Available online: https://apnews.com/ca5e62255bb87bf1b151f9bf075aaadf (accessed on 24 March 2020).
  42. FHWA (Federal Highway Administration). Transportation System Management and Operations in Action; Report no. FHWA-HOP-17-025; FHWA: Washington, DC, USA, 2017.
  43. FHWA (Federal Highway Administration). Are your roads weather savvy? Public Roads 2019, 83, 16–20. [Google Scholar]
  44. IOWA DOT. Cutting Costs, not Corners in Mason City; IOWA DOT: Ames, IA, USA, 2017.
  45. Kwon, T.J.; Fu, L.; Jiang, C. Road weather information system stations-where and how many to install: A cost benefit analysis approach. Can. J. Civ. Eng. 2014, 42, 57–66. [Google Scholar] [CrossRef]
  46. Du, Y.; Chowdhury, M.; Rahman, M.; Dey, K.; Ngo, L.B. A distributed message delivery infrastructure for connected vehicle technology applications. IEEE Trans. Intell. Transp. Syst. 2017, 19, 787–801. [Google Scholar] [CrossRef]
  47. Young, R.K.; Welch, B.M.; Siems-Anderson, A.R. Generating Weather Alerts Including High Wind Blowover Hazards Using Pikalert; Wyoming DOT: Cheyenne, WY, USA, 2019.
  48. Dey, K.; Fries, R.; Ahmed, S. Future of Transportation Cyber-Physical Systems–Smart Cities/Regions. Transp. Cyber-Phys. Syst. 2018, 267–307. [Google Scholar] [CrossRef]
  49. Zhou, Y.; Evans Jr, G.H.; Chowdhury, M.; Wang, K.C.; Fries, R. Wireless communication alternatives for intelligent transportation systems: A case study. J. Intell. Transp. Syst. 2011, 15, 147–160. [Google Scholar] [CrossRef]
  50. The Safety Band. Available online: https://www.transportation.gov/content/safety-band (accessed on 5 April 2020).
  51. Dey, K.C.; Rayamajhi, A.; Chowdhury, M.; Bhavsar, P.; Martin, J. Vehicle-to-vehicle (V2V) and vehicle-to-infrastructure (V2I) communication in a heterogeneous wireless network–Performance evaluation. Transp. Res. Part C Emerg. Technol. 2016, 68, 168–184. [Google Scholar] [CrossRef] [Green Version]
  52. Tessier, R. Evaluation of Portable Road Weather Information Systems; Massachusetts Department of Transportation: Boston, MA, USA, 2016.
  53. Tampa Connected Vehicle Pilot Success in Recruiting Participants. Available online: https://www.its.dot.gov/pilots/tampa_participants.htm (accessed on 15 June 2020).
  54. Lerner, N.; Robinson, E.; Singer, J.; Jenness, J.; Huey, R.; Baldwin, C.; Fitch, G. Human Factors for Connected Vehicles: Effective Warning Interface Research Finding; National Highway Traffic Safety Administration: Washington, DC, USA, 2014.
Figure 1. Distribution of survey respondents.
Sustainability 12 05071 g001
Figure 2. Impacts of winter storms on transit operations.
Sustainability 12 05071 g002
Figure 3. Communication mediums used by transit agencies to communicate information with transit users.
Sustainability 12 05071 g003
Figure 4. Perceived usefulness of road weather information to improve transit operations.
Sustainability 12 05071 g004
Figure 5. Information sources of transit agencies to collect road weather information.
Sustainability 12 05071 g005
Figure 6. Perceived usefulness of potential CV application features in transit vehicles.
Sustainability 12 05071 g006
Figure 7. Concerns on relevant issues of CV technologies in winter transit operations.
Sustainability 12 05071 g007
Figure 8. Schematic of the CV infrastructure in supporting multimodal winter travel CV applications (adopted from image sources: [42,43,44]).
Sustainability 12 05071 g008
Figure 9. CV application subsystems and communication technologies.
Sustainability 12 05071 g009
Table 1. Questions asked in the national survey of transit agencies.
Survey Questions
  • Survey respondent’s identification information.
    Name and either email address or phone number of the survey respondents.
    Affiliated transit agency.
  • Impacts of winter storms on transit operations.
  • Currently used mediums to communicate transit delays or cancellation information to transit users.
  • Winter road weather information required to improve transit operations.
  • Currently used information sources to obtain road weather information.
  • Perceived usefulness of CV weather data to improve safety and mobility of winter transit operations.
  • Transit operation managers’/supervisors’ rating of the usefulness of different CV application features.
  • Transit operation managers’/supervisors’ concerns on CV technologies in transit operations.
Table 2. Information flows from data collection subsystems.
SubsystemInformation Flow
CVs(i) Will send collected data from road weather sensors, on-board equipment, and GPS to CV Roadside Equipment and to other vehicle OBEs.
(ii) Will provide updates on road weather condition to CV drivers.
(iii) Maintenance and Construction Vehicle OBEs will send environmental sensor data (e.g., surface temperature, subsurface temperature, treatment status) to Maintenance and Construction Management Center.
* (iv) Transit vehicle OBEs will communicate transit vehicle information/status (e.g., schedule, route, performance, vehicle condition) with the Transit Management Center.
* (v) Will communicate operational decisions received from the Transit Management Center to transit vehicle operators.
* (vi) Will communicate transit vehicle location and motion and transit vehicle information to personal information devices and traveler support equipment.
ITS Roadway Equipment(i) Will send road weather condition information to CV Roadside Equipment.
(ii) Will send environmental sensor data to CV Roadside Equipment, and Traffic Management Center, and Maintenance and Construction Management Center after processing at server/cloud platform.
CV Roadside Equipment(i) Will send road weather condition information to ITS Roadway Equipment.
(ii) Will send environmental monitoring application status (current operational state and status, and a record of system operation) to the Traffic Management Center.
(iii) Will send speed warning application status (i.e., a record of measured vehicle speeds and notifications, alerts, and warning issued) to the Traffic Management Center to ensure if the speed warning application is working properly.
(iv) Will send road weather advisory status (i.e., current configuration parameters, a log of issued advisories) to the Transportation Information Center to ensure the road weather advisory application is working properly.
(v) Will provide vehicle situational data parameters (parameters used to control data, such as snapshot frequency, filtering criteria, and reporting interval) to vehicle OBE.
(vi) Will send road weather advisories, reduced speed notification, and lane or road closure information to vehicle OBEs.
(vii) Will send environmental sensor data (e.g., air temperature, exterior light status, wiper status) to the Traffic Management Center and Maintenance and Construction Management Center after processing on a server/cloud platform.
* Additional information flow (not included in the Architecture Reference for Cooperative and Intelligent Transportation (ARC-IT)).
Table 3. Information flows from data distribution subsystems.
SubsystemInformation Flow
Traffic Management Center(i) Will send environmental monitoring information (parameters and threshold) and speed warning monitoring information to CV Roadside Equipment (i.e., sensors).
(ii) Will send environmental sensor control data and variable speed limit control data to the ITS Roadway Equipment.
(iii) Will share current road condition and surface weather condition data with the Maintenance and Construction Management Center, Transportation Information Center, and Transit Management Center *.
Maintenance and Construction Management Center (i) Will send road weather maintenance information to the Traffic Management Center, Transit Management Center, and Transportation Information Center.
Transportation Information Center(i) Will send road network environmental situation data to the Traffic Management Center and Transit Management Center.
(ii) Will send road weather advisories to the CV Roadside Equipment and Vehicle OBEs.
* (iii) Will send demand-responsive transit trip requests and trip confirmations to the Transit Management Center.
* (iv) Will send interactive traveler information, traveler alerts, and trip plans to personal information devices.
* (v) Will send interactive traveler information and traveler alerts to Transit Vehicle OBEs.
* (vi) Will communicate travelers’ provided updates on social media sites.
* (vii) Will send interactive traveler information to traveler support equipment.
Transit Management Center* (i) Will send transit system data to the Traffic Management Center and Transportation information Center.
* (ii) Will send route assignment information, schedules, and transit vehicle operator information to the Transit Vehicle OBEs.
* (iii) Will send demand-responsive transit plans, transit and fare schedules, transit incident information, and transit schedule adherence information to the Transportation Information Center.
Traveler Interface* (i) Will send user profiles, trip requests, trip confirmation, and trip feedback to the Transportation Information Center.
* (ii) Will send user location and user information to the Transit Vehicle OBEs.
* (iii) Will put travel requests and traveler-sourced updates on social media.
* Additional information flow (not included in the ARC-IT).

