Heat of Hydration Stresses in Stainless-Steel-Reinforced-Concrete Sections


Civil and Environmental Engineering, Western University, London, ON N6A 5B9, Canada
*
Author to whom correspondence should be addressed.
Sustainability 2020, 12(12), 4852; https://doi.org/10.3390/su12124852
Submission received: 14 May 2020
/
Revised: 5 June 2020
/
Accepted: 10 June 2020
/
Published: 14 June 2020
(This article belongs to the Special Issue Sustainable Structural Design for High-Performance Buildings and Infrastructures)
Abstract
:Stainless steel (SS) is increasingly used in construction due to its high strength and corrosion resistance. However, its coefficient of thermal expansion is different from that of concrete. This difference raises concerns about the potential for concrete cracking during the hydration process. To address this concern, a thermal-structural finite element model was developed to predict the stresses in SS-reinforced concrete (RC) sections during the hydration process. Different curing regimes were taken into consideration. The analysis was performed in two stages. First, a transient thermal analysis was performed to determine the temperature distribution within the concrete section as a function of concrete age and its thermal properties. The evaluated temperature distribution was then utilized to conduct stress analysis. The ability of the model to predict the stresses induced by the expansion of the bars relative to the surrounding concrete was validated using relevant studies by others. The model outcomes provide in-depth understanding of the heat of hydration stresses in the examined SS RC sections. The developed stresses were found to reach their peak during the first two days following concrete casting (i.e., when concrete strength is relatively small).
1. Introduction
Stainless steel (SS) provides many advantages over conventional carbon steel due to its high corrosion resistance, and consequently, its lower dependence on the alkalinity of the protective concrete cover. Using SS bars to reinforce concrete structures results in a significant improvement in their durability and a reduction in their maintenance and repair costs. As such, the use of SS bars in the construction industry continues to increase, especially in bridges and coastal structures [1].
Despite the various positive aspects of SS bars, their thermal properties constitute a drawback. The reason lies in the fact that both carbon steel and concrete have similar coefficients of thermal expansion, whereas the thermal expansion coefficient of SS is about 80% higher than that of concrete [2,3]. Thus, when the temperature of an SS-reinforced concrete (RC) section increases, the thermal incompatibility between the SS bars and concrete results in stresses that are not experienced by carbon steel RC sections.
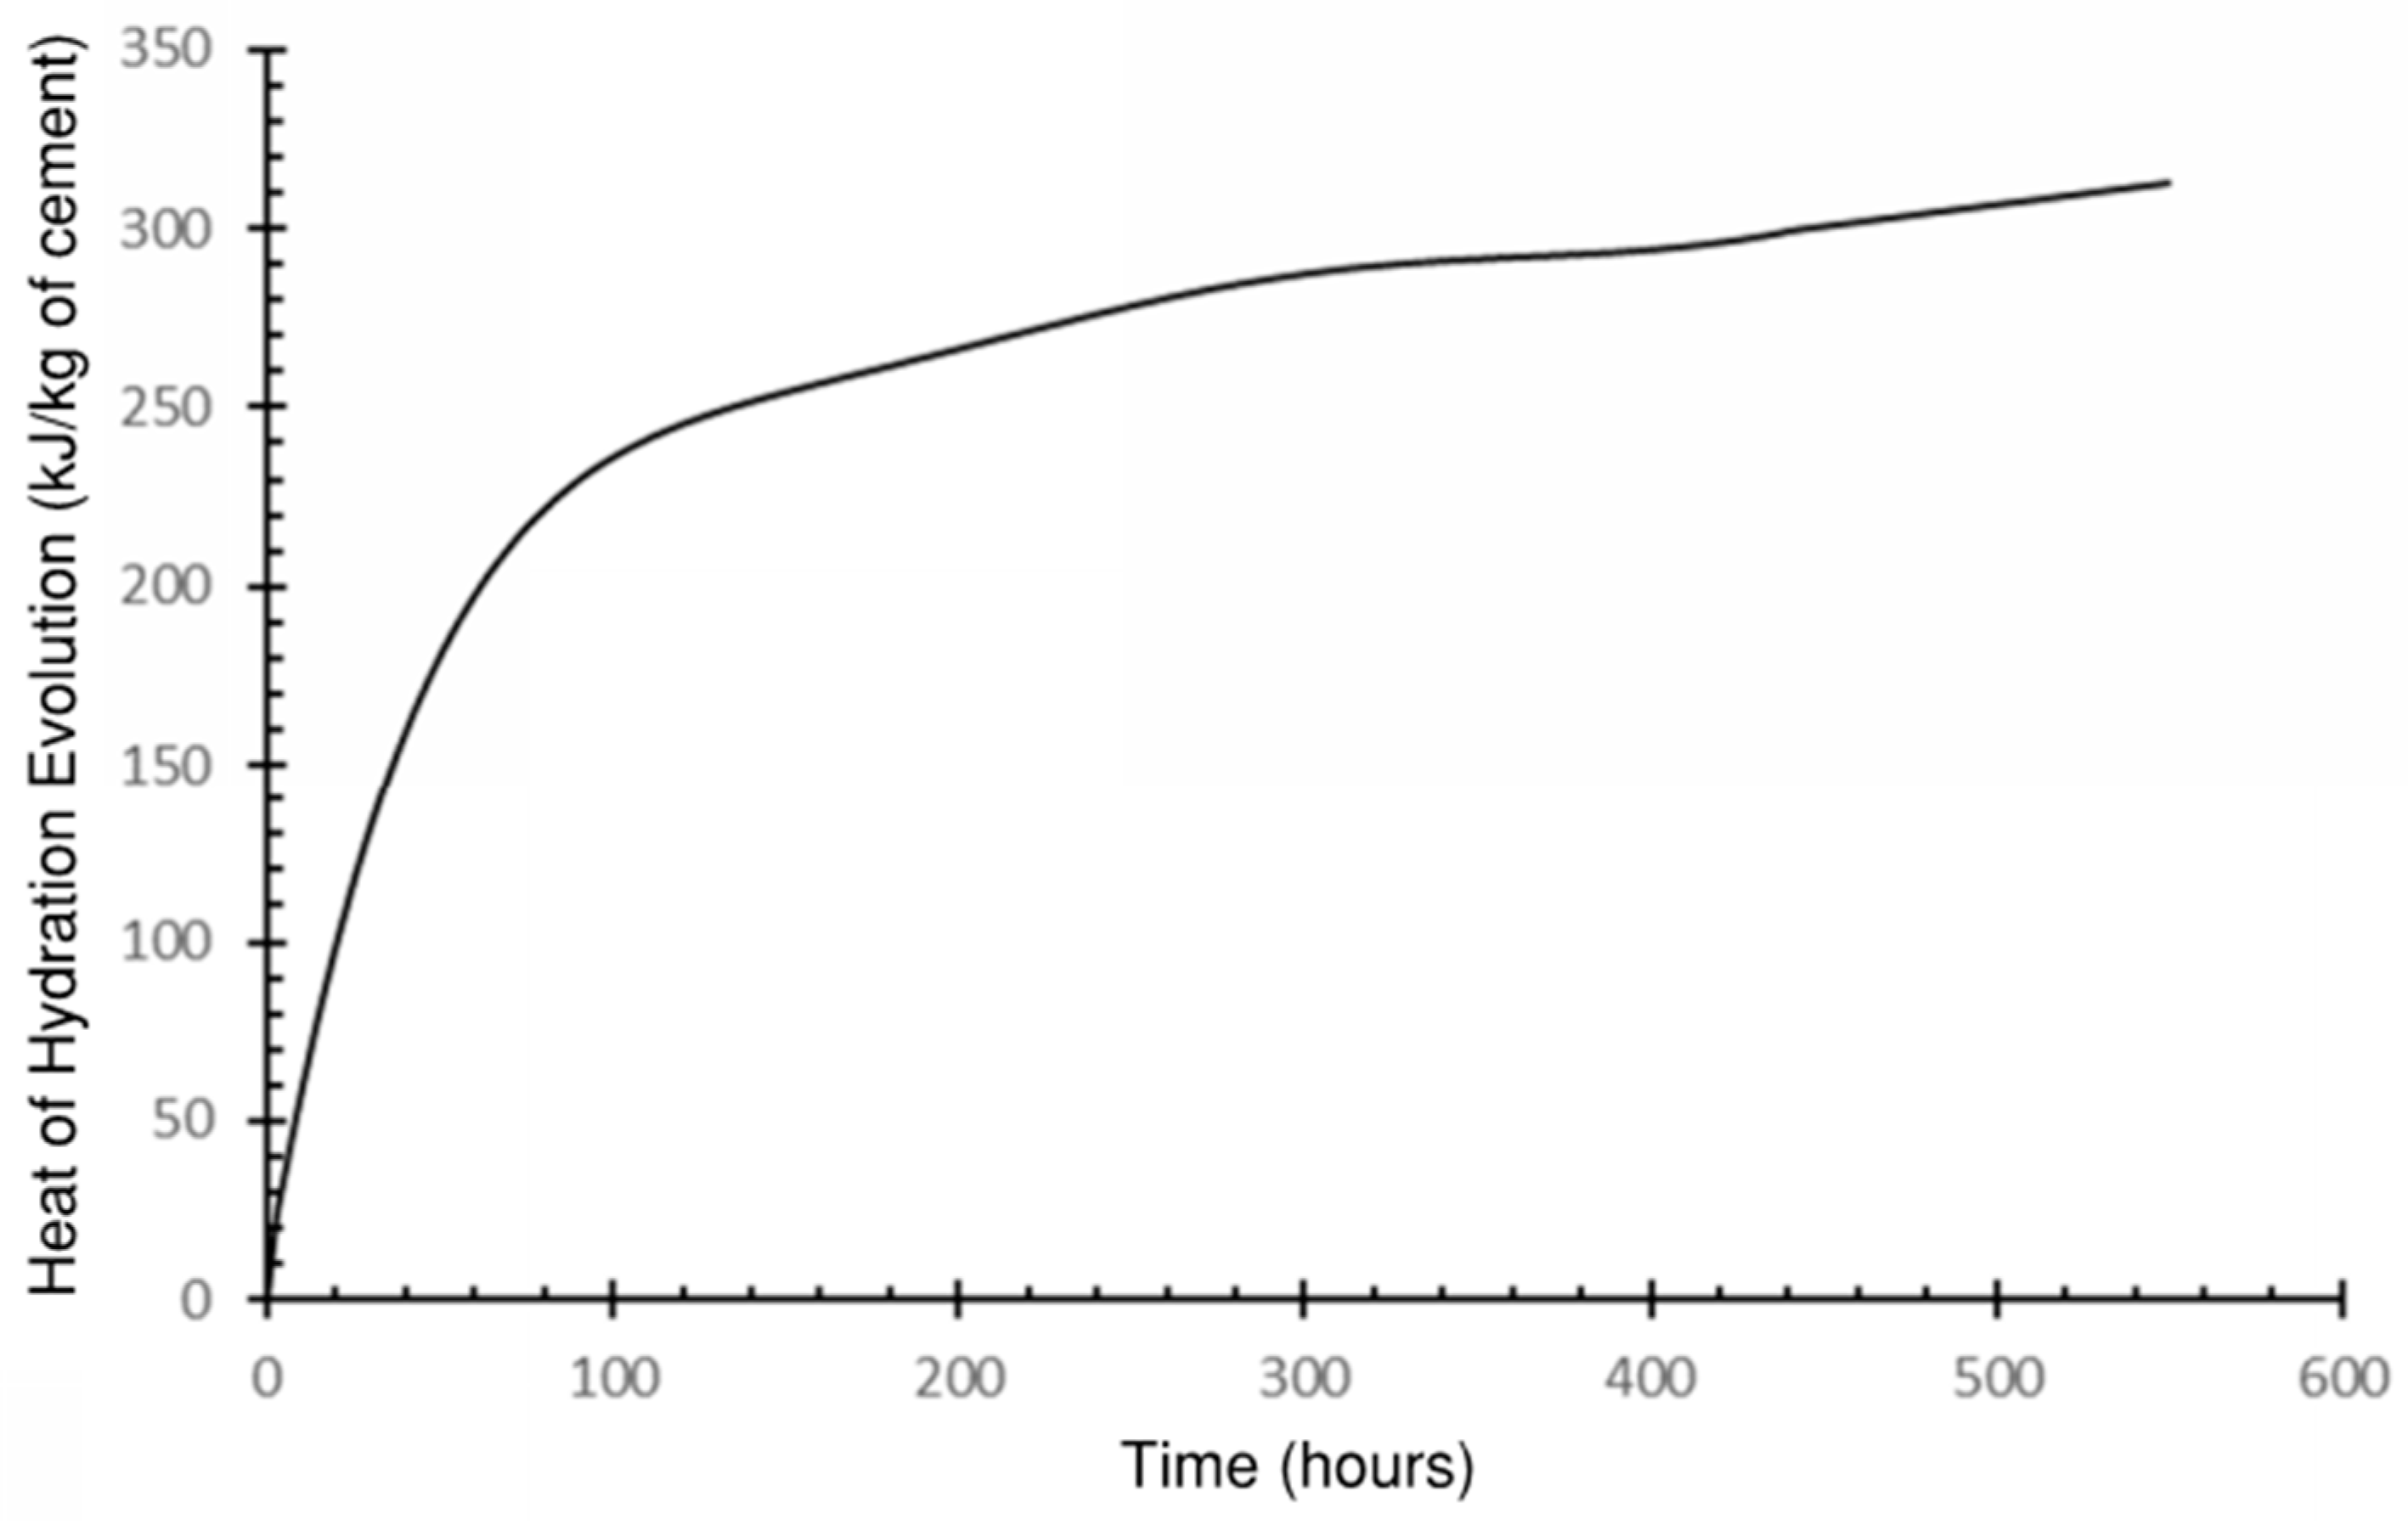
In early-age concrete, heat is released from the exothermic hydration reaction which occurs between cement and water. The heat of hydration increases the temperature of the concrete mix and the embedded reinforcing bars. The temperature increase can reach 55 °C in mixes with high cement content [4]. The variation of the heat of hydration with time is given in Figure 1. Ordinary Portland cement is composed mainly of aluminate (C3A), aluminoferrite (C4AF), belite (C2S), and alite (C3S) [5,6]. The hydration reaction produces calcium silicate hydrate (C-S-H) gel and ettringite, which increase the concrete’s strength. Wet or air curing preserves a satisfactory temperature for the concrete and improves its properties [7].
The coefficients of thermal expansion of concrete and carbon steel bars are 1.1 × 10⁻⁵ °C−1 and 1.2 × 10⁻⁵ °C−1, respectively [8]. These close values imply an excellent thermal compatibility between the two materials. However, the thermal expansion coefficient of SS bars can exceed 1.8 × 10⁻⁵ °C−1 [9]. This relatively large divergence from concrete’s thermal expansion raises concerns about the possibility of additional thermal stresses that may cause cracks. This scenario is expected to be most critical during the curing period, while the concrete’s tensile strength is very low, and its temperature is increasing due to the heat produced during the hydration process.
This paper aims to numerically investigate the influence of the heat of hydration on stress distribution in SS RC sections, considering the thermal incompatibility between the two materials. A finite element model is developed and validated to examine the temperature distribution and stresses developed in SS RC sections. Water and air curing regimes are considered in the analysis.
2. Material Models
2.1. Concrete
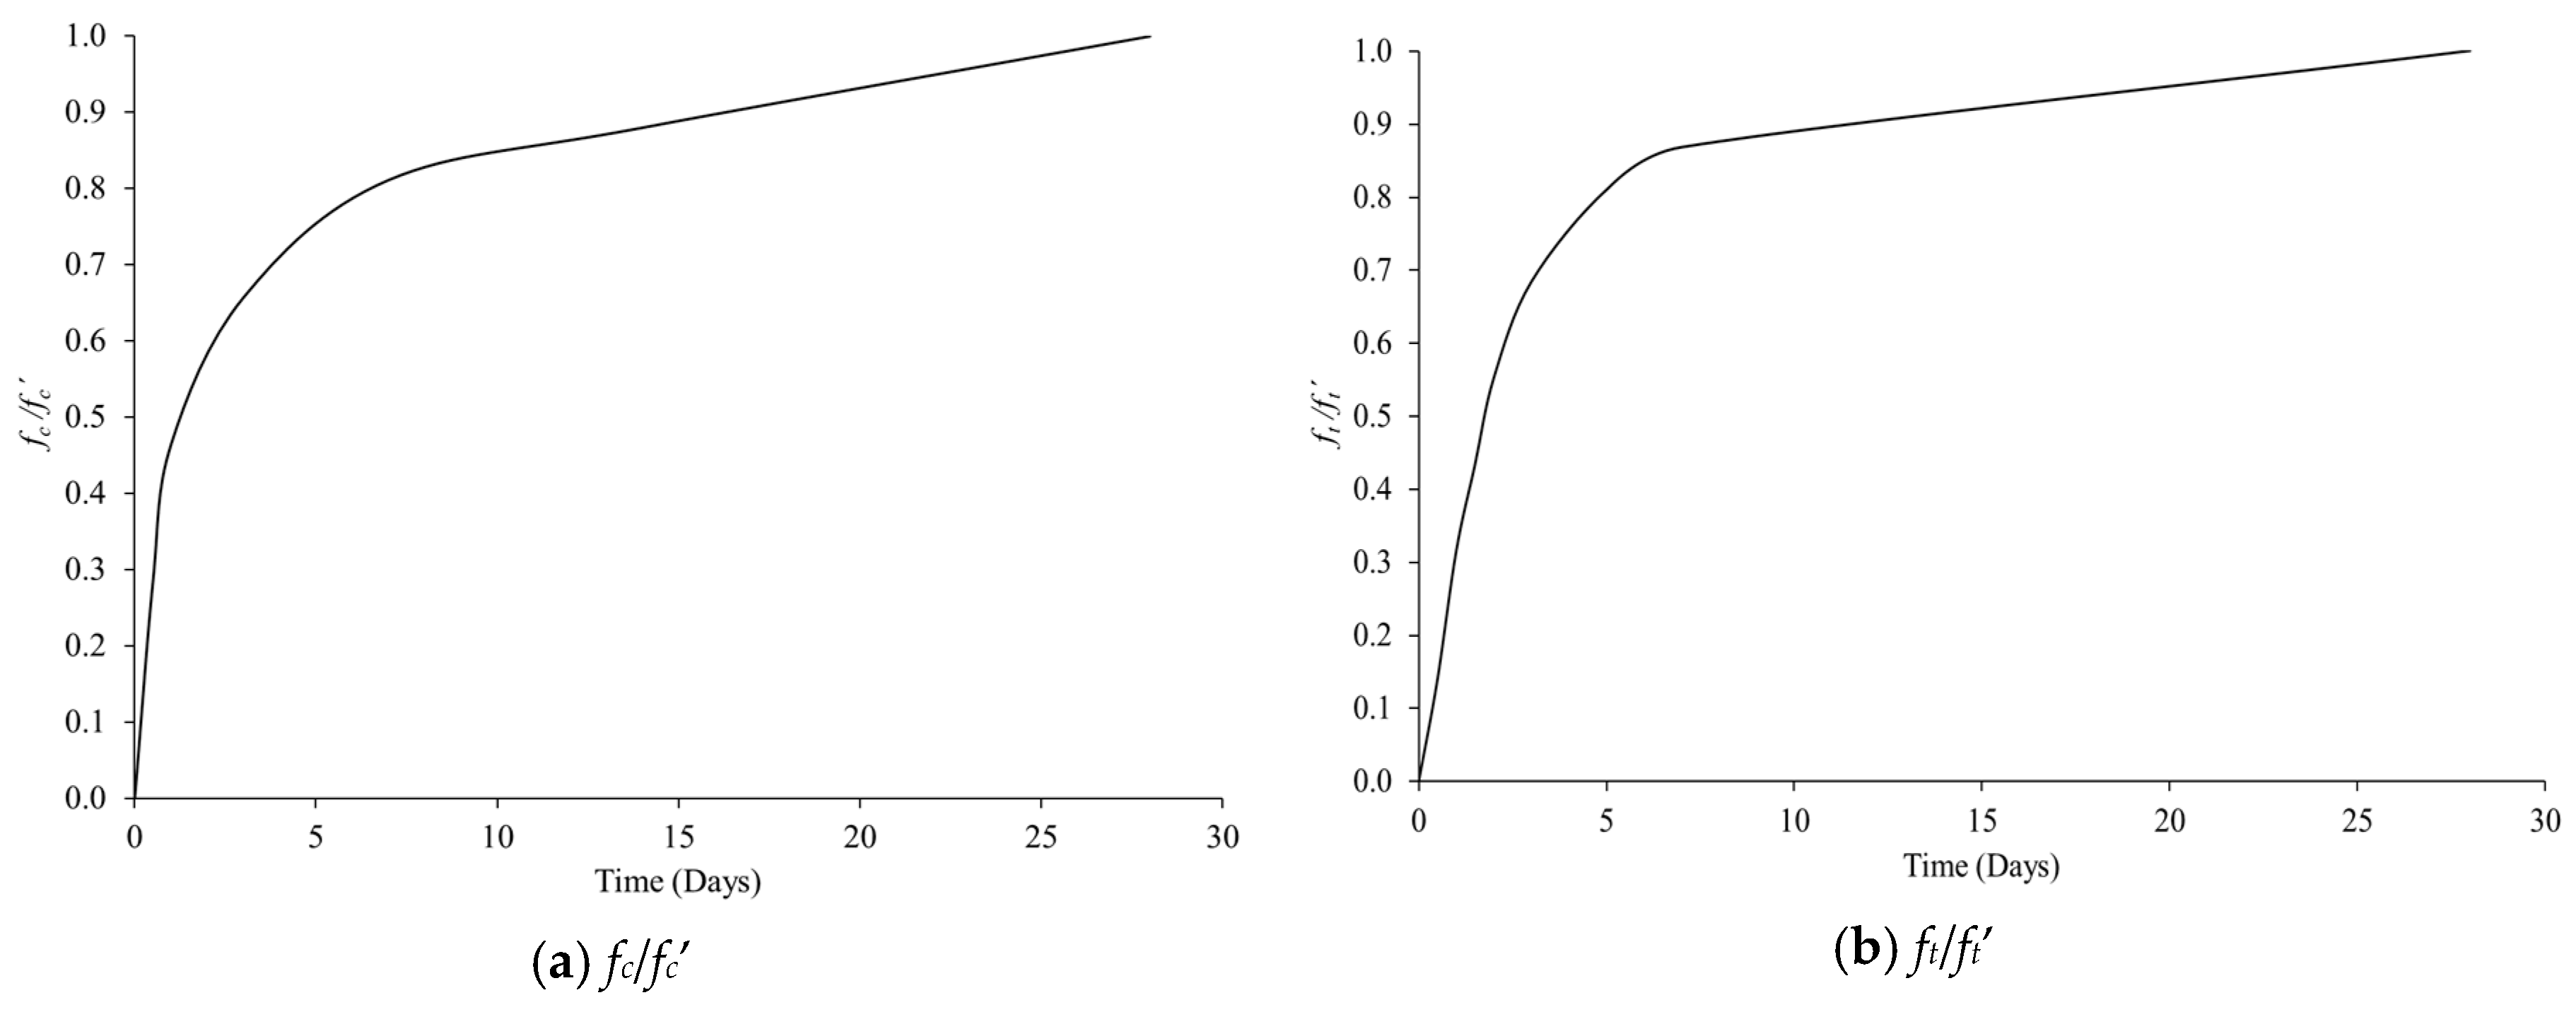
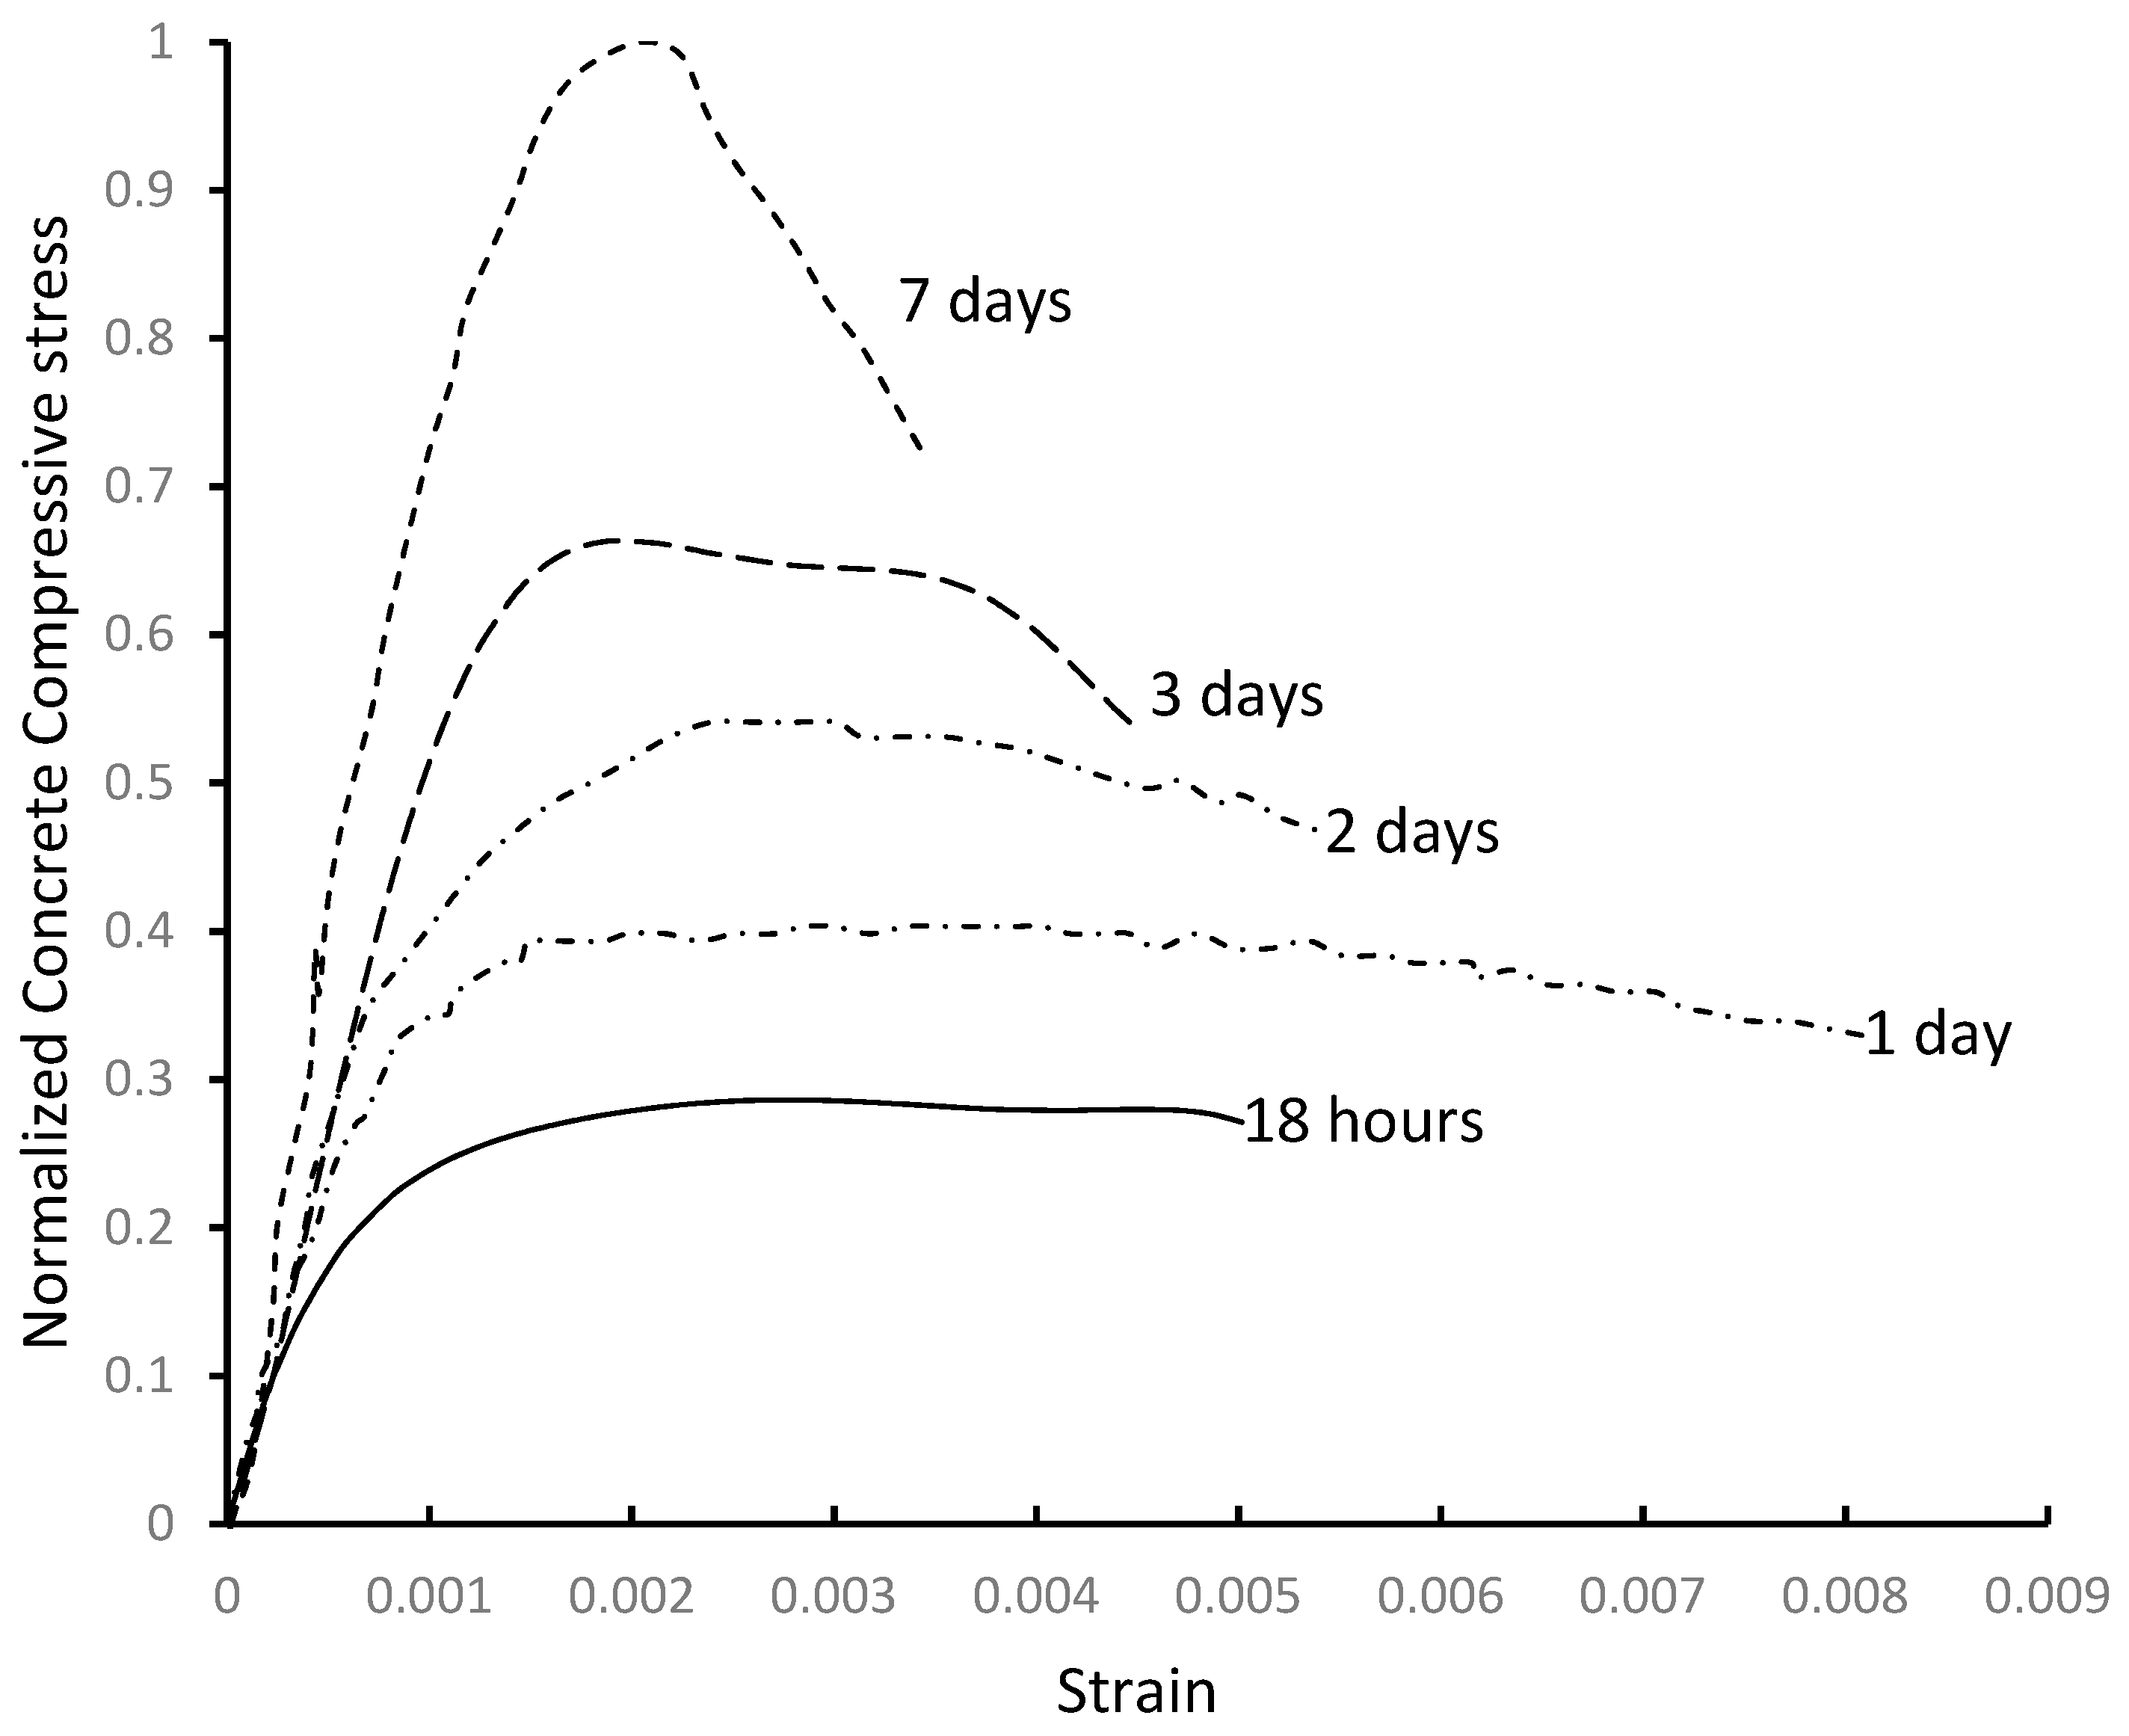
The variations of the concrete compressive strength (fc) and tensile strength (ft) with time were assumed to follow the values reported by Jin et al. [10] and Kim [11], as summarized in Figure 2, where fc’ and ft’ are the 28-day compressive and tensile strength, respectively. The concrete constitutive relationship was assumed to follow the model proposed by Jin et al. [10] and was idealized using the ANSYS multilinear model [12]. The concrete strain at peak stress and Poisson’s ratio were assumed to be 0.002 and 0.30, respectively. Concrete failure was assumed to correspond to the crushing strain for unconfined concrete (εcu = 0.0035) [3]. The normalized compressive stress–strain relationship at various concrete ages is shown in Figure 3. The figure shows that concrete compressive strength increases with time, whereas its ductility decreases. The tensile behavior of concrete is predominantly brittle. Concrete was assumed to resist tensile stresses up to the cracking point, beyond which the tensile capacity of concrete drops to zero. The coefficient of thermal expansion of concrete, its specific heat, and its density were assumed at 1 × 10⁻⁵ °C−1 [3], 920 J/kg·°C [13], and 2300 kg/m3 [14], respectively. The thermal conductivity of concrete was assumed to follow the values provided by EC2 [14], as shown in Figure 4.
2.2. Stainless Steel Bars
The constitutive relationship of SS bars was assumed based on the experimental work of Chen and Young [15]. The coefficients of thermal expansion of austenitic 316LN and duplex 2205 SS bars were assumed at 17.8 × 10⁻⁶ °C−1 and 13 × 10−6 °C−1, respectively. The density, specific heat, and thermal conductivity of the bars were taken as 7750 kg/m3, 440 J/kg·°C [11], and 15 W/m·°C [16], respectively.
3. Finite Element Model
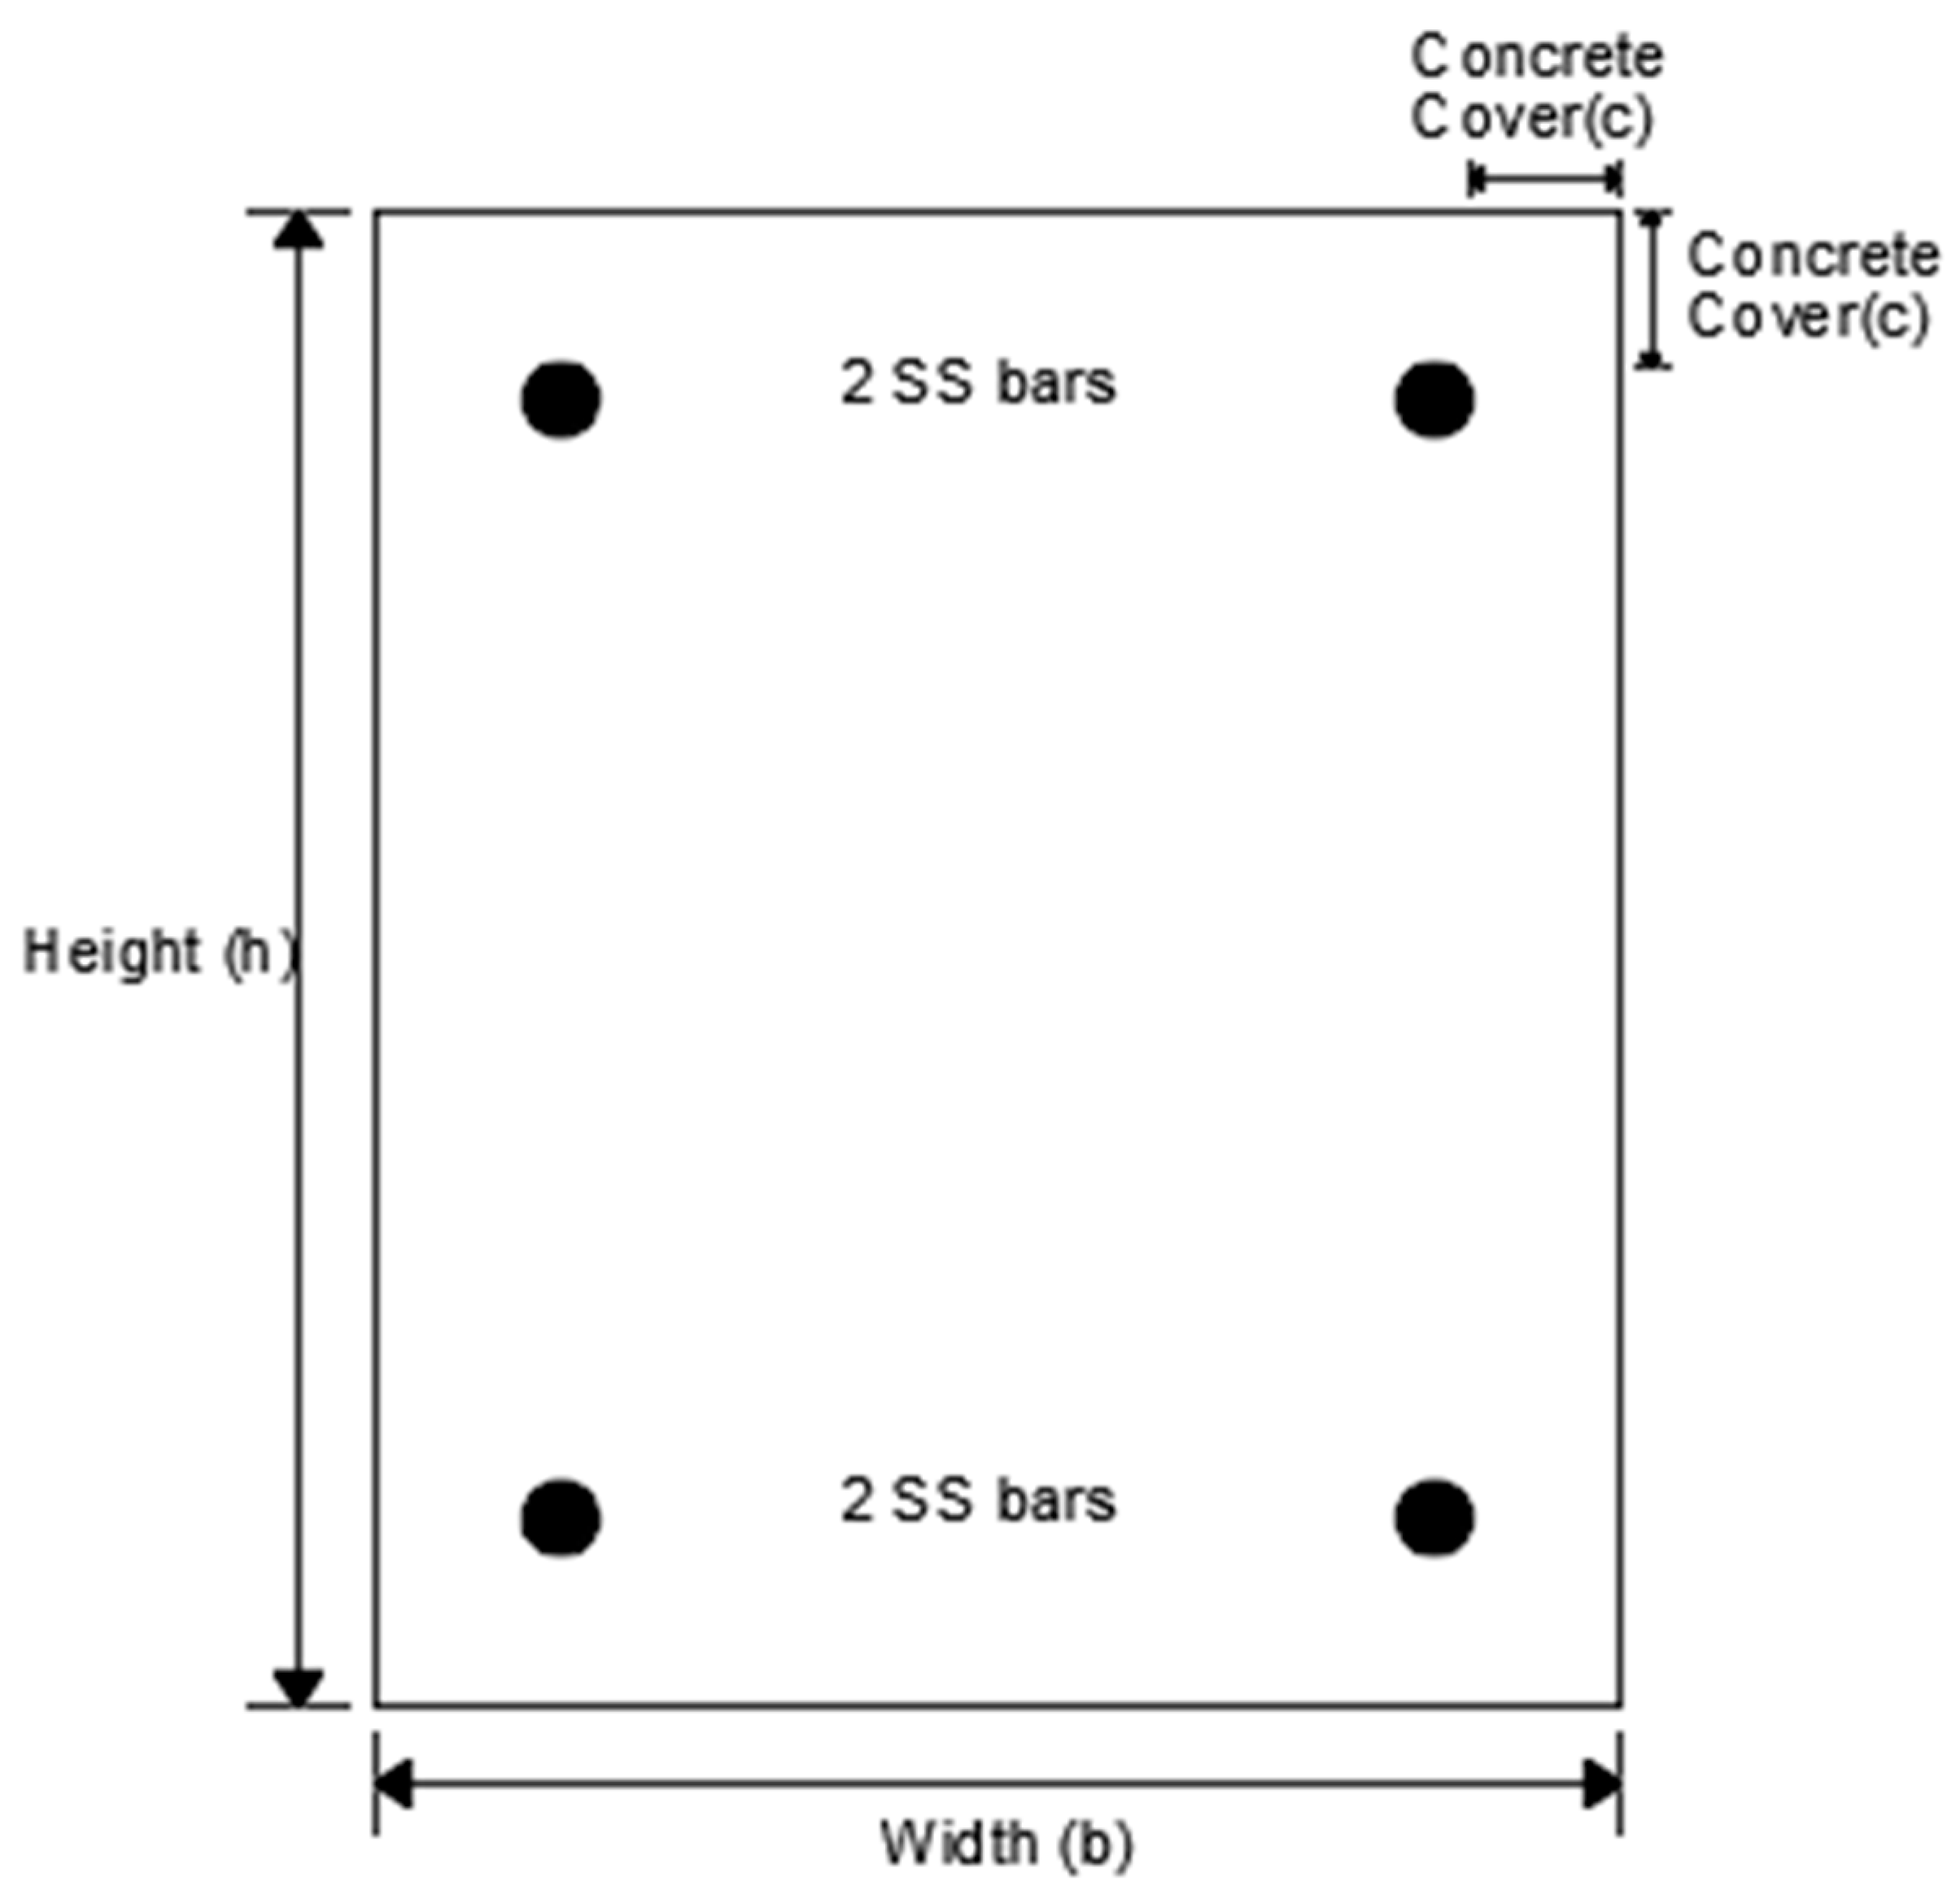
Figure 5 shows a typical SS RC section considered in the analysis. The examined parameters were the section height (h), section width (b), concrete cover (c), and bar diameter (d). The section was assumed to be reinforced with two SS bars in tension and compression.
A two-dimensional thermal-structural analysis was performed using ANSYS 17.2 finite element software [12]. Since the section was doubly symmetric in terms of geometry and applied temperatures, only the bottom-left quarter was considered in the model. The analysis was performed by (1) selecting appropriate elements, (2) specifying thermal and structural material properties, (3) performing thermal analysis to determine the temperature due to heat of hydration at a specific time, and (4) performing a static structural analysis to determine the induced stresses and examine the potential for cracking.
3.1. Thermal Analysis
Both concrete and SS were modeled using PLANE77 [12], a two-dimensional 8-node thermal solid element. The element makes it possible to conduct two-dimensional steady-state analyses and is characterized by its temperature shape functions, which are well-suited to model curved geometries such as the boundary between the concrete and the SS rebars. SURF151 and CONTA171 elements [12] were used at the boundary of the SS bar to model the interaction between the SS rebar and the surrounding concrete. A typical meshed section is shown in Figure 6. The optimum mesh density was chosen by performing a preliminary sensitivity analysis. A preliminary mesh, which was refined around the SS rebar, was first assumed. The mesh was then further refined until the variation in the principal stresses between subsequent refinement reaches could be considered negligible.
RILEM Committee 42 [17] provided details about an experimental program that determined the relationship between the total heat liberated during the hydration reaction and time considering various water/cement ratios. For a water/cement ratio of 0.4, which ensures an adequate amount of water to complete the hydration process, the relationship is shown in Figure 7. The internal heat is generated by applying this relationship as a uniform internal energy that varies with time. Heat transferred by convection was applied on the exposed boundaries using convection coefficients of 12 kcal/m2·h·°C and 4.3 kcal/m2·h·°C for water and air curing, respectively [18,19,20].
3.2. Structural Analysis Model
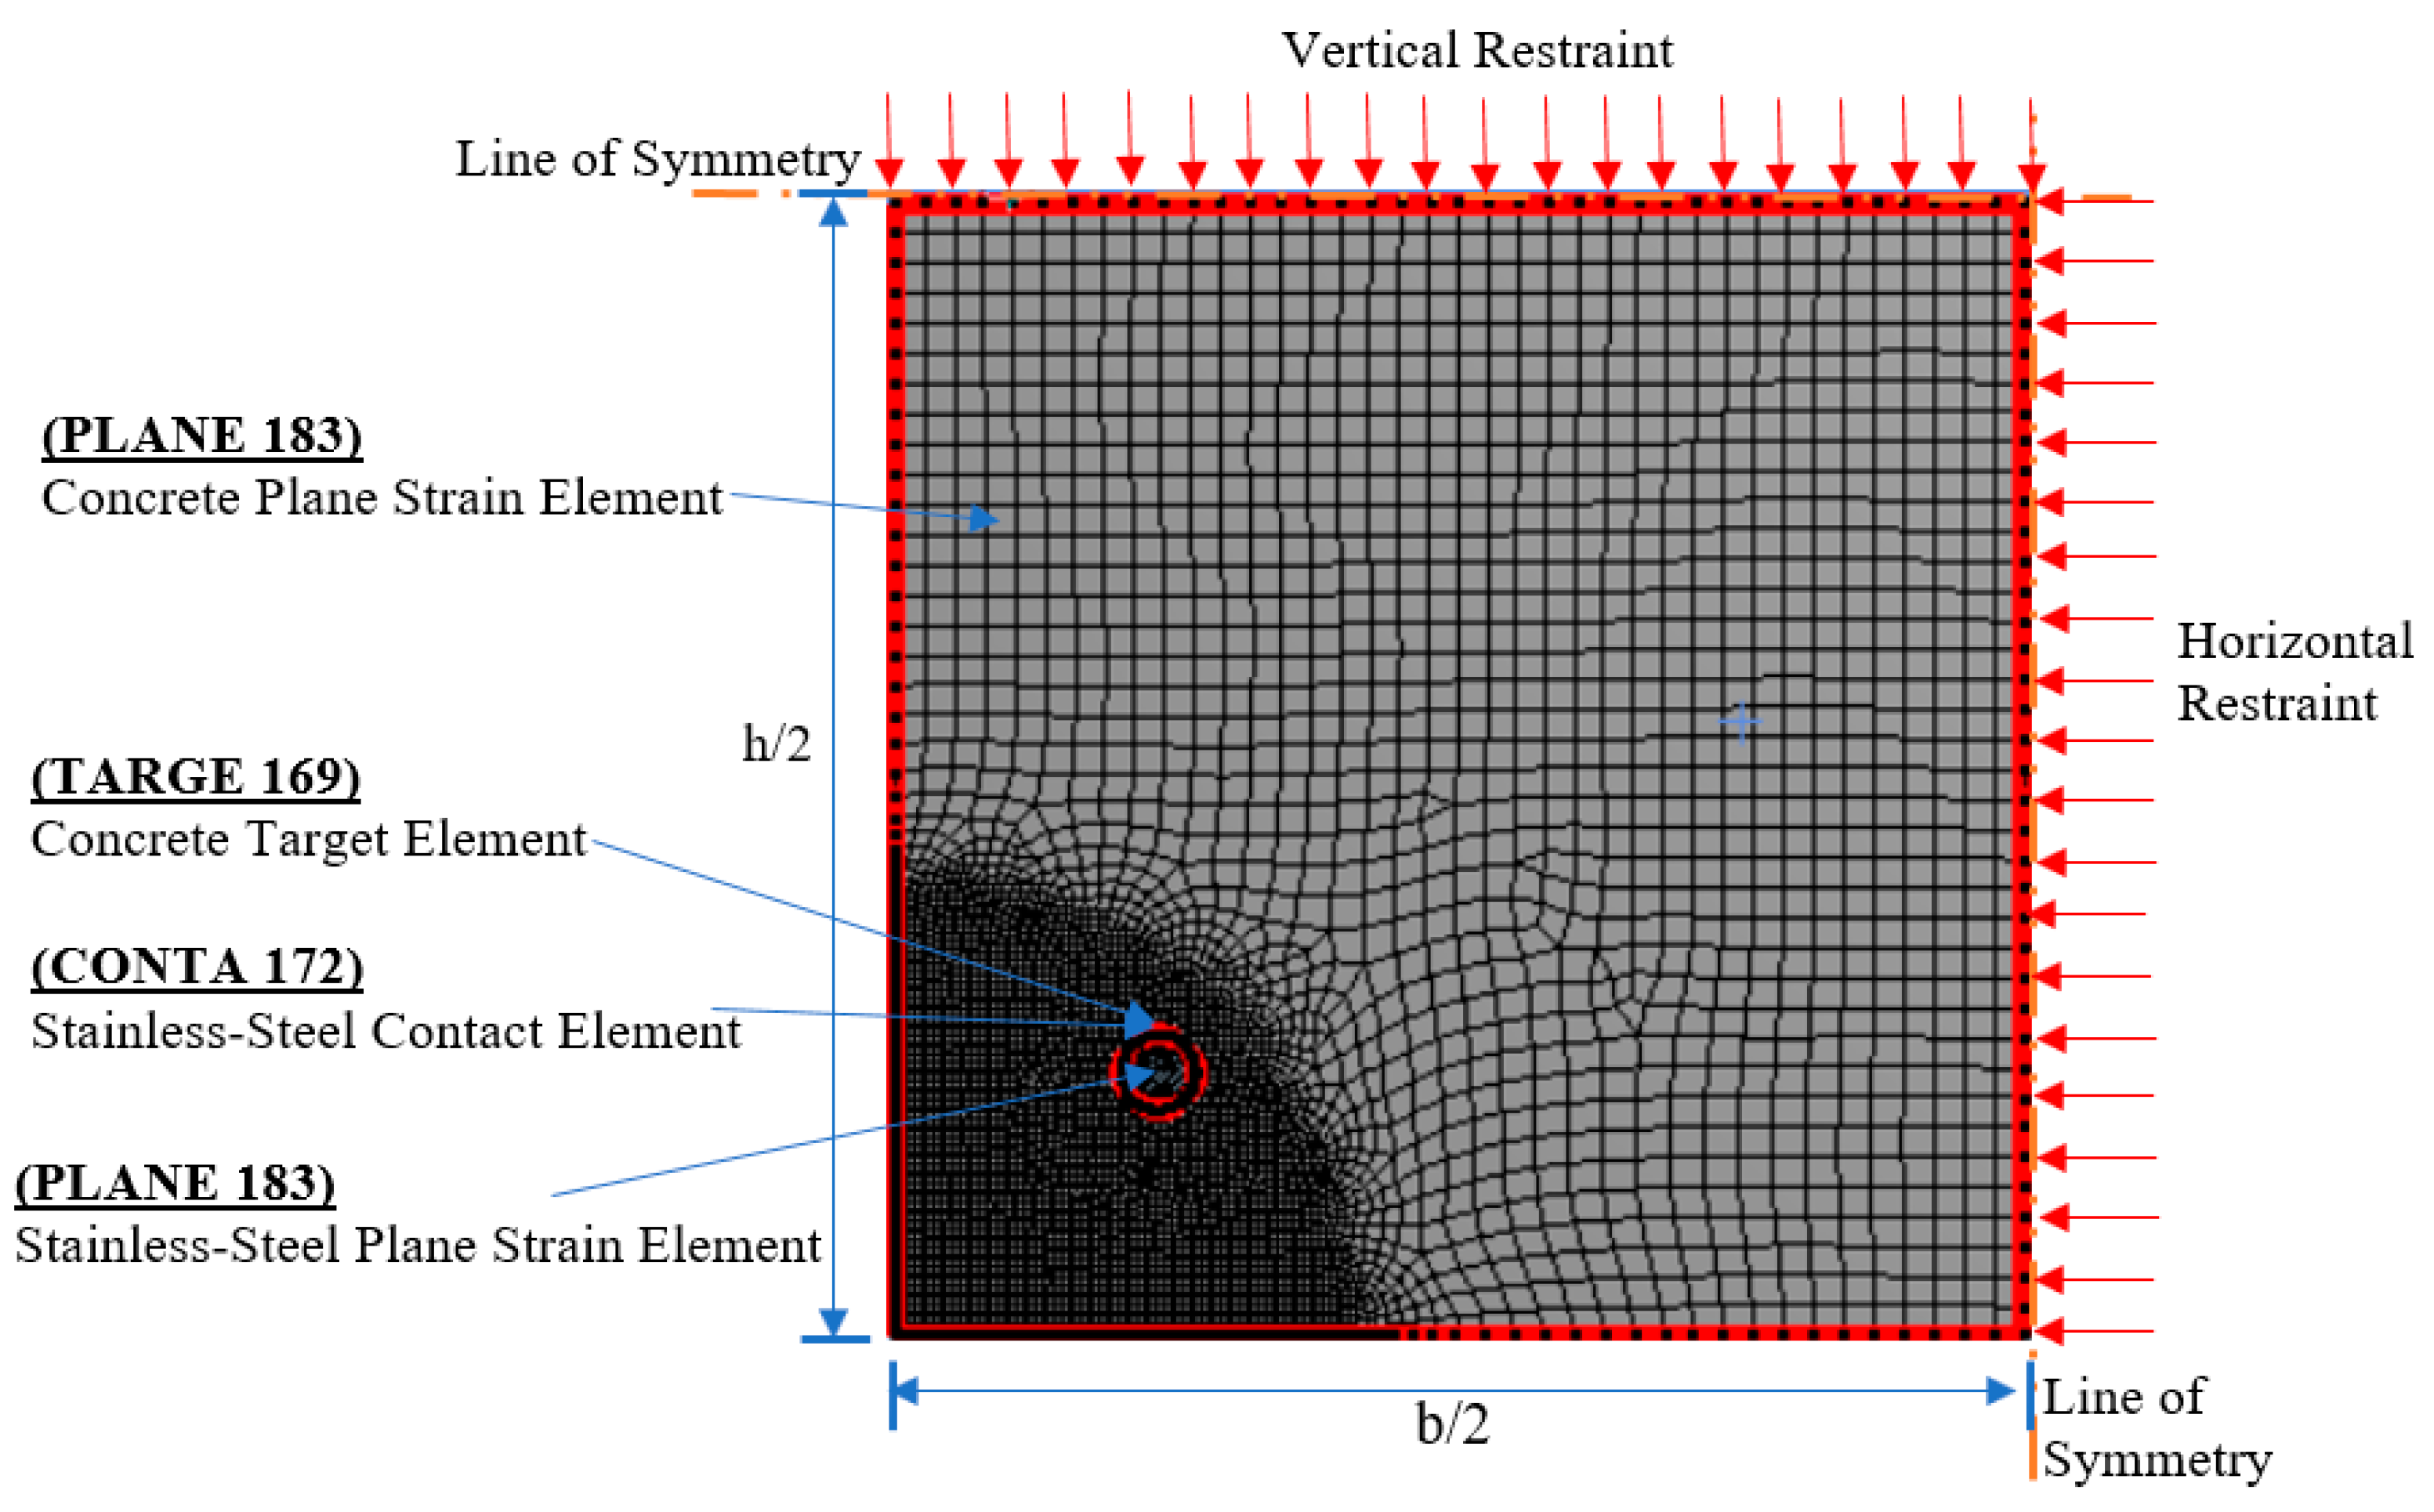
The thermal 2D element (PLANE77), used in the thermal analysis, was replaced with an equivalent structural element (PLANE183) to model the concrete and SS rebars. This high-order 8-node element provides quadratic displacement behavior with two translational degrees of freedom at each node. This feature allows the element to accurately capture the stress distribution. A typical structural mesh is illustrated in Figure 8. The nodes along both lines of symmetry were restrained against orthogonal translational movement, whereas the nodes along the free edges were unrestrained. The temperature values reached in the thermal analysis stage defined the applied thermal loads.
The contact between concrete and the boundaries of the SS bars was simulated by CONTA172 [12] and the associated target element TARGE169 [12]. These elements could capture the deformations of the boundaries. Concrete was considered as the target element, as it was expected to resist the SS rebar expansion.
4. Validation
Unfortunately, the current literature lacks experimental data related to the effect of radial thermal expansion of SS bars on early-age concrete. However, Du et al. [21] conducted a finite element analysis to determine the influence of corrosion-expansion of steel bars on the structural response and cracking behavior of concrete elements. The results revealed the significant role of reinforcement radial expansion on crack formation. A finite element model was also developed and validated by Du et al. [21]. Clark and Saifullah [22] conducted accelerated corrosion tests to study the effects of corroded reinforcement on bond strength and concrete cracking.
Since the mechanism of stress development in the proposed research is similar to that of corroded bars, the results obtained by Clark and Saifullah [22] are considered to validate the finite element model. The RC section considered by Clark and Saifullah [22] had cross-sectional dimensions of h = 175 mm and b = 150 mm. A maximum mesh size of 3 mm was used to model the concrete. Reducing the size to 2.5 mm was found to alter the stresses by 0.2%, which was assumed negligible. The concrete was modeled with a void at the location of each corroded bar. The radial thermal expansion of the steel bars due to corrosion was simulated by applying radial displacement at the concrete nodes in the vicinity of the voids.
The variation of radial expansion at cracking with the ratio of concrete cover to bar diameter (c/d) was determined and compared to the results obtained by Clark and Saifullah [22], as illustrated in Figure 9. The prediction error ranged between 9% and 14%, which is considered acceptable given the complexity of the problem.
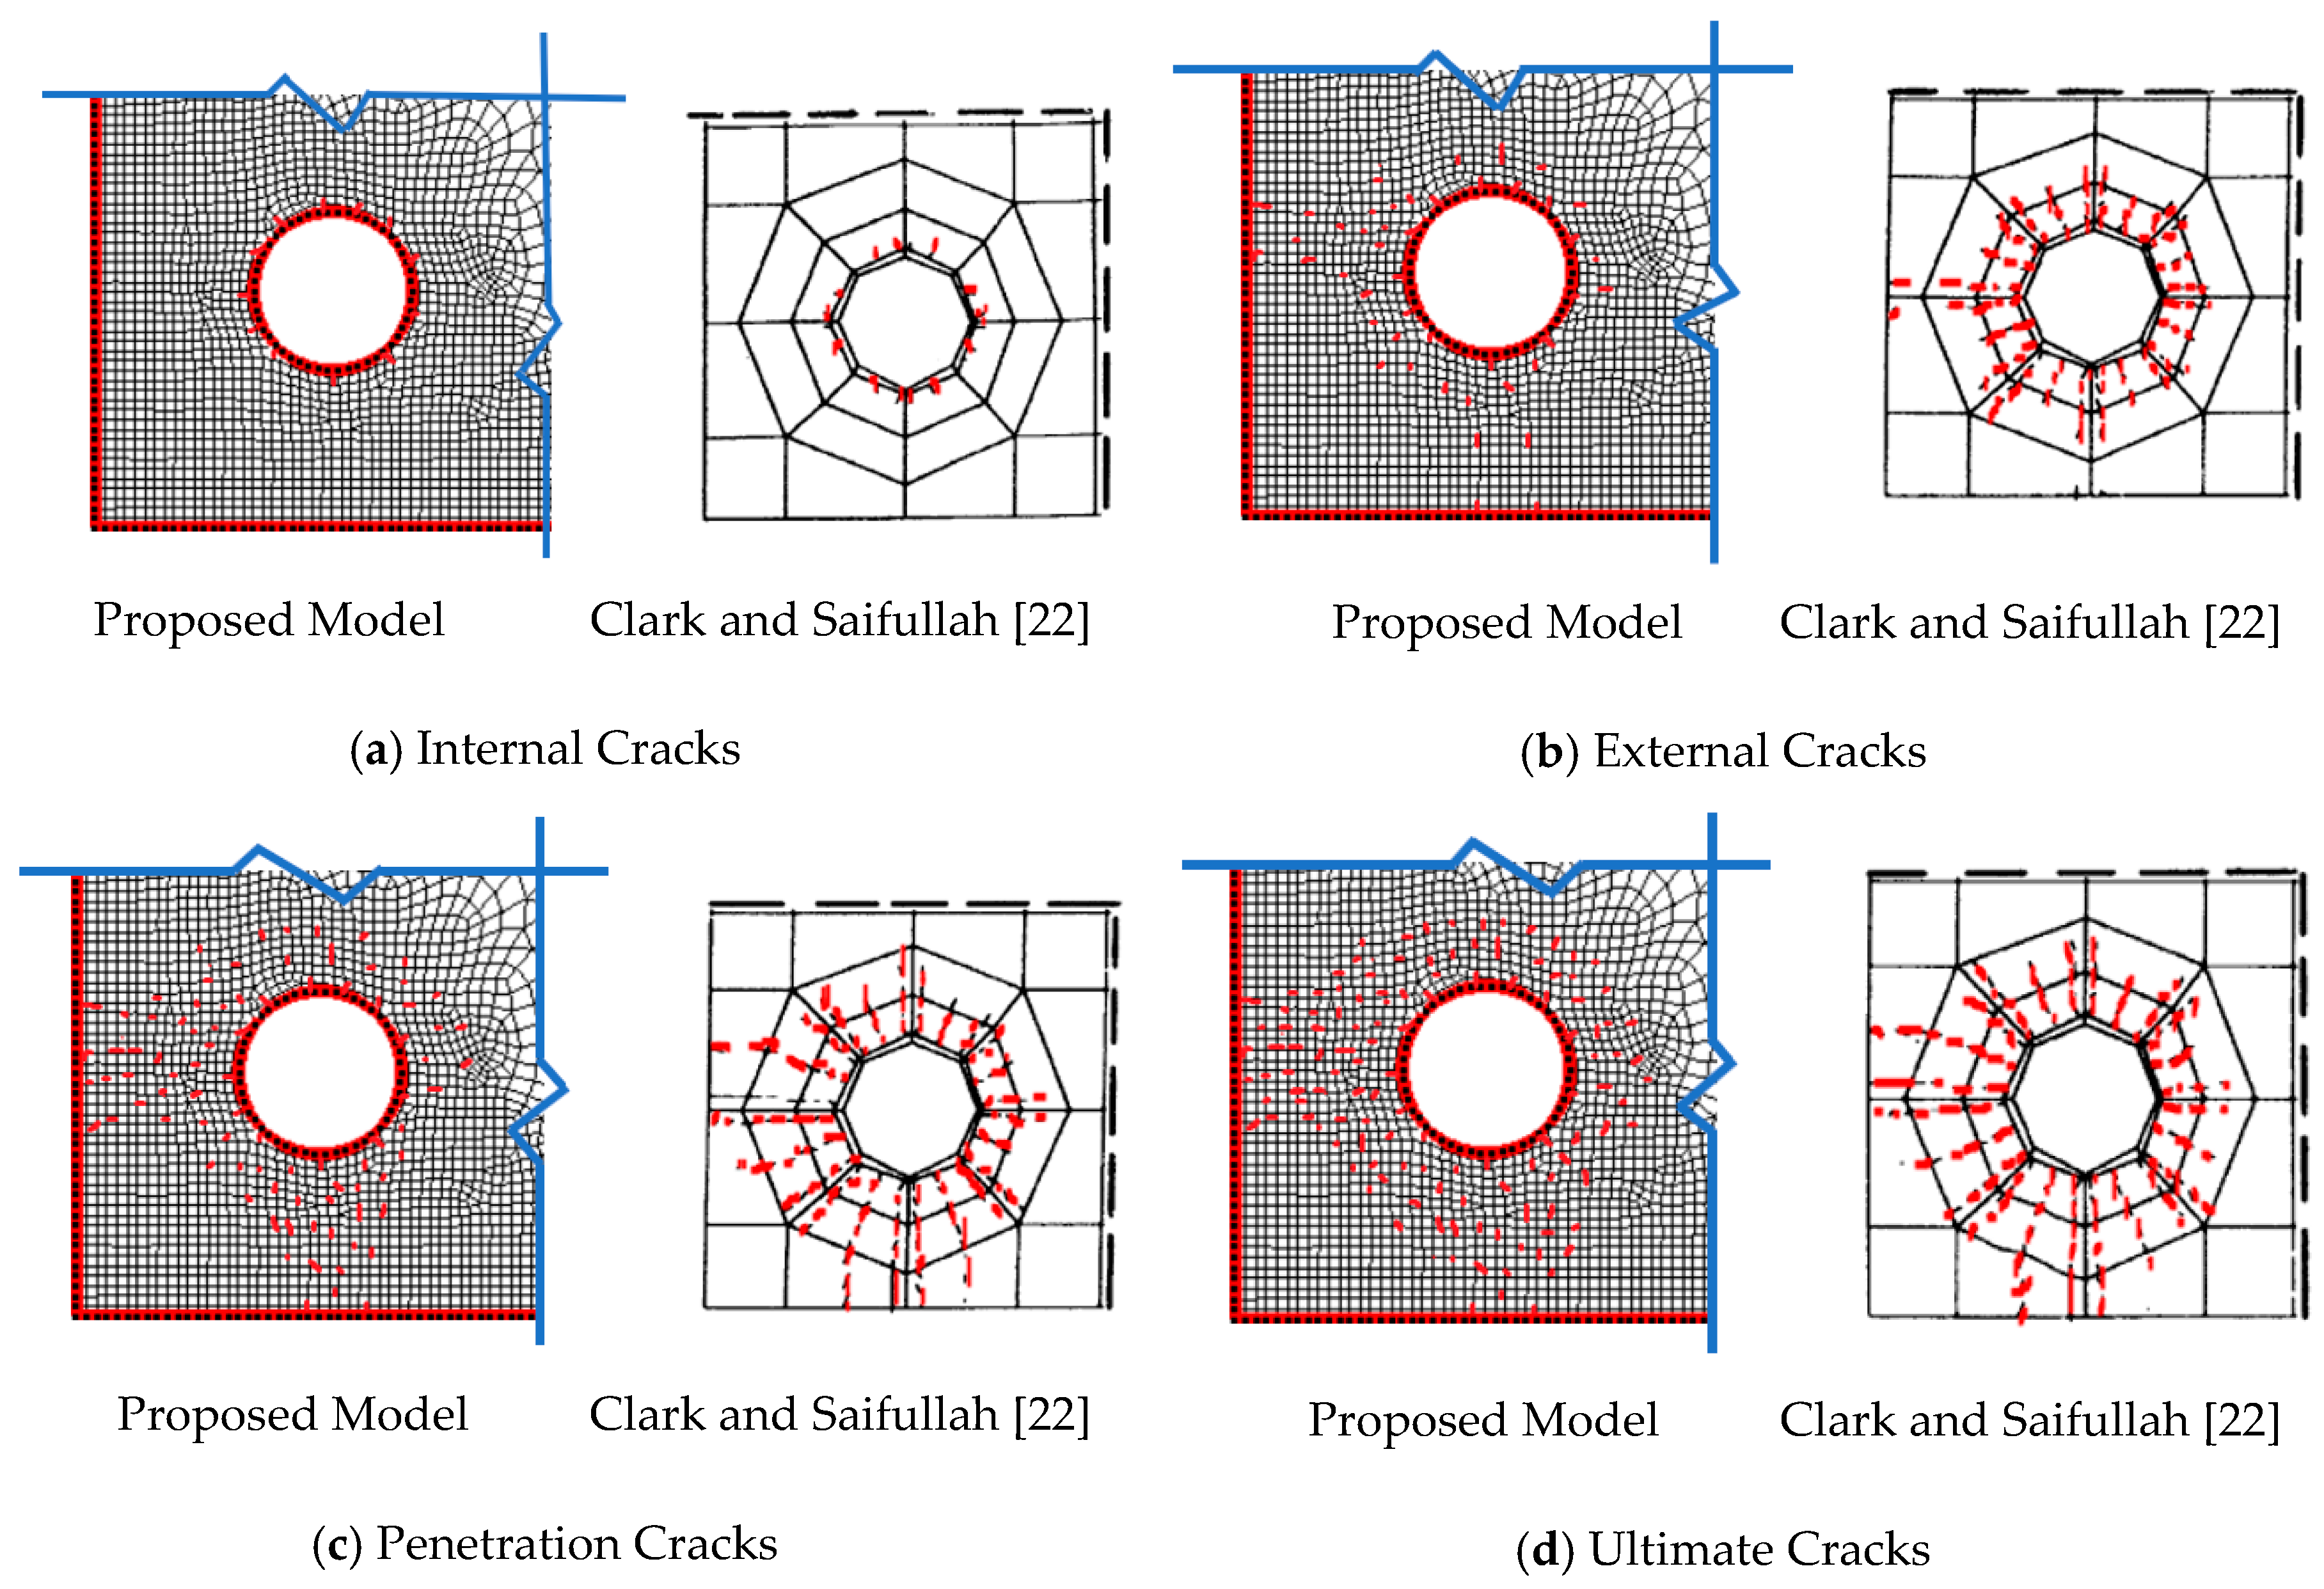
The obtained crack pattern was evaluated and compared to the data provided by Clark and Saifullah [22], as shown in Figure 10. As the radial expansion of the corroded reinforcement increased, the cracking of concrete followed the same stages described by Clark and Saifullah [22]: (1) internal cracks, as shown in Figure 10a, which started at a radial expansion of 0.00044 mm, as compared to 0.00050 mm by Clark and Saifullah [22]; (2) external cracks, as shown in Figure 10b, which resulted in the formation of surface cracks at a radial expansion of 0.00135 mm, as compared to 0.00120 mm by Clark and Saifullah [22]; (3) penetration cracking, as shown in Figure 10c, which connected the surface cracks with the internal ones at a radial expansion of 0.0016 mm, as compared to 0.001 mm found by Clark and Saifullah [22]; and (4) ultimate cracks, as shown in Figure 10d, which included all the potential cracks at a radial expansion of 0.0019 mm, as compared to 0.0017 mm as found by Clark and Saifullah [22].
5. Parametric Study
A parametric study was carried out to investigate the influence of varying the cross-section dimensions, bar diameter, SS type, and curing method on the radial thermal stresses developed in SS RC sections. Two sections, with dimensions of 300 mm by 300 mm and 600 mm by 600 mm, were considered in the analysis. Both 316LN and duplex SS bars with diameters of 20 mm and 30 mm were examined. Both air curing and water curing were considered. Concrete cover, concrete tensile strength, and concrete compressive strength were assumed at 35 mm, 3.8 MPa, and 30 MPa, respectively. Therefore, a total of 16 different cases were assessed.
Based on a sensitivity analysis, the optimum mesh size was chosen to vary between 0.85 mm for locations adjacent to the reinforcing bars and 4.0 mm at the core of the concrete section. Boundary conditions and the generated heat of hydration were applied, as discussed previously. Changing SS bar diameter was found to have negligible influence on the temperature distribution within the concrete section, resulting in a maximum difference of less than 1%. Additionally, varying the SS bar type did not have any effect on the temperature distribution, as both 316LN and duplex SS bars possess almost identical thermal properties.
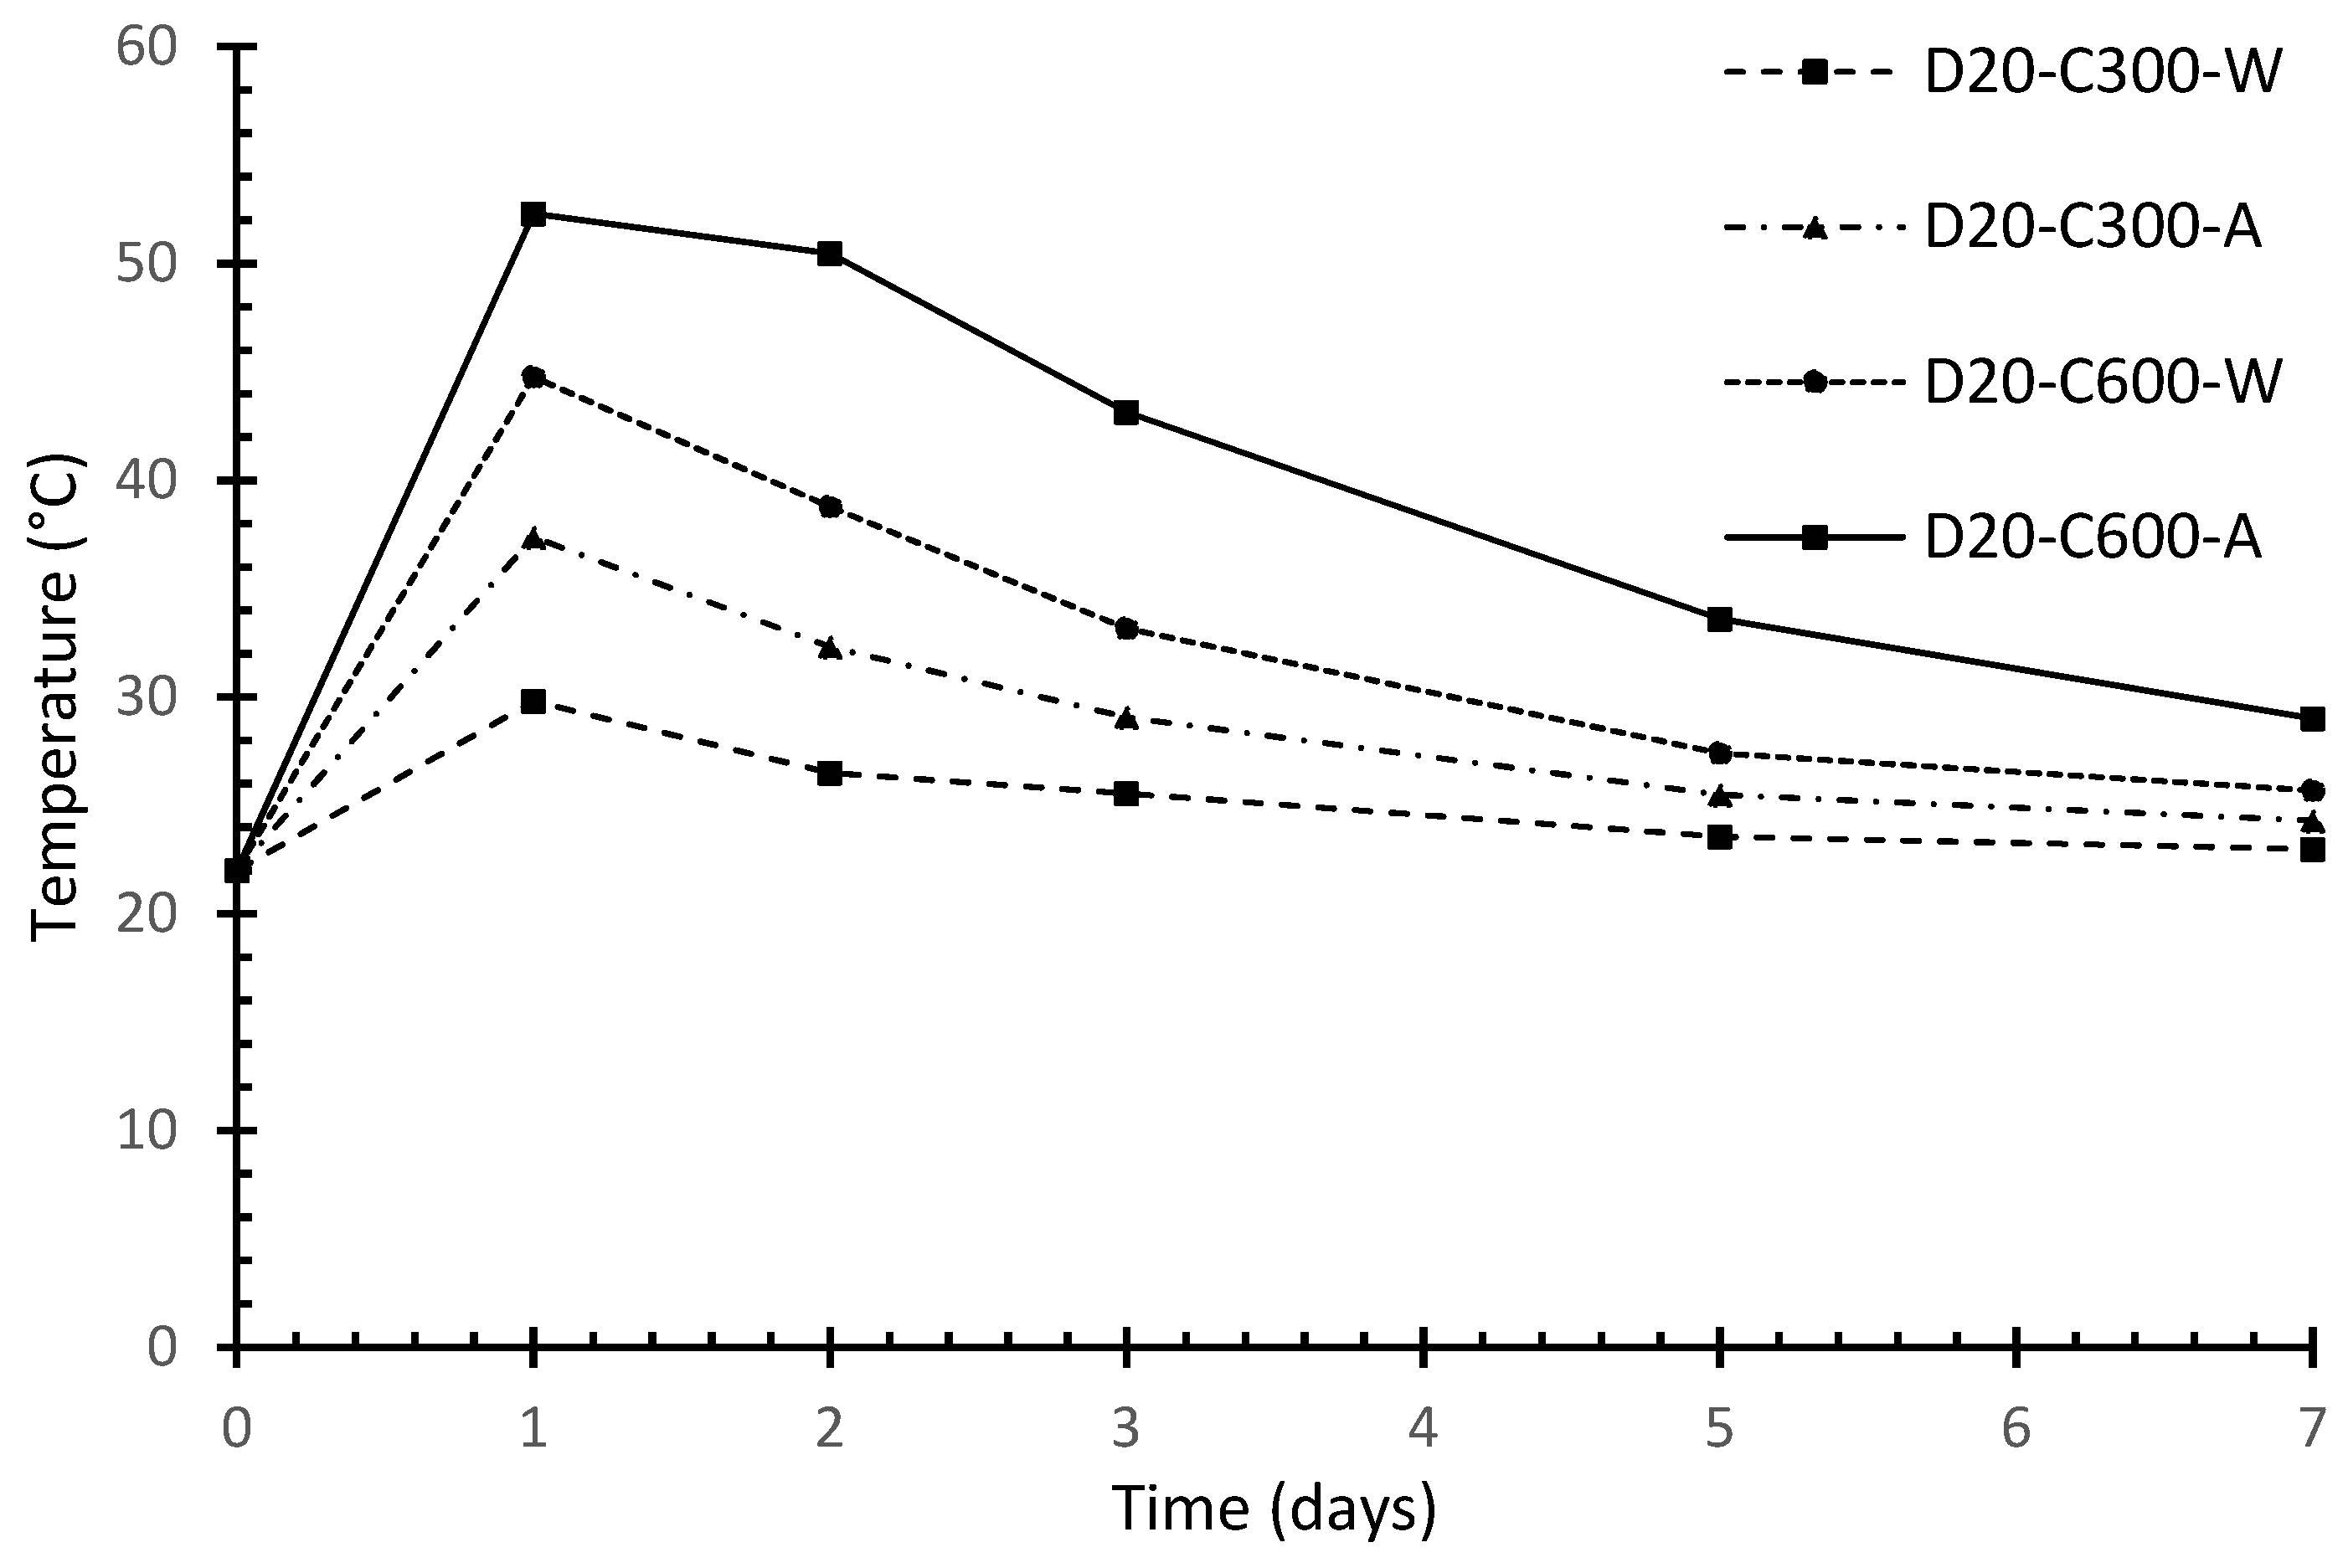
The variation of temperature with time due to the hydration reaction at a point located at the center of the considered RC sections is illustrated in Figure 11, considering 20 mm SS bars (D20), sections with 300 mm or 600 mm dimensions (C300 or C600), and cooling using air or water (A or W). All curves followed the same general trend, which was characterized by a sharp increase in temperature during the initial period until reaching a peak value at about one day. After that, the temperature decreased gradually with a decreasing rate. For the same cross-sectional dimensions, air-cured specimens exhibited higher temperature values than their counterparts subjected to water curing. This was caused by the higher convection coefficient for water, which affected the heat transfer at the interface between the concrete specimens and the surrounding medium.
The rising rate of temperature in the air-cured specimens was found to be about 50% higher than the water-cured specimens, considering a width of 300 mm. By increasing the specimen’s width to 600 mm, the change in rate dropped to about 25%. This variation was attributed to the larger volume in the second case, and consequently, the further away the center of the section was from the surface. Therefore, the internal points were less affected by the variation of the curing regime as the dimensions of the concrete block increased.
Doubling the side length of the examined concrete sections from 300 mm to 600 mm resulted in increasing the initial rate of temperature from 15.3 °C/day to 30.3 °C/day for air-cured specimens and from 7.8 °C/day to 22.8 °C/day for water-cured specimens. This change is attributed to the higher amount of heat energy from the exothermic hydration reaction in larger specimens as compared to the smaller ones.
After one day, the heat energy released from the hydration reaction decreased gradually. This resulted in reducing the temperature, as indicated in Figure 11. In the 300 mm specimens, the reduction rate was almost identical for both air curing and water curing. However, by increasing the section dimensions to 600 mm, the reduction rate in the water-cured specimens became about 25% higher than that of the air-cured specimens. This was attributed to the larger distance from the section center to the surface and the higher heat energy generated in larger specimens.
Peak temperature distribution within the D20–C600 specimen after one day is shown in Figure 12a,b for water-curing and air-curing regimes, respectively. For both regimes, the temperature was at its maximum at the concrete center and its value decreased gradually until reaching the surface. At any point within the examined sections, temperature was lower in the water-cured specimens than the air-cured specimens. This difference was more apparent in the outer elements located near the curing medium. The temperature of the embedded SS bar was assumed to be identical to that of the adjacent concrete elements.
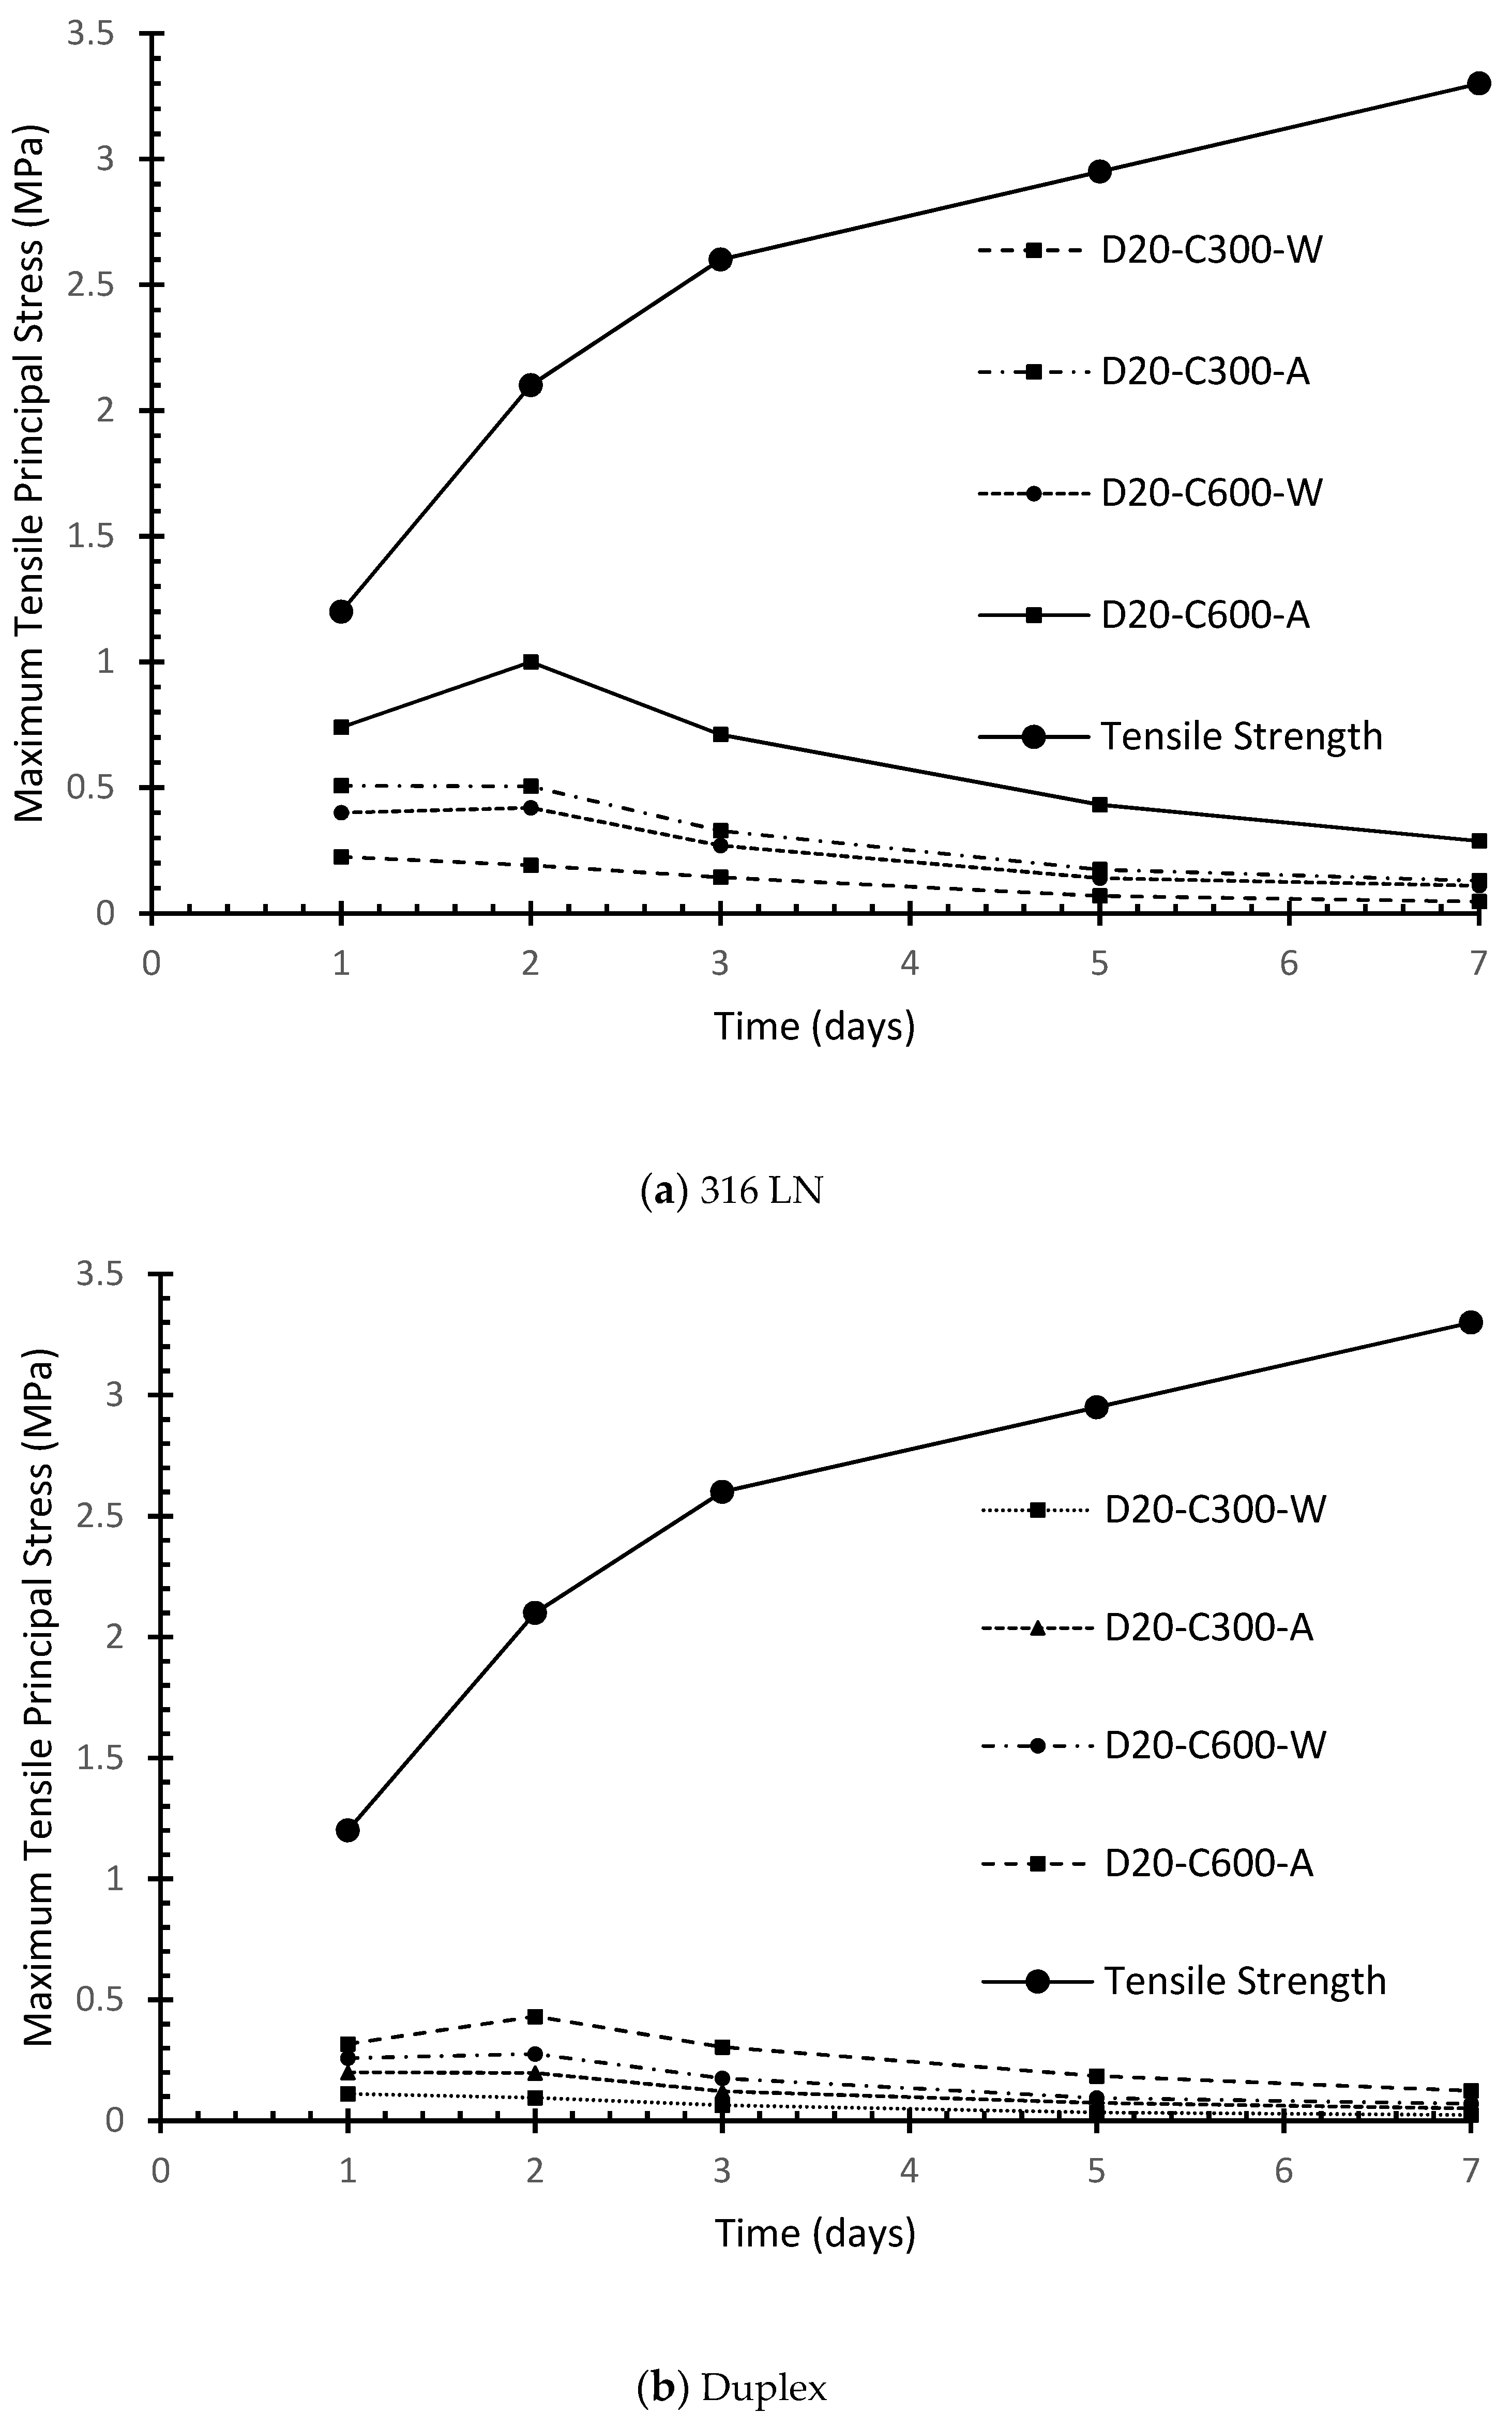
Figure 13a,b illustrate the variation of the principal tensile stresses considering 316 LN and duplex SS bars, respectively. The concrete tensile strength is also shown. The continuous increase in concrete tensile strength was attributed to the continuous hydration reaction, taking place in the early-age concrete. The principal tensile stress increased during the first day until reaching a peak, beyond which a gradual decrease was experienced over a longer duration. This behavior followed the trend of the temperature distribution resulting from hydration reaction. As the temperature increased, thermal expansion in the SS bars increased at a higher rate than the surrounding concrete, causing higher thermal stresses to develop. It should be noted that for all analyzed samples, the developed tensile stresses were lower than the tensile strength of concrete, and thus concrete cracking was not expected to occur.
Figure 14 illustrates the principal stress distribution in Section D20-C300 after 1 day of hydration. The figure shows that the principal stress in concrete was at a maximum near the SS bars and decreased toward the surface. Changing the size of the SS bar from 20 to 30 mm had an insignificant effect on the peak tensile stress since the temperature variation did not exceed 5%. Increasing the section cross section from 300 mm by 300 mm to 600 mm by 600 mm increased the developed stresses by an average of 55% around the SS bar. By changing the curing regime from water curing to air curing, a 150% increase in stress was observed in all sections reinforced with 316 LN SS bars. Considering duplex reinforcement, the stresses increased by 100% for C300 sections and by 60% for C600 sections.
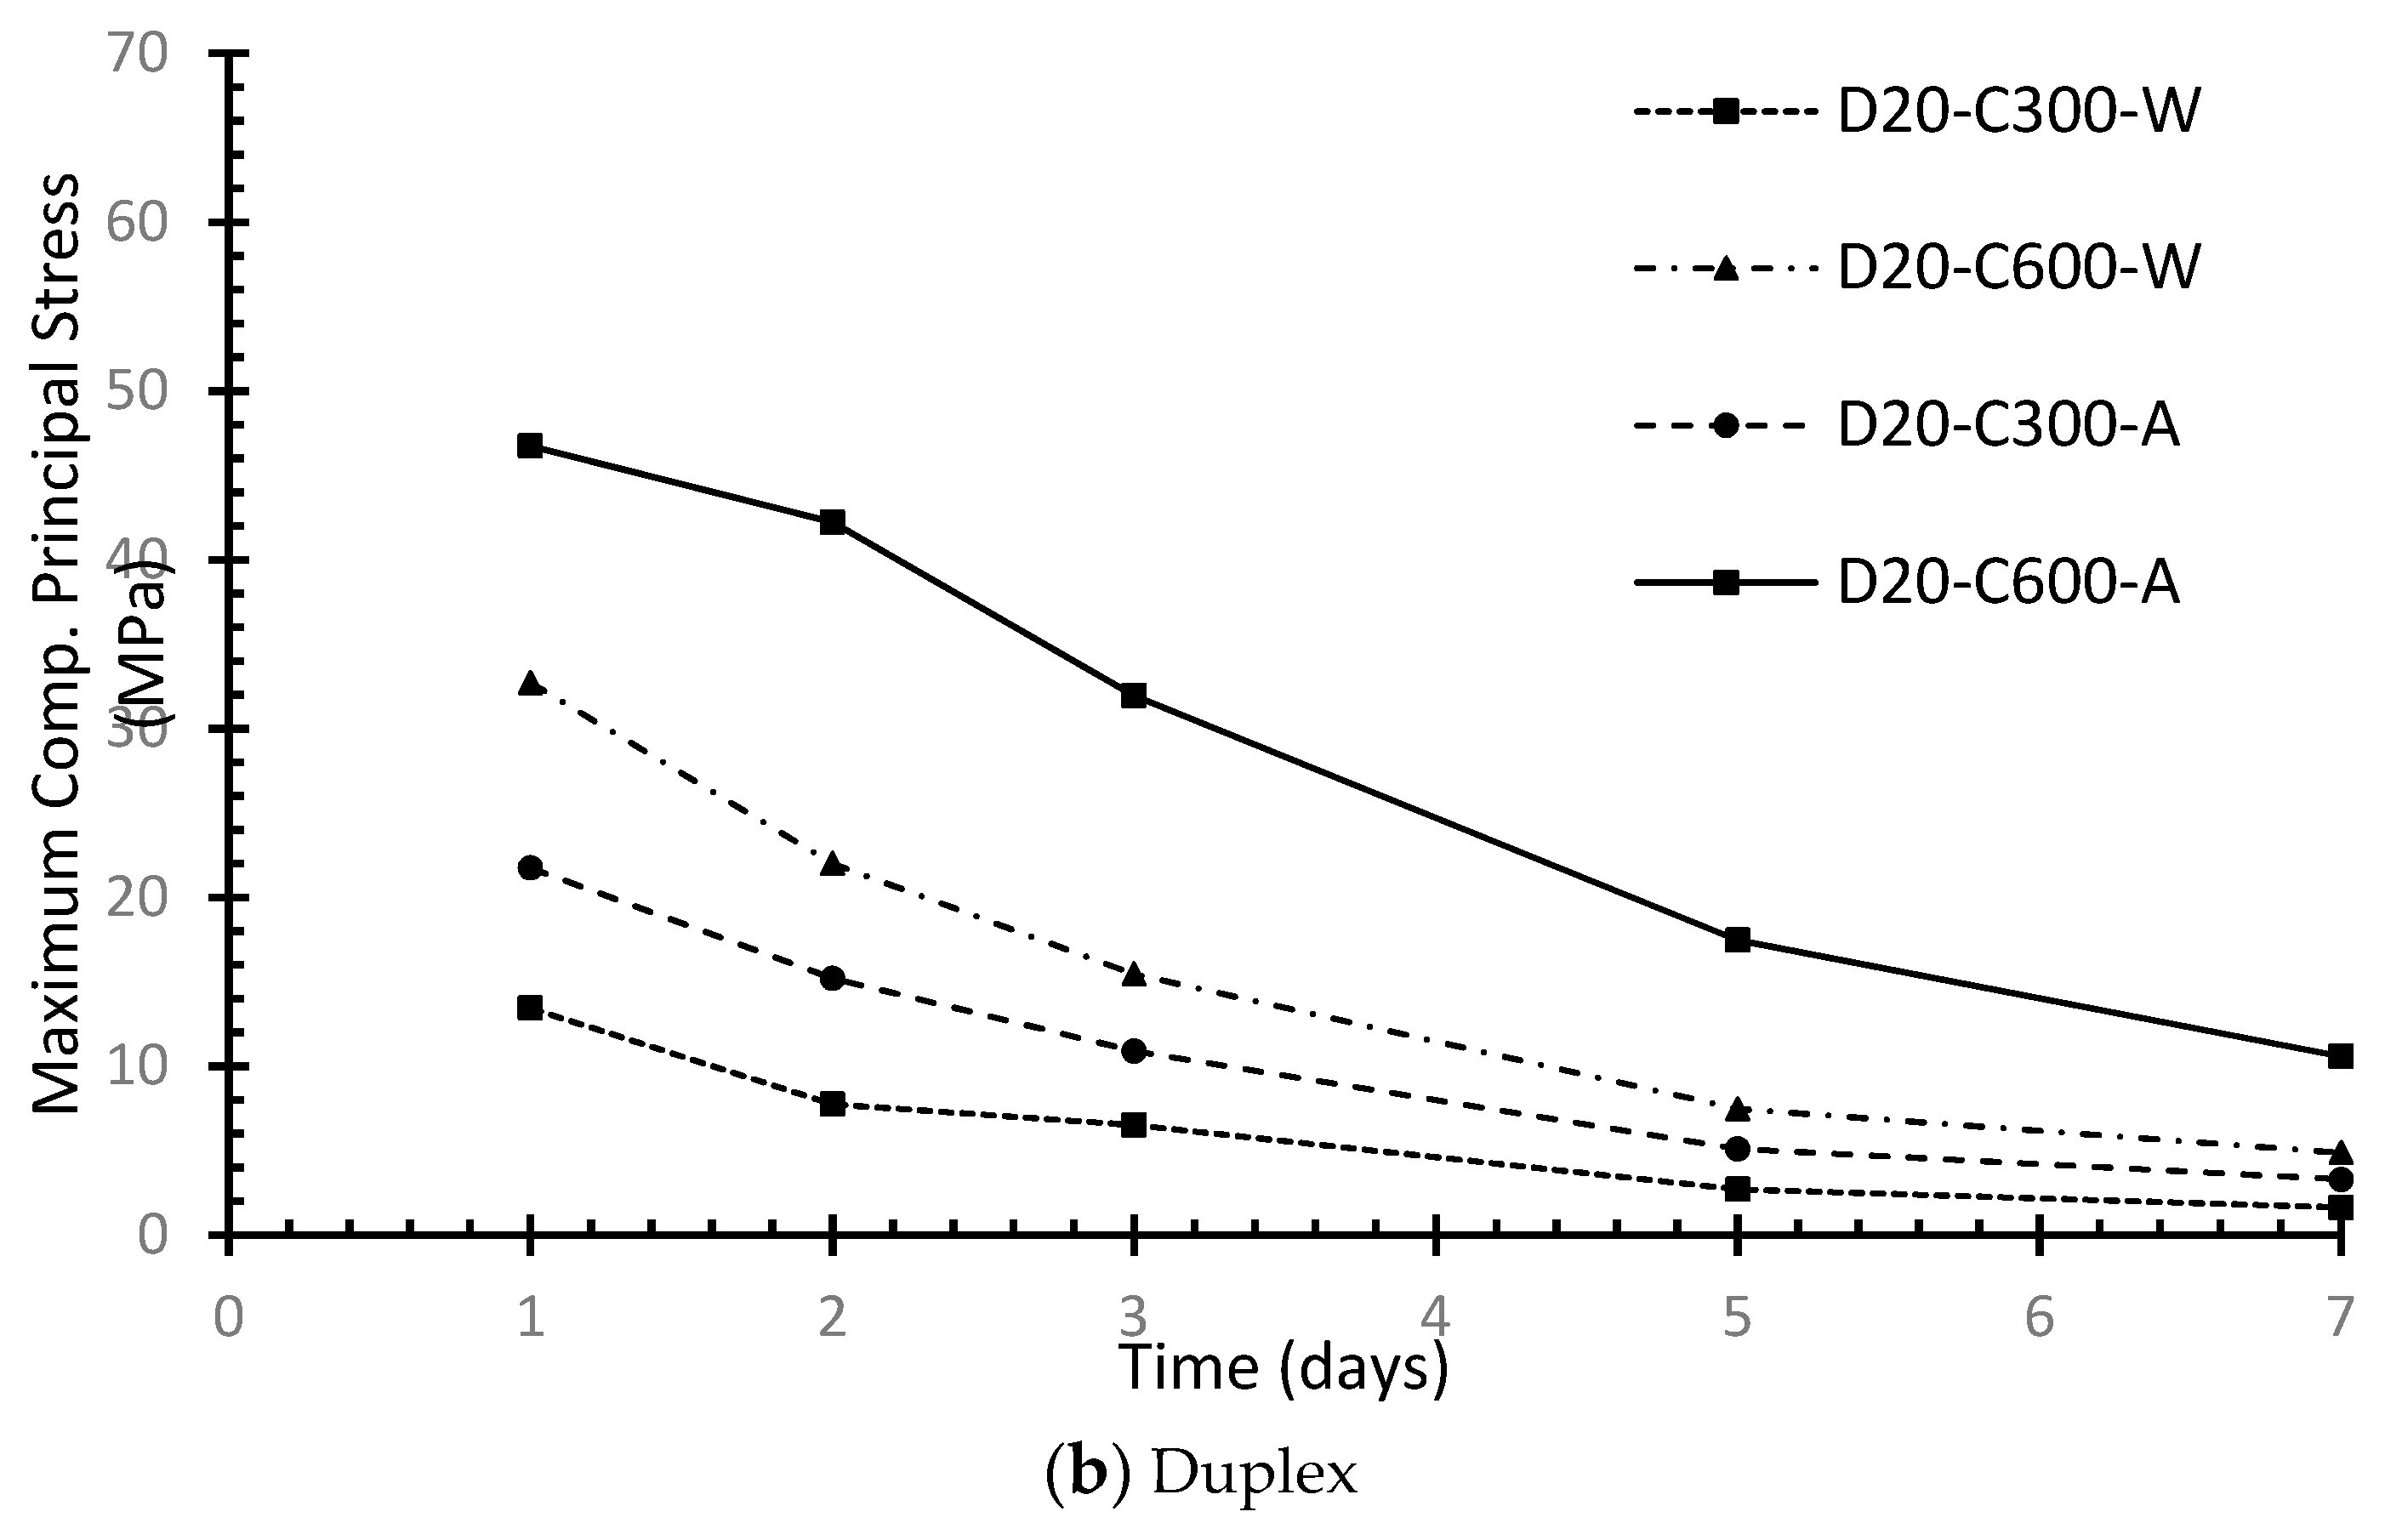
The variation of the maximum radial compressive stresses in the SS bars with concrete age is illustrated in Figure 15. In all specimens, the peak stress was reached after one day of curing, when the temperature in the vicinity of the SS bar was the highest. After that, the heat generated from the hydration reaction decreased with time, leading to a continuous reduction of the peak stress until reaching a minimum value at the end of the examined period. Varying the size of the SS bars from 20 mm to 30 mm had a negligible influence on the maximum radial compressive stress developed in the bars. Doubling the dimensions of the square cross section increased the stresses by about 50%. The curing method was found to have a significant influence on the induced stresses in the SS bar with time. For specimens with the same cross-sectional dimensions and bar size, water curing caused a reduction in the principal compression stress in the SS bar by about 65% and 40% compared to the air-cured specimens for duplex and 316 LN bars, respectively.
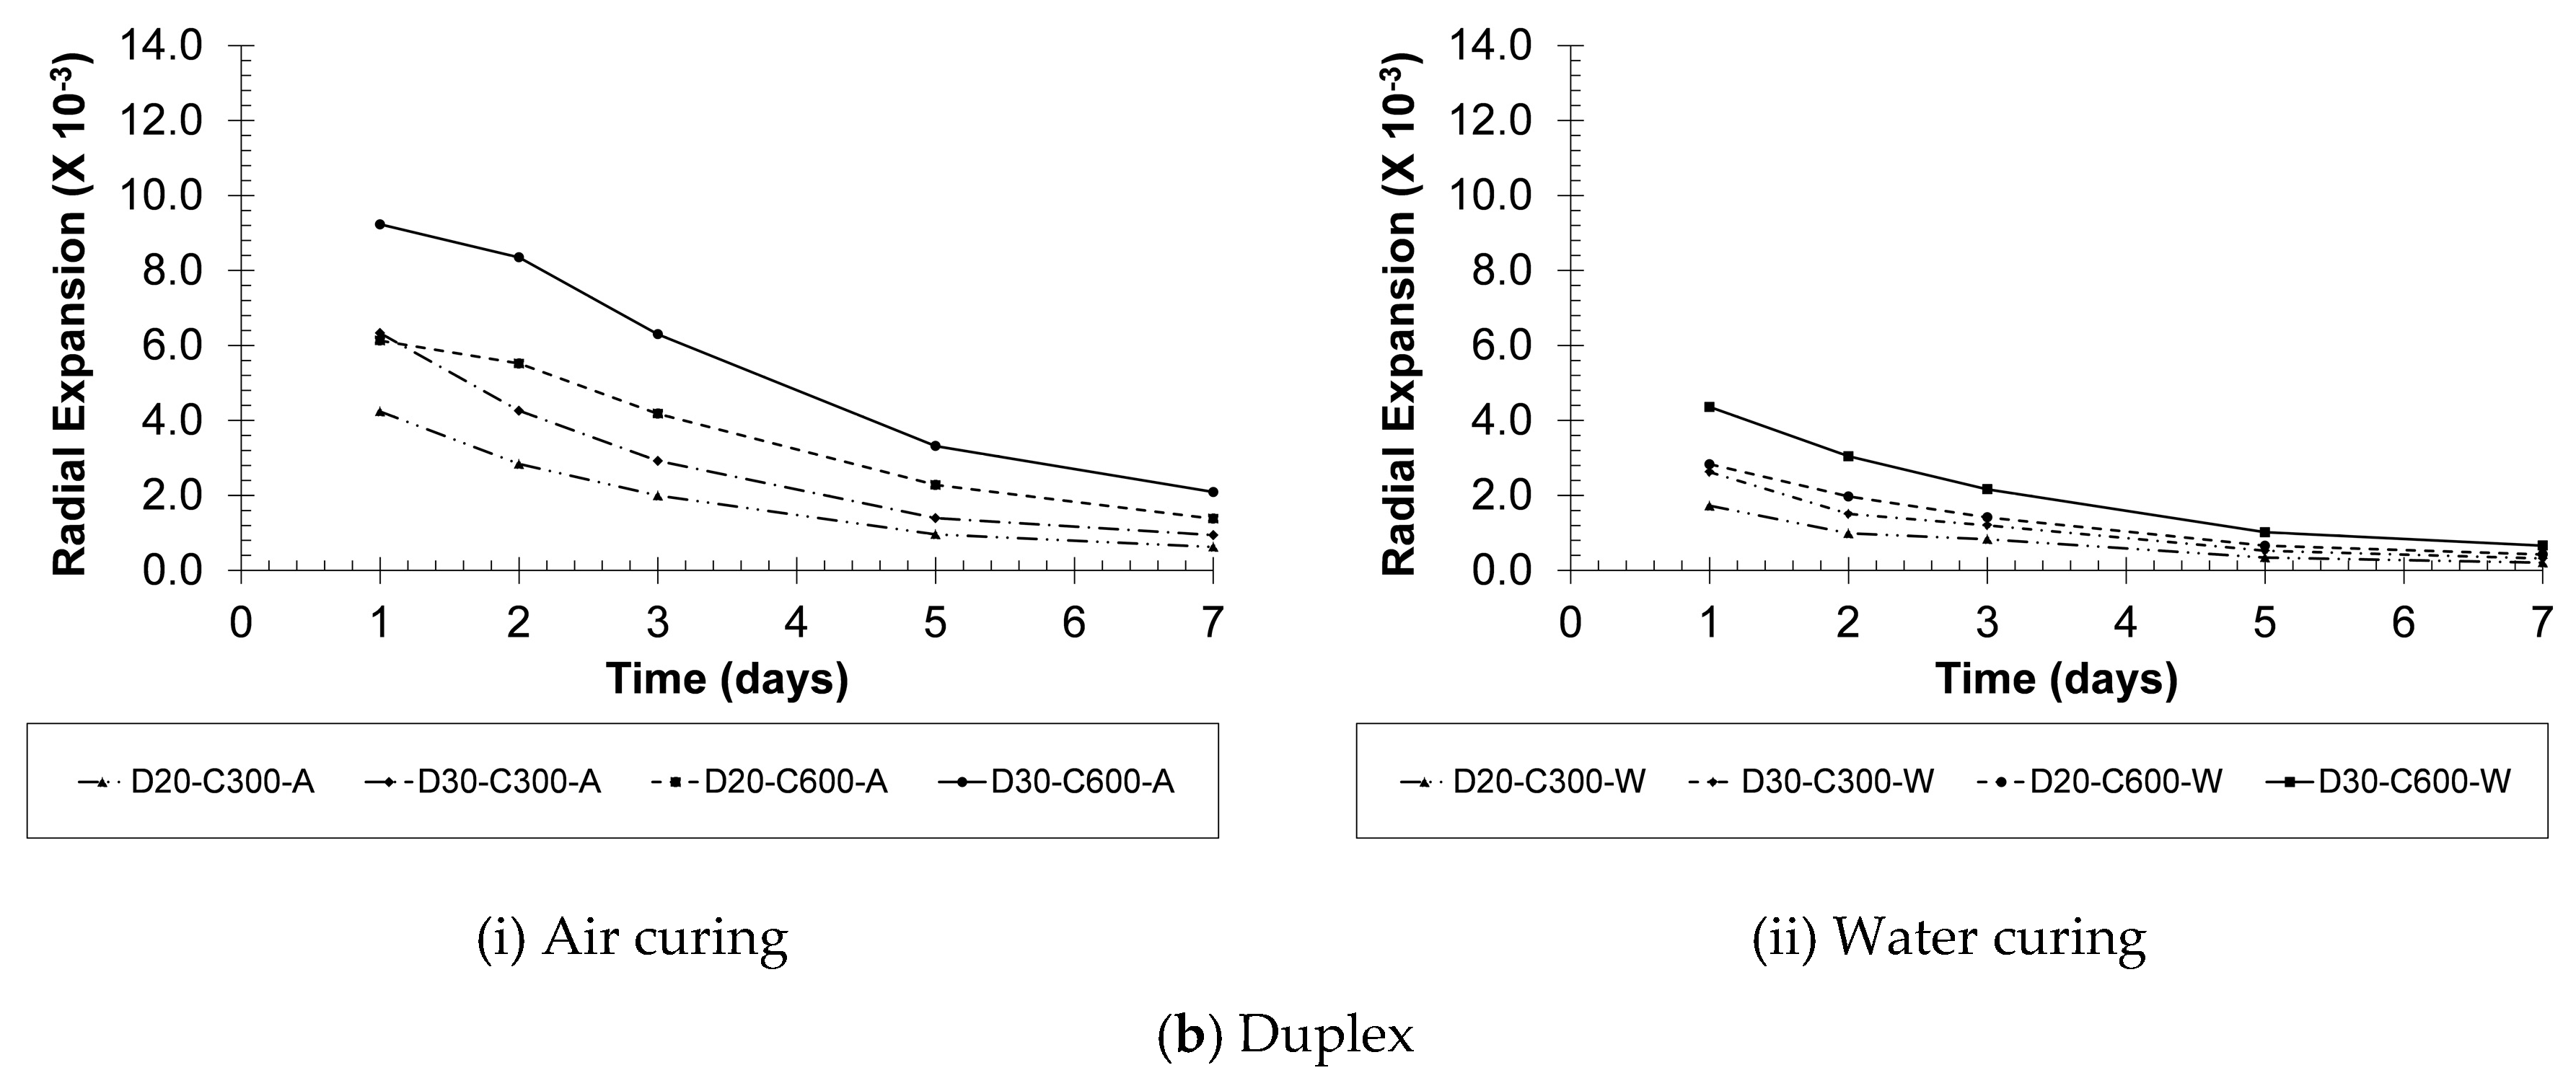
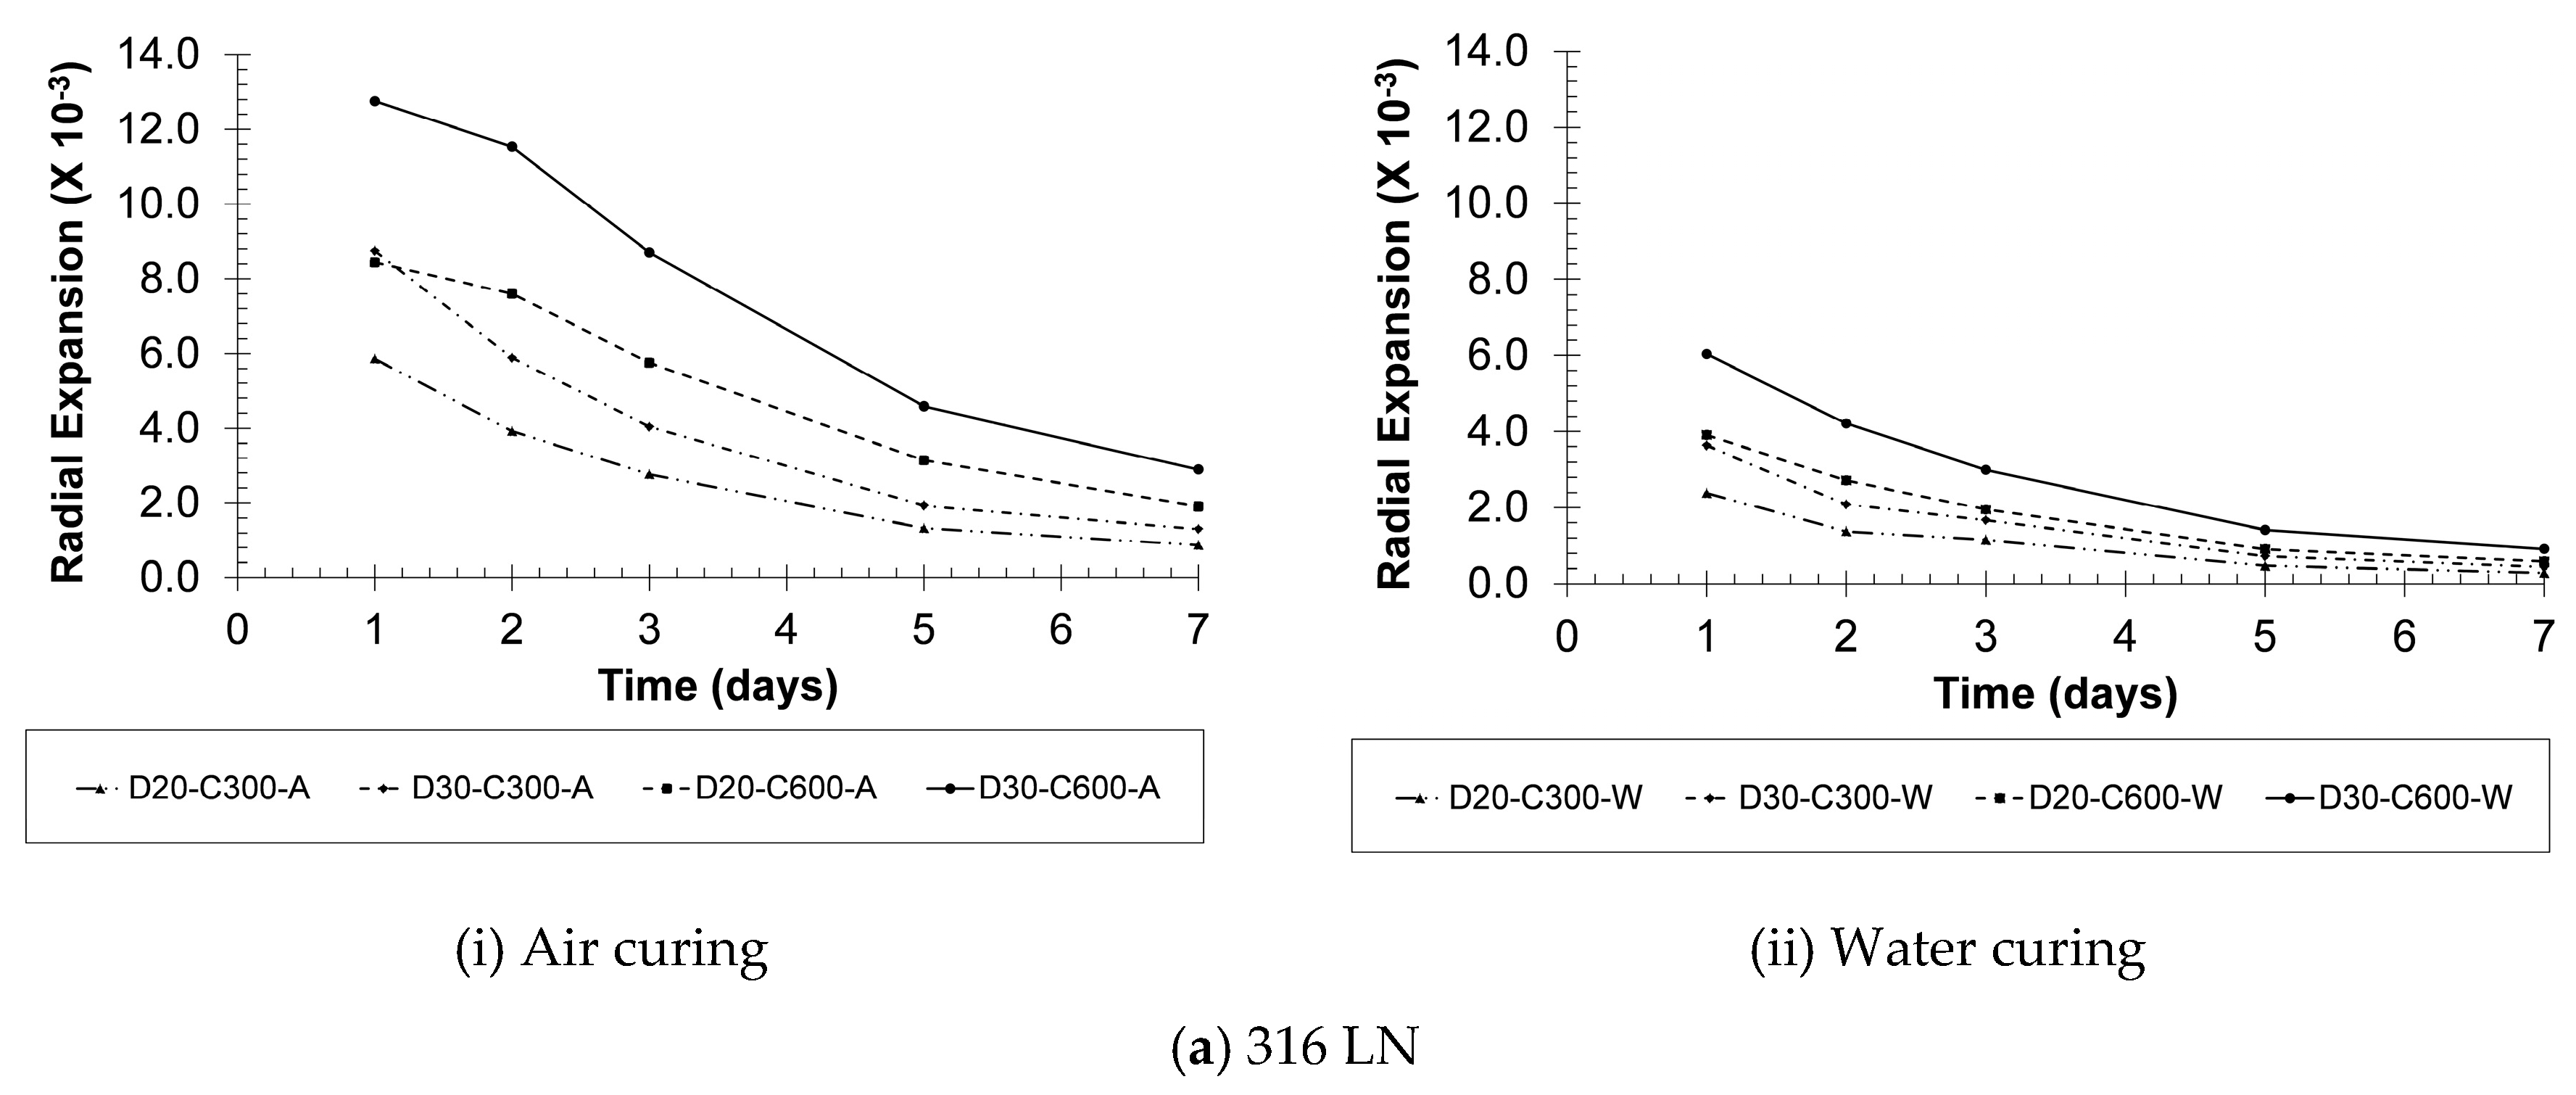
Figure 16a,b illustrate the variation of the radial thermal expansion of 316LN and duplex SS bars in early-age concrete, respectively. The peak expansion was detected after one day due to the high activity of the hydration reaction and the excessive generation of heat energy. After that, a gradual decrease was noticed due to the reduction in the hydration rate. Increasing the diameter of the SS bars from 20 mm to 30 mm increased the radial expansion by about 35% and 65% in water-cured and air-cured specimens, respectively. Increasing the cross section from 300 mm by 300 mm to 600 mm by 600 mm raised the expansion by just under 50%. This was attributed to the higher temperature reached in the larger sections at the same concrete age. Changing the SS reinforcement from duplex to 316 LN increased the expansion by 40% due to the difference in thermal coefficient between the two SS types.
6. Summary and Conclusions
A thermal-structural finite element model was developed to analyze the behavior of stainless-steel reinforced concrete sections during the hydration process. First, a transient thermal analysis determined the temperature distribution within concrete. Then, a structural analysis determined the stress distribution inside concrete and stainless-steel radial expansion.
The variation in thermal expansion between concrete and SS resulted in the development of thermal stresses near the bars. These stresses do not develop in the case of carbon steel RC sections. Using duplex SS bars minimized these stresses and the radial expansion of SS. The maximum temperature inside concrete was affected by the size of the specimen. The radial thermal expansion of SS was affected by the temperature generated from the hydration reaction in the surrounding concrete and by the diameter of the SS bar. This expansion was restrained by the concrete matrix and generated thermal stresses in the vicinity of the steel bars. During the first two days, the concrete strength was relatively small, whereas the generated stresses were at their peak. Therefore, minimizing the temperature is important to control the radial expansion of SS bars, especially within the first two days of casting the concrete. Continuous water curing of concrete reduced the principal stresses. For the analyzed cases, the developed tensile stresses were not expected to cause concrete cracking.
Author Contributions
Conceptualization, M.A.Y.; Formal analysis, M.K.; Funding acquisition, M.A.Y.; Investigation, M.K.; Project administration, M.A.Y.; Supervision, M.A.Y. and M.M.A.A.; Validation, M.K.; Writing—original draft, M.K.; Writing—review and editing, M.M.A.A. All authors have read and agreed to the published version of the manuscript.
Funding
This research was funded by the Ontario Ministry of Transportation (MTO).
Conflicts of Interest
The authors declare no conflicts of interest.
References
- Meng, X.H.; Zhang, S.Y. Application and Development of Stainless Steel Reinforced Concrete Structure. In Proceedings of the MATEC Web of Conferences, 2016 International Conference on Mechatronics, Manufacturing and Materials Engineering (MMME 2016), Hong Kong, China, 11–12 June 2016; Volume 63. [Google Scholar]
- Canadian Institute of Steel Construction. Handbook of Steel Construction, 11th ed.; CSA Group: Markham, ON, Canada, 2016; pp. 7–47. [Google Scholar]
- CSA A23.3:2014. Design of Concrete Structures; Cement Association of Canada: Ottawa, ON, Canada, 2014; p. 297.
- Verbeck, G.J. Field and Laboratory Studies of the Sulfate Resistance of Concrete; Swenson, E.G., Ed.; Performance of Concrete, A Symposium in Honor of Thorbergur Thorvaldson; University of Toronto Press: Toronto, ON, Canada, 1968. [Google Scholar]
- Kosmatka, S.H.; Kerkhoff, B.; Panarese, W.C. Design and Control of Concrete Mixtures, 14th ed.; Portland Cement Association: Skokie, IL, USA, 2002; pp. 47–49. [Google Scholar]
- Zhi, G. Predicting Temperature and Strength Development of the Field Concrete. Ph.D. Dissertation, Iowa State University, Ames, IA, USA, 2005. [Google Scholar]
- Byfors, J. Plain Concrete at Early Ages; Swedish Cement and Concrete Research Institute: Stockholm, Sweden, 1980; p. 464. [Google Scholar]
- Mindess, S.; Young, J.F.; Darwin, D. Concrete, 2nd ed.; Pearson Education, Inc.: Upper Saddle River, NJ, USA, 2002; p. V644. [Google Scholar]
- Nürnberger, U. Stainless steel reinforcement—A survey. Otto Graf J. 2005, 16, 111–138. [Google Scholar]
- Jin, X.; Shen, Y.; Li, Z. Behaviour of High- and Normal-Strength Concrete at Early Ages. Mag. Concr. Res. 2005, 57, 339–345. [Google Scholar] [CrossRef]
- Kim, T. Concrete Maturity Method Using Variable Temperature Curing for Normal-Strength Concrete Mixes. J. Mater. Civ. Eng. 2008, 20, 735–741. [Google Scholar] [CrossRef]
- ANSYS Inc. ANSYS User’s Manual Release 12.0.1; ANSYS Inc.: Canonsburg, PA, USA, 2009. [Google Scholar]
- ACI Committee 207. Mass Concrete. In ACI Manual of Concrete Practice; American Concrete Institute: Farmington Hills, MI, USA, 1996; pp. 18–24. [Google Scholar]
- European Commission, Background Documents to EN 1992-1-2 Eurocode 2: Design of Concrete Structures Part 1–2: General Rules-Structural Fire Design; CEN: Brussels, Belgium, 2003.
- Chen, J.B.; Young, B. Stress–strain curves for stainless steel at elevated temperatures. Eng. Struct. 2006, 28, 229–239. [Google Scholar] [CrossRef]
- Soudki, K.A.; West, J.S.; Campbell, T.I. Effect of Temperature on Structural Performance of Stainless-Steel Reinforcement; MTO: Waterloo, ON, Canada, 2004; p. 82.
- RILEM Committee 42. Properties of Set Concrete at Early Ages-State of-the-Art Report; RILEM, CEA: Paris, France, 1981; Volume 14. [Google Scholar]
- Korea Concrete Institute. Standard Specification for Concrete; Korea Concrete Institute: Seoul, Korea, 2003. [Google Scholar]
- Verbeck, G.J.; Foster, C.W. Long-Time Study of Cement Performance in Concrete: Chapter 6-The Heats of Hydration of the Cements. Proc. Am. Soc. Test. Mater. 1950, 50, 1235–1262. [Google Scholar]
- ACI Committee 207. Effect of Restraint, Volume Change, and Reinforcement on Cracking of Mass Concrete. ACI Mater. J. 2002, 87, 271–295. [Google Scholar]
- Du, Y.; Chan, A.; Clark, L. Finite Element Analysis of the Effects of Radial Expansion of Corroded Reinforcement. Comput. Struct. 2006, 84, 917–929. [Google Scholar] [CrossRef]
- Clark, L.A.; Saifullah, M. Effect of Corrosion on Reinforcement Bond Strength. In Proceedings of the 5th International Conference on Structural Faults and Repairs; Forde, M., Ed.; Engineering Technical Press: Edinburgh, UK, 1993; pp. 113–119. [Google Scholar]
Figure 1.
Evolution of heat of hydration as a function of time.
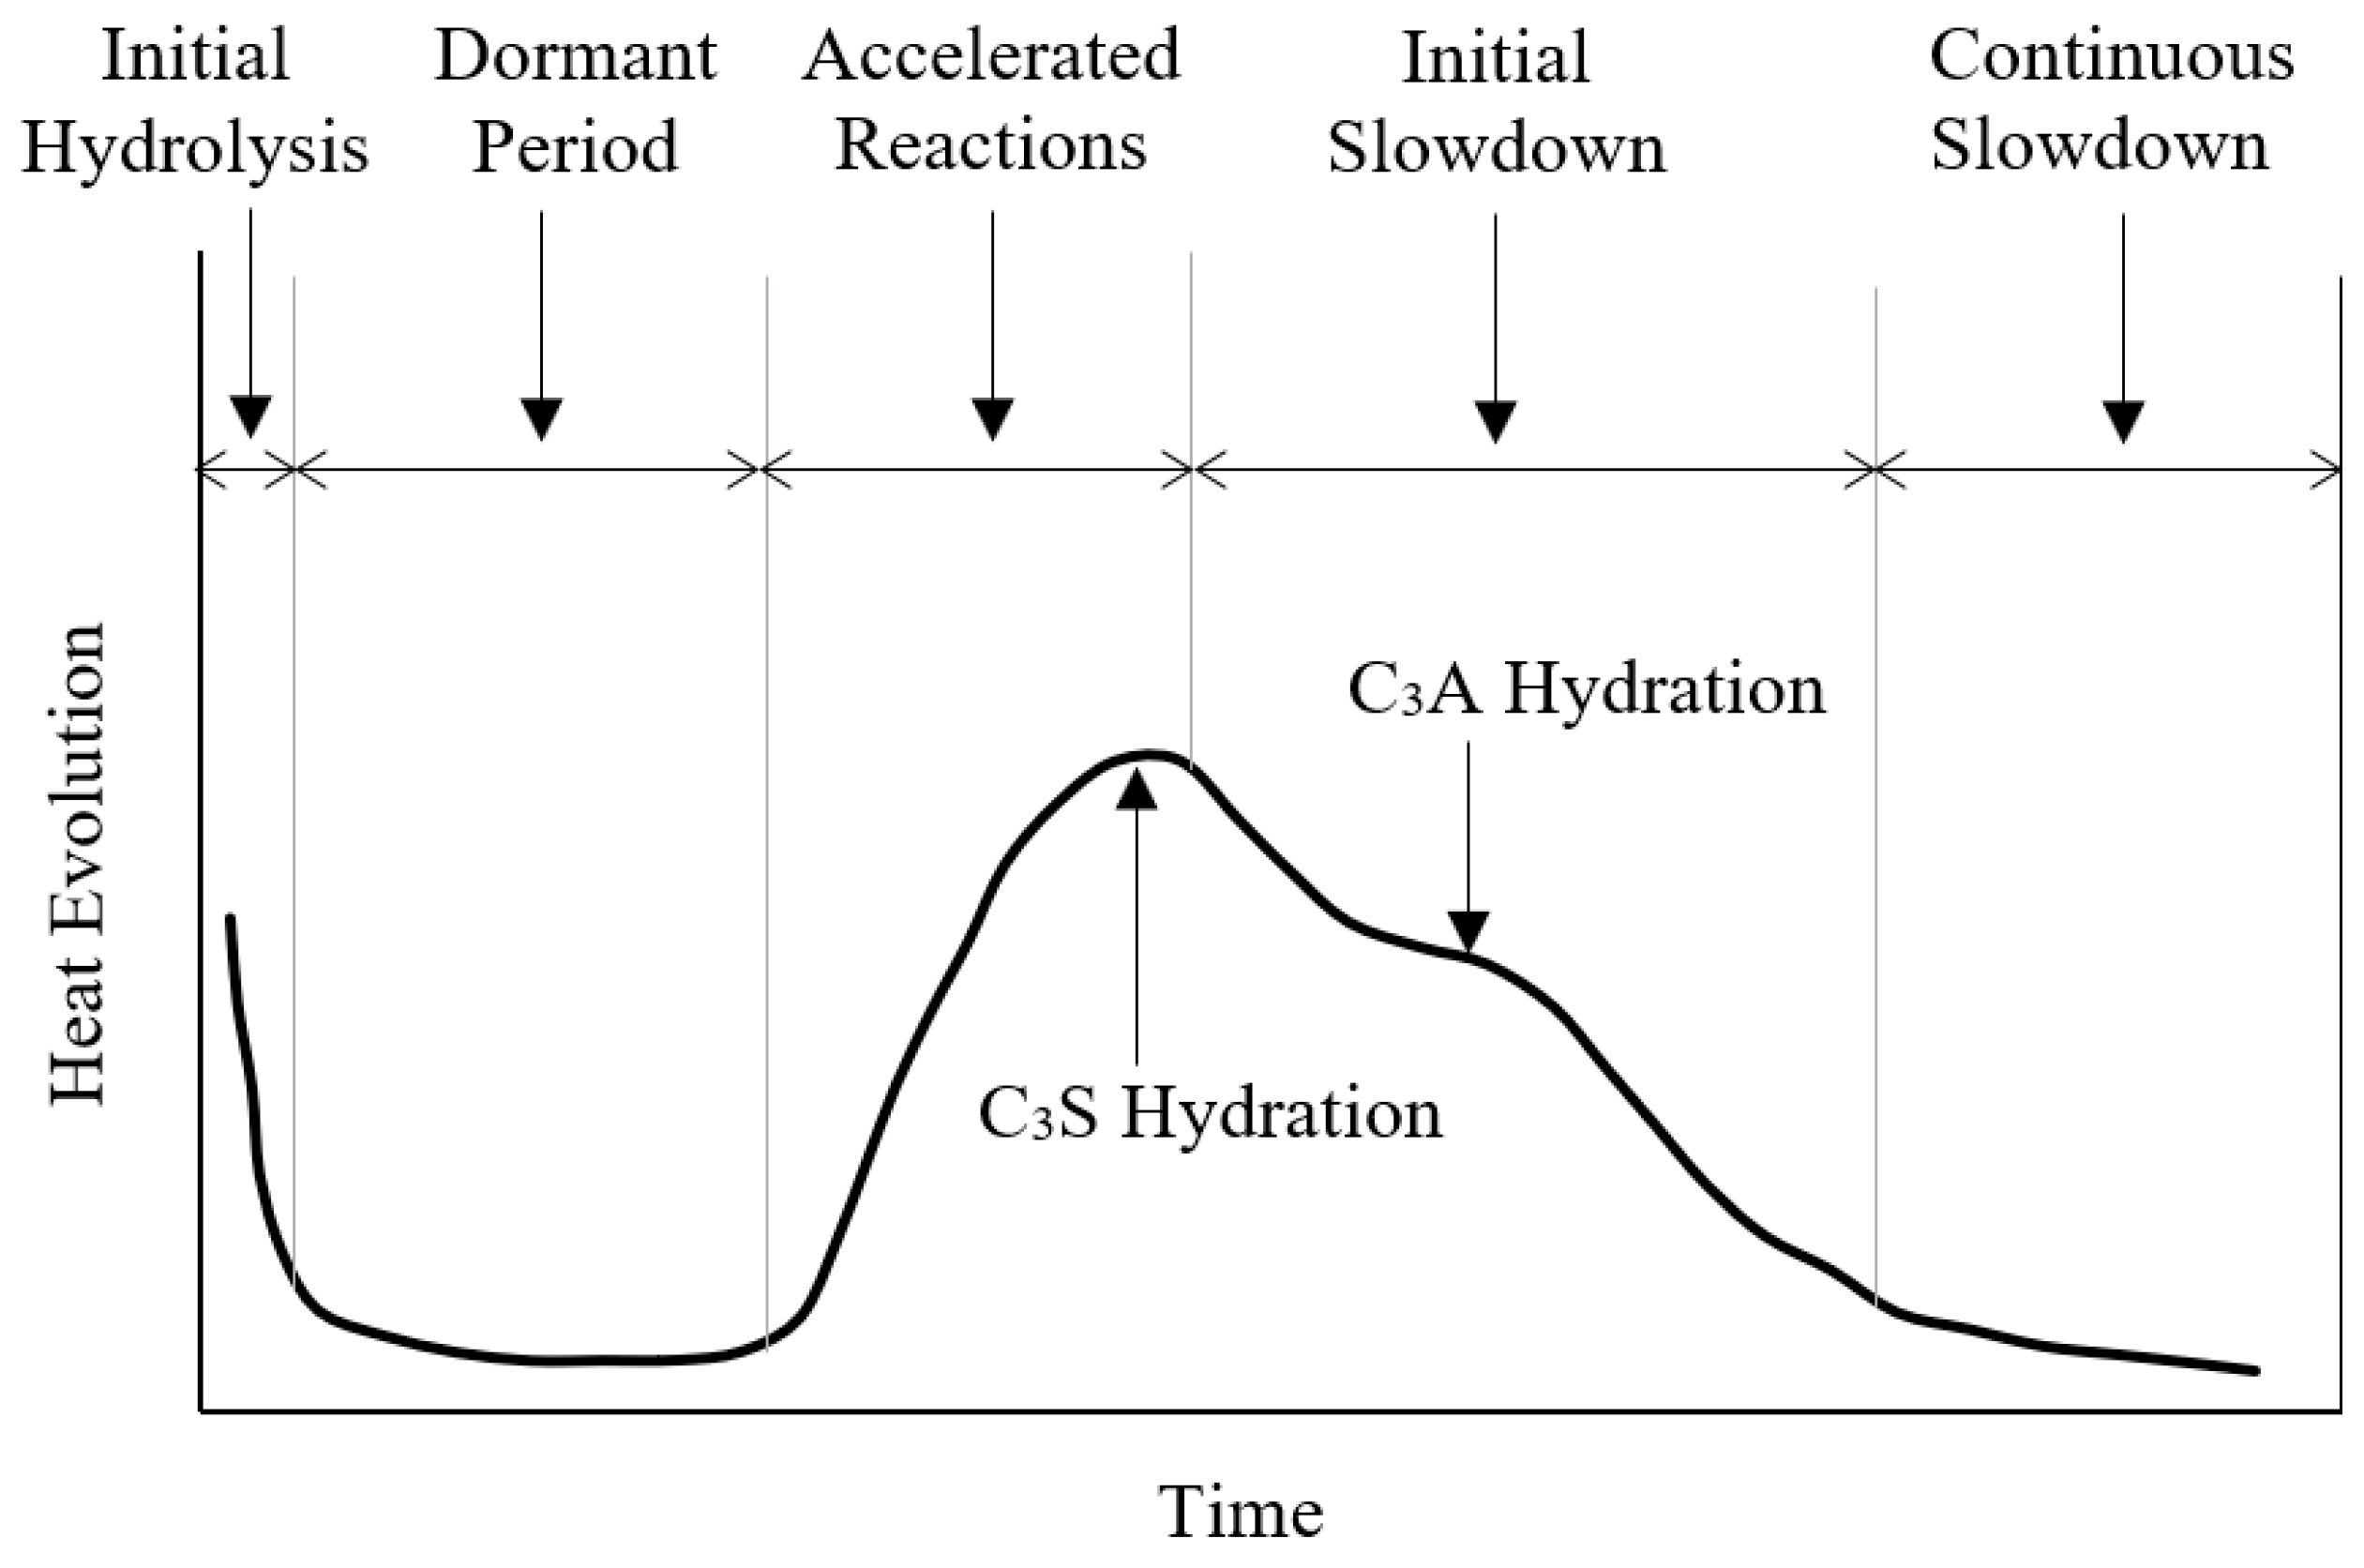
Figure 2.
Variation of concrete strength with time.

Figure 3.
Stress-strain curves of concrete at early age.

Figure 4.
Thermal conductivity for concrete at different temperatures.
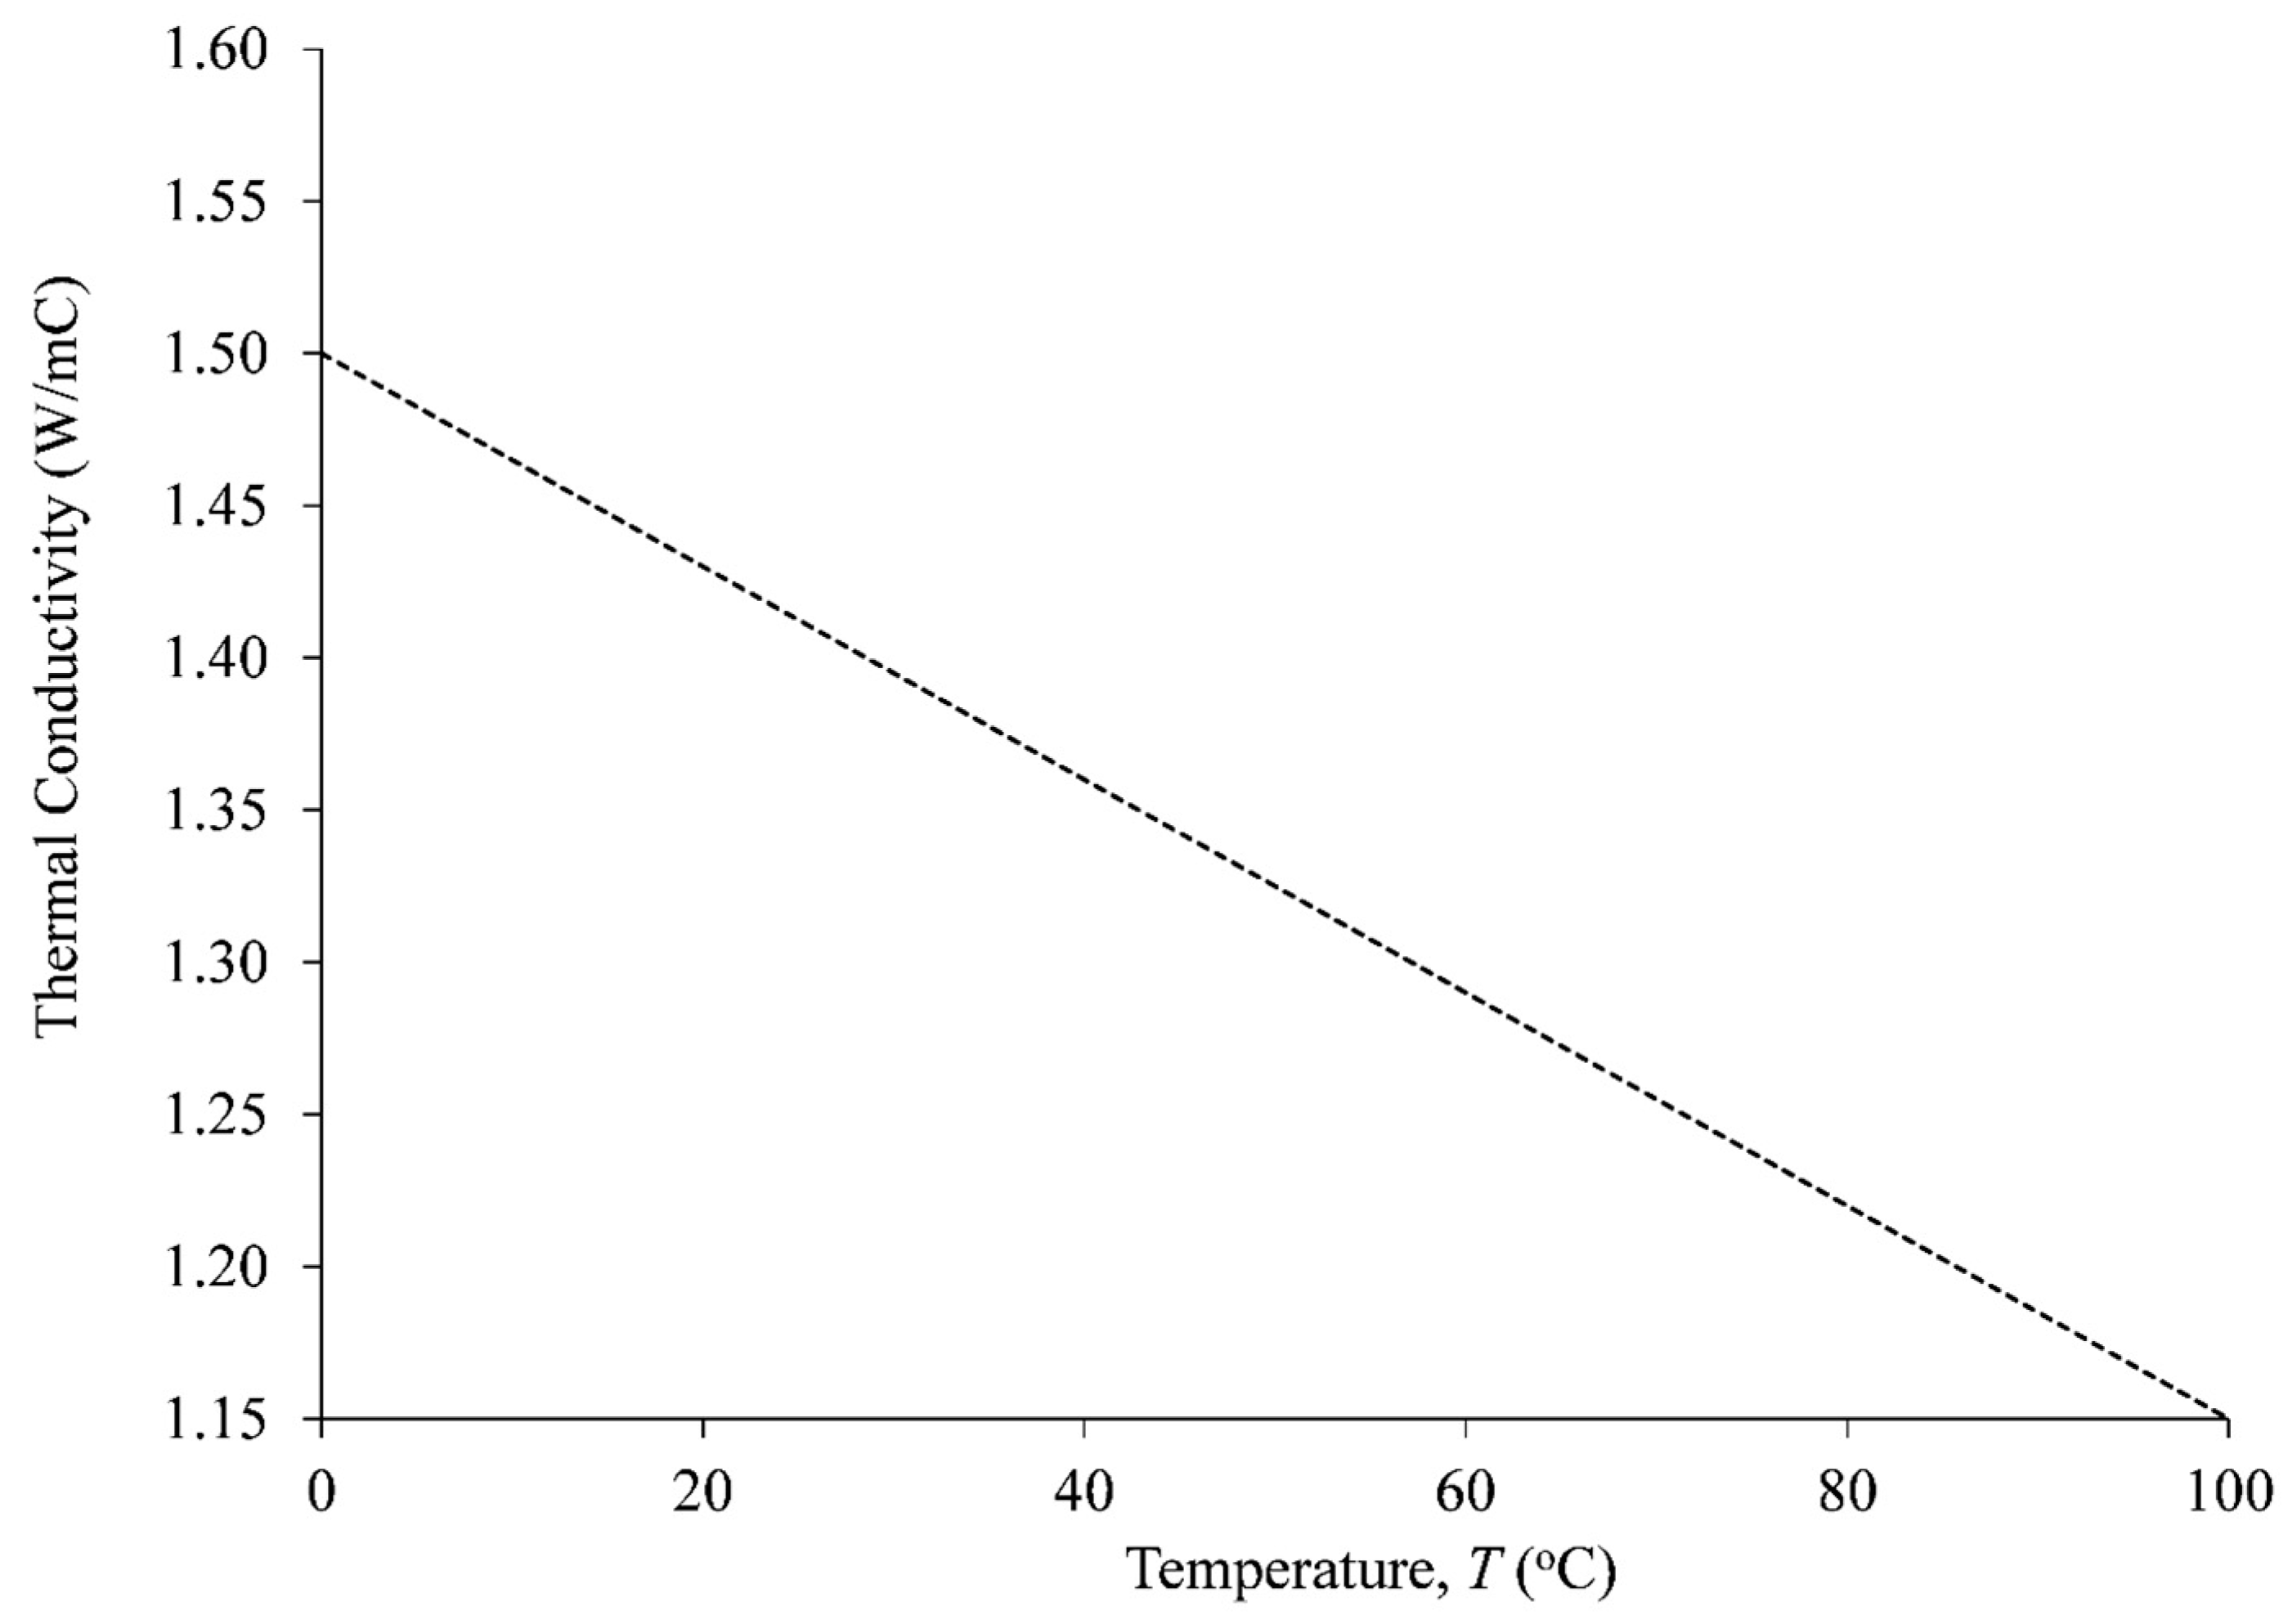
Figure 5.
Typical stainless-steel (SS)-reinforced concrete (RC) section.

Figure 6.
Thermal analysis mesh.
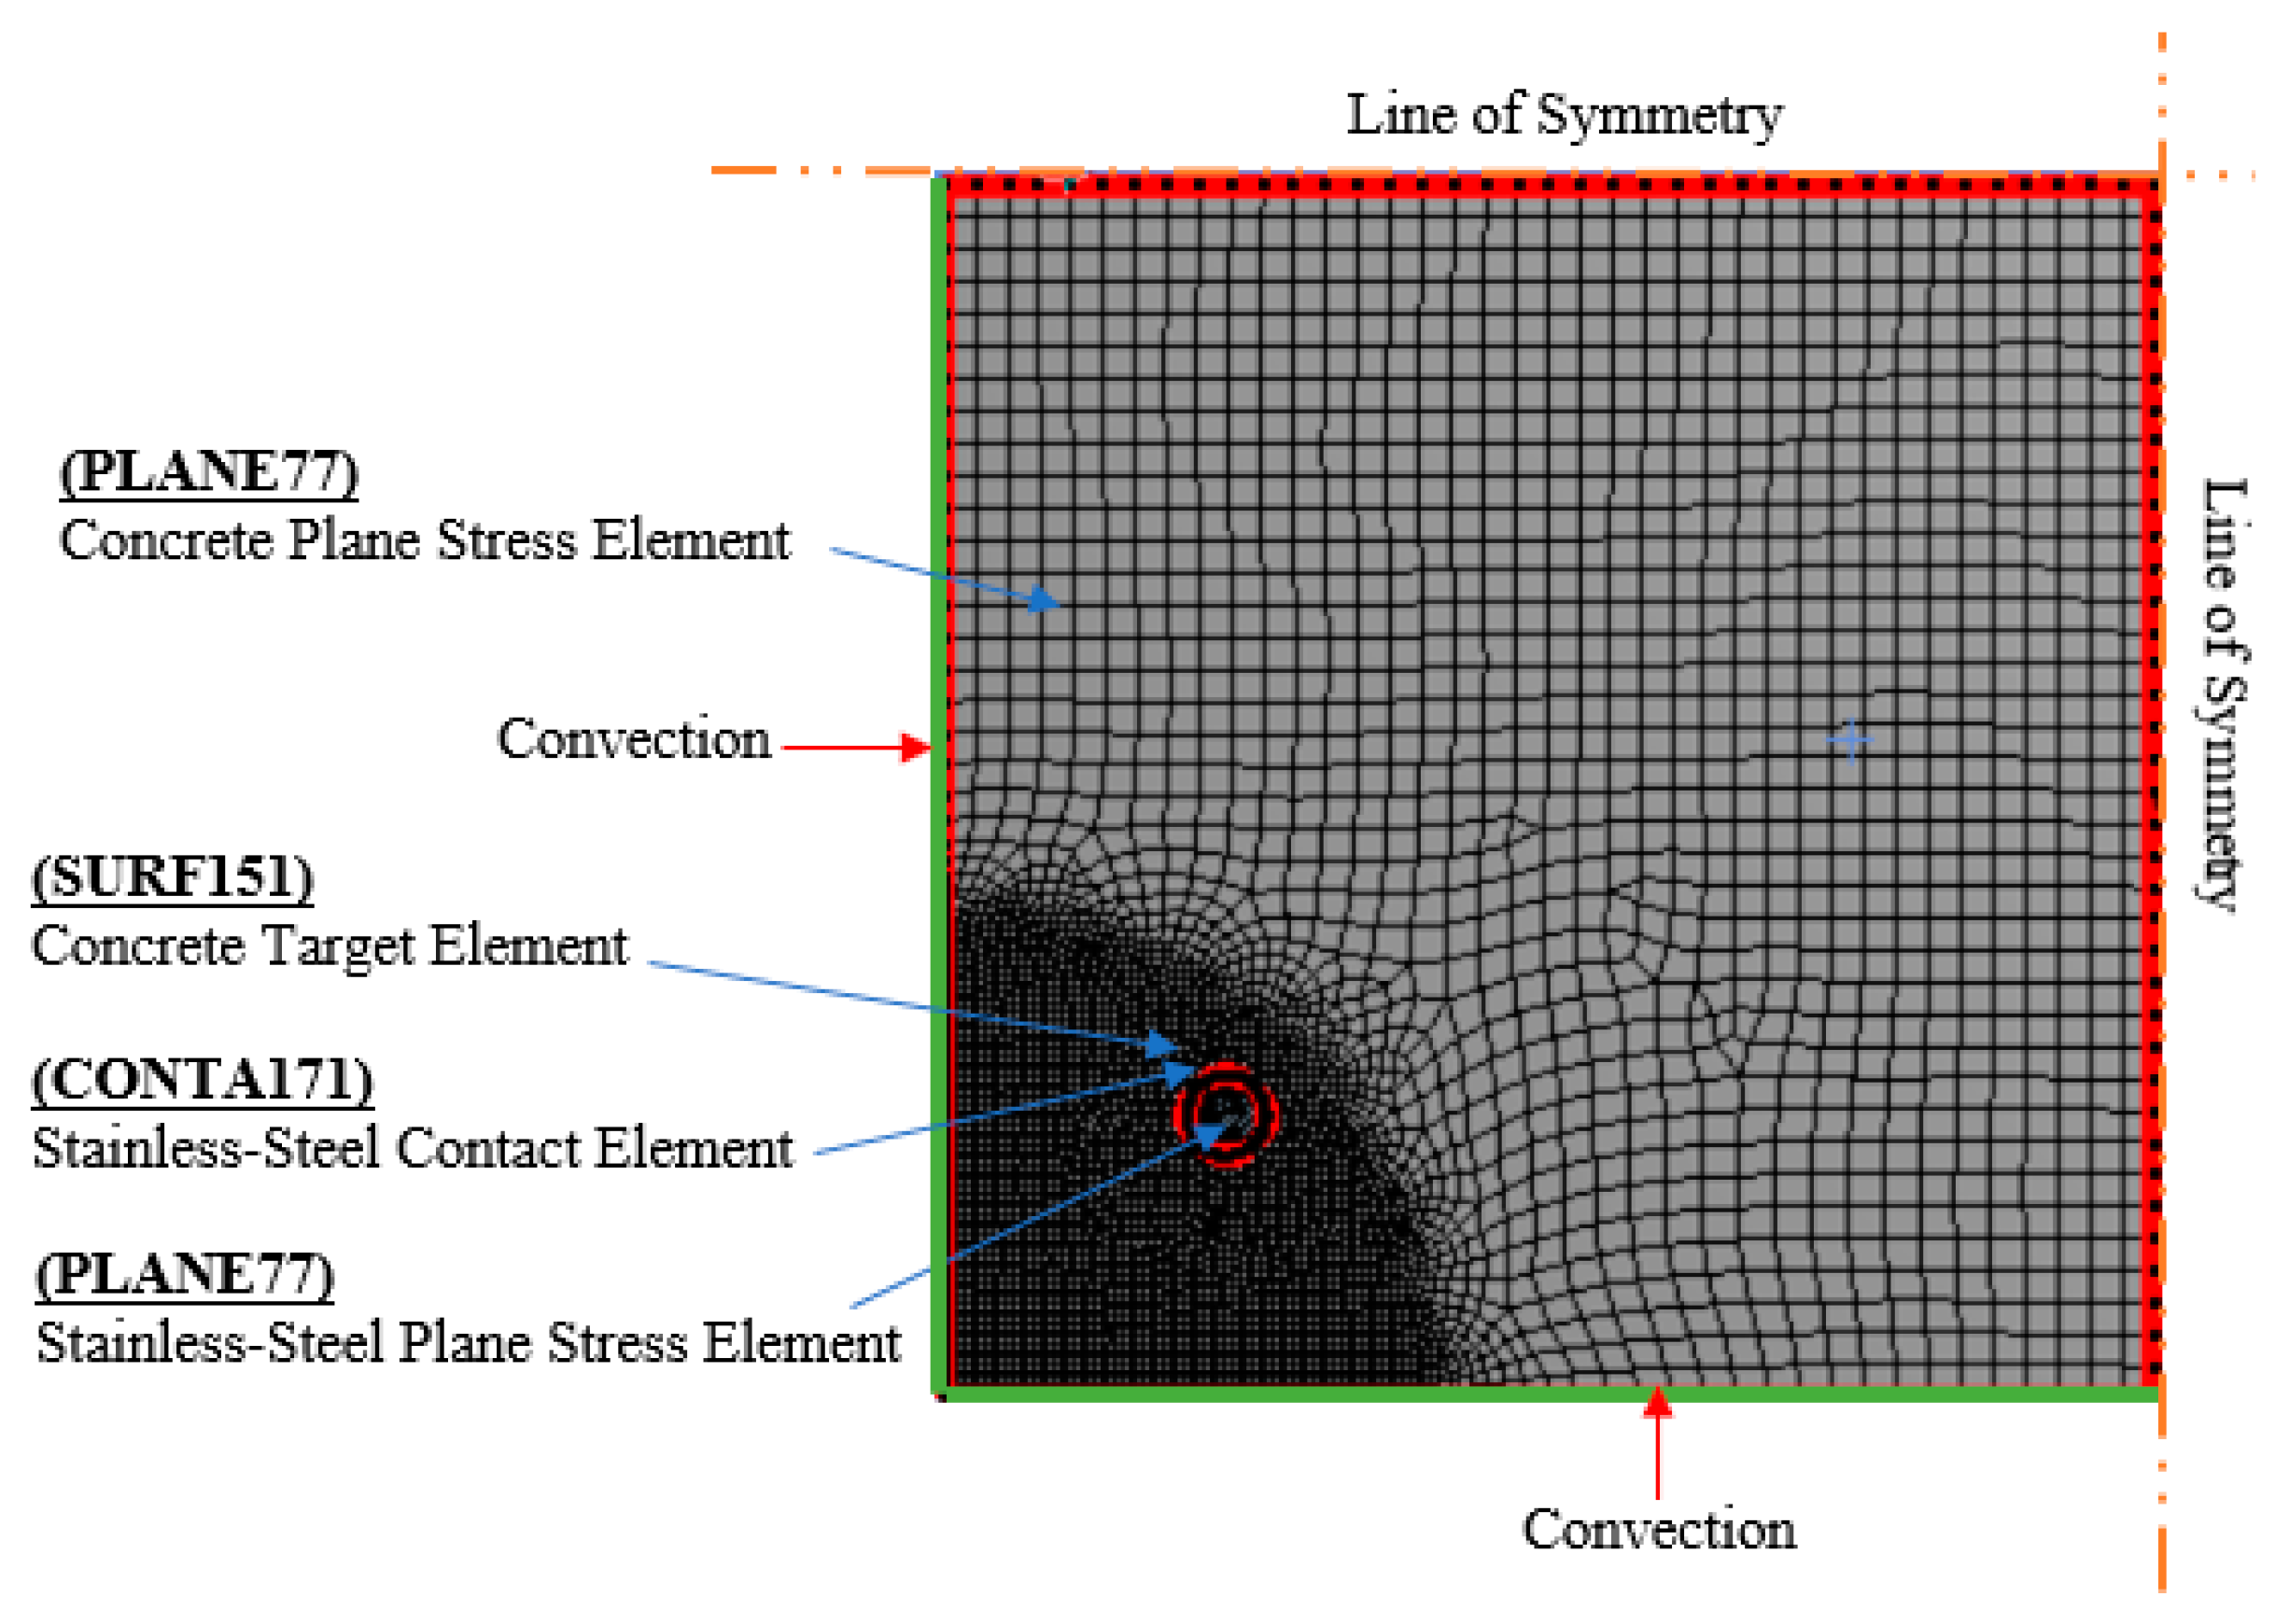
Figure 7.
Heat of hydration at different ages.

Figure 8.
Structural finite element model.

Figure 9.
Radial expansion at cracking.

Figure 10.
Stages of concrete cracking due to the radial expansion of steel bars.

Figure 11.
Variation of maximum hydration temperature with time.

Figure 12.
Temperature variation after 1 day for D20-C600.

Figure 13.
Maximum tensile principal stresses at various ages.

Figure 14.
Tensile stress contours after 1 day for D20-C300.
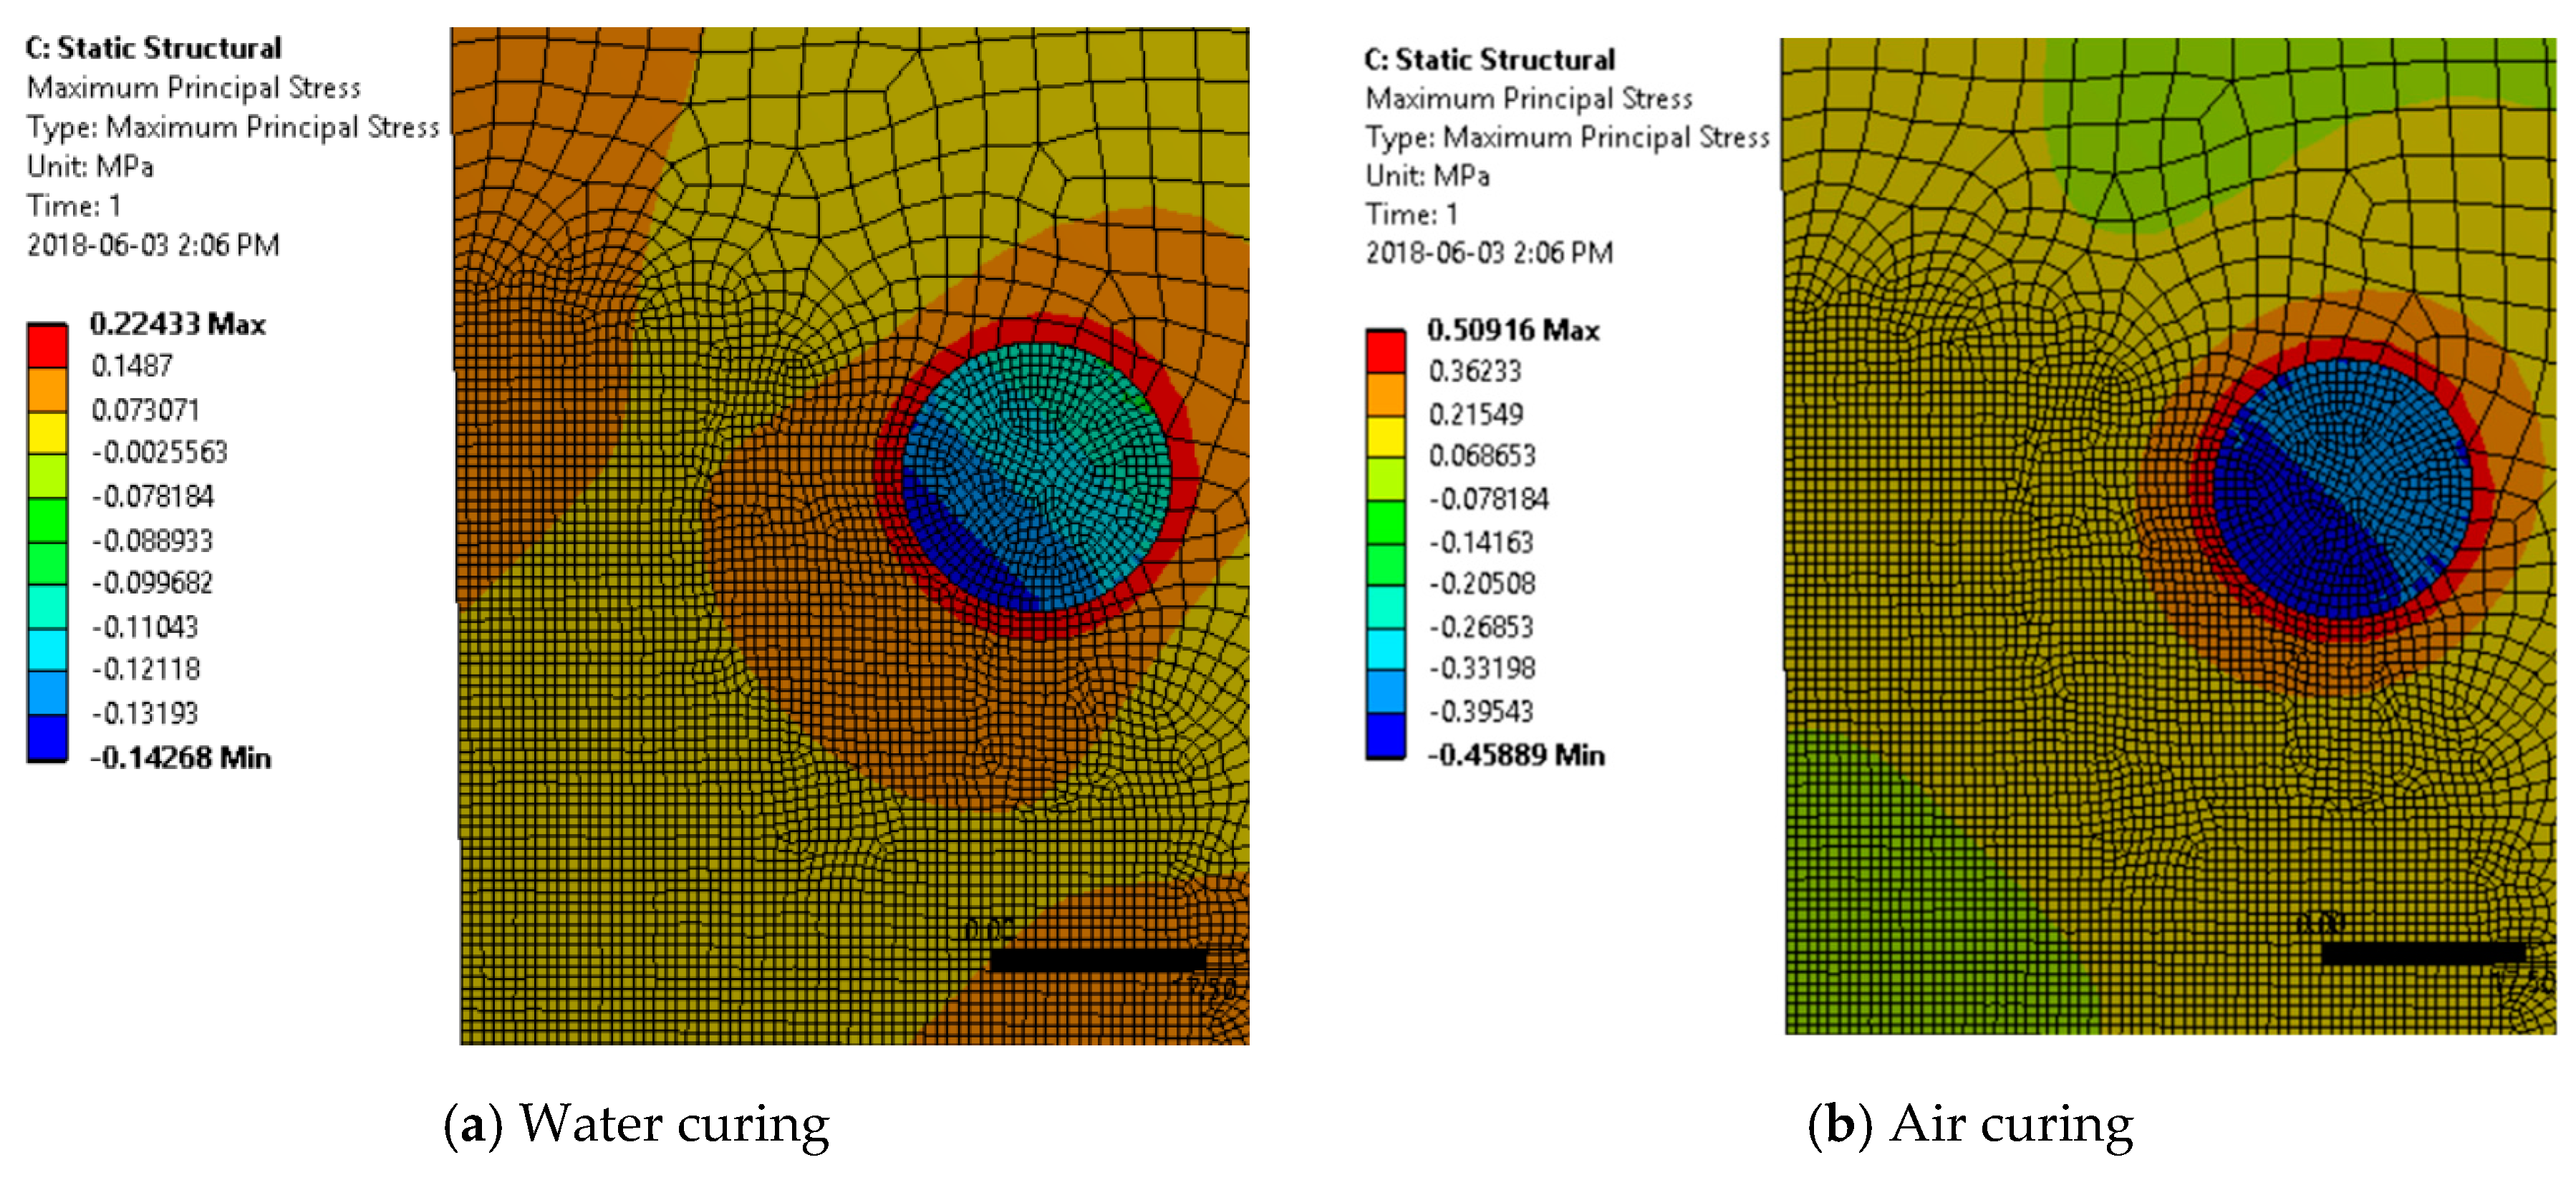
Figure 15.
Maximum compressive principal stresses at various ages.
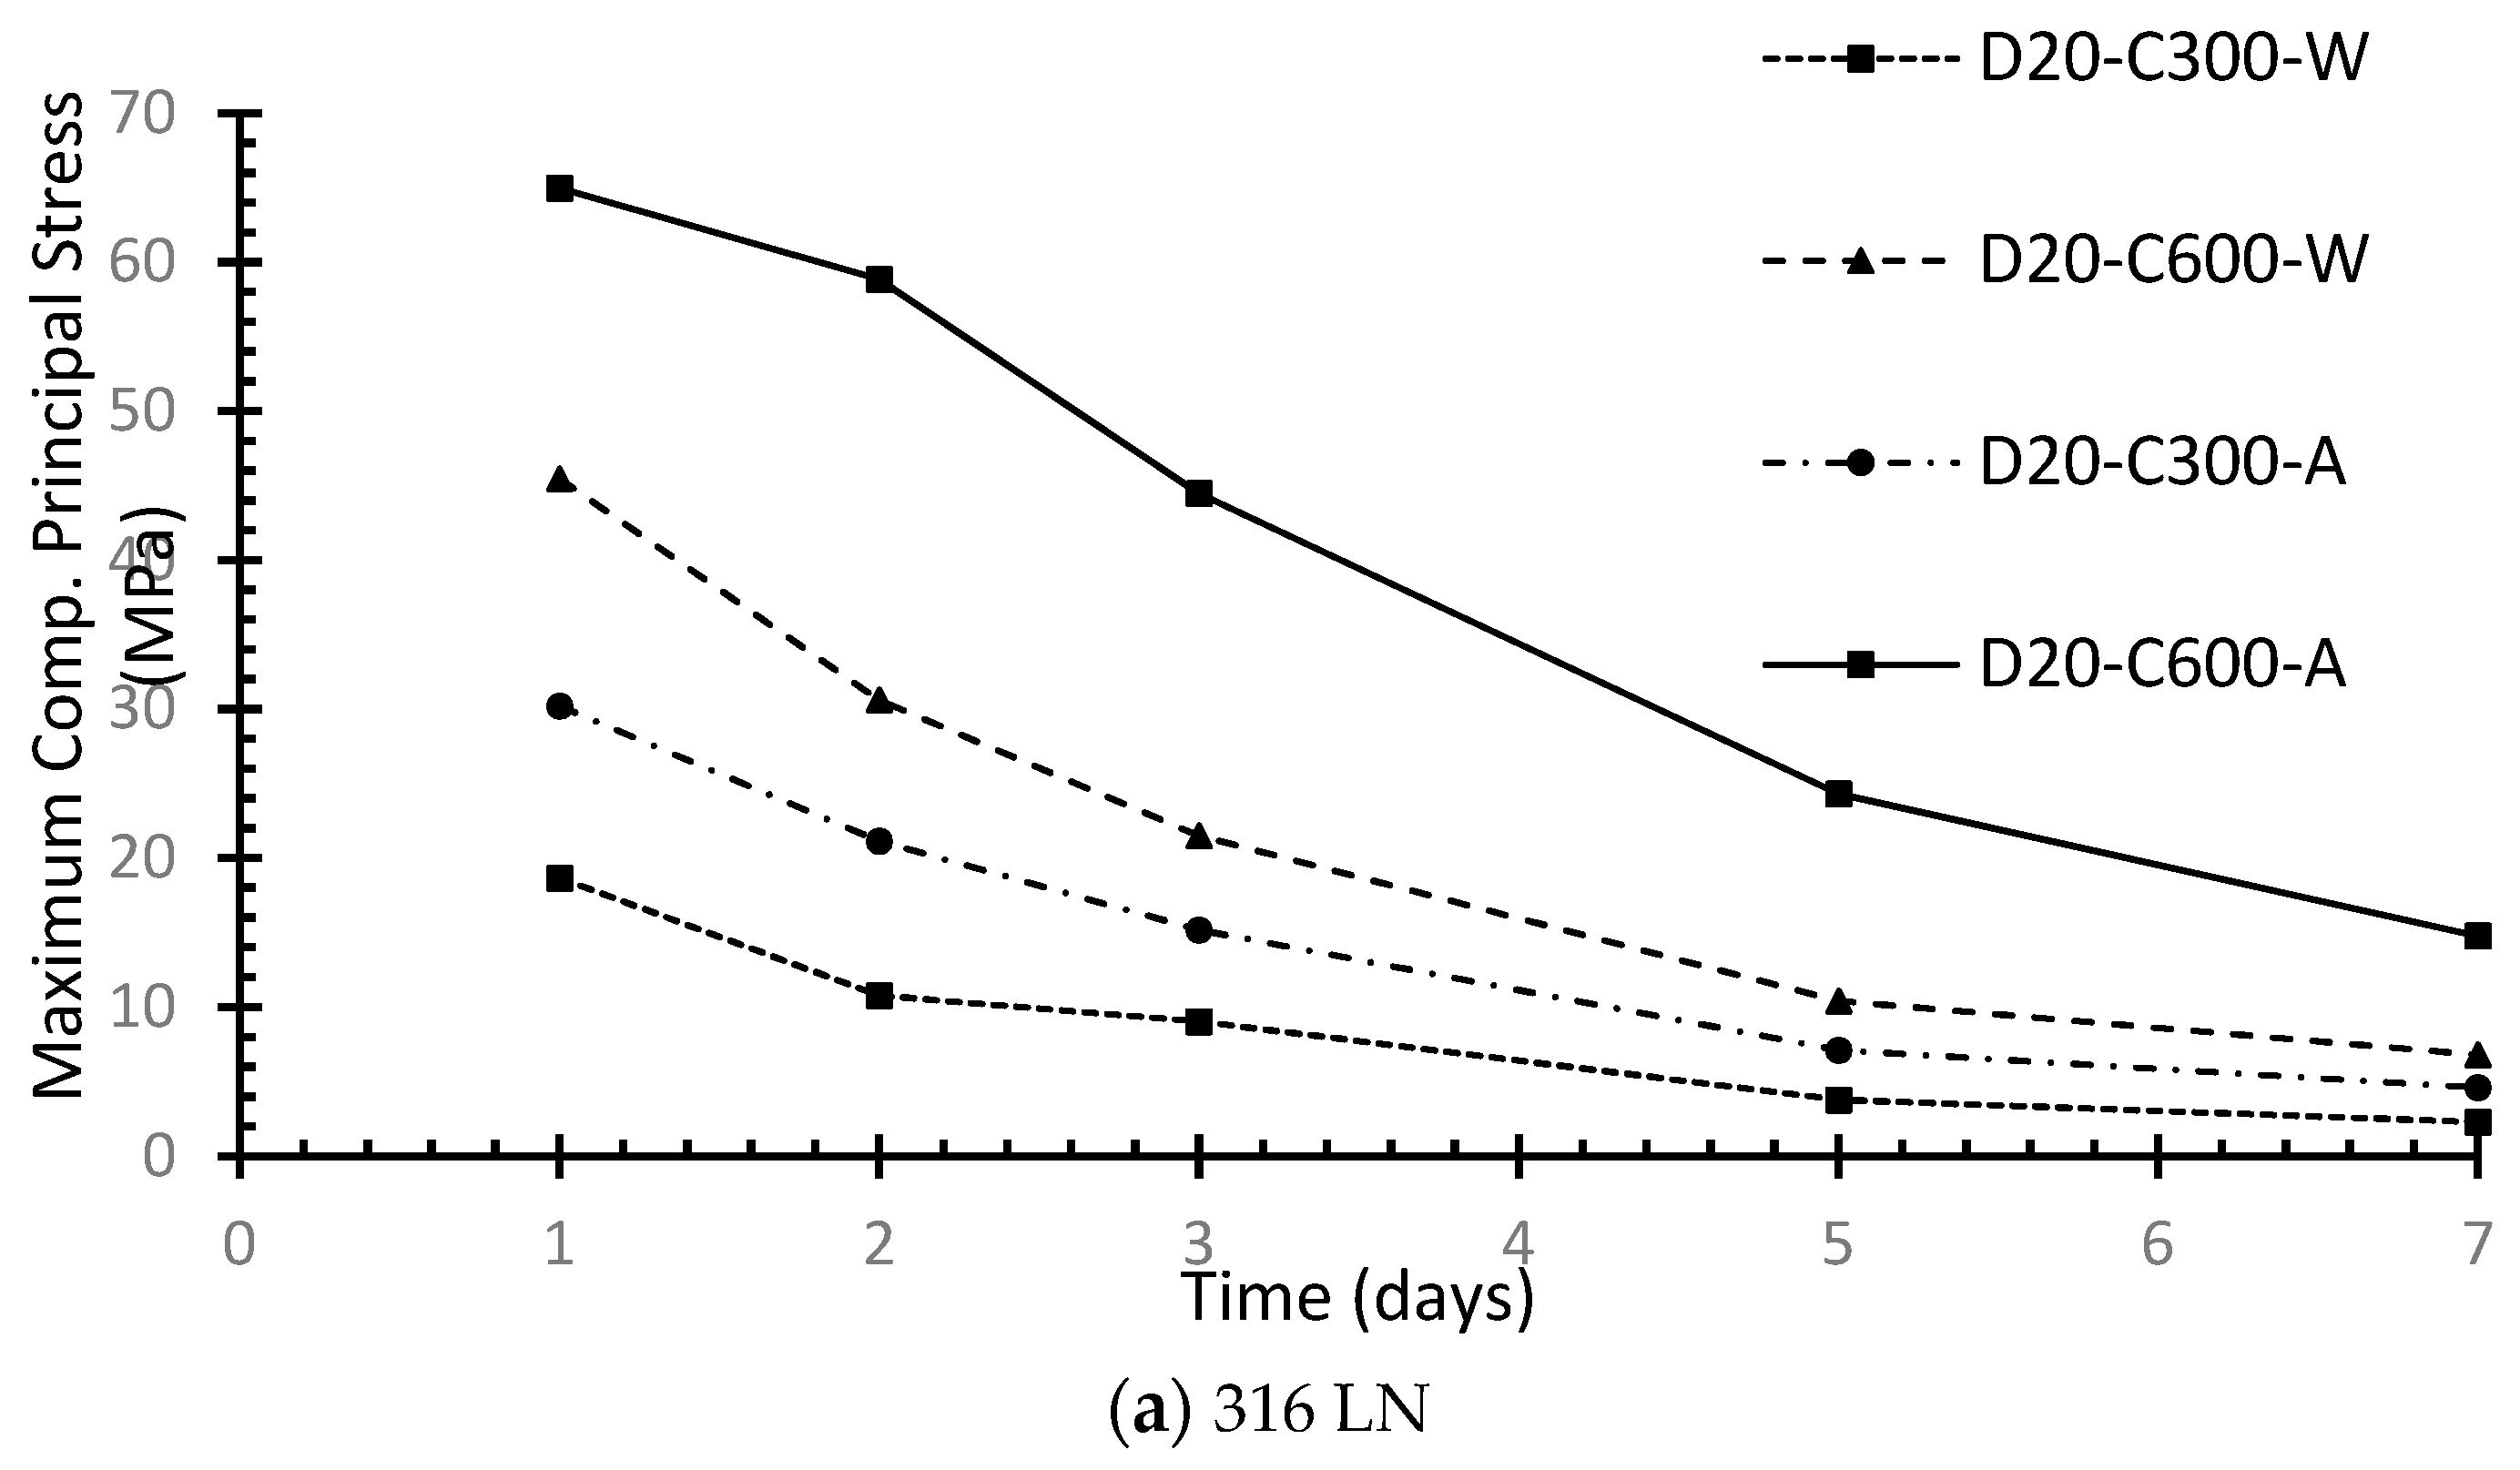

Figure 16.
Radial thermal expansion of SS bars at different ages.

© 2020 by the authors. Licensee MDPI, Basel, Switzerland. This article is an open access article distributed under the terms and conditions of the Creative Commons Attribution (CC BY) license (http://creativecommons.org/licenses/by/4.0/).
Share and Cite
MDPI and ACS Style
Khalifa, M.; Youssef, M.A.; Alhadid, M.M.A. Heat of Hydration Stresses in Stainless-Steel-Reinforced-Concrete Sections. Sustainability 2020, 12, 4852. https://doi.org/10.3390/su12124852
AMA Style
Khalifa M, Youssef MA, Alhadid MMA. Heat of Hydration Stresses in Stainless-Steel-Reinforced-Concrete Sections. Sustainability. 2020; 12(12):4852. https://doi.org/10.3390/su12124852
Chicago/Turabian StyleKhalifa, Mokhtar, Maged A. Youssef, and Mohamed Monir Ajjan Alhadid. 2020. "Heat of Hydration Stresses in Stainless-Steel-Reinforced-Concrete Sections" Sustainability 12, no. 12: 4852. https://doi.org/10.3390/su12124852
Note that from the first issue of 2016, this journal uses article numbers instead of page numbers. See further details here.