What Determines the Psychological Well-Being during Commute in Xi’an: The Role of Built Environment, Travel Attitude, and Travel Characteristics


1
School of Geography and Planning, Sun Yat-sen University, Guangzhou 510275, China
2
Lingnan (University) College, Sun Yat-sen University, Guangzhou 510275, China
*
Author to whom correspondence should be addressed.
Sustainability 2019, 11(5), 1328; https://doi.org/10.3390/su11051328
Submission received: 22 January 2019
/
Revised: 15 February 2019
/
Accepted: 26 February 2019
/
Published: 4 March 2019
(This article belongs to the Special Issue Psychology of Sustainability and Sustainable Development)
Abstract
:The commute well-being (CWB) has been associated with the mental health and depends on the positive or negative emotions that occur during the daily commute. This paper analyzes the influencing factors and discusses the structural relationship between CWB and influencing factors, based on our evaluation of the results for daily CWB between different travel modes. We based our analyses on a CWB survey conducted in the central city proper of Xi’an. In contrast to previous studies, this paper investigates two commuting phases, in the morning and evening, to better analyze daily CWB. To conduct a more comprehensive analysis, in addition to considering multi-stage combined travel, the subjective and objective aspects of factors influencing CWB were deepened and expanded. The measurement was based on the Satisfaction with Travel Scale, which was developed based on a method for measuring subjective well-being. The average CWB level of each model was compared by analyzing the variances. The influencing factors were determined by stepwise regression, and the influence mechanism was analyzed using a structural equation model (SEM). The results indicate that CWB in Xi’an was highest for walking, which was followed, in order, by motorcycle, electric bicycle, staff shuttle bus, bicycle, metro, car, taxi, and bus. The result reflects that commuting by bus is associated with more negative emotions in Xi’an. The results of SEM indicate that the built environment does not directly affect CWB, but it will act on CWB by affecting other factors. The travel attitude, commute mode choice, and other travel characteristics affect each other and affect CWB directly and indirectly. Other travel characteristics has the largest total effect on CWB, and the travel attitudes have the largest direct effect. Without considering the travel attitude, reducing traffic congestion, commuting time, and transfer times can significantly improve CWB and reduce negative emotions in the future in Xi’an.
1. Introduction
Satisfaction has long been an important research target for scholars in various fields. However, in the field of transportation, the concept of satisfaction with travel (SWT) has only begun to attract significant attention in the past decade [1,2,3,4,5]. As part of subjective well-being (SWB) [6,7], which causally influences both health and longevity [8], SWT is an indispensable component of satisfaction. It involves both the positive and negative emotions caused by travel modes, and a cognitive evaluation of travel as part of life satisfaction. SWT involves different assessment timeframes in that the satisfaction associated with a one-way trip can be regarded as an element of short-term assessment while satisfaction with daily travel can be seen as an issue of medium-term assessment, which has been associated with different health conditions [9]. In the existing literature, more and more studies have explored the relationship between SWT and travel characteristics (such as travel mode choice, travel time, travel expenses, service quality, and so on) [3,10,11,12,13,14] or moods [15] based on the connotations and measurement methods of SWT. Many prior studies in the past have proved that travel behavior is significantly affected by the built environment or travel attitudes/preferences. Thus, in recent years, some researchers have attempted to analyze the impact of the built environment or travel attitudes/preferences on SWT [16,17,18,19,20].
However, the existing studies have some limitations. First, as the study of SWT is conducted at the subjective level, it requires a large number of supporting questionnaire investigations. SWT is associated with many subjective and objective factors but the existing studies have selected only a limited number of indicators or simple built environment indicators were selected for discussion. Second, although the existing research has discussed the relationship between SWT, the environment, the travel attitudes/preferences, and travel characteristics as independent influencing factors, the interaction and structural relationships of these influencing factors are rarely comprehensive. Third, given the difficulties involved in conducting questionnaire surveys, the existing research has only investigated the satisfaction of the most important travel stage for multi-stage combined travel. However, for public transportation, residents often need to walk or ride a bicycle to reach a public transport stop. That is to say, residents using combined travel often require at least one connection stage to reach their destination, and the connection stage will often affect residents’ moods and perceptions of well-being. Fourth, studies of daily SWT often require respondents to directly evaluate their overall feelings, but daily travel involves different travel stages, which also affect the subjective evaluation of residents. Furthermore, since commuting is the most basic and important travel undertaken by urban residents, commuting travel is more constant in time and space than other forms of travel, and it directly affects other activities and travel choices as well as the physical health of urban residents [21,22]. In particular, domestic and foreign cities tend to experience expanding development, and the increase in suburbanization leads to increases in commuting distance year by year. However, in China, public transport has been popularized, promoted, and given greater priority than in foreign countries. Thus, many cities in China continue to increase investment on public transport and implement measures for public transport as a priority. It is expected that the development of public transport infrastructure will entice more residents to choose public transport and, thereby, limit the increasing ownership and use of private cars to some extent. Although the proportion of car travel has increased rapidly, the shares rate of car travel is still relatively low compared with that of Western developed countries, and public transport remains the main way for residents to travel. Thus, the travel structure of urban residents in China is quite different to that of Western developed countries. Nevertheless, the practical advantages, emotional realization, and symbolic satisfaction embodied in cars have prompted a continuous increase in demand for cars by China’s residents. Therefore, the competition between public transport and car travel will continue to intensify, which is similar to the situation in other countries.
Based on this discussion of limitations and the unique features of China, there is a strong need for a more comprehensive perspective and in-depth analysis when discussing independent influencing factors and SWT. However, there are few examples of such in-depth analysis among the existing studies. To solve this problem, this paper aims to perform an in-depth analysis of residents’ commuting behavior. The paper is innovative in the following ways. For the first time, the authors consider both single travel and combined travel modes as well as the two stages (departure and return trip) of travel in considering daily commute well-being (CWB). Furthermore, we deepen and expand the indicators of potential influencing factors. In particular, we consider the built environment factors relating to the respondents’ homes and workplaces, and travel characteristics such as waiting and transfer times. In addition, we use a structural equation model (SEM) to comprehensively analyze the structural relationship between the internal and external influencing factors, which include the urban built environment, personal travel attitudes/preferences, and other travel characteristics. Given that the prior studies have not analyzed many second-tier cities as their case study area, in this paper, the authors selected Xi’an as the research area, rather than focusing on the large cities with populations of more than 10 million, such as Beijing, Shanghai, Guangzhou, or Shenzhen. In addition, government policies in China are gradually introducing restrictions on private car usage. Xi’an has implemented such traffic restrictions based on the last digit of license plate numbers. It means that each car will be banned from use one day of the week. According to the “2017 China Major City Traffic Analysis Report” released by Amap, Xi’an is the city that has achieved the largest reduction in congestion as a result of these traffic restrictions in China, and its residents’ CWB is more typical.
2. Study Area and Data
2.1. Research Areas
For this paper, seven urban districts of the central city proper of Xi’an (Xincheng District, Beilin District, Lianhu District, Yanta District, Weiyang District, Baqiao District, and Chang’an District) were selected as the research area for detailed analysis as well as the 80 subdistrict offices and the 1812 communities covered by them (Figure 1a). The overall research area was 2420.7 km2 and the resident population was 5,204,400 in 2016. There are many traffic problems in the area, which largely arise from the contradictions between the historical foundations of the transport networks and the development of modern transportation. The network structure of Xi’an is essentially a rectangular system of radial roads, with imperfections remaining in the trunk roads and the three-dimensional traffic road network. In general, it is a planar and low-speed traffic system. Consequently, there are many traffic problems at present. For instance, the low utilization rate of the city expressway has increased the traffic load in the city. The existing network system in the city, especially the trunk road network system, is inappropriate for the high traffic loads. The construction of trunk roads in the north–south direction is seriously inadequate. The old area of the city, which is surrounded by Ming Great Wall, has limited entrances, exits, and a serious traffic connection problem between the interior and exterior. The construction and reconstruction of the secondary main road and the branch road are lagging, and the urban traffic micro-circulation network is restricted. The low functionality and imperfections in the network result in negative effects on overall traffic capacity. Lastly, the spatial layout of the “chessboard network,” which fails to meet certain requirements of network density, results in inevitable urban traffic congestion.
In addition, there are problems in relation to land uses in Xi’an. The proportion of green land and municipal land in the central urban area is currently low, while the proportion of public service land is high, the proportion of land use is not reasonable, and development of various types of lands is imbalanced. In the built-up area of the whole city, the layout of land for public service facilities is imbalanced, in that such facilities are densely supplied in central built-up areas, but sparsely supplied in surrounding areas. Due to the construction of a large number of public service facilities, infrastructure does not match the rapid expansion of the city, which also leads to a high degree of congestion in the city center. Moreover, the current problems in the main urban area (Xincheng, Beilin, Lianhu, Yanta Districts) include the centralization of urban functions, high population density, a serious shortage of green space, heavy traffic pressure, and a poor overall environment. Moreover, a new center is required to disperse the functions of the old city.
2.2. Source of Data
The research data in this paper can be divided into three types, which include the questionnaire data, vector data, and panel data. Each is discussed below.
Questionnaire data. The authors derived the data from a survey on CWB that was conducted in the central urban area of Xi’an (Figure 1b). Ethical issues in relation to the privacy of respondents were handled appropriately in conducting the survey. A stratified sampling of the resident population in the central urban area of Xi’an was conducted to perform the survey, and 1680 respondents were invited to complete the on-site questionnaire. The questionnaire survey was conducted in July and August 2018, for 20 days in total, and 1512 valid questionnaires were collected, with an effective rate of 90%. As well as collecting sociodemographic information on the respondents (Table 1), the questionnaire investigated their individual commuting mode choices for the two travel phases, morning and evening, the reasons for these choices, and the respondents’ attitudes/preferences to commuting modes.
The sample adopted in this paper consists of 1512 commuters aged from 16 to 65 years. It includes both single-mode and multimodal transport commuters. The commuting mode is determined based on the commuting mode used most frequently by the respondent in a week, which is also the transportation mode that takes the most time in the whole commute travel conducted in one day. Single-mode commuting mainly comprises of walking, cycling, and driving or taking a taxi from the home to the workplace. For multimodal transport commuting, relevant to transportation modes such as bus, subway, and commuter shuttle, we consider two interchange stages because most commuters must pass through two interchanging stages before arriving at their destination. Based on the current state of development of public transport in Xi’an, one or two transfers are required before passengers arrive at their destination. The survey required respondents to provide the times taken for transfers when they commute using public transport, such as buses and the subway.
Vector data and panel data. To further investigate the impact of built environment elements on CWB, the authors collected road and bus network data and points of interest (POI) data in the study area based on Amap and OpenStreetMap. In total, there were 15 categories of POIs, including locations for catering, shopping, accommodation, travel, and other facilities. The panel data mainly consist of the population data on various street offices and communities under its jurisdiction in 2016, including the resident population and the employed population. In addition, the population data are derived from the public statistical yearbook provided by government websites. More detail is provided in Section 3 below which will introduce the built environment variables consisting of vector data and panel data.
3. Methodology
3.1. CWB Measurement
The existing studies have developed a number of standards to measure people’s opinions of their travel modes. The Satisfaction with Travel Scale (STS) has been applied most frequently. It was developed using a method of measuring SWB and was first applied by Ettema et al. [1]. It is widely assumed that SWB consists of two dimensions [23,24]: emotional well-being (the intensity, frequency, and duration of positive and negative effects), which is associated with individual mood status, and cognitive well-being (the overall cognitive judgment of life satisfaction), which is associated with an individual’s overall assessment of his/her life. In designing the STS, similar dimensions to SWB were adopted and, therefore, the STS can be considered as a specific area of SWB. So far, in the existing studies, scores in the STS have been calculated by averaging scores across topics, including positive activation/negative inactivation, positive inactivation/negative activation, and cognitive assessment [3,11,14,24]. Recently, scholars have evaluated two emotional responses and cognitive assessments using Cronbach’s alpha value and a SEM (i.e., confirmatory factor analysis) [3,14,24]. These studies show that the three basic aspects covered by the STS can measure SWT effectively. This paper performed a corresponding investigation and measurement based on the STS established by Ettema et al. [1].
3.2. Analysis of the Influences on CWB
The average CWB level of each model was compared using the analysis of the variance method in this paper. The influencing factors of CWB were determined by multiple stepwise regression, and the influence mechanism was analyzed using the SEM, which can analyze the relationship between multiple dependent and independent variables, and reflect the direct and indirect effects of interactions between latent variables.
As noted above, this paper aims to add more objective built environment and location factors into the discussion of influencing factors, which is an aspect missing from the existing studies. Thus, this paper determined the degree of land-use mixes, the traffic network (road and transit networks), the population density, and the configuration of facilities for community, with sample start and end points determined with reference to the existing built environment literature [25], based on ArcGIS software, as shown in Table 2. In addition, dummy variables were set for the variables such as travel attitudes/preferences and travel characteristics based on the questionnaire data, where the attitudes and preferences were set from “strongly disagree” to “strongly agree,” according to the seven-point Likert scale (Table 3).
3.3. Conceptual Model
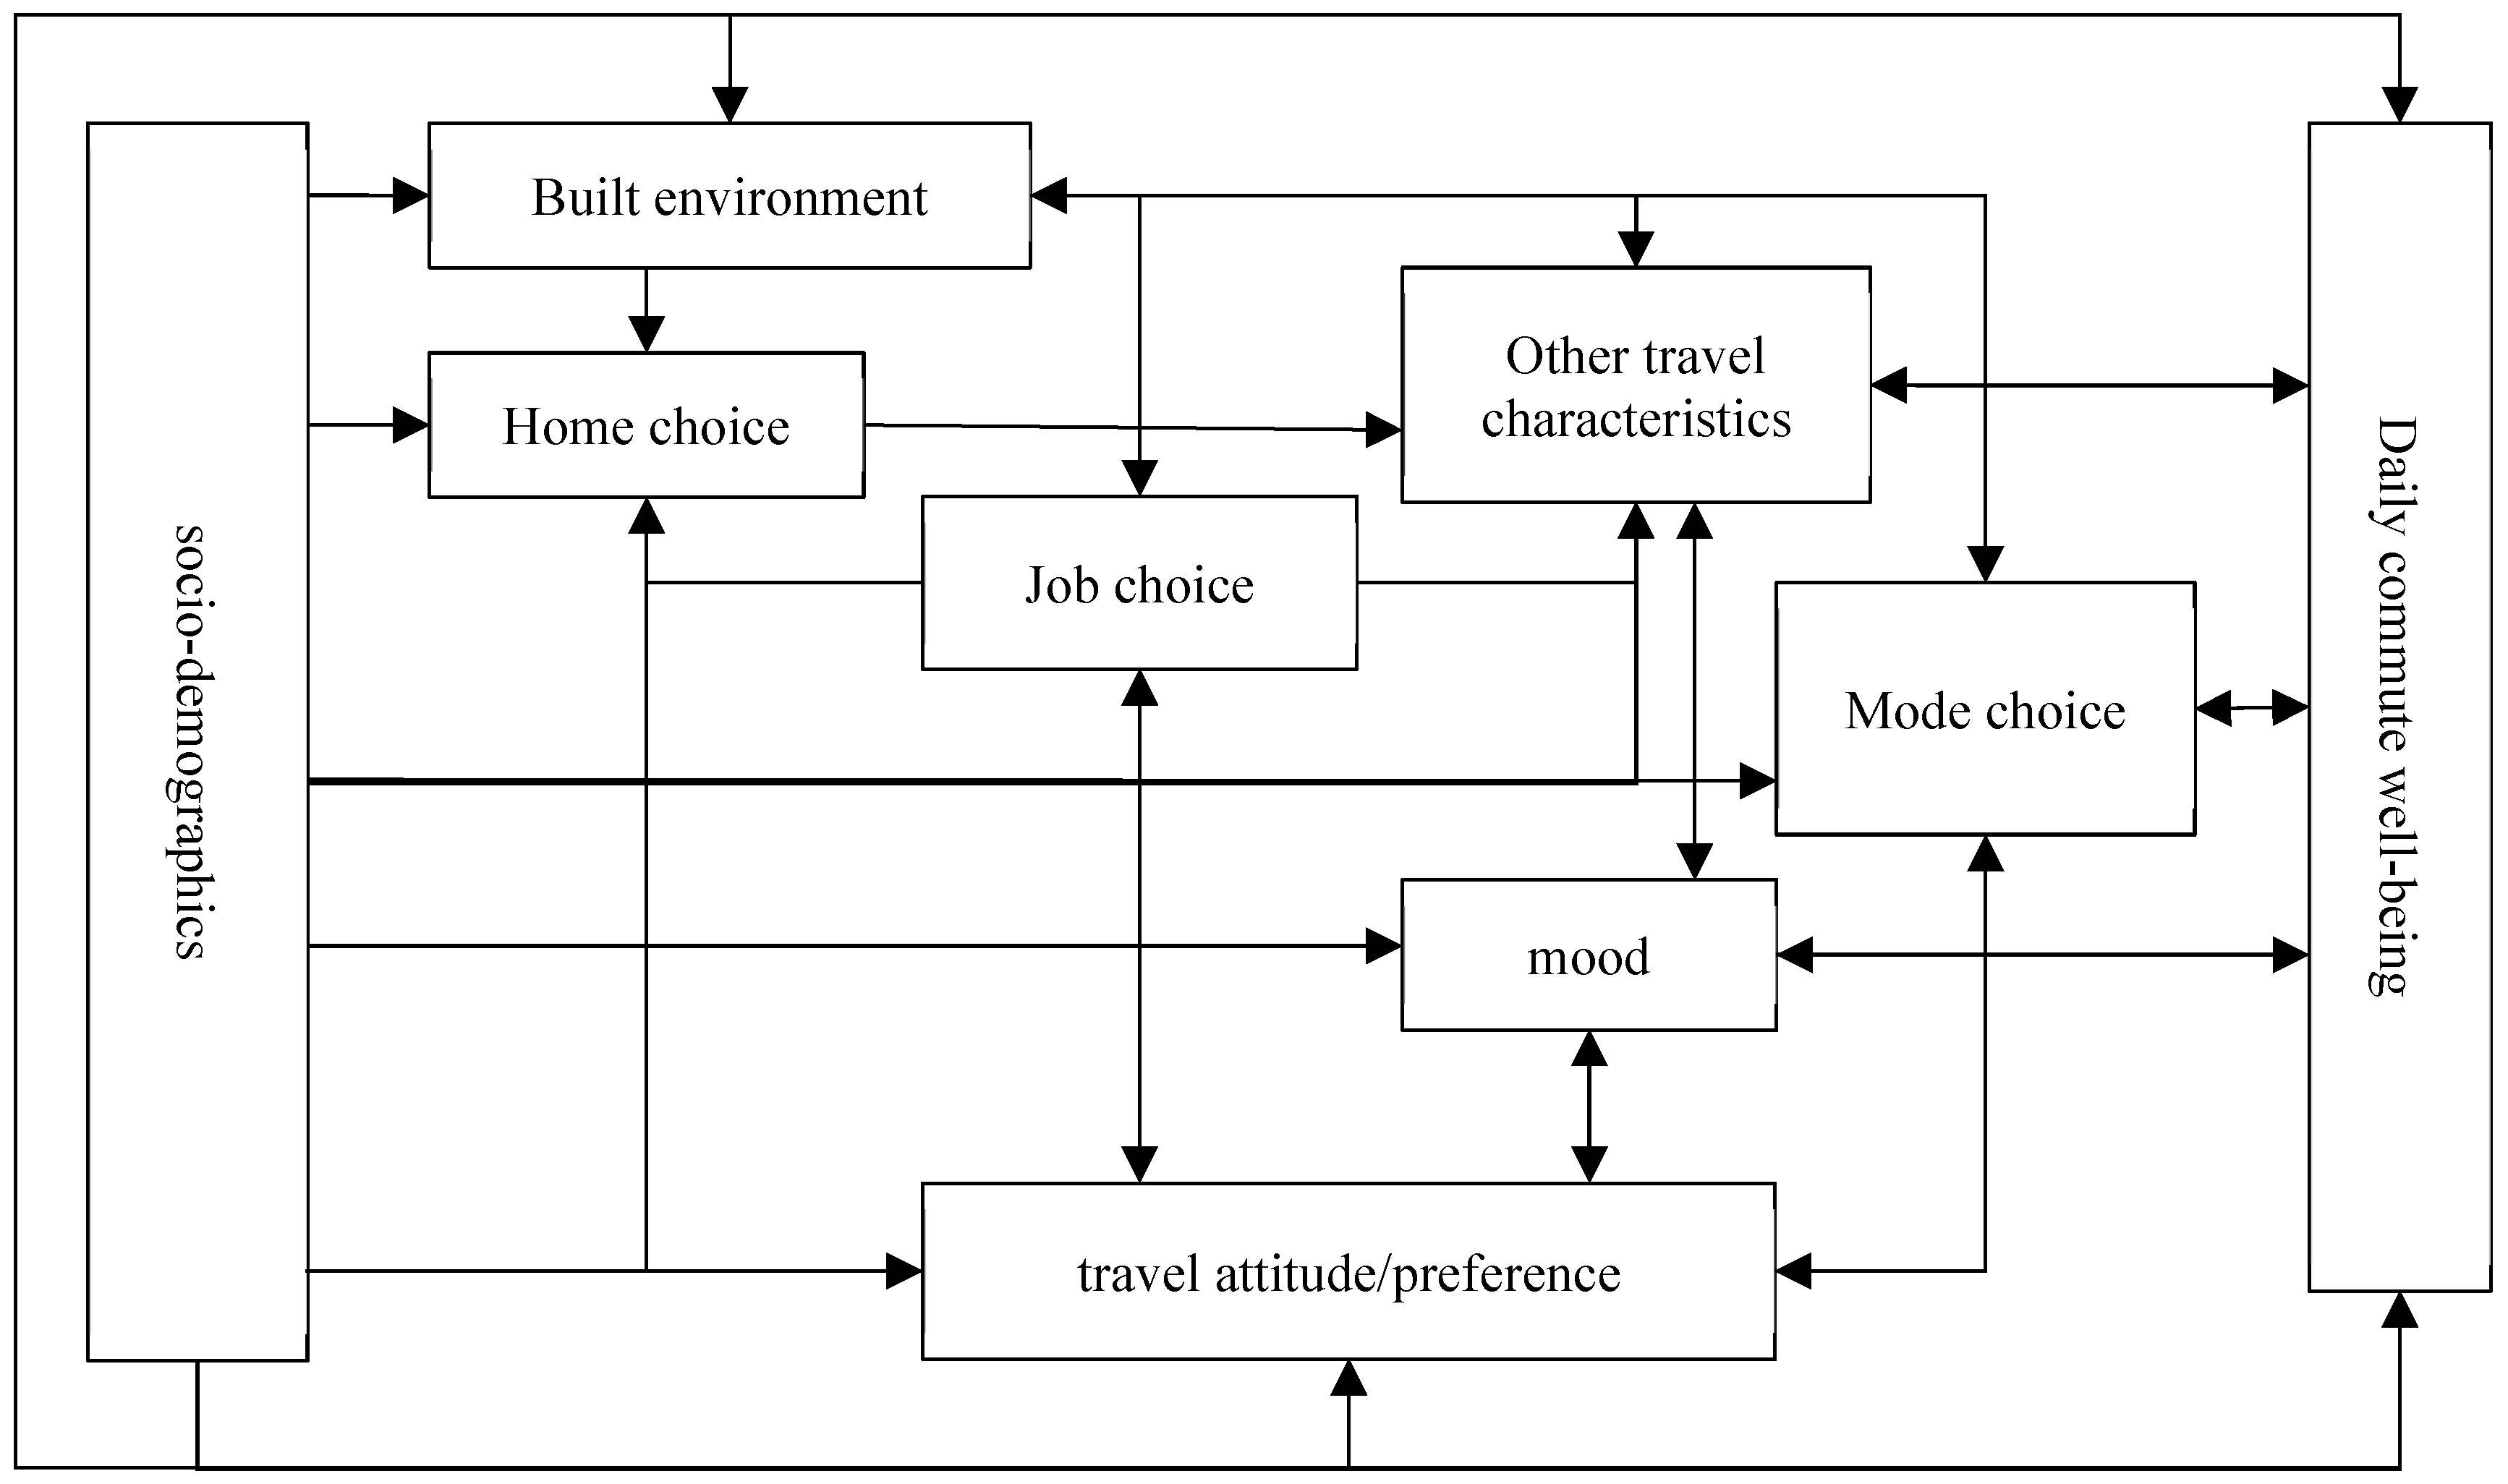
Current studies have linked the external objective factors, as well as the internal subjective factors, with SWT. The structural relationships among them provide the conceptual basis of the analysis. As illustrated in Figure 2, a conceptual model was constructed and the relationships between variables are described in detail in the following sections.
3.3.1. Influence of External Objective Built Environmental Factors and Travel Characteristics on SWT
Previous studies have shown that travel mode, the built environment, and SWT are interrelated. The built environment not only directly affects SWT but also affects travel modes though various elements of the urban morphology, land-use patterns, and the transport network, which indirectly results in different SWTs. There is a great deal of empirical literature on the impact of urban morphology on travel modes, with many studies concerned not only with the influencing factors, such as density, land-use patterns, and pedestrian-friendly environments [30], but also with the impact of the city/neighborhood built environment on travel distance and travel mode [31]. In general, empirical studies on travel distance have indicated that higher urbanization levels are associated with shorter travel distances [32,33]. In particular, compact cities can reduce travel distances [34]. However, travel time is inversely related with the urbanization level. The higher the urbanization level is, the more serious the traffic congestion and parking problems are [35]. The existing literature on travel distance within a neighborhood has shown that a shorter travel time results from the characteristics associated with traditional communities, including high density living, high mixed land-use patterns, and high accessibility [31]. The effects of these characteristics on travel distance and travel time are clear and the urbanization level of the living environment is positively correlated with the usage of transit, bicycles, and walking [36]. In addition, the usage of these travel modes increases with facility density and the degree of land-use mixing [30,31,37]. Studies have shown that, in the United States, the construction of retail stores in neighborhoods has increased the travel by transit [37], and that the availability of parking lots is positively related to the usage of private cars [38]. Thus, these empirical studies have shown that travel behavior results from the decisions made by individuals in a variety of spatial and temporal contexts. For example, simulation prediction models have been used in these studies to analyze the effects on SWT that occur through the spatial configuration, including the road coverage situation, travel cost, travel mode, and social developments.
The travel choice usually depends on the domicile of residents. In terms of travel mode, SWT is related to social inequality, especially in urban and suburban areas [39]. A lack of travel choices may compel individuals (especially those in low-income groups) to utilize poor quality services, which may prevent them from participating in social activities [40]. For example, in rural areas, SWT is more likely to be affected by a lack of travel modes [41]. People living in the suburbs are more likely to drive to their destinations, but those who live in neighborhoods with highly mixed land-use patterns (i.e., a mix of residences, public service facilities, commercial facilities, and so on) and convenient pedestrian environments, are more willing to walk due to the high accessibility of the living environment [17]. Therefore, land use and networks do affect SWT. In particular, studies have shown the relationship of housing to shopping centers, places of work, and other nonresidential places is related to people’s walking or cycling behavior [31,37,42]. Thus, an increase in physical activity and effective improvements of emotions can be achieved by enriching the land-use pattern and improving the pedestrian environment and accessibility of a neighborhood [43,44]. Better pedestrian infrastructure, including sidewalks and street lighting, can encourage more active travel, especially in relation to the nonwork travel behaviors of families [25].
3.3.2. The Influence of Internal Subjective Psychological Factors and Non-Travel Mode Characteristics on SWT
Factors in non-travel mode characteristics that related to commuter personality, behavior, and preferences also affect SWT. In addition to the basic socio-demographics that must be considered [45], several other factors have been discussed in previous studies. For example, the values and lifestyles of travelers are critical to explain the satisfaction associated with short-distance and long-distance commuting [46]. The attitude toward environmental protection is an important explanatory variable for railways, buses, and active transport use in short commutes, and the variable “reflects social status” is of great importance for private car use. In addition, in a study on the CWB of college students [47], researchers compared public transportation, active travel, and private car users, and found that the commuting enjoyment of public transportation users was the lowest. The authors explained the findings of this study by discussing “unavailable” passenger attitude variables related to travel preferences such as “I get half of fun when reaching the destination,” “I like to travel alone,” and “I utilize my commuting time efficiently.” Cyclists obtained higher scores for these variables than did other groups because more of them chose “I get half of fun when reaching the destination.” In addition, the study found that the attitude variables regarding family location preferences (such as “I like to live in a lively community” or “I feel safe when I travel in my community”) had a significant influence.
Therefore, the existing studies clearly indicate the importance of psychological factors in affecting the choice of commuting mode [48] as well as their differing influence on different people [49]. However, existing mode choice models often ignore the influence of psychological factors, and only replace them with error terms. Latent variables (such as attitudes, perceptions, etc.) can be applied in the measurement of psychological factors. For example, if the dependent variable is the intention to use a vehicle to get to work after obtaining the job, then the independent variables include emotional motivation, travel mode characteristics, and the social order [50]. Furthermore, some scholars have used path analysis, which provides further evidence that the causal relationship from choice behavior to attitude is stronger than the causal relationship from attitude to choice behavior [51].
4. Results
4.1. Comparison of Differences in CWB
According to the results for the CWB associated with various commute travel modes, satisfaction (from high to low) is ordered as follows (Table 4): walking (0.97), motorcycle (0.72), electric bicycle (0.53), unit shuttle (0.48), bicycle (0.45), subway (0.37), private car (0.32), taxi (0.22), and bus (0.06). Among them, the CWB associated with walking, motorcycle, and electric bicycle transport is significantly higher than that of other modes of transportation (F = 33.05, p < 0.05).
Although the existing studies have only analyzed the main commute travel modes (such as the use of two or more of modes of walking, bicycle, private car, bus, subway, or light rail), the commute travel modes discussed in this paper are more extensive. However, it can still be seen that the users of active commuting and rail transit are more satisfied with commuting, and the well-being of bus users is the worst, which is consistent with the previous research results.
4.2. Factors Affecting CWB
In the current paper, all factors were analyzed by stepwise regression, and a total of 23 factors were left in the model (Table 5). The model passed the F test (F = 31.551, p < 0.05), which indicates that it is valid. Furthermore, the variance inflation factor values in the model are all less than five in the multicollinearity tests, which means that there is no clear collinearity problem and the Durbin–Watson value is around two, which indicates that there is no autocorrelation in the model or, between the sample data, and that the model is effective. However, it should be noted that stepwise regression can only provide direct effects between variables and cannot demonstrate possible indirect effects. Moreover, as a result of potential collinearity, unexplained results may occur, such as a negative correlation between a single indicator and the overall results. Therefore, the stepwise regression analysis applied in this paper is only used to determine the influencing factors instead of to explain the correlational coefficient.
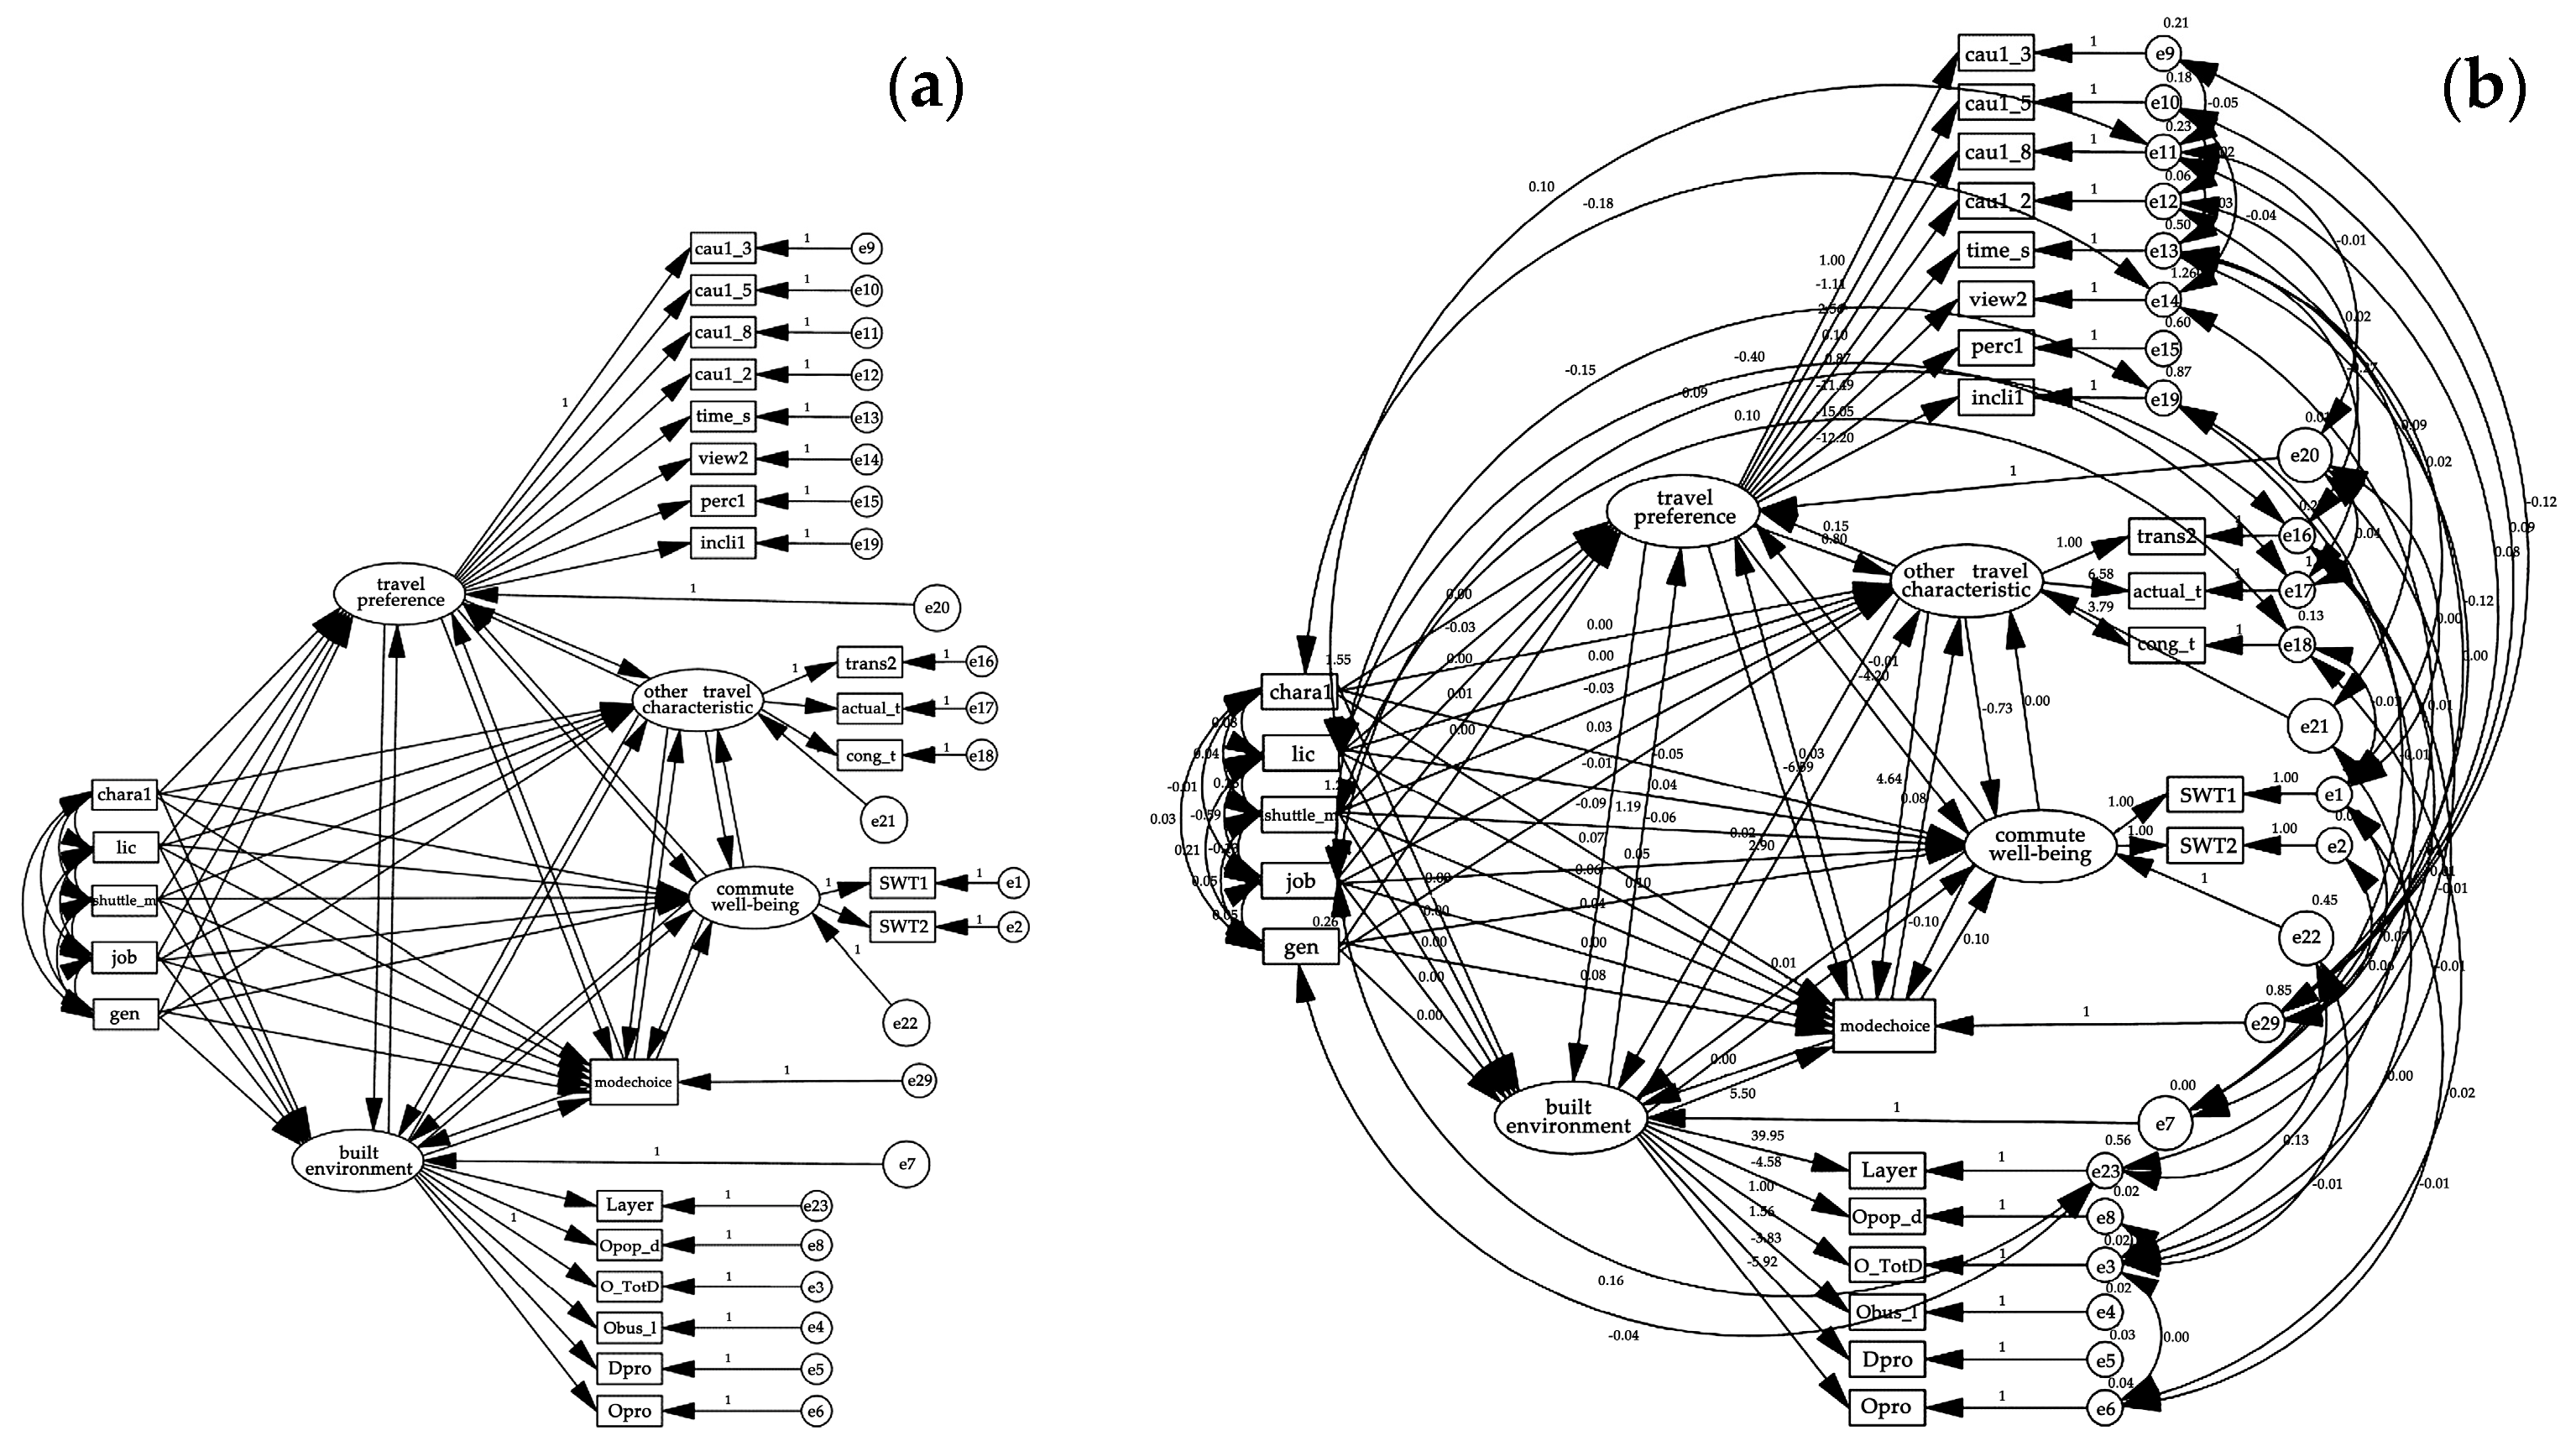
In addition, this paper excluded the factors of residence and job selection, and analyzed the CWB developed by Amos based on the theoretical framework derived from existing studies. The initial model is shown in Figure 3a, based on measuring the CWB using the STS, and including emotional factors among the dependent variables. Since some fit indexes in the initial model did not meet corresponding standards, the initial model was corrected, and the modified model and its results are shown in Figure 3b and Table 6.
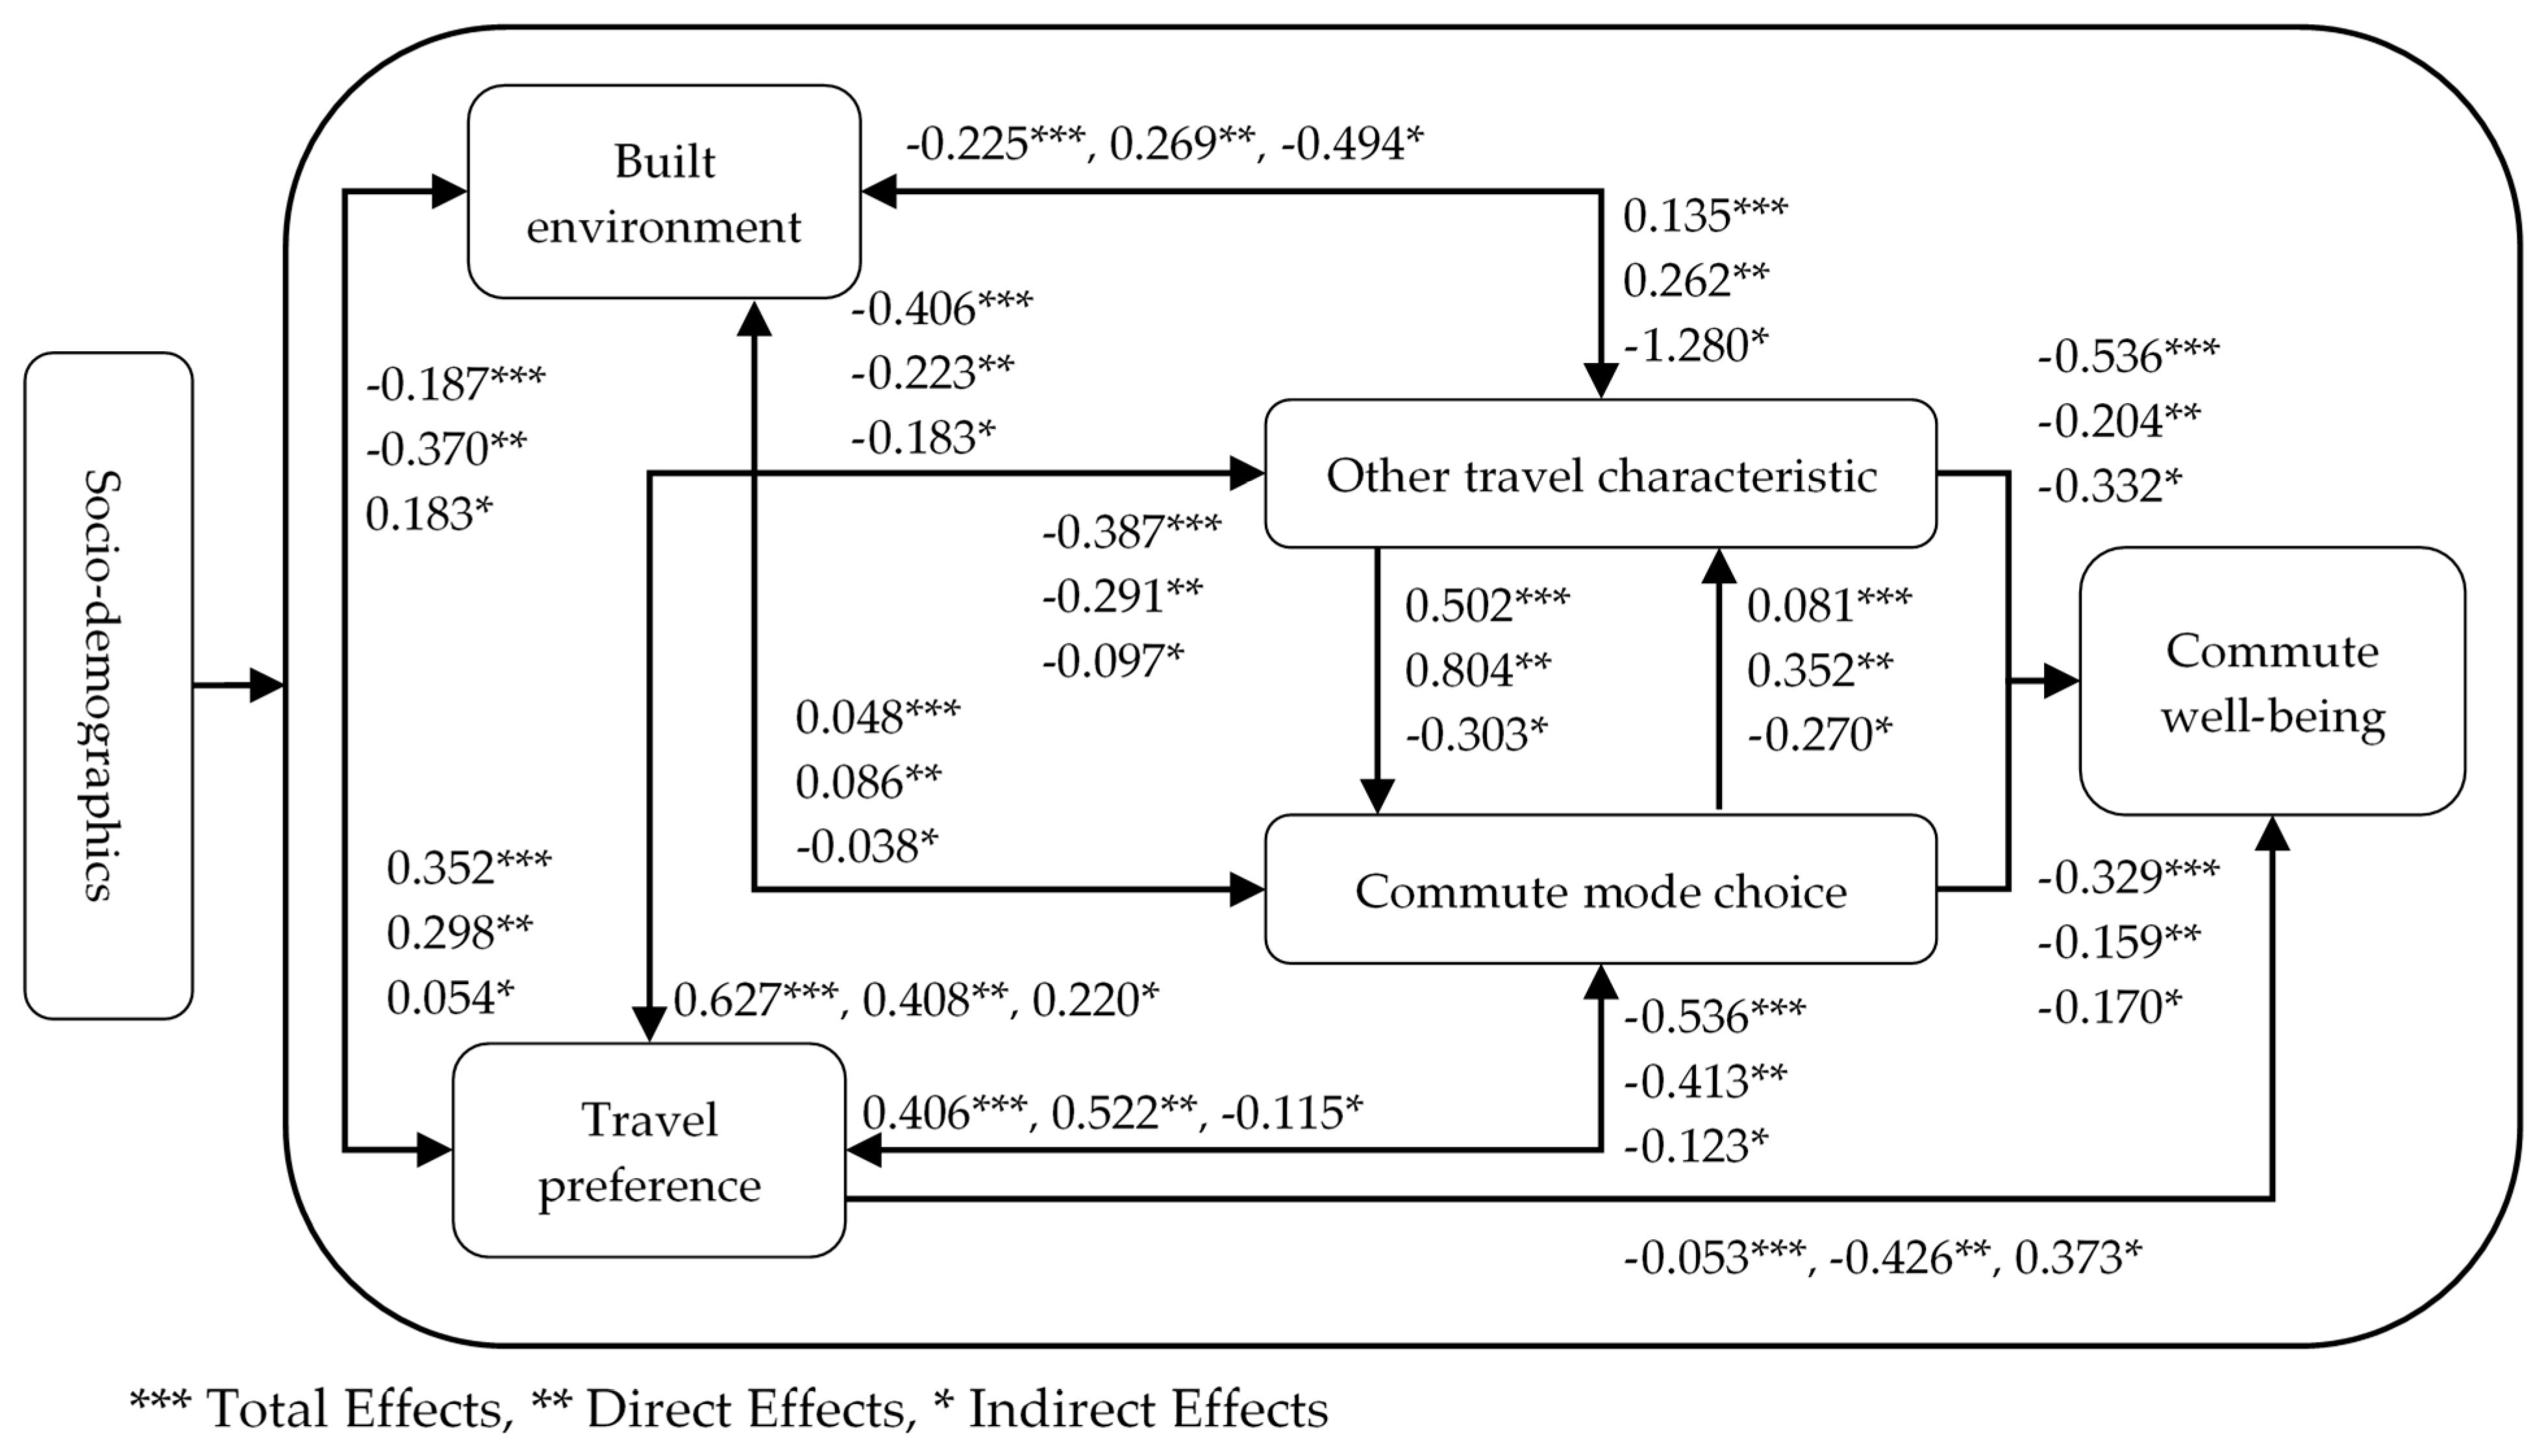
A simplified version of the theoretical model can be obtained using the results of the model path coefficient and three aspects of the effect, as shown in Figure 4. This model passed the validity test, the relevant common fit index reached the evaluation standard [52], and the model’s goodness-of-fit was high. At the same time, it can be concluded that the built environment does not directly affect the CWB, but it does act on it indirectly by affecting other factors [20]. The three factors, travel attitude/preference, commuting mode choice, and other travel characteristics, will affect each other, and will affect CWB directly and indirectly. The other travel characteristics has the greatest overall impact on CWB while the travel attitude/preference has the greatest direct impact.
4.2.1. The Influence of Socio-Demographics on CWB
Five socio-demographic factors will affect the CWB, including job status, driving license status, shuttle mode, and personal character (more critical, easy to quarrel with others). It was found that job status (0.075) and driving license status (0.069) had a significant positive influence. Gender (0.063) has a relatively small influence in the overall structural relationship. The results indicated that the longer the driving experience is, the higher the satisfaction for males is, and that the fewer restrictions there are on work time, the higher CWB will be. The characteristics of the shuttle mode (−0.082) and the more critical and quarrelsome characteristics (−0.072) will have a significantly negative impact on CWB. The result indicated that greater complexity of the shuttle mode will significantly reduce the CWB, which is possibly because it will result in the occurrence of certain factors that have a negative influence on CWB, such as spending more time, encountering congestion, and other factors. In addition, encountering commuters who are more likely to argue with others will affect the mood of the individuals during commuting, and have a negative influence on their CWB.
4.2.2. The Influence of Commuting Mode Choice and Other Travel Characteristics on CWB
From the perspective of commuting mode choice (−0.159), CWB will gradually decrease when people change from walking to driving (walking–bicycle/electric car/motorbike), gradually increase their autonomy, and require options that enable them to drive by themselves (public transportation—taxi/network car/staff shuttle bus—private car). The overall results indicate that other travel characteristics will negatively affect CWB. The traffic congestion duration (0.931), commuting time (0.895), and the transfer times of public transportation during the afternoon return trip (0.427) will significantly affect the latent variables of other travel characteristics and reduce CWB in turn. This indicates that the longer the commuting travel time and the duration of traffic congestion are, the more the commute experience is affected, and the lower the CWB is [53]. In addition, the more transfers there are for public transportation during the afternoon return trip (i.e., during the process of returning home from work), the longer is the commuting time required, and the more potential there is for congestion or crowding.
4.2.3. The Influence of Travel Attitude/Preference on CWB
The overall results indicate that travel attitudes/preferences will have a negative influence on CWB. The stronger the following attitudes and preferences are, the lower CWB will be: residents’ satisfaction with commuting time (−0.106), whether autonomy is considered when choosing the commute travel mode (−0.218), and whether respondents consider that “the chosen commute travel mode is better than others” (−0.676), that “choosing this kind of commute travel mode is very easy and convenient” (−0.850), or that they are “highly likely to choose this commute travel mode to travel to work next time” (−0.695). Whether the choice of the transportation mode takes into account cost (0.180), reliability (0.034), and other instrumental factors (such as the ability to chat with attendants, look at a mobile phone, or read a newspaper) (0.439) are also influential in relation to CWB. The stronger the attitude and preference for these three aspects are, the lower the CWB will be.
The cost factor and other instrumental factors are mainly relevant to the active travel mode, electric vehicles, motorcycles, and public transportation. Most trips involving the first three of these modes involve short-distance travel and encounter fewer factors that affect the CWB. If accessibility and reliability are low and congestion is high for public transportation in the Xi’an city, researchers have found that, even if commuting cost is relatively low, and people can “read newspapers and books, chat with friends or play phone games [11]” when using public transportation, CWB cannot be improved by a single factor. Reliability factors mainly apply to buses and private cars. The former is the same as the above cases. Almost no alternative commuting mode can compete with private cars with regard to autonomy, such as route selection. However, many other factors will have an effect on CWB, such as inexperienced drivers who are less safe in traffic and are more prone to accidents [54,55,56], whether drivers become easily bored with other road users, physical and mental exhaustion during driving, restrictions on lanes and driving speed [24], and, especially, traffic congestion problems during long-term commuting [57,58].
4.2.4. The Influence of Location and the Built Environment on CWB
The overall results show that the location and built environment do not have a direct impact on CWB, but they will influence CWB by affecting commuting choices, travel attitudes/preferences, and other travel characteristics. This paper also attempts to investigate whether there is a spatial difference in CWB from the aspect of location factors. The results indicate that, even though the overall built environment does not directly affect the CWB, the location factor is still significantly negatively correlated with CWB (−0.256, p < 0.01). According to the calculation method for the circle layers mentioned in Section 3.2, the four population structure circle layers formed in the study area are basically consistent with the urban development pattern. Fewer land use types and transportation networks are observed in the outer circle layer (Table 7), and the corresponding CWB is lower. The locations of the four layers in Xi’an are as follows. (1) The “first circle layer” mainly covers the east side of the Ming City Wall with the north–south street as the central axis. This circle layer includes traditional commercial centers, such as East Street. (2) The “second circle layer” is basically bounded by the second ring road, covering all other areas except the first circle layer within the second ring road. This circle layer covers the entire area of the “old town” (Xincheng District, Beilin District, and Lianhu District). (3) The “third circle layer” is basically bounded by the third ring road, which is the control area of the main urban area of Xi’an. (4) The “fourth circle layer” belongs to the central urban circle layer, including the northern part of Weiyang District, the eastern part of Baqiao District, and all administrative scope of the Chang’an District, including some rural areas and street office centers.
Among the built-in environmental factors, the per capita bus line length in the community where respondents reside (0.244), the mean value of the global depth of the road network in the community where respondents reside (0.158), and the number of bus stops within 500 m of the place where respondents reside and work (−0.523 and −0.414, respectively), as well as the population density of the community where the respondents reside (−0.576) all significantly affect the latent variable of the built environment. The longer the length of the per capita bus line, the closer it is to the suburbs, and the worse the built environment will be. This is mainly because, even though there are more bus lines in the three internal circle layers, the populations of these areas are very concentrated, so the index is lower than in the fourth circle layer (i.e., the suburbs). The mean value of the global depth of the road network in the community where the respondents reside reflects the spatial distribution from the central space to any other space after spatial remapping of the community. The higher is the global depth, the less convenient the space will be. According to the results of the model, this indicator is also negatively correlated with satisfaction (−0.119, p < 0.01). In addition, a higher number of bus stops within 500 m of the place where respondents reside and work reflects the accessibility of bus transport, which indicates that public transportation and travel is convenient. At the same time, the higher is the population density of the community where the respondents reside, the closer to the city center they are, the better the transportation network is.
5. Conclusions
5.1. Discussion
Daily work is an important part of life, and the impact on mental health is becoming more and more significant [59,60]. Particularly after the recent global economic turmoil, the overall mental health status of residents has shown a downward trend. The World Health Organization has suggested that the financial crisis may trigger more mental health problems and even suicides. In the current economic situation, people often face a “separation of occupation and residence,” which results in longer commuting distances and higher commuting costs. This paper attempts to analyze CWB given this context and determine the factors affecting CWB and residents’ mental health. The results are described below.
- (1)
- This paper calculates the data obtained from a survey based on STS. According to the results, CWB for various travel modes in Xi’an is ordered as follows (from high to low): walking, motorcycle, electric bicycle, staff shuttle bus, bicycle, metro, driving, taxi, and bus. From the results, it can be concluded that the satisfaction of active commuters is the highest [47,61,62], and that the CWB with cars is higher than that associated with buses [63]. These results are consistent with the existing research studies. We found that the overall CWB associated with public transportation is low, with bus travel having the lowest level of CWB, which reflects the problems with public transportation in Xi’an. In the research area, except for the main urban area, public transportation is underdeveloped, and the peripheral suburbs are not tightly connected to the center of the main urban area. The density of public transport stations is low, and the coverage rate is not high. There are only three rail transit lines throughout Xi’an that are in operation. The coverage rate of bus stations in Xi’an is high for the first and second circle layers when calculated using service area radiuses of 300 m and 500 m. For the radius of 300 m, the calculated coverage rate reaches 74.2%. In the third circle layer (the main urban area circle layer), the calculated coverage rates are 49.1% and 44.5%, respectively. Coverage is even lower in the fourth circle layer. The third and fourth circle layers do not meet the construction standard. This reflects the fact that the construction of public transportation does not match the land development in the peripheral suburbs, and the travel needs of suburban residents are not being met. Moreover, although public transportation in the inner circle layers (the main urban area) is relatively well developed, under the “strong centripetal effect” caused by the land use and transportation network in the urban development process of Xi’an, buses in the inner circle layers face serious traffic congestion problems. Coupled with the often-poor service quality of the various bus operation companies, this has seriously affected CWB of public transportation.
- (2)
- The results of the SEM show that the built environment factor does not directly affect the CWB [20], but it will act on the CWB by affecting other factors. The three factors known as the travel attitude/preference, commuting mode choice, and other travel characteristics will affect each other, and will affect commute well-being directly and indirectly. The other travel characteristic factors has the greatest overall impact on commute satisfaction (−0.536) and the travel attitude/preference has the greatest direct impact (−0.426). This also shows that, in the future urban traffic management of Xi’an, management of congestion, reduced commuting time, and the number of transfers can significantly improve residents’ CWB regardless of residents’ travel attitudes/preferences.
- (3)
- Based on the influencing factors for CWB, the following conclusions can be drawn.: (a) For male residents, CWB will be higher when there are fewer restrictions on work time and respondents have greater experience with longer driving, for residents with a more complicated children shuttle mode and easier to quarrel with others, CWB will be lower. (b) From the perspective of travel characteristics, time factors will greatly affect the satisfaction, which has also been confirmed by past studies [53], and the number of transfers can also reflect the length of time spent traveling. When setting dummy variables for the commuting mode choice in this paper, it is classified, according to whether driving is required, whether the mode involves autonomy of travel, and the travel cost. The result also reflects that the CWB will drop significantly during the transition from walking to private cars. (c) From the perspective of travel attitudes/preferences, the more positive are preferences and attitudes, the higher is the CWB. However, this paper also considers the commuting mode choice by residents, and the travel modes usually have serious problems, or need to deal with a complex road environment, which leads to an increase of travel time and results in a negative impact on satisfaction. (d) From the perspective of location and the built environment, the per capita bus line length and the mean value of the global depth of the road network, and the population density in the community where respondents reside, as well as the number of bus stops within 500 m of where the respondents reside and work will significantly affect the latent variable of the built environment, and act on the travel attitudes/preferences, the commute mode choice, and other travel characteristics, which will further affect the CWB. The location factor is also significantly negatively correlated with satisfaction, which indicates that there is a significant spatial difference in CWB.
5.2. Limitations and Strengths
There are several limitations in this paper. First, we attempt to analyze the factors that affect CWB by refining the objective built environment indicators based on the existing research. However, increasing the influencing factors considered means that a large number of questionnaires are required to ensure the accuracy of the model calculations. In future research, it will be necessary to expand the sample size further to support the analysis. Second, this paper chooses a method of stratified sampling, selecting definitive residents in the community as the survey object, and it does not consider factors concerning self-selection of the residence and workplace. How these choices will affect CWB requires further analysis. Lastly, although this paper attempts to analyze the various objective indicators according to the communities in which residences or workplaces are located separately, the choice of commuting route, and factors that affect regions other than the communities at the starting and end points of journeys will also greatly affect CWB. However, this paper can only represent the communities involved in the intermediate process, outside the starting and end points of journeys, based on time elements. The effects of these regions need to be discussed in more detail in future analysis.
In addition to these limitations, this study has several strengths. First, this paper investigated two single-way commuting travel phases in the morning and evening to reflect the daily CWB, which provided fairly robust results. Second, this paper covered more comprehensive influencing factors that are both subjective and objective. All objective indicators were calculated according to both the origin and the destination to reflect the impact on daily CWB. Lastly, we considered multimodal travel modes and investigated their connecting stages in the survey.
5.3. Conclusions and Policy Recommendations
Evidence from this study provides robust support for the observation that active travel modes have the most positive health effects. In addition, we highlight our results for bus travel, which has the most negative health effects among all the travel modes. Integrated management of urban design, transport planning, and public health is needed to develop policies to increase CWB and promote green travel modes, which will enhance public health and the population’s well-being. The specific recommendations arising from the paper are as follows. (1) Expand the new center of the city to alleviate the long commute time caused by the separation of occupation and residence, and the traffic congestion caused by the centripetal traffic flow, which is also the root cause of the traffic operation problems in Xi’an and the more negative emotions of residents, and (2) implement staggered office hours to reduce the traffic pressure during peak hours. At the same time, this speeds up the construction of roads and increases the capacity of urban traffic. (3) This improves public transport facilities, rationally allocates bus lines and stations, and reduces the number of transfers. At the same time, it encourages people to take a bus or subway to reduce the number of vehicles on the road.
Author Contributions
Conceptualization, D.W., M.W., and X.C. Methodology, software, formal analysis, investigation, resources, data curation, writing—original draft preparation, visualization, D.W. Writing—review and editing, validation, D.W., M.W., and X.C. Supervision, project administration, funding acquisition, X.C.
Funding
The National Nature Science Foundation of China (No.41831284 and No.41671160) and the Fundamental Research Funds for the Central Universities, SNNU (No.18SZYB01) funded this research paper.
Acknowledgments
We would like to thank Edanz Group (www.edanzediting.com/ac) for editing and polishing the style of this manuscript. Meanwhile, we are also greatly indebted to Nan Tang and Xingchuan Gao, who have provided us with great help in this questionnaire survey.
Conflicts of Interest
The authors declare no conflicts of interest.
References
- Ettema, D.; Gärling, T.; Eriksson, L.; Friman, M.; Olsson, L.E.; Fujii, S. Satisfaction with travel and subjective well-being: Development and test of a measurement tool. Transp. Res. Part F Traffic Psychol. Behav. 2011, 14, 167–175. [Google Scholar] [CrossRef]
- Abou-Zeid, M.; Witter, R.; Bierlaire, M.; Kaufmann, V.; Ben-Akiva, M. Happiness and travel mode switching: Findings from a Swiss public transportation experiment. Transp. Policy 2012, 19, 93–104. [Google Scholar] [CrossRef]
- Friman, M.; Fujii, S.; Ettema, D.; Gärling, T.; Olsson, L.E. Psychometric analysis of the satisfaction with travel scale. Transp. Res. Part A Policy Pract. 2013, 48, 132–145. [Google Scholar] [CrossRef]
- Susiloa, Y.O.; Catsa, O. Exploring key determinants of travel satisfaction for multi-modal trips by different traveler groups. Transp. Res. Part A Policy Pract. 2014, 67, 366–380. [Google Scholar] [CrossRef]
- Aydin, N.; Celik, E.; Gumus, A.T. A hierarchical customer satisfaction framework for evaluating rail transit systems of Istanbul. Transp. Res. Part A Policy Pract. 2015, 77, 61–81. [Google Scholar] [CrossRef]
- De Vos, J.; Schwanen, T.; Van Acker, V.; Witlox, F. Travel and subjective well-being: A focus on findings, methods and future research needs. Transp. Rev. 2013, 33, 421–442. [Google Scholar] [CrossRef]
- Ettema, D.; Gärling, T.; Olsson, L.E.; Friman, M. Out-of-home activities, daily travel, and subjective well-being. Transp. Res. Part A Policy Pract. 2010, 44, 723–732. [Google Scholar] [CrossRef]
- Diener, E.; Chan, M.Y. Happy People Live Longer: Subjective Well-Being Contributes to Health and Longevity. Appl. Psychol. Health Well Being 2011, 3, 1–43. [Google Scholar] [CrossRef]
- Roberts, J.; Hodgson, R.; Dolan, P. “It’s driving her mad”: Gender differences in the effects of commuting on psychological health. J. Health Econ. 2011, 30, 1064–1076. [Google Scholar] [CrossRef] [PubMed]
- Cao, J. The association between light rail transit and satisfactions with travel and life: Evidence from Twin Cities. Transportation 2013, 40, 921–933. [Google Scholar] [CrossRef]
- Ettema, D.; Friman, M.; Gärling, T.; Olsson, L.E.; Fujii, S. How in-vehicle activities affect work commuters’ satisfaction with public transport. J. Transp. Geogr. 2012, 24, 215–222. [Google Scholar] [CrossRef]
- Gatersleben, B.; Uzzell, D. Affective appraisals of the daily commute—Comparing perceptions of drivers, cyclists, walkers, and users of public transport. Environ. Behav. 2007, 39, 416–431. [Google Scholar] [CrossRef]
- Mokhtarian, P.L.; Papon, F.; Goulard, M.; Diana, M. What makes travel pleasant and/or tiring? An investigation based on the French National Travel Survey. Transportation 2015, 42, 1103–1128. [Google Scholar] [CrossRef]
- Olsson, L.E.; Gärling, T.; Ettema, D.; Friman, M.; Fujii, S. Happiness and Satisfaction with Work Commute. Soc. Indic Res. 2013, 111, 255–263. [Google Scholar] [CrossRef] [PubMed]
- Friman, M.; Gärling, T.; Ettema, D.; Olsson, L.E. How does travel affect emotional well-being and life satisfaction? Transp. Res. Part A Policy Pract. 2017, 106, 170–180. [Google Scholar] [CrossRef]
- Cao, J.; Ettema, D. Satisfaction with travel and residential self-selection: How do preferences moderate the impact of the Hiawatha Light Rail Transit line? J. Transp. Land Use 2014, 7, 93–108. [Google Scholar] [CrossRef]
- De Vos, J.; Mokhtarian, P.L.; Schwanen, T.; Van Acker, V.; Witlox, F. Travel mode choice and travel satisfaction: Bridging the gap between decision utility and experienced utility. Transportation 2016, 43, 771–796. [Google Scholar] [CrossRef]
- Manaugh, K.; El-Geneidy, A.M. Does distance matter? Exploring the links among values, motivations, home location, and satisfaction in walking trips. Transp. Res. Part A Policy Pract. 2013, 50, 198–208. [Google Scholar] [CrossRef]
- St-Louis, E.; Manaugh, K.; Van Lierop, D.; El-Geneidy, A. The happy commuter: A comparison of commuter satisfaction across modes. Transp. Res. Part F Traffic Psychol. Behav. 2014, 26, 160–170. [Google Scholar] [CrossRef]
- Ye, R.N.; Titheridge, H. Satisfaction with the commute: The role of travel mode choice, built environment and attitudes. Transp. Res. Part D Transp. Environ. 2017, 52, 535–547. [Google Scholar] [CrossRef]
- Gabriele, G.; Francesco, M.; Javier, F.P.; Giulio, A.; Nicola, M. Expatriates’ Multiple Fears, from Terrorism to Working Conditions: Development of a Model. Front. Psychol. 2016, 7. [Google Scholar] [CrossRef]
- Mucci, N.; Traversini, V.; Giorgi, G.; Garzaro, G.; Fiz-Perez, J.; Campagna, M.; Rapisarda, V.; Tommasi, E.; Montalti, M.; Arcangeli, G. Migrant Workers and Physical Health: An Umbrella Review. Sustainability 2019, 11, 232. [Google Scholar] [CrossRef]
- Diener, E. Subjective well-being. Psychol. Bull. 1984, 95, 542–575. [Google Scholar] [CrossRef] [PubMed]
- Ettema, D.; Gärling, T.; Olsson, L.E.; Friman, M.; Moerdijk, S. The road to happiness: Measuring Dutch car drivers’ satisfaction with travel. Transp. Policy 2013, 27, 171–178. [Google Scholar] [CrossRef]
- Cervero, R.; Kockelman, K. Travel demand and the 3Ds: Density, diversity, and design. Transp. Res. Part D Transp. Environ. 1997, 2, 199–219. [Google Scholar] [CrossRef]
- Mercado, R.; Páez, A. Determinants of distance traveled with a focus on the elderly: A multilevel analysis in the Hamilton CMA, Canada. J. Transp. Geogr. 2009, 17, 65–76. [Google Scholar] [CrossRef]
- Koohsari, M.J.; Kaczynski, A.T.; Mcormack, G.R.; Sugiyama, T. Using Space Syntax to Assess the Built Environment for Physical Activity: Applications to Research on Parks and Public Open Spaces. Leis. Sci. 2014, 36, 206–216. [Google Scholar] [CrossRef]
- Koohsari, M.J.; Owen, N.; Cerin, E.; Giles-Corti, B.; Sugiyama, T. Walkability and walking for transport: Characterizing the built environment using space syntax. Int. J. Behav. Nutr. Phys. Act. 2016, 13, 121. [Google Scholar] [CrossRef] [PubMed]
- Feng, C.M.; Hsieh, C.H. Implications of Transport Diversity for Quality of Life. J. Urban Plan. Dev. ASCE 2009, 135, 13–18. [Google Scholar] [CrossRef]
- Boarnet, M.; Crane, R. The influence of land use on travel behavior: Specification and estimation strategies. Transp. Res. Part A Policy Pract. 2001, 35, 823–845. [Google Scholar] [CrossRef]
- Ewing, R.; Cervero, R. Travel and the built environment—A synthesis. Land Dev. Public Involv. Transp. 2001, 87–114. [Google Scholar] [CrossRef]
- Dieleman, F.M.; Dijst, M.; Burghouwt, G. Urban form and travel behaviour: Micro-level household attributes and residential context. Urban Stud. 2002, 39, 507–527. [Google Scholar] [CrossRef]
- Kenworthy, J.R.; Laube, F.B. Patterns of automobile dependence in cities: an international overview of key physical and economic dimensions with some implications for urban policy. Transp. Res. Part A 1999, 33, 691–723. [Google Scholar] [CrossRef]
- Boehmer, T.K.; Hoehner, C.M.; Deshpande, A.D.; Brennan Ramirez, L.K.; Brownson, R.C. Perceived and observed neighborhood indicators of obesity among urban adults. Int. J. Obes. 2007, 31, 968–977. [Google Scholar] [CrossRef] [PubMed] [Green Version]
- Schwanen, T.; Dijst, M.; Dieleman, F.M. A microlevel analysis of residential context and travel time. Environ. Plan. A 2002, 34, 1487–1507. [Google Scholar] [CrossRef]
- Newman, P.W.G.; Kenworthy, J.R. Gasoline Consumption and Cities: A Comparison of U.S. Cities with a Global Survey. J. Am. Plan. Assoc. 1989, 55, 24–37. [Google Scholar] [CrossRef]
- Cervero, R.; Radisch, C. Travel choices in pedestrian versus automobile oriented neighborhoods. Transp. Policy 1996, 3, 127–141. [Google Scholar] [CrossRef] [Green Version]
- Kitamura, R.; van der Hoorn, M.; Wijk, F. A Comparative Analysis of Daily Time Use and the Development of an Activity-Based Traveller Benefit Measure. Pharm. Biol. 1997, 38, 40–45. [Google Scholar]
- Rydin, Y.; Bleahu, A.; Davies, M.; Davila, J.D.; Friel, S.; De Grandis, G.; Groce, N.; Hallal, P.C.; Hamilton, I.; Howden-Chapman, P.; et al. Shaping cities for health: Complexity and the planning of urban environments in the 21st century. Lancet 2012, 379, 2079–2108. [Google Scholar] [CrossRef]
- Bocarejo S., J.P.; Oviedo H., D.R. Transport accessibility and social inequities: A tool for identification of mobility needs and evaluation of transport investments. J. Transp. Geogr. 2012, 24, 142–154. [Google Scholar] [CrossRef]
- Wallace, R.; Hughes-Cromwick, P.; Mull, H.; Khasnabis, S. Access to health care and nonemergency medical transportation—Two missing links. Manag. Public Policy 2005, 2005, 76–84. [Google Scholar] [CrossRef]
- Ewing, R.; Cervero, R. Travel and the built environment: A meta-analysis. J. Am. Plan. Assoc. 2010, 76, 265–294. [Google Scholar] [CrossRef]
- Pucher, J.; Buehler, R.; Bassett, D.R.; Dannenberg, A.L. Walking and cycling to health: A comparative analysis of city, state, and international data. Am. J. Public Health 2010, 100, 1986–1992. [Google Scholar] [CrossRef] [PubMed]
- Bassett, D.R.; Pucher, J.; Buehler, R.; Thompson, D.L.; Crouter, S.E. Walking, cycling, and obesity rates in Europe, North America, and Australia. J. Phys. Act. Health 2008, 5, 795–814. [Google Scholar] [CrossRef] [PubMed]
- Acker, V.V.; Wee, B.V.; Witlox, F. When Transport Geography Meets Social Psychology: Toward a Conceptual Model of Travel Behaviour. Transp. Rev. 2010, 30, 219–240. [Google Scholar] [CrossRef] [Green Version]
- Ory, D.T.; Mokhtarian, P.L. When is getting there half the fun? Modeling the liking for travel. Transp. Res. Part A Policy Pract. 2005, 39, 97–123. [Google Scholar] [CrossRef] [Green Version]
- Paez, A.; Whalen, K. Enjoyment of commute: A comparison of different transportation modes. Transp. Res. Part A Policy Pract. 2010, 44, 537–549. [Google Scholar] [CrossRef]
- Dobson, R.; Dunbar, F.; Smith, C.J.; Reibstein, D.; Lovelock, C. Structural models for the analysis of traveler attitude-behavior relationships. Transportation 1978, 7, 351–363. [Google Scholar] [CrossRef]
- Golob, T.F.; Regan, A.C. Impacts of highway congestion on freight operations: Perceptions of trucking industry managers. Transp. Res. Part A Policy Pract. 2001, 35, 577–599. [Google Scholar] [CrossRef]
- Van, H.T.; Choocharukul, K.; Fujii, S. The effect of attitudes toward cars and public transportation on behavioral intention in commuting mode choice-A comparison across six Asian countries. Transp. Res. Part A Policy Pract. 2014, 69, 36–44. [Google Scholar] [CrossRef]
- Tardiff, T.J. Causal inferences involving transportation attitudes and behavior. Transp. Res. 1977, 11, 397–404. [Google Scholar] [CrossRef]
- Browne, M.W.; Cudeck, R. Alternative Ways of Assessing Model Fit. Sociol. Methods Res. 1992, 21, 230–258. [Google Scholar] [CrossRef]
- Higgins, C.D.; Sweet, M.N.; Kanaroglou, P.S. All minutes are not equal: Travel time and the effects of congestion on commute satisfaction in Canadian cities. Transportation 2017, 1–20. [Google Scholar] [CrossRef]
- Organization, W.H. Health Effects of Transport-Related Air Pollution; World Health Organization Regional Office for Europe: Copenhagen, Denmark, 2005. [Google Scholar]
- Lusk, A.C.; Morency, P.; Miranda-Moreno, L.F.; Willett, W.C.; Dennerlein, J.T. Bicycle guidelines and crash rates on cycle tracks in the United States. Am. J. Public Health 2013, 103, 1240–1248. [Google Scholar] [CrossRef] [PubMed]
- World Health Organization. Global Status Report on Road Safety 2013: Supporting a Decade of Action: Summary; WHO: Geneva, Switzerland, 2013. [Google Scholar]
- Novaco, R.W.; Stokols, D.; Milanesi, L. Objective and subjective dimensions of travel impedance as determinants of commuting stress. Am. J. Community Psychol. 1990, 18, 231–257. [Google Scholar] [CrossRef] [PubMed] [Green Version]
- Novaco, R.W.; Gonzalez, O.I. Commuting and well-being. In Technology and Psychological Well-being; Amichai-Hamburger, Y., Ed.; Cambridge University Press: Cambridge, UK, 2009; pp. 174–205. [Google Scholar]
- Gabriele, G.; Giulio, A.; Nicola, M.; Vincenzo, C. Economic stress in the workplace: The impact of fear of the crisis on mental health. Work 2015, 51, 135–142. [Google Scholar]
- Mucci, N.; Giorgi, G.; Roncaioli, M.; Perez, J.F.; Arcangeli, G. The correlation between stress and economic crisis: A systematic review. Neuropsychiatr. Dis. Treat. 2016, 12, 983–993. [Google Scholar] [CrossRef] [PubMed]
- Turcotte, M. Like commuting? Workers’ perceptions of their daily commute. Can. Soc. Trends 2006, 82, 35–40. [Google Scholar]
- Turcotte, M. Commuting to work: Results of the 2010 general social survey. Can. Soc. Trends 2011, 92, 25–36. [Google Scholar]
- Eriksson, L.; Friman, M.; Gärling, T. Perceived attributes of bus and car mediating satisfaction with the work commute. Transp. Res. Part A Policy Pract. 2013, 47, 87–96. [Google Scholar] [CrossRef]
Figure 1.
Research area. (a) Location map of Xi’an. (b) Locations’ distribution of home and job of the samples.
Figure 1.
Research area. (a) Location map of Xi’an. (b) Locations’ distribution of home and job of the samples.
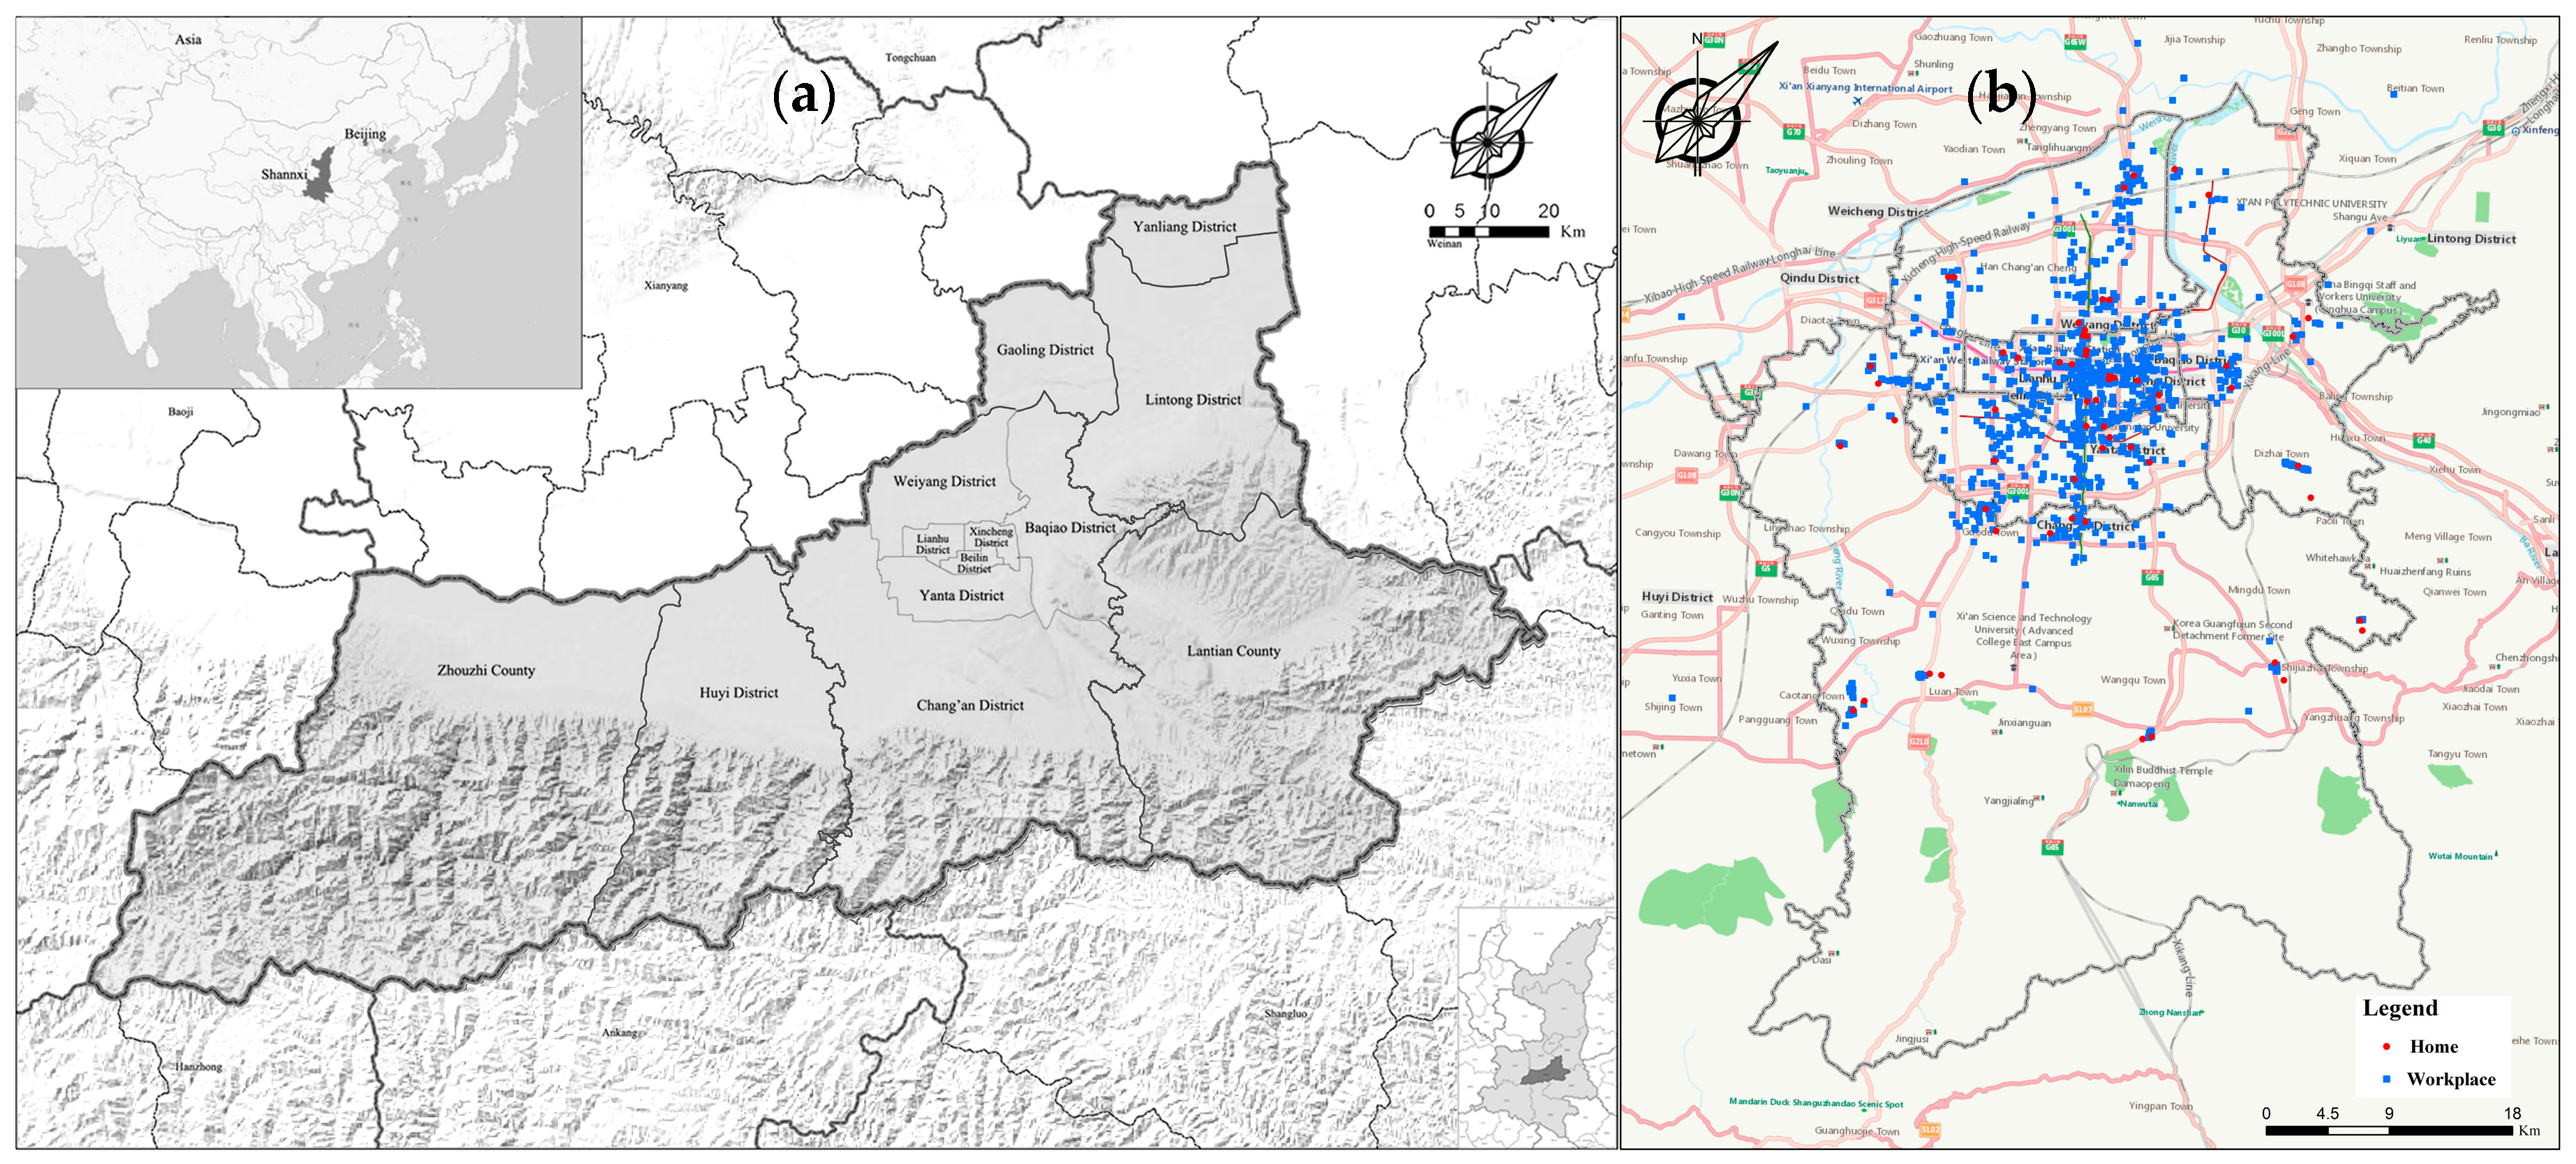
Figure 2.
Theoretical framework of daily commute well-being.

Figure 3.
Initial model structure (a) and modified model structure (b).

Figure 4.
Total effects, direct effects, and indirect effects of latent variables (standardized).


Table 1.
Sample characteristics and dummy variable setting.
| Socio-Demographics | Dummy Variable | Percentage | Socio-Demographics | Dummy Variable | Percentage |
|---|---|---|---|---|---|
| Gender | Personal character 1 | ||||
| Female | 0 | 51.12 | More critical, easy to quarrel with others: Strongly disagree to strongly agree (1 to 7) | 1 | 9.19 |
| Male | 1 | 48.88 | 2 | 52.18 | |
| Education level | 3 | 9.26 | |||
| Junior high school or less | 1 | 21.36 | 4 | 20.24 | |
| High school or higher vocational education | 2 | 34.06 | 5 | 6.08 | |
| College and undergraduate | 3 | 38.69 | 6 | 2.71 | |
| Master and above | 4 | 5.89 | 7 | 0.33 | |
| Age | Personal character 2 | ||||
| 16–20 | 1 | 2.84 | Good self-control ability: Strongly disagree to strongly agree (1 to 7) | 1 | 0.73 |
| 21–30 | 2 | 26.98 | 2 | 3.31 | |
| 31–40 | 3 | 30.95 | 3 | 5.36 | |
| 41–50 | 4 | 20.97 | 4 | 25.46 | |
| 51–60 | 5 | 16.01 | 5 | 31.28 | |
| 61–65 | 6 | 2.25 | 6 | 29.10 | |
| 7 | 4.76 | ||||
| Job status | Personal character 3 | ||||
| State organs, party, and mass organizations | 1 | 3.51 | More impetuous: Strongly disagree to strongly agree (1 to 7) | 1 | 3.37 |
| State-owned enterprises and institutions | 2 | 16.87 | 2 | 20.83 | |
| Employees of private and foreign enterprises | 3 | 21.10 | 3 | 10.98 | |
| Individual operators | 4 | 25.20 | 4 | 38.89 | |
| Professional | 5 | 22.09 | 5 | 16.01 | |
| Urban migrant workers | 6 | 11.24 | 6 | 9.33 | |
| 7 | 0.60 | ||||
| Monthly income | Personal character 4 | ||||
| Lower middle income | 1 | 15.87 | More introverted and reserved: Strongly disagree to strongly agree (1 to 7) | 1 | 3.31 |
| Middle income | 2 | 23.61 | 2 | 18.58 | |
| Upper-middle-income | 3 | 43.72 | 3 | 16.87 | |
| Revenue | 4 | 16.80 | 4 | 27.38 | |
| Driving license status | 5 | 18.98 | |||
| No driver’s license | 0 | 45.04 | 6 | 13.69 | |
| Less than 3 years | 1 | 11.97 | 7 | 1.19 | |
| 3–5 years | 2 | 19.84 | Personal character 5 | ||
| 6–10 years | 3 | 14.22 | More easygoing and calm: Strongly disagree to strongly agree (1 to 7) | 1 | 0.79 |
| More than 10 years | 4 | 8.93 | 2 | 1.59 | |
| Shuttle mode | 3 | 3.97 | |||
| No school-age children | 0 | 73.94 | 4 | 24.07 | |
| On the way | 1 | 5.16 | 5 | 33.20 | |
| out of the way | 2 | 5.56 | 6 | 31.55 | |
| Special shuttle | 3 | 15.34 | 7 | 4.83 |
Table 2.
List of built environment variables.
| Category | Variable Name | Variable Calculation Method |
|---|---|---|
| Location | Population density circle layer | Four population structure circle layers were formed through cluster analysis on 80 street offices based on the population data of the study area in 2016. |
| Land use | Land use diversity index, landmix | , the community in which the sample resides is the basic unit, ranging from 0 to 1 [25,26] |
| Density | Population and employment density, pop_d | The ratio of the sum of the community population and the number of jobs to the total land area of the individual’s place of residence, unit of measurement: person/km2 |
| Transit network | Number of stations accessible by bus, pro | The number of bus stops within 500 m around the sample point |
| Bus line density, pubm | The density of bus lines within 500 m around the sample point | |
| Bus stop density, bus_d | The ratio of the number of bus stops to the area of the community in which the samples were taken | |
| Per capita length of the bus lines, bus_l | The ratio of the length of the bus lines to the population (the sum of the resident population and the employed population) of the community in which the samples were taken, in m/person | |
| Road network | Mean value of connectivity, Connec | The mean values of connectivity, control points, mean depth, global and local integration, and global and local depth of the road network were calculated using the Axwoman program [27], based on the community in which the survey respondents lived or worked as the basic unit |
| Mean value of control point, Contro | ||
| Mean value of depth, MeanDe | ||
| Mean value of global integration, GInteg | ||
| Mean value of local integration, LInteg | ||
| Mean value of global depth, TotalD | ||
| Mean value of local depth, LocalD | ||
| Per capita network length, net_p | The ratio of the length of the road network to the population of the community (the sum of the resident population and the employed population) was calculated using the community in which the respondents resided as the basic unit, unit of measurement: m/person | |
| Walking (cycling) condition, ssw | SSW = z[z (gross population density) + 2 × z (integration)], walking (cycling) condition was calculated using the community in which the samples resides as the basic unit [28] | |
| Road network density, road_d | Street road network length /total area of community, unit of measurement: km/km2 | |
| Facility configuration | Traffic pattern diversity, H | , the availability of private cars, buses, subways, bicycles, and electric vehicles (including motorcycles) were calculated based on the community and family in which the respondents resided as the basic unit, ranges from 0 to 1 [29] |
| Parking facility, park | Parking at an unreserved parking space in the residential area/unit roadside = 1, parking at other parking lots surrounding the residential area/unit = 2, parking at reserved parking space in the residential area/unit roadside = 3, parking at an underground garage in the residential area/unit = 4 |
Table 3.
List of other variables.
| Category | Variable Name | Variable Calculation Method |
|---|---|---|
| Travel characteristics | Overall commute time, congestion time, commuting cost, transfer times, and waiting time | Questionnaire |
| Travel attitude/preference | Commuter mode intention
| Questionnaire |
Factors for choosing commuting mode
| Questionnaire | |
Personal opinion
| Questionnaire (“from strongly disagree to strongly agree” according to the 7-point Likert scale) | |
Influence by others
| ||
Relevant perception
| ||
Behavioral tendency
| ||
| Socio-demographics | Age, gender, occupation, education, personality, family composition (whether there are school-age children, whether they need to pick up, school-age children shuttle mode) | Questionnaire |
Table 4.
Commute satisfaction by modes.
| Mode | N | Mean | S.D. | ||
|---|---|---|---|---|---|
| Walk | 345 | 0.97 | 0.79 | ||
| Taxi | 9 | 0.22 | 0.86 | ||
| Scheduled bus | 16 | 0.48 | 0.97 | ||
| Metro | 156 | 0.37 | 0.75 | ||
| Electric bicycle | 175 | 0.53 | 0.80 | ||
| Bus | 364 | 0.06 | 0.64 | ||
| Motorbike | 5 | 0.72 | 0.71 | ||
| Drive | 283 | 0.32 | 0.80 | ||
| Bicycle | 159 | 0.45 | 0.88 | ||
| Total | 1512 | 0.45 | 0.83 | ||
| ANOVA | Sum of Squares | df | MS | F | p-value |
| Between groups | 156.95 | 8.00 | 19.62 | 33.05 | 0.00 |
| Within groups | 892.32 | 1503.00 | 0.59 | ||
| Total | 1049.27 | 1511.00 |
Table 5.
Regression analysis of satisfaction with the commute.
| Unstandardized Coefficients | Standardized Coefficients | t | p | VIF | ||
|---|---|---|---|---|---|---|
| B | Standard Error | Beta | ||||
| constant | 0.664 | 0.216 | - | 3.070 | 0.002 *** | - |
| gen | 0.074 | 0.038 | 0.044 | 1.923 | 0.055 * | 1.180 |
| job | 0.040 | 0.015 | 0.065 | 2.623 | 0.009 *** | 1.369 |
| shuttle_m | −0.036 | 0.016 | −0.049 | −2.185 | 0.029 ** | 1.096 |
| lic | 0.054 | 0.016 | 0.091 | 3.373 | 0.001 *** | 1.599 |
| Layer | −0.097 | 0.020 | −0.128 | −4.802 | 0.000 *** | 1.577 |
| chara1 | −0.034 | 0.015 | −0.050 | −2.273 | 0.023 ** | 1.084 |
| mode | −0.069 | 0.021 | −0.112 | −3.328 | 0.001 *** | 2.515 |
| actual_t | −0.048 | 0.019 | −0.097 | −2.510 | 0.012 ** | 3.340 |
| cong_t | −0.071 | 0.034 | −0.080 | −2.077 | 0.038 ** | 3.323 |
| cau1_2 | 0.147 | 0.074 | 0.045 | 1.986 | 0.047 ** | 1.119 |
| cau1_3 | −0.134 | 0.041 | −0.075 | −3.273 | 0.001 *** | 1.153 |
| cau1_5 | −0.133 | 0.045 | −0.067 | −2.952 | 0.003 *** | 1.151 |
| cau1_8 | −0.111 | 0.042 | −0.066 | −2.654 | 0.008 *** | 1.364 |
| time_s | 0.106 | 0.036 | 0.086 | 2.944 | 0.003 *** | 1.876 |
| view2 | 0.054 | 0.016 | 0.092 | 3.373 | 0.001 *** | 1.657 |
| perc1 | 0.051 | 0.018 | 0.092 | 2.810 | 0.005 *** | 2.359 |
| incli1 | 0.080 | 0.018 | 0.143 | 4.508 | 0.000 *** | 2.236 |
| trans2 | −0.078 | 0.037 | −0.051 | −2.094 | 0.036 ** | 1.299 |
| Opro | −0.296 | 0.087 | −0.085 | −3.394 | 0.001 *** | 1.376 |
| Dpro | −0.272 | 0.100 | −0.063 | −2.721 | 0.007 *** | 1.193 |
| Obus_l | 0.359 | 0.140 | 0.058 | 2.571 | 0.010 ** | 1.118 |
| O_TotD | −0.581 | 0.142 | −0.092 | −4.095 | 0.000 *** | 1.125 |
| Opop_d | −0.433 | 0.124 | −0.087 | −3.498 | 0.000 *** | 1.354 |
D-W: 1.610, * p < 0.10 ** p < 0.05 *** p < 0.01, R2 = 0.328, Adjust R2 = 0.317, F = 31.551.
Table 6.
Structural equation model results.
| S.E. | C.R. | Standardized Estimate | |||
|---|---|---|---|---|---|
| Travel preference | <--- | chara1 | 0.002 | 1.512 | 0.045 |
| Other travel characteristic | <--- | chara1 | 0.004 | −0.066 | −0.002 |
| Commute mode choice | <--- | chara1 | 0.024 | 2.946 | 0.065 *** |
| Commute well-being | <--- | chara1 | 0.017 | −2.811 | −0.072 *** |
| Built environment | <--- | chara1 | 0.001 | −3.548 | −0.173 *** |
| Travel preference | <--- | lic | 0.007 | −4.451 | −0.529 *** |
| Other travel characteristic | <--- | lic | 0.007 | −0.708 | −0.028 |
| Commute mode choice | <--- | lic | 0.033 | 1.852 | 0.063 * |
| Commute well-being | <--- | lic | 0.021 | 1.967 | 0.069 ** |
| Built environment | <--- | lic | 0.001 | −0.789 | −0.037 |
| Travel preference | <--- | shuttle_m | 0.002 | −0.976 | −0.030 |
| Other travel characteristic | <--- | shuttle_m | 0.006 | −4.562 | −0.122 *** |
| Commute mode choice | <--- | shuttle_m | 0.031 | 1.201 | 0.031 |
| Commute well-being | <--- | shuttle_m | 0.018 | −3.386 | −0.082 *** |
| Built environment | <--- | shuttle_m | 0.001 | 1.868 | 0.067 * |
| Travel preference | <--- | job | 0.002 | 2.621 | 0.102 *** |
| Other travel characteristic | <--- | job | 0.006 | 5.694 | 0.190 *** |
| Commute mode choice | <--- | job | 0.024 | −0.097 | −0.002 |
| Commute well-being | <--- | job | 0.016 | 2.753 | 0.075 *** |
| Built environment | <--- | job | 0.001 | 2.810 | 0.144 *** |
| Travel preference | <--- | gen | 0.005 | 0.670 | 0.019 |
| Other travel characteristic | <--- | gen | 0.011 | −1.172 | −0.028 |
| Commute mode choice | <--- | gen | 0.056 | 1.422 | 0.030 |
| Commute well-being | <--- | gen | 0.041 | 2.534 | 0.063 ** |
| Built environment | <--- | gen | 0.002 | 2.332 | 0.099 ** |
| SWT1 | <--- | Commute well-being | 0.953 | ||
| SWT2 | <--- | Commute well-being | 0.028 | 35.607 | 0.961 *** |
| O_TotD | <--- | Built environment | 0.158 | ||
| Obus_l | <--- | Built environment | 0.391 | 3.997 | 0.244 *** |
| Dpro | <--- | Built environment | 0.881 | −4.347 | −0.414 *** |
| Opro | <--- | Built environment | 1.307 | −4.531 | −0.523 *** |
| Opop_d | <--- | Built environment | 1.011 | −4.527 | −0.576 *** |
| cau1_3 | <--- | Travel preference | 0.180 | ||
| cau1_5 | <--- | Travel preference | 0.231 | −4.802 | −0.218 *** |
| cau1_8 | <--- | Travel preference | 0.57 | 4.545 | 0.439 *** |
| cau1_2 | <--- | Travel preference | 0.093 | 1.091 | 0.034 |
| time_s | <--- | Travel preference | 0.479 | 1.813 | −0.106 * |
| view2 | <--- | Travel preference | 2.232 | −5.149 | −0.676 *** |
| perc1 | <--- | Travel preference | 2.881 | −5.225 | −0.850 *** |
| trans2 | <--- | Other travel characteristics | 0.427 | ||
| actual_t | <--- | Other travel characteristics | 0.446 | 14.757 | 0.895 *** |
| cong_t | <--- | Other travel characteristics | 0.235 | 16.140 | 0.931 *** |
| incli1 | <--- | Travel preference | 2.363 | −5.162 | −0.695 *** |
| Layer | <--- | Built environment | 8.74 | 4.571 | 0.758 *** |
| Travel preference | <--- | Built environment | 0.425 | 2.799 | 0.298 *** |
| Other travel characteristics | <--- | Built environment | 0.828 | 3.505 | 0.262 *** |
| Commute well-being | <--- | Built environment | 2.327 | −0.049 | −0.003 |
| Commute well-being | <--- | Other travel characteristics | 0.367 | −1.983 | −0.204 ** |
| Other travel characteristics | <--- | Travel preference | 0.418 | −1.927 | −0.291 * |
| Commute well-being | <--- | Travel preference | 1.025 | −4.100 | −0.426 *** |
| Commute mode choice | <--- | Travel preference | 1.303 | −5.058 | −0.413 *** |
| Commute well-being | <--- | Commute mode choice | 0.059 | −1.68 | −0.159 * |
| Commute mode choice | <--- | Built environment | 3.098 | 1.776 | 0.086 * |
| Other travel characteristic | <--- | Commute mode choice | 0.013 | 4.676 | 0.352 *** |
| Commute mode choice | <--- | Other travel characteristic | 0.438 | 10.586 | 0.804 *** |
| Built environment | <--- | Travel preference | 0.036 | −2.578 | −0.370 ** |
| Built environment | <--- | Other travel characteristic | 0.011 | 2.273 | 0.269 ** |
| Travel preference | <--- | Other travel characteristic | 0.048 | 3.055 | 0.408 *** |
| Travel preference | <--- | Commute mode choice | 0.012 | 2.632 | 0.522 *** |
| Built environment | <--- | Commute mode choice | 0.002 | −2.224 | −0.223 ** |
| Other travel characteristics | <--- | Commute well-being | 0.015 | 0.276 | 0.015 |
| Travel preference | <--- | Commute well-being | 0.007 | −1.499 | −0.102 |
| Commute mode choice | <--- | Commute well-being | 0.176 | −0.585 | −0.064 |
| Built environment | <--- | Commute well-being | 0.003 | 2.209 | 0.244 |
Model Fit: CMIN/DF = 4.238, GFI = 0.960, RMSEA = 0.046, NFI = 0.932, TLI = 0.914, CFI = 0.947, * p < 0.10, ** p < 0.05, *** p < 0.01.
Table 7.
Current situation of the network in different population circle layers.
| Layers | Network | Main Street | Secondary Main Street | |||
|---|---|---|---|---|---|---|
| Length (km) | Density (km/km2) | Length (km) | Density (km/km2) | Length (km) | Density (km/km2) | |
| The first layer | 104.12 | 7.95 | 17.14 | 1.31 | 8.10 | 0.62 |
| The second layer | 370.93 | 4.87 | 68.19 | 0.90 | 43.52 | 0.57 |
| The third layer | 1009.60 | 5.40 | 99.60 | 0.53 | 119.18 | 0.64 |
| The fourth layer | 1870.90 | 2.20 | 583.23 | 0.37 | 334.08 | 0.21 |
© 2019 by the authors. Licensee MDPI, Basel, Switzerland. This article is an open access article distributed under the terms and conditions of the Creative Commons Attribution (CC BY) license (http://creativecommons.org/licenses/by/4.0/).
Share and Cite
MDPI and ACS Style
Wei, D.; Cao, X.; Wang, M. What Determines the Psychological Well-Being during Commute in Xi’an: The Role of Built Environment, Travel Attitude, and Travel Characteristics. Sustainability 2019, 11, 1328. https://doi.org/10.3390/su11051328
AMA Style
Wei D, Cao X, Wang M. What Determines the Psychological Well-Being during Commute in Xi’an: The Role of Built Environment, Travel Attitude, and Travel Characteristics. Sustainability. 2019; 11(5):1328. https://doi.org/10.3390/su11051328
Chicago/Turabian StyleWei, Dong, Xiaoshu Cao, and Miaomiao Wang. 2019. "What Determines the Psychological Well-Being during Commute in Xi’an: The Role of Built Environment, Travel Attitude, and Travel Characteristics" Sustainability 11, no. 5: 1328. https://doi.org/10.3390/su11051328
Note that from the first issue of 2016, this journal uses article numbers instead of page numbers. See further details here.