A System of Shared Autonomous Vehicles Combined with Park-And-Ride in Residential Areas


1
Graduate School of Engineering, Nagoya University, Nagoya 4648601, Japan
2
Institute of Materials and Systems for Sustainability, Nagoya University, Nagoya 4648601, Japan
*
Author to whom correspondence should be addressed.
Sustainability 2019, 11(11), 3113; https://doi.org/10.3390/su11113113
Submission received: 28 April 2019
/
Revised: 15 May 2019
/
Accepted: 28 May 2019
/
Published: 2 June 2019
(This article belongs to the Special Issue Smart Mobility for Future Cities)
Abstract
:As suburbanization and unprecedented population aging are converging, enhanced personal mobility for suburban residents is required. In this study, a collaborative scheme involving park-and-ride services associated with public transport and a shared autonomous vehicle system are proposed. Two residential areas in the Nagoya metropolitan region, Japan, are considered: a residential area at the outer edge of a subway line and a commuter town with a nearby railway station. Three user groups are assumed: park-and-ride commuters who park shared autonomous vehicles at the station and take the train to their workplaces; inbound commuters who disembark from trains at the station and use the vehicles to reach their workplaces within the target area; and elderly and disabled residents, who use shared autonomous vehicles for trips within the target area. The system performance is investigated through agent-based simulation. The results suggest that, in the edge case, approximately 400 shared autonomous vehicles can facilitate more than 10,000 trips at an appropriate level of service. For the commuter town, fewer than 400 vehicles can provide rapid responses with a wait time of approximately 5 min for more than 5000 trips per day. Thus, the proposed system can feasibly provide a quick response service.
1. Introduction
Increased suburban sprawl and population aging is having two main effects. First, suburban areas are attracting more residents [1] and, thus, the number of urbanites relying upon suburban transport systems is increasing. Second, the global population is aging [2], and the corresponding deterioration of personal mobility is becoming a significant and unavoidable problem. In the context of increasing traffic problems in suburban areas and deterioration of the personal mobility of elderly people, two possible solutions can be proposed: the use of park-and-ride (P&R) schemes suited to suburban residential areas and use of autonomous vehicles (AVs), which may greatly advance accessibility [3] for individuals. P&R schemes encourage out-of-town parking with entry into the town via public transport. This approach has been shown to reduce congestion in some countries [4] and offers real benefits to motorists [5]. In regards to AVs, as this technology continues to advance, such vehicles can potentially benefit both metropolitan areas [3,6,7] and individuals [3,8]. From the user perspective, AVs can greatly advance accessibility [3] and offer a less stressful and safe service [8]. Form the metropolitan perspective, the improved accessibility provided by an AV system can provide benefits of city sprawl [3,9], reducing parking demands [7] and labor costs [6].
Crossovers already exist between AVs and public transport [6], AVs and implementation [10,11,12,13], and P&R and public transport [14,15]. In the study of reference [6], an integrated AV and public transportation system in Singapore was proposed and simulated. Compared with the bus-only system in terms of average out-of-vehicle time and PCU-kilometers traveled, the results showed that the integrated system has the potential ability to enhance service quality and use bus services more efficiently. As for the implementation, reference [10] explored the AVs’ benefits, costs, and impacts on transportation planning issues. In addition, references [11,12] introduced a replacement of conventional vehicles by autonomous vehicles in Berlin and used a large-scale taxi simulation. Reference [11] investigated the potential services region and the influence on overall traffic. Reference [12] also found that it is possible to replace the demand for 1.1 million private cars with 90,000–110,000 taxis. In addition, the average waiting time and minimum fleet size are utilized as the relevant service criteria in the research of reference [11] and reference [12]. Similarly, reference [13] replaced taxis with autonomous vehicles and tested its potential benefits by using simulated two sharing strategies in an agent-based simulation. Shaheen et al. have presented a systematic framework for a P&R-based car-sharing system in references [14,15], which has motivated this work. In the research, a variety of research methods have been used including interviews, questionnaires, and travel diaries to collect its commute travel effect.
However, there are insufficient schemes involving collaboration between AVs and P&R. Hence the aims of the present study are the following:
- To envision and analyze an AV-based public-transport combined shared system for suburban residential areas;
- To verify the effectiveness of the conceived system for suburban users in terms of the level of service (LOS) and system efficiency, as indicated by the minimum fleet size, wait times, etc.
To evaluate the proposed system, two case studies are performed: for a residential area at the outer edge of a subway line, i.e., Meito Ward in Nagoya City, and a suburban commuter town with a nearby railway station, i.e., Kozoji Newtown in Kasugai City. Both of these towns are located in the Nagoya metropolitan area, Japan. Simulations are conducted for both cases. The results indicate the capability of the proposed system in suburban residential areas.
The remainder of this paper is structured as follows. In Section 2, the proposed system and examined cases are described. In Section 3, details of the simulation used to assess the proposed system are given. The results and accompanying discussion are presented in Section 4.
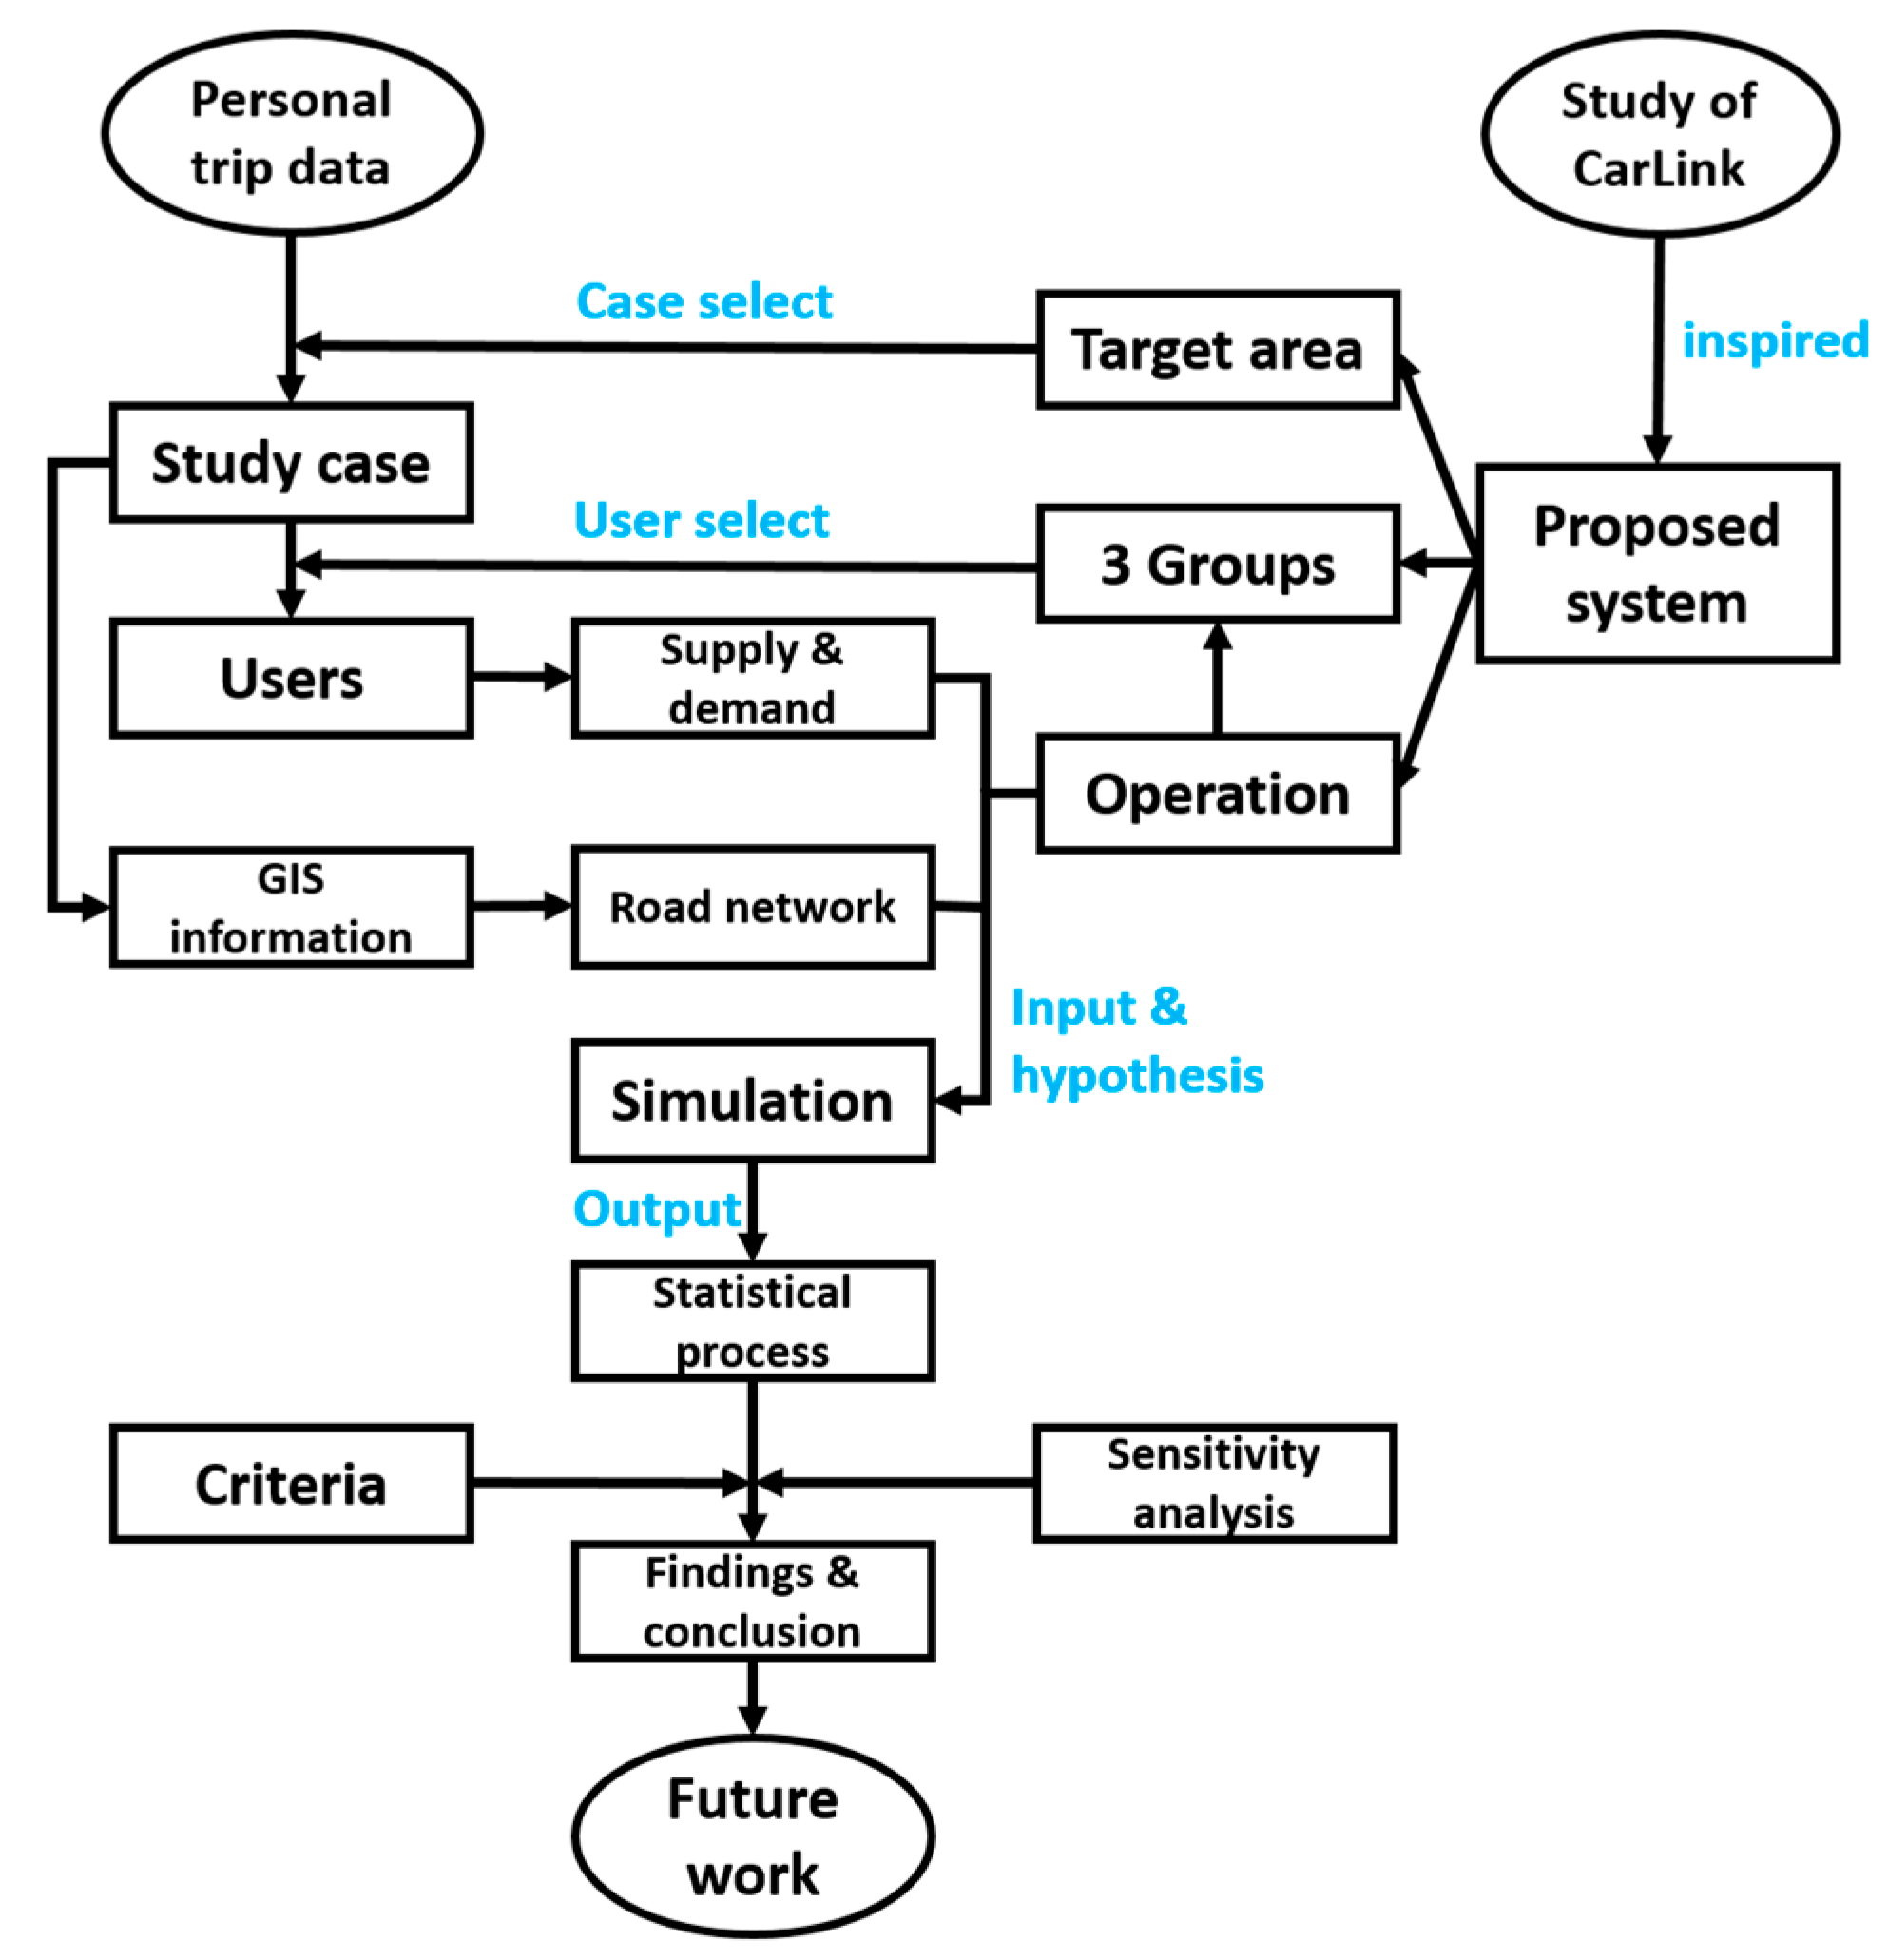
The general research flow is shown in Figure 1.
2. System and Cases
2.1. System Design
Users of the proposed P&R-based shared-AV system can be divided into the following three distinct user groups, which are then correlated by the flow of the AV fleet.
- P&R commuters: These individuals use AVs between their origins and transfer station(s) on their morning and evening commutes, while using the train for the remaining portion of their commute. These users store the AVs at their origins in the evenings.
- Inbound commuters: These individuals debark from trains and transfer to the shared-use AVs previously deposited at the station by the P&R commuters. They then take the AVs to their workplaces in the target area.
- Elderly and disabled residents: These users are collected from their origins by a shared-use AV deposited earlier by a P&R commuter. The AV is then utilized until the elderly or disabled residents arrive at their destinations within the target area.
In this study, the potential sizes of each user group were derived from unpublished current person trip survey data, and their travel modes were altered according to the proposed system.
2.1.1. Fundamental Elements
Before the features of the three user groups are discussed, the following basic concepts are introduced.
- Target area: The area selected for analysis in a case study, typically a suburban region with a certain number of residents and at least one public station;
- Key transit station(s): The transfer public transport station(s) of a study case, usually a railway station within the target area;
- User: The service object of the AV system, who shares usage of the fleet under the given circumstances; users are typically categorized as commuters or the elderly:
- Commuter: Those who make trips as commutes with several purposes, i.e., attending their workplace/school, returning to their workplace/school, and returning home;
- The elderly and disabled: This category includes two kinds of people: residents in the target area with mobility difficulties and those aged over 70. Users with mobility difficulties may include the visually handicapped, hearing impaired, and some senior citizens.
2.1.2. Group Features
The attributes and transportation mode adaptations for the three user groups are explained below.
P&R commuters: These commuters depart out of the target area and travel using the railway system from the key transit station(s) within the target area. The current access mode for the key transit stations of the P&R commuters is limited to private passenger vehicles. However, for the proposed shared AV system, these access trips are facilitated by a shared AV. As the shared autonomous passenger car is similar to a private passenger vehicle, these users are expected to be receptive to this concept. Importantly, the AV that transports them from their origin to the station remains within the target area until they return, though the P&R commuters may take whichever AV in the fleet is available.
Inbound commuters: These commuters disembark trains at the key transit station(s) within the target area. Keeping the same filtration as the P&R commuters, the current egress mode from the key transit station(s) to the inbound commuter destinations is limited to private passenger vehicles. However, without a dramatic change compared to their current egress mode, the carriers for the inbound commuters’ egress trips are replaced by shared AVs in the proposed scheme. Thus, the inbound commuters arrive at their destinations (perhaps a workplace) using shared AVs previously deposited by the P&R commuters. Note that this scheme does not necessarily mean that the entire fleet is utilized by the inbound commuters exclusively.
Elderly and disabled residents: As mentioned in Section 2.1.1, these target-area residents have mobility difficulties or are over 70 years old. Although such users may not have transport requirements associated with commuting, they may have target destinations such as healthcare or entertainment facilities. Thus, in the proposed scheme, the door-to-door AVs previously deposited by the P&R commuters collect these users and perform their desired trips within the target area, removing their lack of personal mobility.
2.1.3. System Operation
As for the previous study of P&R scheme [15], it is not surprising that the three user groups are connected by the shared AVs. However, considering the AV transfer, the P&R commuters are most similar to “providers” as they “bring” the AVs to the target area. Then, some vehicles of the fleet may serve the inbound commuters, with the remainder of the fleet possibly serving the elderly and disabled residents at the same time. Thus, the inbound commuters and the elderly and disabled residents are “consumers” to some extent. The fleet serves both groups until the P&R commuters return to the station during the evening peak hours.
Additionally, to maintain a flexible, balanced, and self-consistent system, two assumptions are made.
- The AVs in the P&R-based system belong to a non-profit organization, are identical, and have no charging or maintenance needs during the daytime. Moreover, each vehicle accommodates only one passenger at a time, although they are shared among all users.
- In the evening peak hours, the same number of P&R commuters reverse their morning commuting trips by transferring at the same stations and returning to their origins. Furthermore, the same number of fleet vehicles are stored at these users’ origins (usually their homes).
Evidently, commuting trips of P&R commuters occurring during non-morning hours are not considered. For the morning commuting period, 05:00–10:59 was selected as most commuting trips are concentrated within this period, as shown in Figure 2. Similarly, the fixed evening commuting period was taken to be 17:00–23:59. The P&R commuters were assumed to return to the key transit stations following the debarkation trends of these stations.
In accordance with the above two assumptions, the number of P&R commuters in the morning peak hours were identified. Note that the number of identified P&R commuters corresponds to the number of AVs that carry them to the key transit stations in the morning.
2.1.4. Data
A simulation was performed to evaluate the proposed system. Before it, based on the group features, the original C programs and Excel were utilized to first collect multiple kinds of data for both study cases, including the items listed below.
- P&R commuters: The residential-location (the middle and small zones for the Meito and Kozoji Newtown cases, respectively), origin, and destination distributions were obtained, along with the arrival distribution in the morning commuting period and details of the access mode sharing.
- Inbound commuters: Almost identical data to those for the P&R commuters were collected; however, as the destinations were fixed within the target area, the destination distribution was not required. Further, as these commuters debark trains at the key transit station(s), the access mode sharing data were replaced with egress mode sharing data.
- Elderly and disabled residents: The departure distributions by time of day and the number of persons and families were determined.
The data was derived from the unpublished 5th Personal Trip Survey of the Metropolitan Area of Chūkyō. Chūkyō region is a major metropolitan area in Japan centered on the city of Nagoya. This survey was executed from the year 2011.
2.2. Study Case
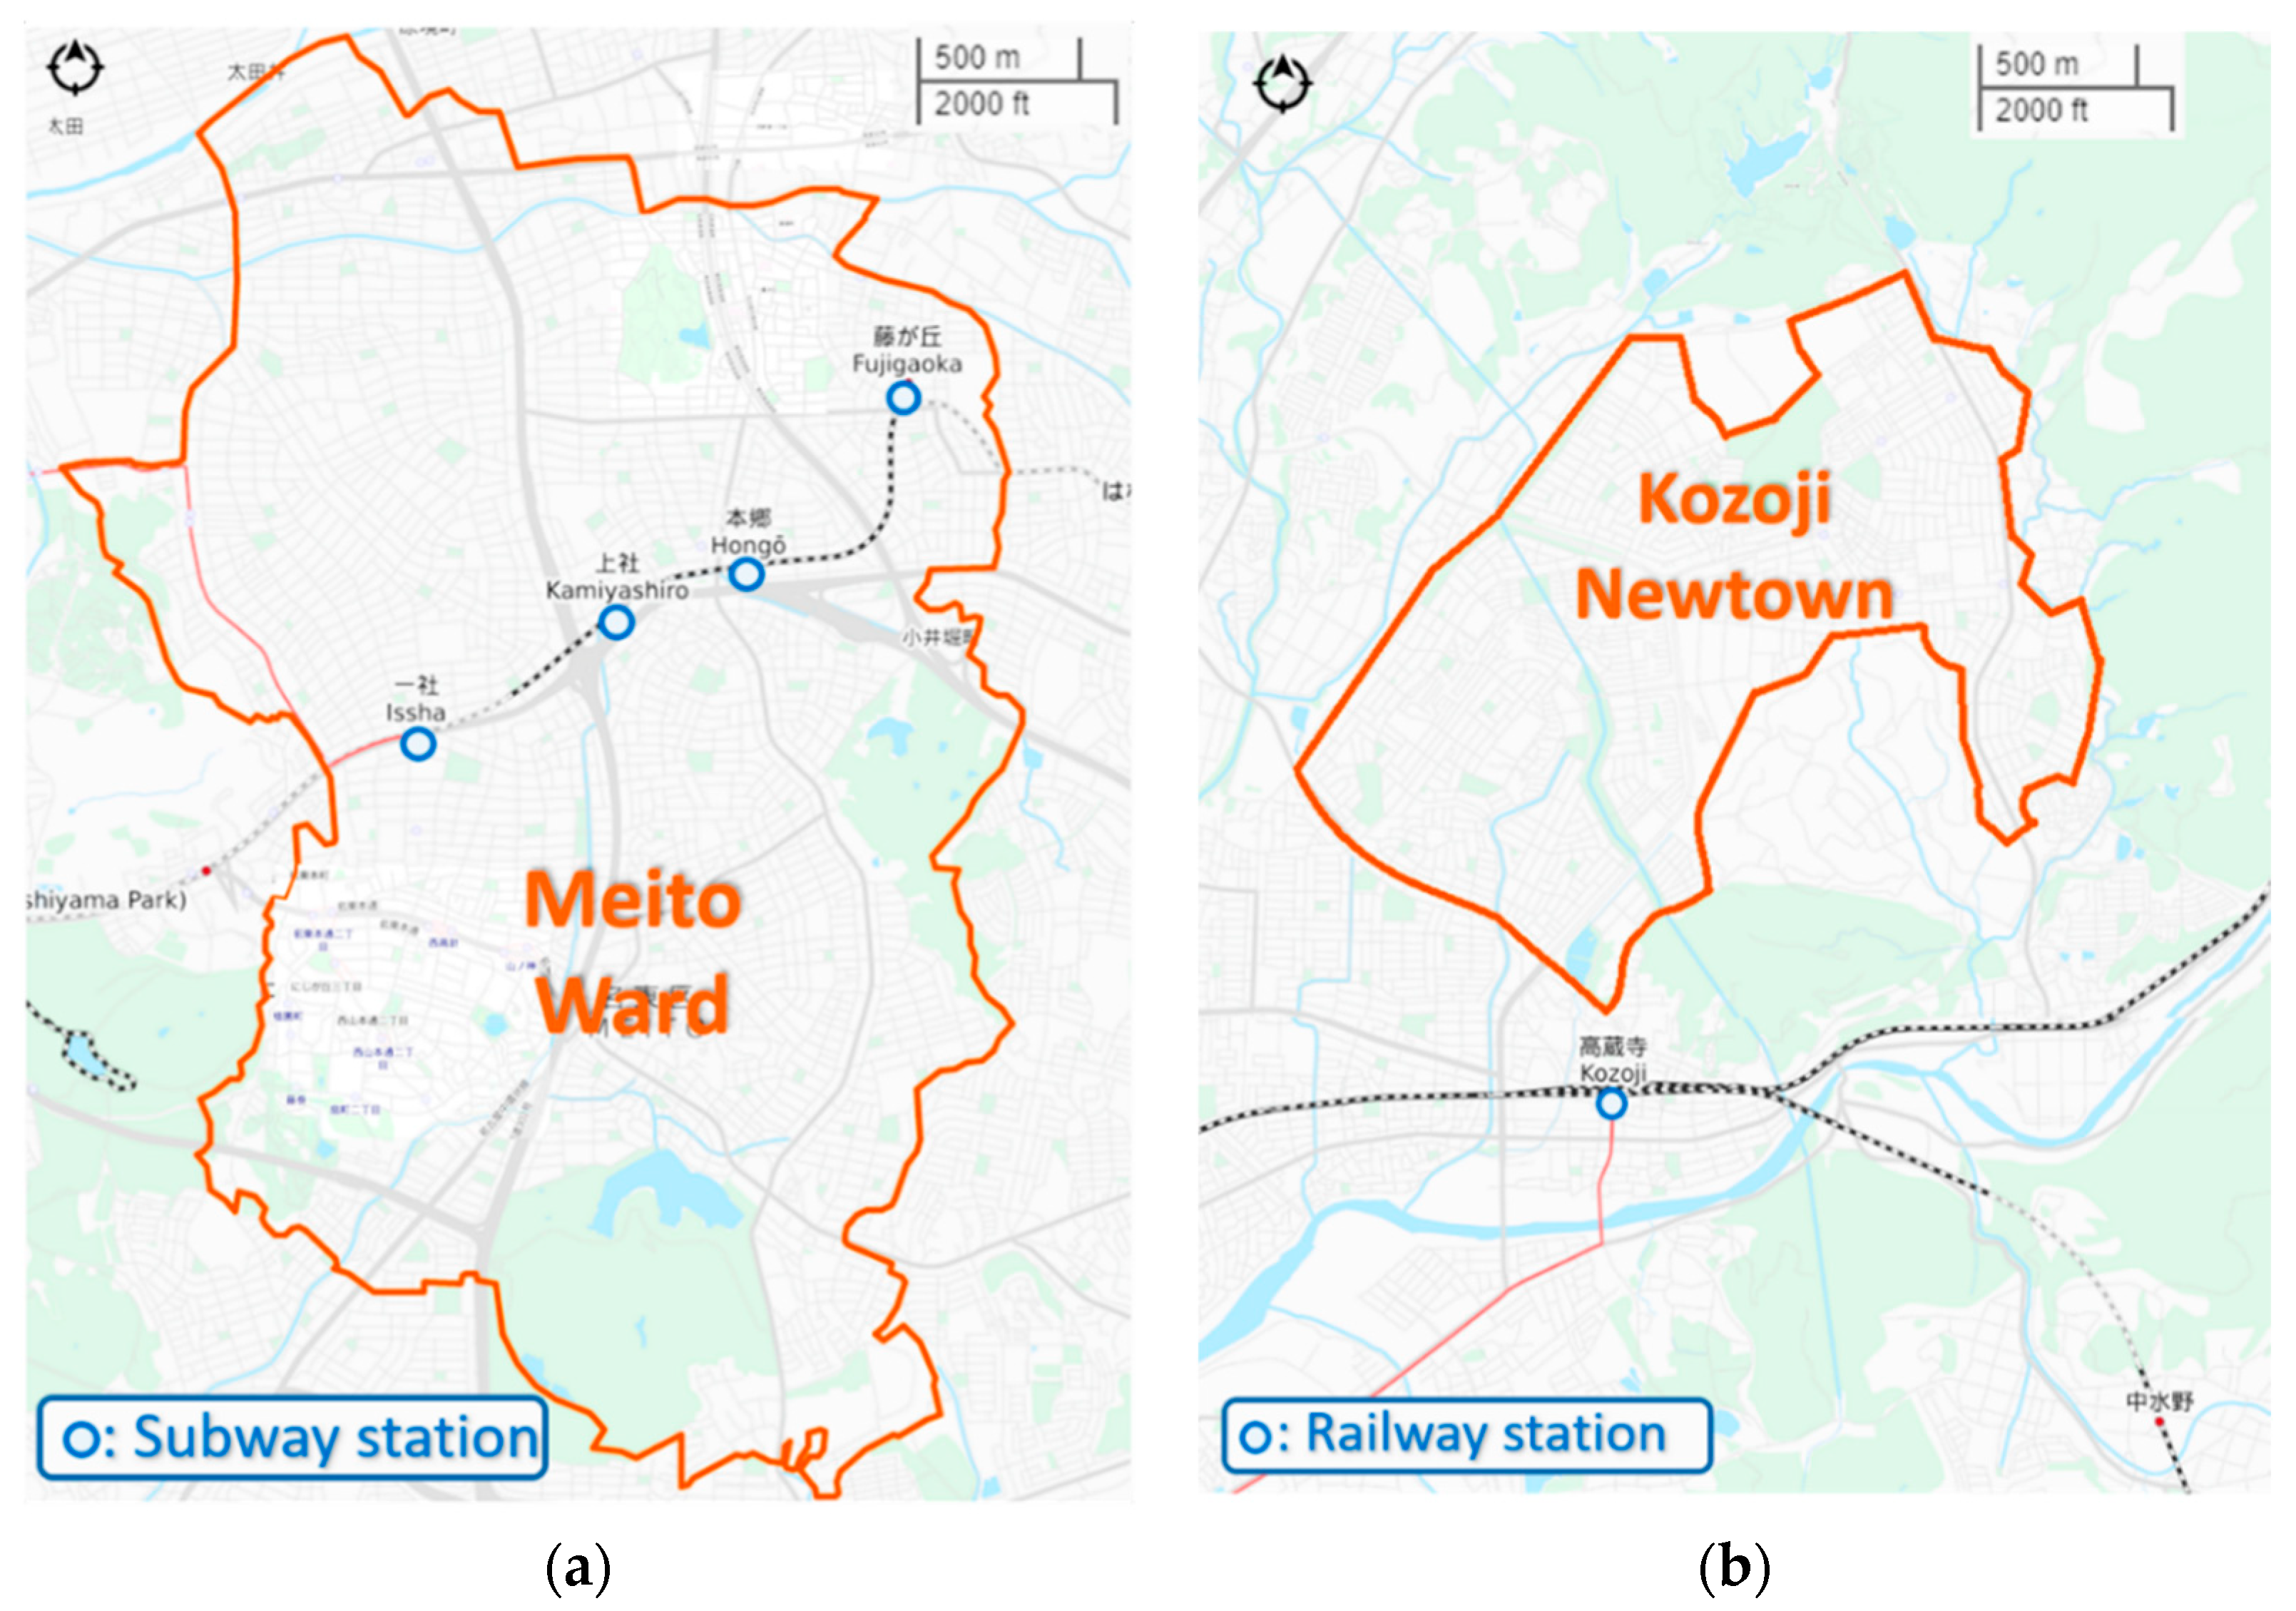
Two areas in the suburban area of Aichi prefecture, Japan, were selected as target cases in this study: Meito Ward in Nagoya City and a commuter town named Kozoji Newtown in Kasugai City (Figure 3). The term “commuter town” (or “bedroom community” [UK “dormitory town”]) refers to “a suburban area or town where many commuters live, often quite a distance from the place of employment” [16].
2.2.1. Edge Case, Meito Ward
Meito Ward is an ideal base for the proposed P&R-based shared AV system for two reasons. First, the marginally located Meito Ward corresponds to the northeastern transportation hub of Nagoya City. Four Nagoya-City subway stations (Higashiyama line) are located within Meito Ward. As an artery metro line, Higashiyama line connects Nagoya City Center with the northeastern region. In addition, Meito Ward borders both Nagakute City and Nisshin City; thus, it can constitute an alternative transfer hub for commuters in the outlying cities. As Meito Ward is located at the edge of the city and the end of the city subway line, we refer to the Meito case as the “edge case” in this study.
Through data collection for the Meito case, it was found that the period from 05:00 to 10:59 is the most intensive morning commuting period (Figure 2). The commuters transfer to railway in Meito in this time were regarded as P&R commuters. The westernmost Issha station had the fewest external transfer (i.e., departing out of Meito Ward) commuters; thus, it was excluded from the key transfer stations.
2.2.2. Commuter Town Case, Kozoji Newtown
Kozoji Newtown was developed as a typical commuter town and is located approximately 17 km northeast of the center of Nagoya City, as shown in Figure 3. Kozoji Newtown has distinctive features compared to Meito Ward, as detailed below.
- Location: As one of the 16 wards of Nagoya City, Meito is within the boundary of Nagoya City; however, Kozoji Newtown is located in another nearby city, namely, Kasugai. The areas of both towns also differ: The total area of Meito Ward is 19.45 km2 [17], almost three times that of Kozoji Newtown, at 7.02 km2 [18].
- Key transit station: Usually, the transfer stations in the target area are taken as the key transit stations, as for the stations in Meito Ward. However, Kozoji railway station, which is the nearest railway station, is located outside of Kozoji Newtown. This station is 16 km from Nagoya City Center (Sakae station), but Nagoya City Center is accessible via the two railway lines that pass through Kozoji station (Kozoji station has two “station codes” in the data source, though the station is not separated into two lines when been discussed). Therefore, because of its nearness and accessibility, Kozoji station is most suitable for the proposed P&R scheme. Thus, it was selected as the key transit station of this case.
- P&R commuters: The most distinctive feature of Kozoji Newtown is that it was developed as a Nagoya-City commuter town. Thus, the commuters residing in Kozoji Newtown are likely to be potential P&R commuters. Differing from the edge case, the commuters residing in Kozoji Newtown who boarded the railway line at Kozoji station were categorized as P&R commuters for the Kozoji Newtown case considered in this study.
The other characteristics are identical to those of the edge case. The inbound commuters included those who commuted with destinations within Kozoji Newtown, debarking at Kozoji station. Of course, the inbound-commuter egress mode and P&R-commuter access mode are currently limited to private passenger vehicles, as stated in Section 2.1.2. The elderly and disabled residents were extracted from among the residents of Kozoji Newtown in a similar manner as for the edge case.
3. Simulation
Agent-based simulation software called artisoc 4.0 was utilized in this study. Similar to a research tool, artisoc can simulate interactions among multiple agents in a direct interface and adapt to data derived from a geographic information system (GIS). The systematic assumptions for the agent-based simulation formed the keystone of this analysis, which incorporated the essential aspects of the agents considered in this study and their interactions. These aspects are described in the following subsections.
3.1. Range and Period
First, owing to knowledge limitations and the simulation software characteristics and program settings, the simulation incorporated two inevitable imperfections:
- The simulation range was limited to the target area only;
- Some input information, such as the available fleet, could be manually changed for each hour.
For Imperfection 1, although some users may have travelled to workplaces in the downtown region of the city, trips ending in locations outside the target area for instance, all P&R commuters, were excluded from the simulation. However, this is not a major detriment to this suburban-focused study, as the trips performed by the inbound commuters and the elderly and disabled residents could be executed in the simulation. Based on the data collection, in the case of Meito Ward, 14219 trips were targeted and in Kozoji-Newtown, 6395 trips were targeted.
For Imperfection 2, the simulation progress along the time of day could not be reset unless the input items required updating. Obviously, in both the morning and evening peak hours, the fleet size fluctuated because of the P&R commuter transitions at the key transit station(s). That is, it was necessary to stop the simulation on an hourly basis during peak hours.
As for the simulation range, all node and link information were obtained from the Japan Digital Road Map (Ver. 3.11) and was modified via GIS. The geographic information was converted to artisoc format as the basis of the simulation range. Although Kozoji station is located outside the target area, it was added to the road network of the Kozoji Newtown case because of its indispensability to users.
This study focused on commuting trips, thus the concept of “day” refers to a weekday. Besides, all trips of the three groups were collected from the weekday section of the personal trip data.
The service period was from 05:00 to 23:59, because a small number of trips occurred at midnight. The overall period in a day was divided into three sub-periods: the morning commuting hours, evening commuting hours, and off-peak hours.
- Morning commuting hours: This period extended from 05:00 to 10:59, based on the peak commuting hours in the morning. As the arriving P&R commuters accumulated, the autonomous fleet in the target area also increased in size.
- Evening commuting hours: This period was from 17:00 to 23:59, based on the evening peak hours. As the number of returning P&R commuters increased, more AVs were removed from the target area.
- Off-peak hours: This sub-period was located between the two commuting sub-periods and endured for 6 h, from 11:00 to 16:59. During this sub-period, the size of the fleet in the target area remained constant.
Note that, to ensure fleet accessibility at the required times, it was assumed that usage of the AVs arriving during the morning commuting hours was postponed until the next hour. For example, if 100 AVs arrived at 07:00, those AVs would only come into service from 08:00. Similarly, the AVs leaving during the evening commuting hours were banned from service from the beginning of the hour. For example, if 100 P&R commuters transfer from the train to AVs at 19:00, usage of those 100 AVs was blocked from 19:00 until the users arrived at the key transit station the following morning.
In addition, the inbound commuters and elderly and disabled residents could access the AVs through the entire period from which the number of available AVs exceeded zero to 22:59. As mentioned in Section 2.1, all users of the three groups maintained their current arrival times, which were derived from the data sources considered in development of the shared AV system.
Hence, the interactions among the groups during periods in a day can be described as: the AVs are brought to the target area by the P&R commuters in the morning commuting hours. These AVs can be available from next hour, which influence the fleet size in the simulation and provide service to both inbound commuters and the elderly and disabled residents when requested. From 11:00 the fleet size in simulation stops increasing and remains constant during the off-peak hours since no P&R commuters transfer in the target area. From 17:00 some AVs will be banned from service in order to service the incoming P&R commuters, thus the available fleet size serving the inbound commuters and the elderly and disabled residents in simulation will keep decreasing hourly during the evening commuting hours. Until 23:00 none of the AV is available for inbound commuters or the elderly and disabled residents because the AVs were taken or banned from use.
3.2. Fleet Setting
Multiple features are described in this sub-section, including the features of an individual AV and the simulation generation and dispatch method and speed adaption.
Capacity: As stated in the corresponding assumption reported in Section 2.1.3, the capacity of an individual AV in the simulation was one passenger. Consideration of one-passenger cars allows the greatest flexibility when developing a scheme to handle various kinds of trip. In addition, a one-passenger car that does not take detours or facilitate ride-sharing can restore the convenience of a private car to the utmost extent for users who previously used private passenger vehicles.
Generation: The road network information was loaded before the fleet was generated. At the beginning of each simulation, the fleet was uniformly generated at the nodes of the target area. The vehicle distribution locations are called the “initial points” in this study. The number of vehicles distributed in each sub-area (the basic or small zones in the datasets) corresponded to its population proportion relative to the population of the entire target area. In accordance with the AV transfer initiated by the P&R commuters, the number of available vehicles fluctuated during the two peak commuting hours. That is, the fleet was generated hourly following the most recent available fleet size in the peak commuting hours. Note that, although the vehicles were initialized at road network nodes in the simulation, this is generally illegal in reality. Thus, for real-world implementation, the AVs are expected to park in legal parking areas or parking lots distributed within each sub-area.
Dispatch strategy: Upon completion of the simulation initialization, the service was triggered by a request from an inbound commuter or elderly/disabled resident. Following the origin-destination (OD) table, the origin and destination featured in the request were shared among the fleet. Generally, the first come, first served (FCFS) strategy was the fixed rule for request response. Thus, the stand-by AV nearest to the origin point collected the passenger and carried him/her to their destination. When each trip was completed, the deadhead AV (i.e., having no passenger or request) was assumed to return to the initial point, i.e., the location at which the vehicle was generated, until the next request was received. While returning to the initial point, the deadhead AV only responded to a request if its real-time position was nearer to the collection location than those of the other stand-by AVs. Once the AV returned to the initial point, it remained on standby until receipt of the next request.
Speed: The AVs in the simulation traveled at a preset constant speed once the fleet was generated. To reflect the traffic conditions of the road network, the hourly speed setting in the system was adjusted according to the National Road Traffic Census (2010), Aichi section [19], using the settings employed by Yamamoto et al. [20]. The average speeds for the two study cases individually corresponded to the average speed of Nagoya City and that of Aichi prefecture excluding Nagoya City in the census, for Meito Ward and Kozoji Newtown, respectively. Apart from the differences between the case study locations, the average speeds change depending on the non-peak and peak periods. Thus, in the Meito case, the speed reduced to 18.9 km/h during the peak hours of 07:00 to 09:00 and 17:00 to 19:00, but remained at 24 km/h at all other times. For Kozoji Newtown, the peak hour speed was 27.6 km/h, while that for the other periods was 31.8 km/h, as detailed in Table 1.
3.3. Input Factors
Two kinds of input data were required before executing the simulation, including basic information and decision variables. First, the various kinds of basic information mentioned in the previous sections were required. The other kinds of basic information included the nodes and links derived from the GIS, the demographic information of each sub-area within the target areas, and the operation hour timetable for the fleet. In addition, input data that required alteration to reflect the results of the new scenario were required, as detailed below.
- Available fleet size: The fleet size is the supply in the system. As explained under the heading “Generation” in Section 3.2, the fleet size fluctuated during the commuting peak hours; therefore, the available fleet size was reset hourly as a key decision variable. Furthermore, the fleet size at the beginning and end of the simulation period was zero.
- Time interval: One-hour simulations were performed for the initial and end hours of the two commuting hour periods. But for the off-peak hours the simulation was executed only once, for the constant fleet and speed.
- Speed: Generally, as described under the “Speed” heading in Section 3.2, the speed settings were as given in Table 1.
- Maximum wait time: The wait time of every trip was from the request until pick-up or cancellation. In the simulation, users did not cancel requests unless the wait time equaled the maximum wait time. This condition limited the wait time in the output. In fact, the maximum wait time was longer than the longest time interval in the simulation; thus, the trip wait time results were collected without loss of information.
4. Results and Discussion
After the simulation process, the output information was collected in the form of figures and simulation logs. Hence, the evaluation results for the P&R-based shared-AV system were analyzed. Based on the two kinds of log, the key evaluation results were derived for the shared AV system.
A basic parameter of passenger log, the waiting time of the trip u could be easily calculated from the difference between the two moments:
where, Tu_wt: waiting time of trip u (s); mu_gon: moment of being picked up of trip u (h:mm:ss); mu_req: moment of request of trip u (h:mm:ss);
Similarly, the time length of travel time is the difference between moments of getting off and getting on. Furthermore, the rate of idle or empty driving is simply the proportion of idle or empty driving. For example, the idle rate of autonomous vehicle i is derived from:
where, Ri_idl: time ratio of idle of autonomous vehicle i; ti_ret: time of returning to the initial point after dropping off a passenger of autonomous vehicle i; ti_pic: time from receiving a requirement until pick up the passenger of autonomous vehicle i; ti_isev: time length of in service of autonomous vehicle i; ti_idl: stand-by time length of autonomous vehicle i (s) in once simulation;
The travel time of autonomous vehicle i in a specific sub-period j in the simulation is the sum of empty driving and in service time in the sub-period:
where, tij_trav: travel time of the autonomous vehicle i, in the j sub-period (s); tij_ret: time of returning to the initial point after dropping off a passenger of autonomous vehicle i during sub-period j(s); tij_pic: time from receiving a requirement until picking up the passenger of autonomous vehicle i during sub-period j (s); tij_isev: time length of in service of autonomous vehicle i during sub-period j (s);
Thus, the sum of vehicle kilometer traveled (VKT) of I autonomous vehicles with a constant speed Vij during j sub-period is:
By summing the VKTIj in J period, the VKT per vehicle is:
where, Vij: speed of the autonomous vehicle i, in the j sub-period (km/h); VKTIj: sum of vehicle kilometer traveled of fleet i, in the j sub-period (s);
Concentrating on the wait time, statistical analyses were performed to obtain the performance criteria results for the proposed system.
4.1. Criteria
In this study, the average wait time and 95th percentile wait time were taken as the key parameters indicating the LOS for users. Furthermore, the minimum fleet size and the idle and in service ratios were considered to determine the efficiency of the shared AV system.
From the customer perspective, the wait time can be the main factor affecting their experience and influencing their evaluation of the service. According to Bischoff and Maciejewski [12], the relevant service criteria include the average wait time and the 95th percentile of the wait time. Those researchers state that “waiting times for an AT should never be considerably higher than it takes to usually park and un-park a vehicle. Apart from the average waiting times, the 95 percentile of wait time is set as a criterion.” (The AT means autonomous taxi.) These criteria are employed in the present work because similarities exist between the conditions employed in this study and that by Bischoff and Maciejewski [12]. For example, in both studies, attempts were made to replace the vehicles used for the current trips within a target area by AVs with various fleet sizes. In addition, multiple-agent simulations were used in both the present study and that by Bischoff and Maciejewski [12] to explore fleet size minimization.
In the scenarios proposed in this study, the trips of three interoperable groups were mainly rearranged by adoption of a P&R scheme, with the current transportation modes being replaced. Thus, the minimum fleet size indicates the efficiency of the whole AV system. Additionally, the cost on the operator side decreases with the fleet size. The idle and in service ratios were also processed to illustrate the operational efficiency of the proposed system. Besides, the empty driving ratio was added since these three ratios provide a 100% of operation ratio.
4.2. Scenario Results
Based on the assumptions employed in the simulation, various fleet sizes for Meito Ward and Kozoji Newtown were evaluated via the simulation software. The entire fleet of shared AVs provided by the P&R commuters was defined as the “full fleet” or “100% fleet.” In the simulation scenarios, an appointed percentage (usually lower than 100%) of the full fleet tentatively responded to the requests of the inbound commuters and the elderly and disabled residents. For example, in the 10% fleet scenario of the Meito case, the available fleet was reduced from 1717 vehicles to 172 vehicles during the off-peak hours. The supply during other periods as also reduced to one-tenth, as shown in Figure 4. Under the acceptable LOS, the lower the percentage of the utilized fleet, the more efficient the system.
4.2.1. Meito Ward Results
In the Meito Ward case, 25% of the full fleet provided a favorable average wait time (1 min) and 95th percentile of the wait time (3 min), as detailed in Table 2. However, the LOS deteriorated at 20% of the full fleet size. Thus, the minimum fleet size is expected to range from 343 to 429 vehicles.
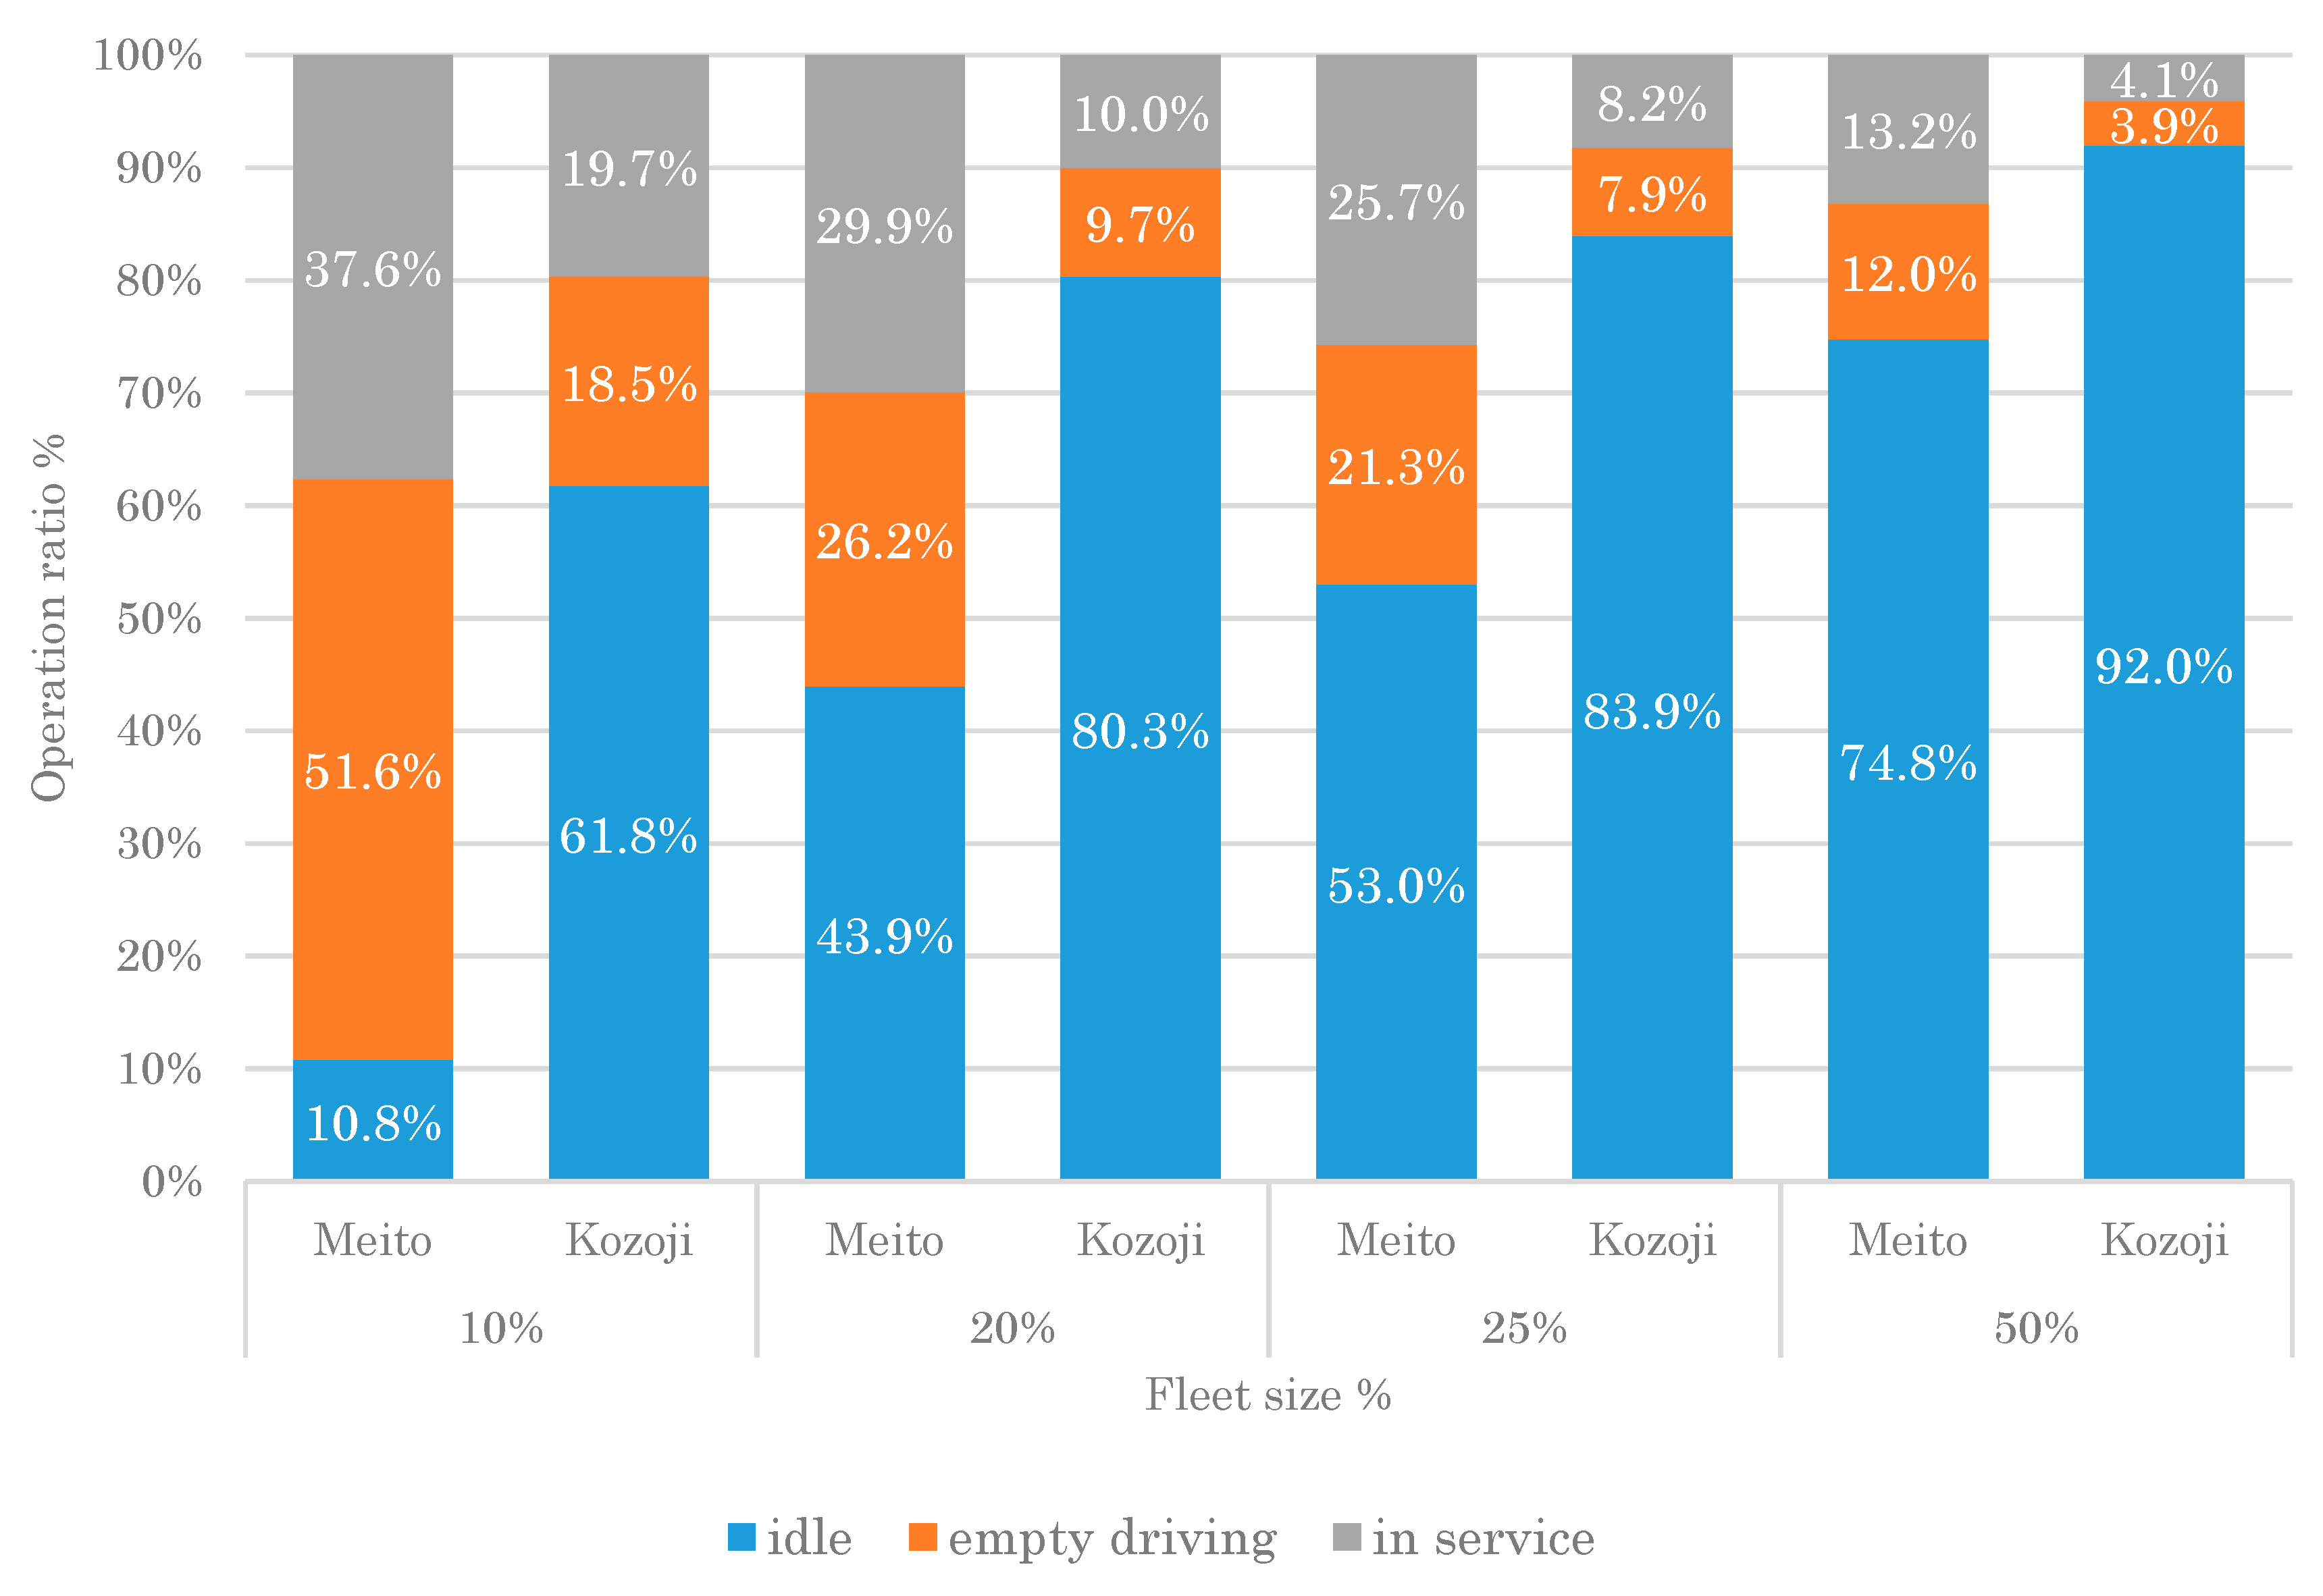
Furthermore, the system efficiency was found to improve with fleet downsizing, as shown in Figure 5. Compared with the performance for 50% of the fleet, the VKT per vehicle improved by 87% and 123% for 25% and 20% fleet sizes, respectively, while the idle operation ratio decreased by 21% and 30%, respectively. However, as regards the LOS, there were no harsh compromises between 50% and 25% fleet sizes. For example, the 95th percentile of the wait time increased from approximately 2 min to approximately 3 min with decreasing fleet size, which is still a short wait time.
4.2.2. Kozoji Newtown Results
In the Kozoji Newtown case, the minimum fleet size was found to be 20% of the full fleet size, corresponding to 370 vehicles, with an acceptable average wait time of approximately 1 min and a 95th percentile of the wait time of approximately 5 min. Furthermore, compared with 50% fleet size, the 20% fleet size case yielded clear improvements in the VKT per vehicle and the operation ratios. In detail, the VKT per vehicle increased by 144%, while the in service ratio was more than double the values for the 50% fleet size case. The idle ratio decreased by 11%. Thus, all results indicate better efficiency when 20% of the fleet is available.
4.2.3. Sensitivity Analysis of Kozoji Newtown
Because of the particularity of the Kozoji Newtown case, as described in Section 2.2.2, some inaccuracies may be concealed within the results. Thus, an additional sensitivity analysis was performed for this case.
First, speeds equivalent to 90%, 100% and 110% of the base speed were set without alteration of the other parameters for the minimum fleet size (20% of the full fleet) for Kozoji Newtown. The results revealed no major difference in the average wait time with the differences in speed of several percentage points. The wait time distribution results also support this point. As for the system efficiency, the idle rate as well as the VKT per vehicle increased with the speed, which accords with expectation. The idle rates differed from 78% to 81% for the considered speeds, which is acceptable. The VKT per vehicle increased only slightly with the speed, as detailed in Table 3.
Then, two special scenarios were simulated using the minimum fleet size for Kozoji Newtown, so as to test the hypothetical system. As approximately 20% of the elderly and disabled residents (in Table 3, “elderly” refers to the elderly and disabled residents group) had no records of any trips, the actual demand may be potentially greater than the demand determined in the simulation. Thus, in the first special scenario (labeled “Higher demand” in Table 3), the demand was modified to 125% of the base demand and 125% of the demand of inbound commuter and elderly and disabled resident respectively. Secondly, the P&R scheme influences the supply based on the cooperation of the P&R commuters. As a result, the available vehicle number fluctuates with the time of day. Thus, to distinguish between taxi mode, for which the fleet size is constant, and P&R mode, a constant fleet scenario was also simulated (labeled “Taxi” in Table 3).
When the case with 125% demand (“Higher demand” in Table 3) is compared with the base scenario, it is apparent that the completed trips decreased; however, there was no major difference between the average wait time and the 95th percentile of the wait time. As regards the “Taxi” scenario, the average and 95th percentile of the wait time decreased, because there were more available vehicles during the morning and evening commuting periods. However, for the system efficiency, the idle rate for the taxi mode exceeded that for the base scenario by more than 5%, indicating that the system efficiency is lower in the taxi mode. The VKT per vehicle for the 125% demand case was much higher than that of the base scenario, but only a slight difference was noted for the taxi mode. Generally, for the Kozoji Newtown case, the system is sufficiently robust to handle several speed variations. Indeed, if the speeds increase in the future, the LOS may be improved slightly. In addition, the LOS remains acceptable when satisfying 125% demand. Although the taxi mode may offer lower wait times, the system efficiency decreases simultaneously.
4.3. Major Findings
The proposed system is capable of providing users with an acceptable service in two cases.
- A halved fleet of vehicles transferred by the P&R commuters can satisfy the demands of the inbound commuters and the elderly and disabled residents traveling in the target area; however, the corresponding efficiency is not desirable.
- In the case of Meito Ward, when approximately 20% to 25% of the full fleet is used (approximately 400 vehicles), the shared AVs can provide a quick response service for the inbound commuters and the elderly and disabled residents with an average wait time of less than 2 min.
- In the case of Kozoji Newtown, fewer than 400 shared AVs can perform more than 6000 trips for the inbound commuters and the elderly and disabled residents travelling within the target suburban area from the beginning of the morning peak hour period until 22:59. For approximately 95% of trips, the wait time is less than approximately 5 min and the average wait time of all trips is approximately 1 min.
According to the sensitivity analysis results determined via the simulation, this system is robust to speed variations in the case of Kozoji Newtown. Besides, the system can still provide a quick response service when 25% of the demand from inbound commuters, elderly and disabled residents or both groups is increased.
From the policy suggestion perspective, there are several findings.
According to the simulation results, about 400 shared AVs are suggested for planning of the shared AV system in both Meito Ward and the Kozoji Newtown area.
Based on the sensitivity analysis, the system can keep its LOS even if the trips by the inbound commuters or elderly and disabled residents in Kozoji Newtown increase by a quarter.
Due to the sharing among users, the vehicles of the inbound commuters become unnecessary for their commuting trips. Thus, the application of the system may result in a decrease of car ownership, pollution abatement and less parking space being needed.
The current transportation mode of the elderly and disabled residents including private cars, public transportation, etc. However, this system can provide quick door-to-door service almost everyday, which provides an attractive option.
4.4. Future Work
Various limitations were identified during this study, which should be addressed in future work.
- As hourly constant speeds were set for the AVs, the simulation output may have included distortions due to insensitive reflections of the changing traffic volumes of the road network. Thus, to reflect detailed speed variations, use of simulation software such as MATSim should be considered for future work on this topic.
- The external trips of the P&R commuters were not reflected in the simulation, although this factor indirectly affects the internal trips of the inbound commuters or elderly and disabled residents. To incorporate the external trips of the P&R commuters in the simulation, road network enlargement or other solutions are required.
- In reality, the AV mileage factor is one of the most significant obstacles affecting the fleet performance, and lack of consideration of this aspect is a limitation of this study. First, charging stations (e.g., for electric AVs) must be incorporated in the simulation. Afterwards, the associated challenges may be determined.
- The FCFS strategy may not be the most advanced solution for AV dispatch. Use of the demand-supply balancing taxi dispatch strategy or another more reasonable frame could provide new research directions.
- To evaluate how the proposed system improves on the current transport systems in the target areas in detail, possible applications and evaluation criteria are required.
Author Contributions
Conceptualization, T.Y.; methodology, T.Y. and M.H.; formal analysis, Y.Z., Y.L. and M.H.; data curation, Y.Z.; writing—original draft preparation, Y.Z.; writing—review and editing, T.Y., Y.Z. and Y.L.; funding acquisition, T.Y.
Funding
This research was funded by the Ministry of Education, Culture, Sports, Science, and Technology, Japan, through a Grant-in-Aid for Scientific Research, grant no. 16H02367, as well as the Japan Society for the Promotion of Science.
Acknowledgments
The authors express their great appreciation to all the individuals and organizations who supported this study.
Conflicts of Interest
The authors declare no conflict of interest.
References
- Burian, J.; Voženílek, V. Identification and analysis of urbanization and suburbanization in Olomouc region—Possibilities of GIS analytical tools. In Advances in Spatial Planning; Burian, J., Ed.; InTech: London, UK, 2012; pp. 143–164. [Google Scholar]
- Department of Economic and Social Affairs United Nations. World Population Ageing; The United Nations: New York, NY, USA, 2002; pp. 1950–2050. [Google Scholar]
- Meyer, J.; Becker, H.; Bösch, P.M.; Axhausen, K.W. Autonomous vehicles: The next jump in accessibilities? Res. Transp. Econ. 2017, 62, 80–91. [Google Scholar] [CrossRef] [Green Version]
- Song, Z.; He, Y.; Zhang, L. Integrated planning of park-and-ride facilities and transit service. Transp. Res. Part C 2017, 74, 182–195. [Google Scholar] [CrossRef]
- Parkhurst, G. Park and ride: Could it lead to an increase in car traffic? Transp. Policy 1995, 2, 15–23. [Google Scholar] [CrossRef]
- Shen, Y.; Zhang, H.; Zhao, J. Integrating shared autonomous vehicle in public transportation system: A supply-side simulation of the first-mile service in Singapore. Transp. Res. Part A 2018, 113, 125–136. [Google Scholar] [CrossRef]
- Zhang, W.; Guhathakurta, S.; Fang, J.; Zhang, G. Exploring the impact of shared autonomous vehicles on urban parking demand: An agent-based simulation approach. Sustain. Cities Soc. 2015, 19, 34–45. [Google Scholar] [CrossRef]
- Kang, N.; Feinberg, F.M.; Papalambros, P.Y. Autonomous electric vehicle sharing system design. J. Mech. Des. 2016, 139, 011402. [Google Scholar] [CrossRef]
- Zakharenko, R. Self-driving cars will change cities. Reg. Sci. Urban Econ. 2016, 61, 26–37. [Google Scholar] [CrossRef]
- Litman, T. Autonomous Vehicle Implementation Predictions; Victoria Transport Policy Institute: Victoria, BC, Canada, 2017. [Google Scholar]
- Bischoff, J.; Maciejewski, M. Autonomous taxicabs in Berlin—A spatiotemporal analysis of service performance. Transp. Res. Procedia 2016, 19, 176–186. [Google Scholar] [CrossRef]
- Bischoff, J.; Maciejewski, M. Simulation of city-wide replacement of private cars with autonomous taxis in Berlin. Procedia Comput. Sci. 2016, 83, 237–244. [Google Scholar] [CrossRef]
- Liu, Z.; Miwa, T.; Zeng, W.; Morikawa, T. An agent-based simulation model for shared autonomous taxi system. Asian Transp. Stud. 2018, 5, 1–13. [Google Scholar]
- Shaheen, S.A.; Rodier, C. Travel effects of a suburban commuter carsharing service: CarLink case study. Transp. Res. Rec. 2005, 1927, 182–188. [Google Scholar] [CrossRef]
- Shaheen, S.A.; Novick, L. Framework for testing innovative transportation solutions: Case study of CarLink, a commuter carsharing program. Transp. Res. Rec. 2005, 1927, 149–157. [Google Scholar] [CrossRef]
- Preston, J.P. Community involvement in school: Social relationships in a bedroom community. Can. J. Educ. 2013, 36, 413–437. [Google Scholar]
- Official Nagoya City Website. Available online: http://www.city.nagoya.jp/kids/page/0000007521.html (accessed on 22 April 2019).
- Official Kozoji Newtown Website. Available online: http://kozoji-nt.com/introduce#history (accessed on 22 April 2019).
- Ministry of Land, Infrastructure and Transport. Heisei 22nd National Road Traffic Survey (Road Traffic Census) General Traffic Survey Total List; Ministry of Land, Infrastructure and Transport: Tokyo, Japan, 2011. (In Japanese)
- Yamamoto, M.; Kaji, D.; Hattori, Y.; Yamamoto, T.; Tamada, M.; Fujigaki, Y. Study on spread of shared autonomous vehicles. Proc. Infrastruct. Plan. 2016, 53, 28–29. (In Japanese) [Google Scholar]
Figure 1.
The research flowchart.

Figure 2.
Trip number distributions for commuters transferring at Meito and Kozoji railway stations in one day.
Figure 2.
Trip number distributions for commuters transferring at Meito and Kozoji railway stations in one day.
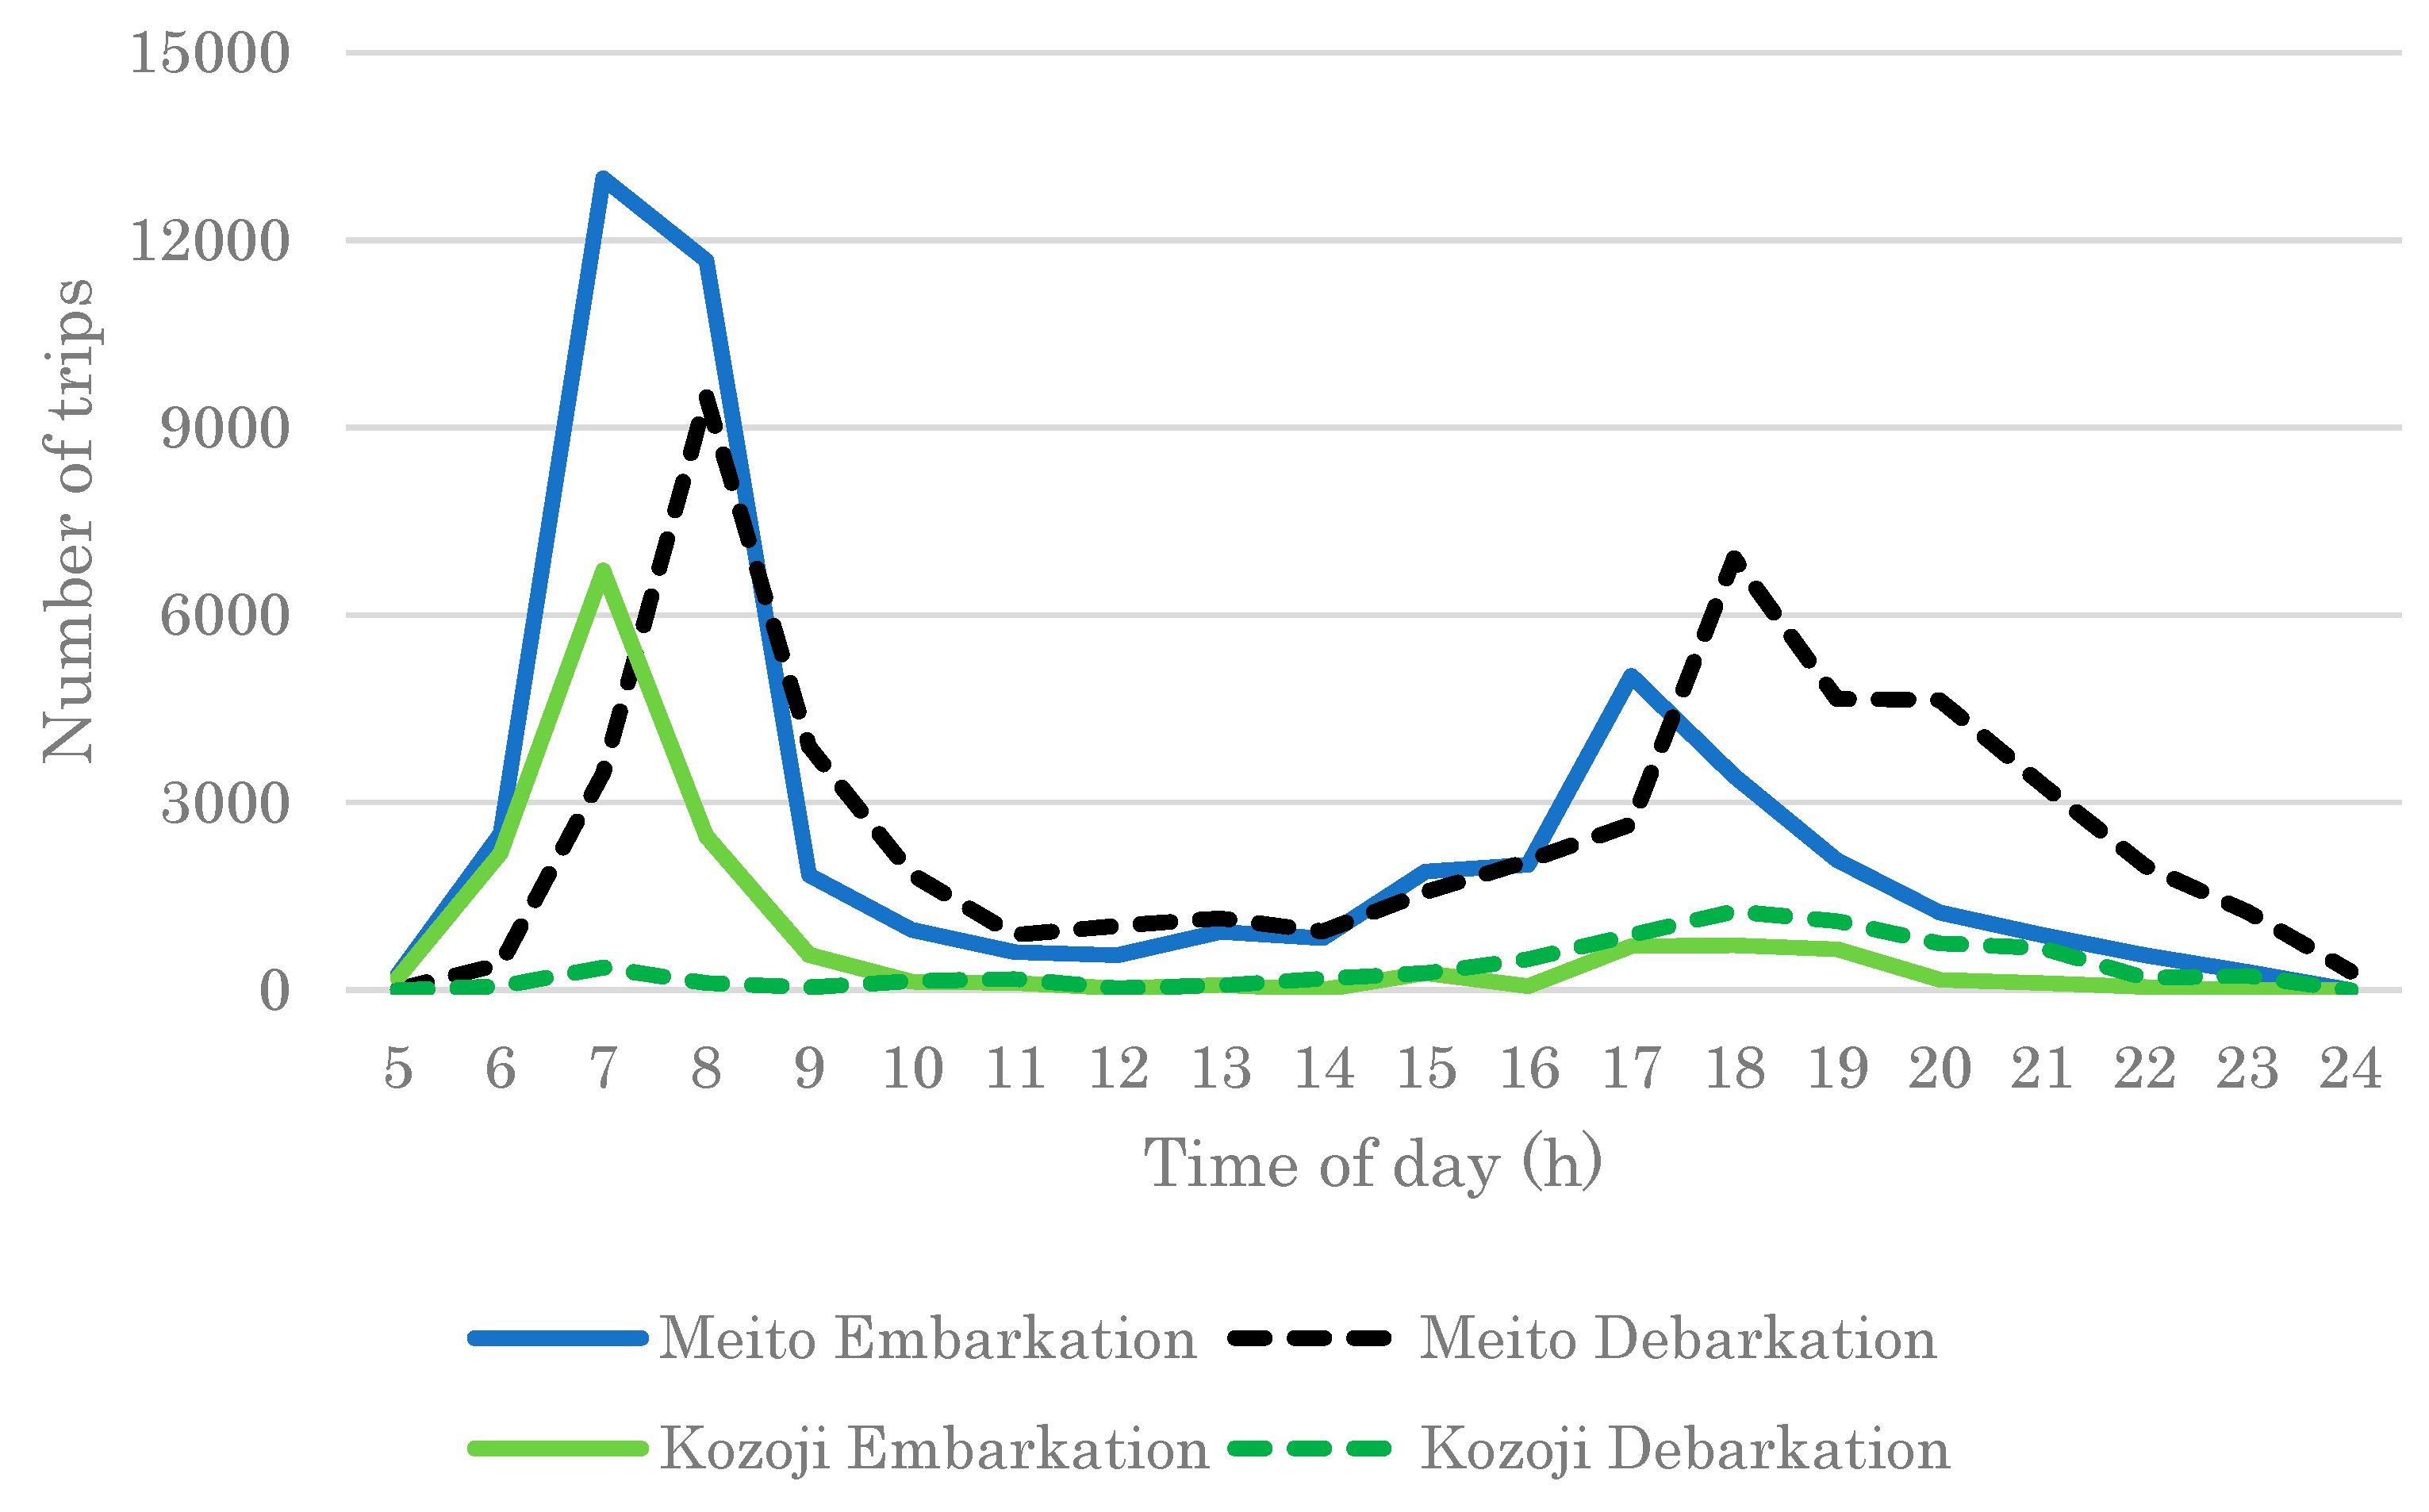
Figure 3.
Meito Ward and Kozoji Newtown on same scale (source: OpenStreetMap): (a) Meito Ward and (b) Kozoji Newtown.
Figure 3.
Meito Ward and Kozoji Newtown on same scale (source: OpenStreetMap): (a) Meito Ward and (b) Kozoji Newtown.

Figure 4.
Available vehicles over one day in Meito case, for various percentages of full fleet.
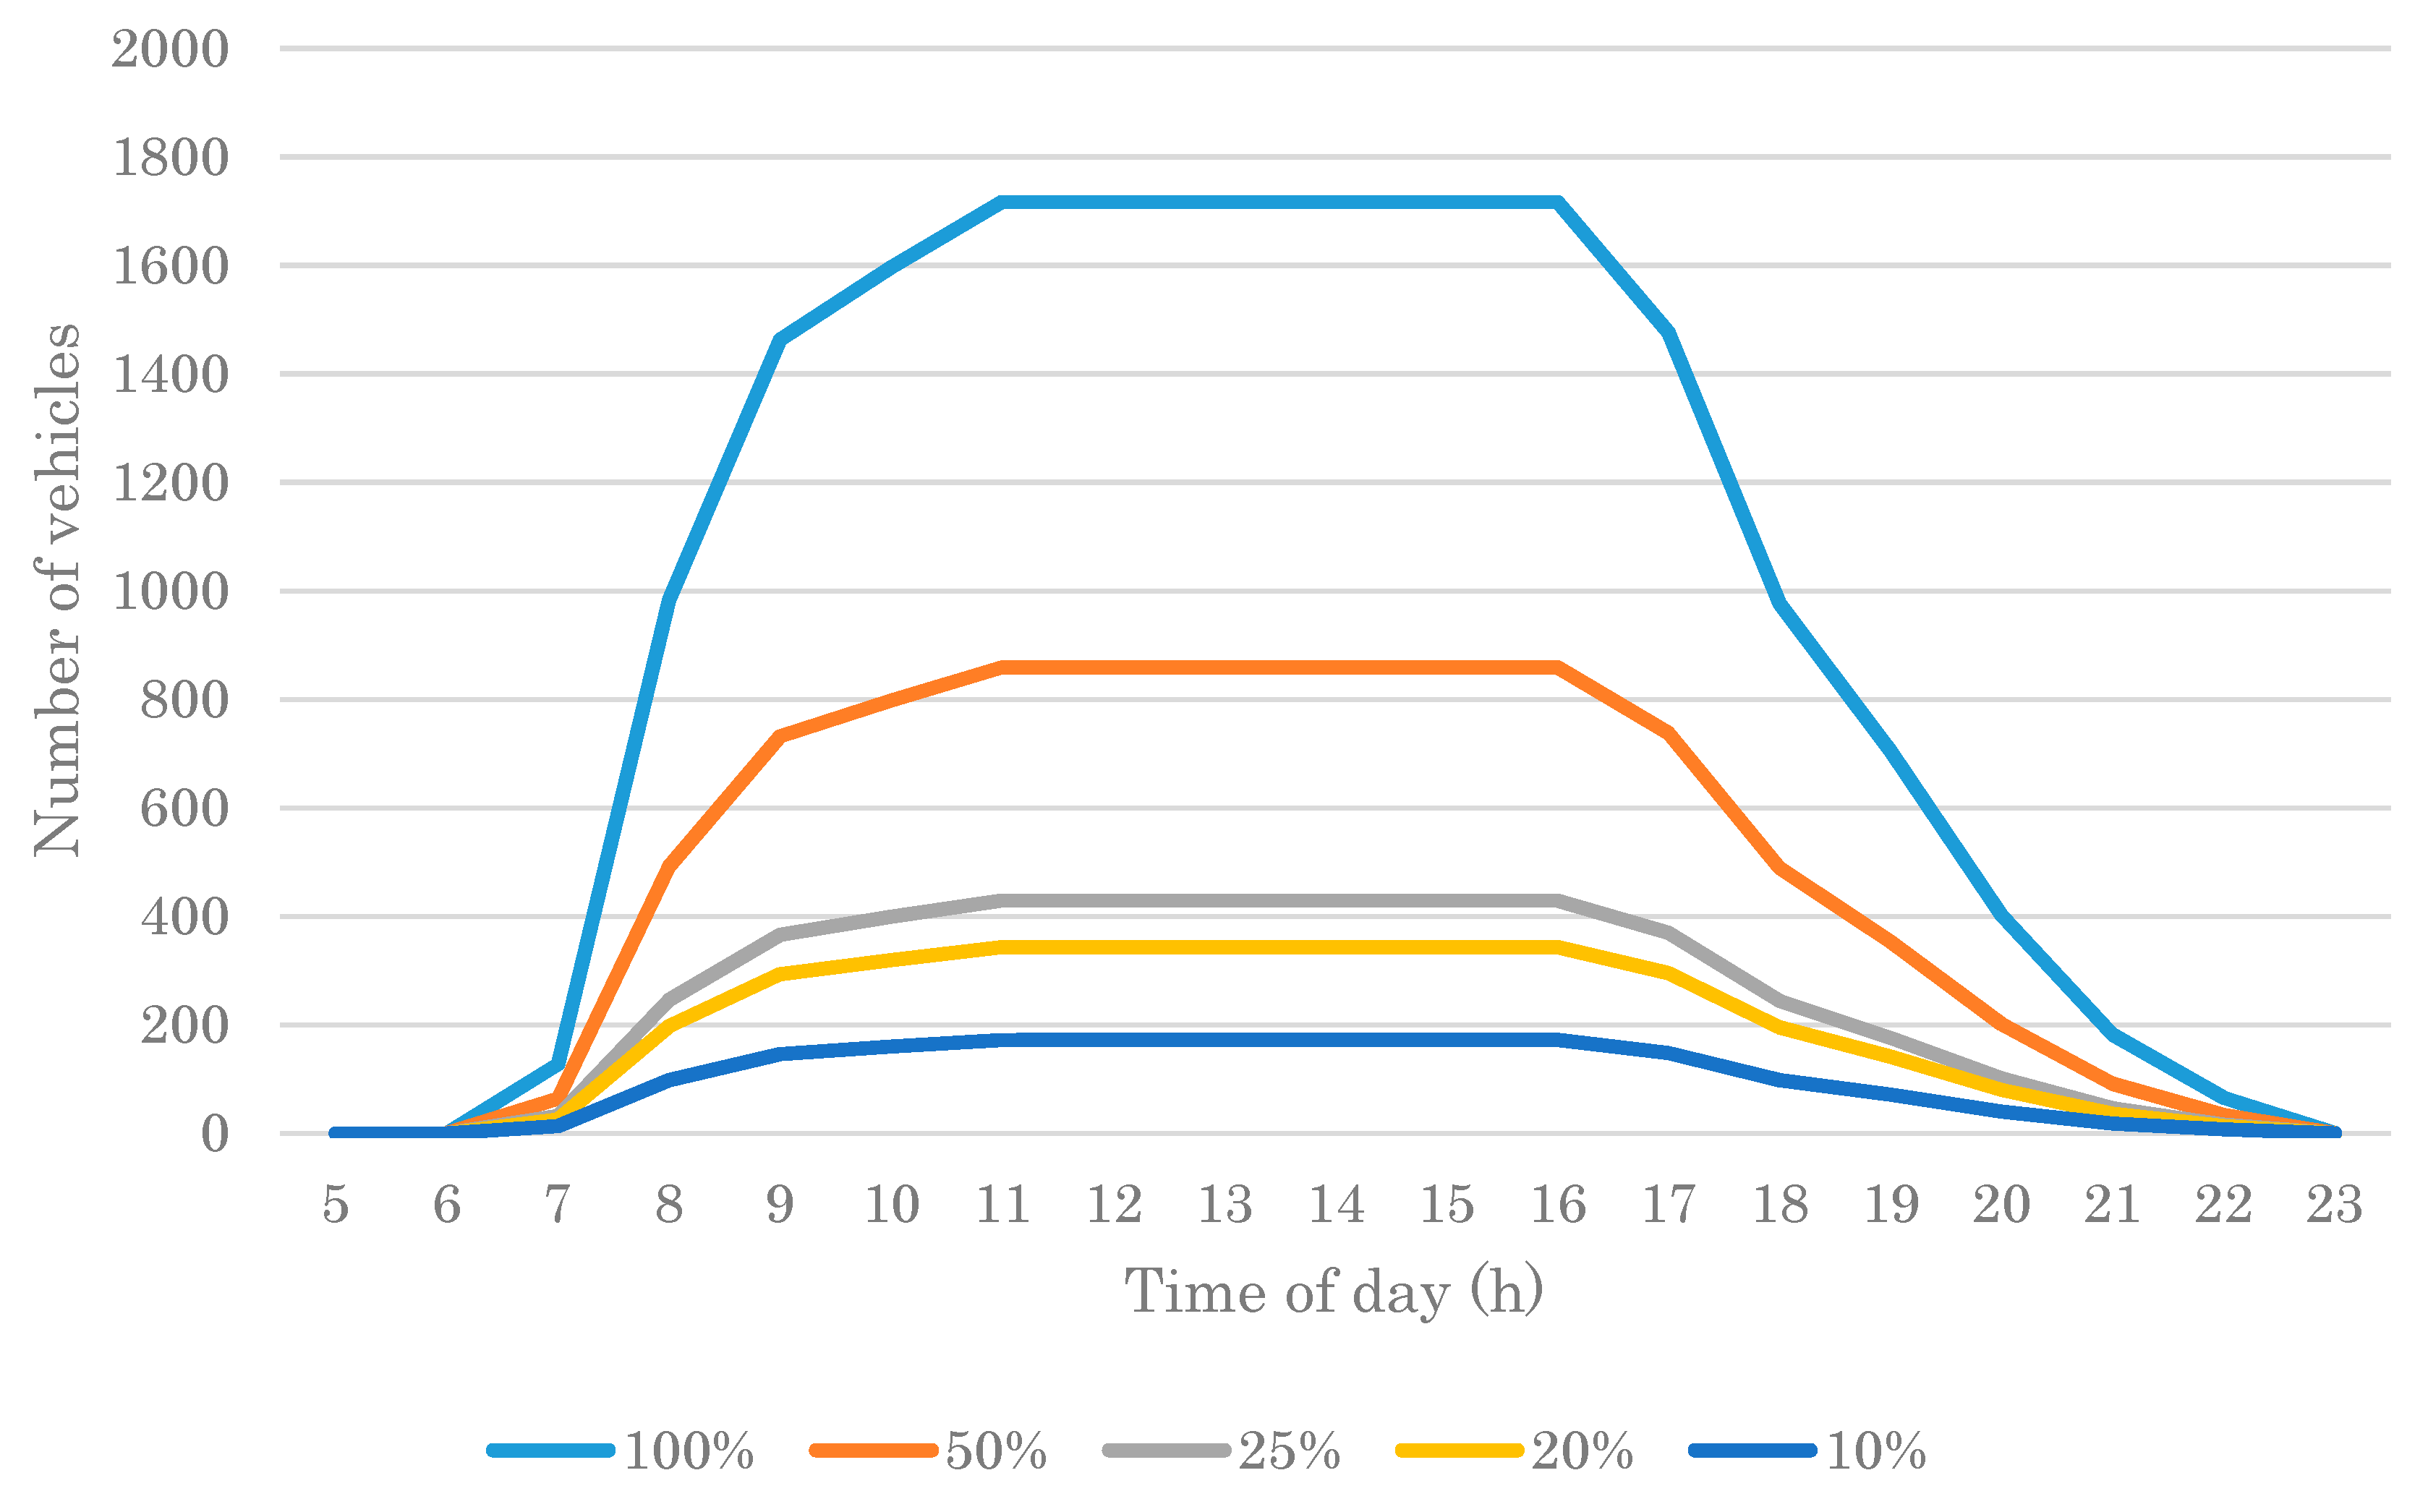
Figure 5.
Operation ratios of Meito Ward and Kozoji Newtown cases for various fleet sizes.

Table 1.
Speed settings of study cases by time period.
| Peak Hours | Off-Peak Hours | ||
|---|---|---|---|
| Time of day | 07:00–09:59 17:00–19:59 | 05:00–06:59 10:00–16:59 20:00–22:59 | |
| Speed (km/h) | Meito | 18.9 | 24.0 |
| Kozoji | 27.6 | 31.8 | |
Table 2.
Wait time results for Meito Ward and Kozoji Newton for different fleet sizes.
| Meito Ward | Fleet size | Vehicle | 172 | 343 | 429 | 859 |
| Percentage | 10% | 20% | 25% | 50% | ||
| Average wait time | 41 m 39 s | 1 m 47 s | 1 m 4 s | 32 s | ||
| 95th percentile of wait time | 1 h 35 m 14 s | 7 m 9 s | 3 m 12 s | 1 m 39 s | ||
| Completed trips (%) | 55.3% | 87.2% | 92.1% | 94.1% | ||
| Kozoji Newtown | Fleet size | Vehicle | 185 | 370 | 462 | 924 |
| Percentage | 10% | 20% | 25% | 50% | ||
| Average wait time | 1 m 28 s | 1 m 2 s | 58 s | 43 s | ||
| 95th percentile of wait time | 6 m 55 s | 5 m 6 s | 4 m 46 s | 3 m 39 s | ||
| Completed trips (%) | 92.5% | 94.0% | 95.1% | 95.0% | ||
Table 3.
Comparison of service level and system efficiency for Kozoji Newtown case determined via sensitivity analysis.
Table 3.
Comparison of service level and system efficiency for Kozoji Newtown case determined via sensitivity analysis.
| Scenario | Base | Lower Speed | Higher Speed | Higher Demand (125% Inbound & 125% Elderly) | Higher Demand (125% Inbound & 100% Elderly) | Higher Demand (100% Inbound & 125% Elderly) | Taxi | |
|---|---|---|---|---|---|---|---|---|
| Speed | 100% | 90% | 110% | 100% | 100% | 100% | 100% | |
| Demand | 100% | 100% | 100% | 125% inbound & 125% elderly | 125% inbound & 100% elderly | 100% inbound & 125% elderly | 100% | |
| Waiting time | Average | 1 m 2 s | 1 m 11 s | 57 s | 1 m 11 s | 1 m 7 s | 52 s | 52 s |
| 95th percentile | 5 m 6 s | 5 m 53 s | 4 m 36 s | 5 m 45 s | 5 m 30 s | 4 m 24 s | 3 m 48 s | |
| Completed trips | 94.0% | 93.3% | 94.8% | 90.0% | 91.2% | 93.6% | 98.3% | |
| Operation mode | Idle rate | 80.3% | 78.6% | 81.7% | 75.4% | 79.5% | 77.8% | 85.7% |
| Empty ride rate | 9.7% | 10.4% | 9.0% | 11.9% | 10.1% | 10.8% | 7.0% | |
| In service rate | 10.0% | 11.0% | 9.3% | 12.6% | 10.4% | 11.4% | 7.2% | |
| Kilometer traveled per vehicle (km) | Empty ride | 31.9 | 30.9 | 32.8 | 39.4 | 33.5 | 35.9 | 33.9 |
| In service | 33.1 | 32.8 | 33.7 | 41.8 | 34.3 | 38.0 | 34.9 | |
| Empty ride + In service | 65.0 | 63.7 | 66.5 | 81.2 | 67.8 | 73.9 | 68.8 | |
© 2019 by the authors. Licensee MDPI, Basel, Switzerland. This article is an open access article distributed under the terms and conditions of the Creative Commons Attribution (CC BY) license (http://creativecommons.org/licenses/by/4.0/).
Share and Cite
MDPI and ACS Style
Zhou, Y.; Li, Y.; Hao, M.; Yamamoto, T. A System of Shared Autonomous Vehicles Combined with Park-And-Ride in Residential Areas. Sustainability 2019, 11, 3113. https://doi.org/10.3390/su11113113
AMA Style
Zhou Y, Li Y, Hao M, Yamamoto T. A System of Shared Autonomous Vehicles Combined with Park-And-Ride in Residential Areas. Sustainability. 2019; 11(11):3113. https://doi.org/10.3390/su11113113
Chicago/Turabian StyleZhou, Yefang, Yanyan Li, Mingyang Hao, and Toshiyuki Yamamoto. 2019. "A System of Shared Autonomous Vehicles Combined with Park-And-Ride in Residential Areas" Sustainability 11, no. 11: 3113. https://doi.org/10.3390/su11113113
Note that from the first issue of 2016, this journal uses article numbers instead of page numbers. See further details here.