Circular Economy Indicators as a Supporting Tool for European Regional Development Policies


1
Faculty of Management, AGH University of Science and Technology, 30-059 Krakow, Poland
2
Institute of Geography and Spatial Management, Faculty of Geography and Geology, Jagiellonian University, 31-007 Kraków, Poland
3
Department of Applications of Mathematics in Economics, AGH University of Science and Technology, 30-059 Krakow, Poland
*
Author to whom correspondence should be addressed.
Sustainability 2019, 11(11), 3025; https://doi.org/10.3390/su11113025
Submission received: 7 April 2019
/
Revised: 20 May 2019
/
Accepted: 22 May 2019
/
Published: 28 May 2019
(This article belongs to the Section Economic and Business Aspects of Sustainability)
Abstract
:The current research proposes a system of possible indicators for evaluating progress towards circular economy (CE) at the regional level in European Union countries. This was accomplished through desktop research examining potential CE indicators and approaches to monitoring, worldwide or at the country level, and possibilities for adapting such approaches to European regions. The study has shown that existing tools for monitoring are inadequate for tracking the progress of CE transition at the regional level. Based on those findings, it is possible to propose principles for designing CE indicators, types of indicators, their main characteristics and sources for data collection. The study also presents a case study for tracking CE progress, applying the proposed CE indicators to the Malopolska region in southern Poland. However, comparing CE progress between different European regions may not be feasible because of the limits of data availability. Additional indicators should be identified at the regional level to increase the quality of proposed areas of CE monitoring. Nevertheless, analysing CE indexes for various regions could offer a valuable method for distinguishing regional leaders in CE development to serve as useful examples, while determining which regions need to intensify their efforts toward such a transition.
1. Introduction
Recently, the circular economy (CE) concept has gained the attention of scholars and practitioners as an alternative to the linear economy model, as linear economy’s limitations result in insufficient use of resources and demand fossil fuels consumption [1,2,3,4,5,6,7,8,9]. CE is a completely opposite paradigm which offers an opportunity to rethink existing economic systems in order to increase resource efficiency, turn waste into a resource and implement new approaches to consumption and production based on renting and leasing instead of owning. Such actions should ultimately make economic systems less vulnerable, more sustainable and competitive at micro-level [10,11,12,13], eco-industrial park level [14,15] and macro-level [16,17]. In accordance with such objectives, some European governments and local authorities are already taking steps in the direction of CE implementation, national level initiatives represented by a circular economy in the Netherlands by 2050 [18], Finland’s National Circular Economy Roadmap [19],f ProgRess II-German Resource Efficiency Programme [20], Leading the transition: a circular economy action plan for Portugal [21], Towards a Model of Circular Economy for Italy—Overview and Strategic Framework [22], France Unveils Circular Economy Roadmap [23] and Roadmap towards the Circular Economy in Slovenia [24].
At the same time, a few initiatives were introduced at regional and local levels as well, such as Promoting Green and Circular Economy in Catalonia: Strategy of the Government of Catalonia [25], Brussels Region—Programme Régional en Economie Circulaire (2016) [26], Scotland-Making Things Last: A Circular Economy Strategy for Scotland [27], Circular Amsterdam [28], White Paper on the Circular Economy of Greater Paris [29], Extremadura 2030: Strategy for a Green and Circular Economy [30], London’s Circular Economy Route Map [31] and the Circular Flanders kick-off statement [32].
Progress toward CE and sustainability has become increasingly important not only for Europe, but also for China and most other countries in the world. The CE concept is observed as a new engine of green growth worldwide [33]. That is why there are many attempts to apply the CE approach in various areas of business and public management. Recently, a CE evaluation tool was even proposed for sustainable event management for a hypothetical Olympic Village [34]. Moreover, CE ideas appeared as an urban regeneration model, with universities playing one of the key roles in this process [35]. Numerous attempts have been made to evaluate how CE-based business models could be applied to industry [10,13]. The current study will nevertheless focus mainly on CE in public management, paying the most attention to the theory and practical solutions for EU countries and how these relate to the experiences of other countries.
CE and resource efficiency promotion are in line with the EU’s international commitments like the 2030 Sustainable Agenda, Paris Agreement to combat climate change and G7 Alliance for Resource Efficiency—building more sustainable supply chains and global markets for secondary raw materials.
The EU countries’ deep interest in the CE concept has resulted in realising such framework documents as “Towards a circular economy: A zero-waste program for Europe” [36] and “Closing the loop-An EU action plan for the Circular Economy” [37]. Active involvement of the European Commission (EC) in preparing a CE-supporting environment can also be seen among numerous initiatives and actions encouraging CE reported after one year of implementation of the action plan for the circular economy [38]. One of the most anticipated actions planned by the EC related to CE was presentation of the CE monitoring framework at the end of 2017.
Evaluation of the effectiveness of CE actions is crucial; how to estimate the progress from the linear economy model to the circular economy is a question already appearing in research and practical areas [39,40]. Although CE has become an increasingly sound concept seeing active implementation from micro to macro-levels, there are still only a limited number of studies focusing on measuring circularity for European countries, regions, cities, companies or production and consumption processes. In comparison with China, where CE has become a core strategy for national development with a system of evaluation indicators for national and industrial park levels existing since 2007, Europe continues to lack a unified system of indicators. Each European-level initiative, like those mentioned above, has its own system of indicators, causing difficulties in comparing the effects of CE policy and strategy implementation. Most available research proposing indicators for CE evaluation are in fact based on Chinese experience, presenting case studies from Chinese cities and regions [41,42,43,44,45,46]. Yet as Chinese regions have substantial differences in their levels of development, such regions must also adopt differing CE development strategies [46].
Chinese regional and national CE practices cannot be directly applied to European realities because, as the recent research of [47] has shown, while Chinese and European perspectives on CE share a common conceptual basis and exhibit many similar concerns in seeking resource efficiency, they have different focuses framed by different problems. For China, the problem is more generally environmental problems and pollution, while for Europe the focus is on materials usage, resource efficiency, waste management, new business models, new jobs, eco-innovations, social innovations, etc. [11,48,49]. A European system of indicators should therefore take into account the specific European context of CE.
The current study paid special attention to CE indicators for European regions, given that the current activities of the EC regarding a CE monitoring framework relate to the national and the EU levels while paying limited attention to monitoring procedures for regional- and local-level policies. Such actions may leave a gap between policymaking and practical implementation impacting regional stakeholders. This would be a serious omission as regions are the most important units for realising numerous European policies [50].
There are a few studies proposing frameworks for transition to the circular economy model based on various incentives and instruments [51,52,53], but there is a lack of a system of indicators for evaluation and monitoring of CE progress at the regional level. Thus the main purpose of the current research was proposing a possible system of such regional level CE evaluation indicators.
To satisfy the above objective, the following issues will be addressed; Section 2—the concept and method of the study, presenting the authors’ concept for conducting the current research; Section 3—analysis of existing approaches and indicators of CE-based regional development, analysing the main approaches to CE monitoring and evaluation in the EU and worldwide; Section 4—a CE system of indicators, assumptions for the design and proposals for European regional indicators, presenting the concept for the CE indicators’ design; Section 5—Malopolska region case study using CE indicators and CE index, presenting an example of the practical application of a system of evaluation indicators applied to the Malopolska region of Poland; and Section 6—conclusions from the findings and ideas for future developments.
2. The Concept and Method of the Study
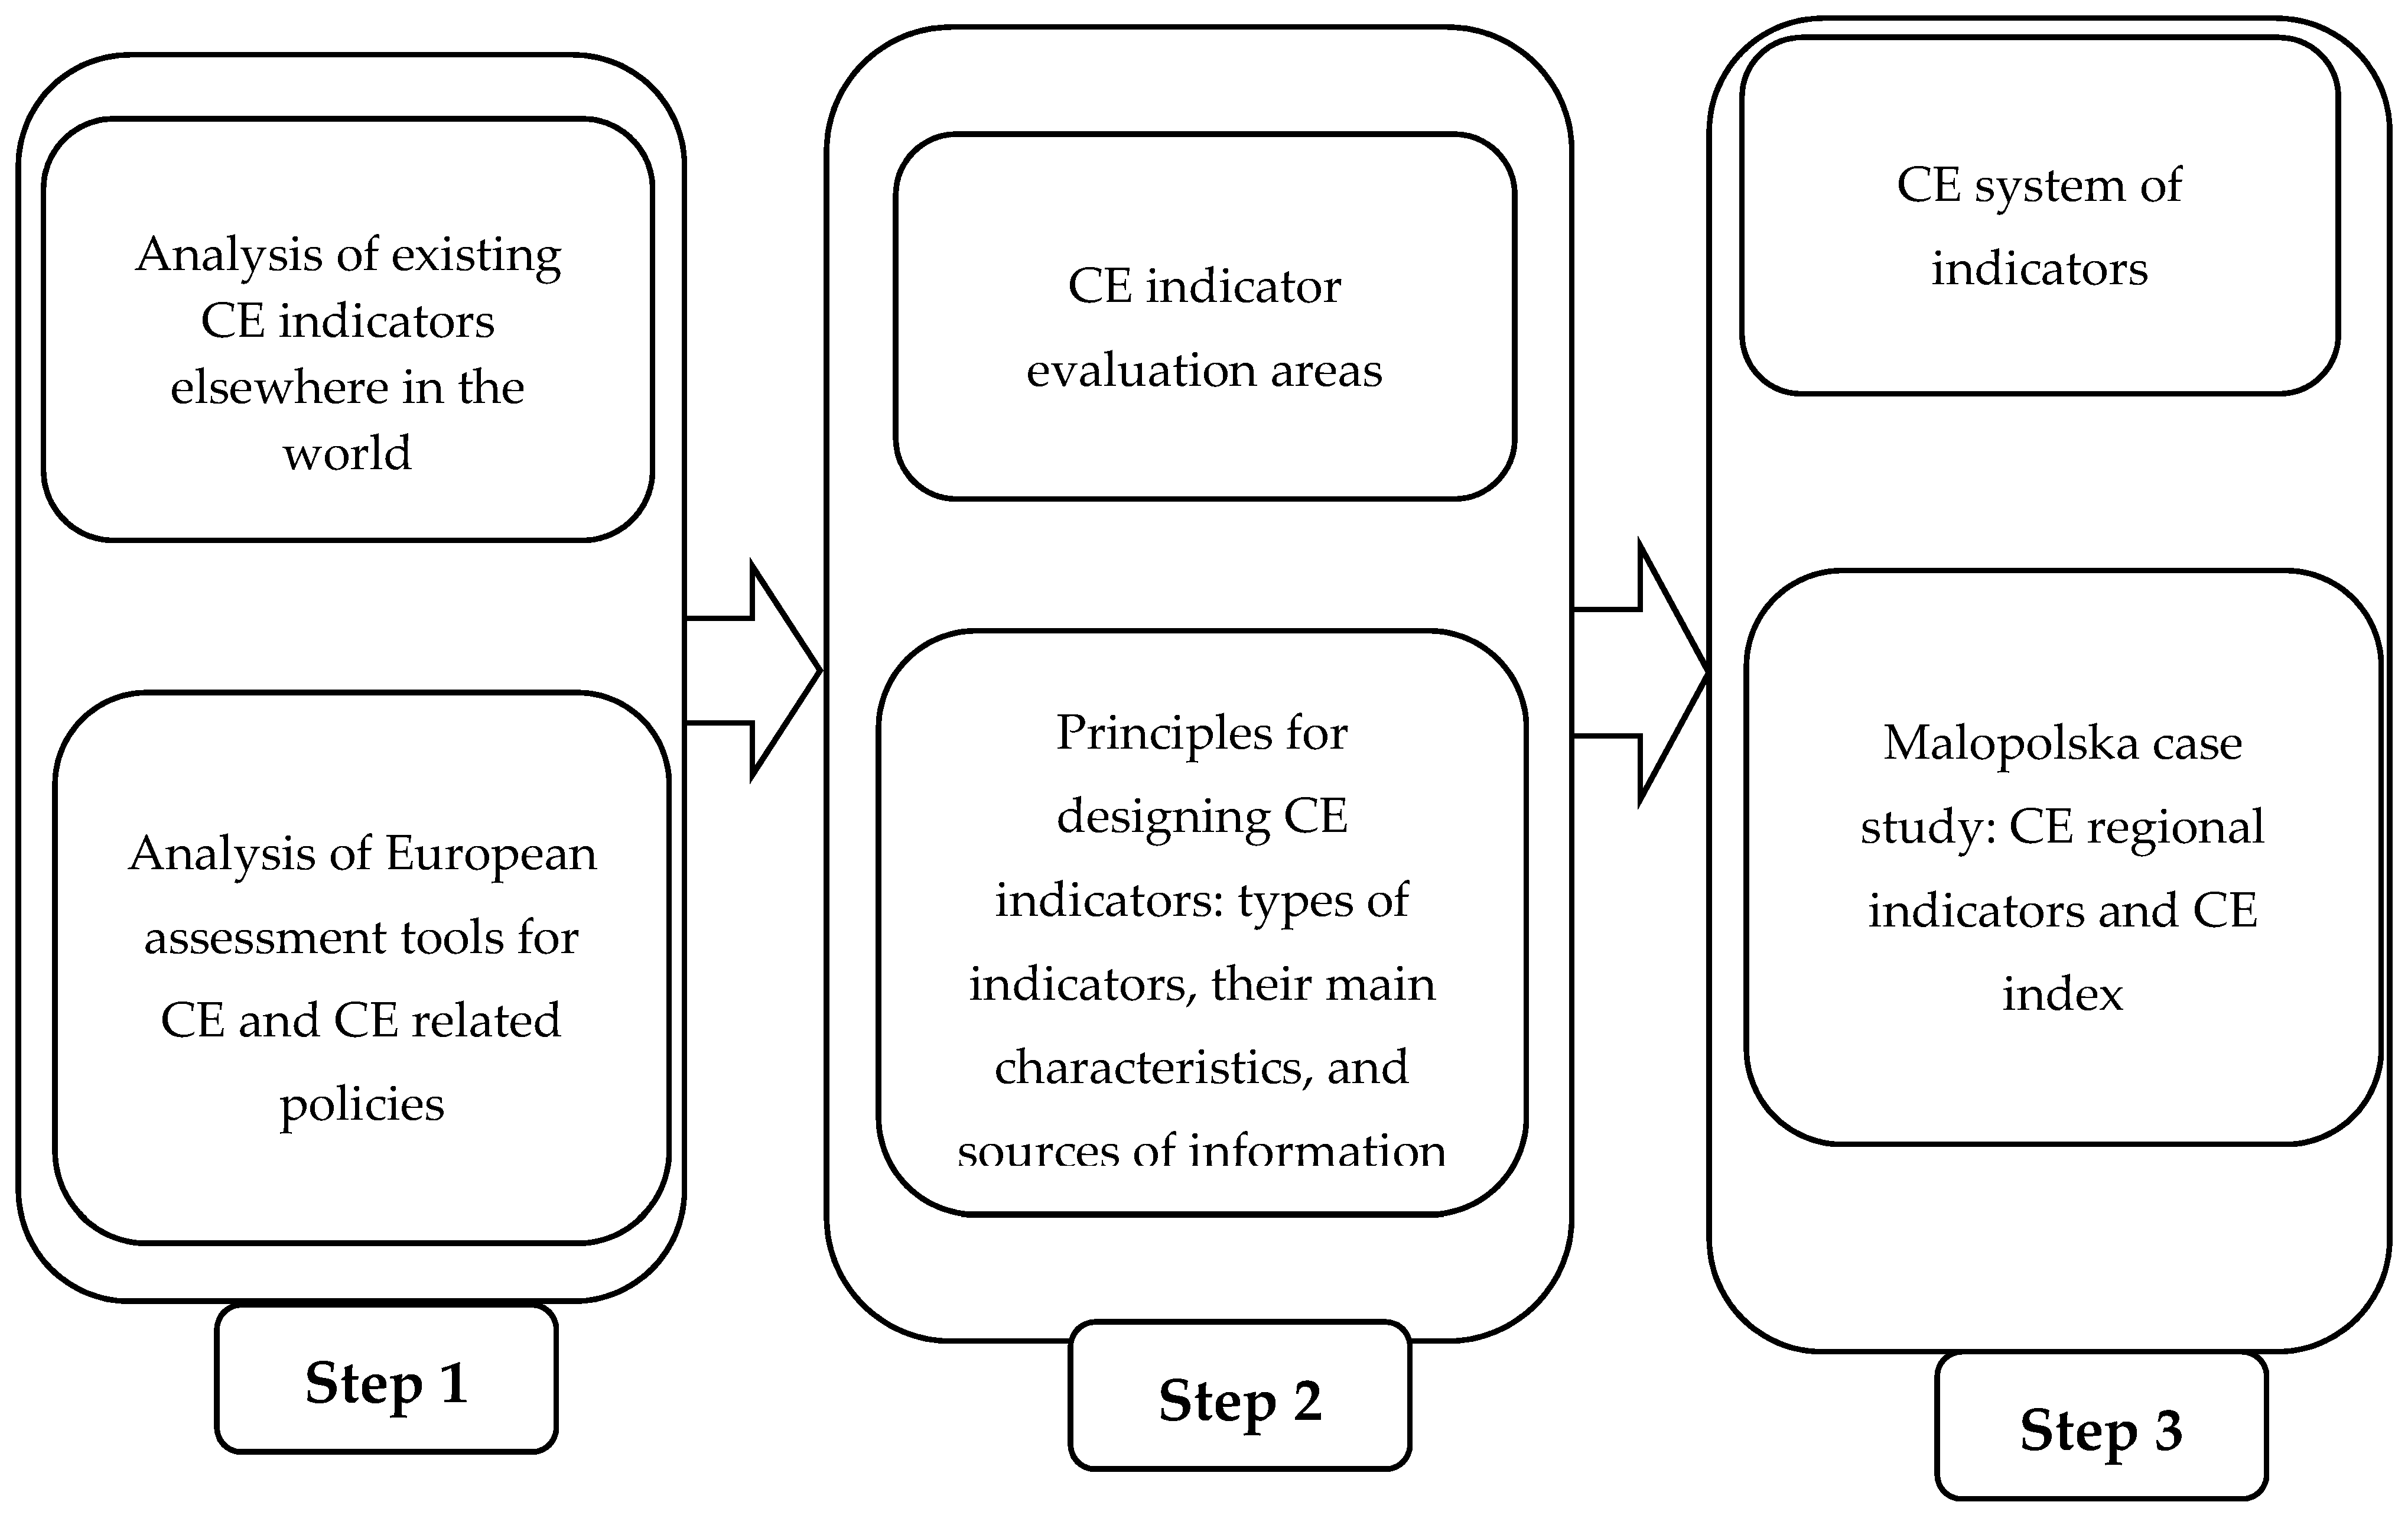
This research was based on the concept presented in Figure 1, consisting of a three-step process to develop indicators for monitoring and evaluating policies and strategies for CE-based regional development. The concept presented below is original and was developed by the authors for achieving the stated goal of the research. It consists of developing a conceptual background for proposing CE indicators and includes the aforementioned case study from the Malopolska region to demonstrate the proposed approach.
- Step 1.
- Firstly, analysis was conducted of existing CE indicators employed around the world, examining their compatibility for use under European conditions. Existing indicators for evaluation of EU policies related to CE issues were also examined. As CE is promoted as a new strategy of development, some measures of evaluating other public development policies could be applied in the case of CE as well.
- Step 2.
- This step identified the main characteristics necessary for region-specific CE indicators, identifying sources for data collection.
- Step 3.
- The final step analysed the research conducted in the first two steps in order to propose a system of indicators for areas identified as the most important for CE at the regional level. A case study was prepared (for the Malopolska region of Poland) to present a practical application of the indicator system.
3. Analysis of Existing Approaches and Indicators of CE-Based Regional Development
3.1. Analysis of Existing CE Indicators
The subject of CE indicators has not yet been exhaustively researched at the EU level because CE has only been actively promoted in the EU since 2014. Experience with CE indicators in China, Japan, the USA and the Republic of Korea is further advanced, having already received significant attention from scholars in China and Europe [17].
The first national system of CE indicators in the case of China was announced in 2007. Those indicators were designed to promote the application of CE, assessing the general performance of CE practice and supporting policymaking processes. These were based on the so-called 3R principles [17]. The National Development and Reform Commission (NDRC) of China established two sets of indicators—one for the macro-level, for general evaluation of CE development of each individual region and for the country as a whole; the other set introduced for the meso-level, for assessing the status of CE development of industrial parks. The proposed systems are continually being developed by the Chinese government, and in order to improve the effectiveness of such indicators, in 2017 the NDRC realised updated CE evaluation indicators which include 17 indicators categorized into three groups. The new system focuses the most on the national and provincial levels [45,54].
The Chinese model of CE evaluation is based not only on the above mentioned indicators, but also on indicators established by China’s National Bureau of Statistics (CNSB) in 2015 [45].
One more set of indicators related to CE in China was released in 2003 by the Ministry of Environmental Protection regarding the “eco-city” dimension [45].
The Chinese approach to measuring CE, as well as the approaches of other countries, such as Japan, the USA and the Republic of Korea, are based on material flows accounting and analysis approaches [17]. As the research of Guo et al. has shown, other key methods for CE evaluation included material flow analysis, life cycle analysis and eco-efficiency analysis [45]. One more study was done by [51] wherein CE evaluation was accomplished using the DEA (data environmental analysis) approach.
These numerous examples demonstrate that systems of CE indicators in China and other developed and developing countries are being actively discussed, developed and implemented. Furthermore, as China has chosen CE as a strategy for national development, numerous pilot projects have been launched to move from theory to implementation of the strategy [55].
In addition to studies on the theoretical and practical aspects of CE in China based on the national system of CE indicators, some of the research was devoted to an index method approach for evaluating CE aspects. A detailed analysis was conducted using this method, resulting in several reviews and proposed general frameworks, but the definition of tools and criteria for measuring the level of circularity of products, companies, or regions is still lacking. The work of Elia et al., focused on critical analysis and comparison of the global effectiveness of the most widespread environmental assessment methodologies based on quantitative indicators and measuring the level of application of CE strategies to companies, products and services [11].
Complex research on the index method’s usage for measuring CE can be seen in several empirical studies that proposed measuring CE in selected regions of China. Qing et al. proposed measuring CE development based on a hierarchical structure model and an evaluation index system [42].
The next research along these lines was done by Jiang et al., studying regional economic development with Fuzzy Comprehensive Evaluation Methods for analysis of CE development in a single region, and Comparison Evaluation Methods to analyse CE development in different regions [44].
One more study examining the regional dimension of CE was carried out by Jla and Zhang in 2011, where fuzzy mathematic and matter elements analysis were used as a model for evaluation of regional CE in the Beijing, Anhui and Sichuan provinces [56].
3.2. European Assessment Tools for CE
At present, indicators for monitoring and evaluating at the EU level exist in the following policies; EUROPE 2020 [57], Sustainable Development Strategy (from 2005 to 2015) [58] and Sustainable Development Goals (since 2016) [59], Euro-indicators/PEEIS [60] and European Pillars of Social Right [61].
Some of these approaches and the data used for monitoring those policies could also be relevant for CE initiatives, for example in Europe 2020 as a strategy for smart, sustainable and inclusive growth for 2014–2020 or in Sustainable Development Goals. On the other hand, some of the above policies such as Euro-indicators/PEEIS, European Pillars of Social Right and Macroeconomic Imbalance Procedure are focused more on general macroeconomic indicators, so their applicability to CE evaluation would be rather limited.
Table 1 presents general information about indicators for monitoring and evaluation of EU policies relevant for some aspects of CE.
These indicators provide valuable tools for monitoring the policies and strategies for which they were dedicated, but their complexity can also cause difficulties for such monitoring. Interpretation of results evaluated by as many as 100 indicators is not necessarily simple and transparent.
As was mentioned above, in December 2017 the European Commission released a CE monitoring framework intended to track the progress of CE implementation at the Member States’ level [62]. There are four main monitoring areas—production and consumption, waste management, secondary raw materials and innovations. The framework consists of 10 main indicators, some of which are broken down into subindicators. The framework released could be described as basic, its monitoring areas focused mainly on resources and materials issues at the EU Member States’ levels.
The European Environment Agency also proposed their approach to designing CE monitoring indicators with the following focus areas; material input, ecodesign, production, consumption and waste recycling [63]. For each focus area, the Agency posed possible “policy questions”, suggested indicators in order to answer such questions and analysed the level of data availability. This would seem to be a reasonable approach as certain policy questions are completely new in comparison with the current linear economy model, thus the data is not yet available. The EEA presented some examples of such indicators, including product lifetime, involvement of companies in CE networks, share of materials where safe recycling options exists, proportion of recycled materials in new products, time and number of necessary tools for disassembly, etc.
One more valuable source of data that should be considered in developing a system of indicators for CE monitoring and evaluation is the so-called European Scoreboards. As preliminary investigation has shown, the following EU scoreboards would be related to monitoring aspects of CE; Resource Efficiency Scoreboard, Raw Materials Scoreboard, European Innovation Scoreboard, Regional Innovation Scoreboard, Digital Agenda Scoreboard, EU Transport Scoreboard, Consumer Conditions Scoreboard, Consumer Markets Scoreboard and Social Scoreboard.
All the analysed approaches were important for identifying the main assumptions on which a regional system of CE indicators should be based.
4. CE System of Indicators: Assumptions for Design and Proposals for European Regional Indicators
As the analysis presented in Section 3 has shown, the EC has already developed general approaches for monitoring and evaluating public policies. Existing approaches are based on systems of indicators, which sometimes have their own hierarchy in order to assess the effectiveness of public policies from various perspectives. Such systems of indicators can be expected to make it possible to monitor movement toward more general and strategic purposes, while at the same time assess operational level achievements. However, as was mentioned above, the complexity could cause difficulties given the volume of data to be interpreted and potential time constraints. An example of such an approach is the set of indicators used for monitoring the Sustainable Development Strategy (SDS) of the EU until 2015. This set included various kinds of indicators responding to different user needs as follows [64].
Level 1: ‘Headline indicators’ monitor the overall objectives related to the key challenges of the SDS. They are widely used indicators with a high communicative and educational value. They are robust and available for most EU Member States, generally for a minimum period of five years.
Level 2: ‘Operational indicators’ are related to the operational objectives of the SDS. They are lead indicators in their subthemes. They are robust and available for most EU Member States for a minimum period of three years.
Level 3: ‘Explanatory indicators’ are related to actions described in the SDS or to other issues which are useful for analysing progress towards the strategy’s objectives. Breakdowns of higher level indicators, e.g., by gender or income group, are usually also found at this level.
In addition to the above, the following indicators were also identified (Eurostat, 2015):
‘Contextual indicators’ are part of the set, but either do not monitor directly a particular SDS objective or they are not policy responsive. Generally, they are difficult to interpret in a normative way. However, they provide valuable background information on issues having direct relevance for sustainable development policies and are helpful in understanding the topic.
‘Indicators under development’ either already exist but are of insufficient quality or coverage (e.g., not yet available for three years or for a majority of Member States) or are known to be currently under development. Indicators under development are expected to become available within two years and of adequate quality.
‘Indicators to be developed’ are either known to be currently under development but no final satisfactory result is expected within two years, or they are currently not being developed.
On the basis of more than 130 indicators, the EC (EUROSTAT) produced several biannual monitoring reports on sustainable development, most recently in 2015 [65]. After 2015, the focus of such monitoring was changed and in 2017 monitoring will be done based on evaluation of EU sustainable development from the Sustainable Development Goals (SDG) perspective set up in the blueprint for global sustainable development—Agenda 2030. The EU SDG indicators set has been developed based on a broad and inclusive process and takes into account input provided by numerous and varied actors, including other services of the EC, EU Member States, international bodies and civil society organisations. This EU SDG indicators set will be used to produce the first EU SDG monitoring report to be released in November 2017 (Eurostat, 2017). Each goal is covered by six indicators, except goals 14 and 17 which only have five indicators. Forty-one indicators are multipurpose indicators (MPIs). These are indicators primarily assigned to one goal but used to monitor other goals as well. Those indicators were simplified and there is no longer a three-level approach. All indicators are headline indicators while some of them play a multipurpose role, assessing more than one SDG.
Indicators management is also important at this point because the abilities and skills of stakeholders to use and interpret the data obtained via the indicator-based analysis is of equal importance. Thus, various tools and methodologies may exist for the application and management of indicators [17]. For this reason, it was important at this stage of the current research to propose principles for indicator design, specifying their scope and possible types.
The conducted analysis has shown that monitoring procedures should strive toward simplicity and transparency, so it would be reasonable to propose a limited number of indicators concentrating on CE focus areas. With that assumption, a general scheme is presented in Figure 2 showing types of indicators, principles for their design and sources for data collection. The proposed concept of the CE indicators’ design is an original one developed by the authors in order to achieve the research goals. At the same time, it incorporates some elements of approaches used in the EU for monitoring and evaluating the effectiveness of implementation of the sustainable development concept via public policies.
The CE concepts in Europe are diverse in scope, targeting not only primary and secondary resource efficiency, but also a wide spectrum of issues such as innovation, new business models, new patterns of consumption, active implementation of smart solutions, ecodesign, green jobs, etc. Those aspects are indicative of the highly interdisciplinary character of CE at the regional level. The current research identified seven main areas of CE demonstrating regional implications of the new economic model:
- (1)
- (2)
- (3)
- (4)
- (5)
- (6)
- (7)
- (8)
- (9)
- (10)
- (11)
- (12)
The current research proposes indicators for each of the above-mentioned areas (Table 2). This includes possible evaluation aspects of monitoring and indicators related to the identified aspects.
The best way to prove the practical application of the proposed approach to CE monitoring based on the indicators system is to prepare a case study for one European region at the NUTS 2 level, as it could help to illustrate the main pros and cons of this monitoring method. It is also helpful for identification of the main barriers and limitations which should be eliminated in order to increase the efficiency of monitoring. Thus, Section 5 of the paper is devoted to the case of CE monitoring in the Malopolska region (southern Poland).
5. CE Malopolska Region: Case Study
5.1. Malopolska Region
The Malopolska region, also known as the Małopolskie Voivodeship or Lesser Poland, is situated in southern Poland. It has an area of 15,108 square kilometres (5833 sq. mi), which, in terms of size, ranks among the smallest regions in the country (12th place). The region has a population of 3,382,260 (8% of the country’s population), with a population density of 223 persons/km2. In 2016 a total of 1,634,901 people lived in urban areas. The level of urbanisation is ~48%. In 2016, Malopolska ranked 4th place among Poland’s regions in terms of the number of registered economic entities (8.7% of all entities in the country) [88].
The economic potential and attractiveness for investment of the region has therefore made it one of the leading regions in the country. This outcome is also due to good transport infrastructure, the region’s location on international transit routes and favourable conditions for investment (creation of special economic zones, advanced scientific and research facilities) [89].
At the same time, the region has some environmental problems; the most serious of them is air pollution. In a WHO report, Krakow was ranked 8th among 575 cities for high levels of PM 2.5 and 145th among 1100 cities for levels of PM 10. The problem of high air pollution spans the whole Malopolska region [90].
Waste statistics for the region show that in 2016, ~975.4 thousand tons of municipal waste was collected in Malopolska, including 601 thousand tons from households. Since 2013 there has been an upward trend in the amount of municipal waste collected (from 702 thousand tons in 2013 to 975.4 thousand tons in 2016). Since 2005, a systematic increase in the amount of waste collected selectively has been observed. In 2016 about 266.3 thousand tons were collected selectively, but this is still only 27.7% of all collected municipal waste [88].
The Malopolska region was chosen for preparing a case study in order to estimate CE progress as Malopolska is one of the leading regions of Poland when it comes to CE issues. Malopolska regional authorities have already started the transition to a CE model. A detailed analysis of CE related actions at the regional level was presented in [91].
One of the most important regional initiatives within Malopolska is participation in the international project SYMBI, or “Industrial Symbiosis for Regional Sustainable Growth and a Resource Efficient Circular Economy”, of which the Marshal Office of the Małopolskie Voivodeship is a partner. The project, financed by the Interreg EU programme, is contributing to the improvement of regional development policies and programmes related to the promotion and dissemination of Industrial Symbiosis and Circular Economy [92].
Malopolska regional authorities and their partners from regions of Finland, Spain, Italy, Hungary, Greece and Slovenia are currently working on project realisation, and already have shared experience in preparing public policies and their opportunities in support of the CE model through such instruments as green public procurement and public–private partnerships. They are currently identifying how these and other public policy instruments could be supportive for industrial symbiosis and CE, and how regional authorities could encourage better cooperation among producers and whole supply chains. This effort would also be helpful in creating favourable conditions for extended producers’ responsibility.
Last year, the project partners prepared case studies for describing the best practices of industrial symbiosis in the regions involved. The project’s activities have not only a promotional character, but also result in the first attempts to introduce CE assumptions at the level of both operational and strategic documents for Malopolska. The first document that was updated in March 2017 is the Waste Management Plan of Malopolska [93], in which the concept of CE was introduced, and new EU regulation related to waste management targets was mentioned. The document identified the main CE areas in which the region should focus while realising the long-term waste management plan. Industrial symbiosis was chosen as one of the main instruments for such policy realisation. Also introduced were numerous actions focusing on waste reduction based on CE assumptions.
Ultimately, the SYMBI project presents an opportunity for Malopolska regional authorities to learn which instruments are most effective. This includes evaluating those instruments already used by more advanced (from the CE point of view) regions of Finland, Spain and Italy, and examines how such practices could be introduced into the regional policies of Malopolska and the policies of the various stakeholders involved (the business sector, NGOs, academic and research communities).
One more document to be updated to introduce CE ideas at the regional level for Malopolska is the Spatial Management Plan for the Malopolska Region [94]. This document is important because spatial management policy could determine how industrial and urban symbiosis could be introduced, organizing regional public spaces important for creating favourable conditions for developing such key CE building blocks as collaborative economy, service economy and social economy.
In addition to SYMBI project realisation, the regional authorities of Malopolska recently organized numerous actions focusing on waste prevention. Such actions in 2013–2017 included the following [95].
- educational campaign “You Segregate-You Recover” with the purpose of dissemination of information on the Waste Management Plan of the region and the new municipal waste management system;
- regional competition “LPR Clean Community” in cooperation with the Voivodeship Fund of Environmental Protection and Water Management with the purpose of identifying and promoting LPR rural and rural–urban communities that have the most effective systems of waste management at the regional level;
- regional competition “Pass it on” for association of housewives in rural areas with the purpose of organizing information actions aimed at promoting a waste management hierarchy, waste reuse, exchange and decoration and repair of old and used goods; and
- upcycling of Malopolska promotional materials after rebranding—the “eco-campaign promoting waste management hierarchy: recycling/upcycling, promotion of repair networks and reuse”; actions taken were focused on upcycling of out-dated banners and sewing of ecological bags distributed among the LPR population and carrying out an information campaign on a radio station dedicated to the prevention of waste.
All the above-mentioned actions show the commitment and readiness of Malopolska authorities to start the transition to a CE model of development. The special role of the various stakeholders involved is emphasized, because it would be impossible to implement institutional changes in the region without effective supportive mechanisms. Here it is crucial to develop effective monitoring mechanisms for tracking the progress towards CE at the regional levels. One of the main mechanisms of monitoring is a system of CE indicators. The case study’s CE indicators and the CE index are presented in the next section of the paper.
5.2. CE Progress in the Malopolska Region
5.2.1. CE Regional Indicators
In order to demonstrate the practical application and opportunities for CE progress at the regional level, data from CE-related indicators for the Malopolska region for 2005 to 2016 was collected and compared with country-level indicators for Poland. Opportunities for monitoring CE in the case study region were limited because of difficulties with data accessibility. Nevertheless, economic prosperity economy, zero-waste economy, innovative economy, energy-efficient and renewable energy-based economy, low carbon economy, smart economy and spatially effective economy areas were chosen for analysis. The majority of the data collected for the CE indicators within these subject areas was available via open data sources, while some elements had to be requested from internal databases of the Malopolska Regional Statistic Office, Environmental Department of the Malopolska Marshal Voivodeship Office and Voivodeship Inspectorate of Environmental Protection. At the same time, areas such as social economy, bioeconomy, service/performance economy and collaboration/sharing economy could not currently be properly monitored as there is a lack of accessible CE-related information in those cases at the regional level for Malopolska.
CE progress in Malopolska and its comparison with the country level was based on 25 indicators within the above-mentioned areas, with each indicator scaled to the population, area or presented as a percentage (Table 3). The indicators presented in Table 3 were proposed by the authors taking into account the specifics of the region, data availability and the assumptions for designing the system of CE indicators for European regions. Such indicators are not certified by the EC but could be recommended for evaluation and monitoring of CE progress in particular European regions. This makes it possible to compare a wide range of regions without the loss of precision of the calculations.
5.2.2. Construction of the CE Index
Combining the indicators into one single index is a problem that may be solved in a few possible ways. To simplify, constructions can be divided into those using expert knowledge and those that do not. Among techniques drawing upon expert knowledge, the simple aggregate index may be listed. In this case each subindicator has a certain weight (weights are positive and sum up to unity) and the index is an equivalent of the weighted arithmetic mean. Ascribing of weights is done with the use of the knowledge of relevant experts. For instance, in Li and Zhang research their index assigned all subindicators with the same weight. As another example, the Analytic Hierarchy Process may be categorized among the experts’ technique as well [96]. The method itself is created on solid mathematical grounds, but its first step relies on expert estimation of the relative strengths of subindicators [97,98]. Similar tendencies may be observed in the case of the Fuzzy Synthesis Appraisal [44].
Among the techniques which do not use expert knowledge, the Grey Correlation Degree method should be distinguished [99] together with principal component analysis [42]. The present thesis applies the last method primarily due to its universalism and the possibility of intuitive interpretation of the results. Not without significance is also the fact that establishing a hierarchy among subindicators can be perceived as questionable, controversial or contentious.
In the first step of construction of the CE index, each indicator was categorized as one with a positive or negative impact on the index. For variables with a positive impact, values were transformed as in Equation (1) [44,45,53]:
and for variables with a negative impact, values were transformed as in Equation (2):
where stands for the value of indicator ‘’ in period ‘’.
The Principal Component Analysis (PCA) is used in this paper as a tool to construct the CE index. The main reason behind this decision was the fact that the selected indicators are highly correlated. In general, the PCA is a statistical technique designed for data reduction. In the case of this index construction, the reduction means a single linear combination of indicators. In order to construct the necessary principal components, the correlation matrix of variables was calculated and then decomposed. Subsequently the leading eigenvectors from the eigendecomposition describe a series of uncorrelated linear combinations of the indicators that contain most of the variance from the dataset. As a result, the eigenvectors from a PCA make it possible to learn more about the underlying structure of the set of indicators.
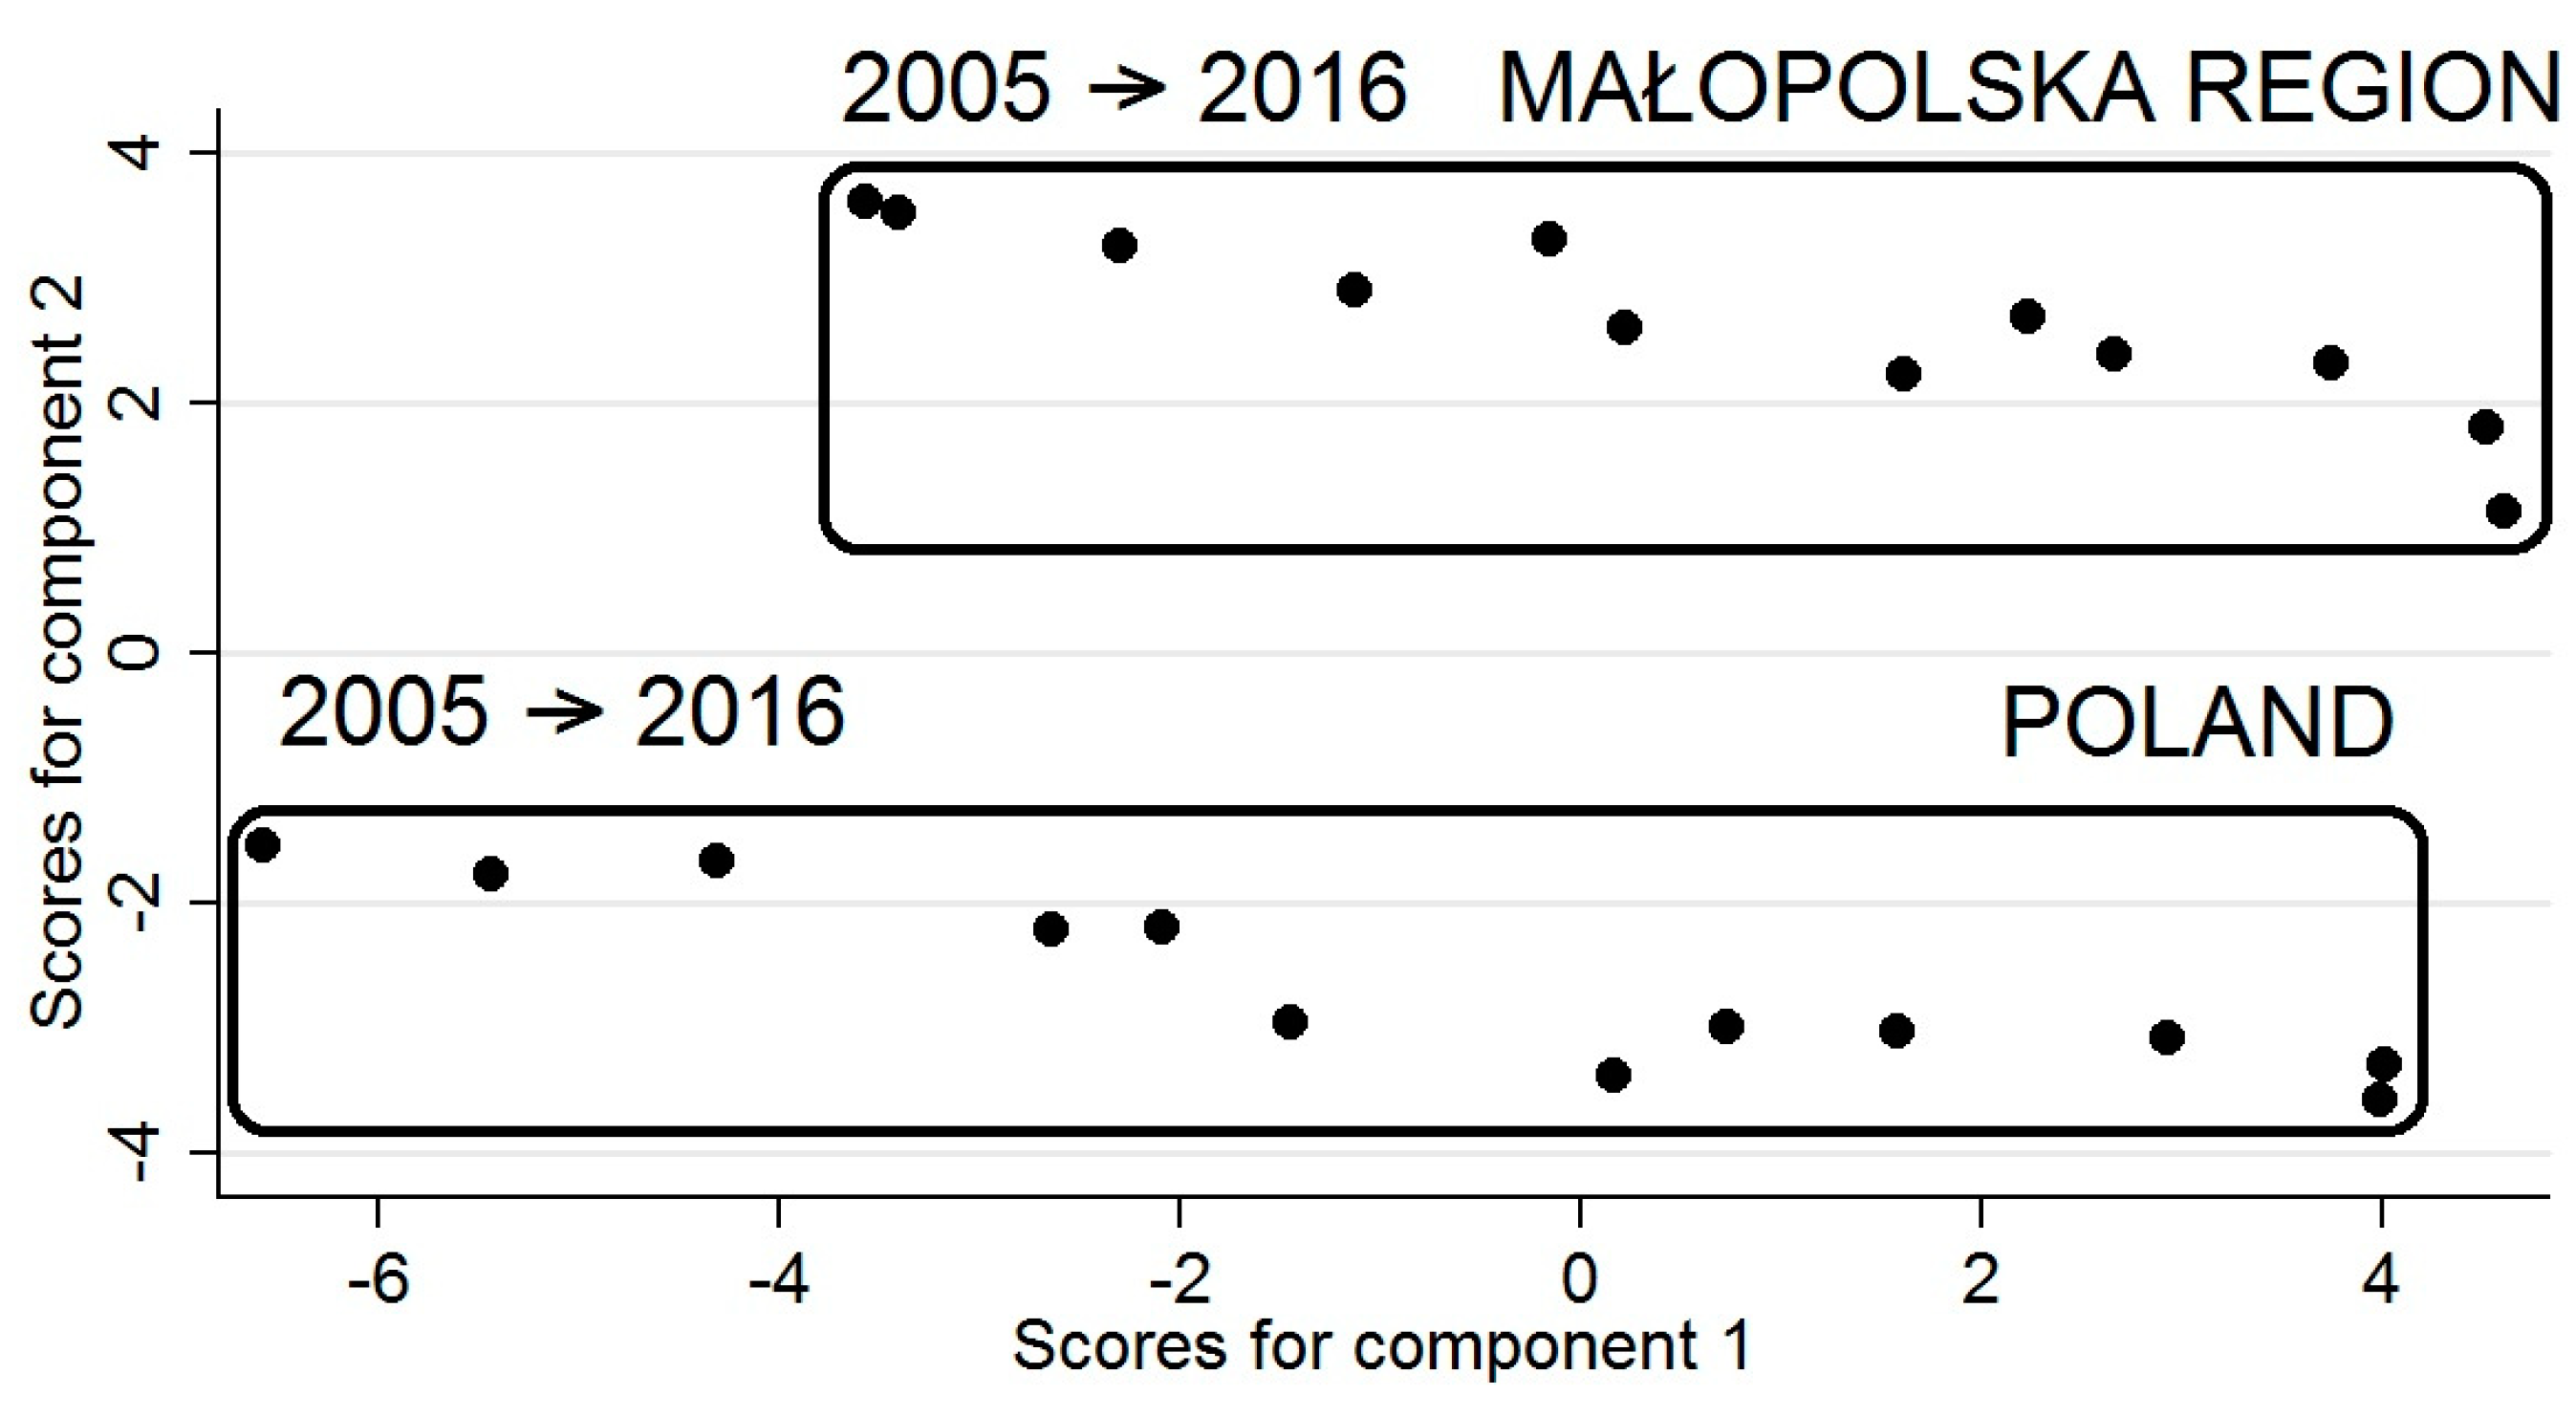
The proportions of variance explained by the selected components are presented in Table 4. The first component explains 43.42% of the variance from the indicators, the second explains 31.12% and they both cumulatively are responsible for ~75% of the variance. The impact of further components is relatively small. For each eigenvalue, a linear combination of indicators was produced and evaluation scores for the years 2005–2016 for both the Malopolska region and Poland as a whole were calculated (Details available on request.).
Figure 3 was prepared with the intention to visualize evaluation scores for the first two components. The points on the graph represent the values of the first and second components for the Malopolska region and for Poland annually for the period of 2005 to 2016. The obtained scores for the variables are clearly clustered into two groups. One can observe that the scores for the Malopolska region are significantly higher than the scores for Poland. This relationship is observable both for the first and second components. In the following years, it can be seen that the values of the first component increase for both observed regions; however, this increase is suppressed by the second component, the values of which are gradually decreasing.
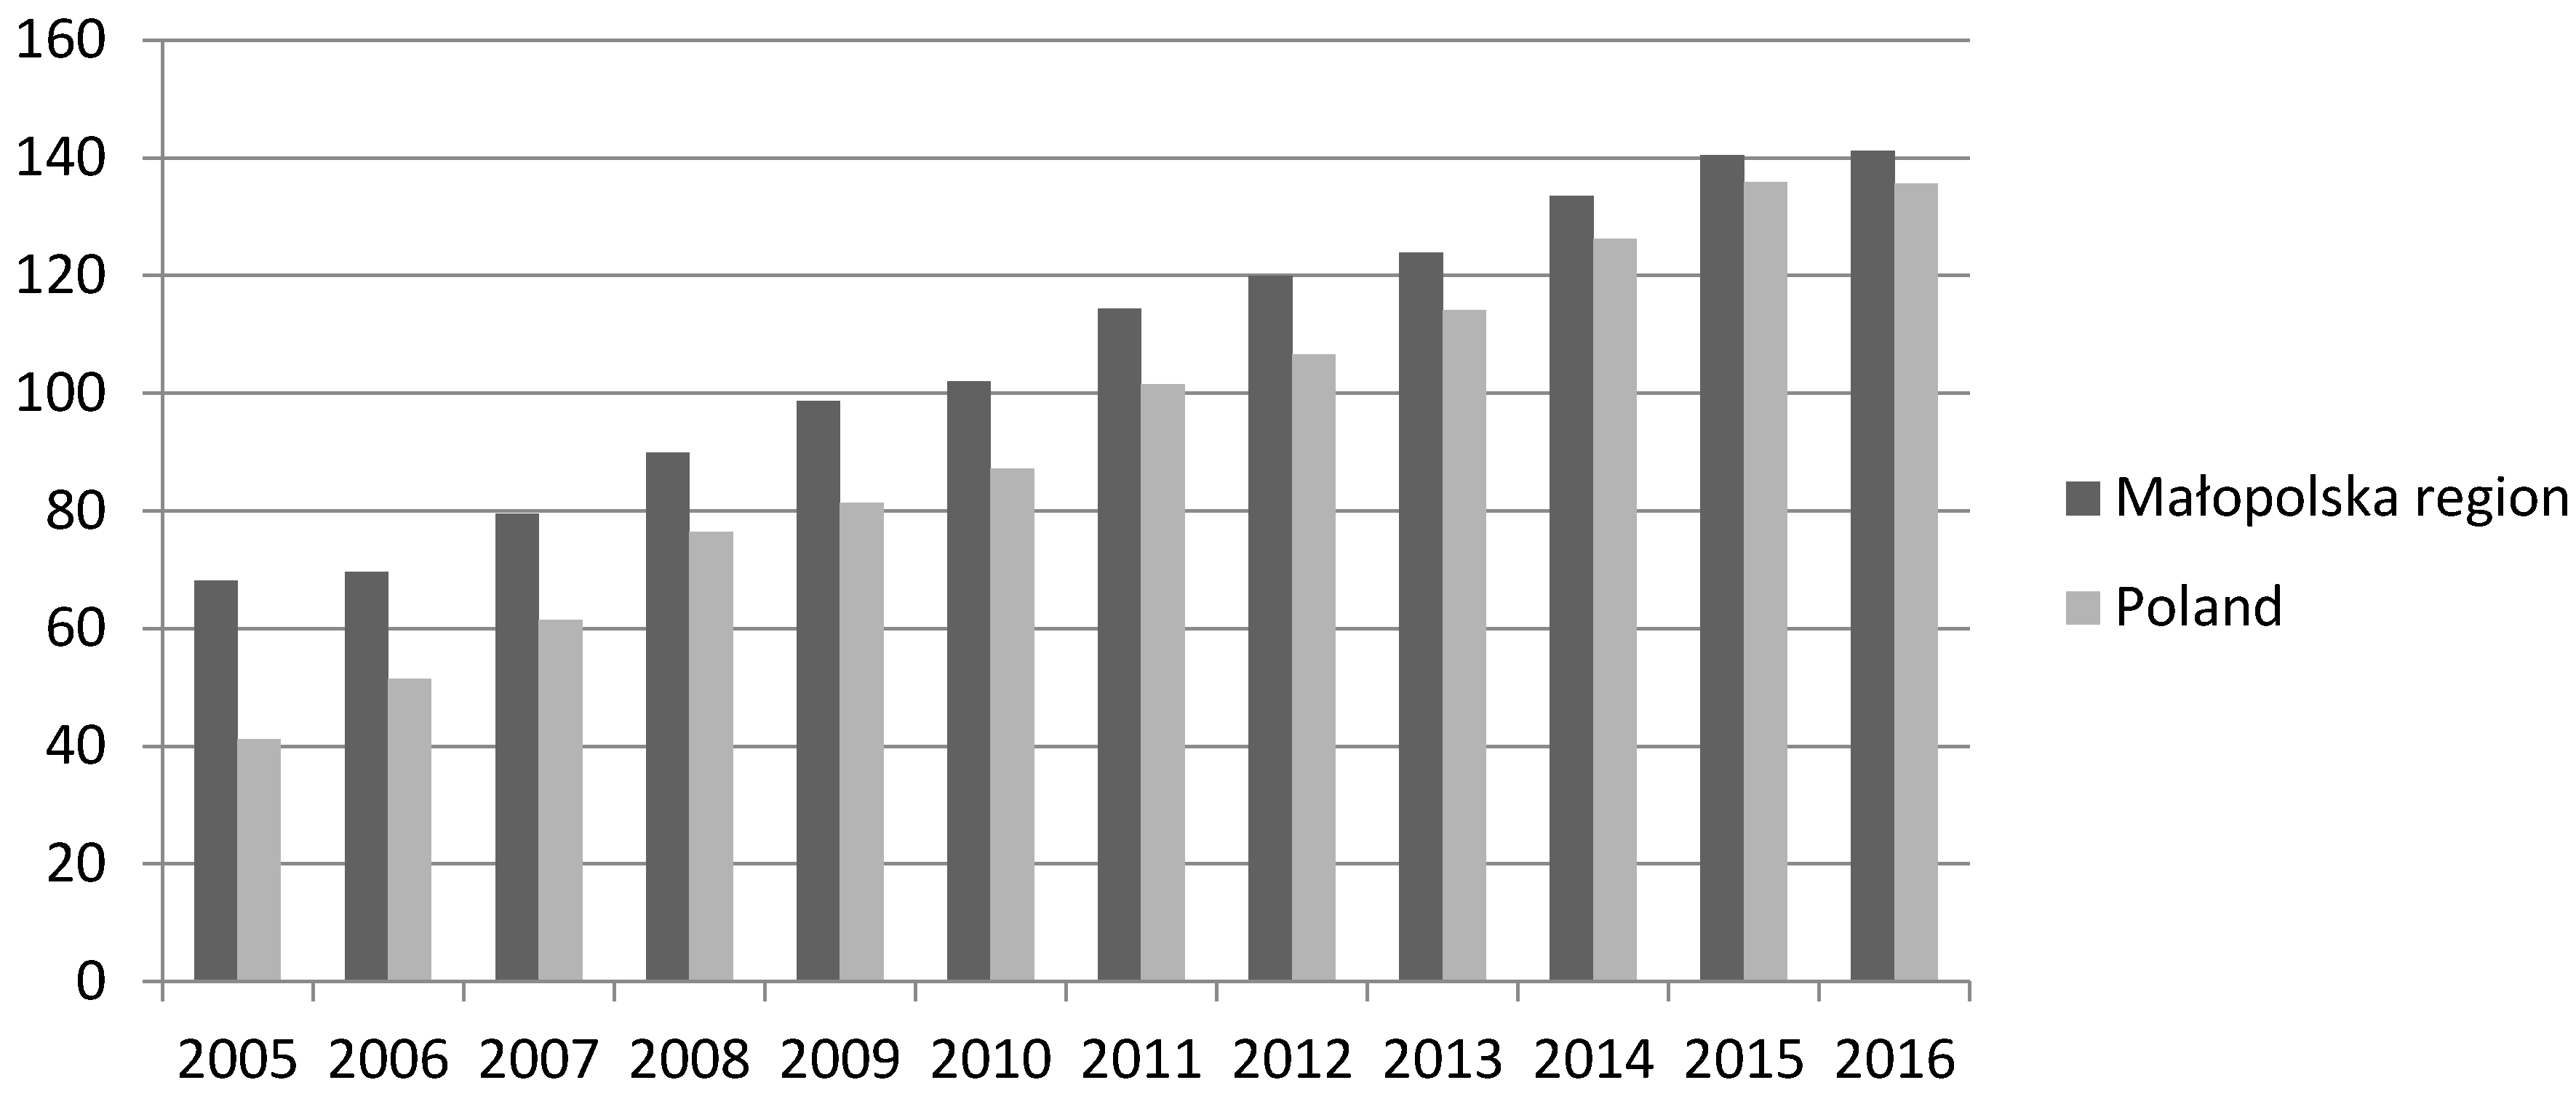
The first component was used to build the CE index. Finally, Equation (3) was used to define the index values:
where presents the score for variable ‘’ and stands for the mean value of variable scores. The values were thus transformed to express the percentage deviation from the center of the min–max interval. The results are presented in Figure 4.
6. Discussion and Conclusions
This study has focused on recent trends in CE indicators as a monitoring tool for supporting European regional development policies. Its findings are intended to help regional policymakers to track the progress towards CE transition in order to achieve smart and sustainable growth. The proposed methodology for monitoring CE using the specific indicators selected within CE-related areas is proposed as the main result of the current research. It is intended to be an additional supporting instrument for developing a variety of monitoring actions to track the effects of CE-based regional development within the European context.
As this analysis has shown, existing approaches for monitoring focus greatly on Chinese CE assumptions and priorities. Thus far, both national level actions and academic research regarding CE-based development strategy propose assessment areas and indicators primarily relevant for the macro and meso-levels of development in China. Existing indicators cover resource efficiency, waste management, water, pollution and some social and economic issues, which are also important for European countries and regions. At the same time, European and Asian priorities differ to an extent, and European monitoring and evaluation need to focus on priorities relevant for its countries and regions. Existing CE monitoring in Europe does not cover such crucial aspects as tracking changes in consumption and production models, the spatial dimension influenced by CE strategies and social, economic and cultural changes caused by reorientation toward CE-based regional development. Nevertheless, the approaches presented in the analysed research for CE indicators’ design can be adapted as a starting point for measuring the European dimensions of CE at national or regional levels.
CE transformation also has a strong rebound effect as in any transformation process. In such a situation, monitoring and tracking changes caused by CE transformation plays an important role by offering policymakers a chance to adapt and correct strategies and actions according to information obtained through regular evaluation. Without regular feedback about CE’s effects, it would be impossible to implement the best CE solutions at the regional level. CE monitoring indicators should be tailored through strategies and action plans specific to each region. The current study proposed general approaches for developing a set of monitoring indicators, but each region will require its own monitoring system considering the specifics and peculiarities of local CE processes. That is why regional authorities should start from the adaptation of existing regional development strategies or develop new ones based on CE’s core concepts. Only after having a CE-focused strategy should a system of CE monitoring indicators be developed.
The CE monitoring framework released by the European Commission at the end of 2017 is not detailed enough for monitoring the effects of important CE areas like social innovations, eco-innovations, sharing economy initiatives, the level of greening of the main economic sectors, new business models’ implementation, ecodesign and architecture initiatives. Yet those aspects were identified in recent research on CE from a European perspective as highly important at the regional and local levels [50,69,100]. For the time being, the European Commission’s monitoring actions were proposed only for the national level, with no proposals for the other operational levels of implementation. Thus, even when first steps towards CE monitoring at the national level are undertaken in the EU, the existing framework would not adequately capture CE effects at the local and regional levels. The region as an administrative unit is, however, vital in the context of European Union development policy, necessitating the selection of the proposed CE monitoring indicators in the above analysis.
Additionally, this research has presented a case study in Section 5 of the paper to serve as a valuable example of the practical application of the proposed indicator system, revealing a continuous, yearly increase in the CE indicator value for Malopolska over a period of 12 years. Comparing the situation in Malopolska with that of the whole country (Poland), it is readily apparent that from 2005 to 2008 the index value for Poland is rising faster than for the Malopolska region. Therefore, it can be assumed that other parts of Poland are developing more rapidly. However, to make more detailed conclusions, further research should be conducted.
Unfortunately, in the current context it must be pointed out that comparisons between regions of different countries are not feasible due to the lack of availability of data. Eventually, analysing CE indexes for selected regions may prove to be the proper method for distinguishing leaders in CE implementation—or those particularly lagging—which could be used as positive or negative examples.
In order to develop the CE index using Principal Component Analysis, the existence of strong correlations between variables was assumed. In this context, further analysis could prove beneficial of the causal relationships between variables, and of the way in which changes in selected components of the index influence the industry of the region, especially consumption and production.
Further research related to CE implementation at the regional level will be devoted to developing a CE regional model in the form of a dynamic stochastic general equilibrium (DSGE) model. DSGE models are useful tools for policymakers because they use modern macroeconomic theory to explain and predict an economy’s response to various policy scenarios, in particular, allowing for the observation of the long term benefits from CE implementation.
Author Contributions
Conceptualization, A.A.; Methodology: A.A. and P.Z.; Software: P.Z.; Validation: P.Z.; Formal Analysis: A.A. and P.Z.; Investigation: A.A. and P.Z.; Resources A.A. and P.Z.; Data Curation: A.A. and P.Z.; Writing—Original Draft Preparation: A.A. and P.Z.; Writing—Review & Editing: A.A. and P.Z.; Visualization: A.A. and P.Z.; Supervision A.A.; Project Administration: A.A.; Funding Acquisition: A.A.
Funding
This research was funded by the European Union’s Horizon 2020 research and innovation programme under the Marie Skłodowska-Curie grant agreement No. 665778. The project has also received funding from the National Science Centre, Poland, POLONEZ funding programme (project registration number 2015/19/P/HS4/02098) ![Sustainability 11 03025 i001]()
![Sustainability 11 03025 i002]() .
.

 .
.Conflicts of Interest
The authors declare no conflicts of interest. The founding sponsors had no role in the design of the study; in the collection, analyses, or interpretation of data; in the writing of the manuscript, or in the decision to publish the results.
References
- Kobza, N.; Schuster, A. Building a responsible Europe—The value of circular economy. IFAC-PapersOnLine 2016, 49, 111–116. [Google Scholar] [CrossRef]
- Geissdoerfer, M.; Savaget, P.; Bocken, N.M.P.; Hultink, E.J. The Circular Economy e a new sustainability paradigm? J. Clean. Prod. 2017, 143, 757–768. [Google Scholar] [CrossRef]
- Korhonen, J.; Honkasalo, A.; Seppälä, J. Circular Economy: The Concept and its Limitations. Ecol. Econ. 2018, 143, 37–46. [Google Scholar] [CrossRef]
- Domenech, T.; Bleischwitz, R.; Doranova, A.; Panayotopoulos, D.; Roman, L. Mapping Industrial Symbiosis Development in Europe_ typologies of networks, characteristics, performance and contribution to the Circular Economy. Resour. Conserv. Recycl. 2019, 141, 76–98. [Google Scholar] [CrossRef]
- Lakatos, E.S.; Cioca, L.-I.; Dan, V.; Ciomos, A.O.; Crisan, O.A.; Barsan, G. Studies and investigation about the attitude towards sustainable production, consumption and waste generation in line with circular economy in Romania. Sustainability 2018, 10, 865. [Google Scholar] [CrossRef]
- Rada, E.C.; Ragazzi, M.; Torretta, V.; Castagna, G.; Adami, L.; Cioca, L.I. Circular economy and waste to energy. AIP Conf. Proc. 2018, 1968, 030050. [Google Scholar]
- Walmsley, T.G.; Varbanov, P.S.; Su, R.; Ong, B.; Lal, N. Frontiers in process development, integration and intensification for circular life cycles and reduced emissions. J. Clean. Prod. 2018, 201, 178–191. [Google Scholar] [CrossRef]
- Ragazzi, M.; Fedrizzi, S.; Rada, E.C.; Ionescu, G.; Ciudin, R.; Cioca, L.I. Experiencing Urban Mining in an Italian Municipality towards a Circular Economy vision. Energy Procedia 2017, 119, 192–200. [Google Scholar] [CrossRef]
- D’Amato, D.; Droste, N.; Allen, B.; Kettunen, M.; Lahtinen, K.; Korhonen, J.; Leskinen, P.; Matthies, B.; Toppinen, B. Green, circular, bio economy: A comparative analysis of sustainability avenues. J. Clean. Prod. 2017, 168, 716–734. [Google Scholar] [CrossRef]
- Lewandowski, M. Designing the Business Models for Circular Economy—Towards the Conceptual Framework. Sustainability 2016, 8, 43. [Google Scholar] [CrossRef]
- Elia, V.; Gnoni, M.G.; Tornese, F. Measuring circular economy strategies through index methods: A critical analysis. J. Clean. Prod. 2017, 142, 2741–2751. [Google Scholar] [CrossRef]
- Wang, P.C.; Che, F.; Fan, S.S.; Gu, C. Ownership governance, institutional pressures and circular economy accounting information disclosure an institutional theory and corporate governance theory perspective. Chin. Manag. Stud. 2013, 8, 487–501. [Google Scholar] [CrossRef]
- Khazami, N.; Ymeri, P.; Fogarassy, C. Investigating the current business model innovation trends in the biotechnology industry. J. Bus. Econ. Manag. 2019, 20, 63–85. [Google Scholar] [CrossRef]
- Zeng, H.; Chen, X.; Xiao, X.; Zhou, Z. Institutional pressures, sustainable supply chain management, and circular economy capability: Empirical evidence from Chinese eco-industrial park firms. J. Clean. Prod. 2017, 155, 54–65. [Google Scholar] [CrossRef]
- Zhao, H.; Zhao, H.; Guo, S. Evaluating the comprehensive benefit of eco-industrial parks by employing multi-criteria decision making approach for circular economy. J. Clean. Prod. 2017, 142, 2262–2276. [Google Scholar] [CrossRef]
- Geng, Y.; Doberstein, B. Developing the circular economy in China: Challenges and opportunities for achieving “leapfrog development”. Int. J. Sustain. Dev. World Ecol. 2008, 15, 231–239. [Google Scholar] [CrossRef]
- Geng, Y.; Fu, J.; Sarkis, J.; Xue, B. Towards a national circular economy indicator system in China: An evaluation and critical analysis. J. Clean. Prod. 2012, 23, 216–224. [Google Scholar] [CrossRef]
- A Circular Economy in the Netherlands by 2050. Dutch Ministry of Environment 2016. Available online: https://www.oecd.org/environment/ministerial/whatsnew/2016-ENV-Ministerial-Netherlands-Circular-economy-in-the-Netherlands-by-2050.pdf (accessed on 14 October 2018).
- Leading the Cycle Finnish Road Map to a Circular Economy 2016–2025. Sitra Studies 121. 2016. Available online: https://media.sitra.fi/2017/02/24032659/Selvityksia121.pdf (accessed on 28 October 2018).
- Germany-German Resource Efficiency Programme (ProgRess II). Federal Ministry for the Environment, Nature Conservation, Building and Nuclear Safety 2016. Available online: http://www.bmub.bund.de/fileadmin/Daten_BMU/Pools/Broschueren/german_resource_efficiency_programme_ii_bf.pdf (accessed on 14 October 2018).
- Leading the Transition: A Circular Economy Action Plan for Portugal: 2017–2020. Ministry of Environment of Portugal 2017. Available online: https://circulareconomy.europa.eu/platform/sites/default/files/strategy_-_portuguese_action_plan_paec_en_version_3.pdf (accessed on 14 October 2018).
- Towards a Model of Circular Economy for Italy—Overview and Strategic Framework. Ministry for the Environment, Land and Sea Ministry of Economic Development 2017. Available online: https://circulareconomy.europa.eu/platform/sites/default/files/strategy_-_towards_a_model_eng_completo.pdf (accessed on 14 October 2018).
- France Unveils Circular Economy Roadmap. The French Ministry of Ecological and Solidarity Transition. 2018. Available online: https://www.ecologique-solidaire.gouv.fr/sites/default/files/FREC%20-%20EN.pdf (accessed on 14 October 2018).
- Roadmap towards the Circular Economy in Slovenia. Circular Change 2018. Available online: http://www.vlada.si/fileadmin/dokumenti/si/projekti/2016/zeleno/ROADMAP_TOWARDS_THE_CIRCULAR_ECONOMY_IN_SLOVENIA.pdf (accessed on 14 October 2018).
- Promoting Green and Circular Economy in Catalonia: Strategy of the Government of Catalonia. The Government of Catalonia. 2015. Available online: https://circulareconomy.europa.eu/platform/strategies; http://mediambient.gencat.cat/web/.content/home/ambits_dactuacio/empresa_i_produccio_sostenible/economia_verda/impuls/IMPULS-EV_150519.pdf (accessed on 14 October 2018).
- Programme Régional En Economie Circulaire 2016–2020. Ministry of Housing, Quality of Life, Environment and Energy of Belgium; Minister of the Economy, Employment and Professional Training 2016. Available online: http://document.environnement.brussels/opac_css/elecfile/PROG_160308_PREC_DEF_FR (accessed on 14 October 2018).
- A Circular Economy Strategy for Scotland Report. The Scottish Government. 2016. Available online: https://circulareconomy.europa.eu/platform/sites/default/files/making_things_last.pdf (accessed on 14 October 2018).
- Circular Amsterdam: A vision and Action Agenda for the City and Metropolitan Area. City Government of Amsterdam. 2016. Available online: https://www.circle-economy.com/wp-content/uploads/2016/04/Circular-Amsterdam-EN-small-210316.pdf (accessed on 14 October 2018).
- White Paper on the Circular Economy of the Greater Paris. City Government of Paris. 2016. Available online: https://api-site.paris.fr/images/77050 (accessed on 14 October 2018).
- Extremadura 2030: Strategy for a Green and Circular Economy. Regional Government of Extremadura. 2017. Available online: http://extremadura2030.com/wp-content/uploads/2018/05/estrategia2030.pdf (accessed on 14 October 2018).
- London’s Circular Economy Route Map. London Waste and Recycling Board. 2017. Available online: https://www.lwarb.gov.uk/wp-content/uploads/2015/04/LWARB-London%E2%80%99s-CE-route-map_16.6.17a_singlepages_sml.pdf (accessed on 14 October 2018).
- Circular Flanders Kick-off Statement. Vlaanderen Circulair. 2017. Available online: https://circulareconomy.europa.eu/platform/sites/default/files/kick-off_statement_circular_flanders.pdf (accessed on 14 October 2018).
- Welfens, P.; Bleischwitz, R.; Geng, Y. Resource efficiency, circular economy and sustainability dynamics in China and OECD countries. Int. Econ. Econ. Policy 2017, 14, 377–382. [Google Scholar] [CrossRef] [Green Version]
- Horvath, B.; Kovacs, A.; Szőke, L.; Takacs-Gyorgy, K.A. Circular Evaluation Tool for Sustainable Event Management—An Olympic Case Study. Acta Polytech. Hung. 2017, 14, 161–177. [Google Scholar]
- De Medici, S.; Riganti, P.; Viola, S. Circular Economy and the Role of Universities in Urban Regeneration: The Case of Ortigia, Syracuse. Sustainability 2018, 10, 4305. [Google Scholar] [CrossRef]
- Commission of European Communities. Towards a Circular Economy: A Zero Waste Programme for Europe; Communication No. 398; (COM (2014), 398); Commission of European Communities: Brussels, Belgium, 2014; Available online: http://ec.europa.eu/environment/circular-economy/pdf/circular-economy-communication.pdf (accessed on 5 April 2019).
- Commission of European Communities. Closing the Loop—An EU Action Plan for the Circular Economy; Communication No. 614; (COM (2015), 614); Commission of European Communities: Brussels, Belgium, 2015; Available online: https://eur-lex.europa.eu/resource.html?uri=cellar:8a8ef5e8-99a0-11e5-b3b7-01aa75ed71a1.0012.02/DOC_1&format=PDF (accessed on 5 April 2019).
- Commission of European Communities. Communication No. 33, 2017. Report from the Commission to the European Parliament, the Council, the European Economic and Social Committee and the Committee of the Regions on the implementation of the Circular Economy Action Plan (COM (2017), 33). Available online: http://ec.europa.eu/eu2020/pdf/COMPLET%20EN%20BARROSO%20%20%20007%20-%20Europe%202020%20-%20EN%20version.pdf (accessed on 5 April 2019).
- Petit-Boix, A.; Leipold, S. Circular economy in cities: Reviewing how environmental research aligns with local practices. J. Clean. Prod. 2018, 195, 1270–1281. [Google Scholar] [CrossRef]
- De Abreu, M.C.S.; Ceglia, D. On the implementation of a circular economy: The role of institutional capacity-building through industrial symbiosis. Resour. Conserv. Recycl. 2018, 138, 99–109. [Google Scholar] [CrossRef]
- Geng, Y.; Zhu, Q.; Doberstein, B.; Fujita, T. Implementing China’s circular economy concept at the regional level: A review of progress in Dalian, China. Waste Manag. 2009, 29, 996–1002. [Google Scholar] [CrossRef]
- Qing, Y.; Mingyue, C.; Qiongqiong, G. Research on the Circular Economy in West China. Energy Procedia 2011, 5, 1425–1432. [Google Scholar] [CrossRef] [Green Version]
- Yang, Q.; Gao, Q.; Chen, M. Study and Integrative Evaluation on the development of Circular Economy of Shaanxi Prince. Energy Procedia 2011, 5, 1568–1578. [Google Scholar] [CrossRef]
- Jiang, G.-G. Empirical Analysis of Regional Circular Economy Development--Study Based on Jiangsu, Heilongjiang, Qinghai Province. Energy Procedia 2011, 5, 125–129. [Google Scholar] [CrossRef] [Green Version]
- Guo, B.; Geng, Y.; Ren, J.; Zhu, L.; Liu, Y.; Sterr, T. Comparative assessment of circular economy development in China’s four megacities: The case of Beijing, Chongqing, Shanghai and Urumqi. J. Clean. Prod. 2017, 162, 234–246. [Google Scholar] [CrossRef]
- Jakhar, S.K.; Mangla, S.K.; Luthra, S.; Kusi-Sarpong, S. When stakeholder pressure drives the circular economy Measuring the mediating role of innovation capabilities. Manag. Decis. 2018, 57, 904–920. [Google Scholar] [CrossRef]
- Zhang, B.; Bi, J.; Fan, Z.; Yuana, Z.; Gea, J. Eco-efficiency analysis of industrial system in China: A data envelopment analysis approach. Ecol. Econ. 2008, 68, 306–316. [Google Scholar] [CrossRef]
- Parchomenko, A.; Nelen, D.; Gillabel, J.; Rechberger, H. Measuring the circular economy—A Multiple Correspondence Analysis of 63 metrics. J. Clean. Prod. 2018, 210, 200–216. [Google Scholar] [CrossRef]
- Azevedo, S.G.; Godina, R.; Matias, J.C.O. Proposal of a sustainable circular index for manufacturing companies. Resources 2017, 6, 63. [Google Scholar] [CrossRef]
- McDowall, W.; Geng, Y.; Huang, B.; Bartekova, E.; Bleischwitz, R.; Turkeli, S.; Kemp, R.; Domenech, T. Circular Economy Policies in China and Europe. J. Ind. Ecol. 2017, 21, 651–661. [Google Scholar] [CrossRef] [Green Version]
- Wu, H.-Q.; Shi, Y.; Xia, Q.; Zhu, W.-D. Effectiveness of the policy of circular economy in China: A DEA-based analysis for the period of 11th five-year-plan. Resour. Conserv. Recycl. 2014, 83, 163–175. [Google Scholar] [CrossRef]
- Scheinberg, A.; Nesic, J.; Savain, R.; Luppi, P.; Sinnott, P.; Petean, F.; Pop, F. From collision to collaboration—Integrating informal recyclers and re-use operators in Europe: A review. Waste Manag. Res. 2018, 34, 820–839. [Google Scholar] [CrossRef] [PubMed]
- Botezat, E.A.; Dodescu, A.O.; Văduva, S.; Fotea, S.L. An Exploration of Circular Economy Practices and Performance among Romanian Producers. Sustainability 2018, 10, 3191. [Google Scholar] [CrossRef]
- Vermunt, D.A.; Negro, S.O.; Verweij, P.A.; Kuppens, D.V.; Hekkert, M.P. Exploring barriers to implementing different circular business models. J. Clean. Prod. 2019, 222, 891–902. [Google Scholar] [CrossRef] [Green Version]
- Su, B.; Heshmati, A.; Geng, Y.; Yu, X. A review of the circular economy in China: Moving from rhetoric to implementation. J. Clean. Prod. 2013, 42, 215–227. [Google Scholar] [CrossRef]
- JIa, C.-R.; Zhang, J. Evaluation of Regional Circular Economy Based on Matter Element Analysis. Procedia Environ. Sci. 2011, 11, 637–642. [Google Scholar] [CrossRef] [Green Version]
- Europe 2020. A Strategy for Smart, Sustainable and Inclusive Growth. Communication from the Commission. Communication No. 2020, 2010 (COM (2010), 2020). Brussels 2010. Available online: http://ec.europa.eu/eu2020/pdf/COMPLET%20EN%20BARROSO%20%20%20007%20-%20Europe%202020%20-%20EN%20version.pdf (accessed on 5 April 2019).
- A Sustainable Europe for a Better World: A European Union Strategy for Sustainable Development Communication from the Commission; (COM(2001)264); Brussels. 2001. Available online: https://ec.europa.eu/regional_policy/archive/innovation/pdf/library/strategy_sustdev_en.pdf (accessed on 5 April 2019).
- Next Steps for a Sustainable European Future European Action for Sustainability. Communication from the Commission to the European Parliament, the Council, the European Economic and Social Committee and the Committee of The Regions; (COM(2016) 739); Brussels. 2016. Available online: https://ec.europa.eu/europeaid/sites/devco/files/communication-next-steps-sustainable-europe-20161122_en.pdf (accessed on 5 April 2019).
- Towards Improved Methodologies for Eurozone Statistics and Indicators. Communication of the Commission to the European Parliament and the Council on Eurozone Statistics; (COM(2002) 661). 2002. Available online: https://eur-lex.europa.eu/LexUriServ/LexUriServ.do?uri=COM:2002:0661:FIN:EN:PDF (accessed on 5 April 2019).
- European Pillars of Social Right. European Commission. 2017. Available online: https://ec.europa.eu/commission/sites/beta-political/files/social-summit-european-pillar-social-rights-booklet_en.pdf (accessed on 14 October 2018).
- Eurostat: CE overview. 2018. Available online: http://ec.europa.eu/eurostat/web/circular-economy (accessed on 14 October 2018).
- Circular Economy in Europe. Developing the Knowledge Base. European Environmental Agency Report No 2/2016; Luxembourg: Publications Office of the European Union 2016. Available online: https://www.socialistsanddemocrats.eu/sites/default/files/Circular%20economy%20in%20Europe.pdf (accessed on 5 April 2019).
- Indicators for the EU Sustainable Development Goals. Eurostat. 2015. Available online: http://ec.europa.eu/eurostat/web/sdi/indicators (accessed on 14 October 2018).
- Sustainable development in the European Union 2015. Monitoring report of the EU Sustainable Development Strategy. Eurostat. 2015. Available online: http://ec.europa.eu/eurostat/documents/3217494/6975281/KS-GT-15-001-EN-N.pdf (accessed on 14 October 2018).
- Ellen MacArthur Foundation (EMF). Towards the Circular Economy 1: An Economic and Business Rationale for an Accelerated Transition. 2012. Available online: https://www.ellenmacarthurfoundation.org/assets/downloads/publications/Ellen-MacArthur-Foundation-Towards-the-Circular-Economy-vol.1.pdf (accessed on 5 April 2019).
- Ellen MacArthur Foundation (EMF). Delivering the Circular Economy: A Toolkit for Policymakers. 2015. Available online: https://www.ellenmacarthurfoundation.org/assets/downloads/publications/EllenMacArthurFoundation_PolicymakerToolkit.pdf (accessed on 5 April 2019).
- Korhonen, J.; Nuur, C.; Feldmann, A. Circular economy as an essentially contested concept. J. Clean. Prod. 2018, 178, 618–643. [Google Scholar] [CrossRef]
- Prieto-Sandoval, V.; Jaca, C.; Ormazabal, M. Towards a consensus on the circular economy. J. Clean. Prod. 2018, 179, 605–615. [Google Scholar] [CrossRef]
- Veleva, V.; Bodkin, G.; Todorova, S. The need for better measurement and employee engagement to advance a circular economy: Lessons from Biogen’s “zero waste” journey. J. Clean. Prod. 2017, 154, 517–529. [Google Scholar] [CrossRef]
- Malinauskaite, J.; Jouhara, H.; Czajczynska, D.; Stanchev, P.; Katsou, E.; Rostkowski, P.; Thorne, R.J.; Colon, J.; Ponsa, S.; Al-Mansour, F.; et al. Municipal solid waste management and waste-to-energy in the context of a circular economy and energy recycling in Europe. Energy 2017, 141, 2013–2044. [Google Scholar] [CrossRef]
- De Jesus, A.; Mendonça, S. Lost in Transition? Drivers and Barriers in the Eco-innovation Road to the Circular Economy. Ecol. Econ. 2018, 145, 75–89. [Google Scholar] [CrossRef]
- De Jesus, A.; Antunes, P.; Santos, R.; Mendonça, S. Eco-innovation in the transition to a circular economy: An analytical literature review. J. Clean. Prod. 2018, 172, 2999–3018. [Google Scholar] [CrossRef]
- Weber, G.; Cabras, I. The transition of Germany’s energy production, green economy, low carbon economy, socio-environmental conflicts, and equitable society. J. Clean. Prod. 2017, 167, 1222–1231. [Google Scholar] [CrossRef]
- Fang, K.; Dong, L.; Rend, J.; Zhang, Q.; Han, L.; Fu, H. Carbon footprints of urban transition: Tracking circular economy promotions in Guiyang, China. Ecol. Model. 2017, 365, 30–44. [Google Scholar] [CrossRef]
- Bibri, S.I.; Krogstiea, J. On the social shaping dimensions of smart sustainable cities: A study in science, technology, and society. Sustain. Cities Soc. 2017, 29, 219–246. [Google Scholar] [CrossRef] [Green Version]
- Tseng, M.-L.; Tan, R.R.; Chiu, A.S.F.; Chien, C.-F.; Kuo, T.C. Circular economy meets industry 4.0: Can big data drive industrial symbiosis? Resour. Conserv. Recycl. 2018, 131, 146–147. [Google Scholar] [CrossRef]
- Breure, A.M.; Lijzen, J.P.A.; Maring, L. Soil and land management in a circular economy. Sci. Total Environ. 2018, 624, 1125–1130. [Google Scholar] [CrossRef] [PubMed]
- Saavedra, Y.M.B.; Iritani, D.R.; Pavan, A.L.R.; Ometto, A.R. Theoretical contribution of industrial ecology to circular economy. J. Clean. Prod. 2018, 170, 1514–1522. [Google Scholar] [CrossRef]
- Ladu, L.; Blind, K. Overview of policies, standards and certifications supporting the European bio-based economy. Curr. Opin. Green Sustain. Chem. 2017, 8, 30–35. [Google Scholar] [CrossRef]
- Stahel, W. The product life factor. In An Inquiry into the Nature of Sustainable Societies. The Role of the Private Sector; Orr, G.S., Ed.; Houston Area Research Centre: Houston, TX, USA, 1982; pp. 72–105. [Google Scholar]
- Tukker, A. Product services for a resource-efficient and circular economy—A review. J. Clean. Prod. 2015, 97, 76–91. [Google Scholar] [CrossRef]
- Cheng, M. Sharing economy: A review and agenda for future research. Int. J. Hosp. Manag. 2016, 57, 60–70. [Google Scholar] [CrossRef]
- Godelnik, R. Millennials and the sharing economy: Lessons from a ‘buy nothing new, share everything month’ project. Environ. Innov. Soc. Transit. 2017, 23, 40–52. [Google Scholar] [CrossRef]
- Habibi, M.R.; Davidson, A.; Laroche, M. What managers should know about the sharing economy. Bus. Horizons 2017, 60, 113–121. [Google Scholar] [CrossRef]
- Moktadir, M.A.; Towfique, R.; Rahman, M.H.; Ali, S.M.; Paul, S.K. Drivers to sustainable manufacturing practices and circular economy: A perspective of leather industries in Bangladesh. J. Clean. Prod. 2017, 174, 1366–1380. [Google Scholar] [CrossRef]
- Homrich, A.S.; Galvao, G.; Abadia, L.G.; Carvalho, M.M. The circular economy umbrella: Trends and gaps on integrating pathways. J. Clean. Prod. 2018, 175, 525–543. [Google Scholar] [CrossRef]
- Malopolska Region Report. Marshal Office of Malopolska Voivodeship. Voivodeship Labour Office in Cracow, Regional Center for Social Policy in Cracow: 2016. (In Polish). Available online: https://www.malopolska.pl/publikacje/rozwoj-regionalny/wojewodztwo-malopolskie-2016 (accessed on 5 April 2019).
- Report on the State of the Environment in Malopolska in the Years 2013–2015; Voivodeship Inspectorate for Environmental Protection in Cracow, Cracow. 2016; (In Polish). Available online: http://www.krakow.pios.gov.pl/Press/publikacje/raporty/raport16/raport2016.pdf (accessed on 5 April 2019).
- Air Quality in Cities Database. World Health Organization. 2016. Available online: www.who.int/phe/health_topics/outdoorair/databases/cities/en (accessed on 14 October 2018).
- Avdiushchenko, A. Challenges and Opportunities of Circular Economy Implementation in the Lesser Poland Region (LPR). In Proceedings of the Thirteenth International Conference on Waste Management and Technology 2016, Tsinghua University, Basel Convention Regional Centre for Asia and the Pacific, Beijing, China, 21–24 March 2018; pp. 328–340. [Google Scholar]
- SYMBI Interreg Europe. Available online: https://www.interregeurope.eu/symbi/ (accessed on 14 October 2018).
- Waste Management Plan for the Malopolska (Lesser Poland) Region. Resolution No. XXXIV/509/17 of the Lesser Poland (Malopolskie) Voivodship Assembly from March 27, 2017 on amending the Resolution No. XI / 125/03 of the lesser Poland (Malopolska) Region Assembly from 25 339 August 2003 on the Waste Management Plan of the Lesser Poland (Malopolskie) Voivodship. Cracow. 2016. (In Polish). Available online: https://www.malopolska.pl/_userfiles/uploads/PGOWM_2016-2022.pdf (accessed on 5 April 2019).
- Spatial Management Plan for the Lesser Poland (Malopolska) Region. Resolution of the Regional Assembly of the Małopolska Region from 22 December 2003. Krakow. 2003; (with Updates in 2018); (In Polish). Available online: http://edziennik.malopolska.uw.gov.pl/WDU_K/2018/3215/akt.pdf (accessed on 5 April 2019).
- NUTS 2016 Classification. Eurostat. 2016. Available online: https://ec.europa.eu/eurostat/web/nuts/background (accessed on 7 April 2019).
- Li, W.F.; Zhang, T.Z. Research on the circular economy evaluation index system in resource based city. Econ. Manag. J. 2005, 8, 82–86. [Google Scholar]
- Chen, W.H. Study on indicator system of urban circular economy development. Econ. Manag. 2006, 16, 55–60. [Google Scholar]
- Qian, L.; Wang, H.H.; Zhao, R.M. Assessment of development level of circular economy and its countermeasures in Qingdao. J. Qingdao Univ. Sci. Technol. 2008, 24, 93–99. [Google Scholar]
- Zhang, B.; Huang, X.J. Research on circular economy development indicator system and demonstrable assessment. China Popul. Resour. Environ. 2005, 15, 22–26. [Google Scholar]
- Rantaa, V.; Aarikka-Stenroosa, L.; Ritalab, P.; Mäkinena, S.J. Exploring institutional drivers and barriers of the circular economy: A cross regional comparison of China, the US, and Europe. Resour. Conserv. Recycl. 2017, 135, 70–82. [Google Scholar] [CrossRef]
Figure 1.
The concept of designing circular economy (CE) indicators for European regions.

Figure 2.
The concept for CE indicator design.
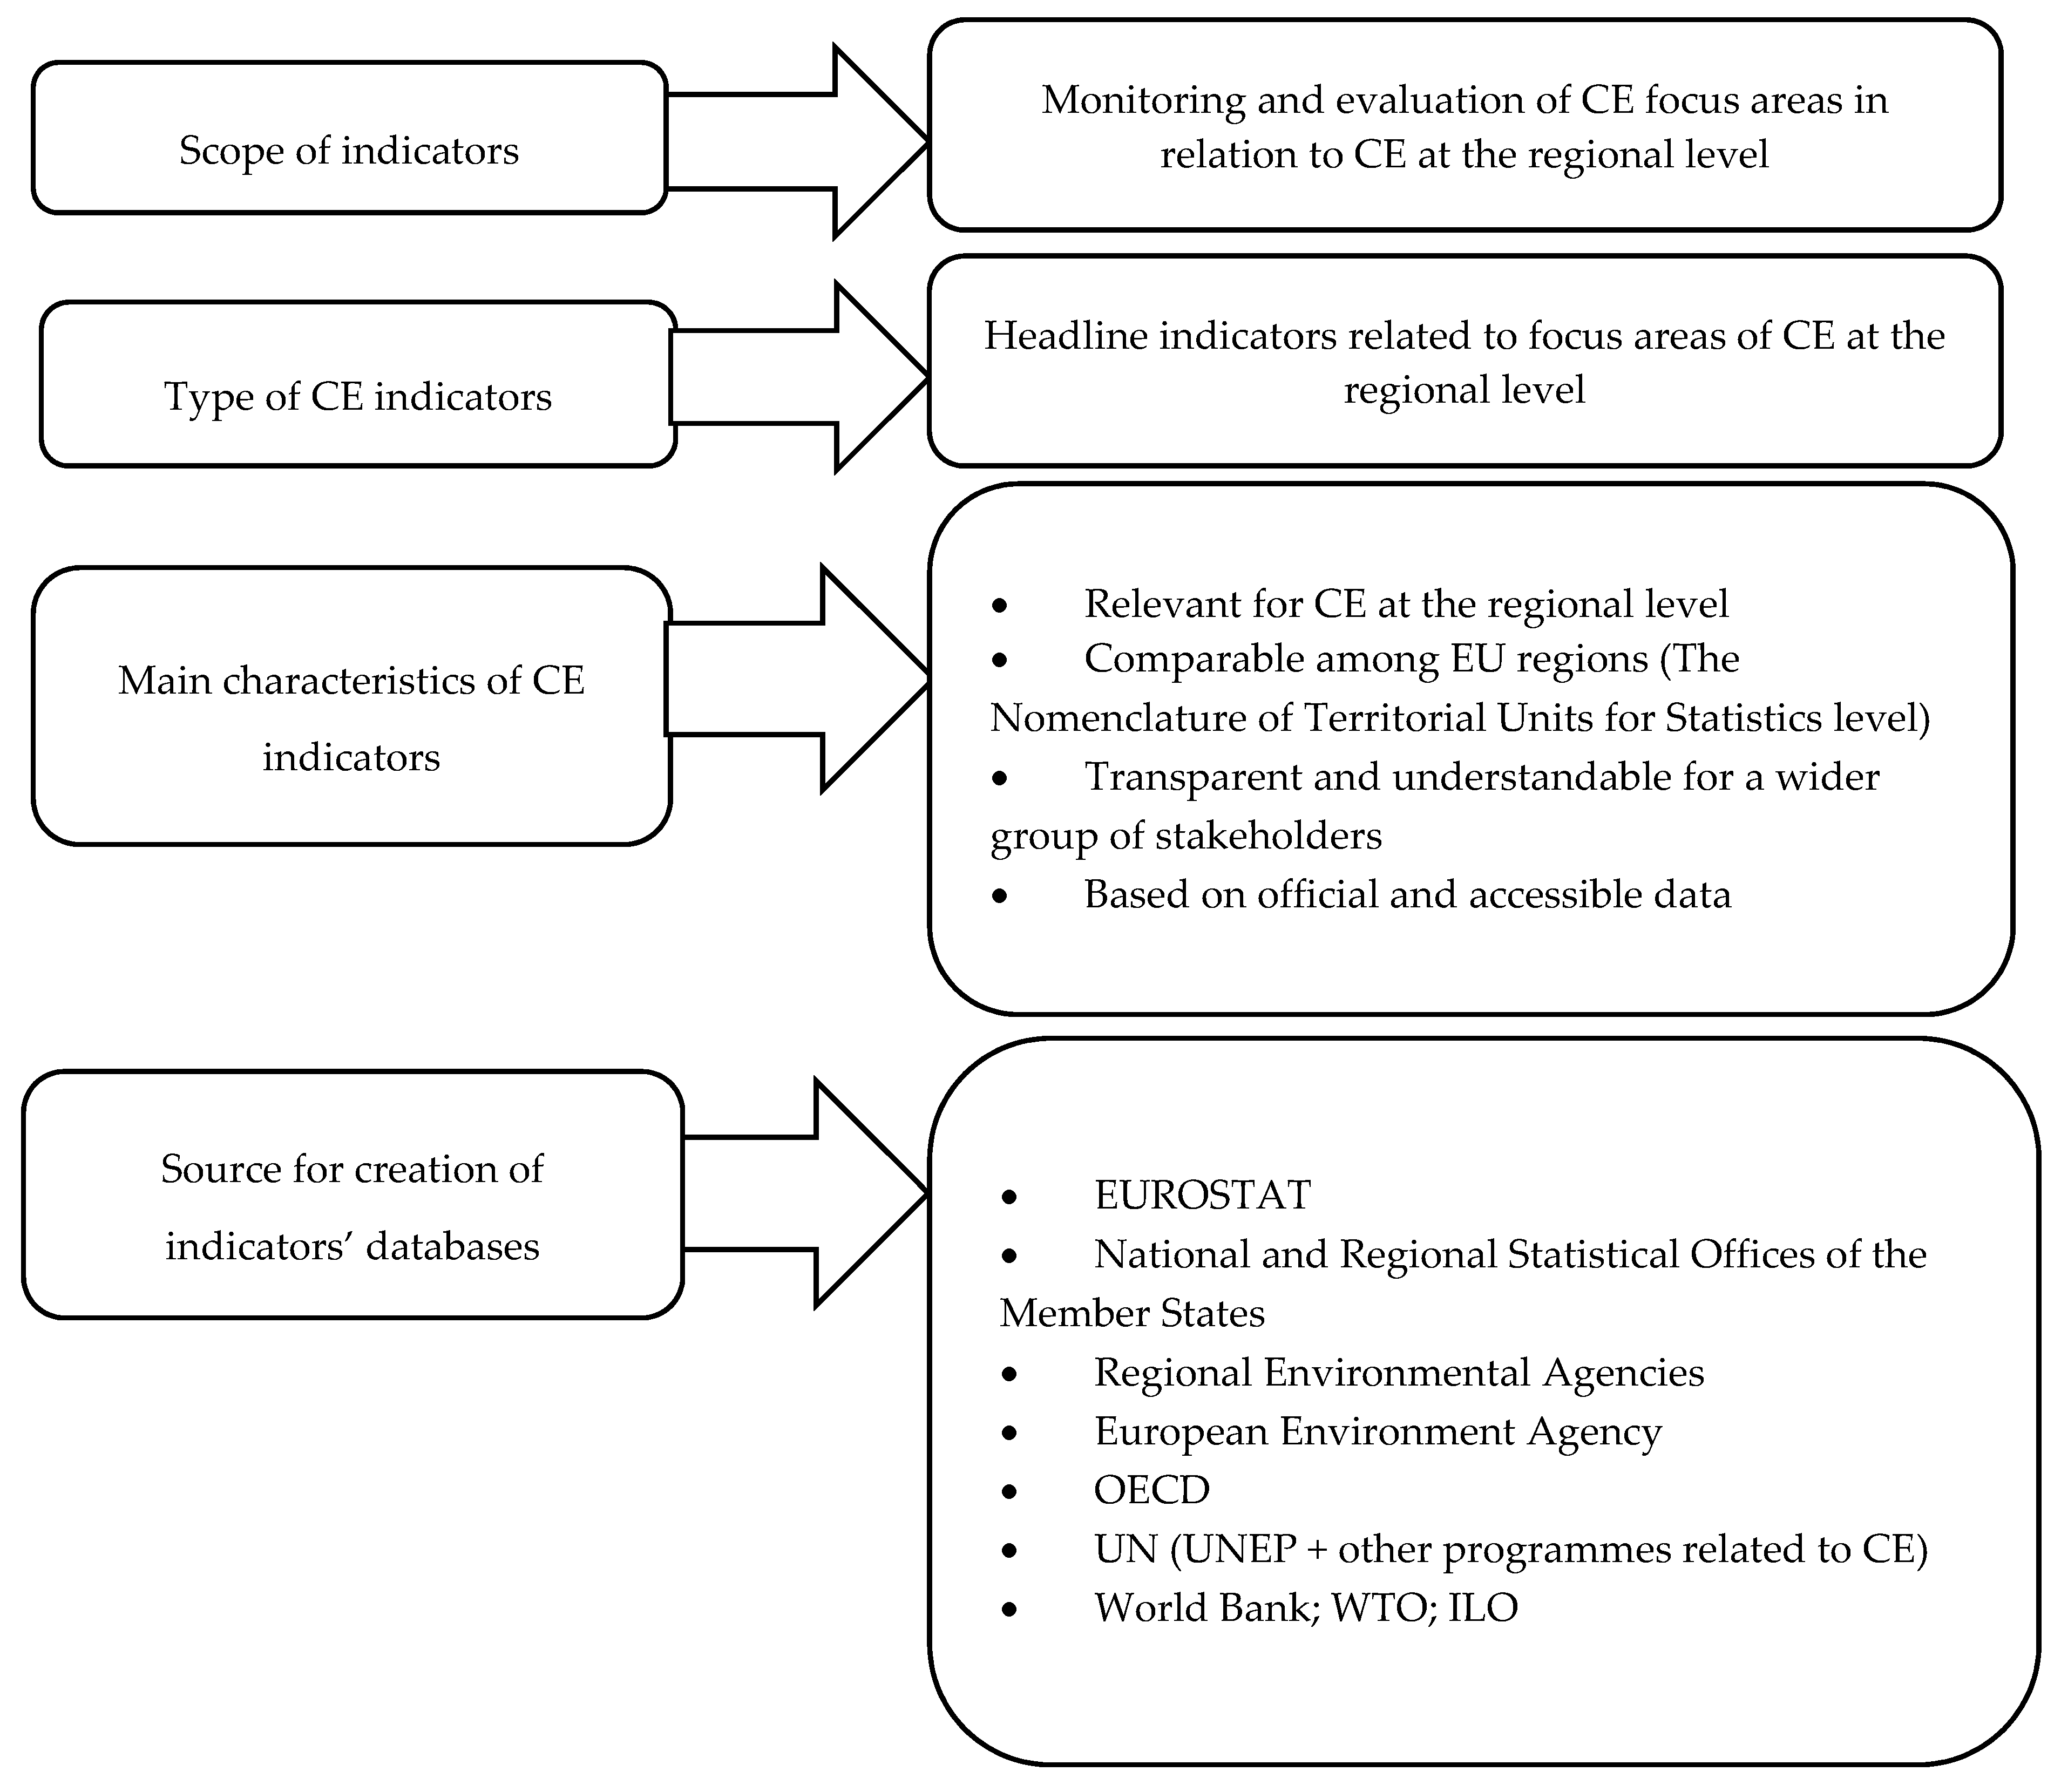
Figure 3.
Variable scores: component 1 vs. component 2.

Figure 4.
The CE index values for Poland and the Malopolska region, years 2005 to 2016.


Table 1.
EU policies area of monitoring and types of indicators *.
| Name of the Monitored EU Policy/Area/Strategy | Characteristics/Types of Indicators | Areas of Monitoring | Relevance for CE Monitoring at the Regional Level ** |
|---|---|---|---|
| EUROPE 2020 the EU’s agenda for growth and jobs for the current decade. It emphasises smart, sustainable and inclusive growth as a way to overcome the structural weaknesses in Europe’s economy, improve its competitiveness and productivity and underpin a sustainable social market economy. | Six headline indicators | Employment, R&D, climate change and energy, education, poverty and social inclusion. | Partly relevant |
| SUSTAINABLE DEVELOPMENT Indicators for monitoring the sustainable development goals (SDGS) in an EU context (the set of indicators was established in 2017, changing the previous one which was used from 2005 to 2015 and was in line with the EU Sustainable Development Strategy). | The set is structured along the 17 SDGs and includes 100 different indicators. | Poverty, agriculture and nutrition, health, education, gender equality, water, energy, economy and labour, infrastructure and innovations, inequality, cities, consumption and production, climate, oceans, ecosystems, institutions and global partnership. | Highly relevant |
| EUROPEAN PILLAR OF SOCIAL RIGHTS | Headline indicators (5 indicators in the first group, 5 indicators in the second group and 4 indicators in the third group). Secondary indicators (10 indicators in the first group, 6 indicators in the second group and 5 indicators in the third group). | Group 1. Equal opportunities and access to the labour market (education, skills and lifelong learning, gender equality in the labour market, inequality and upward mobility, living conditions and poverty and youth). Group 2. Dynamic labour markets and fair working conditions (labour force structure, labour market dynamics and income including employment-related). Group 3. Public support/social protection and inclusion (impact of public policies on reducing poverty, childcare, healthcare and digital access). | Partly relevant |
* Source: authors’ own work based on European Statistical Office information; ** Authors’ own assessment.
Table 2.
Proposed indicators for CE monitoring at the regional level.
| CE Specific Area | Evaluation Aspects for Monitoring | Possible Indicators for Monitoring |
|---|---|---|
| Economic prosperity economy taking into account financial aspects of environmental actions | Economic growth, green economic growth, GDP per capita, green jobs, unemployment level, environmental taxes and levies (share of budget revenues) and business based on CE business models (share) | Increase in household income, income of households, euros per inhabitant or PPS based on final consumption per inhabitant, real growth rate of regional gross value added at basic pricepercentage change over previous year, poverty risk indicator (below the relative poverty line) after taking into account social transfers in income |
| Financial aspects of environmental actions | Green public procurement, expenditure on environmental education | |
| Zero-waste economy | Water, wastes, recycling, reuse, refurbishment and remanufacturing | Municipal waste generated per inhabitant in a region, generation of waste excluding major mineral wastes per GDP unit, generation of waste excluding major mineral wastes per GDP in relation to domestic material consumption, recycling rate of municipal waste, recycling rate of biowaste in kg per capita, recycling rate of all waste excepting major mineral waste in %, rate of reuse, rate of remanufacturing and refurbishment, wastewater reuse, wastewater treatment |
| Innovative economy | Innovation, eco-innovations | Eco-innovations, patents related to recycling sectors, secondary raw materials, renewal, regeneration, expenditure on research and development in relation to GDP, share of innovative enterprises by sector in general enterprises |
| Energy-efficient and renewable energy-based economy | Energy efficiency, renewable energy sources | Final energy intensity of GDP, energy efficiency in households (energy consumption per household), energy productivity (the indicator results from the division of the gross domestic product (GDP) by the gross inland consumption of energy for a given calendar year), electricity consumption for 1 million PLN (Polish currency) of GDP, expenditure on fixed assets for environmental protection related to saving electricity per capita |
| Low carbon economy | Air pollution, CO2 emissions | Carbon dioxide emissions, emission of particulates, outlays/expenditures on fixed assets serving environmental protection and water management related to protection of air and climate |
| Bioeconomy | Biofuels, biomass, bio-based products | Biofuels, biomass, bioproducts, number of patents in the field of biotechnology, expenditures on research and development (R&D) in the field of biotechnology |
| Service/performance economy | Product as service sector | Market share of “product as services sector” |
| Collaborating/sharing economy | Sharing services | Individual used any website or app to arrange an accommodation from another individual, individuals used dedicated websites or apps to arrange an accommodation from another individual, individuals used any website or app to arrange a transport service from another individual *, individuals used dedicated websites or apps to arrange a transport service from another individual |
| Smart economy | R&D in green sector | % of households with Internet access, % of individuals using cloud services, e-commerce indicator: Internet purchases by individuals in % during last 3 months, e-government activities indicator: Internet use in interaction with public authorities (last 12 months) in % of individuals, percentage of households with broadband access, enterprises that provided training to develop/upgrade ICT skills of their personnel (% of enterprises), enterprises with access to broadband Internet |
| Resource Efficient Economy | Resource efficiency, material efficiency | Productivity of resources (GDP per unit of resources used by the regional economy), regional consumption of materials, the circular material use rate (CMU) (% of recyclable materials used in the economy in relation to the total consumption of raw materials) |
| Social Economy | Social innovations, collaboration services (platforms), social awareness of environmental issues | Innovative social enterprises, collaboration services platforms set up by local citizens |
| Spatially effective economy | Public space, green areas, circular spaces, industrial symbiosis areas, urbanization level | Dispersion ratio of housing (number of buildings per 1 km2 area of the region), The area of public spaces in ha, urbanization rate, forest cover indicator, length of bicycle paths, share of legally protected areas in the total area, share of Natura 2000 areas in the total area, passenger transport: % using public mass transport services, % of travellers traveling by nonmotorized means of transport (on foot and bicycle), % of passenger cars |
Table 3.
Recommendations for evaluation indicator system for the CE (NUTS2 level [95]).
Table 3.
Recommendations for evaluation indicator system for the CE (NUTS2 level [95]).
| Dimensions | No. | Indicators | Units |
|---|---|---|---|
| Economic prosperity economy | 1.1 | GDP | per capita, fixed prices, PLN |
| 1.2 | Average life expectancy at birth for men | years | |
| 1.3 | Registered unemployment rate | % | |
| 1.4 | At-risk-of-poverty rate | % | |
| Zero-waste economy | 2.1 | Municipal waste collected selectively in relation to the total amount of municipal waste collected | % |
| 2.2 | Municipal waste collected per one inhabitant | tons/person | |
| 2.3 | Industrial and municipal wastewater purified in wastewater requiring treatment | % | |
| 2.4 | Outlays on fixed assets serving environmental protection and water management related to recycling and utilization of waste | per capita, fixed prices, PLN | |
| Innovative economy | 3.1 | Expenditures on research and development activities | per capita, fixed prices, PLN |
| 3.2 | Average share of innovative enterprises in the total number of enterprises | % | |
| 3.2 | Adults participating in education and training | % | |
| 3.4 | Patent applications for 1 million inhabitants | ||
| Energy-efficient and renewable energy-based economy | 4.1 | Share of renewable energy sources in total production of electricity | % |
| 4.2 | Outlays on fixed assets serving environmental protection and water management related to electricity saving | per capita, fixed prices, PLN | |
| 4.3 | Electricity consumption | kWh/person | |
| Low carbon economy | 5.1 | Carbon dioxide emission from plants especially noxious to air purity | tons/person |
| 5.2 | Emission of particulates | tons/1 km2 | |
| 5.3 | Passenger cars | Cars/1000 population | |
| 5.4 | Pollutants retained or neutralized in pollutant reduction systems in total pollutants generated from plants especially noxious to air purity | % | |
| 5.5 | Outlays on fixed assets serving environmental protection and water management related to protection of air and climate | per capita, fixed prices, PLN | |
| Smart economy | 6.1 | Households with personal computer with broadband connection to Internet | % |
| 6.2 | enterprises with access to the Internet via a broadband connection | % | |
| Spatially effective economy | 7.1 | Forest cover indicator | % |
| 7.2 | Street greenery and share of parks, lawns and green areas of the housing estate areas in the total area | % | |
| 7.3 | Urbanization rate | % |
Note: In total 25 indicators, categorized in 7 groups.
Table 4.
Principal Components and their contribution rate.
| Component | Eigenvalue | Proportion | Cumulative |
|---|---|---|---|
| Comp. 1 | 10.8542 | 0.4342 | 0.4342 |
| Comp. 2 | 7.77977 | 0.3112 | 0.7454 |
| Comp. 3 | 1.42008 | 0.0568 | 0.8022 |
| Comp. 4 | 1.24390 | 0.0498 | 0.8519 |
| Comp. 5 | 1.09559 | 0.0438 | 0.8957 |
| Comp. 6 | 0.89274 | 0.0357 | 0.9315 |
| Comp. 7 | 0.62868 | 0.0251 | 0.9566 |
| … | … | … | … |
| Comp. 23 | 0.00020 | 0.0000 | 1.000 |
Note: Components calculated from correlation matrix.
© 2019 by the authors. Licensee MDPI, Basel, Switzerland. This article is an open access article distributed under the terms and conditions of the Creative Commons Attribution (CC BY) license (http://creativecommons.org/licenses/by/4.0/).
Share and Cite
MDPI and ACS Style
Avdiushchenko, A.; Zając, P. Circular Economy Indicators as a Supporting Tool for European Regional Development Policies. Sustainability 2019, 11, 3025. https://doi.org/10.3390/su11113025
AMA Style
Avdiushchenko A, Zając P. Circular Economy Indicators as a Supporting Tool for European Regional Development Policies. Sustainability. 2019; 11(11):3025. https://doi.org/10.3390/su11113025
Chicago/Turabian StyleAvdiushchenko, Anna, and Paweł Zając. 2019. "Circular Economy Indicators as a Supporting Tool for European Regional Development Policies" Sustainability 11, no. 11: 3025. https://doi.org/10.3390/su11113025
Note that from the first issue of 2016, this journal uses article numbers instead of page numbers. See further details here.