Power Quality and Rooftop-Photovoltaic Households: An Examination of Measured Data at Point of Customer Connection


1
School of Chemistry, Physics and Mechanical Engineering, Queensland University of Technology, Brisbane, QLD 4000, Australia
2
School of Electrical Engineering and Computer Science, Queensland University of Technology, Brisbane, QLD 4000, Australia
3
Independent Scholar, Brisbane, QLD 4000, Australia
4
Faculty of Architecture, Karlsruher Institute of Technology, 76131 Karlsruhe, Germany
*
Author to whom correspondence should be addressed.
Sustainability 2018, 10(4), 1224; https://doi.org/10.3390/su10041224
Submission received: 8 March 2018
/
Revised: 12 April 2018
/
Accepted: 14 April 2018
/
Published: 17 April 2018
(This article belongs to the Collection Sustainable Built Environment)
Abstract
:Photovoltaics (PVs) have been widely reported as causing power quality problems for electricity distribution networks. Much of this literature gives the impression that networks, particularly low voltage networks, were effectively and proficiently managed and operated before the rise of PVs and that this new technology is causing problems that did not previously exist and would not currently exist if there were no rooftop PV systems. The purpose of this paper is to examine measured data of power quality at the customer service point of four random households in four different distribution networks in Australia. This is the first report of power quality examination from the perspective of the end-user (solar households). The results show that the low voltage distribution networks reported in this study do not have networks that meet required power quality standards—and this cannot be attributed to the rooftop PV systems reported here. The paper proposes that power quality failures in these low voltage networks could be attributed to poor historical management, missed opportunities to embrace PVs as a means of better network management, lack of acknowledgement of the emergence of the prosumer and lack of total quality management and systems thinking.
1. Introduction
In efforts to reduce greenhouse gas emissions, control energy costs, limit smog and/or enhance energy security, a significant number of nations have established renewable energy targets as a share of electricity production or primary energy. These include the EU (27% of energy consumption by 2030) [1], Germany (40–45% by 2025) [2], the USA (20% of electricity generation by 2020 nationally; 30% by 2025 for federal government consumption) [3], China (15% of primary energy from non-fossil sources by 2020) [4], India (35%, no date) and Australia (20% of electricity generation by 2020) [5]. Globally, renewable generation was reported to account for 22% of world electricity generation in 2012 [6]. In some countries grid-connected photovoltaic (PV) systems are seen as part of this transition, including utility scale (e.g., >1 MWp) systems connected to the medium voltage network and medium scale (10 kWp–1 MWp) or small scale (<10 kWp) systems connected to the low voltage (LV) network [7]. The majority of existing low voltage distribution networks (LVDN), however, are radial and have been designed for unidirectional power flow from high voltage down to low voltage [8].
When rooftop PVs first emerged, many network operators were reluctant to ‘allow’ such systems to connect to their networks, citing safety and reliability of supply as the main concerns. Academic and industry research since the 1980s has reported numerous ‘issues’ that PVs create for distribution networks: islanding, harmonic distortion, electromagnetic interference, reactive power/power factor, reverse power flow and frequency and voltage regulation [8,9,10,11,12,13]. The nature and extent of such problems for LVDNs has been examined in relation to the penetration level of PVs (for example as reported in [14,15]). Perhaps the most reported issue relates to voltage quality (over voltage, under voltage and voltage unbalance) [7,16,17,18]. Academic reviews of PV/network issues tend to focus on specific issues and/or solutions, such as smoothing the output power from PVs to account for variability [19], improving PV converter technology [20], the dynamic use of PV and distributed storage to mitigate load and PV unbalance [21], islanding techniques [22] and the transformation from passive to active distribution networks [23]. Most, if not all, of this research has been conducted from the perspective of the Distribution Network Service Provider (DNSP).
Despite the fact that power quality issues have always existed in electrical networks [24], current public discourse gives the impression that PV systems are the only or main cause of power quality problems in LV networks. This is evidenced in online media [25,26,27] and print/online news in multiple countries [28,29,30]. Much of the language of both academic and industry publications and political and regulatory rhetoric, creates an impression (deliberately or inadvertently) that LV networks were effectively managed before the rise of PVs and that somehow this technology is causing problems that did not previously exist and do not exist in parts of the networks without rooftop PV systems. An example of public misinformation is provided below:
“...the variations in solar production are causing all sorts of problems with local electrical infrastructure ... it causes the voltage at the transformer to increase ... this excessive voltage is causing problems, such as power trips and appliance failure, for all consumers on the electrical network as electrical appliances are designed to use 240v.”[31]
But is this perception that PVs are the main or sole cause of LVDN problems the whole truth? Research literature on LV network monitoring is very limited and under-explored [32] and to the authors’ knowledge, there have been no published reports on power quality examination from the perspective of end-use solar households. The purpose of this paper is to report on measured power quality (voltage, frequency and power factor) at the customer service point—the point of common coupling (PCC) or customer point of attachment (PoA). Power quality, household consumption (major services and total) and PV generation from four random households are evaluated at different time intervals (12 months, monthly, daily) to investigate the likelihood of any of these factors contributing to identified power quality issues on their respective networks. The analysis raises questions of whether DNSPs’ current public focus on managing and regulating rooftop PV systems is masking underlying and pre-existing power quality issues that have not previously been identified, managed, regulated and/or publically communicated.
2. Materials and Methods
A mixed methods approach using both quantitative and qualitative data was used. This section compares Australian power quality requirements with international practice (Section 2.1), describes the context of the four case study solar houses where power quality was measured (in 4 different LVDNs) and four additional case studies (113 residential properties in the same LVDN) (Section 2.2) and the methods used for collecting and analysing this data (Section 2.3 and Section 2.4). A mixed methods approach is deemed suitable for examining complex relationships between different elements [33,34,35], enhancing data validity and reducing the chance of bias.
2.1. Power Quality Standards
Deviations in voltage, current and frequency are a means of quantifying power quality [24]. This section summarises international and Australian power quality requirements, against which the case study data will be compared.
2.1.1. Frequency Standards
50 Hz is the international standard for supply voltage of 230/400 volts. In electricity networks designed around large centralised power stations, the frequency of the network is typically ‘managed’ by the synchronous generators, provided that the generation capacity and load are relatively matched and that there are no fast rates of change in either state. In Australia, the Frequency Operating Standards define allowable ranges under normal operating conditions on the interconnected national network (i.e., the range shown in Table 1 must be kept 99% of the time and any deviations stabilised within 5 min) as well as containment and stabilisation ranges and recovery timeframes for other conditions such as failures in transmission lines or supply scarcity. Its definitions apply to “all power system equipment, including generation equipment, transmission and distribution equipment and consumer equipment” [36]. Table 1 shows that despite 50 Hz being the international standard, there are slight variations in the upper and lower tolerances between countries, for ‘normal’ operating conditions. There may also be differences in the tolerance time (e.g., 99.5% under EN50160 but 99% in Australia). These local variations are important to understand before analysing frequency data in particular jurisdictions.
2.1.2. Voltage Standards
Some international standards for voltage are summarized in Table 2, providing a context for the Australian standard and practices in different jurisdictions in Australia. It shows the change in the Australian Standard in 2000 from 240 V to 230 V (row 6) but that this Standard has not been adopted in each jurisdiction yet (row 8). It also shows that those states that have adopted the 230 V standard (row 7) have a tighter preferred voltage tolerance (+6.1%, −2.2%) than the nominal tolerances applied by the 230 V standard.
An example voltage distribution compared with lower, preferred and upper operating zones required by the Australian 230 V standard is shown in Figure 1. In contrast to the European adopted EN50160 that requires 230 V ±10% for 95% of time, in Australia the upper (+10%) and lower (−6%) of the 230 V standard is based on the 99th percentile. This means that voltages (over a 10 min average) can exceed the upper and lower limits only 1% of the time under normal network operation. In addition to these point-of-supply voltage standards, AS/NZS 3000 Wiring Rules allow for an additional 5% voltage drop to occur between the point of supply and the point of use within a customer’s premises. Exported energy from rooftop PVs is widely reported to cause voltage rise, particularly at times of high solar radiation and low load, due to the export of real power and the impedance of the system.
2.1.3. Power Factor Standards
In an alternating current circuit, power factor (pf) is the cosine of real power (kW) and apparent power (kVA). Unity power factor (pf = 1) occurs when there is no difference between real power and apparent power and any measurable difference then becomes a measure of energy wastage and an indication of network line losses and decreased network utilization [46]. Reactive power is needed for equipment such as electric motors, fluorescent light ballasts and transformers and can cause current to lag voltage. Conversely, current leads voltage in capacitors and hence they are often used near load centres to support voltage profiles. Table 3 shows the measures different Australian states utilize to address power factor (as reported in 2009). Only the states represented by the case studies in this paper are presented. Note that to meet these power factor standards, most DNSPs in Australia implement power factor ‘management’ strategies (e.g., kW or kVA demand charges) for non-residential customers. No power factor correction/management strategies are applied to residential customers in any Australian jurisdiction.
2.2. Case Studies
2.2.1. Case Studies for Quantitative Data
This paper reports on data measured at four detached single-family homes in four different LVDNs as characterized in Table 4. Three of the homes have a rooftop PV system and all homes are connected to a radial distribution network. These homes were part of a study evaluating innovations in energy efficiency and net zero energy (NZE) housing in Australia [47,48,49,50]. It is coincidental that they are in four different LVDNs but the data collected for energy efficiency/NZE analysis inadvertently provided an opportunity to evaluate power quality measured at these premises.
2.2.2. Case Studies—Supplementary Qualitative Data
To examine issues arising with grid-connect PVs and LVDNs in more depth, information (historical, anecdotal and quantitative) was gathered from four additional sites (Table 5). Each of these sites has roof-mounted PVs in different configurations and each is connected to the same LVDN, a radial network.
2.3. Quantitative Data Collection and Validation Methods
A Home Energy Management System (HEMS)—AuziMAX by Enopte (www.enopte.com)—was customized for the four case study homes to record minute data from all electrical circuits (via current transformer (CT) clamps; 1% accuracy) as well as voltage, real power, power factor and frequency (via a Hiking DDS238-2 Energy Meter, a Class 1 meter compliant with IEC 61036: Alternating Current Static Watt-Hour Meters for Active Energy (Classes 1 and 2)). The equipment was installed at the PCC/PoA, meaning that all measurements are actual power quality experienced by the household at the point of connection to the network. The occupants have access to the online dashboard supplied with the HEMS unit, whilst the research team utilized the raw data to conduct their own data evaluation. The accuracy of the energy meter data was first validated through analysis of frequency (e.g., Tables 7 and 8 show that the measured frequency for all case study houses was within the required standard (49.85–50.15 Hz) for 99% of time) and later through the analysis software (refer to the following section).
Data from the additional four case studies was supplied by the relevant homeowners, communities or other bodies as indicated in Table 9 (e.g., written records and correspondence, equipment technical specifications, site inspections, measured data, DNSP documents etc.).
2.4. Quantitative Data Analysis and Validation Method
AuziMAX utilises its bespoke cloud based data storage and analysis system (Energy Maximiser: Enopte, Coolum Beach, Australia) to provide feedback to the customers’ dashboard. The raw data from the measurement devices is also accessible. Raw data for 1 year was extracted from the cloud server and uploaded in MS Excel and in MoniSoft, a Java-based platform-independent software that enables the analysis of energy data of buildings [51]. This software was developed and utilised for Germany’s large energy efficiency in buildings project (EnOB) and utilises the database MarieDB (MariaDB Foundation: Espoo, Finland, 2016). This software includes analysis of data quality and plausibility. Data was analysed in 10 min averages (consistent with the Standard discussed in Section 2.1.2) unless otherwise specified in the following sections.
3. Results
3.1. Annual and Monthly Power Quality
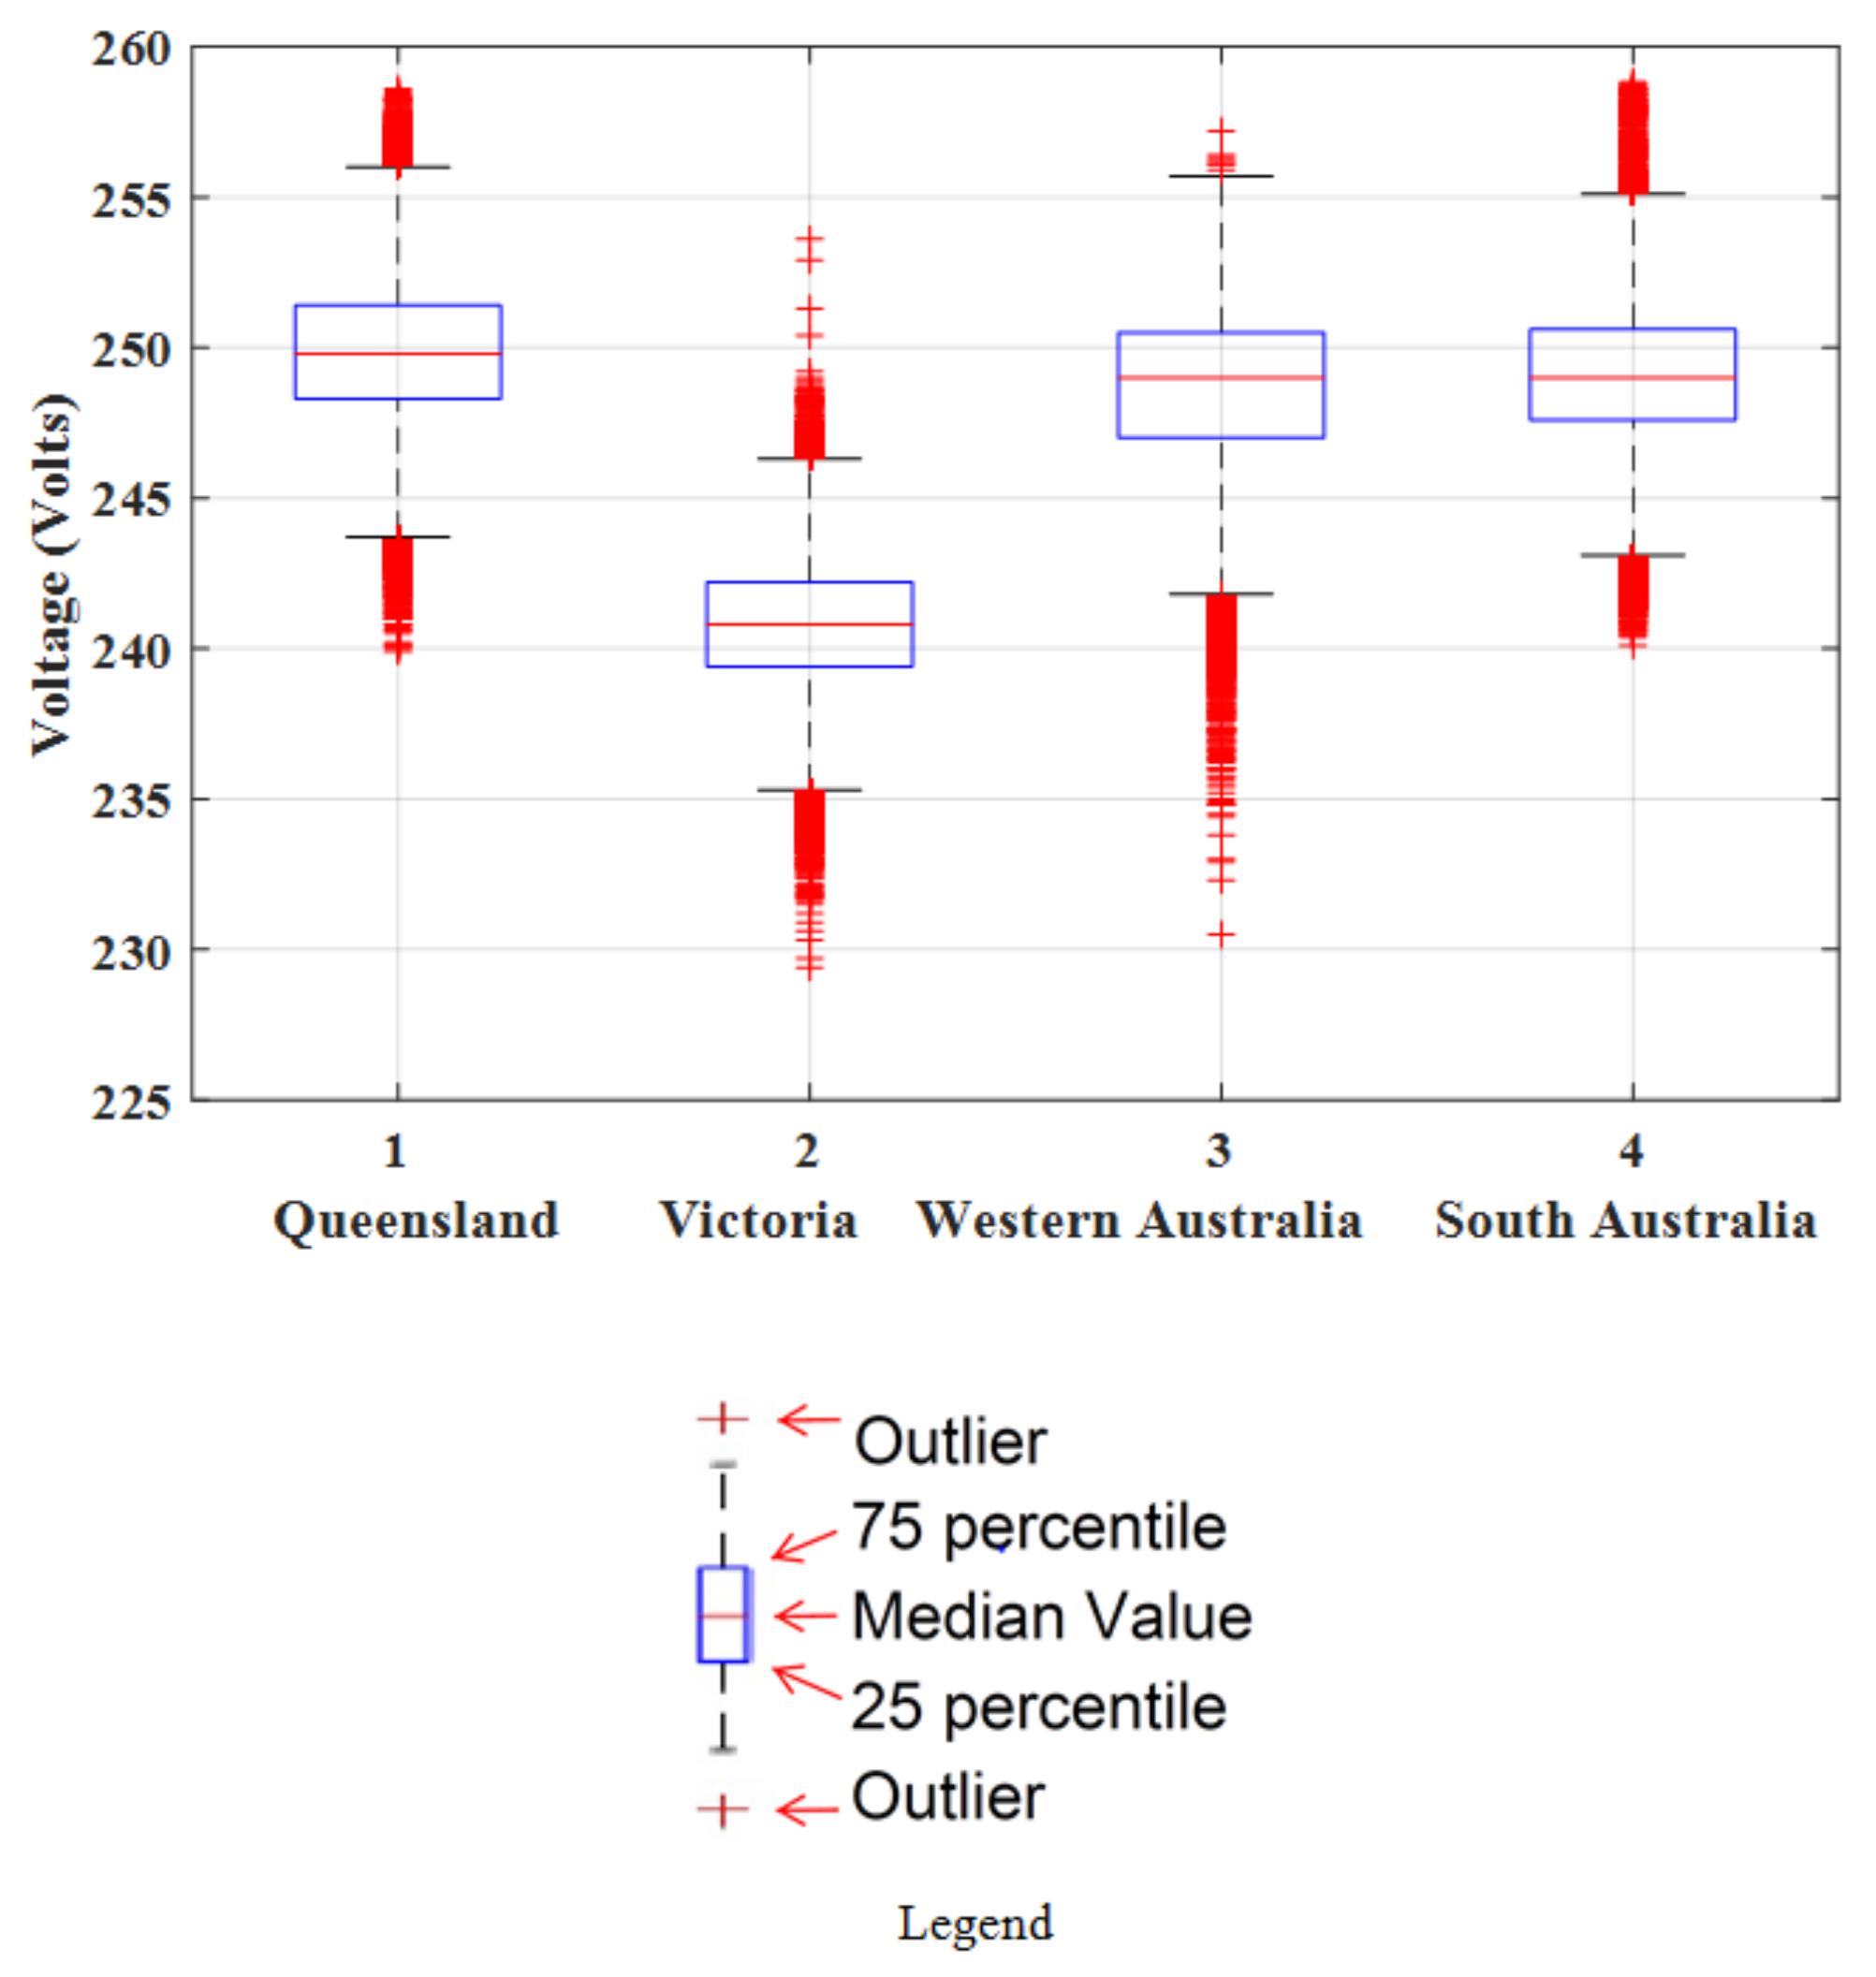
The voltage statistics for 12 months for each of the case study locations is shown in Table 6, revealing the measured mean annual voltage, standard deviation and maximum measured voltage. This is graphically presented for each location in a boxplot (Figure 2). Inside each boxplot, the horizontal red line indicates the median voltage value for each case. The difference between the 75th percentile (the upper side of the box) and the 25th percentile (lower side of the box) is the inter quartile range (IQR). The distance between the upper and lower horizontal black lines (upper and lower whiskers) and the 75th and 25th percentiles is 1.5 times IQR. Any values outside of the whiskers are outliers. Note the variations in mean voltage between the different case studies and the outliers in each, particularly the overvoltage figures.
Monthly power quality analysis for each case study is shown in Table 7 and Table 8. The consistency of the frequency data was used as an indication of the validity and accuracy of the kWh meter used to collect the data. The mean power factor deviation for each of the case study locations for all or most months was above 0.1, indicating the high likelihood that these houses experienced power factors outside of the power factor limits reported by networks to regulators (as shown in Table 3). For example, Queensland DNSPs are required to have a pf greater than 0.8 over any half hour period (row 6, Table 3), yet the measured data at the Queensland case study showed a mean monthly pf at or below 0.8 for four months (May, July, August and June; Table 7). Extremely poor power factor (mean power factor difference >0.5) was seen in Victoria (Sept) and Western Australia (June–October), shown on shaded cells in Table 7 and Table 8. The latter example is intriguing because the house was unoccupied at this time, so household appliances could not have contributed to these high line losses. No explanation of this poor pf was found at the residence: there were no standard residential loads at that time and no loads with high reactive power. The pf results also raise the question as to why pf is not regulated/managed for residential premises in Australia, although there are recent attempts to address this through regulation of PV inverters to control production of reactive power to demand (AS/NZS4777.2: Grid connection of energy systems via inverters Part 2: Inverter requirements).
The voltage data shows that for each case study the mean voltage difference varied on a monthly basis, although the extent of this differed between locations:
- The lowest voltage variation in Queensland was in May, with all other months showing a consistently high monthly mean variation (above 240 V) of approximately 10 V;
- The Victorian house had monthly variations ranging from a low of 6 V (July) to a high of 16 V (August);
- The mean monthly voltage variations in the Western Australian house were less extreme, however there is a suggestion that the variations were less pronounced once the house was inhabited (in late March 2016);
- The South Australian house showed the highest mean monthly voltage, ranging between 15 and 22 V over the 230 V standard. The data shows two months when voltages were outside of the standard.
3.2. Depicting Voltage Variation
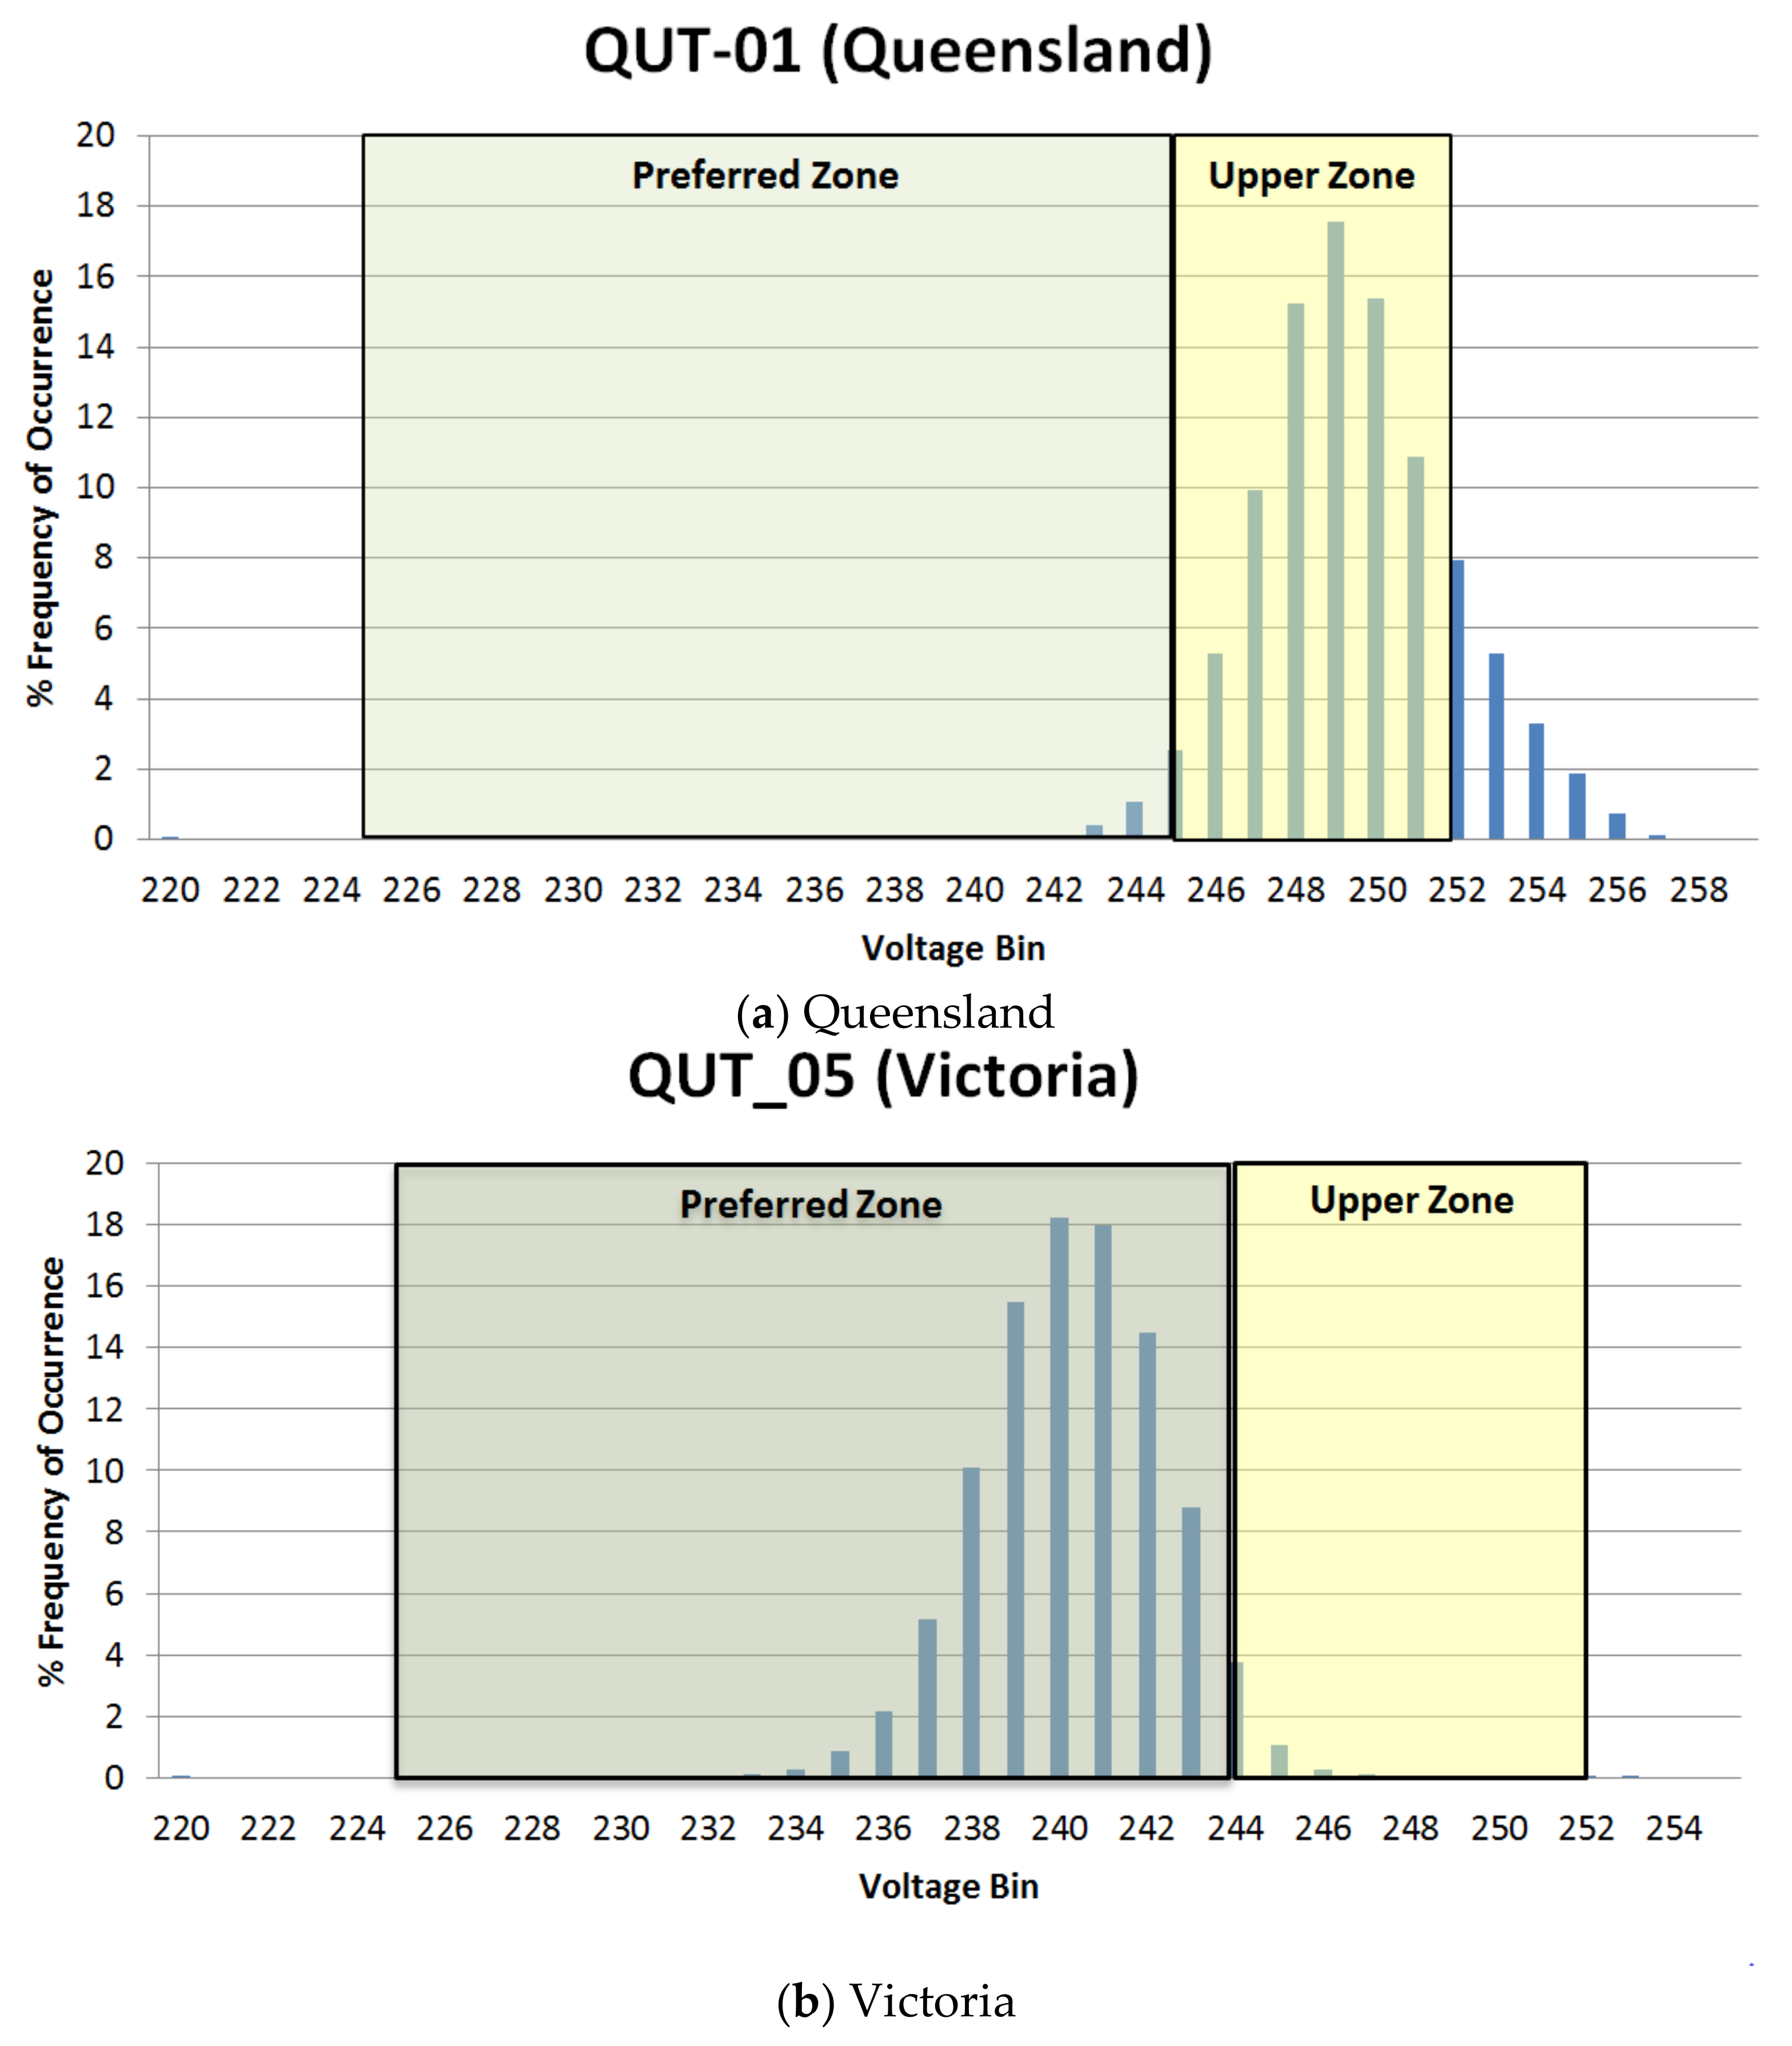
In a similar manner to Figure 1, histograms of voltage distribution were generated (using EXCEL) for each case study to examine the percentage of time the voltage (10 min average) was within preferred limits and upper limits (Figure 3a–d). The new Australian Standard for 230 V (AS 61000.3.100) was used as it is expected that all regions of Australia will adopt this standard sometime in the near future. A comparison of Table 7 and Table 8 with these histograms is revealing:
To examine the voltage variations in more detail, MoniSOFT was used to create carpet graphs for each case study (Figure 4a–d): the x axis represents time over the year (1 August 2015–31 July 2016) and the y axis represents hours of the day (0–24). Green areas indicate consistent voltages within the standards whereas yellow to red areas indicate voltages outside of the standard (higher than the standard). These graphs show how voltage varies throughout the day. Note that this specific analysis was carried out using 30 min averages to enable correlation with other data sources: Australian revenue meters (electricity meters for billing purposes); solar radiation data from the Bureau of Meteorology; and electricity industry practice of demand charges being determined at half hour intervals. Some interesting findings from these figures are highlighted below:
- The Queensland house (Figure 4a) showed the highest voltages occur during the middle of the day, suggesting a possible link with PV generation. However, there were also high voltages in the evening (19:00–23:00) and, to a lesser extent, early morning (01:00–05:00). These high voltages cannot be attributed to PVs.
- The South Australian data (Figure 4b) showed power outages in January and March 2016 and quite dramatic voltage variations occurring in summer and outside of daylight hours. The data appears to be valid as frequency and power factor data at these times was within normal limits. These variations (outside of daylight hours) cannot be attributed to PVs.
- The Victorian data (Figure 4c) also showed some power outages as well as a few occurrences of low voltage. Very little overvoltage was seen.
- The Western Australian house (Figure 4d) showed voltage variations (but not as extreme as South Australia). This house, however, has no rooftop PV, has gas hot water and was unoccupied until late March. This would seem to indicate that the data measured at this location is a true indication of voltage fluctuations on this network transformer. Note that there are significant periods of missing data.
3.3. Possible Contributors to Voltage Variations
This section presents analysis of possible end-user correlations to observed voltage variations, including the physical relationship between the houses and the network transformer, household PV output and household electricity consumption/loads.
3.3.1. Relationship of House to Distribution Network Transformer
Data from two of the case studies (the ‘best’ and ‘worst’ houses according to Table 7 and Table 8) was examined to determine if any correlation could be found between voltage variation and distance between the case study building and the network transformer. Transformer ratings and loadings are not known (as this is not a network analysis paper but a reporting of data from the end-user’s perspective).
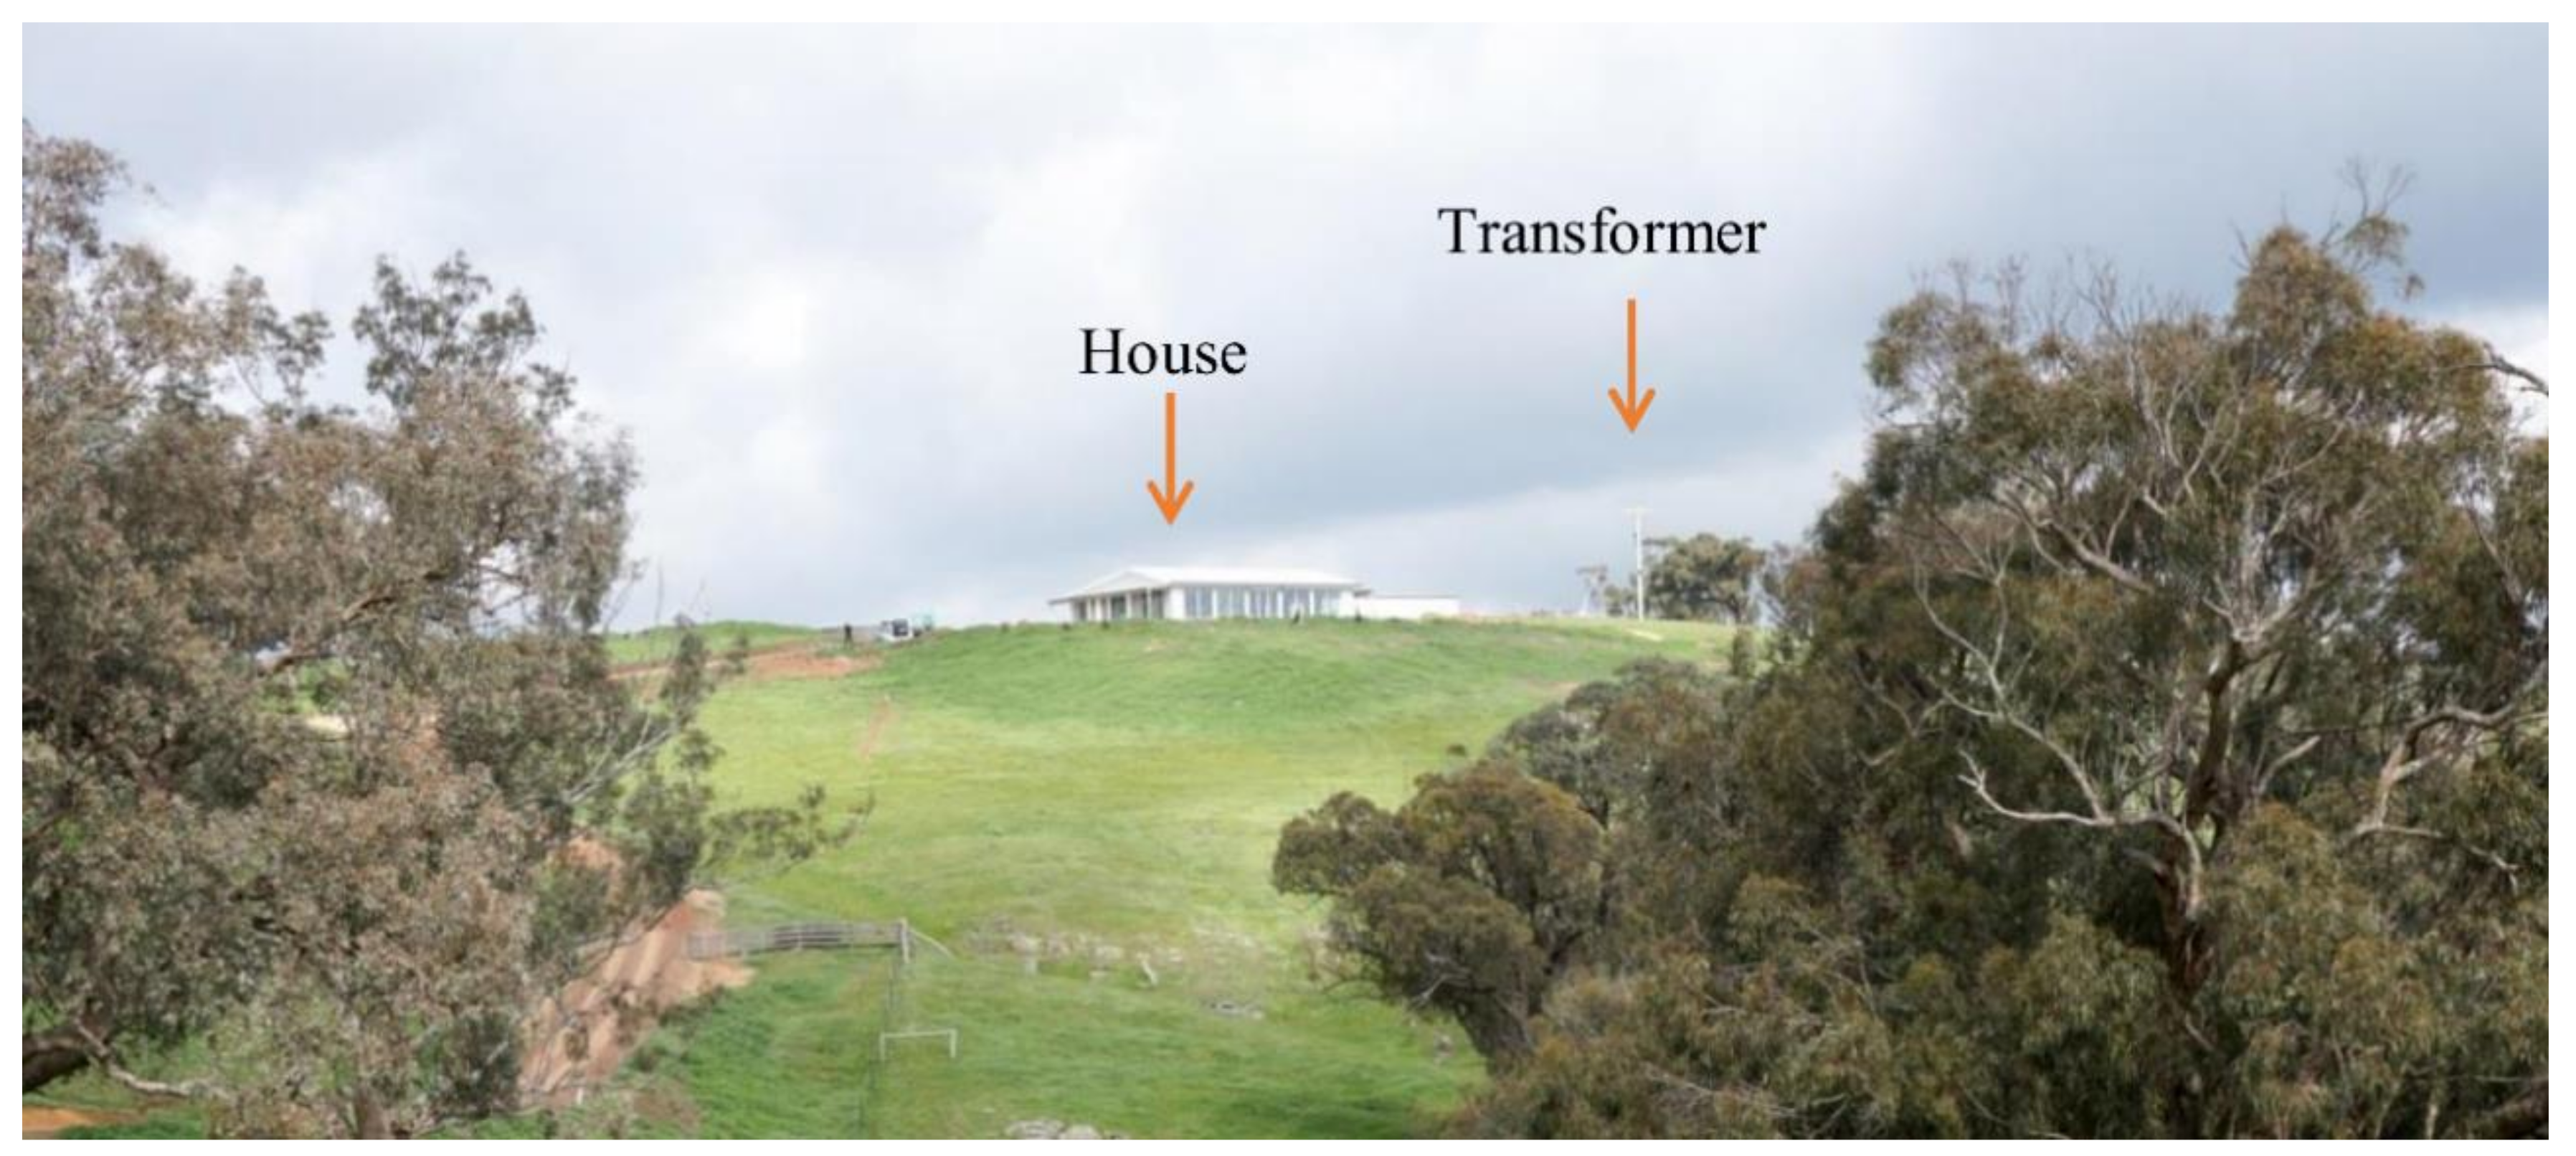
The Victorian house has both a roof-mounted PV as well as a solar water heater (with electric boost) (refer to Table 6), yet of the four case studies it shows the greatest voltage stability. One possible reason for this could be that it is a rural property (i.e., very lightly populated region) and it is very close (<50 m) to the network transformer (Figure 5) that may be lightly loaded. Network information regarding the loadings on this transformer were not available for further analysis.
The Queensland house, with poor voltage regulation, is also close to the network transformer (150–200 m), however it is not known what other loads are on this transformer or the rating of the transformer. An aerial shot of this transformer (Figure 6) suggests that it is loaded by a few detached houses and a dairy (industrial user). As this industrial customer is likely to have high energy and power needs (for milking, milk processing, packaging, bottling and refrigeration) it is possible that power quality issues on this transformer are influenced by this industrial customer rather than the PV household. It is also possible that the high voltage readings are a result of historic/current network practices to maintain high voltages at the LV terminal of distribution transformers to allow for voltage drop along the line. This means that customers closest to the transformer have higher voltages compared with customers connected at the end of that line. This house may be the first or second customer connection point to the transformer and it is feasible that the high supply voltage recorded by this customer is a result of DNSP connection and management decisions rather than the household’s PV system.
3.3.2. Correlation with Solar Generation
Carpet graphs of solar generation were created for the Queensland and South Australian houses (Figure 7a,b) to determine if there were any obvious correlations between high voltage and solar generation at the household level. (Note: similar to Figure 4a–d, this analysis also uses 30 min averages of the 1 min data). Figure 7a shows the total solar generation for the Queensland house between August 2015 and June 2016 at various points during the day. According to the legend on the right, high generation is indicated in red, low generation in green and no generation in blue. A few interesting factors emerge:
- As expected the Queensland house (Figure 7a) showed highest solar generation around midday and the highest solar generation was in August/September (the driest months with the clearest skies and the tilt of the PVs is more closely matched to the sun angle). The low solar generation in the last week of February and March can be explained by poor weather conditions during that period of time [18]. Figure 4a however (the voltage graph) shows high voltage during February/March and no further increase in voltages in August/September, suggesting that there is no link between solar radiation, PV output and supply voltage fluctuations measured at that house at those times.
- For the South Australian house a comparison of supply voltage fluctuations (Figure 4b) and solar generation (Figure 7b) shows no correlation in time of day or time of year. It is not known whether the microinverters of this PV system present any advantages or disadvantages over the more common string inverters, in terms of power quality.
3.3.3. Correlation with Household Loads
Household loads for the South Australian case study were examined to determine if there was any correlation between household load (and particular appliances) and voltage variations. Figure 8 shows household consumption (all electrical circuits) for January and February 2016 (the time indicated in Figure 4b as having several voltage spikes). The relative energy loads (e.g., light, medium, high) are indicated by colours as shown in the legend. Some trends can be seen, for example a considerable energy consumption spike between 1.45 and 3 am (between 2–3.5 kW) and a smaller spike (around 1.5–2 kW) from 11 a.m. almost every day. There is no obvious regular evening peak.
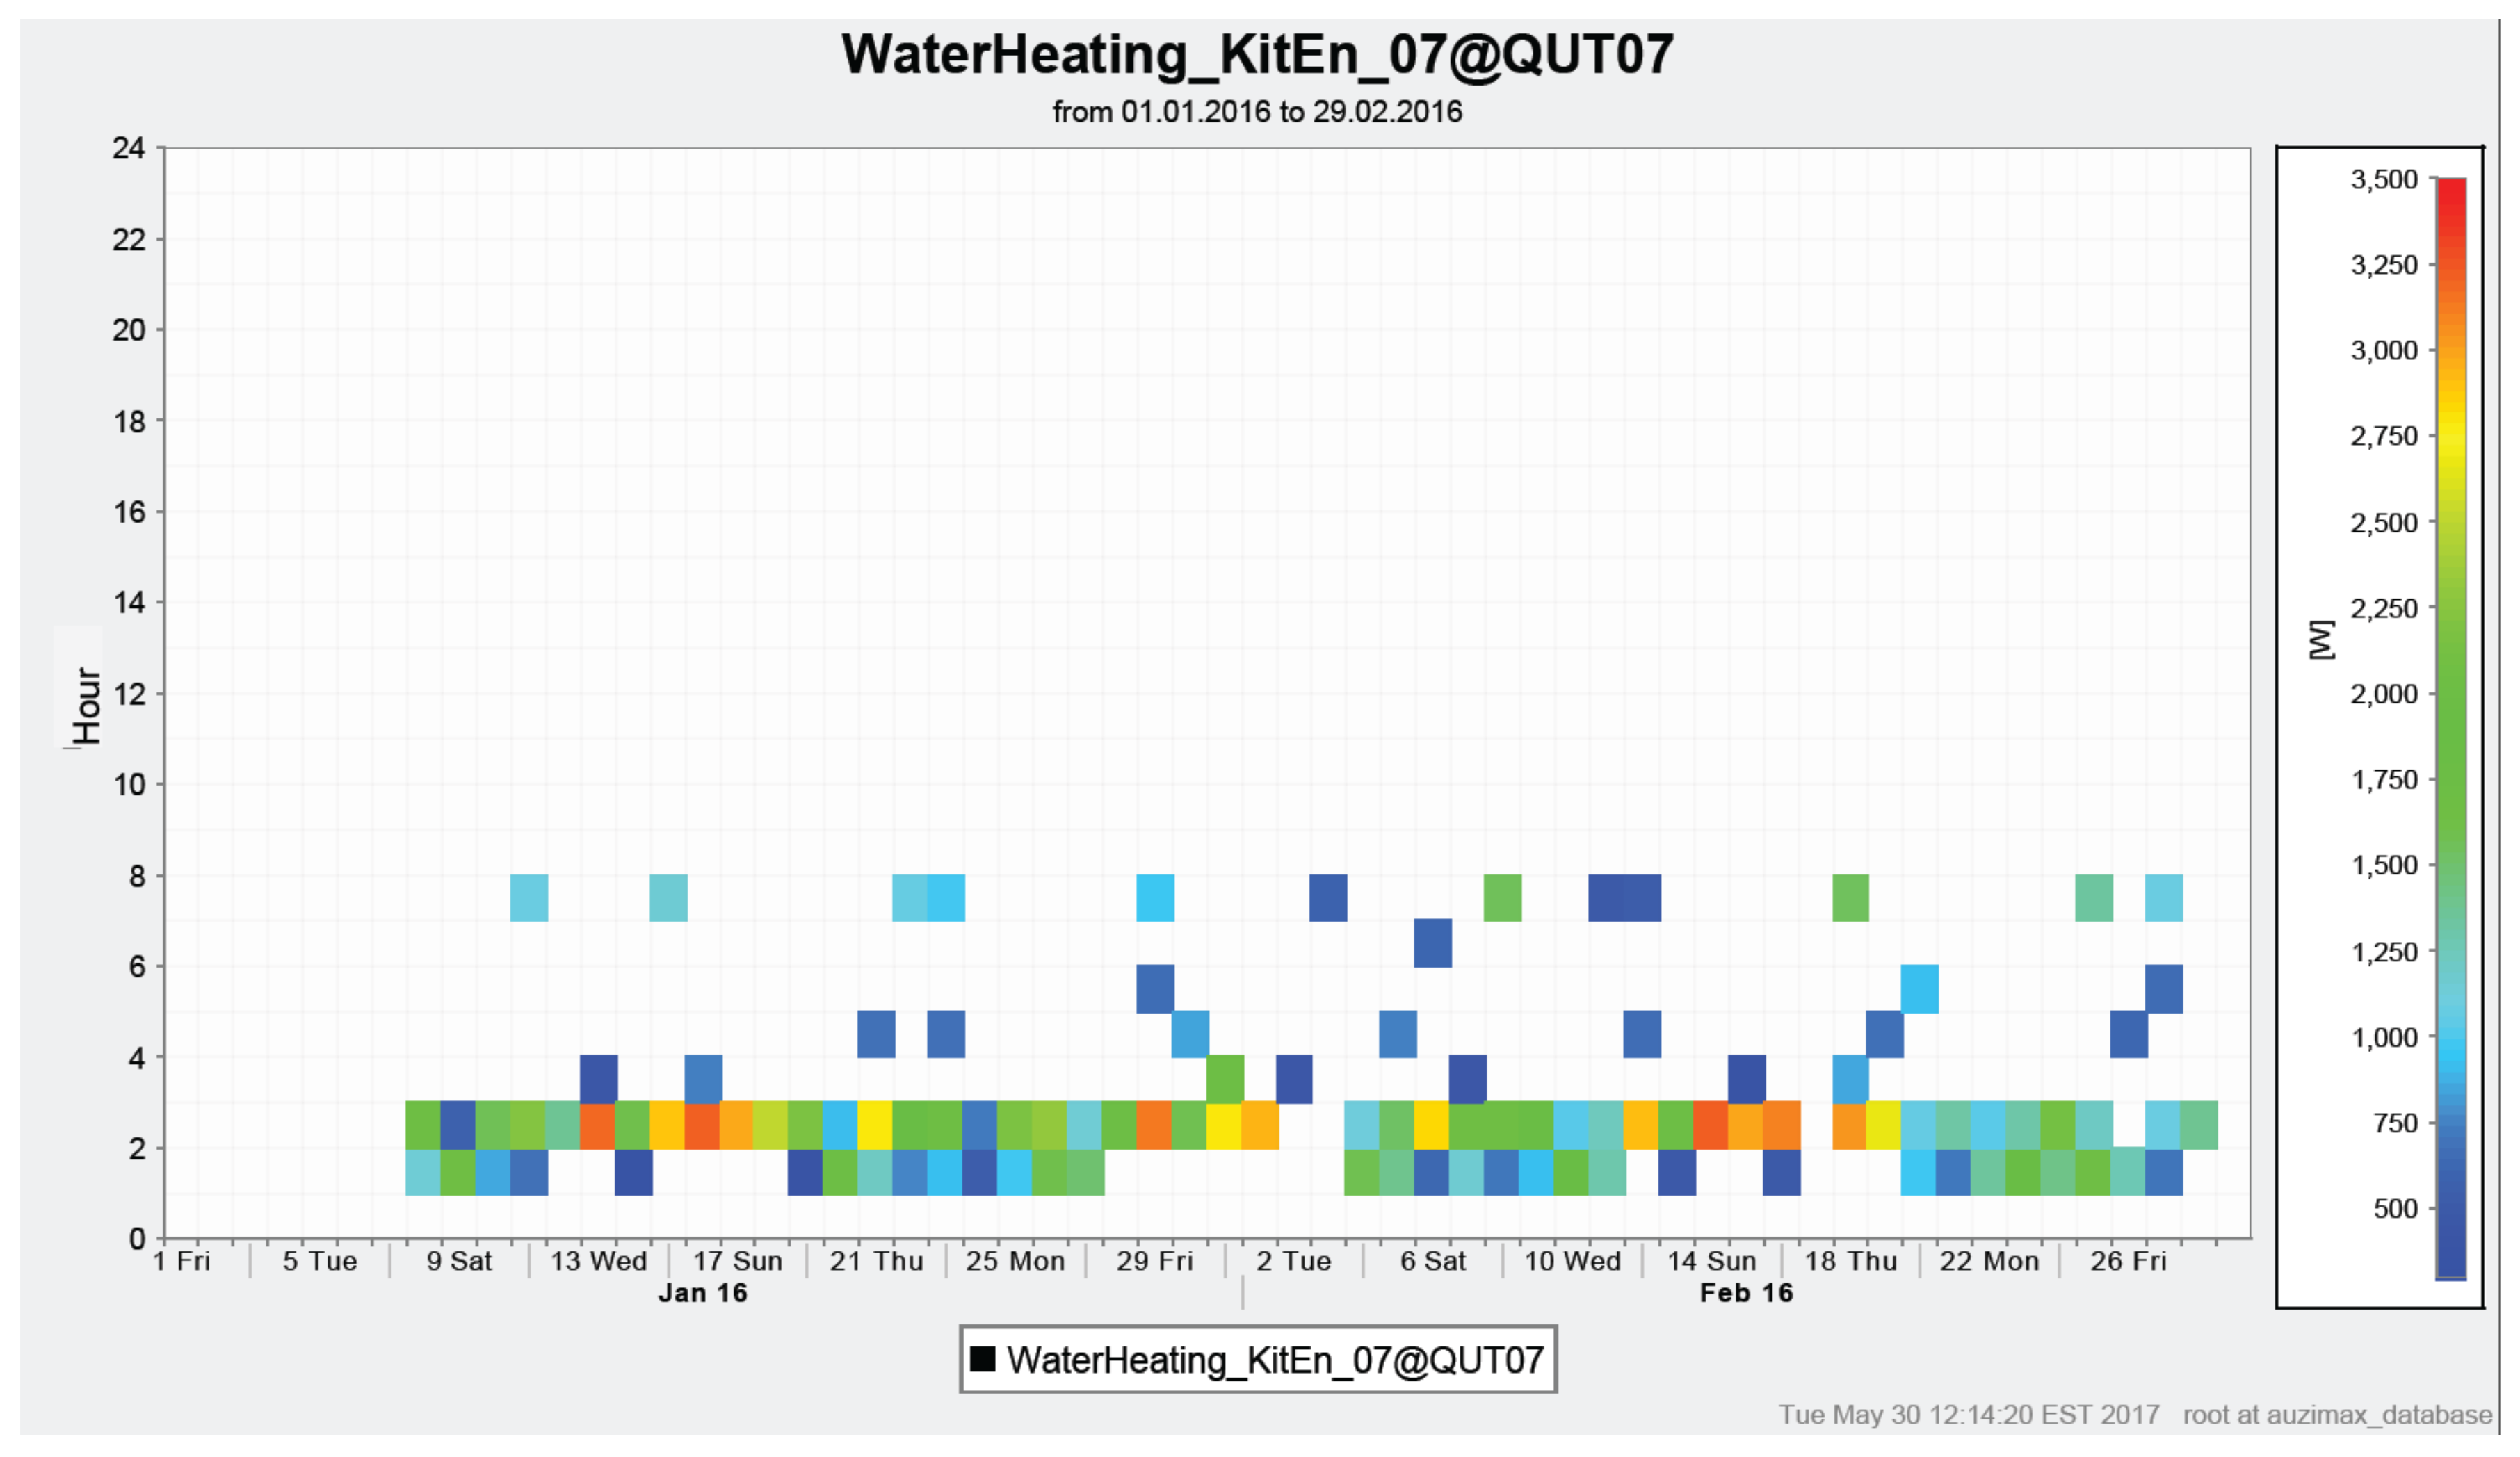
Because voltage variations measured at this house were more prominent in non-daylight hours (Figure 4b), data from individual circuits for this household were then examined to determine which particular appliances could be contributing to the household peak loads seen in Figure 8. Figure 9 graphs the energy consumption of the resistive element hot water unit (a storage system) that supplies hot water to the kitchen and main bedroom en suite. It shows its main consumption is in the early hours of the morning, representing the 2–3.5 kW load seen in Figure 8. This appliance is network controlled, taking advantage of the off peak/overnight tariff offered by the DNSP. The main heating occurs in the early morning hours with additional boosting until 8 a.m. Network controlled hot water storage units are common in detached housing throughout Australia, a demand management strategy implemented by many DNSPs.
This house also has a heat pump hot water system which provides hot water for the laundry and main bathroom, as well as supplying hydronic floor heating used in winter. Figure 10 shows its main consumption is in the middle of the day (11:00–15:00), corresponding to the 1.5–2 kW peak seen in Figure 8. This appliance has been scheduled by the homeowner to run at this time in order to maximize onsite use of his PV generation. These two appliances—the resistive element hot water storage unit and the heat pump water heater account for the main spikes in energy load shown in Figure 8.
This section has examined possible reasons for the supply voltage variations recorded at these households. No correlations were seen linking voltage variations to distance from the local transformer, household PV output or household consumption. This does not mean that PVs may not be impacting on these LV networks but rather that supply voltage fluctuations experienced by these homeowners do not appear to be attributable to their consumption or their PV systems.
3.4. Supplementary Data from Additional Case Studies
As indicated in the introduction, PV systems are often reported by DNSPs and the media as contributing to power quality issues for the network. The previous discussions have shown that, for the four random households reported, power quality issues measured at these premises could not be correlated with their consumption or solar generation. Additional qualitative and quantitative data from other case studies all connected to the same DNSP (described in Section 2.2.2) are presented in Table 9. The first issue presented by these additional case studies relates to the importance of phase balancing at network (Q15), community (Q17) and facility (Q18) levels. The evidence suggesting that phase balancing is not routinely carried out at network, microgrid or building level indicates a need for education and training of power systems engineers, electrical engineers and electricians on the implications of not balancing phases (for loads and for generation). The second issue raised by these case studies is that network actions can have negative impacts on residential PV customers (Q15, Q16). These two issues, from a residential customer’s perspective, are rarely raised in the public arena and no academic papers could be found addressing these issues.
4. Discussion
Australia has over 1.5 million residential rooftop solar systems and the challenges (real or perceived) that these place on existing radial distribution networks are frequently in the news—in a technical, social, political or economic context. The general impression of this rhetoric is that PVs are causing immense problems on the network. In other jurisdictions, for example in California, there is at least an acknowledgement (sometimes) that a lack of ‘a clear policy to manage all the renewables being added to the grid’ is the issue, rather than PVs per se [52].
The results presented in the previous section suggest that the low voltage distribution networks reported in this study do not have perfect networks and are not meeting power quality standards at PoA/PCC. Furthermore, the poor power quality cannot be attributed to the household rooftop PV systems reported here. This does not necessarily mean that PVs are not impacting on each of these LVDNs but rather that there may be other factors that contribute to power quality issues. Four such factors are discussed in the following sections: poor historical management and outdated risk management approach, missed opportunities to embrace PVs as a means of better network management, lack of acknowledgement of the emergence of the prosumer and lack of total quality management and systems thinking. Addressing these contributing factors, publicly, will help correct false and misleading public perceptions of the benefits and limitations of rooftop solar.
4.1. Historical Network Management
In his chairman’s address in 2016, billionaire and businessman Warren Buffet wrote:
Historically, the survival of a local electric company did not depend on its efficiency. In fact, a 'sloppy' operation could do just fine financially. That’s because utilities were usually the sole supplier of a needed product and were allowed to price at a level that gave them a prescribed return upon the capital they employed... That’s all changing.[53]
The case studies presented in this study suggest poor network management of power quality in the low voltage part of the network. It is possible that a key factor in power quality at this level is the lack of balancing of residential loads and residential rooftop PV systems at a transformer level. The lack of knowledge about what is happening on their network at a LV level was recently reinforced by a Queensland DNSP [18] that reported:
- 15% of three urban feeders studied were outside of the 240 V standard; and 29% were outside of the 230 V standard; this inferred that only 70% of the LV network was compliant with voltage requirements.
- They have not managed/reset distribution transformer tap changers to manage voltage fluctuations at a transformer level even though their analysis suggests that 26.6% of currently non-compliant LV networks could be resolved through a transformer tap change. However, due to the high cost and small number of qualified and specialized manufacturers for on load tap changers, they consider it is not possible to equip on load tap changers to distribution transformers to actively manage voltage across a day or season. Therefore, load shedding is needed to reset the distribution transformer tap. This requires considerable planning and notifications to affected customers.
- The company has significant gaps in their data/knowledge about their own network, particularly at a distribution transformer level and below. For example, they do not have accurate records of what tap position the transformer fleet is set to (although they are working to rectify this). They do not know what supply voltages are experienced by the customers. They have a poor understanding of customer loads such as the ratio of constant power loads to resistive loads at peak demand.
These deficiencies in their knowledge of their own system, at an LV level, call into question the assumptions made in their network models on which their business and operational decisions are made. It should also be noted, however, as evidenced by the experiences of Q17 and Q18 in Table 9, that there is also a general lack of understanding in the electrical trades/electrical engineering sector about the need for phase balancing to optimize the performance of an electrical network that needs to manage both local loads and local generation.
The lack of attention to the low voltage network may also be a result of the way in which risk has been managed by the electricity generation and supply industry. With limited budgets and resources, risk management has focused on managing ‘high impact’ network events, such as loss of a centralised generator or collapse of a major transmission line. This was understandable as such events could impact on thousands or even millions of customers. In a centralised system voltage issues within a low voltage distribution network do not attract much attention from either the industry or the broader public. However, the increase in embedded generation at the low voltage level raises the question of whether there is a need to modify the risk management approach to be more in line with the changing network structure and conditions. These changes include not only the existence of embedded generation but also the sheer number of prosumers who are opting for rooftop PV systems. Voltage and other related power quality issues could become high impact events and could have a high likelihood of occurrence if not managed.
4.2. Missed Opportunities for Better Network Management
Certainly, the addition of residential rooftop PVs into a radial distribution network may present challenges for the management of such networks. The networks were designed for unidirectional energy flows through a network from high to medium to low voltage. The previous section discussed how the focus of network management has been on the medium voltage part of the network with little attention paid to their low voltage conditions such as phase balancing. This lack of knowledge about LV networks appears to be a global problem [32].
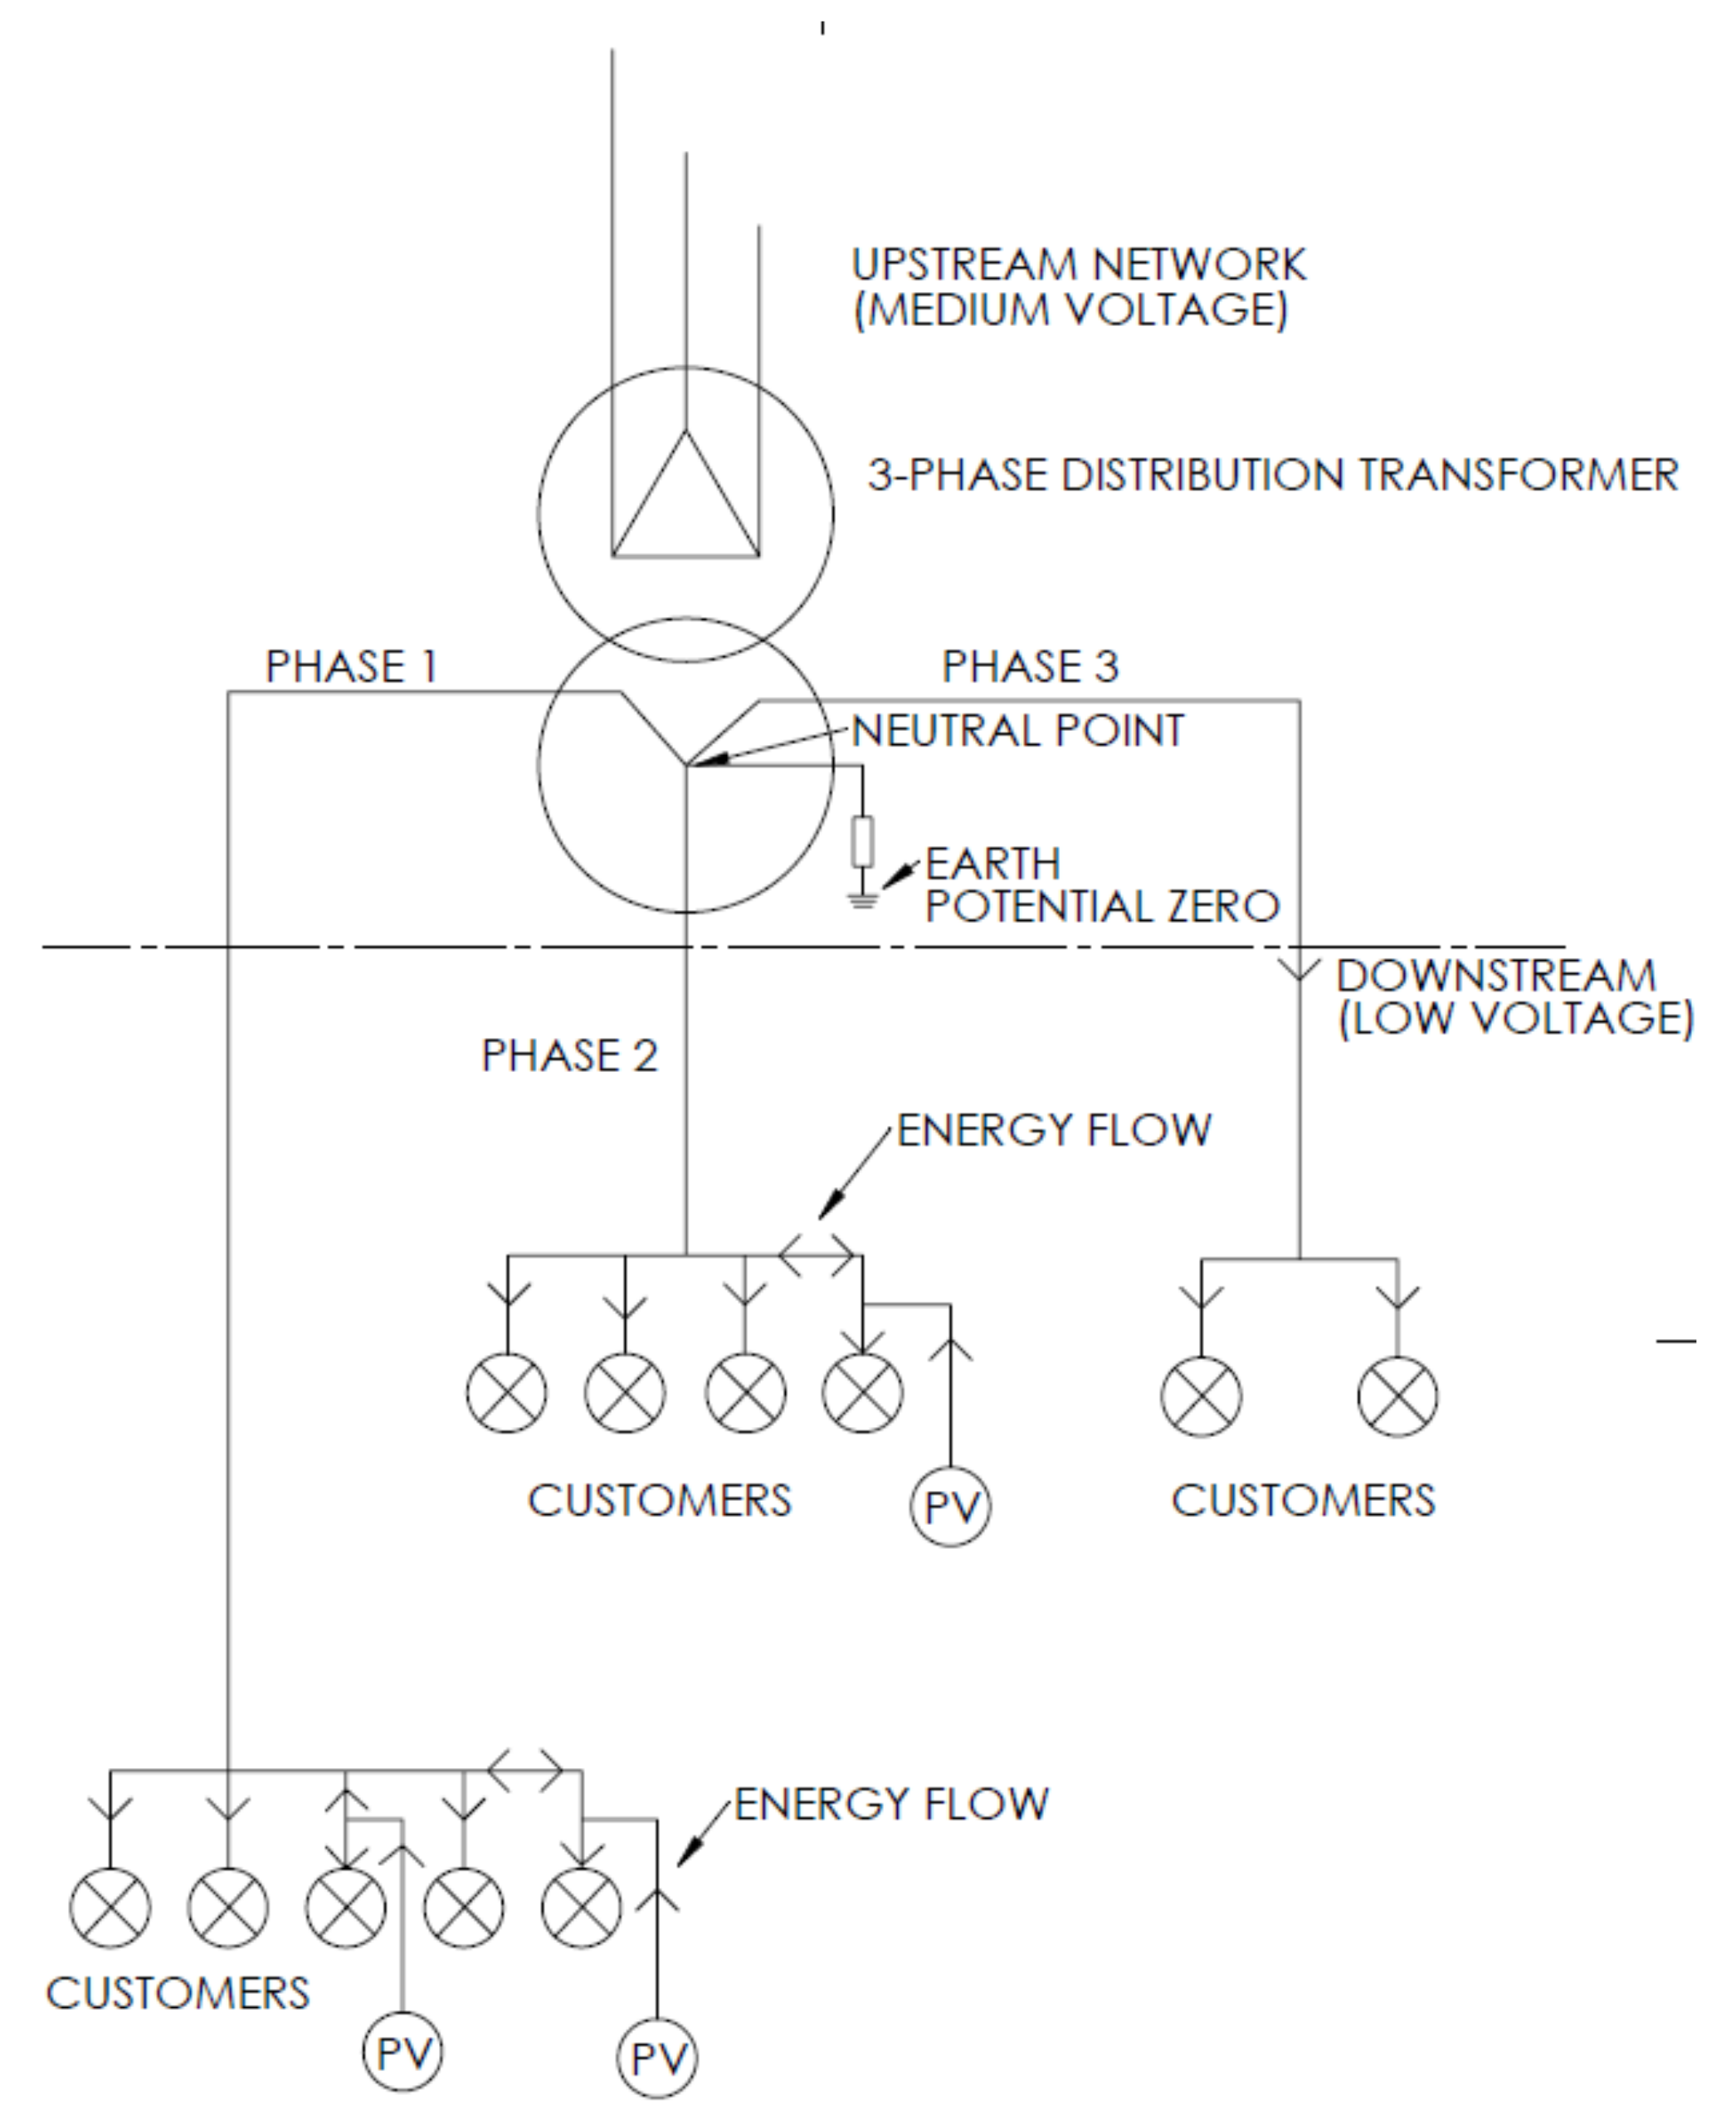
The introduction of residential rooftop PVs means that LV networks are now bi-directional in terms of energy flows and this may exacerbate pre-existing network management issues, such as phase balancing (Figure 11). Connection of residential PV systems to the network (undertaken by the DNSP) may present an opportunity to rebalance the transformers and reset tap changers.
Poor management is also evidenced by DNSPs lack of involvement, as an industry, in a ‘systems thinking’ approach to energy service needs and electricity supply. DNSPs and the energy sector in general are very active in some technical, regulatory and market issues, as highlighted in column 1 of Table 10. This information is collated from a preliminary scan of public documents and government/industry websites in Australia. Column 2 presents additional measures that could be used to address each issue but DNSP involvement in these opportunities is conspicuously absent. This suggests that DNSPs have a somewhat restricted approach to solving power quality issues and are not using their knowledge and influence to improve the total energy system.
One possible reason for this lack of involvement in the whole energy system, is the complexity of their own part of the system (the transmission and distribution network) and its different sub-systems. In Australia, the management of the national network receives a lot of attention, with computer modelling of the transmission network for example including approximately 2400 nodes. In contrast, distribution networks are more complex. For example, in south-east Queensland the distribution network has more than 9 million nodes in a single-phase model. This means modelling such a network, to understand power quality, energy demand and energy flows, will be more complex and time consuming (i.e., have a higher computational cost). Because this part of an energy system has been seen as a lower risk than the transmission network, the DNSPs may not have adequate communicable metering devices within the low voltage network, limiting their knowledge of what is happening at this LV level. Better understanding and operation of the network requires further research to fill gaps in areas such as data acquisition, communication, state estimation, computing, innovative control and embedded generation and energy storage technologies.
4.3. Redefining Relationships with Residential Prosumers
Australia has a significant and growing number of residential rooftop PV systems across all states and territories. Rooftop PV distribution ranges from a low of 10% of residences in the Northern Territory to almost 30% of dwellings in Queensland and South Australia. The rise of residential rooftop PV has already signalled two major challenges to the DNSP business model in terms of customer relations. First, these households are now prosumers—both consumers and producers of electricity—and therefore have different expectations and demands from DNSPs and electricity retailers [47]. Prosumer goals may include, for example, self-sufficiency or reduced reliance on grid electricity, or reduced greenhouse gas emissions or reduced energy costs. Second, because of the inverter, these customers have a network power quality monitor of sorts at their disposal—and may therefore be more aware of when power quality is poor. In the absence of full reporting of power quality by the networks, these customers are likely to call them out on Quality of Service outages. Other opportunities are also emerging that are likely to continue to grow the role of prosumers in the energy market. These include the emergence of home energy storage systems, electric vehicles and the possible active participation of prosumers in wholesale, retail or informal electricity markets through peer-to-peer trading or other mechanisms.
DNSP businesses have always operated in a complex regulatory and technological system but the emergence of prosumers, their differing goals and the access to data about their consumption and generation arguably means that DNSPs now have to add relationship complexity to their business models. The rise of the prosumer has implications for the way that DNSPs have historically managed their assets and how they make business decisions. In essence managing prosumers will require a change in DNSP business culture.
4.4. Lessons from a Quality Management System
Total Quality Management (TQM) is a management approach for improving business culture, products, processes and services. TQM’s eight principles espouse an organisation that sees their culture, products, processes and services as an integrated system; an organisation that is process centred and deploys a strategic and systematic approach to business; an organisation that is both customer focused and actively engages all of their employees; an organisation that is based on fact based decision making, continual improvement and effective communication. Similarly, ISO9000 contains a set of standards for quality management and assurance, helping organisations to establish and document systems for continuous improvement whilst meeting business, regulatory and customer needs and requirements.
These quality management approaches provide a process that DNSPs could adopt to incorporate into their business culture and practices both the technical complexities that rooftop PV present and the relationship complexities that prosumers present. In particular a systematic approach to a thorough and comprehensive audit of LV networks appears to be warranted, to determine existing power quality and management settings and parameters. This will assist in providing evidence to support instances where specific power quality issues or constraints are, or are not, attributable to rooftop PV systems. Equally important would be the re-setting of the relationship with prosumers—from adversarial to collaborative and collegial. Moving from a ‘risk management’ approach to an ‘opportunity investigation’ approach would entail DNSPs actively engaging with prosumers to develop innovations in technology and business models to enable both prosumers and DNSPs to benefit from the increasing penetration of rooftop solar. The traditional approach to electricity supply and demand and the manner in which networks are managed, could be re-conceptualised to a supply, demand and management model applied at an LV or even neighbourhood level, identifying opportunities where the greatest value of rooftop PV can be realized—for prosumers and the network.
5. Conclusions
This paper reports on analysis of power quality data measured at the point of customer connection at four households on different radial networks around Australia. The paper quantifies power quality variations (voltage, frequency and power factor) on a monthly basis over a twelve-month period. Possible contributors to voltage variations were examined, including the houses’ location in regard to the nearest network transformer, the houses’ solar generation and the households’ load profile. No direct correlation was found between these factors and the voltage variations measured, suggesting that power quality variations measured at these households are attributable to other (non-PV) causes. The discussion presents evidence of historically poor knowledge of and management of, low voltage networks and missed opportunities for network improvement. The paper proposes that DNSPs need to re-conceptualise their business culture and practices to embrace the changed nature of energy supply and demand in a world of prosumers and technological and business innovation.
Acknowledgments
This research is part of an Australian Research Council project (ARC LP 130100650 from innovators to mainstream market: A Toolkit for transforming Australian housing and maximising sustainability outcomes for stakeholders) funded by the Australian Government and industry. The funding bodies had no input into the study design; collection, analysis and interpretation of data; the writing of the report or in the decision to submit the article for publication. The research team sincerely thanks the owner-occupiers of these homes for allowing us to intrude into their environment.
Author Contributions
Wendy Miller, Zakaria Amin and Andreas Wagner conceived and designed the data analysis; Zakaria Amin and Andreas Wagner analysed the data; Aaron Liu interpreted the results from the context of low voltage networks; Wendy Miller wrote the paper with contributions from all authors. All authors contributed to refining and editing the paper.
Conflicts of Interest
The authors declare no conflict of interest.
Glossary
| CT clamp | current transformed clamp |
| DNSP | distribution network service provider |
| HEMS | home energy management system |
| IQR | inter quartile range |
| LV | low voltage |
| LVDN | low voltage distribution network |
| PCC | point of common coupling (from network to residential premises) |
| pf | power factor |
| PoA | point of attachment (network to residential premises) |
| PV | photovoltaic |
References
- European Commission. 2030 Climate & Energy Framework. Available online: http://ec.europa.eu/clima/policies/strategies/2030_en (accessed on 31 January 2017).
- Morris, C. Germany May Reach Its 2020 Target for Renewable Power This Year. Available online: http://reneweconomy.com.au/will-germany-reach-2020-target-renewable-power-year-74293/ (accessed on 31 January 2017).
- The White House. Executive Order—Planning for Federal Sustainability in the Next Decade, Executive Order 13693 ed.; Office of the Press Secretary: Washington, DC, USA, 2015. [Google Scholar]
- World Resources Institute. Renewable Energy in China: An Overview; World Resources Institute: Washington, DC, USA, 2014. [Google Scholar]
- Clean Energy Regulator. The Renewable Energy Target 2014 Administrative Report; Australian Government: Canberra, Australia, 2015.
- U.S. Energy Information Administration. International Energy Outlook 2016; U.S. Energy Information Administration: Washington, DC, USA, 2016.
- Mirhassani, S.; Ong, H.C.; Chong, W.T.; Leong, K.Y. Advances and challenges in grid tied photovoltaic systems. Renew. Sustain. Energy Rev. 2015, 49, 121–131. [Google Scholar] [CrossRef]
- Haque, M.M.; Wolfs, P. A review of high pv penetrations in lv distribution networks: Present status, impacts and mitigation measures. Renew. Sustain. Energy Rev. 2016, 62, 1195–1208. [Google Scholar] [CrossRef]
- Eltawil, M.A.; Zhao, Z. Grid-connected photovoltaic power systems: Technical and potential problems—A review. Renew. Sustain. Energy Rev. 2010, 14, 112–129. [Google Scholar] [CrossRef]
- Tratnam, E.L.; Well, S.R.; Kellett, C.M. Central versus localized optimization-based approaches to power management in distribution networks with residential battery storage. Int. J. Electr. Power Energy Syst. 2016, 80, 396–406. [Google Scholar] [CrossRef]
- Penido, D.R.R.; Araujo, L.R.; Carneiro, S.; Pereira, J.L.R.; Garcia, P.A.N. Power Factor Correction on Distribution Networks Including Distributed Generation. In Proceedings of the IEEE Power Engineering Society General Meeting, Tampa, FL, USA, 24–28 June 2007; pp. 1–6. [Google Scholar]
- Pompodakis, E.E.; Drougakis, I.A.; Lelis, I.S.; Alexiadis, M.C. Photovoltaic systems in low-voltage networks and overvoltage correction with reactive power control. IET Renew. Power Gener. 2016, 10, 410–417. [Google Scholar] [CrossRef]
- Khuleedee, W.; Kaewrawang, A.; Tonmitr, K. Impact of on-grids solar pv rooftop on low voltage grid systems: A case study of pea udonthani, thailand. Appl. Mech. Mater. 2015, 781, 296. [Google Scholar] [CrossRef]
- Obi, M.; Bass, R. Trends and challenges of grid-connected photovoltaic systems—A review. Renew. Sustain. Energy Rev. 2016, 58, 1082–1094. [Google Scholar] [CrossRef]
- Watson, G.D.; Watson, N.R.; David, S.-M.; Wood, A.R.; Lemon, S.; Miller, A.J.V. Impact of solar photovoltaics on the low-voltage distribution network in new zealand. IET Gener. Transm. Distrib. 2016, 10. [Google Scholar] [CrossRef]
- Shahnia, F.; Majumder, R.; Ghosh, A.; Ledwich, G.; Zare, F. Voltage imbalance analysis in residential low voltage distribution networks with rooftop pvs. Electr. Power Syst. Res. 2011, 81, 1805–1814. [Google Scholar] [CrossRef]
- Rafi, F.H.M.; Hossain, M.J.; Lu, J. Hierarchical controls selection based on pv penetrations for voltage rise mitigation in a lv distribution network. Int. J. Electr. Power Energy Syst. 2016, 81, 123–139. [Google Scholar] [CrossRef]
- Guinane, A.; McPhail, D.; Gorman, M. Impacts of voltage transition from 240v to 230v voltage. In Proceedings of the Australasian Universities Power Engineering Conference (AUPEC), Brisbane, Australia, 26–29 September 2016. [Google Scholar]
- Shivashankar, S.; Mekhilef, S.; Mokhlis, H.; Karimi, M. Mitigating methods of power fluctuation of photovoltaic (pv) sources—A review. Renew. Sustain. Energy Rev. 2016, 59, 1170–1184. [Google Scholar] [CrossRef]
- Kouro, S.; Leon, J.I.; Vinnikov, D.; Franquelo, L.G. Grid-connected photovoltaic systems: An overview of recent research and emerging pv converter technology. IEEE Ind. Electron. Mag. 2015, 9, 47–61. [Google Scholar] [CrossRef]
- Alam, M.J.E.; Muttaqi, K.M.; Sutanto, D. Alleviation of neutral-to-ground potential rise under unbalanced allocation of rooftop pv using distributed energy storage. IEEE Trans. Sustain. Energy 2015, 6, 889–898. [Google Scholar] [CrossRef]
- Karimi, M.; Mokhlis, H.; Naidu, K.; Uddin, S.; Bakar, A.H.A. Photovoltaic penetration issues and impacts in distribution network—A review. Renew. Sustain. Energy Rev. 2016, 53, 594–605. [Google Scholar] [CrossRef]
- Georgilakis, P.S.; Harziargyriou, N.D. A review of power distribution planning in the modern power systems era: Models, methods and future research. Electr. Power Syst. Res. 2015, 121, 89–100. [Google Scholar] [CrossRef]
- Singh, B.; Chandra, A.; Al-HAddad, K. Power Quality: Problems and Mitigation Techniques; Wiley: West Sussex, UK, 2015. [Google Scholar]
- Blumsack, S. Why Rooftop Solar Is Disruptive to Utilities—And the Grid. Available online: https://theconversation.com/why-rooftop-solar-is-disruptive-to-utilities-and-the-grid-39032 (accessed on 2 February 2017).
- Tlozek, E. Qld Electricity Providers Trying to Block Solar from Grid, Lobby Group Says. Available online: http://www.abc.net.au/news/2014-07-08/qld-providers-trying-to-block-solar-from-grid-groups-says/5579874 (accessed on 8 July 2014).
- Slezak, M. Australia‘s Polictics Only Barrier to Clean Energy System, Report Finds. Available online: https://www.theguardian.com/australia-news/2017/oct/05/australias-politics-only-barrier-to-clean-energy-system-report-finds (accessed on 5 October 2017).
- Warrick, J. Utilities Wage Campaign against Rooftop Solar. Available online: https://www.washingtonpost.com/national/health-science/utilities-sensing-threat-put-squeeze-on-booming-solar-roof-industry/2015/03/07/2d916f88-c1c9-11e4-ad5c-3b8ce89f1b89_story.html?utm_term=.7ba37c86d47b (accessed on 2 February 2017).
- Hepworth, A. Rooftop Solar Panels Overloading Electricity Grid. Available online: http://www.theaustralian.com.au/news/rooftop-solar-panels-overloading-electricity-grid/news-story/5ea583571dde0830ec34d3cd8c32b9dc (accessed on 12 April 2018).
- Too Much Solar Power Could Overload National Grids, Warns Expert. Available online: http://www.dailymail.co.uk/sciencetech/article-1324264/Too-solar-power-overload-national-grid-warns-German-energy-expert.html (accessed on 7 March 2018).
- GEM Energy. Technical Aspects—Connecting to the Grid. Available online: https://www.gemenergy.com.au/technical-aspects-connecting-to-the-grid/ (accessed on 7 March 2017).
- Barbato, A.; Dede, A.; Della Giustina, D.; Massa, G.; Angioni, A.; Laipari, G.; Ponci, F.; Repo, S. Lessons learnt from real-time monitoring of the low voltage distribution network. Sustain. Energy Grids Netw. 2017. [Google Scholar] [CrossRef]
- Neuman, W.L. Social Research Methods: Qualitative and Quantitative Approaches, 7th ed.; Allyn & Bacon: Boston, MA, USA, 2011. [Google Scholar]
- Creswell, J.W. Research Design: Qualitative, Quantitative and Mixed Methods Approaches; SAGE Publications: Thousand Oaks, CA, USA, 2009. [Google Scholar]
- Abowitz, D.A.; Toole, T.M. Mixed method research: Fundamental issues of design, validity and reliability in construction research. J. Constr. Eng. Manag. 2010, 136, 108–116. [Google Scholar] [CrossRef]
- Reliability Panel. Review of the Frequency Operating Standard, Issues Paper 14 July 2017; Australian Energy Market Commission (AEMC): Canberra, Australia, 2017.
- Australian Energy Market Commission (AEMC) Reliability Panel. Application of Frequency Operating Standards during Periods of Supply Scarcity: Final Determination; AEMC: Sydney, Australia, 2009.
- Markiewicz, H.; Klajn, A. Voltage Disturbances: Standard en 50160—Voltage Characteristics in Public Distribution Systems; European Copper Institute, Wroclaw University of Technology and Copper Development Association: Hemel Hempstead, UK, 2004. [Google Scholar]
- National Grid Electricity Transmission plc. The Grid Code, Issue 5, Revision 21; National Grid Electricity Transmission plc: Great Britain, UK, 2017. [Google Scholar]
- New Zealand Government. Electricity Industry Participation Code 2010; New Zealand Government: Okiato, New Zealand, 2010.
- The South African Grid Code—System Operation Code South Africa. Available online: http://www.nersa.org.za/Admin/Document/Editor/file/Electricity/Compliance%20Monitoring/SAGC%20Network%20Version%207_March%202008.pdf (accessed on 12 April 2018).
- Swedish Standard. Voltage Characteristics of Electricity Supplied by Public Electricity Networks; German Institute for Standardisation: Berlin, Germany, 2010. [Google Scholar]
- Standard, B. Bs7671: 2008+a3: 2015—Requirements for Electrical Installation. Iet Wiring Regulations. Available online: https://shop.bsigroup.com/ProductDetail?pid=000000000030292893 (accessed on 12 April 2018).
- American National Standards Institute (ANSI). Ansi c84.1-2016: American National Standard for Electrical Power Systems and Equipment—Voltage Ratings (60 Hertz); National Electrical Manufacturers Association: Rosslyn, VA, USA, 2016. [Google Scholar]
- Australian Standard. As 61000.3.100-2011: Electromagnetic Compatibility (emc)—Limits—Steady State Voltage Limits in Public Electricity Systems. Available online: https://www.techstreet.com/standards/as-61000-3-100-2011-amdt-1-2016?product_id=1913602 (accessed on 12 April 2018).
- Halliday, C.; Elder, L. Power Factor Correction—The Easiest, Biggest, Green Initiative. Available online: http://www.powerlogic.com.au/electrical-policies-and-procedures_11_2895948716.pdf (accessed on 12 April 2018).
- Miller, W.; Senadeera, M. Social transition from energy consumers to prosumers: Rethinking the purpose and functionality of eco-feedback technologies. Sustain. Cities Soc. 2017, 35, 615–625. [Google Scholar] [CrossRef]
- Miller, W.; Liu, A.L.; Amin, Z.; Gray, M. Involving occupants in net-zero-energy solar housing retrofits: An australian sub-tropical case study. Sol. Energy 2018, 159, 390–404. [Google Scholar] [CrossRef]
- Zedan, S.; Miller, W. Quantifying stakeholders‘ influence on energy efficiency in housing: Development and application of a four-step methodology. Constr. Manag. Econ. 2017, 1–19. [Google Scholar] [CrossRef]
- Miller, W.; Amin, Z.; Zedan, S. Steel sips for residential building construction: Lessons from air leakage and thermography analysis of australian houses. J. Archit. Eng. 2017, 23, 04017012. [Google Scholar] [CrossRef]
- EnOB—Research for Energy Optimized Building. Monisoft—Software for Monitoring and Energetic Performance Optimisation. Available online: http://www.enob.info/en/software-and-tools/projects/details/monisoft-software-for-monitoring-and-energetic-performance-optimisation/ (accessed on 1 February 2017).
- Franz, J. California‘s Electrical Grid Can‘t Handle All the Solar Energy the State Is Producing. Available online: https://www.pri.org/stories/2017-07-20/california-s-electrical-grid-can-t-handle-all-solar-energy-state-producing (accessed on 7 March 2018).
- Buffett, W.E. Chairman’s Letter, Berkshire Hathaway Inc. 2015 Annual Report; Berkshire Hathaway Inc.: Omaha, Nebraska, 2016. [Google Scholar]
Figure 1.
Example of voltage distribution based on AS 61000.3.100 (230 V) [45].
Figure 1.
Example of voltage distribution based on AS 61000.3.100 (230 V) [45].
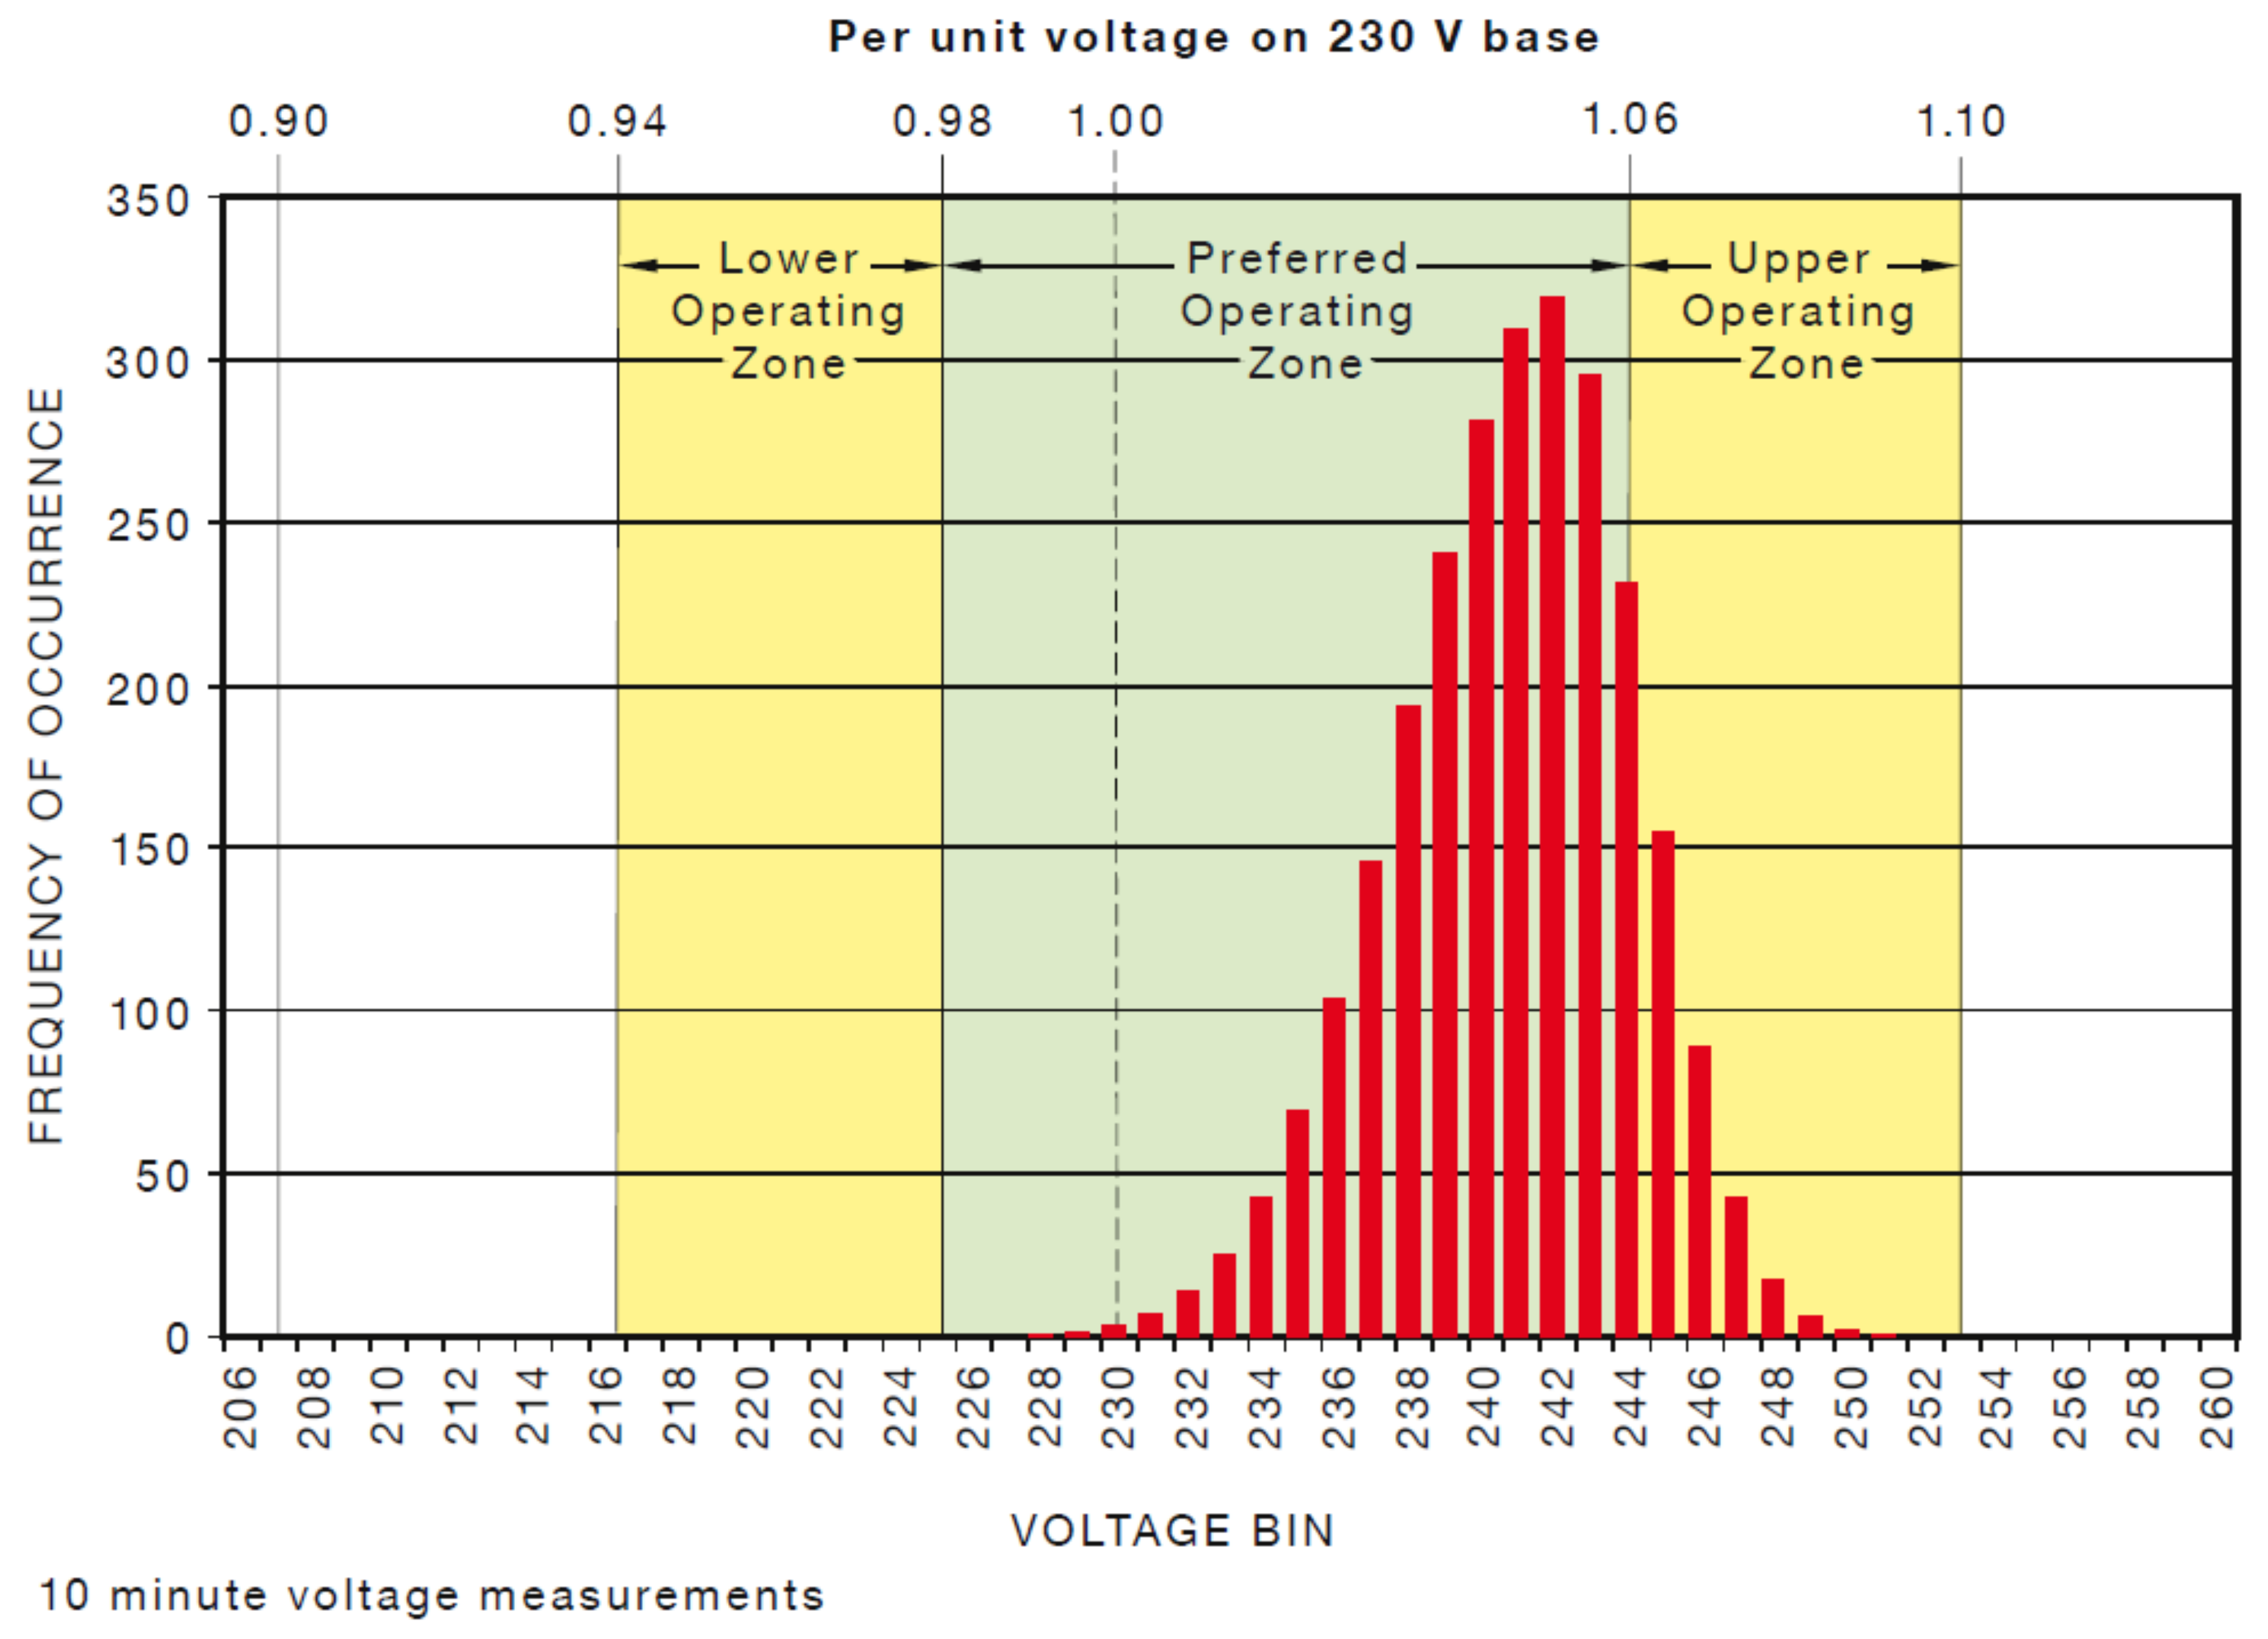
Figure 2.
Voltage Box and Whisker Plot (minute wise).

Figure 3.
(a–d) Voltage Variation in each location according to AS61000.3.100.

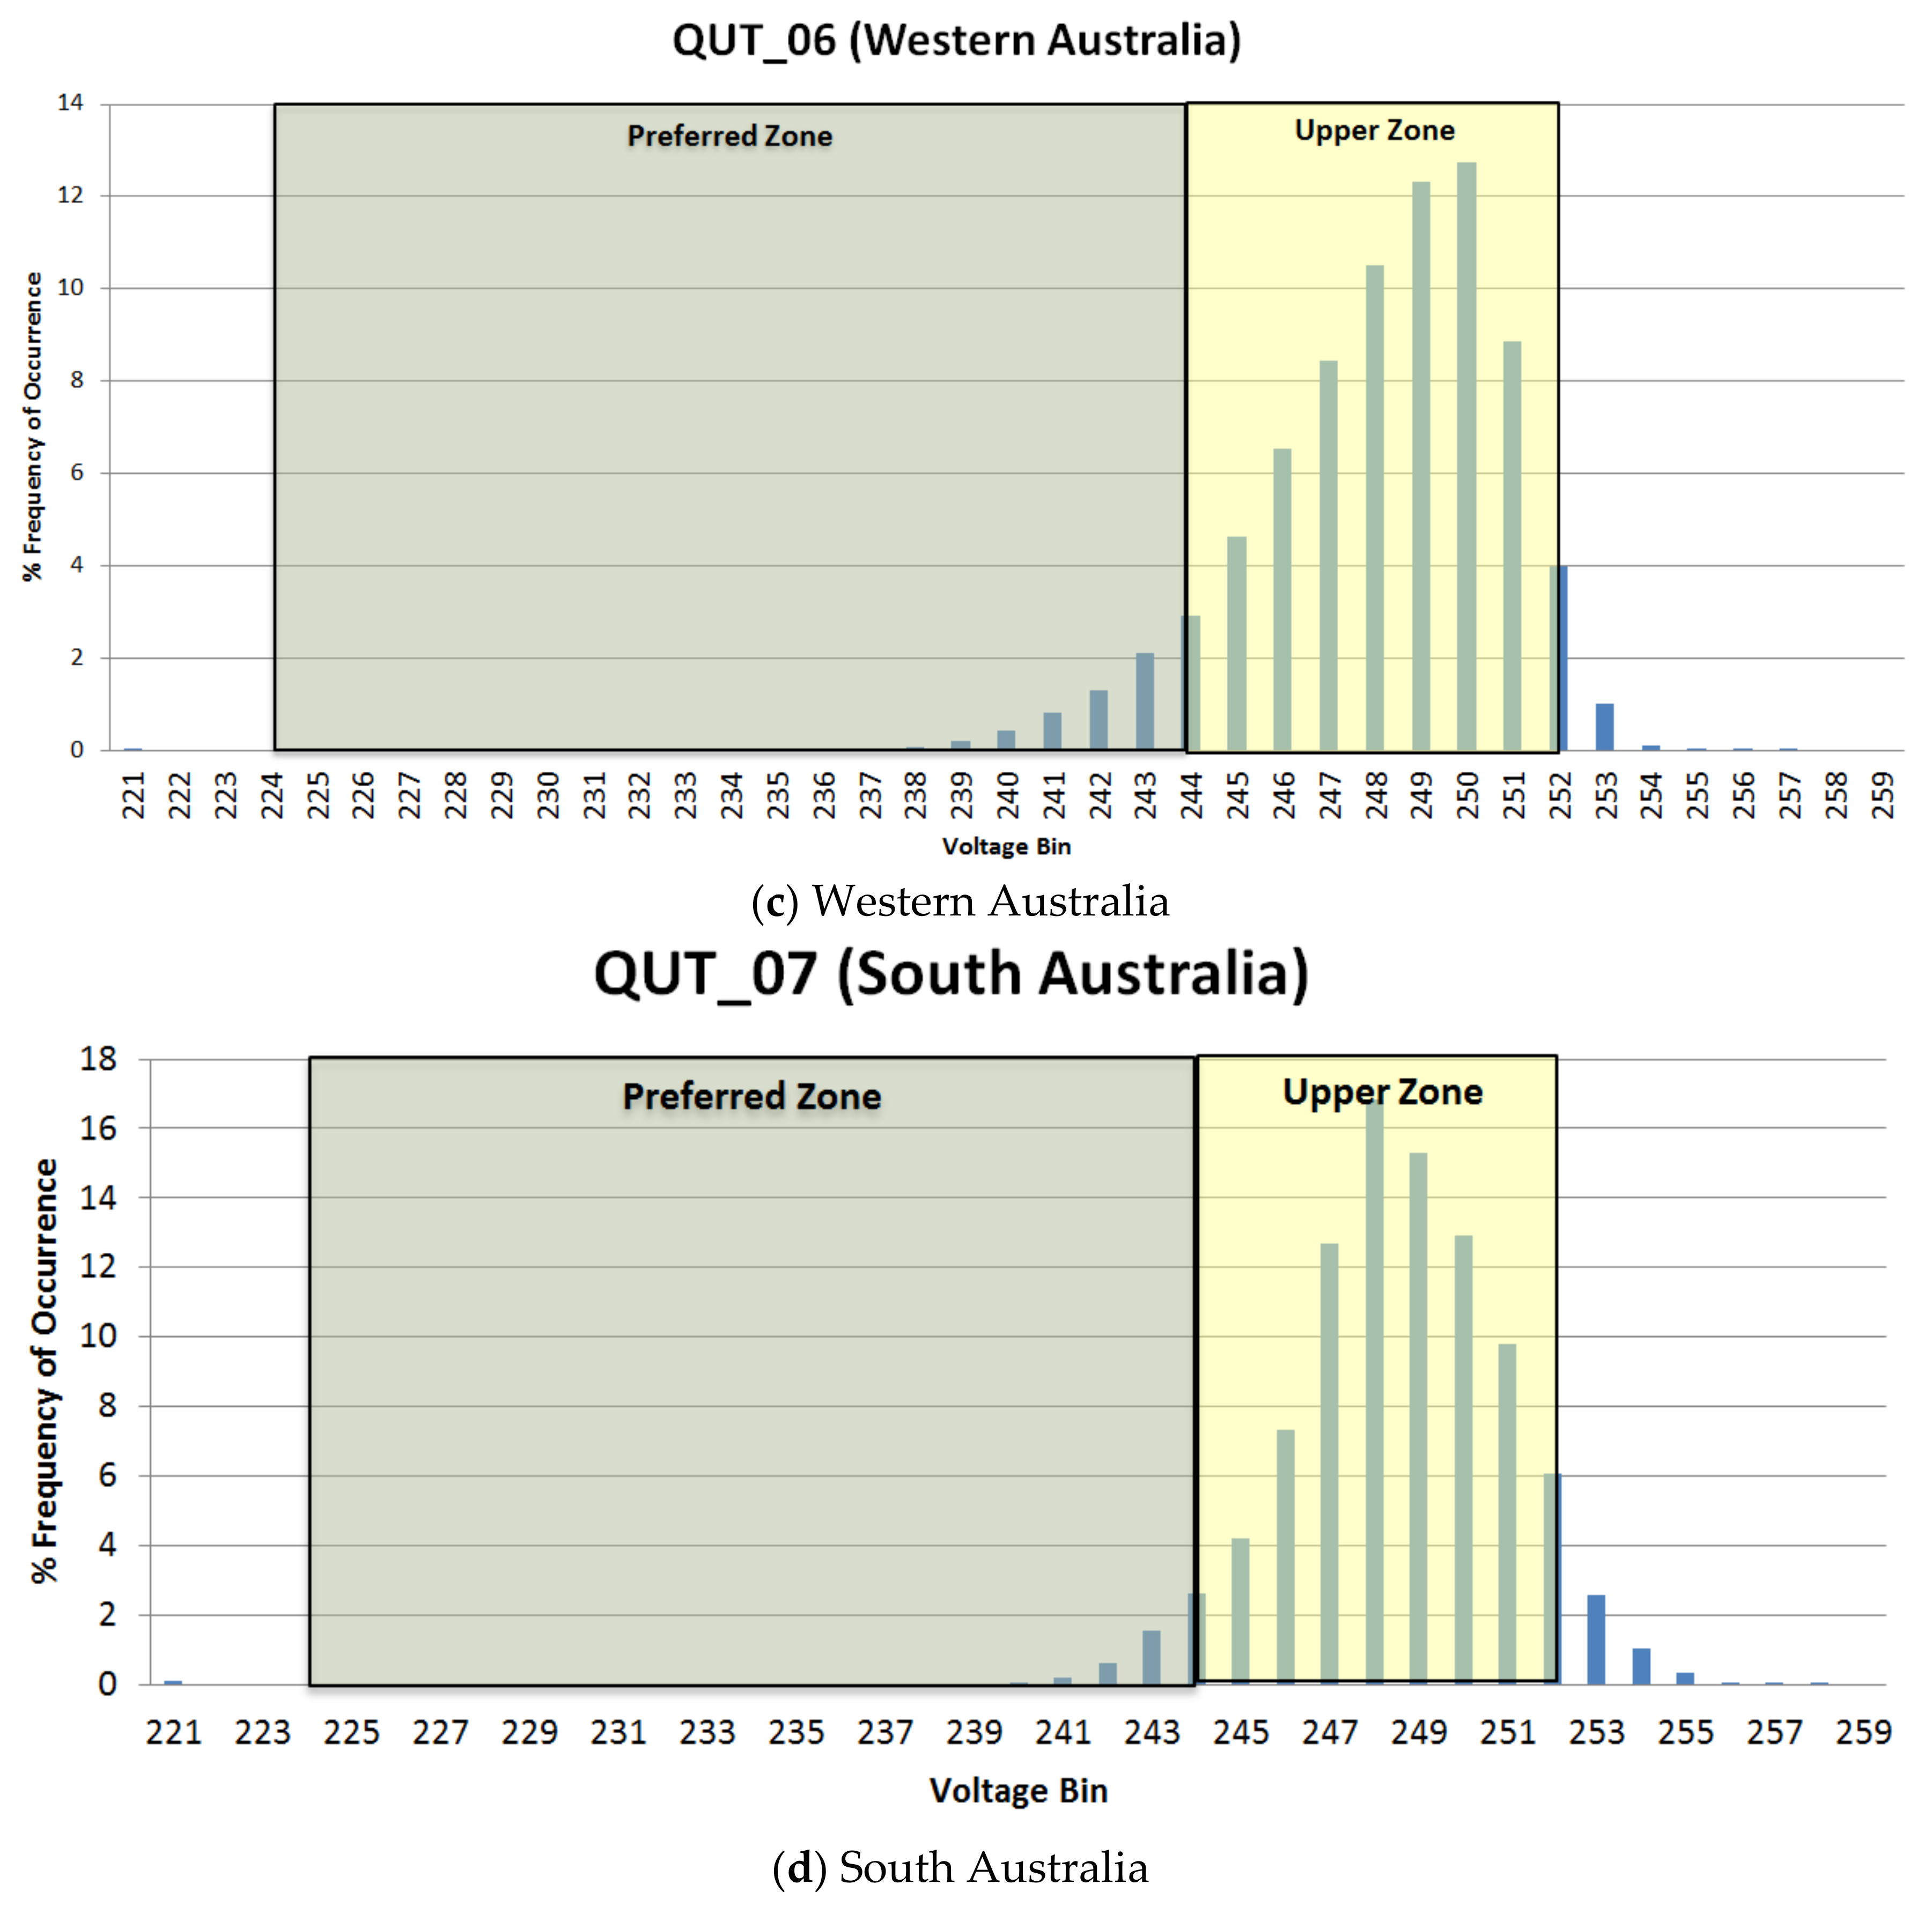
Figure 4.
Voltage variation carpet graphs for case study house in (a) Queensland; (b) South Australia; (c) Victoria; (d) Western Australia.
Figure 4.
Voltage variation carpet graphs for case study house in (a) Queensland; (b) South Australia; (c) Victoria; (d) Western Australia.
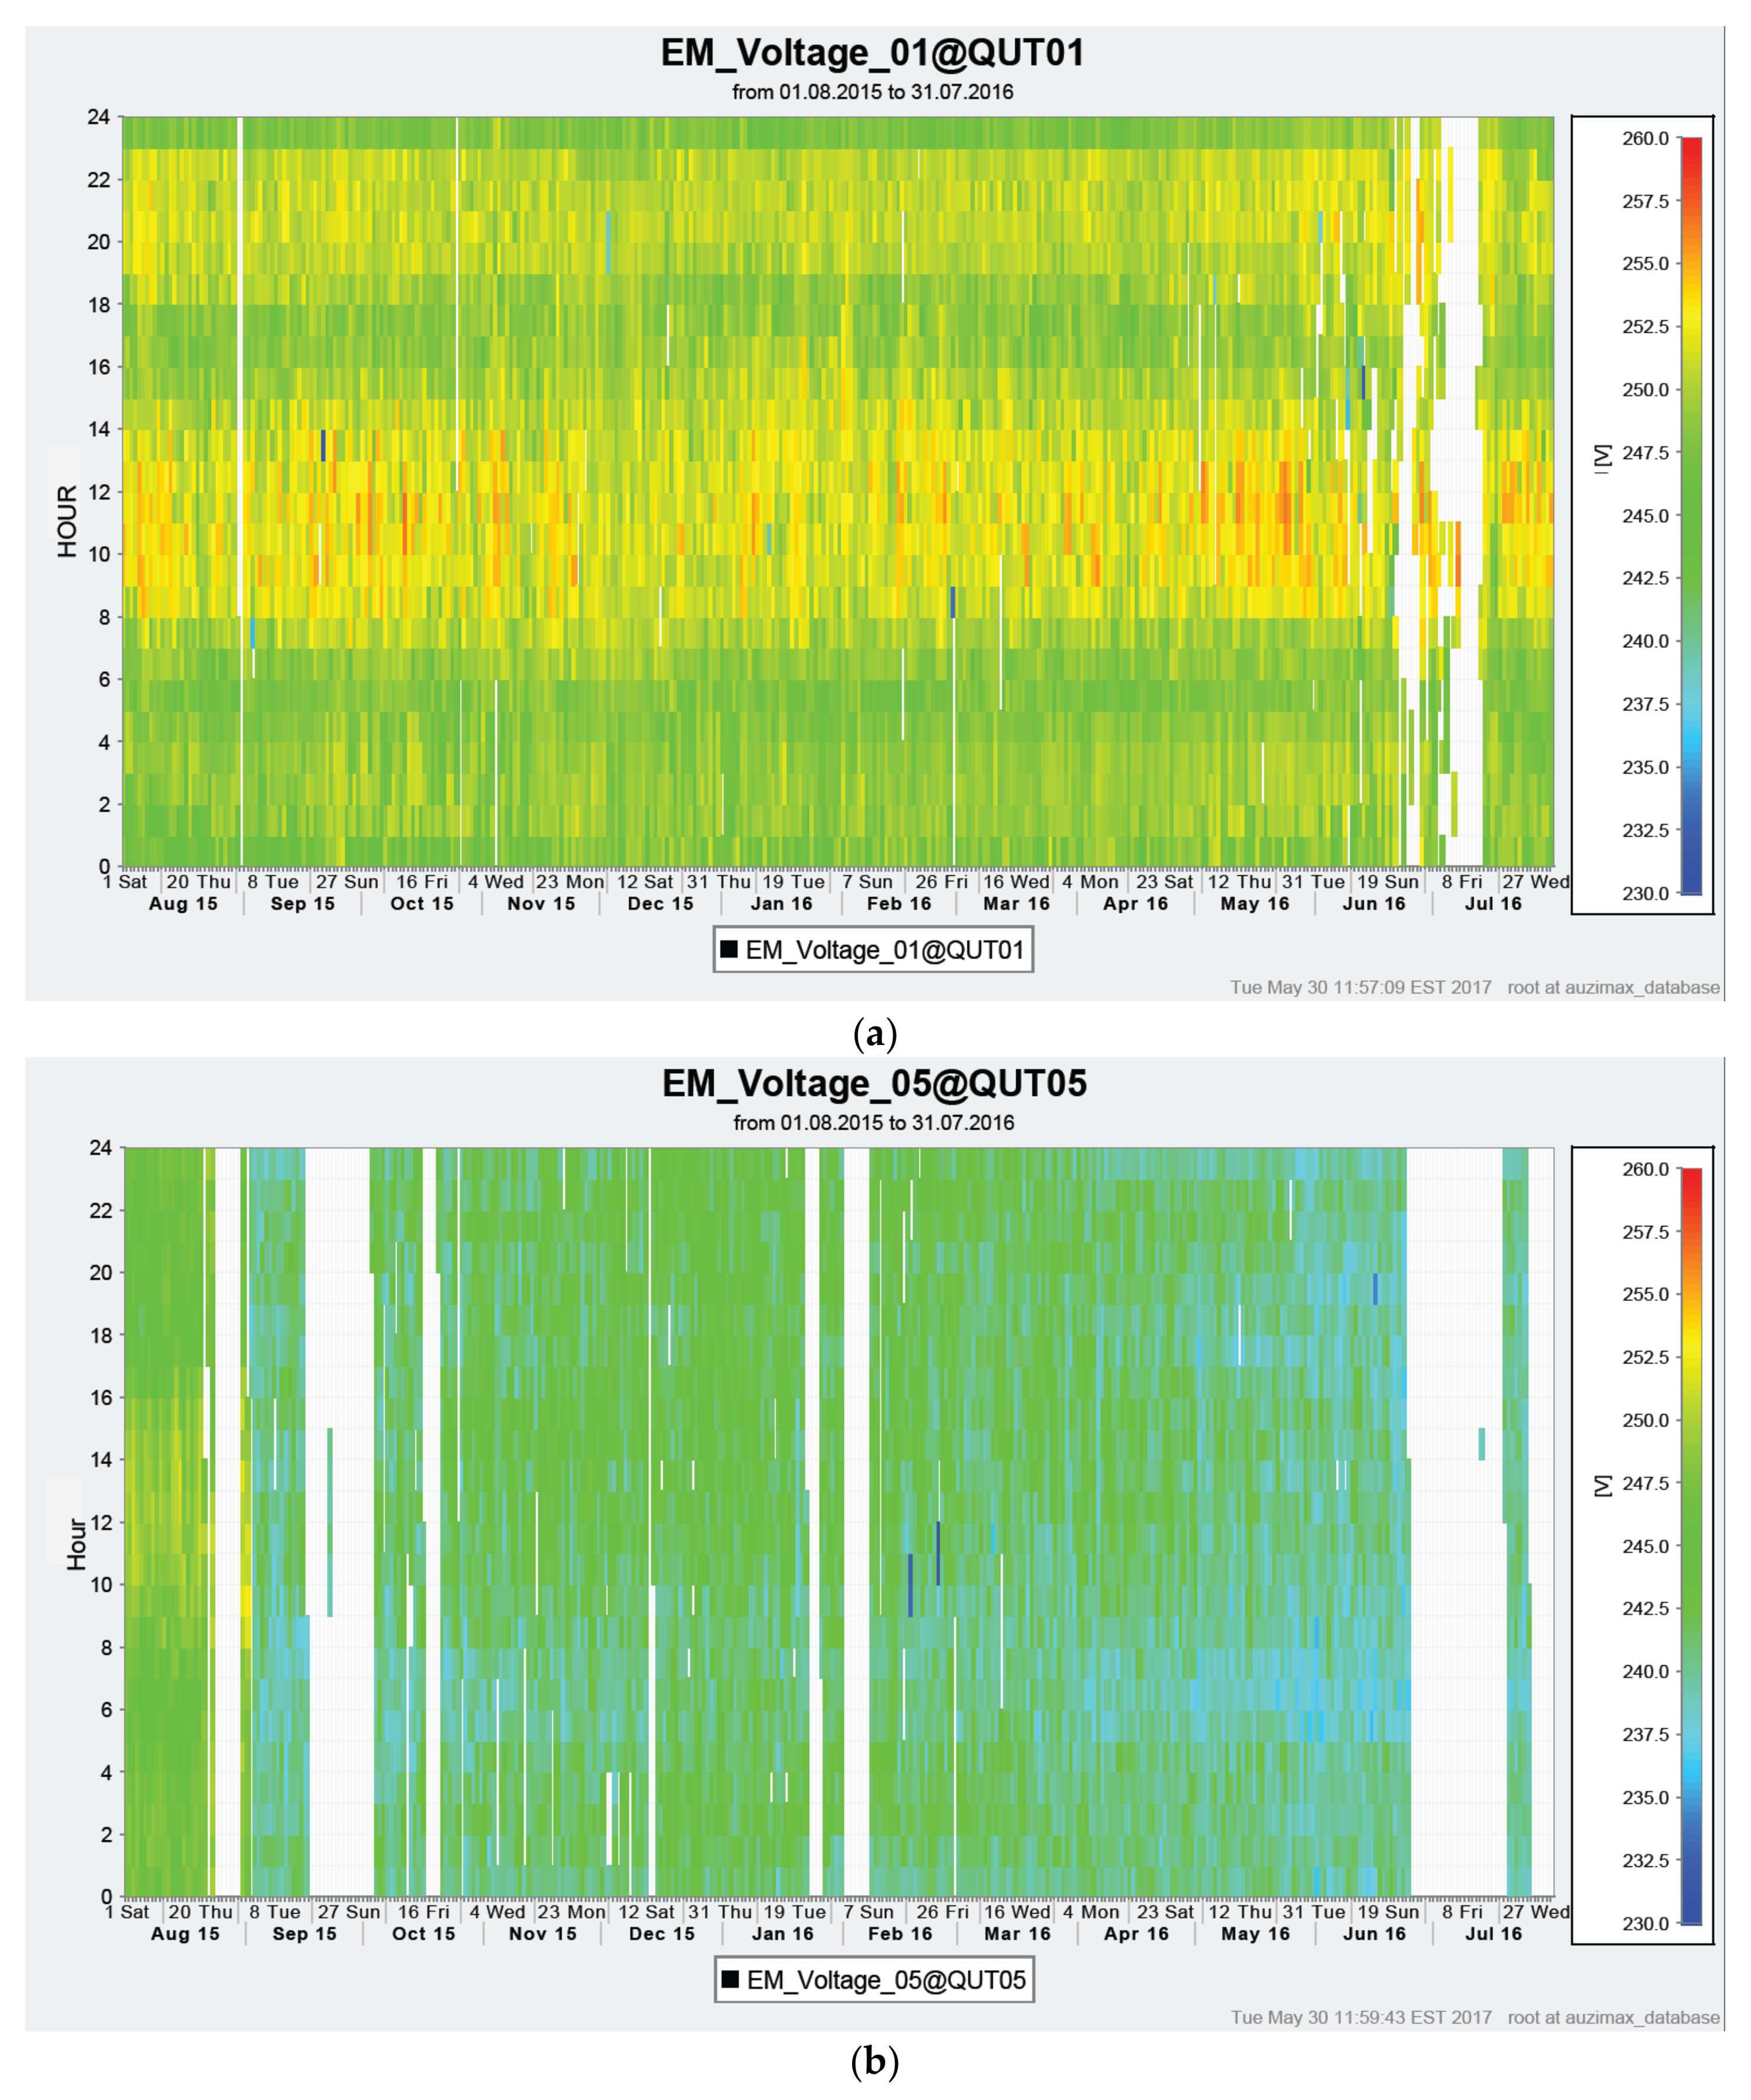
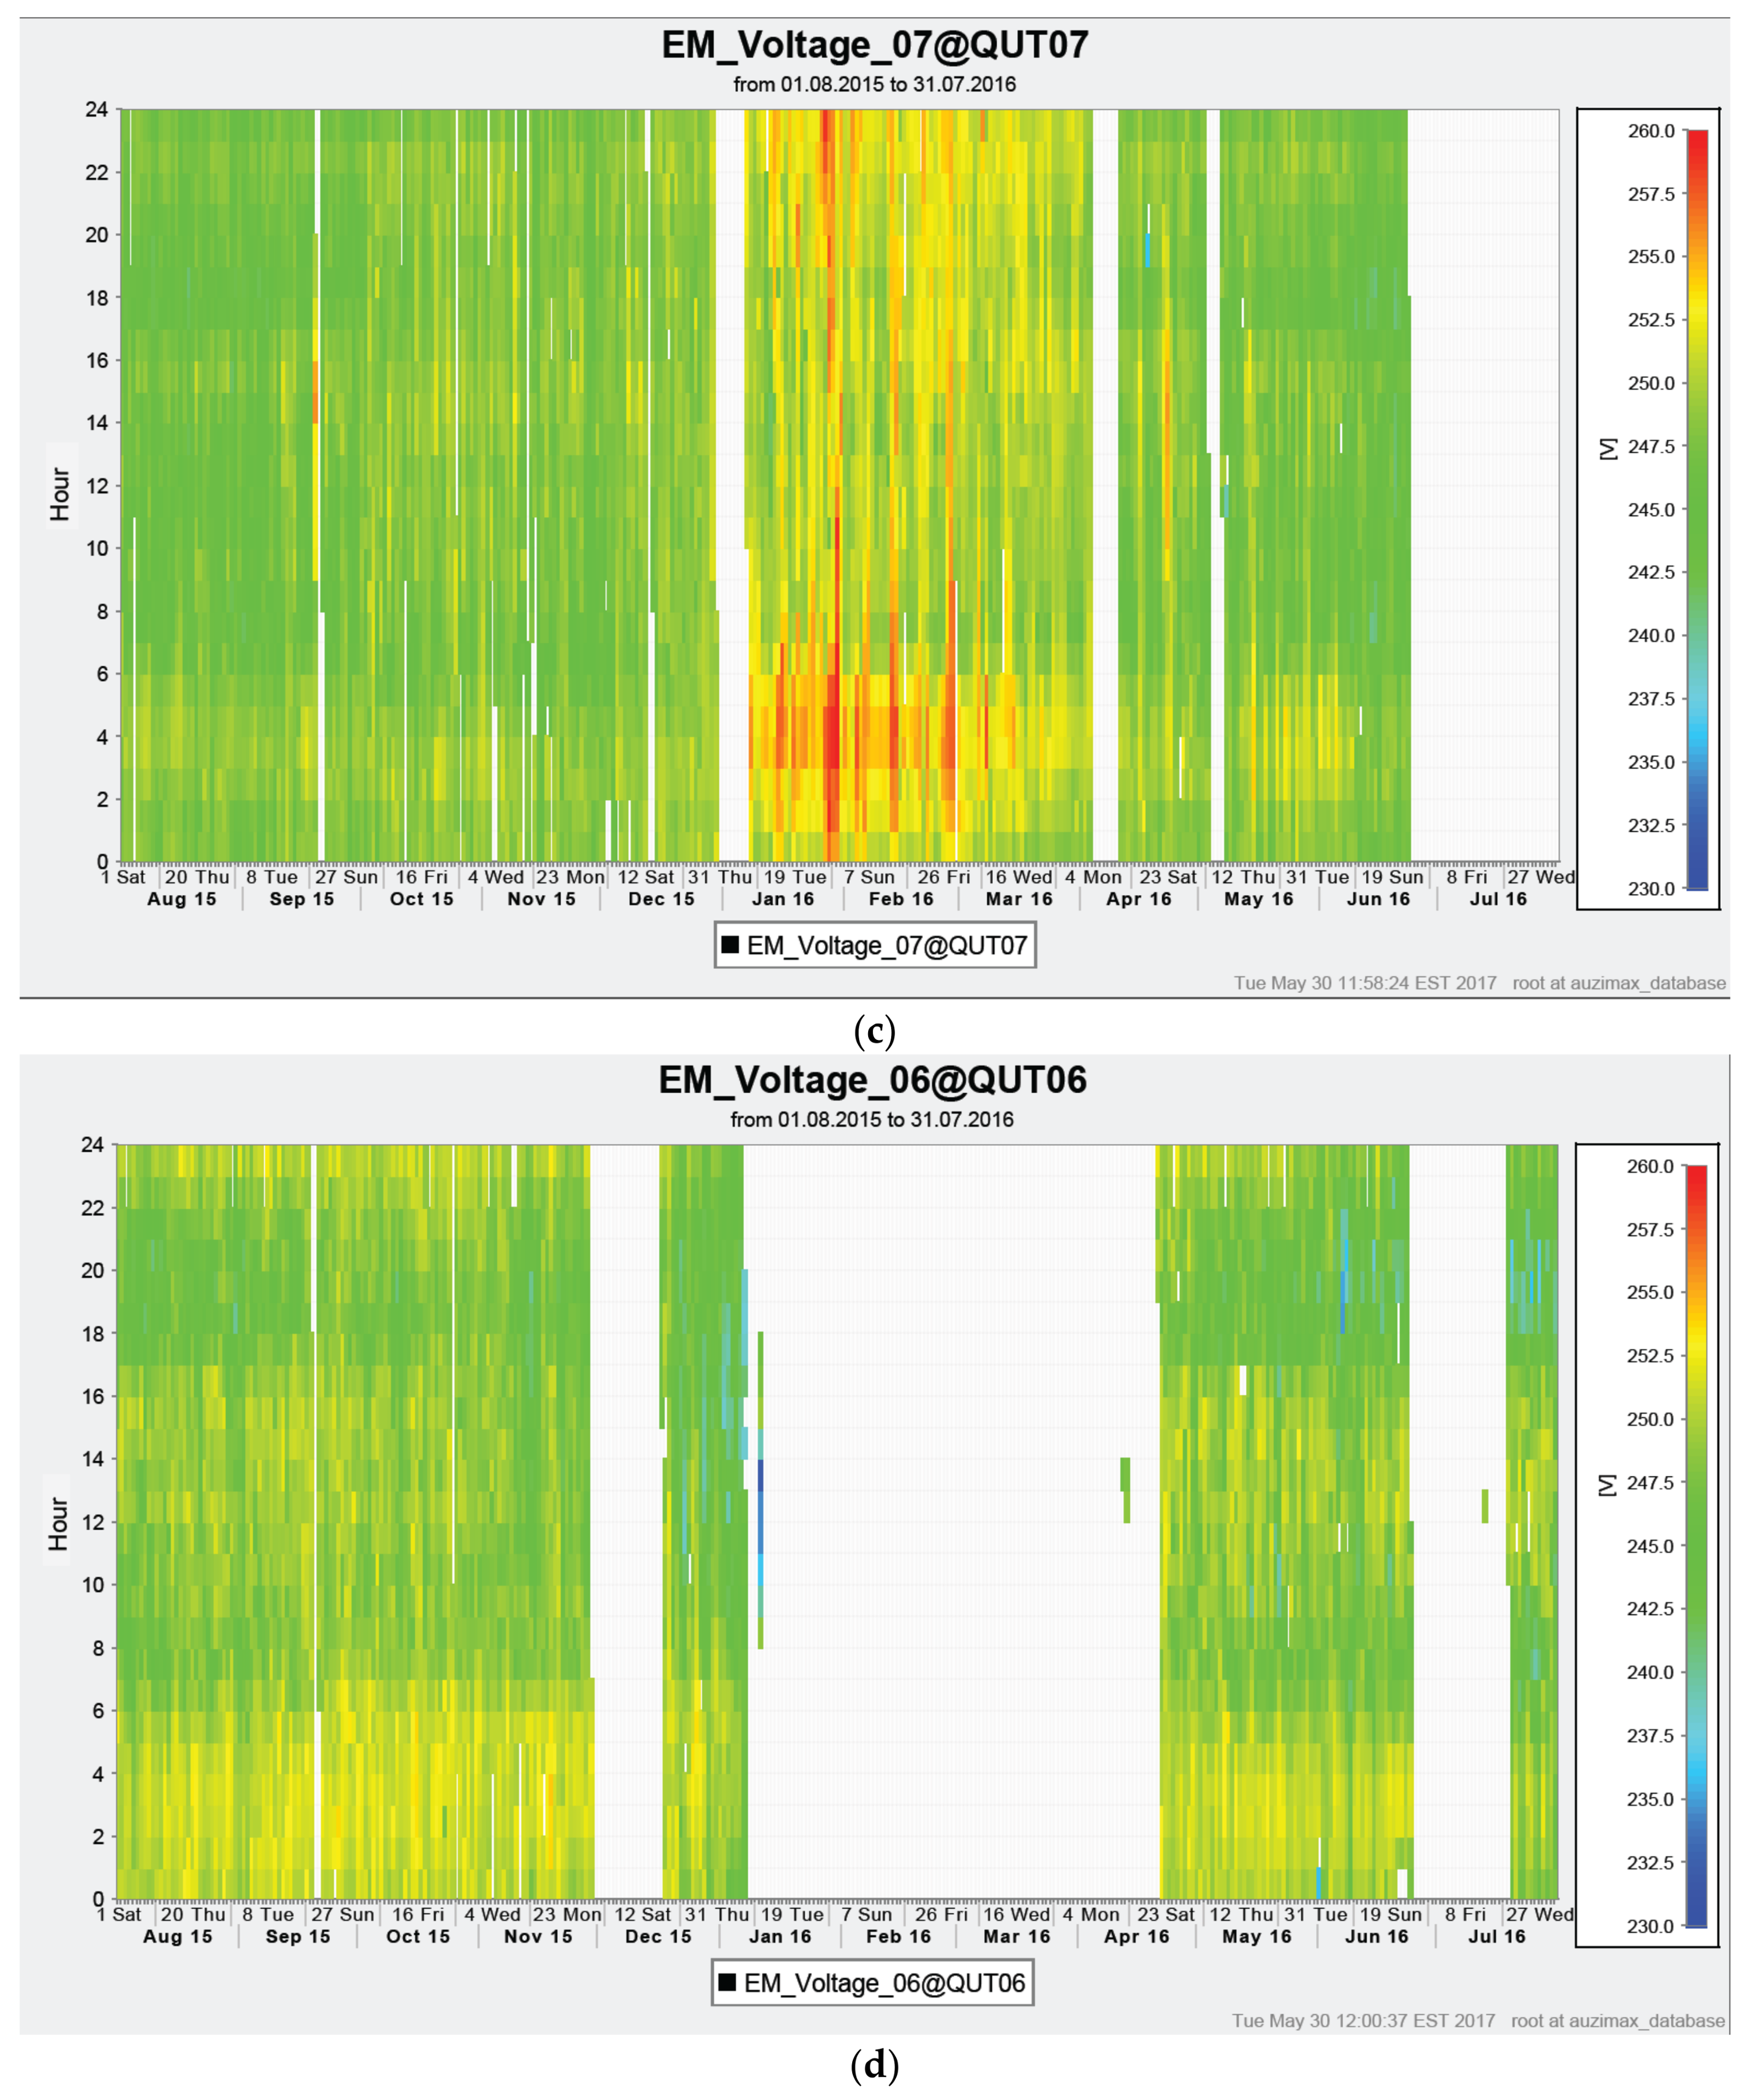
Figure 5.
Photo of Victorian house showing relationship with network transformer.

Figure 6.
Aerial view of Queensland house showing transformer and dairy.
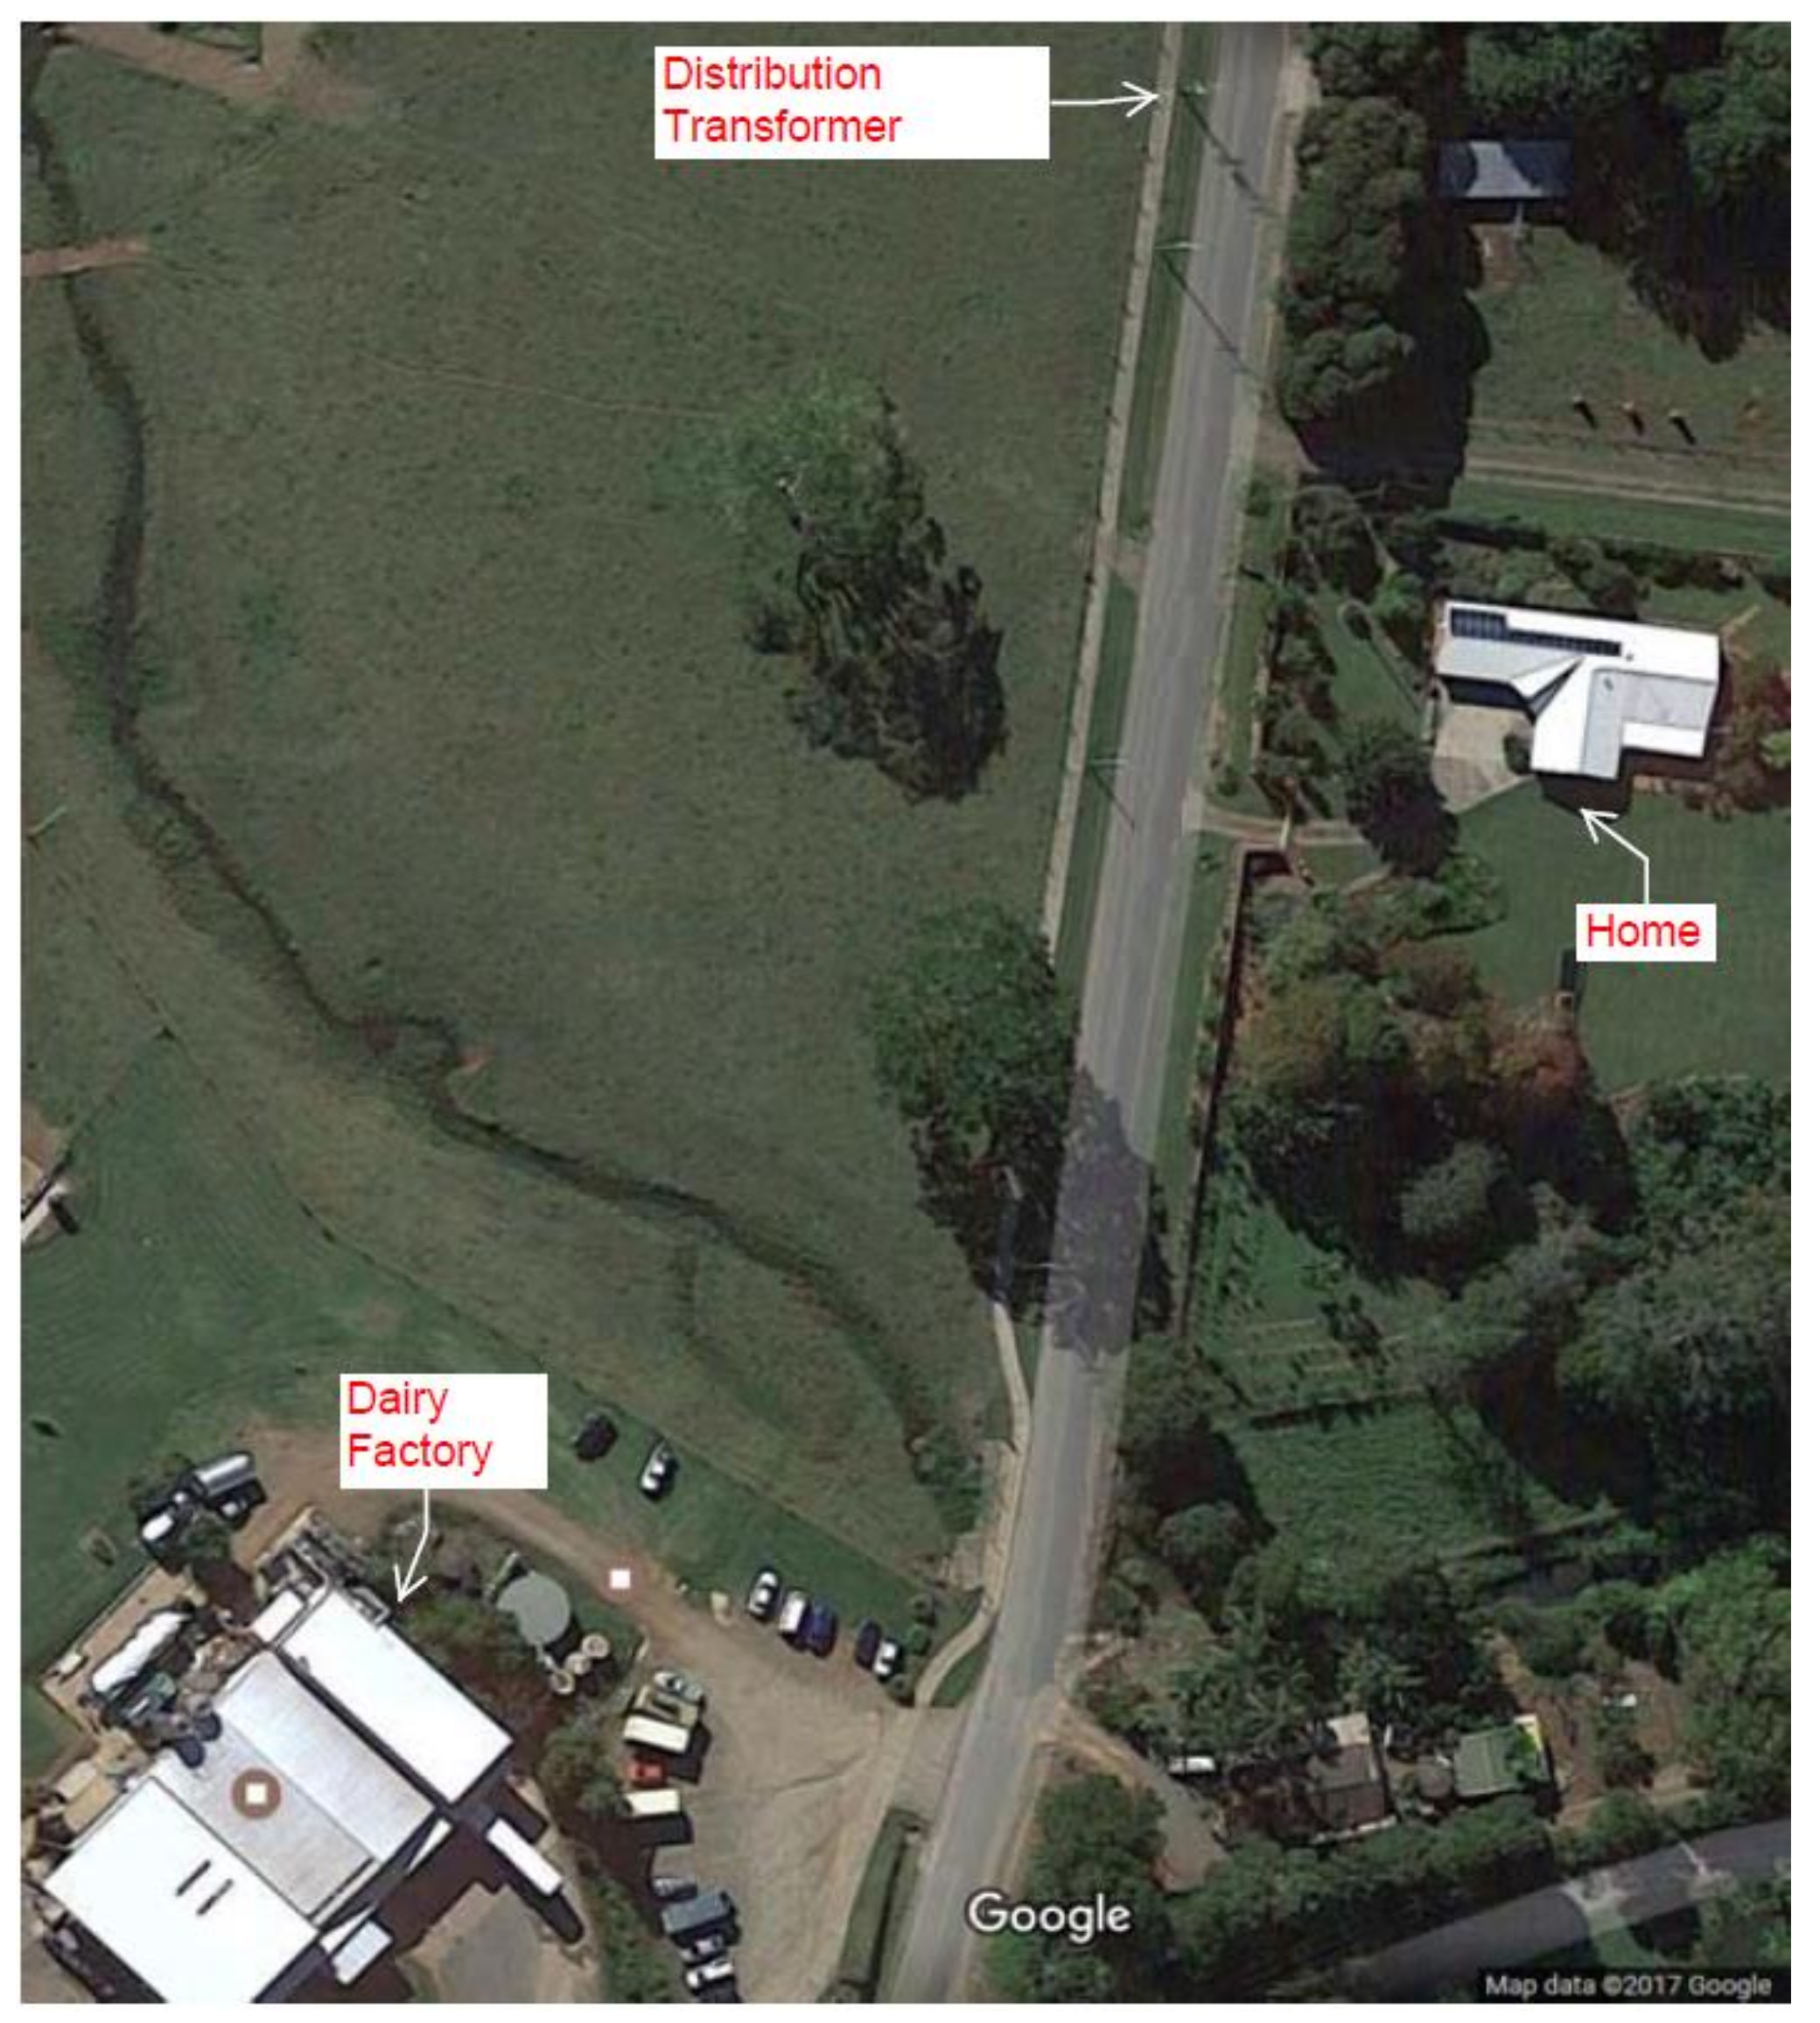
Figure 7.
(a) Carpet graph of solar generation for Queensland case study; (b) Carpet graph of solar generation for South Australian case study.
Figure 7.
(a) Carpet graph of solar generation for Queensland case study; (b) Carpet graph of solar generation for South Australian case study.
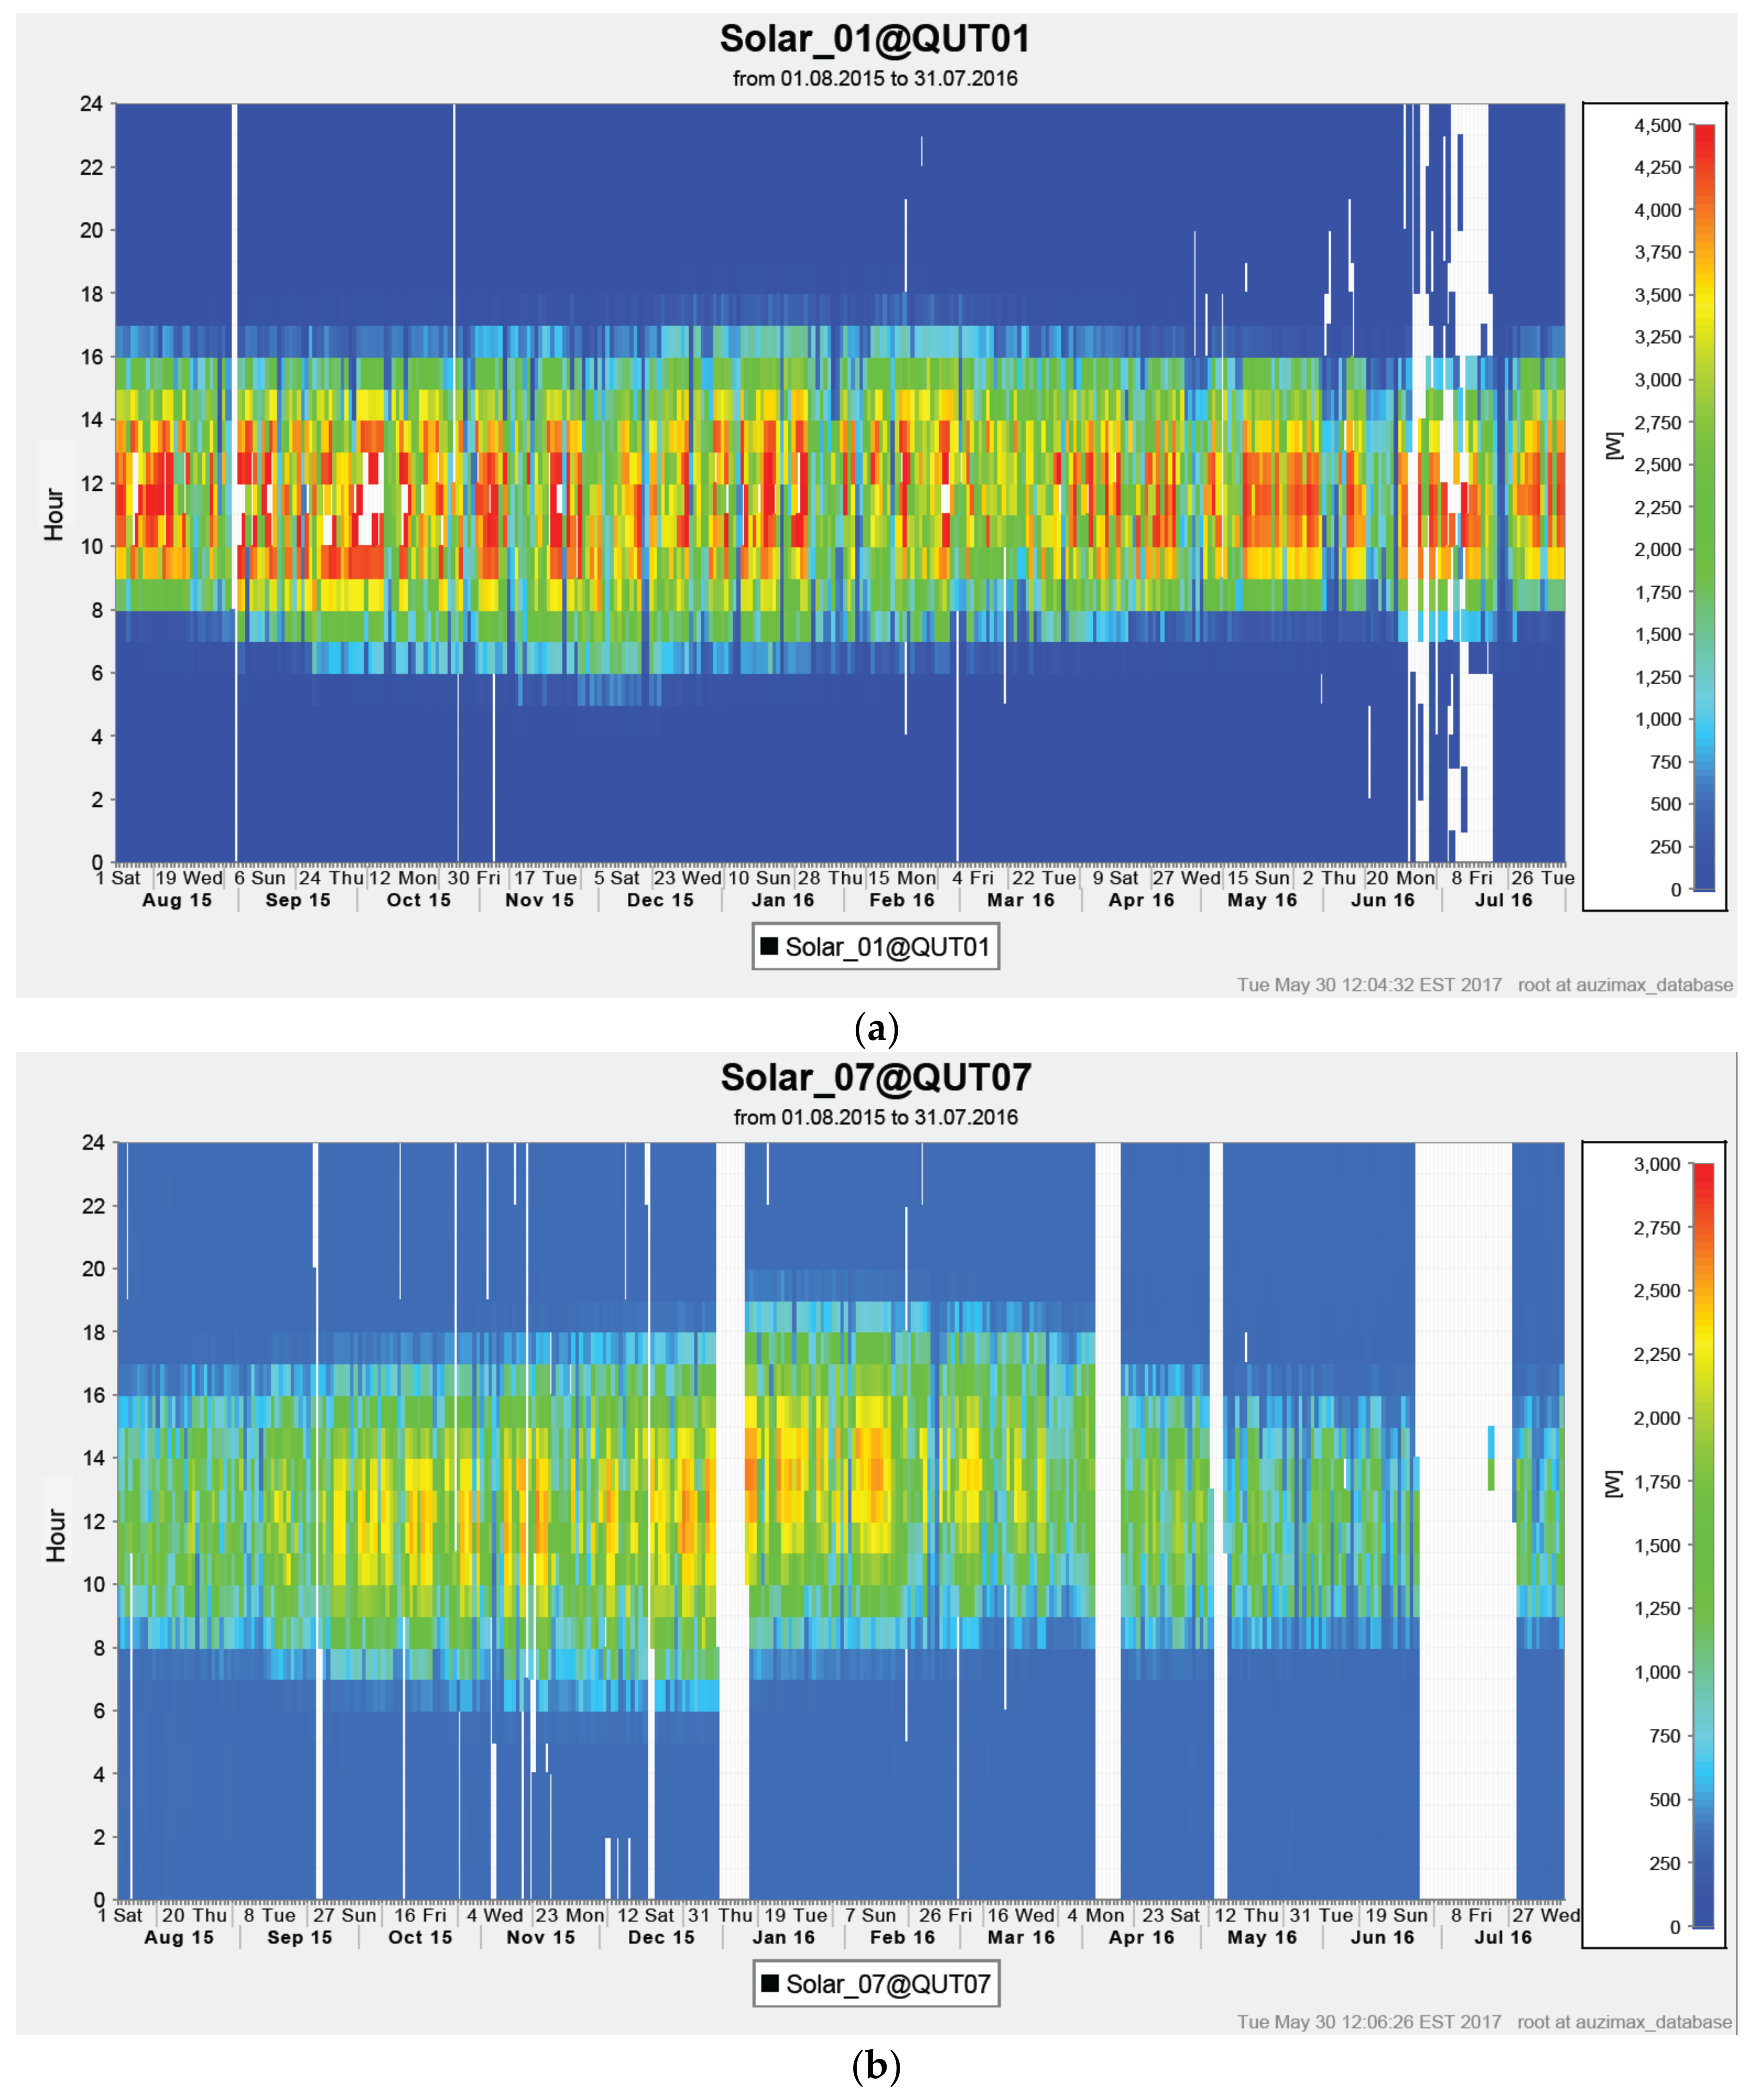
Figure 8.
Energy Consumption South Australian house—Summer 2016.
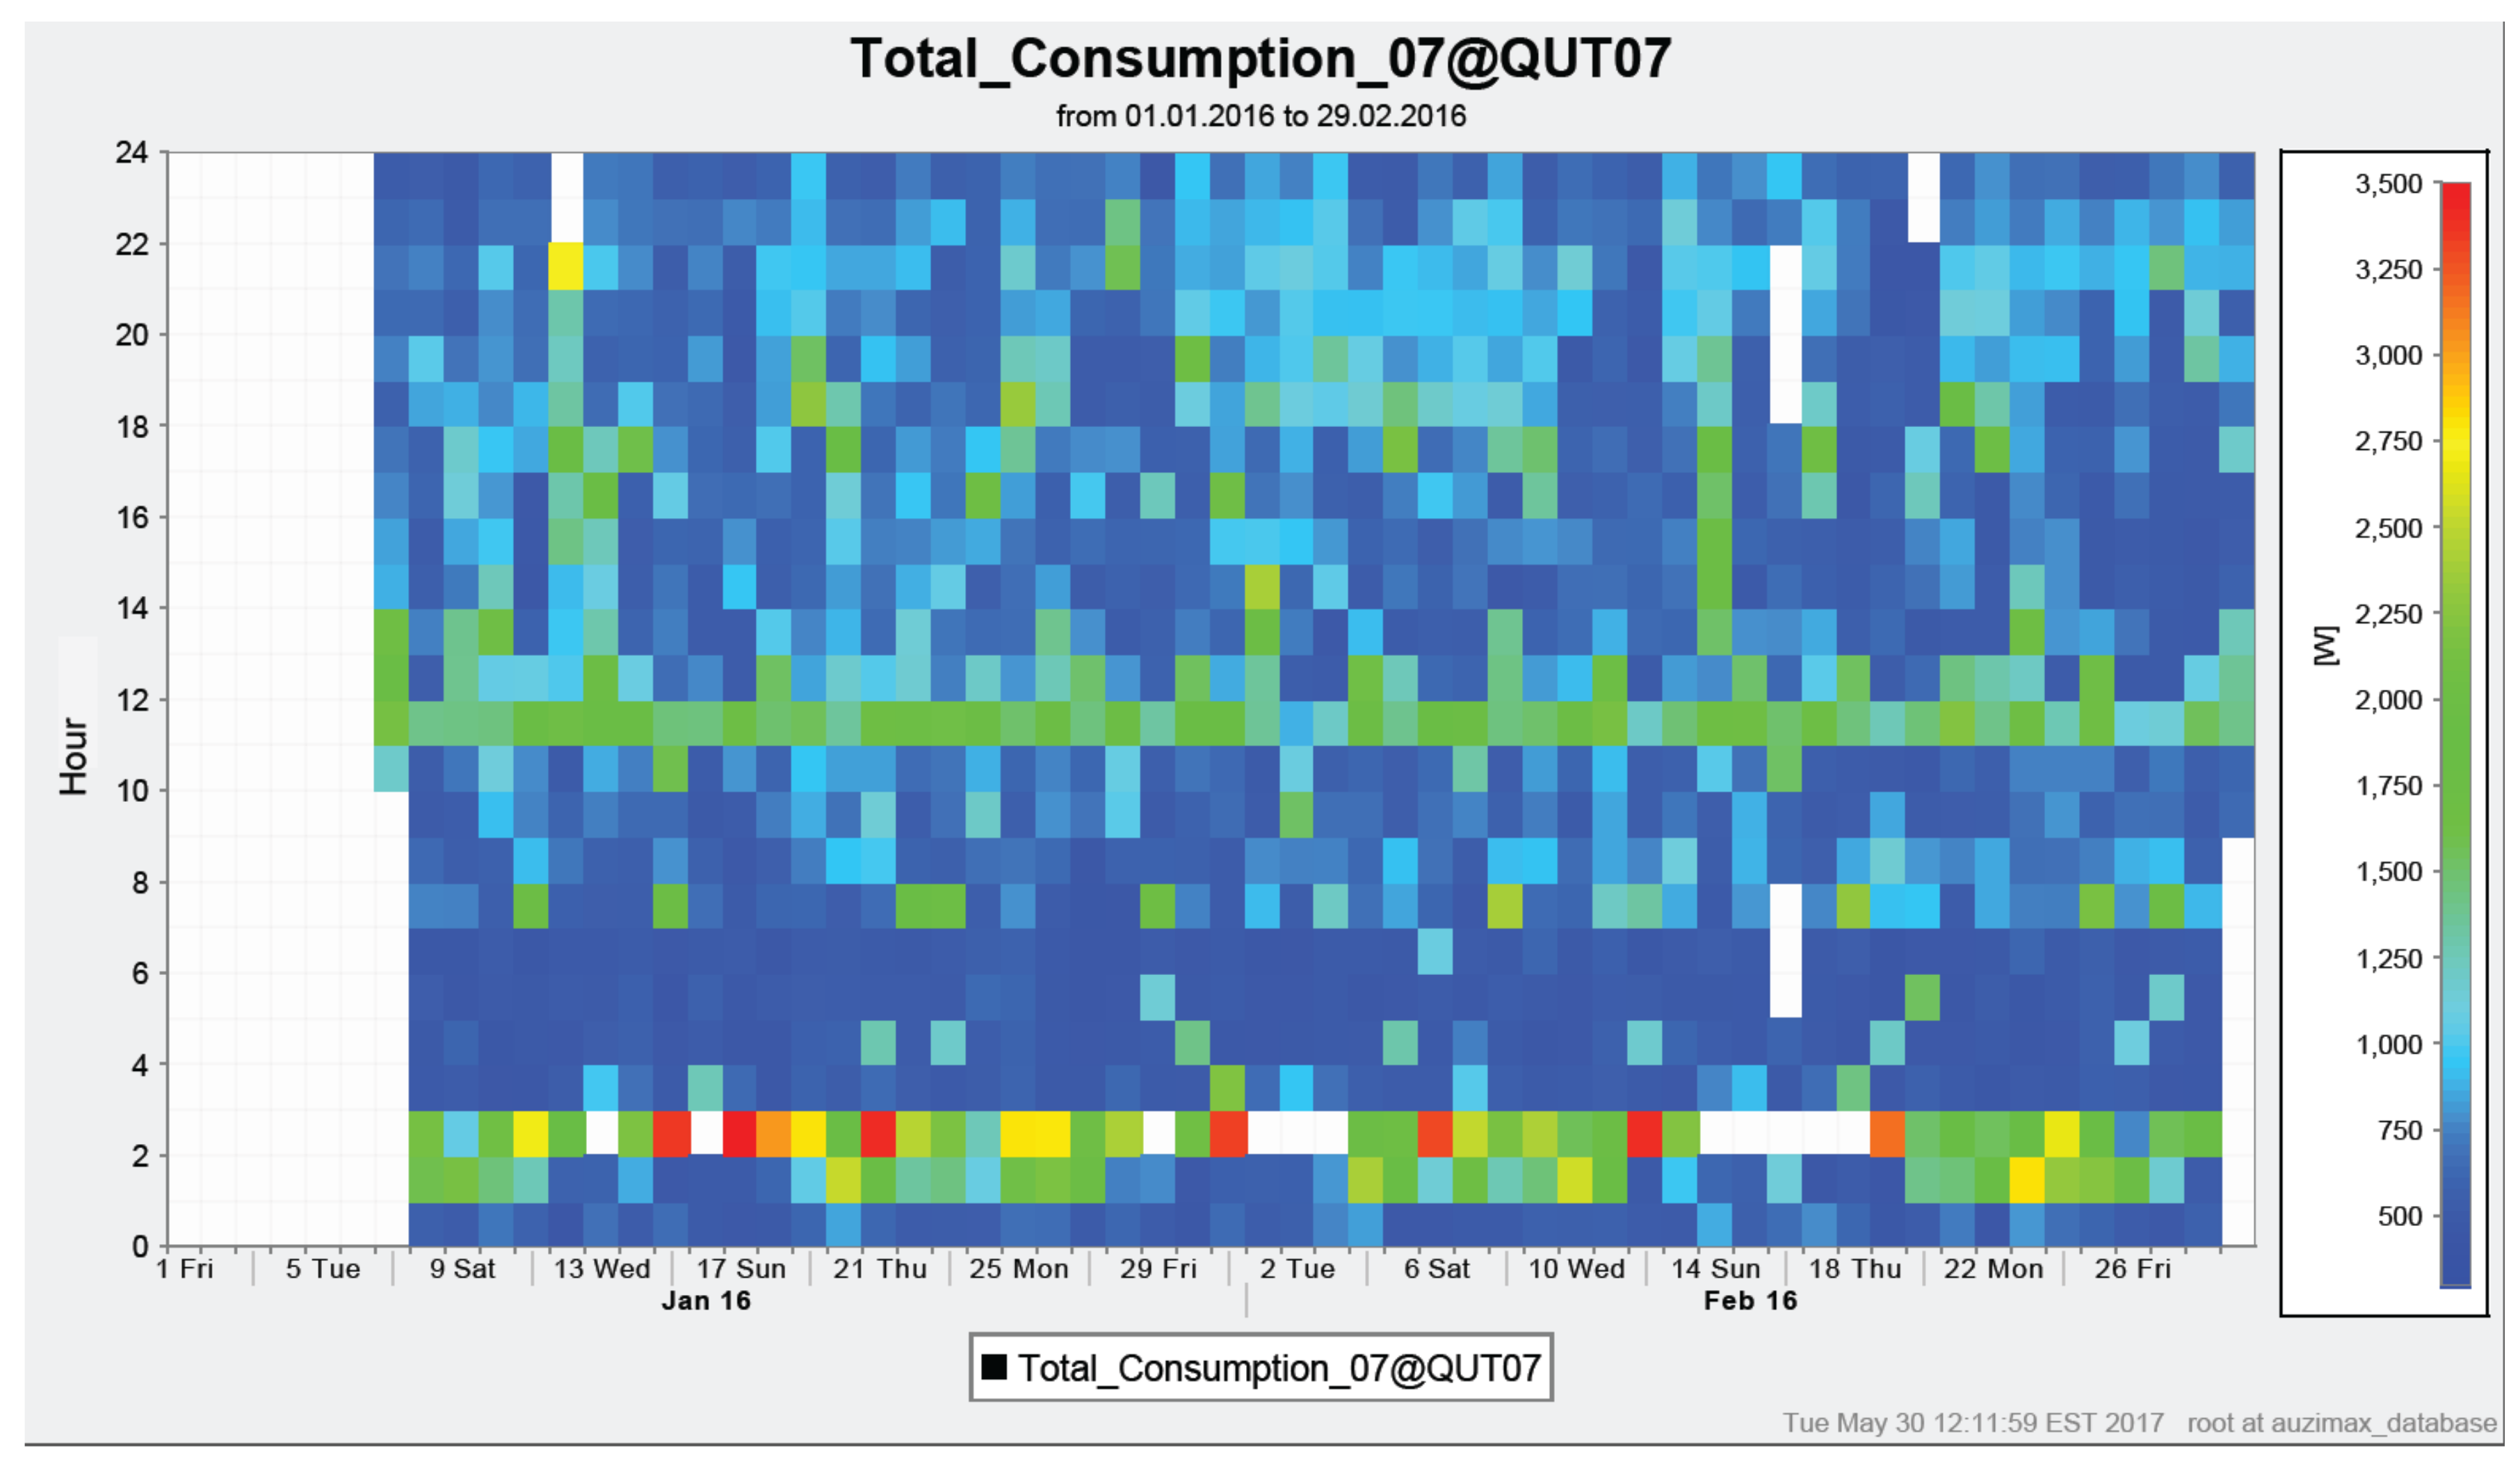
Figure 9.
Carpet graph of hot water service in South Australian house.

Figure 10.
Carpet graph of heat pump hot water service in South Australian house.
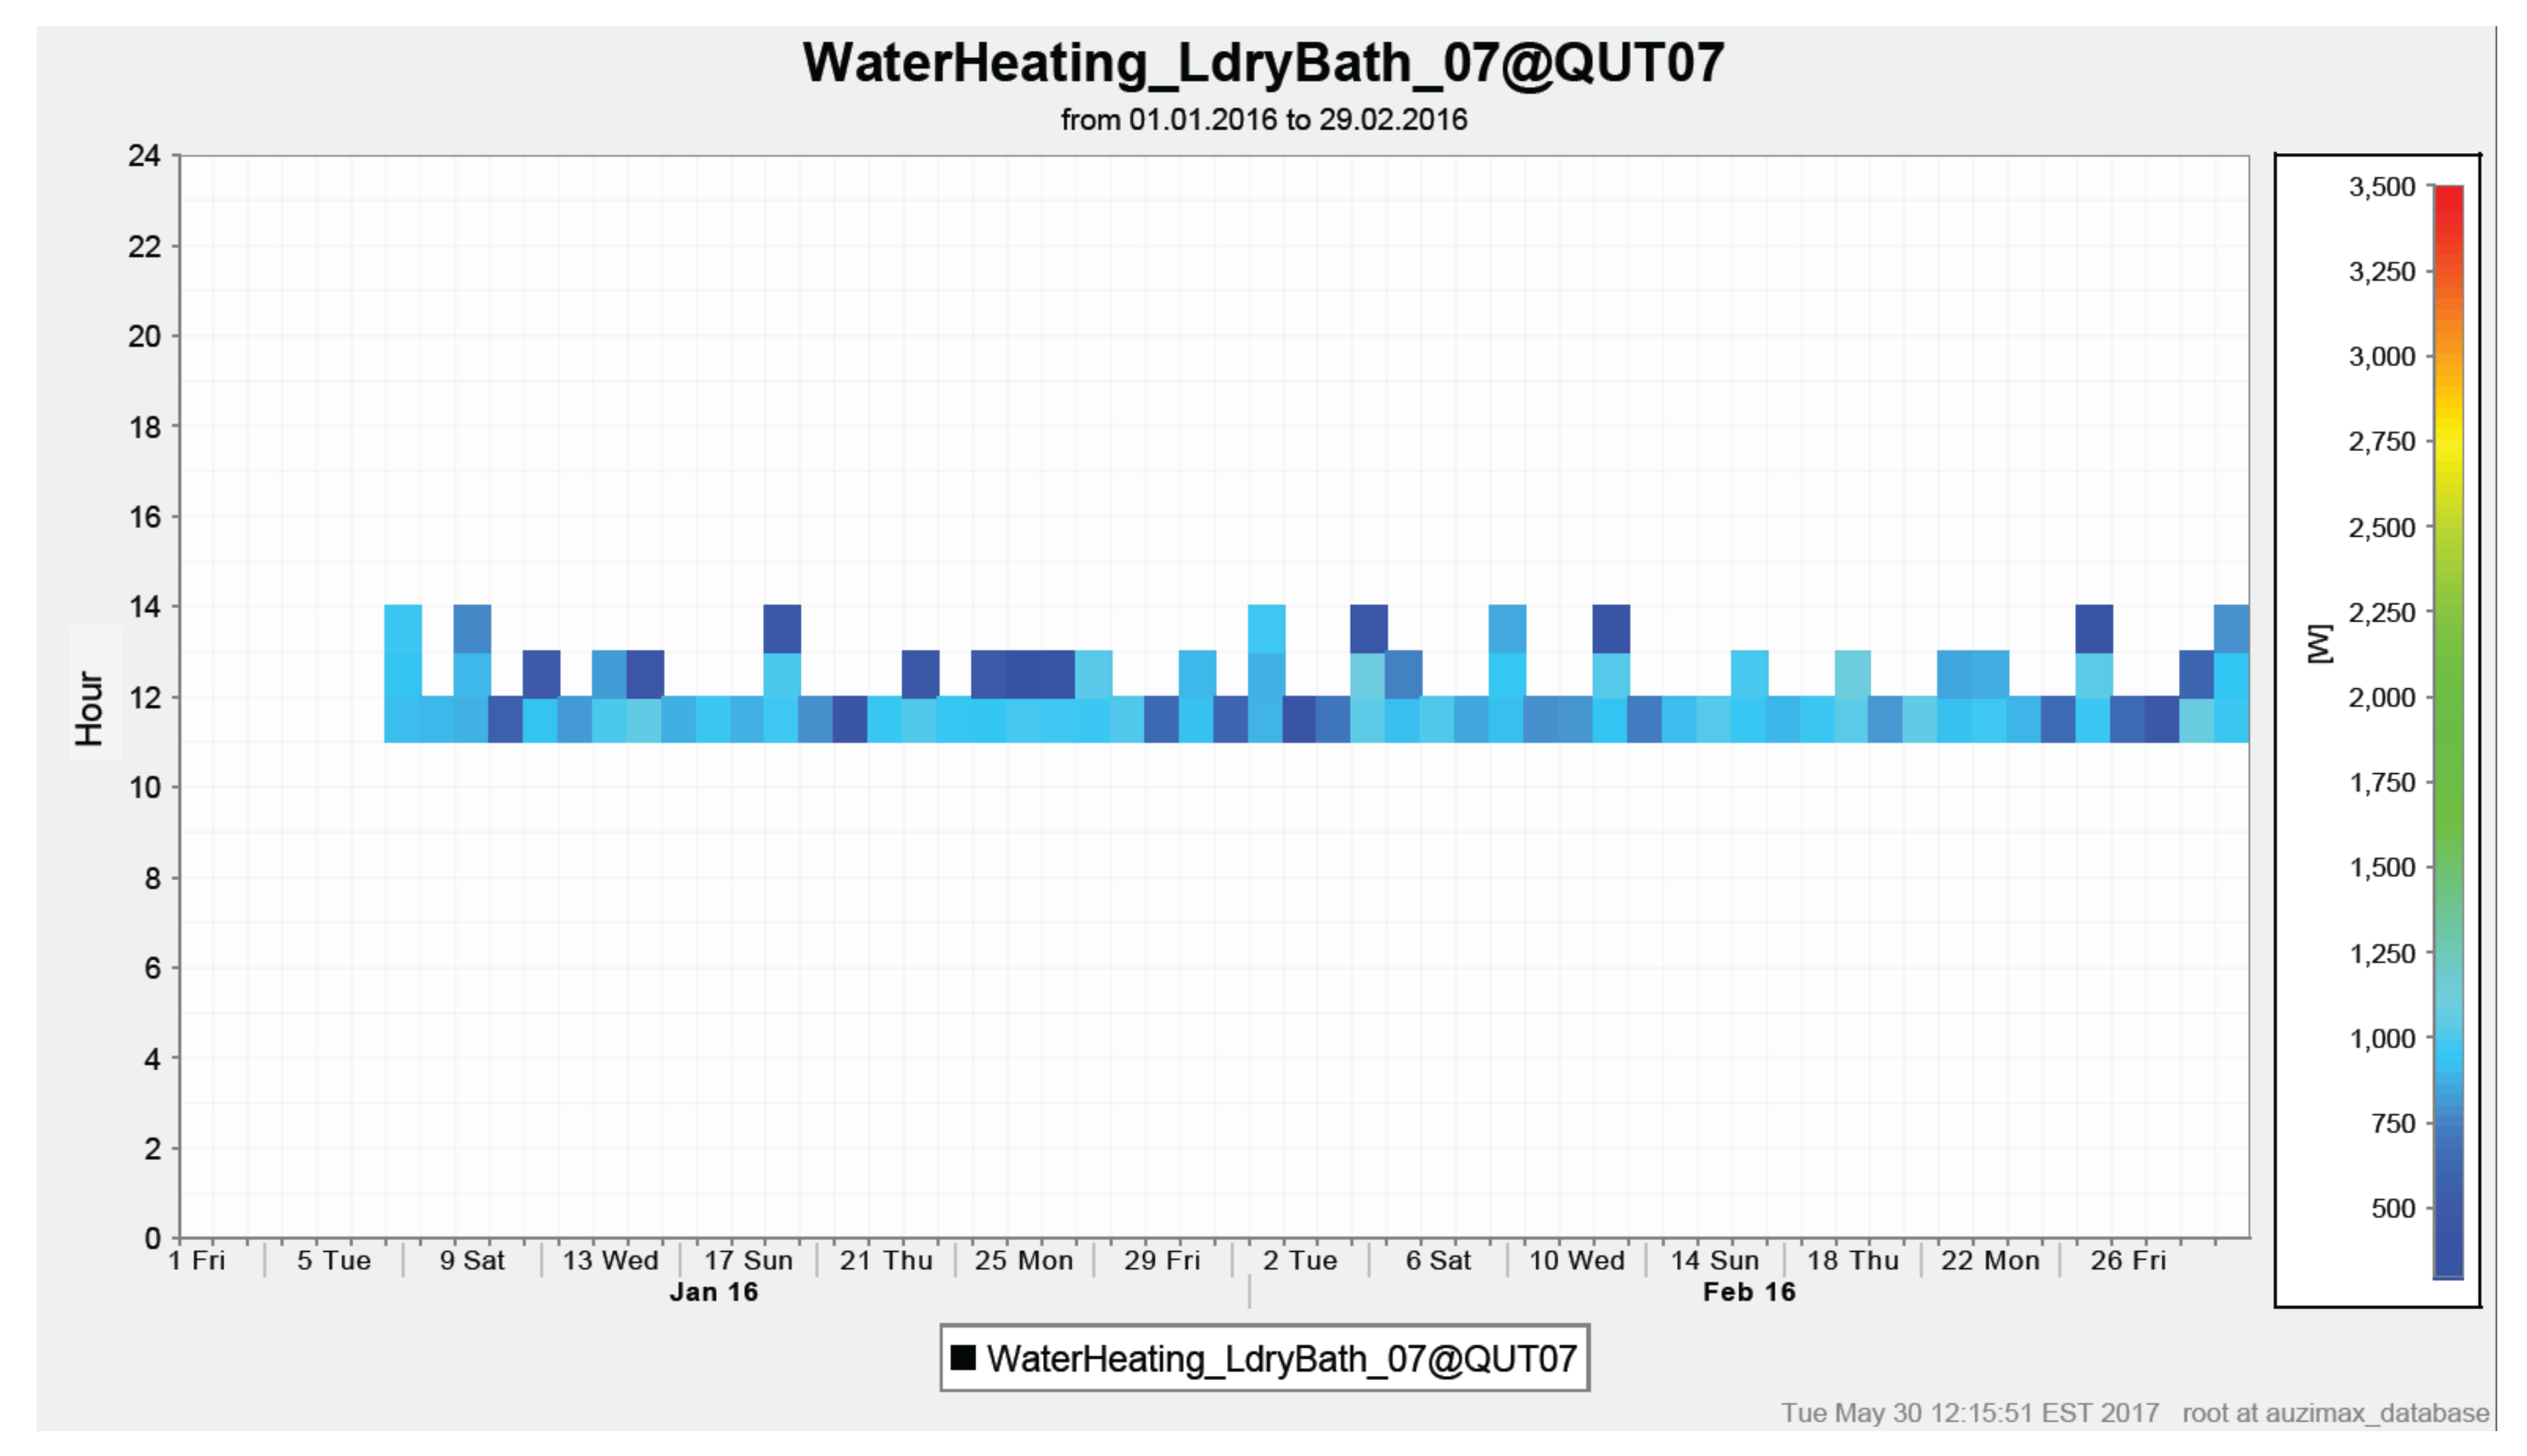
Figure 11.
Representation of energy flows and unbalanced phase distribution on a low-voltage (LV) network.
Figure 11.
Representation of energy flows and unbalanced phase distribution on a low-voltage (LV) network.


Table 1.
Frequency Standards.
| Region/Country | Frequency under ‘Normal’ Operating Conditions | |
|---|---|---|
| Lower (Hz) | Upper (Hz) | |
| Australia [37] | 49.85 | 50.15 |
| Germany (EN50160) [38] | 49.5 | 50.5 |
| United Kingdom [39] | 49.5 | 50.5 |
| New Zealand [40] | 49.8 | 50.2 |
| South Africa [41] | 49.5 | 50.5 |
| United States (60 Hz) | Differing tolerances up to ±0.08 depending on the network | |
Table 2.
Comparison of declared supply voltage standards.
| Country/Region | Allowable Voltage at Customer’s Point of Supply | Voltage Range | Standard/Regulation/Reference |
|---|---|---|---|
| Germany | 230 V ±10% | 207–253 V | DIN EN50160 [42] |
| United Kingdom | 230 V +10%, −6% | 216.2–253 V | BS7671 [43] |
| USA | 120 V ±5% | ANSI Standard C84-1 (2016) [44] | |
| New Zealand | 230 V ±6% | Electrical (Safety) Regulations 2010 (NZ) | |
| Australian Standards | |||
| Pre-2000 | 240 V | AS 2926 (Pre-2000) | |
| 2000+ | 230 V +10%, −6% | 207–253 V | AS 60038-2012 Standard Voltages 1 |
| Australian DNSPs (Victoria, New South Wales, Tasmania, Northern Territory) | 230 V +10%, −6% (nominal) | 216.2–253 V | AS 60038-2012 and |
| 230 V +6.1% −2.2% (pref.) 2 | 225.4–243.8 V | AS 61000.3.100: Limits—Steady state voltage limits in public electricity systems (2011) | |
| Australian DNSPs 3 (Queensland, Western Australia, Australian Capital Territory) | 240 V ±6% | Electricity Regulation 2006 (QLD); WA Connections Manual and Technical Code; ACTEWAGL Service and Installation Rules. |
1 This standard was published in 2000 to bring Australia in line with moves by the International Electrotechnical Committee (IEC) for a consistent 230 V international standard. This standard has not yet been adopted by each state’s DNSPs. The Standard also applies to the point of supply but with the additional 5% voltage drop within customer premises, the actual voltage range at point of use (PoU) is 230 V +10%, −11%. Inconsistencies exist between the voltage supply standards, equipment voltage standards and wiring rules. 2 A tighter voltage variation (i.e., the preferred range) helps to minimize network losses and helps manufacturers optimize the performance of their devices to meet Mandatory Energy Performance Standards test requirements. 3 DNSPs in these states have not yet adapted the 230 V Australian Standard.
Table 3.
Power factor and penalty tariff requirements of relevant Australian states/Distribution Network Service Providers (DNSPs) in 2009 [46].
Table 3.
Power factor and penalty tariff requirements of relevant Australian states/Distribution Network Service Providers (DNSPs) in 2009 [46].
| State | Limits | Measuring Method | Requirement Imposed by | Penalty Tariff Structure (Non-Residential) |
|---|---|---|---|---|
| Victoria | 0.75 lagging to 0.8 leading but depends on voltage and demand | Not specified | Electricity Distribution Code | Fixed of Peak kW demand |
| Queensland | >0.8 to unity 0 not leading unless entity agrees | Over any 30 min | Electricity Regulation 2006 | kW capacity and actual demand charge |
| Western Australia | 0.8 lagging to 0.8 leading or per connection agreement | At period of daily peak demand | WA Electrical Requirements and distributor codes and rules | Western Power—Peak kVA demand |
| South Australia | 0.8 lagging to 0.8 leading but depends on voltage and demand | At monthly maximum demand | ETSA Utilities Service & Installation Rules | Peak kVA demand. Some old customers on kW demand |
| Nationally | 0.9 lagging to 0.9 leading but depends on voltage | Not specified | National Electricity Rules | N/A |
Table 4.
Case study climate, occupancy and energy characteristics.
| State | Queensland | Western Australia | Victoria | South Australia |
|---|---|---|---|---|
| Latitude | 26.8° S | 31.92° S | 37.2° S | 37.75° S |
| Longitude | 152.8° E | 115.87° E | 145.05° E | 140.77° E |
| Climate | Subtropical | Warm Temperate | Cool Temperate | Cool Temperate |
| Summer Tmean Max °C | 26.5 | 30.7 | 23.9 | 24.5 |
| Summer Tmean Min °C | 18.0 | 17.6 | 11.8 | 11.0 |
| Winter Tmean Max °C | 20.2 | 19.0 | 9.8 | 13.7 |
| Winter Tmean Min °C | 9.7 | 8.2 | 4.4 | 5.5 |
| Context | Semi-urban | Suburban | Rural | Suburban |
| Property Type | Detached single family home | Detached single family home | Detached single family home | Detached single family home |
| Floor Area | 221.1 m2 | 275 m2 | 246.3 m2 | 278 m2 |
| Occupants | 2 Adults & 2 Children | 2 Adults & 2 Children ** | 2 Adults | 2 Adults & 3 Children |
| Nominal Voltage | 240 V | 240 V | 230 V | 230 V |
| Hot Water | Electric | Natural Gas | Solar/Electric boost | Heat Pump & Electric |
| Space Heating | Wood heater | Nil | Wood heater | Hydronic Floor heating |
| Space Cooling | Ceiling Fans | Nil | Nil | Nil |
| PV System Size/Inverter type | 6 kWp String inverter | Nil | 3.6 kWp String inverter | 3 kWp (Microinverters) |
| Grid connection | Single Phase | 3 phase | 3 phase | Single phase |
| Distance from LVDN Transformer | 150~200 m | unknown | >50 m | 65 m |
| DNSP | Energex | Western Power | AusNet. | SA Power Networks |
** Only occupied from March 2016.
Table 5.
Characteristics of four additional case studies.
| Q15 | Q16 | Q17 | Q18 | |
|---|---|---|---|---|
| Climate | Subtropical | Subtropical | Subtropical | Subtropical |
| Urban Context | Suburban | Suburban | Suburban | Suburban Fringe |
| Building type | Detached house (Constructed 1974) | Detached house (Constructed 2016) | Residential community (110 apartments constructed circa 2006) | Residential Community Common Facilities (constructed circa 2010) |
| Occupants | 2 adults, 3 children | 2 adults | Senior Adults (80+ year) | NA |
| PV system size/Inverter type | 1.6 kWp String inverter | 3 kWp String inverter | 110 × 1 kWp with String inverter | 5 kWp String inverter |
| Grid connection | Single phase (since 2000) | Single phase (since 2016) | Three phase—microgrid (since 2012); 2 points of connection to network | Three phase (since 2013) |
| DNSP | Energex | Energex | Energex | Energex |
| Data collection type | Household records | Household records | Community Records, kWh meters | Community records |
Table 6.
Supply voltage statistics for 12 months for case studies.
| Queensland | Victoria | Western Australia | South Australia | |
|---|---|---|---|---|
| Mean voltage V | 249.7038 | 240.6472 | 247.5672 | 248.7791 |
| Standard deviation | 7.767765 | 5.460625 | 15.89345 | 8.25179 |
| Q1 | 248.3 | 239.4 | 246.9 | 247.6 |
| Q2 | 249.8 | 240.8 | 249 | 249 |
| Q3 | 251.4 | 242.2 | 250.5 | 250.6 |
| Max. V | 258.6 | 253.6 | 257.2 | 258.8 |
Table 7.
Power quality analysis for Queensland and Western Australia case studies per month over 1 year (regions with 240 V standard).
Table 7.
Power quality analysis for Queensland and Western Australia case studies per month over 1 year (regions with 240 V standard).
| Case Study | Queensland | |||||||||||
|---|---|---|---|---|---|---|---|---|---|---|---|---|
| Month → Power quality ↓ | 15 Apr. | 15 May. | 15 Jun. | 15 Jul. | 15 Aug. | 15 Sep. | 15 Oct. | 15 Nov. | 15 Dec. | 16 Jan. | 16 Feb. | 16 Mar. |
| Mean Frequency Difference (50 Hz) | 0.01 | 1.28 | 0.009 | 0.006 | 0.003 | 0.01 | 0.007 | 0.01 | 0.006 | 0.007 | 0.002 | 0.007 |
| % Time within Frequency Standard (49.85–50.15 Hz) | 99.9 | 99.9 | 99.9 | 99.9 | 99.9 | 99.9 | 99.9 | 99.9 | 99.9 | 99.9 | 99.9 | 99.9 |
| Mean Voltage Difference (St. 240 V) | 10.3 | 3.75 | 9.23 | 9.89 | 10.22 | 9.61 | 9.94 | 10.08 | 9.56 | 9.87 | 9.89 | 9.82 |
| % Time within Standard (240 V +−6%) | 94.3 | 89.9 | 99.03 | 96.21 | 92.65 | 95.97 | 95.9 | 93.17 | 97.28 | 95.07 | 97.76 | 96.2 |
| Mean Power Factor Difference (Deviation below unity pf 1) | 0.18 | 0.2 | 0.16 | 0.202 | 0.21 | 0.11 | 0.175 | 0.066 | 0.098 | 0.22 | 0.122 | 0.14 |
| Case Study | Western Australia | |||||||||||
| Month → Power quality ↓ | 15 Jul. | 15 Aug. | 15 Sep. | 15 Oct. | 15 Nov. | 15 Dec. | 16 Jan. | 16 Feb. | 16 Mar. | 16 Apr. | 16 May. | 16 Jun. |
| Mean Frequency Difference (50 Hz) | NA | 0.006 | 0.005 | 0.01 | 0.015 | 0.004 | 0.014 | NA | NA | 0.36 | 0.31 | 0.19 |
| % Time within Frequency Standard (49.8–50.2 Hz) | NA | 99.9 | 99.9 | 99.9 | 99.9 | 99.9 | 99.9 | NA | NA | 99.9 | 99.9 | 99.9 |
| Mean Voltage Difference (St. 240 V) | NA | 7.68 | 9.28 | 9.2 | 9.02 | 7.19 | 5.47 | NA | NA | 8.48 | 8.44 | 6.39 |
| % Time within Standard (240 V +−6%) | NA | 99.9 | 99.5 | 99.9 | 99.9 | 99.9 | 99.9 | NA | NA | 99.8 | 99.9 | 99.9 |
| Mean Power Factor Difference (Deviation below unity pf 1) | NA | 0.48 | 0.61 | 0.6 | 0.6 | 0.59 | 0.53 | NA | NA | 0.36 | 0.31 | 0.19 |
NA = Not Available.
Table 8.
Power quality analysis for Victoria and South Australia case studies per month over 1 year (regions with 230 V standard).
Table 8.
Power quality analysis for Victoria and South Australia case studies per month over 1 year (regions with 230 V standard).
| Case Study | Victoria | |||||||||||
|---|---|---|---|---|---|---|---|---|---|---|---|---|
| Month → Power quality ↓ | 15 Jul. | 15 Aug. | 15 Sep. | 15 Oct. | 15 Nov. | 15 Dec. | 16 Jan. | 16 Feb. | 16 Mar. | 16 Apr. | 16 May. | 16 Jun. |
| Mean Frequency Difference (50 Hz) | 0.014 | 0.011 | 0.01 | 0.008 | 0.0004 | 0.002 | 0.004 | 0.009 | 0.006 | 0.007 | 0.007 | 0.006 |
| % Time within Frequency Standard (49.85–50.15 Hz) | 99.9 | 99.9 | 99.9 | 99.9 | 99.9 | 99.9 | 99.9 | 99.9 | 99.9 | 99.9 | 99.8 | 99.8 |
| Mean Voltage Difference (St. 230 V) | 6.06 | 16.6 | 10.26 | 10.89 | 11.46 | 11.63 | 12.29 | 8.17 | 11.14 | 10.89 | 10.35 | 9.63 |
| % Time within Standard (230 V +10%, −6%) | 100 | 99.9 | 100 | 100 | 100 | 100 | 100 | 97.3 | 100 | 100 | 100 | 100 |
| Mean Power Factor Difference (Deviation below unit pf 1) | 0.14 | 0.13 | 0.74 | 0.41 | 0.38 | 0.34 | 0.18 | 0.23 | 0.18 | 0.22 | 0.17 | 0.18 |
| Case Study | South Australia | |||||||||||
| Month → Power quality ↓ | 15 Jul. | 15 Aug. | 15 Sep. | 15 Oct. | 15 Nov. | 15 Dec. | 16 Jan. | 16 Feb. | 16 Mar. | 16 Apr. | 16 May. | 16 Jun. |
| Mean Frequency Difference (50 Hz) | NA | 0.045 | 0.008 | 0.008 | 0.01 | 0.007 | 0.007 | 0.003 | 0.007 | 0.009 | 0.013 | 0.008 |
| % Time within Frequency Standard (49.85–50.15 Hz) | NA | 99.8 | 99.9 | 99.8 | 99.9 | 99.9 | 99.9 | 99.9 | 99.9 | 99.9 | 99.2 | 99.3 |
| Mean Voltage Difference (St. 230 V) | NA | 16.4 | 17.24 | 18.13 | 18.33 | 18.56 | 21.67 | 21.67 | 20.58 | 19.4 | 15.5 | 15.36 |
| % Time within Standard (230 V +10%, −6%) | NA | 99.9 | 99.1 | 99.9 | 99.9 | 99.9 | 70.9 | 78.3 | 93.3 | 99.9 | 98.7 | 98.7 |
| Mean Power Factor Difference (Deviation below unity pf 1) | NA | 0.19 | 0.2 | 0.17 | 0.18 | 0.17 | 0.19 | 0.2 | 0.19 | 0.21 | 0.25 | 0.24 |
NA = Not Available.
Table 9.
Additional power quality issues raised by rooftop photovoltaic (PV) customers.
| Case Study | Issues Encountered with DNSP |
|---|---|
| Q15 (end-user records) | This household was one of the first grid-connected PV households in Queensland (in 2000). The DNSP required the household to sign a comprehensive network agreement stipulating the conditions under which the PV system needed to operate in order to not impact on the safety and security of the network. There were no reciprocal clauses. Over the first few years of operation the PV system inverter kept tripping out, for no known reason. After much investigation initiated by the owner, it was found that control signals sent by the DNSP down the wires for controlling hot water systems were inadvertently turning off the inverter. This was resolved by the DNSP connecting the house supply to a different phase on the transformer. Previously no consideration was given by the DNSP regarding what phase a solar household should be connected to in order to avoid such a network issue or to assist the network in balancing local loads/distributed generation. |
| Q16 (end-user verbal report validated against DNSP rules) | This household has a newly constructed house (2016) with a 5 kWp PV and 5 kW string inverter. In a response to the DNSP’s concerns about network voltage fluctuations, new local regulations required the PV installer to limit the output capacity of the inverter 4.5 kW. Whilst this may have benefit for the network, it also had a consequence of limiting the PV production onsite, reducing the capacity of the household for self-consumption. This issue was raised with the DNSP by various customers and the local ‘rule’ has been rescinded. Grid export is limited to 5 kW. |
| Q17 (measured data/network analysis) | This 3-phase residential community network has two points of connection to the local DNSP and has 110 x 1 kWp rooftop PV systems, each with its own small unity-power factor inverter. Neither loads nor PV generation units were evenly distributed across all three phases of the community network, resulting in overvoltage issues. These issues led to the DNSP requiring a large number of PV inverters to be switched off, so the overvoltage issue would not affect its network. Phase balancing in private networks (e.g., at a building or community level) is also important yet seems little understood by electrical engineers/contractors who design and install such systems. |
| Q18 (end-user verbal report validated by engineering report) | A community recreation centre (hall, swimming pool, small gym, library etc.) installed a 5 kWp PV system to provide carbon neutral power to its facilities. The energy loads (e.g., swimming pool pumps and filtration, lighting, refrigeration, communications equipment) were not evenly distributed across the three phases. The PV system was connected to a single phase only. Again, this is an electrical engineer/contractor issue. The importance of phase balancing—for local loads and generation—does not seem to be widely understood. |
Table 10.
Opportunities for DNSP involvement.
| DNSPs Are Active in... | DNSPs Could Be Active in... |
|---|---|
| Influencing regulation of residential rooftop PV systems | Influencing regulation of some customer loads (e.g., air conditioning) that have become a major concern for peak demand management (DNSPs provide incentives for managing these loads but are not actively involved in regulations regarding these loads) |
| Planning to implement demand charges (kVAR) at a residential level | Lobbying/regulating power factor standards for residential equipment (Australia has minimum energy performance standards for many appliances, yet power factor is not a factor in these standards.) |
| Limiting the size of PV permitted at a household level (network connected) | Actively promoting balancing of household load with PV size or balancing at a neighbourhood level |
| Promoting energy efficient heating and cooling appliances | Actively lobbying for better building regulations (higher energy efficiency standards to reduce space heating and cooling demand) |
| Measuring power quality at a substation level | Measuring and reporting power quality at the point of customer connection |
© 2018 by the authors. Licensee MDPI, Basel, Switzerland. This article is an open access article distributed under the terms and conditions of the Creative Commons Attribution (CC BY) license (http://creativecommons.org/licenses/by/4.0/).
Share and Cite
MDPI and ACS Style
Miller, W.; Liu, A.; Amin, Z.; Wagner, A. Power Quality and Rooftop-Photovoltaic Households: An Examination of Measured Data at Point of Customer Connection. Sustainability 2018, 10, 1224. https://doi.org/10.3390/su10041224
AMA Style
Miller W, Liu A, Amin Z, Wagner A. Power Quality and Rooftop-Photovoltaic Households: An Examination of Measured Data at Point of Customer Connection. Sustainability. 2018; 10(4):1224. https://doi.org/10.3390/su10041224
Chicago/Turabian StyleMiller, Wendy, Aaron Liu, Zakaria Amin, and Andreas Wagner. 2018. "Power Quality and Rooftop-Photovoltaic Households: An Examination of Measured Data at Point of Customer Connection" Sustainability 10, no. 4: 1224. https://doi.org/10.3390/su10041224
Note that from the first issue of 2016, this journal uses article numbers instead of page numbers. See further details here.