1. Introduction
Environmental concerns, especially regarding urban microclimate, have become increasingly important, and there is no doubt that there is an international effort to reduce them. City planning is emerging as one of the paradigms that may be exploited to contribute to the well-being of the urban environment. Additionally, it may contribute to solving problems related to the impact of the urbanization process on urban climate, health, economy, and resource management.
The climate in urban environments is transformed by the urbanization process, with modifications to general properties at different scales. Studying climatic elements allows the identification of requirements that guide the decisions that one must make in the initial phase of project elaboration at the urban and building scales.
Despite the development of numerous scientific studies on urban climatology, the city planning process does not fully utilize the knowledge generated by such research efforts. This gap is due to modeling complexity, differences in scale, training of architects and urban planners, and to lack of communication among researchers and planning administrators [
1,
2,
3,
4].
Urban planning is a political activity not always related to scientific knowledge. By simply improving institutional capacity, some of the errors in this process may be minimized [
1,
2,
3,
4].
Studies related to urban climate were initiated in [
1,
2,
3,
4,
5,
6,
7,
8,
9,
10]. The initial applications of research on this theme were performed in Germany in the 1960s and 1970s [
10]. In the following decade, [
11,
12] performed studies emphasizing population growth and the increase in urban density with emphasis on the impact on air and climate quality in the city of Ruhr. The results were presented with climatic analysis maps, as well as climatic directives for urban planning.
After the publication of the book on climatic directives for urban planning by the German Ministry of Baden [
13], the relevance of this study became evident, providing climatic directives for zoning and planning. Also, we may cite “Stuttgart21” [
14], “Berlin Digital Environmental Atlas” [
15] and “Climatic orientations for urban planning” in Portugal [
16] as good examples of research.
In Lisbon, the studies on urban climate were carried out in the last decades by [
11,
16,
17,
18,
19,
20,
21]. In 2009, the authors elaborated a study informing urban planners about the benefits of using climatic information, presenting the results with maps.
The urban planning process in most Brazilian cities does not yet include climatology. The inclusion is little explored due to the lack of qualified teams to understand the concepts related to urban climate. Furthermore, the absence of technical instruments capable of relating the many variables that guide this problem, given city growth, is evident. It is necessary to develop simple tools that solve this problem, associated with specialized training for this purpose. Still, planners need to be made aware of this need.
The analysis of urban morphology indices is a new discussion for some Brazilian capitals. It may be used as a tool by urban planners, providing valuable information for elaborating environmental guidelines, as well as contributing to the adaptation to climate change.
The complexity of the above problem is increasing due to the growth of the involved variables. Hence, this study proposes the analysis of urban morphology indices from the specialized literature considered critical for the urban climate (i.e., impervious surface fraction, building density, verticality, height/width ratio, roughness length, and porosity) in order to elaborate a set of urban maps to characterize urban spaces in the city of João Pessoa, Paraíba, in northeastern Brazil.
This analysis will support the insertion of climate guidelines into the planning process, seeking to understand how cities, with their expansion areas and new projects for urban improvements in specific areas, may behave when using a tool that spatializes the urban indices, showing different morphological characteristics.
1.1. Urban Morphology and Climate
Problems related to urban climate may be of heightened intensity and geographical distribution when in denser areas. The authors in [
5] demonstrate that the urbanization process affects climate at all scales. Several studies have shown strategies to minimize the impact of growth and of urban density on climate using urban planning as a tool to control land usage and coverage, as well as reduce the impact of the urbanization process [
6,
7,
8,
16,
22,
23,
24,
25,
26,
27,
28,
29,
30,
31,
32,
33,
34,
35,
36]. The relation between the urbanization process and climate is complex. One may investigate the impact on thermal comfort and air circulation using different strategies present in the urban spaces system, such as in [
37], and in the analysis the urban structure (dimensions of the buildings and spaces among them, street widths and spacing), urban cover (areas built, paved, with vegetation, bare soil, and water), urban fabric (construction and natural materials), and urban metabolism (heat, water, and pollutants due to human activity) [
2].
Urban structure analysis is an important instrument to regulate land usage with applications to climatic territorial planning and may be investigated using urban morphology or the study of space form and geometry. The relationship between urban form and climate has been examined through spatial distribution and the use of morphological indices [
38,
39,
40,
41] with the purpose of assisting the planning process.
1.2. Urban Morphology Indices
Different methods and techniques exist to analyze urban morphological indices, ranging from the use of spatial metrics [
31,
32,
33,
34,
42,
43,
44], as is the case of the present study, to the use of satellite images [
45,
46,
47,
48,
49,
50]. Several indices may be used in such analyses, such as aerodynamic roughness, porosity, building density, verticality, H/W ratio, and impervious surface fraction, helping to minimize the impacts caused by city growth.
The spatial distribution in the GIS environment is a tool that allows the simple visualization of the studied variables. This visualization may be enhanced through the possibility of combining different types of maps to characterize and analyze the city areas.
1.2.1. Impervious Surface Fraction (ISF)
The Master Plan of the city of João Pessoa, approved by Complementary Law no. 03 from 30 December 1992 [
51], regarding the guidelines and instruments for urban management, refers to data such as the impervious surface fraction. The impervious surface fraction of a lot corres ponds to the ratio of the sum of the total constructed area by the total parcel area in the urban network. High ISF indices associated with rising surface heat and solar irradiation promote an increase in the heat storage rate and thermal conductivity, thus yielding changes to the energy balance [
52].
1.2.2. Building Density (BD)
Building density is the ratio between the constructed and the total available surface. This index is a relevant aspect in urban planning for it shows a city’s evolution, given that buildings constructed in different periods greatly vary as to how the land is used [
45]. Additionally, it enables studies that estimate the impact on surface temperatures [
42] and thermal comfort [
53].
1.2.3. Verticality
Verticality denotes the average height of building blocks weighed by the built area in the unit analyzed. Verticality may represent a significant and inverse effect on the availability of natural light in the facades of urban buildings [
39]. The higher the building, the larger the shading on the roads opposite to solar radiation, and the smaller the sky visibility. Verticality yields an increase in the absorption of solar radiation and the multiple reflections among buildings, making it difficult for heat to disperse into the atmosphere, this reflecting on the radiative balance. Regarding wind performance, high buildings act as a barrier to airflow, causing an increase in turbulence and the accumulation of heat and pollutants.
1.2.4. H/W Aspect Ratio
The ratio of building height to road width (H/W) is a simplified model for studying urban geometry [
52]. This ratio may range from zero to higher values. The larger the H/W ratio of the urban area, the denser it is in the considered urban fraction. The model considers the alteration of air temperature from the modification of constructed space, an essential variable for architects, urban planners, climatologists, and geographers studying urban planning.
Urban geometry is one of the factors that most influence the temperature increase in urban environments [
52]. Therefore, it is necessary to study the characterization of urban canyons, which are represented by the H/W ratio.
The H/W ratio is one of the most relevant indices in urban planning since it strongly affects user thermal comfort in open spaces [
41]. Higher H/W ratio values stabilized thermal comfort, especially during daylight saving time, thus benefiting hot weather locations. This index is directly related to the sky view factor (SVF) and is one of the main indices used in urban climatic analyses to estimate and characterize the intensity of the heat island effect [
9].
1.2.5. Roughness Length (Z0)
Several parameters (indicators) may be used to describe aerodynamic roughness from data on surface geometry or texture. Roughness length (Z
0) is the aerodynamic roughness index due to its characteristic of relating the urban geometry to the airflow speed above the boundary layer [
54,
55]. Z
0 corresponds to the height on the ground, where wind speed is zero [
19,
56]. If the wind profile has a logarithmic variation with altitude and Z
d (height of displacement from the ground layer), this means that the roughness modifies wind action.
Oke describes surface roughness as a critical superficial parameter that governs the production of turbulence of the perpendicular flow in urban valleys [
9]. The higher the roughness is, the more significant the intensity of the interference and the influence of friction are. This is a key parameter to study urban atmosphere, offering an opportunity to identify potential ventilation corridors.
Roughness length affects the turbulence magnitude and the amounts of flows above the boundary layer [
57]. Depending on wind direction, the exposed area of building facades may be different and, consequently, roughness will also change. The same building may act as a wind barrier, with more intensity in one direction or another [
44].
The parameters of roughness describe how effective a surface area is in transforming the energy of medium wind, which flows over it, in turbulent motion in the boundary layer above [
58]. The roughness of the obstacles present on the surface is directly related to the height of the lower boundary layer of the urban atmosphere, i.e., the Urban Canopy Layer (UCL). Thus, the speed and capacity of wind flow depend on the roughness present on the surface [
54].
These parameters may be estimated based on the measures of the facades of the buildings exposed to the direction of the dominant wind, acting as a barrier to wind progression with effects on its speed [
59]. Thus, the calculation of the roughness length (Z
0) and dislocation height (Z) depend, initially, on the analysis of the direction of the dominating winds [
44].
Studies in Szeged, Hungary [
54], and São Paulo, Brazil [
44] evidenced the importance of establishing ventilation corridors using the roughness length for space planning, providing critical data for urban planning procedures.
1.2.6. Porosity (Po)
Porosity could be a useful parameter in the urban climatic planning, the Po characterization allows the estimation of the overall effect of the urban fabric volume on the average wind speed and the potential to dissipate heat and pollutants [
54,
55,
60]. The P
0 index correlates the volume of free air present in the lower layer of the urban atmosphere (Urban Canopy Layer—UCL) over the layer of buildings. Hence, it infers in the space destined for air mass displacements to dissipate anthropic heat. This index also characterizes the space destined for the release of heat stored by the surfaces into the atmosphere.
Porosity (Po) evaluation is based on the input parameters of building volumes, total surface area and the height of the UCL which is defined as a constant (100 m, maximum height at the cells by 100 m, maximum area). This constant value is based on the analysis of the buildings’ heights in the entire study area. The principle is that the number of buildings higher than the UCL height should be significantly low throughout the entire area [
54].
Aerodynamic roughness and porosity allow the investigation of significant constraints to the urban environment, evaluating the possibility of ventilation aisles, which may raise relevant considerations for city planning.
2. Materials and Methods
2.1. Study Area
For decades, the city of João Pessoa has shown rapid urban growth and lack of planning. This growth has been occurring without the expansion of the urban network, with poor-quality housing, increased verticalization, and without proper infrastructure, thus causing a significant impact on its natural systems. Hence, the city needs tools that allow planners to easily identify environment features and visualize existing problems to make appropriate decisions regarding urban planning processes.
João Pessoa is in northeastern Brazil, at latitude 07°06’54’’ S, longitude 34°51’47” W, and with an altitude of 47 m above sea level. The city extension is of 211,475 km
2, with 801,718 inhabitants, yielding a demographic density of 3421.28 people per square kilometer [
61] (
Figure 1).
João Pessoa has a hot and humid tropical climate, presenting a dry summer season with small daily differences in temperature and relative humidity, which may lead to moments of discomfort according to the Köppen-Geiger [
62] classification, where letter A demarks humid tropics.
From 1981 to 2011, the average annual air temperature in João Pessoa was 26.73 °C, with an average maximum of 29.75 °C and an annual minimum of 23.60 °C [
63]. Because it is a coastal city, it presents high relative air humidity values, with an average of 76.07% in the period. The average wind speed registered by meteorological stations from 1981 to 2011 was 3.27 m/s, with an average maximum of 5.79 m/s. The wind regime is predominantly daily, and predominantly in the southeast (SE) direction throughout the year [
63].
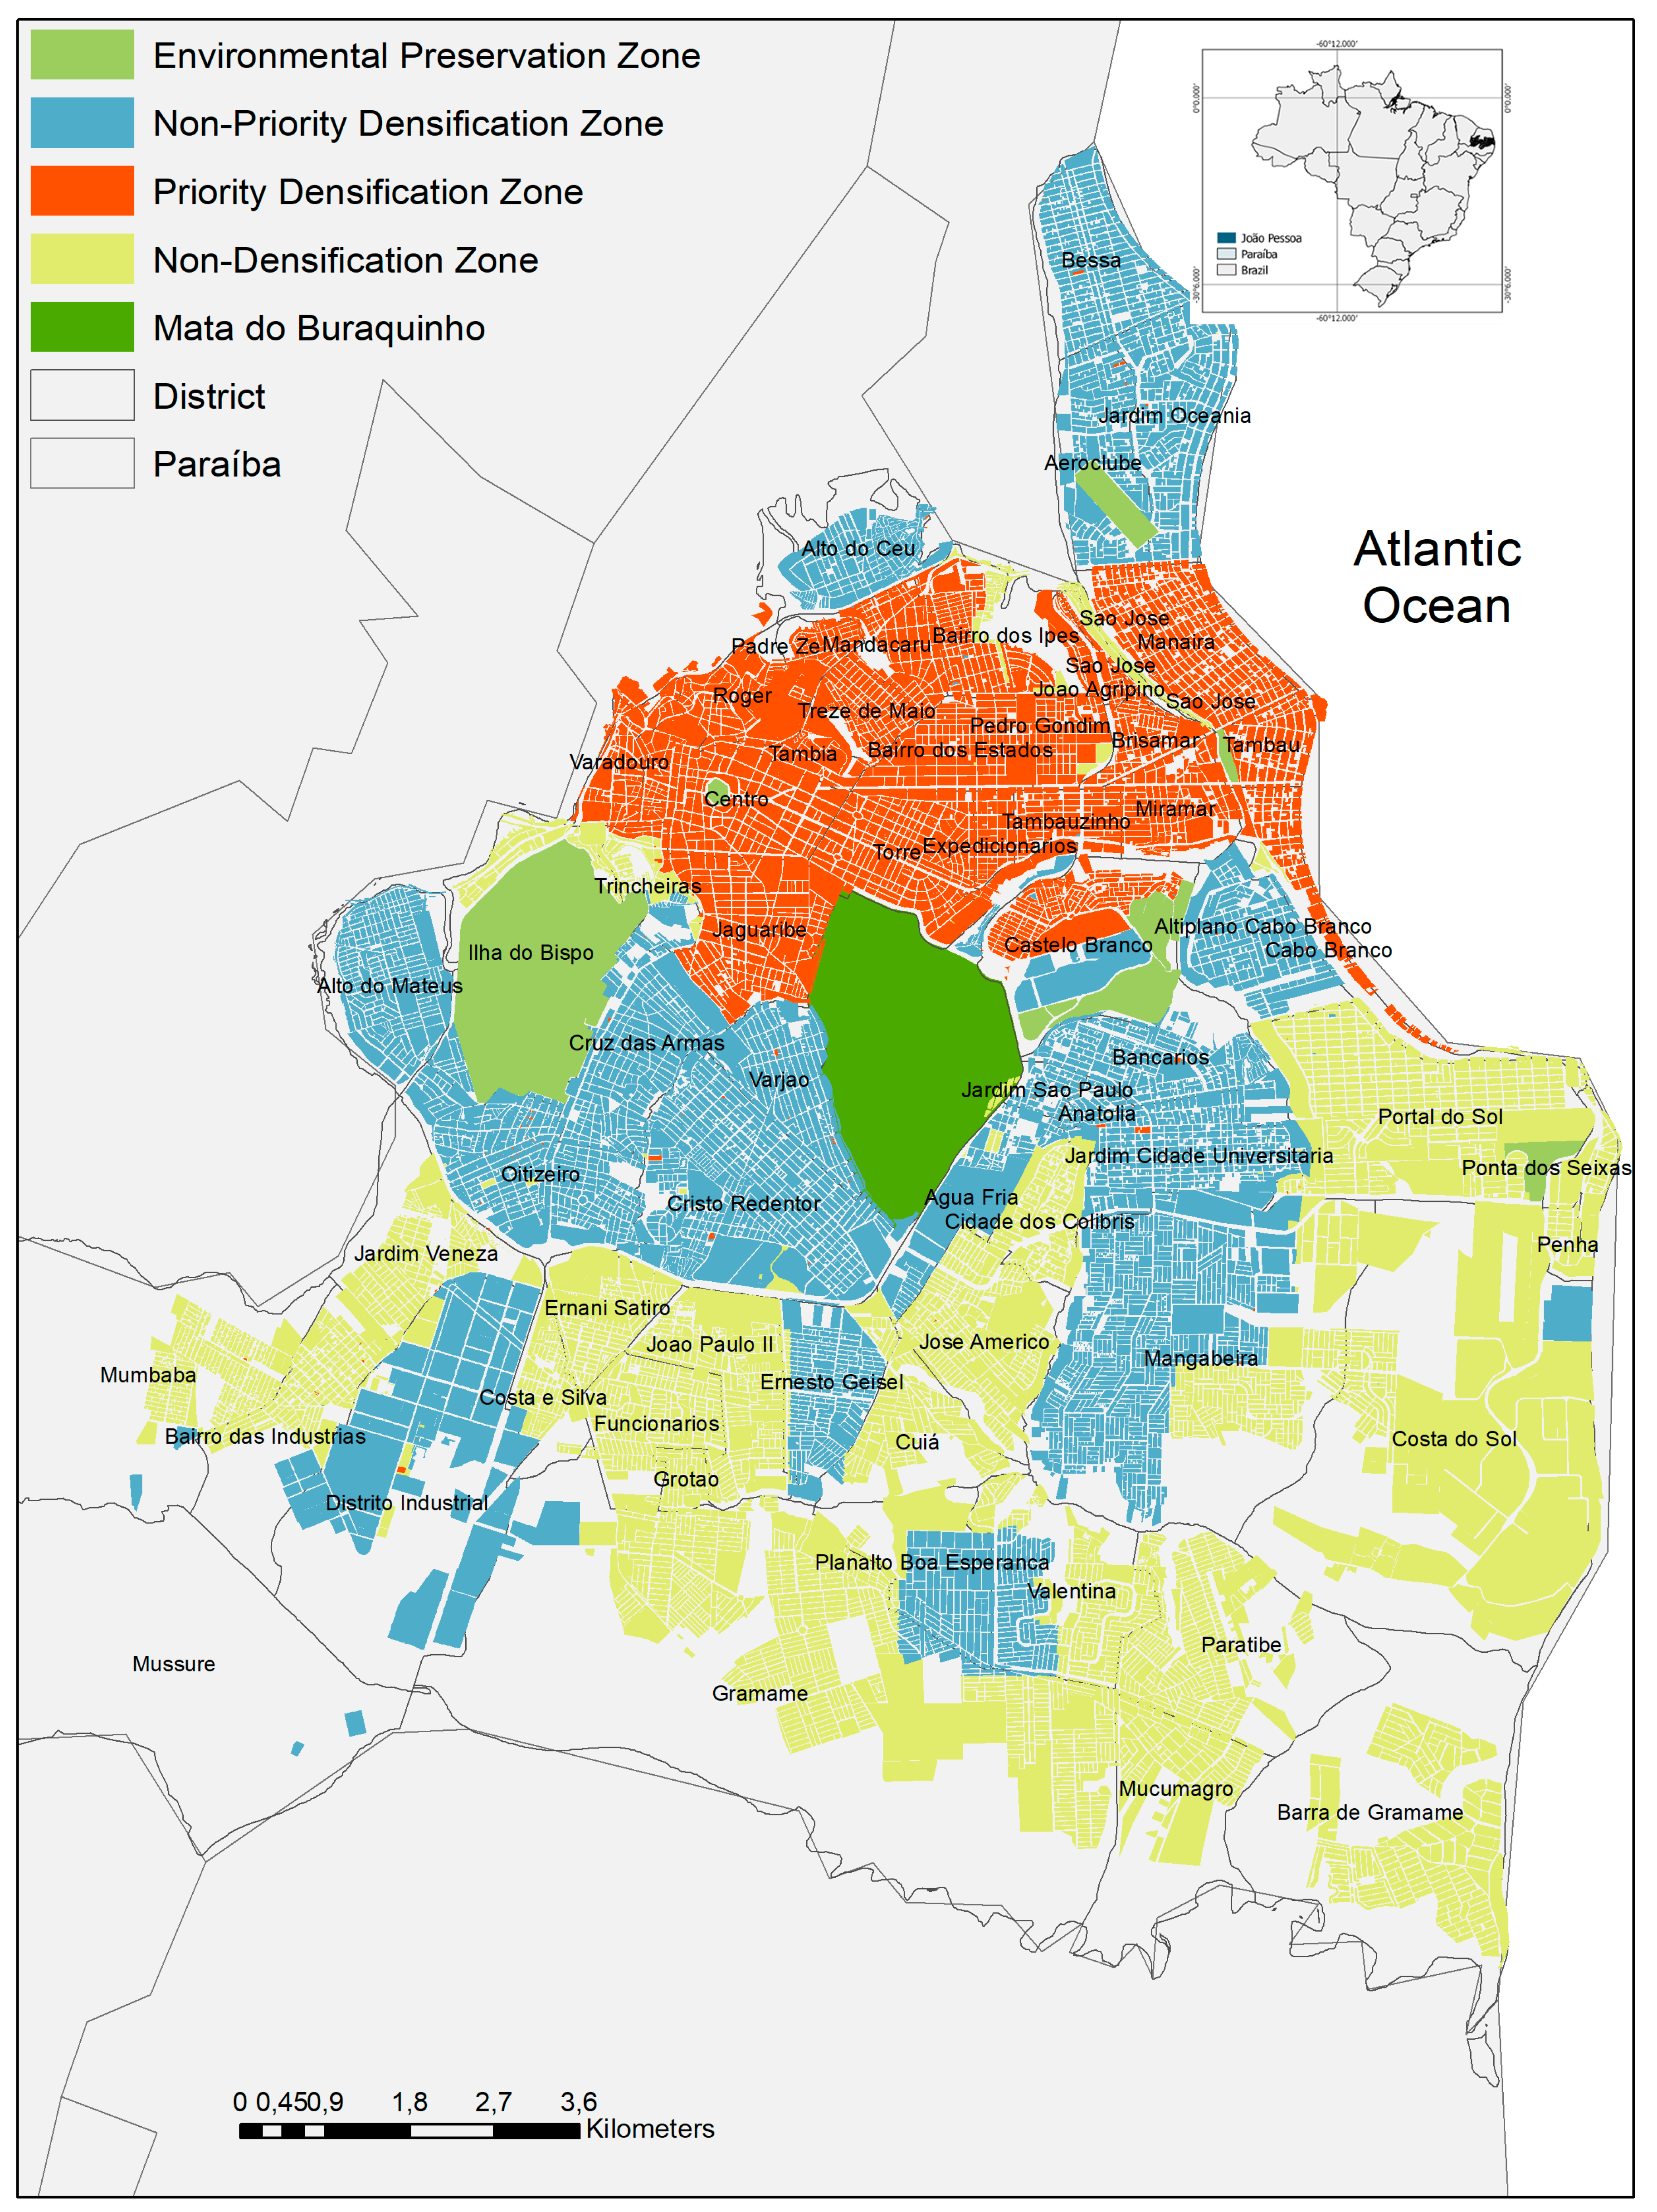
João Pessoa has an extensive area of preserved Atlantic Forest, the Benjamim Maranhão Botanical Gardens, also known as Mata do Buraquinho. The city is divided into integrated areas to enable proper planning and implementation of the strategies and actions defined in the Master Plan. Such areas are called macrozones (
Figure 1).
Macro-zoning considers four zones, each with its particularities, namely:
Densifiable priority zone (DPZ)—area in which the availability of essential infrastructure, a road network, and the environment allow the intensification of land use and occupation. The basic utilization rate may be exceeded, up to the limit of 4.0.
Densifiable non-priority zone (DNPZ)—area in which the availability or lack of one of the essential infrastructure systems allow a moderate intensification of land use and occupation. The utilization rate may be exceeded, up to the limit of 2.0.
Non-densifiable zone (NDZ)—area in which the lack of essential infrastructure, of a road network, and the environment restricts the intensification of land use and occupation.
Environmental preservation zone (EPZ)—this area guarantees the preservation of the unique landscape and remnants of the Atlantic Forest, allowing a sustainable occupation that prioritizes uses typical of rural areas.
In the urban zoning of João Pessoa, one may notice the direction of the study of land use control, which is based on the potential of urban infrastructure, on the current occupation conditions, and on the support capacity of the natural physical environment. However, the city has no urban legislation referring to microclimate.
João Pessoa has been growing without proper planning regarding environmental issues, as evidenced by municipal decree No. 5454/2005 [
51], which allowed an increase in building heights and verticalization exceeding the maximum allowed height. Such increase in verticalization occurred mainly in coastal strip districts and the Altiplano district, which houses the city’s tallest building, with 50 floors and a height of 183 m.
With the objective of establishing strategic references for the city of João Pessoa to face global climatic change, the Inter-American Development Bank (IDB) hired the IDOM-COBRAPE consortium to perform an inventory of greenhouse gas emissions (GGE) for the year 2012, which provided in its appendix a manual of mitigation of atmospheric pollution. It was determined that the inventory of GGE of the municipalities should contemplate the most important sectors, among which were residential and service buildings, following the most recent methodology described in the Global Protocol for Community (GPC) of the International Council for Local Environmental Initiatives (ICLEI).
The inventory makes it possible to reveal the more sensitive sectors and to promote the proper planning and monitoring of the mitigation actions that come to be implemented. However, there is still no prediction for the execution of said monitoring. Air pollution is a very significant health concern. The need to install sensors for a detailed study about this theme is urgent. The index mapping elaborated in this article may also contribute to choosing the location of these sensors, just like “Stuttgart21” [
14], “Berlin Digital Environmental Atlas” [
15] and “Climatic orientations for urban planning in Portugal” [
16].
With the implementation of a monitoring system for greenhouse gas emissions, relevant strategies may be presented, with those showing insufficient results being improved, and those that do not produce effective results being discarded.
2.2. Adopted Indices
The analysis of morphological indices in João Pessoa using a GIS environment was performed, through a methodology that aims to calculate and spatially and automatically distribute the urban indices. We will discuss and present the results of such analysis for each macrozone, emphasizing the most representative districts for each urban index.
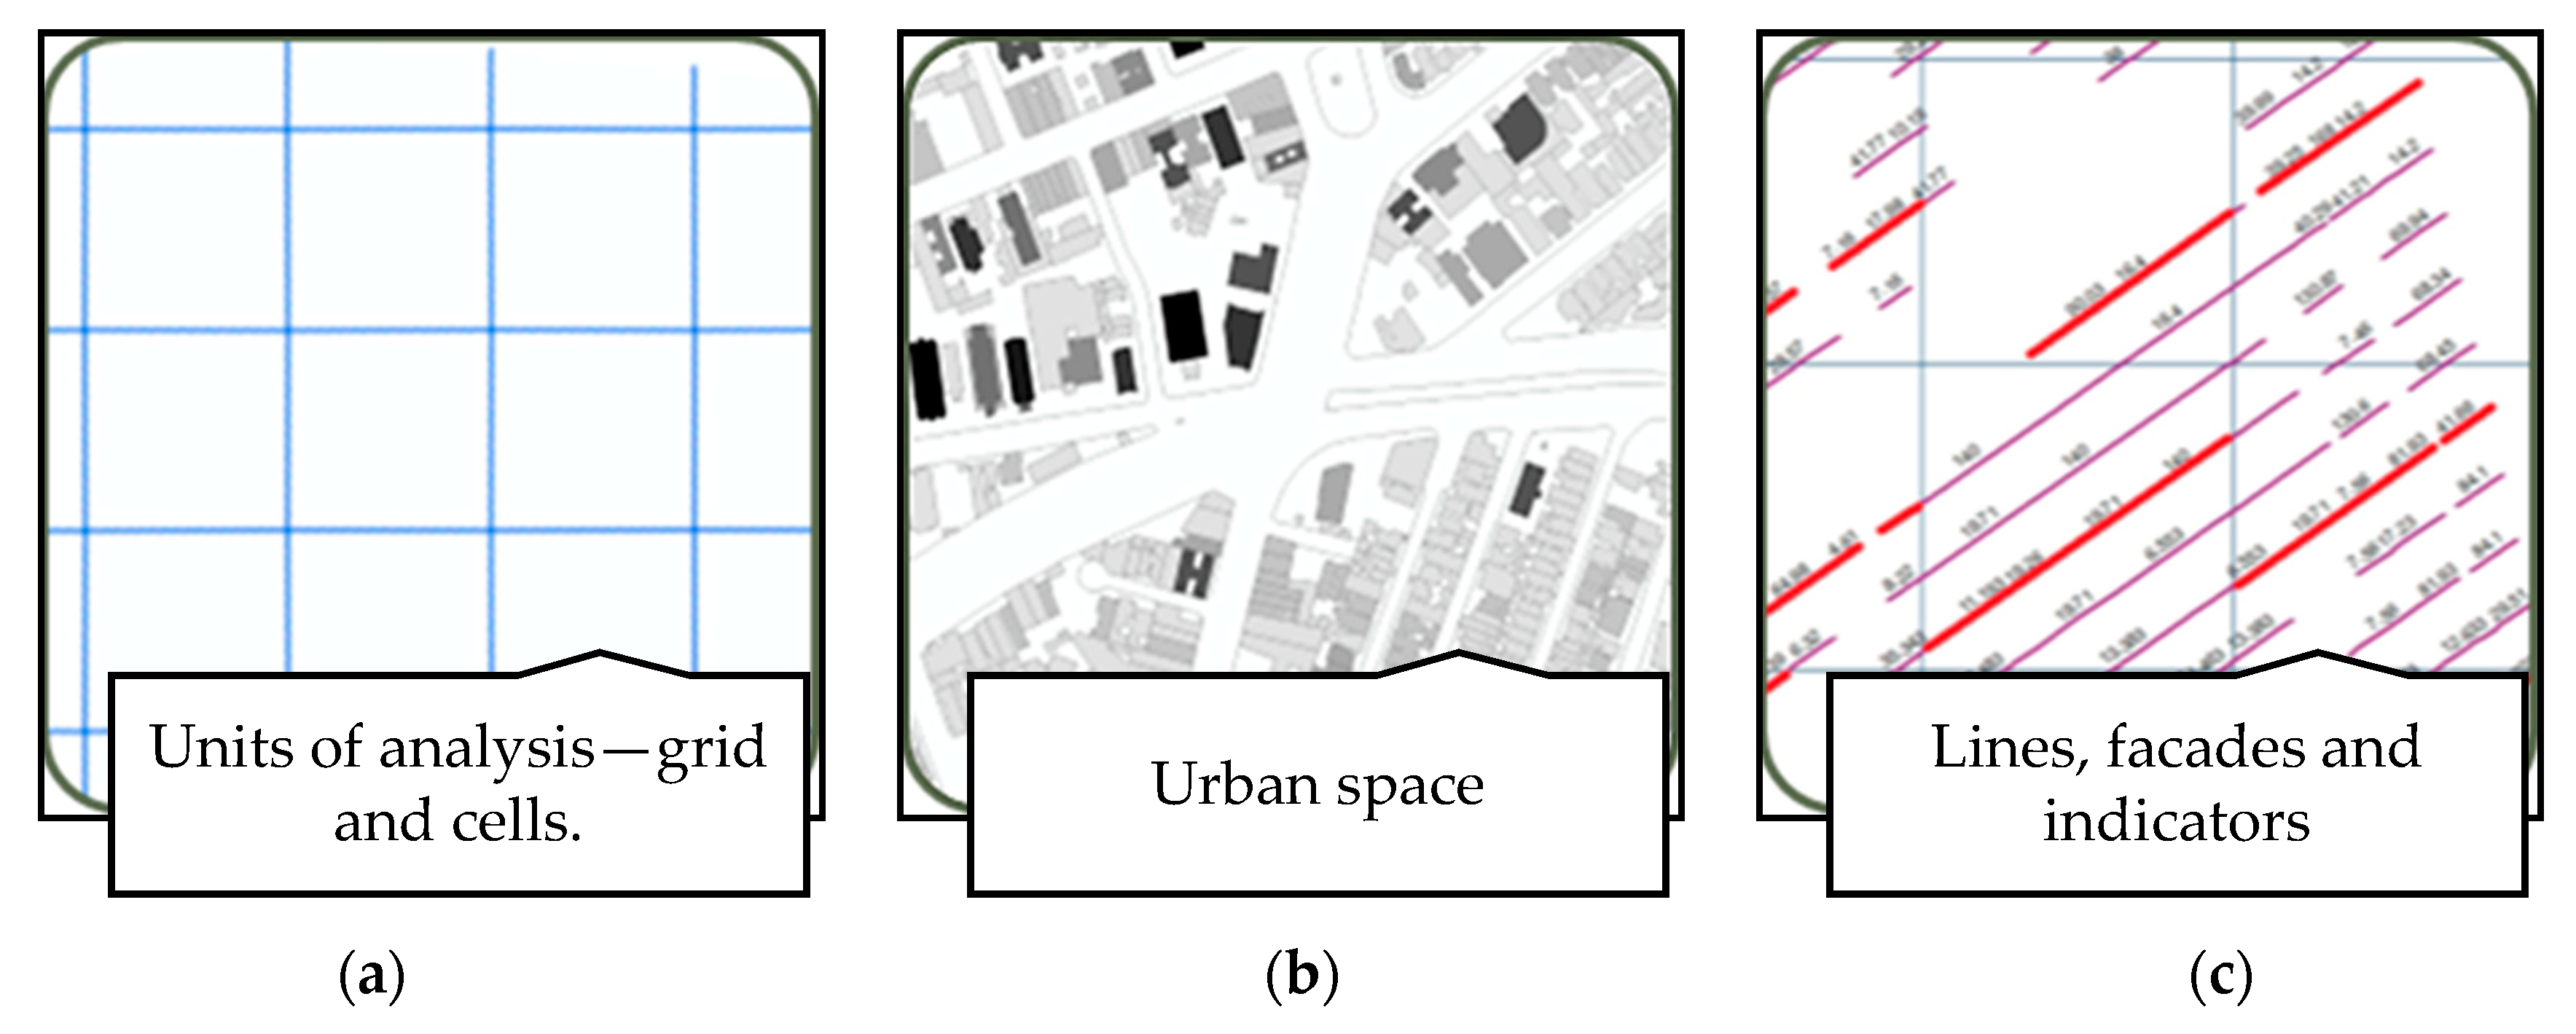
The calculation process was carried out in a GIS environment using the mapping method based on urban vectorial data provided by the city hall of João Pessoa. The urban areas are divided into cells. The set of cells composes a grid. For all calculations, each cell takes into account the height of buildings, the surface área and volume, the width of the streets and the área exposed to the prevailing wind. The data was treated in a regular grid composed of 100x × 100y × 100z m cells (
Figure 2a). The data is in a shapefile format, with information on the constructed areas, circulation areas, and free areas (
Figure 2b). Initially, grid metrics were estimated, including height, area, and volume of the analysis units. Then, the building lot polygons were intersected with the grid and estimated measures required to calculate the indices, such as average height, area, and volume of the lots in the grid. Finally, the measures were calculated for the areas without buildings and the facades present in the lots (
Figure 2c).
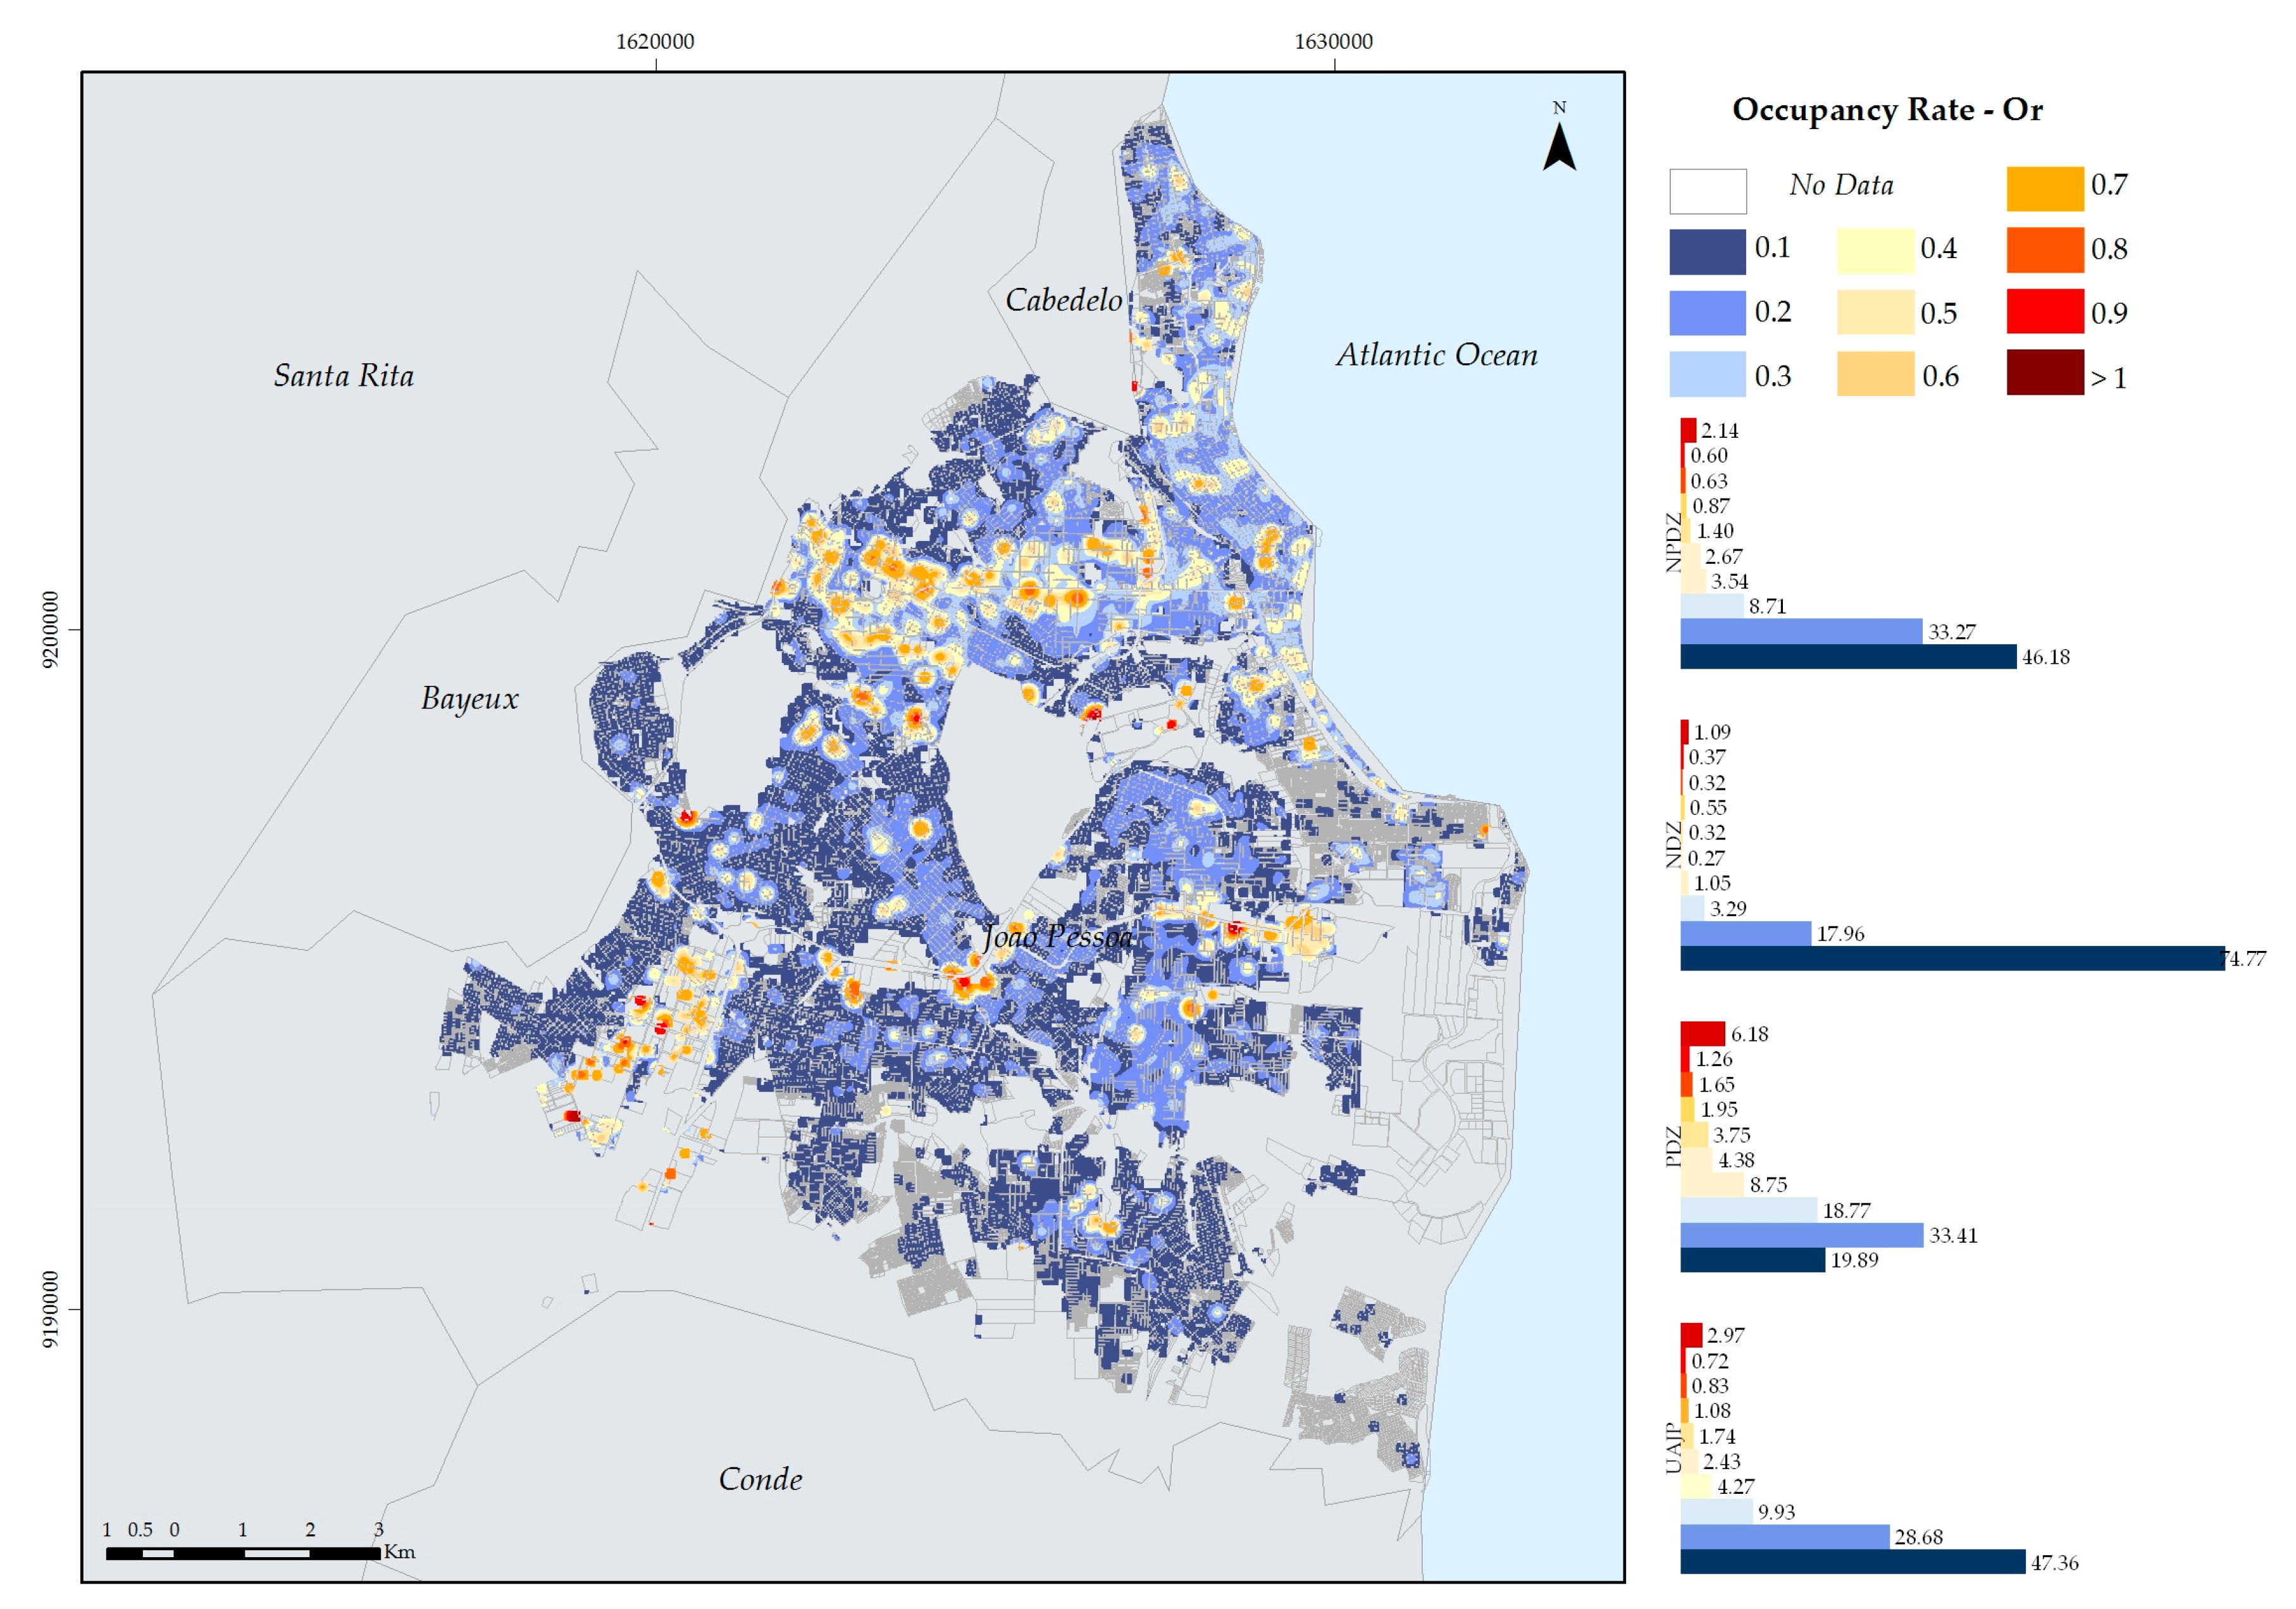
The ISF index is indicated in the city’s legislation as occupancy rate and is pertinent to urban climate studies since it implies the use and regulation of land with reflections on occupation density and permeability of urban spaces. The impervious surface fraction (ISF) was calculated through the ratio between the sum of the total area of the constructed space and the total area of the plot in the urban network. Verticality was calculated by estimating the average height of buildings in the lots by the height of the analysis unit (100 m) (
Table 1).
Aerodynamic roughness was analyzed by mapping in consideration of Z
0 and zd, which were calculated based on the measurements of the building facades exposed to the dominant wind direction [
54,
56]. Parallel lines were created in a perpendicular direction (NE–SW), simulating the building sessions and functioning as barriers to the dominant wind direction (SE). When intercepted with the construction blocks, such lines allow the length, height, and area of the facades to be obtained [
54]. The highest roughness values are related to the largest building facade segments oriented to the main wind direction in João Pessoa.
To calculate the H/W ratio, the height of the constructed spaces was used rationed with the road circulation spaces and free spaces that separate them. To calculate urban porosity, the volume of free air was defined through information concerning the lot areas, the height of constructed spaces, and the volume of the analysis unit with 100 m dimensions (x, y, and z). Such measures were elaborated considering the average height area of the blocks of buildings and the cells, the latter defined as a constant at 100 m in height, to define the free air volume.
3. Results
3.1. Impervious Surface Fraction (ISF)
The ISF index presented low or zero values in areas inserted in the three macrozones. However, it is noticeable that the index increased in the densifiable priority zone with an average value of 0.52, favored by the city’s municipal legislation (
Figure 3). The highest ISF value was observed in the Mangabeira district, followed by the city center. Larger ISF values are related to greater surface exposure to radiation, and hence, these zones may be interpreted as limit points of the surface heat island. The temperature may increase depending on the material present on these surfaces, thus corroborating to zones with greater thermal discomfort.
The impervious surface fraction influences the amount of permeable soil in the open spaces, especially in the densifiable priority zone. The highest values for pervious spaces were found, with values of 74.77% and 46.18%, respectively, in the non-densifiable zone and the densifiable non-priority zone in districts far from the city center and in the coastal area of the city. However, extreme ISF values were observed in the PDZ, on the order of 6.18%, followed by NPDZ, on the order of 2.14%, and global average city, on the order of 3% of the totally impermeable surfaces estimated in a 100 × 100 m cell.
The existing empty spaces in the city of João Pessoa make the amount of permeable soil equivalent to 1 in many areas throughout the city (
Figure 3). However, one should note that the open spaces for this analysis were distinguished based on urban structure [
2], so a detailed analysis of the use of open spaces aimed at delimiting the green spaces will be necessary in the future. The permeable areas analyzed included spaces without buildings, including roads and paved spaces, which do not favor the water infiltration process or air humidity, possibly leading to an increase in local temperature.
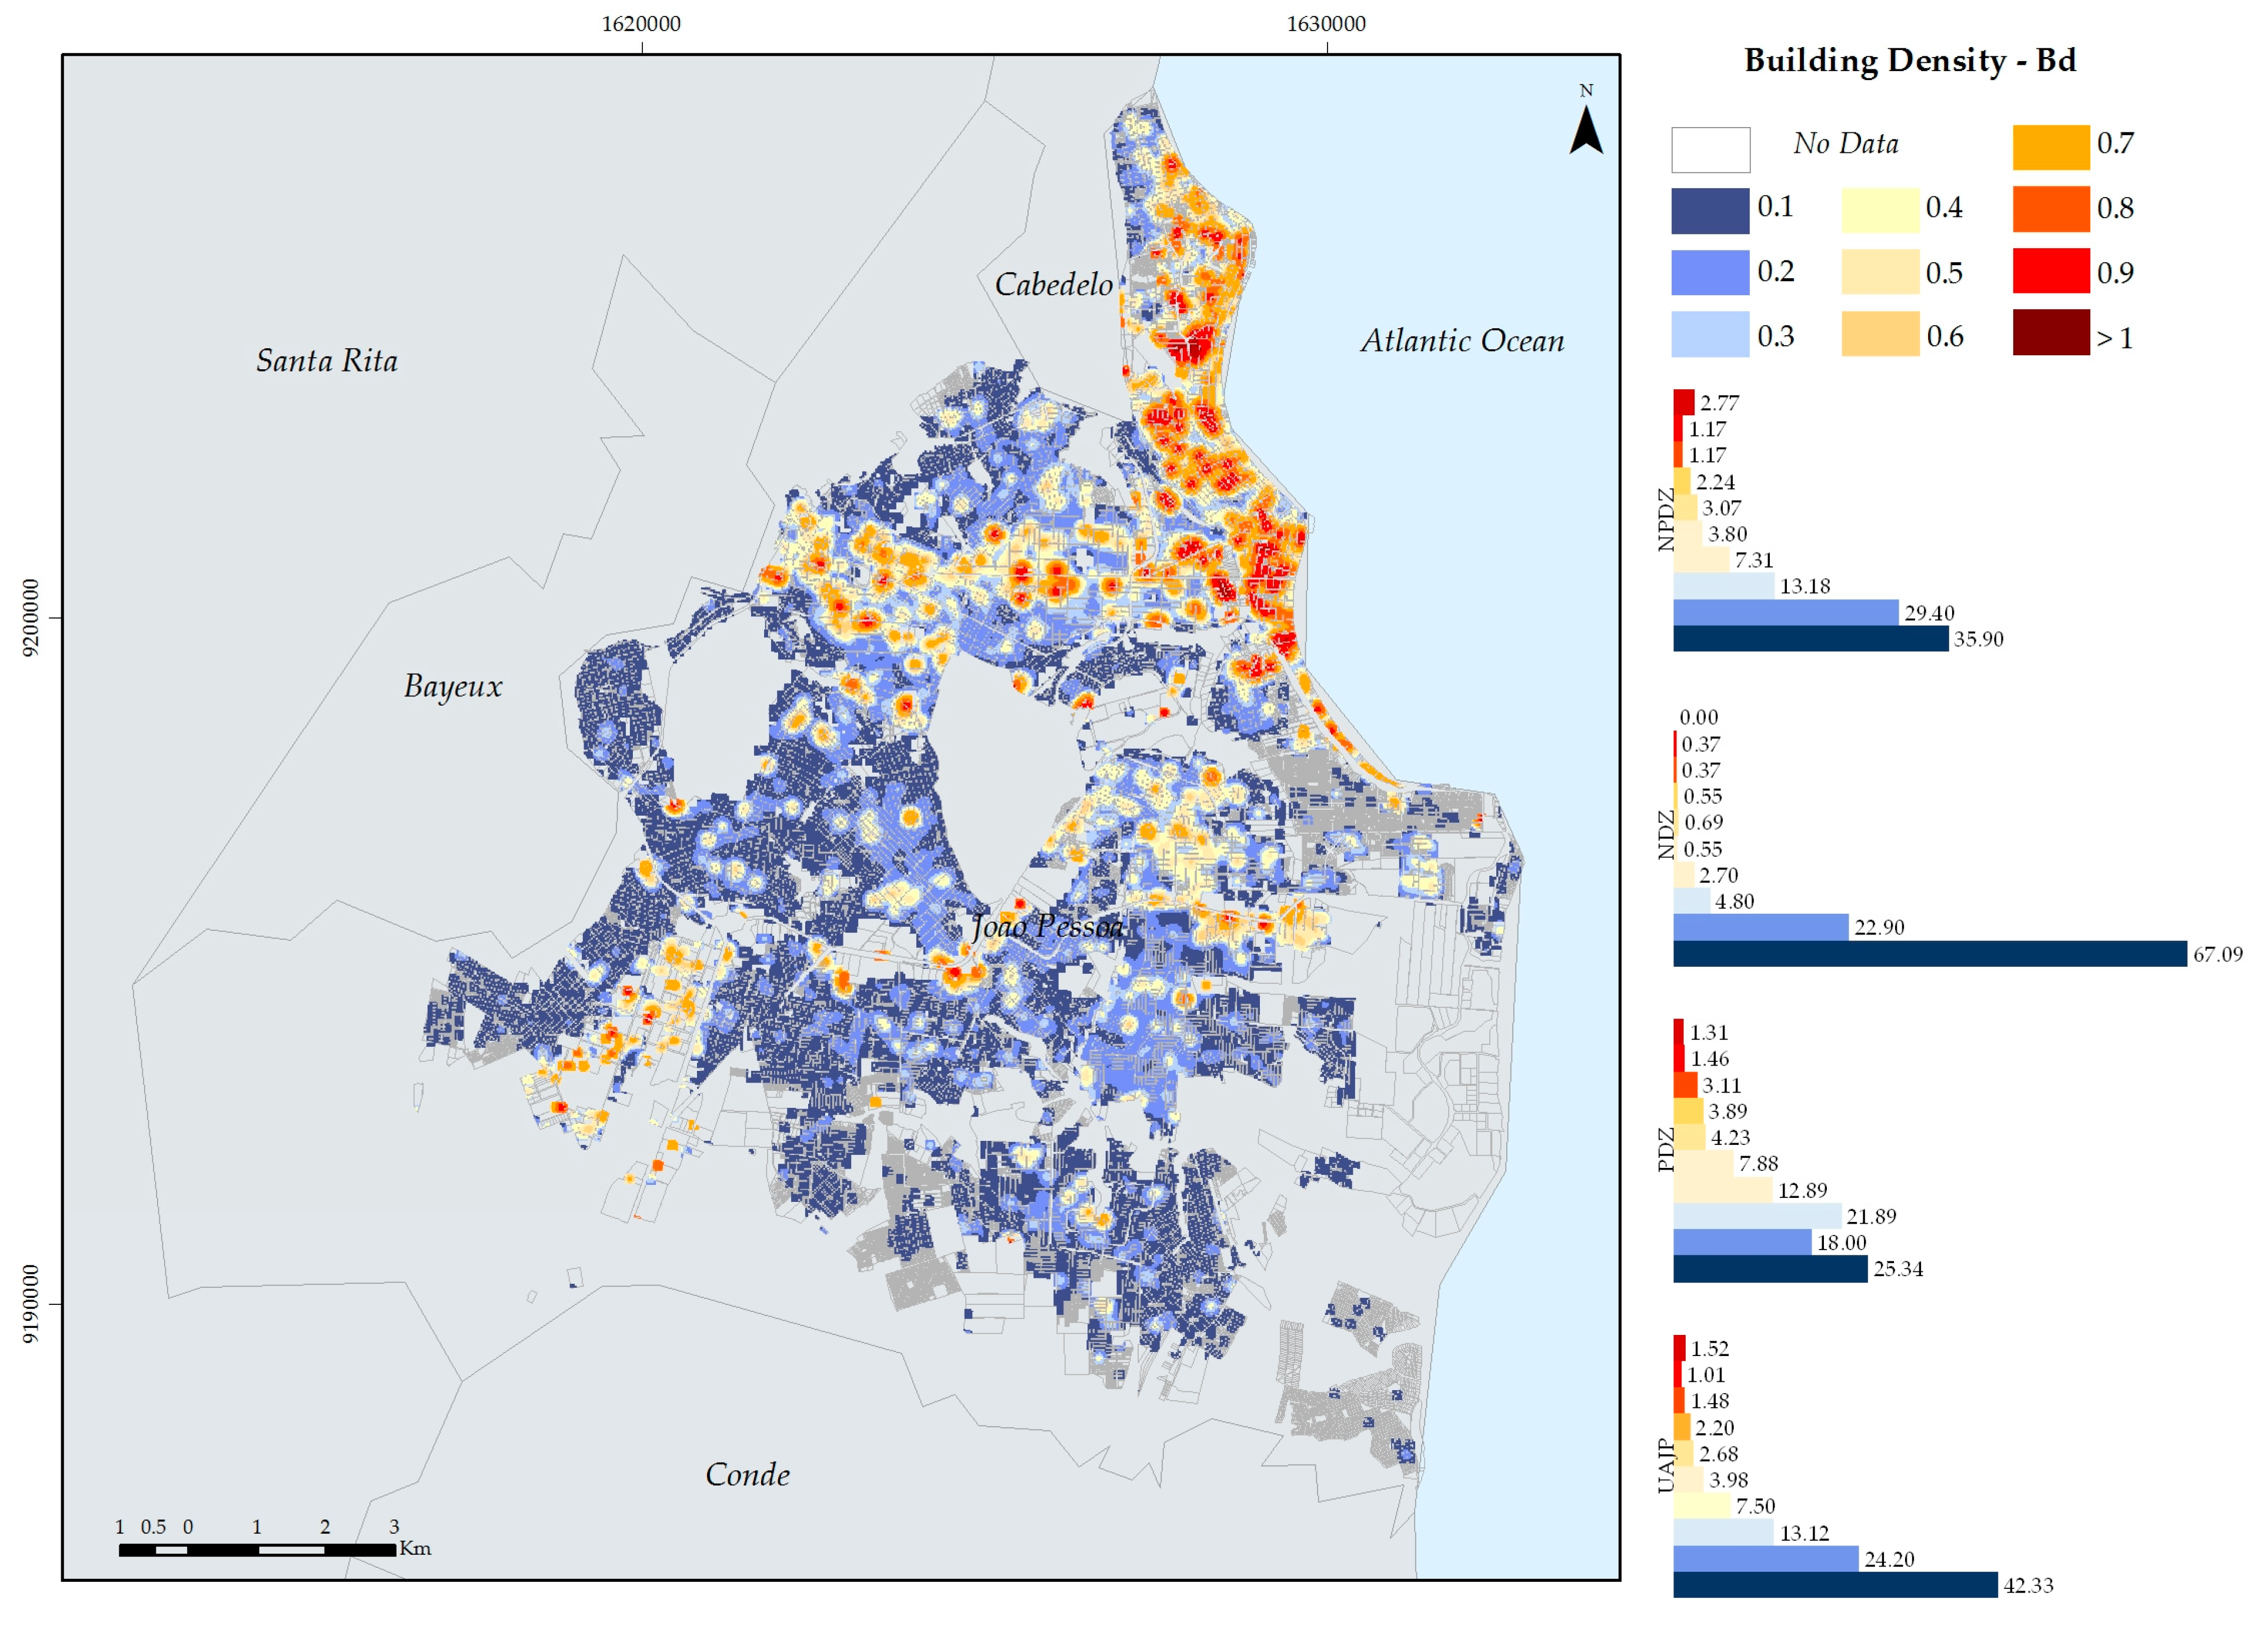
3.2. Building Density (BD)
The urban configurations of the densifiable priority and non-priority zones of João Pessoa have high building densities (average occupancy rate of 52%), especially the districts in the coastal area and those distributed along the east-west corridor connecting to the city center (
Figure 4).
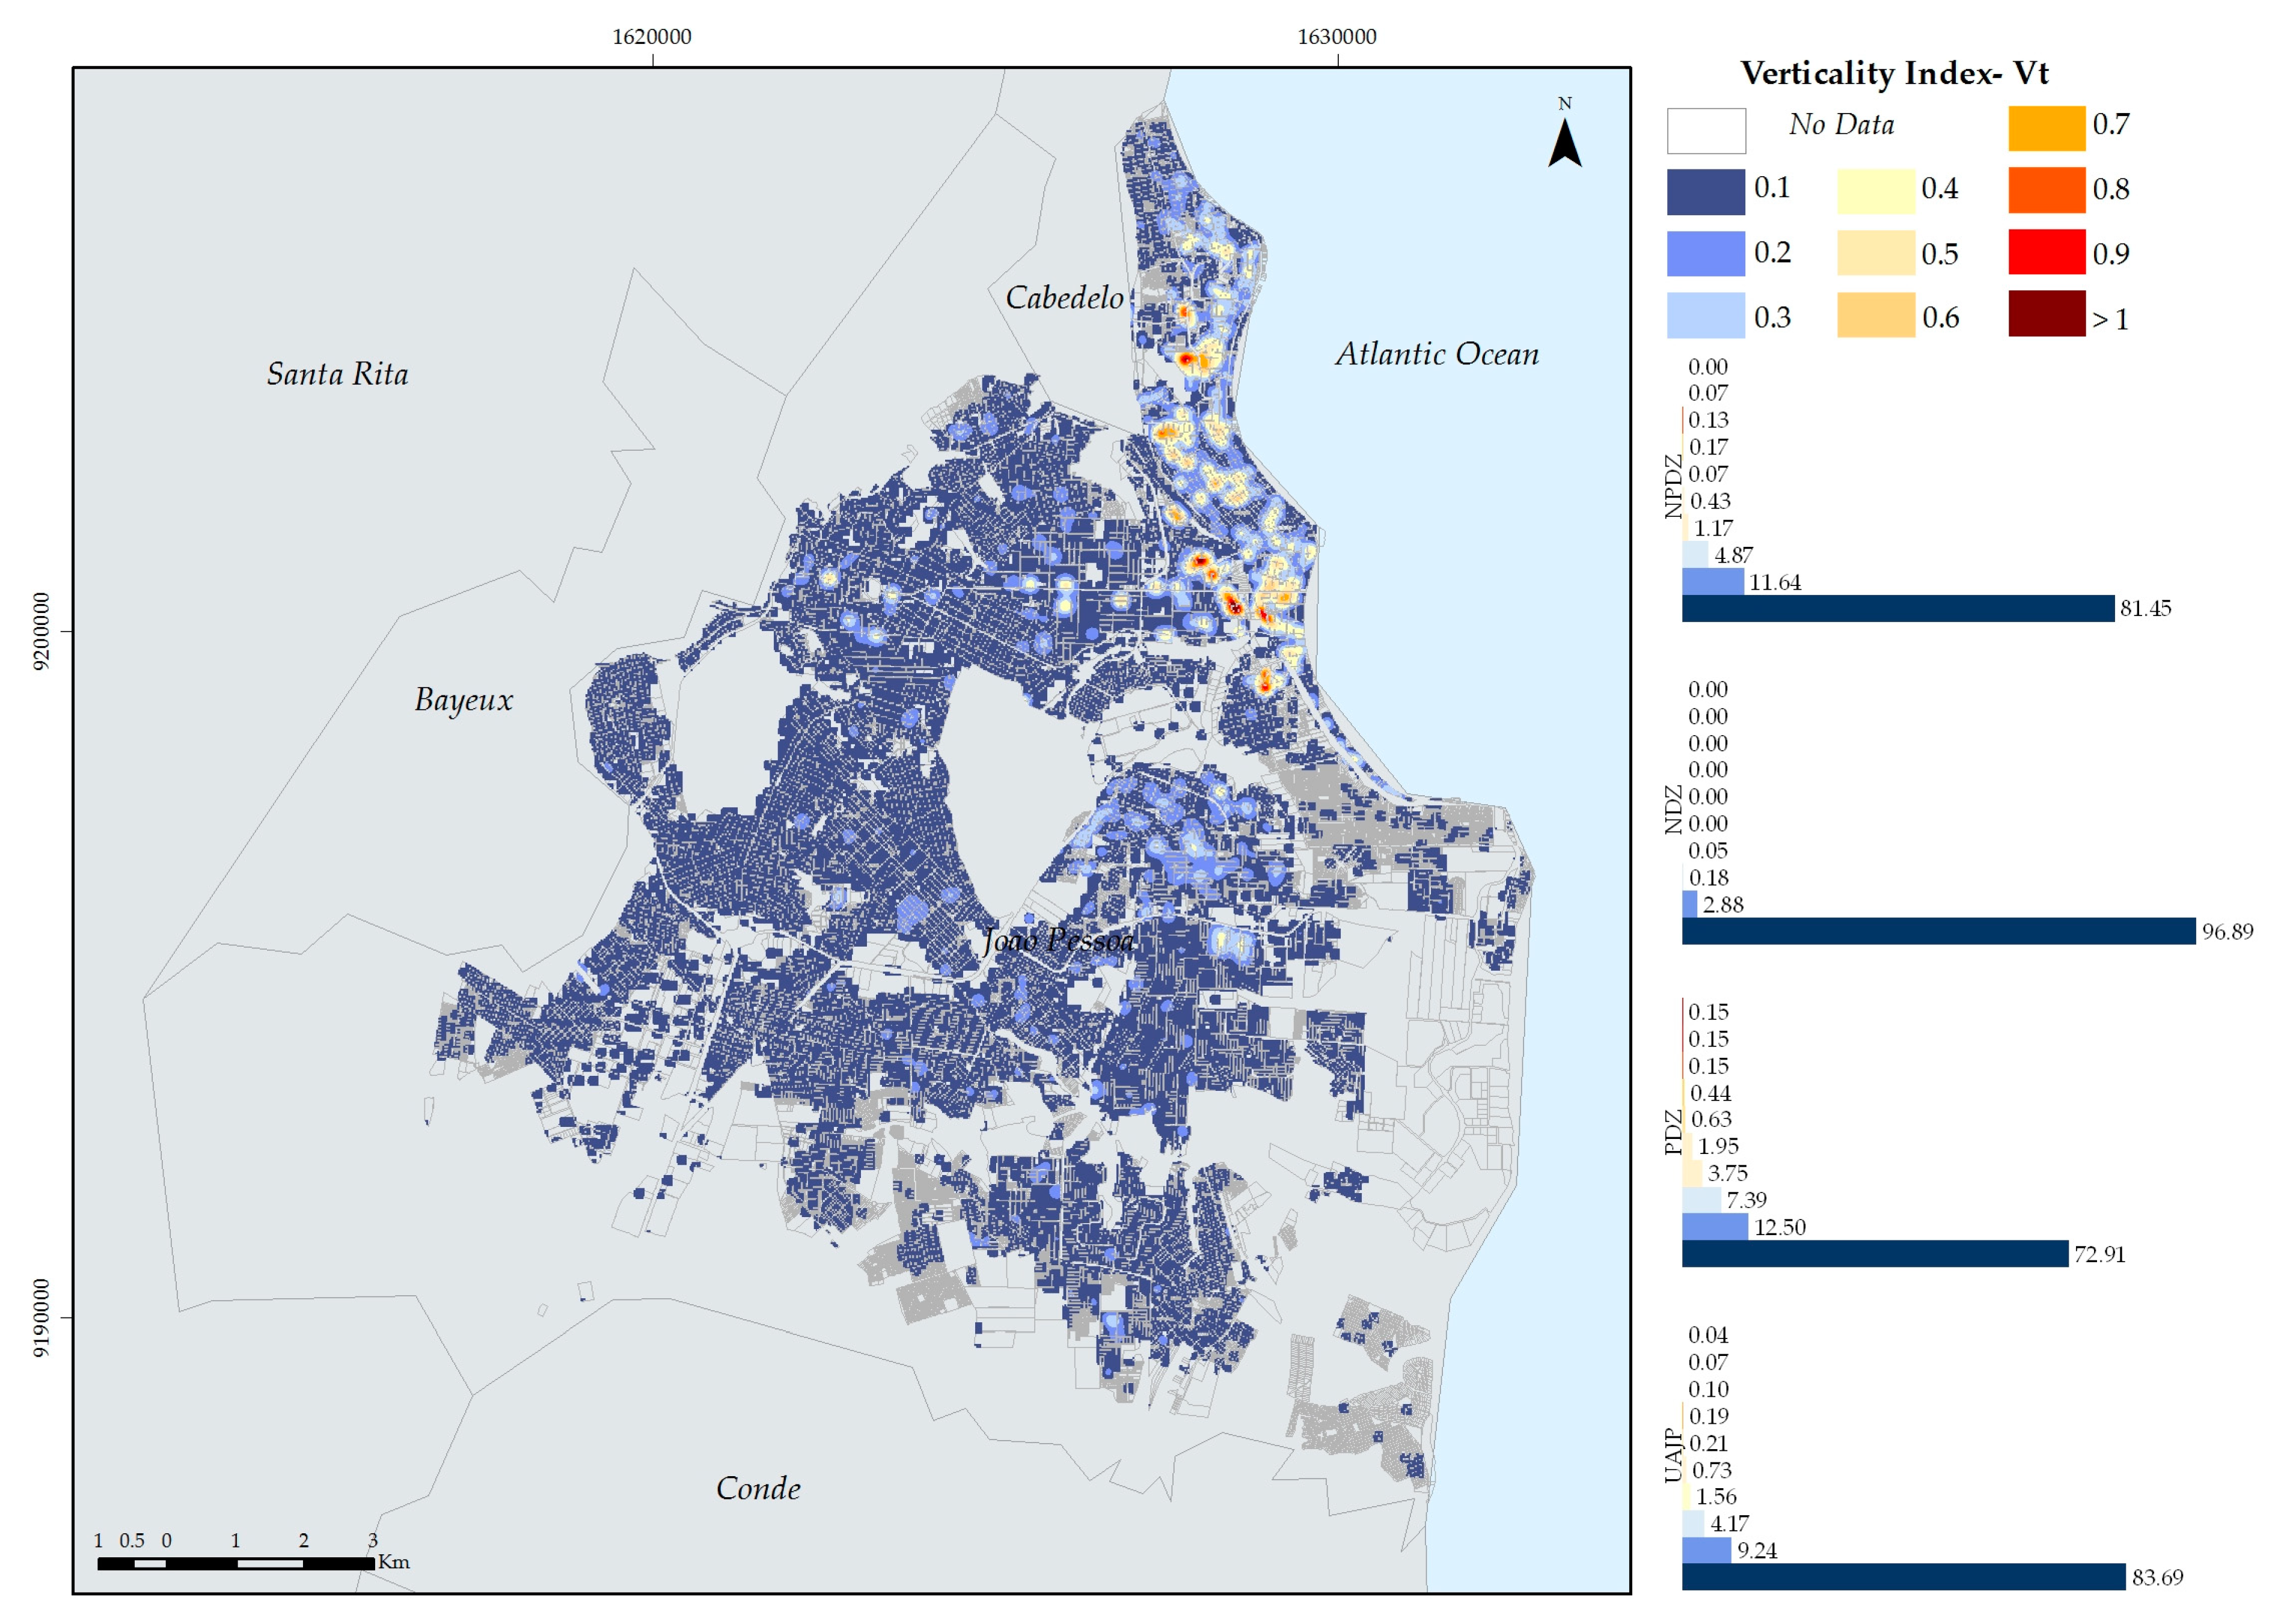
3.3. Verticality Index (Vt)
Based on Vt, the average building height is 18 m, with an estimated maximum height of 100 m, reaching the limit value for the cell analysis unit (
Figure 5). Coastal districts contain the highest number of tall buildings, and therefore, the Vt values for the densifiable priority and non-priority zones remained high, thus configuring zones in which urban form promotes, during the day, higher levels of shading, and therefore, better thermal comfort conditions. In the same zones mentioned, during the night, there may be an accumulation of heat and pollutants due to the interference in wind circulation and to the barrier effect on sea breezes, yielding a more intense heat island.
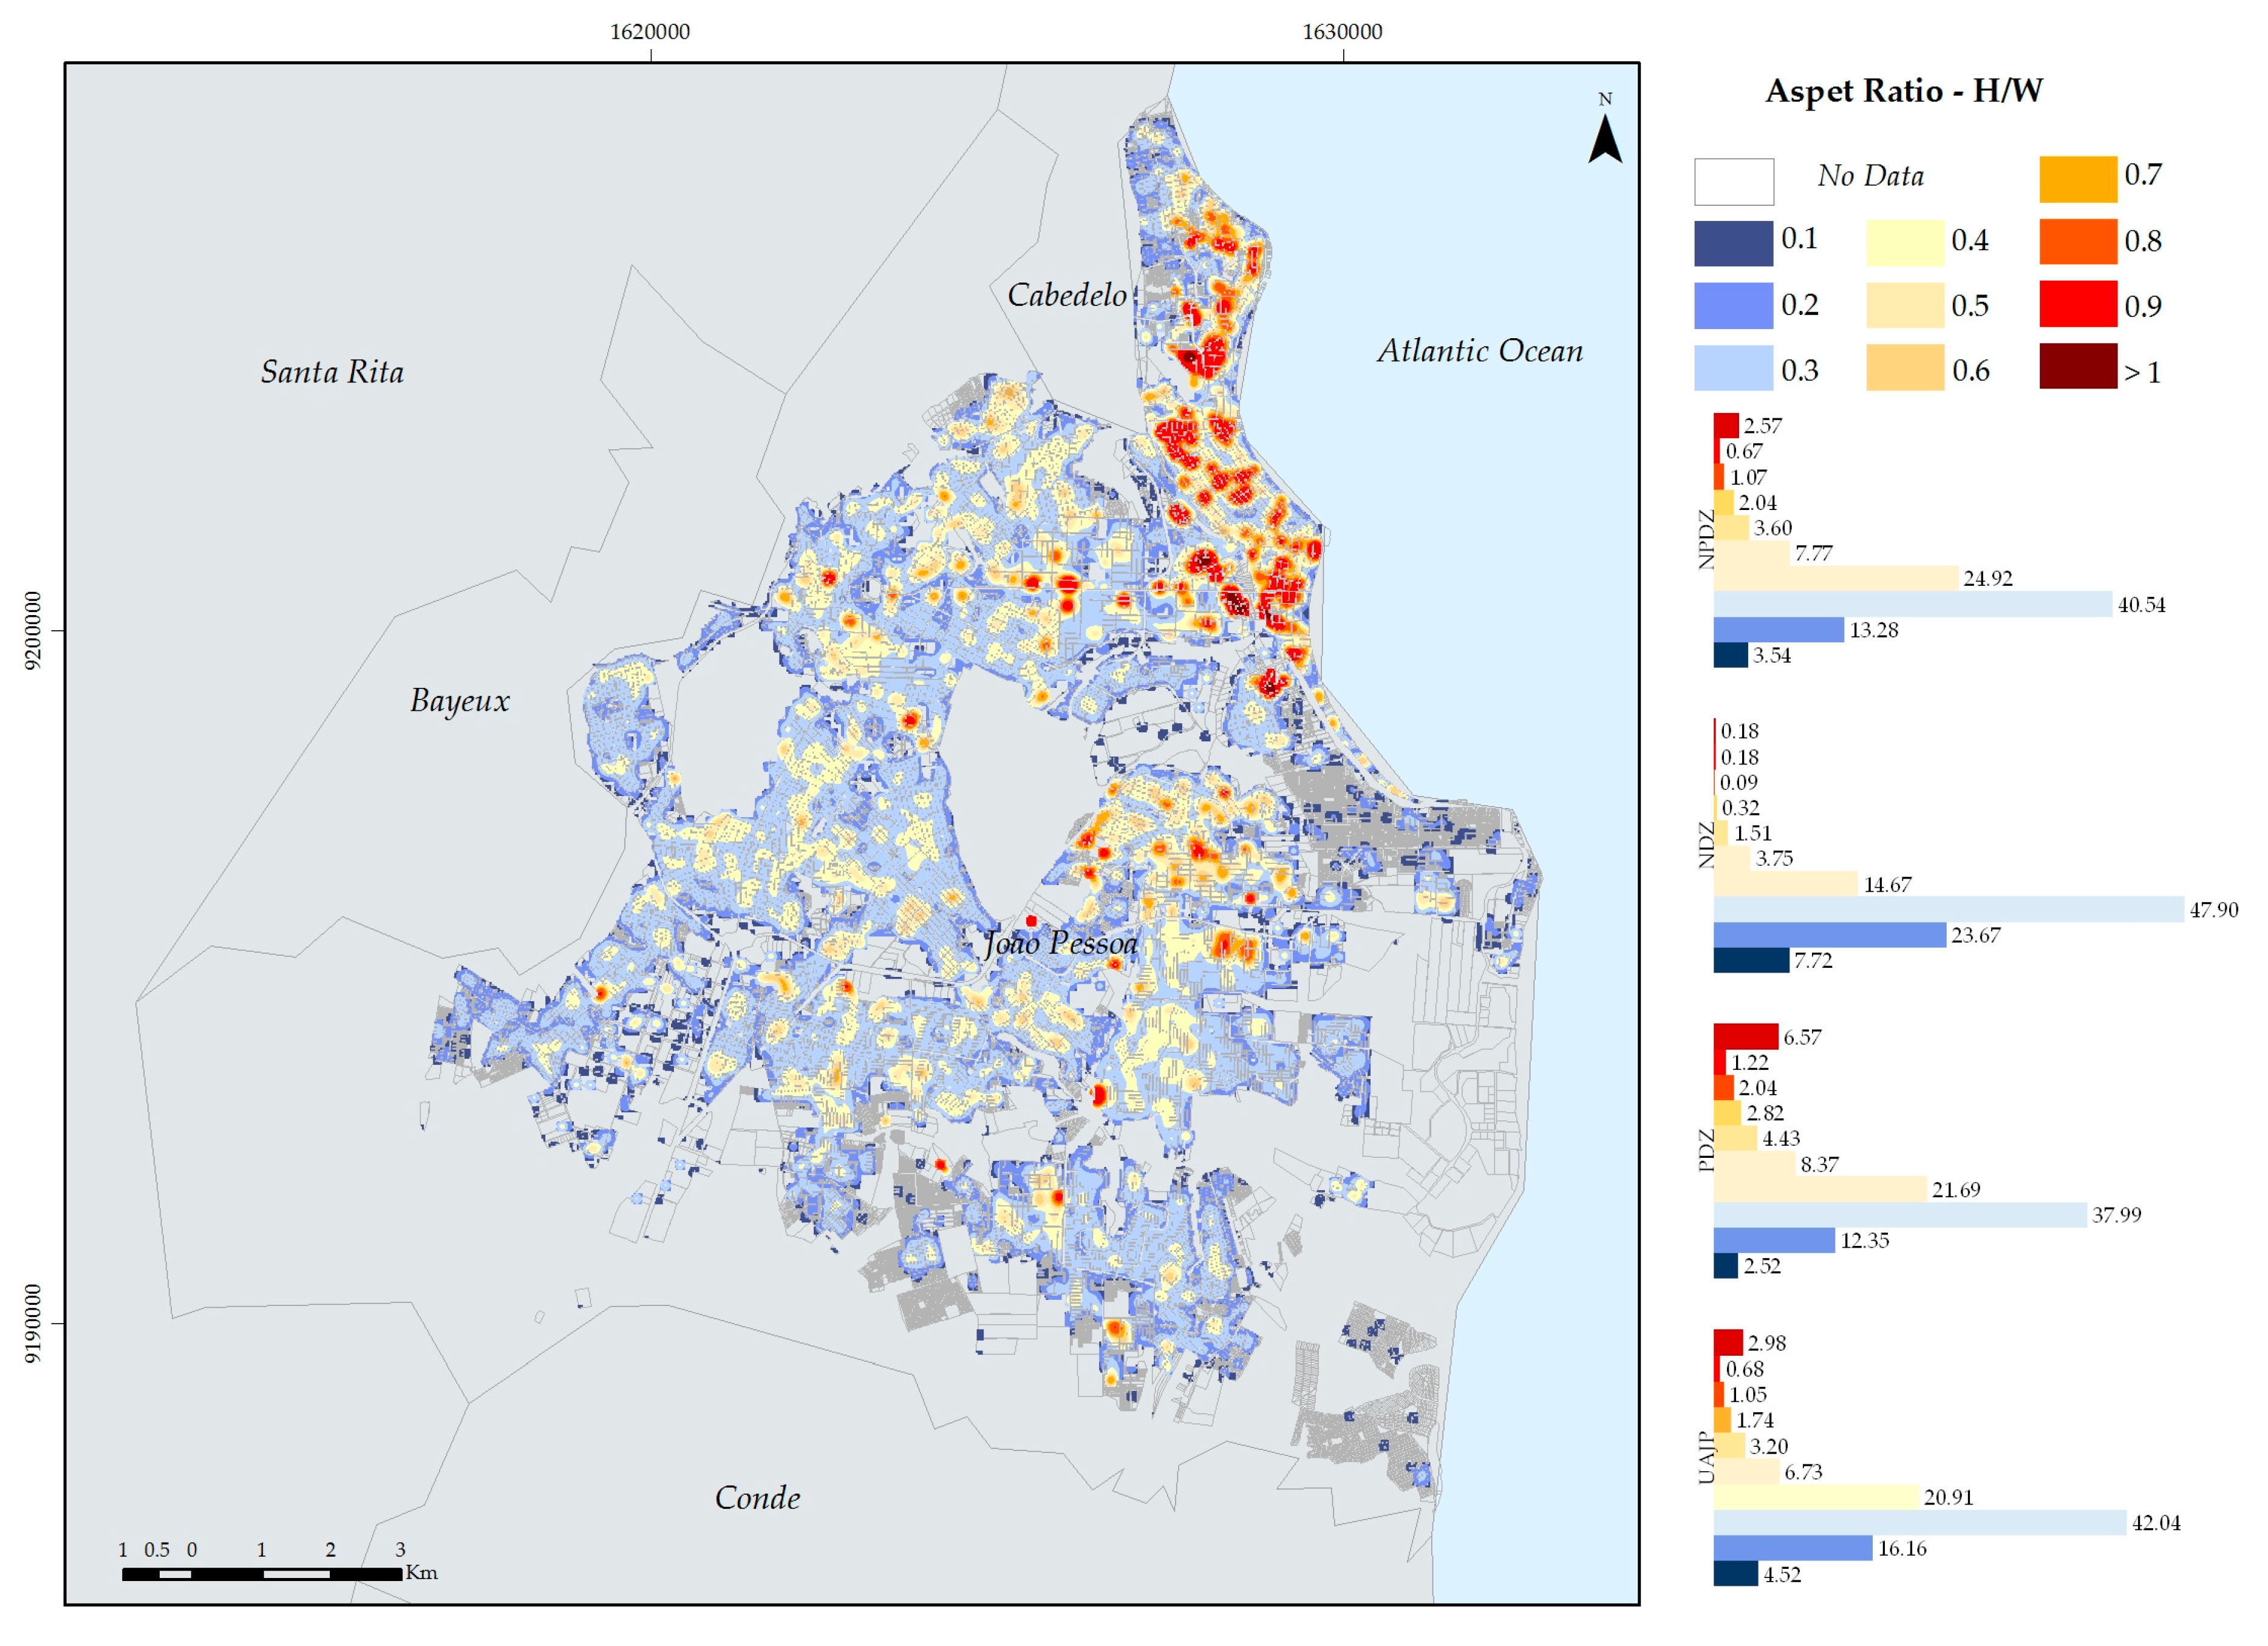
3.4. H/W Aspect Ratio
The results for the H/W ratio in the densifiable non-priority and non-densifiable zones presented favorable conditions for energy exchange and air circulation in the urban canyon, with an average of 0.3 and high concentration of results in the 0.10 class. However, for the densifiable priority zone, the H/W presented an average value of 0.41, which configures the areas in which the urban canyon presents a reduced view of the sky and, therefore, less potential for dispersion of heat and pollutants (
Figure 6).
The highest H/W ratio values were found mainly in the city’s coastal strip (
Figure 6). The results are mostly less than 0.75, which indicates areas in which the average height of the constructed areas per lot is not more significant than the surrounding open spaces. In areas for which the average height of the constructed space per lot is larger than the distance between the spaces that separate them, the H/W correlation reaches a value between 1 and over 1.51, as is the case for the Expedicionários and Aeroclube (coastal area) districts.
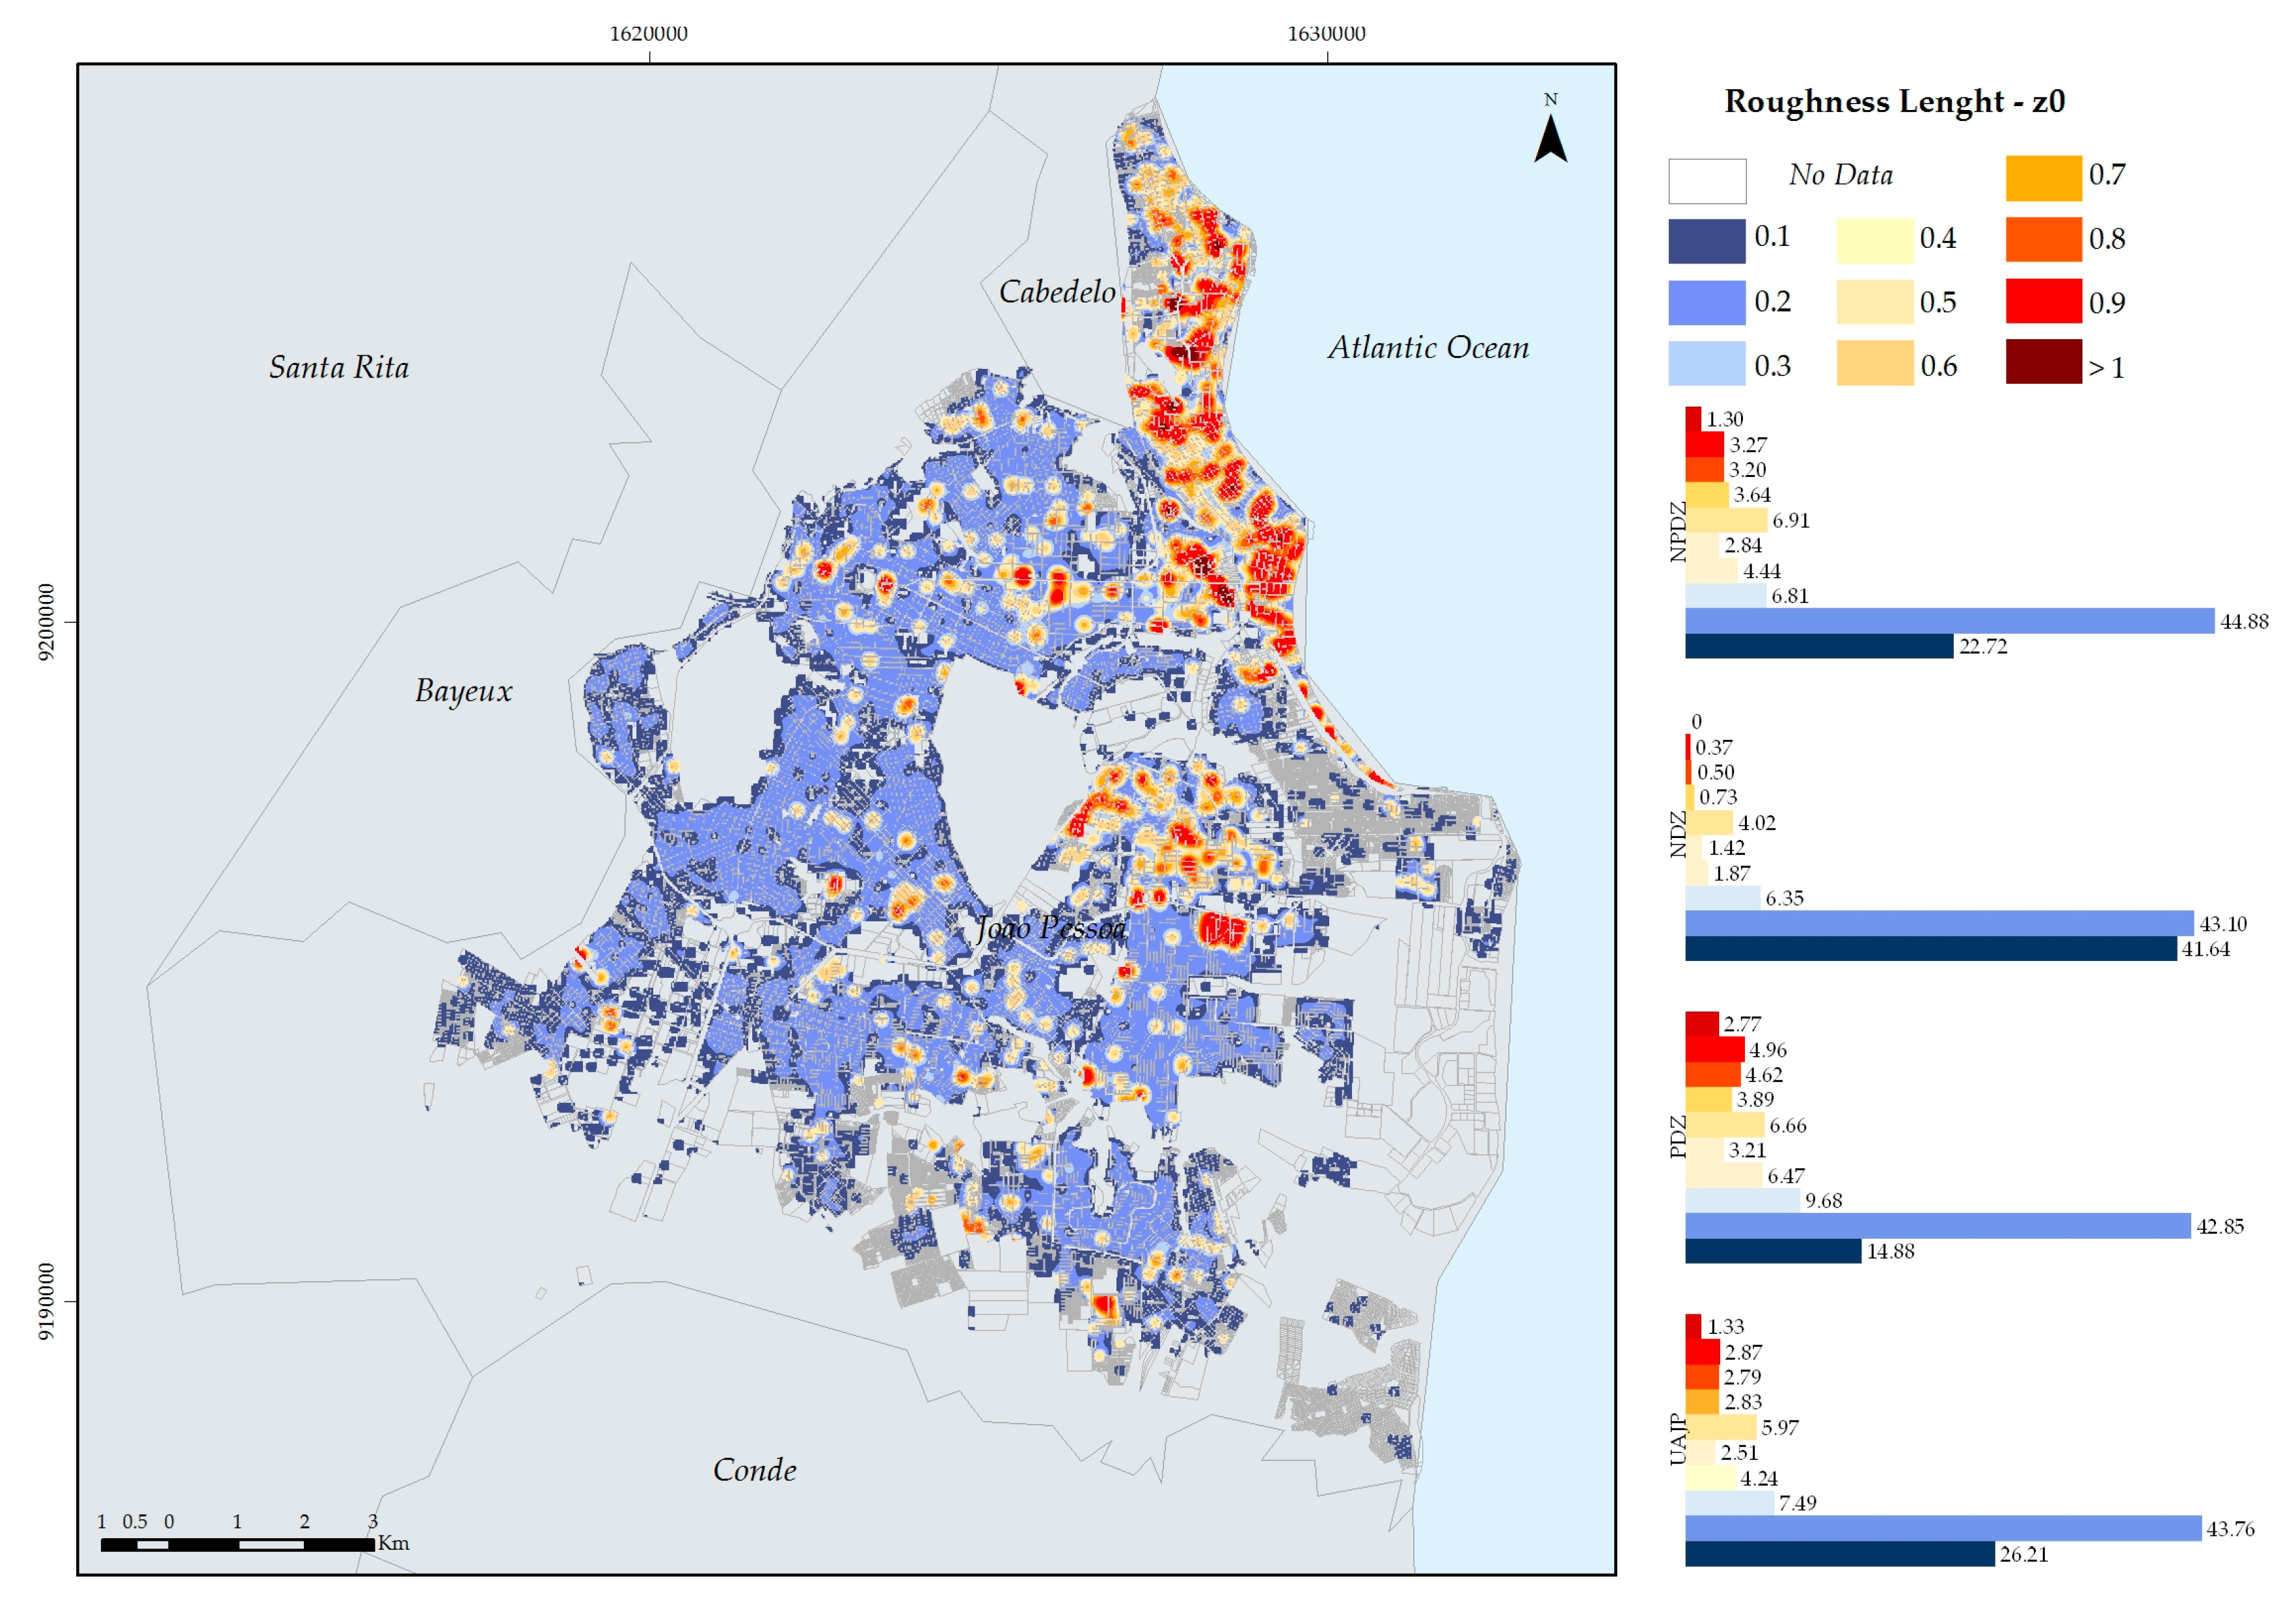
3.5. Roughness Length (Z0)
The macrozones of the city of João Pessoa presented a concentration of aerodynamic roughness values close to 0.10, which indicates low roughness of the constructed spaces and satisfying conditions for wind passage and heat dispersion. The low values occur because the city’s urban fabric is primarily made up of houses with less than two floors.
High aerodynamic roughness values between 1.0 and 1.5, compatible with greater vertical and horizontal densities, occur mainly in the coastal strip of the city (
Figure 7). The highest values for roughness length were identified in the coastal districts.
In the east-west corridor, formed by one of the city’s main avenues (towards the central district), high values for the H/W ratio was observed as well as aerodynamic roughness. The same happens in part of the Altiplano district and in the Mangabeira and Bancários districts, all located in the city’s north-south axis, which indicates an increase in such indices at these locations.
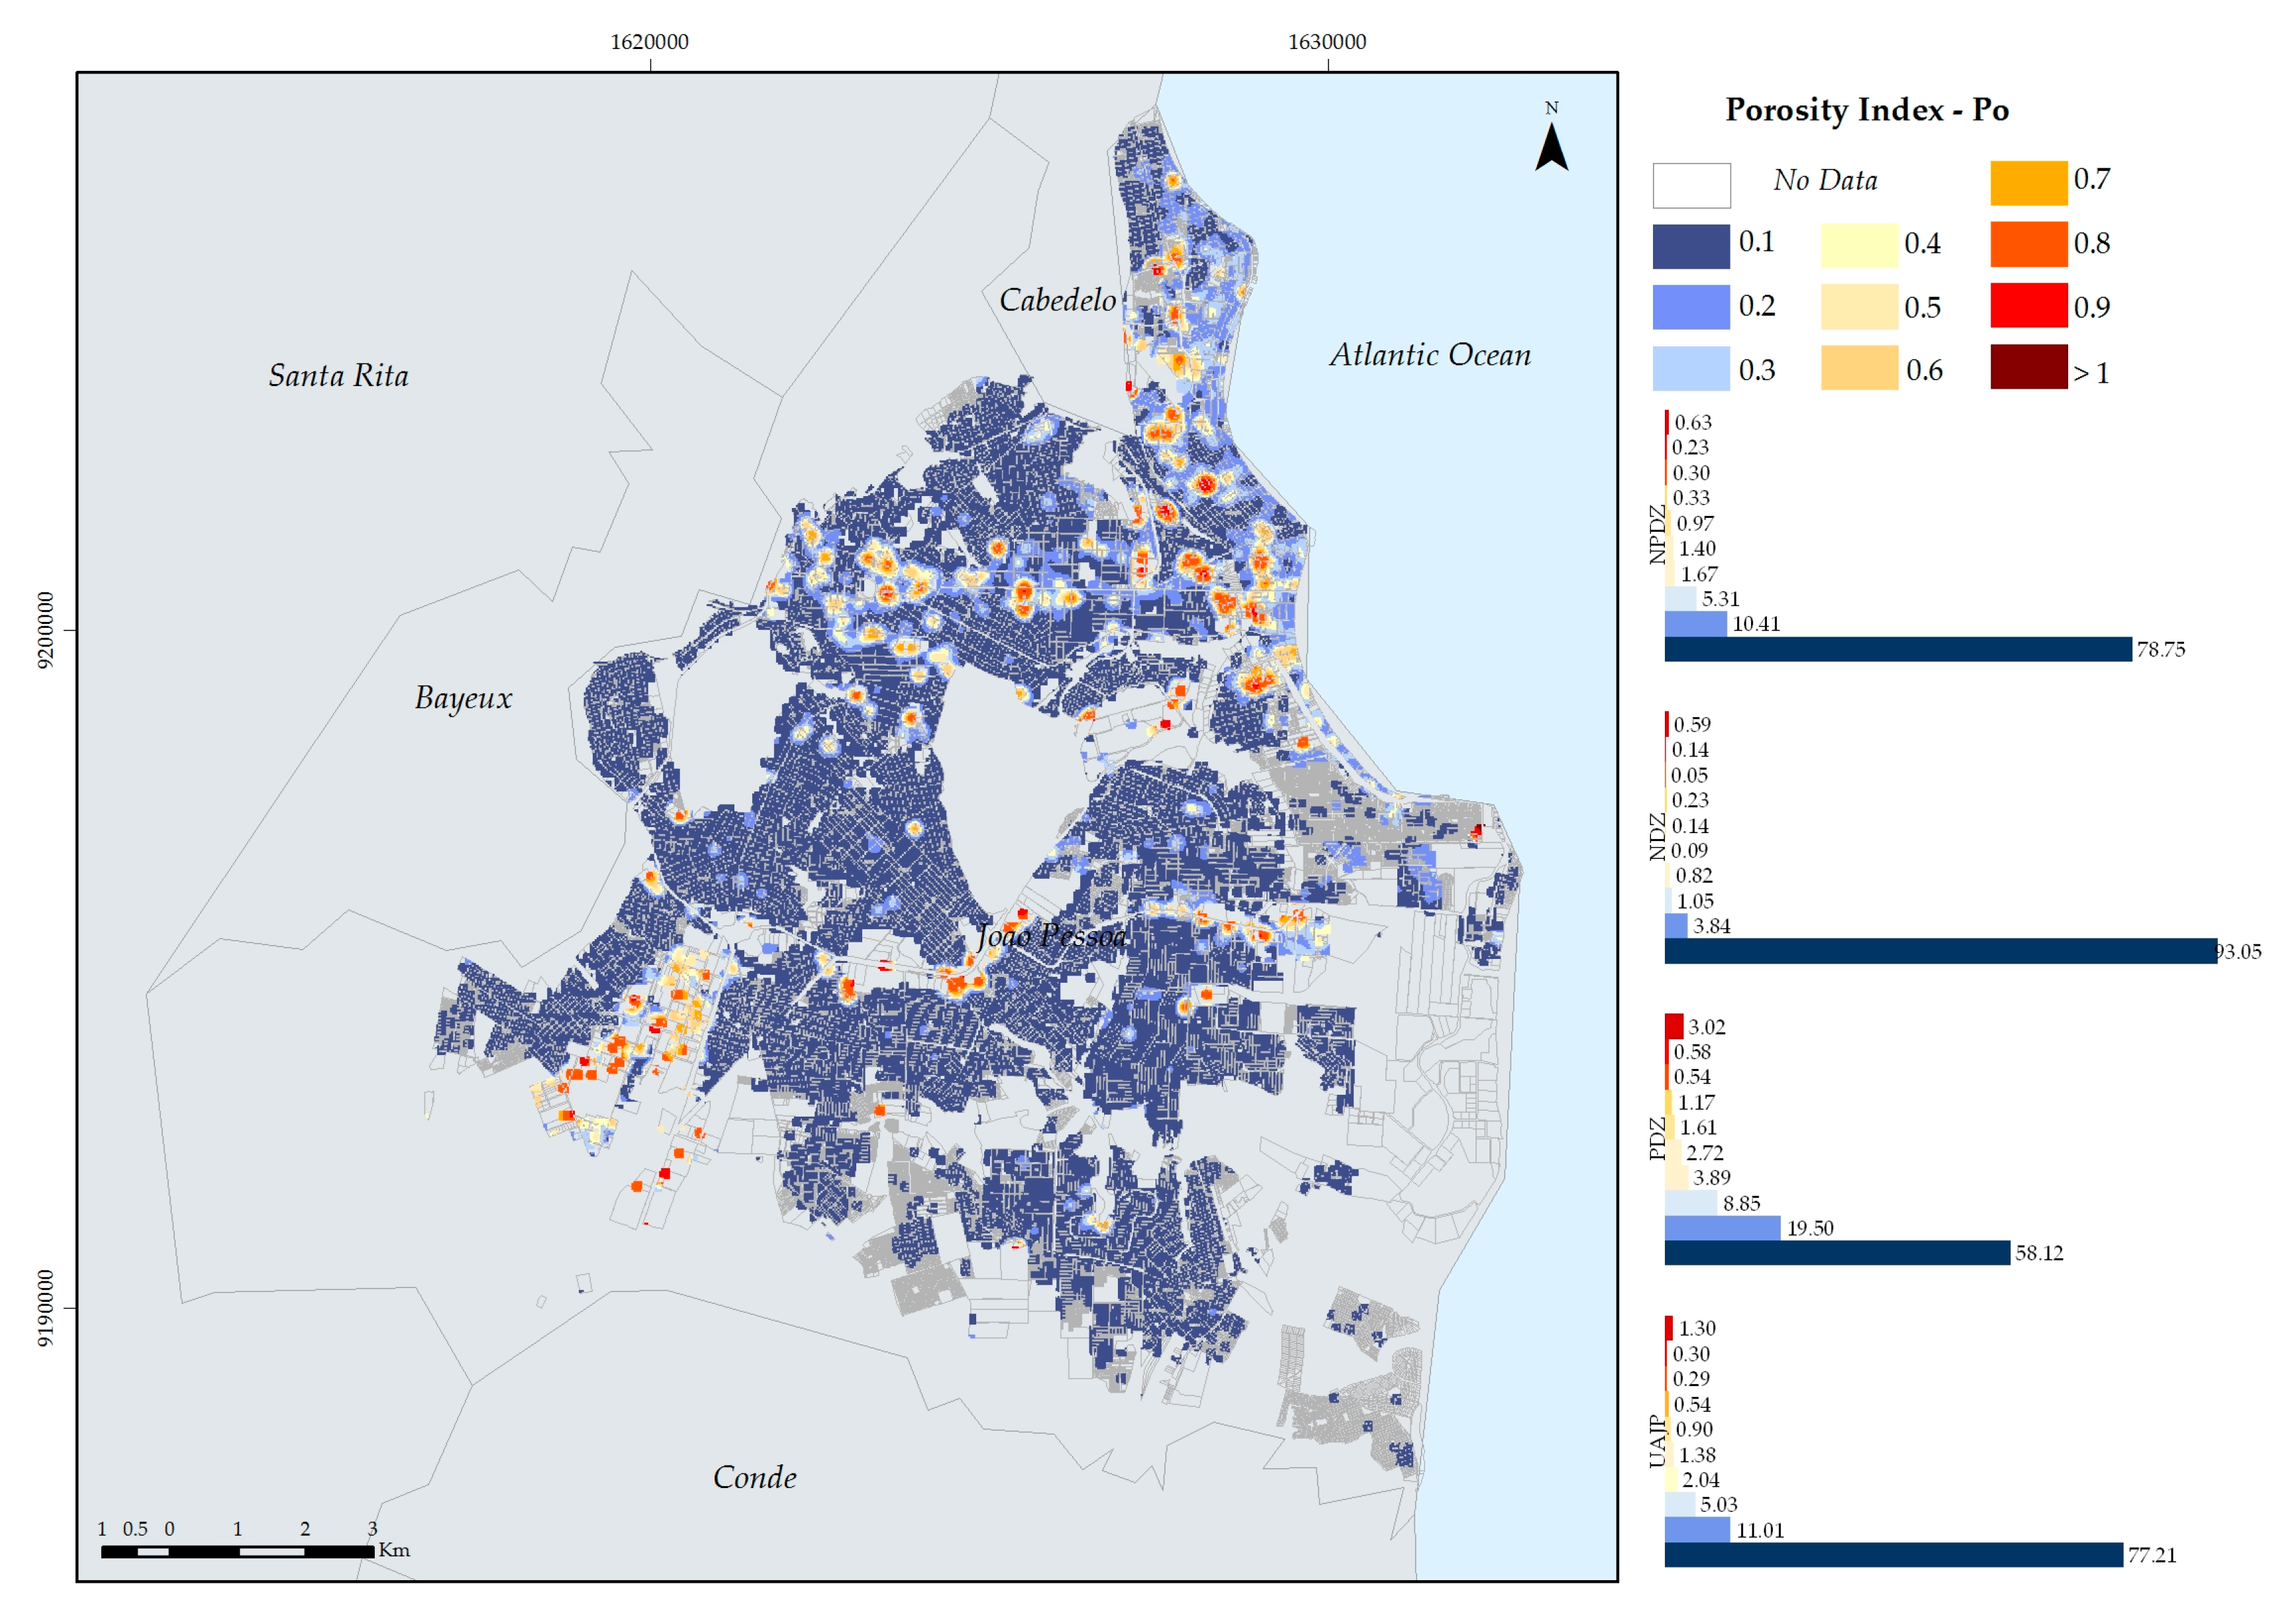
3.6. Porosity Index (Po)
Porosity (Po) was estimated by the grate and cell method, and it was found that it may vary from 0 to 1 as the volume of constructed areas fills the spaces destined for air volume. For João Pessoa, the Po index presented a minimum value on the order of 0.1 and a maximum value of 0.8, characterizing areas where there is less than 20% of space for air circulation and energy exchange between the surfaces and the top of the UCL, given a height of 100 m (
Figure 8).
Porosity is lower in coastal districts (
Figure 8) due to the high impervious surface fractions in such areas, evidencing a large volume of constructed areas. Urban porosity values were around 0.05 in most municipalities. The results indicate the existence of porous urban spaces in the three macrozones. However, values are lower in the densifiable priority zone (
Figure 8), which includes a larger constructed area with urban spaces presenting low air circulation.
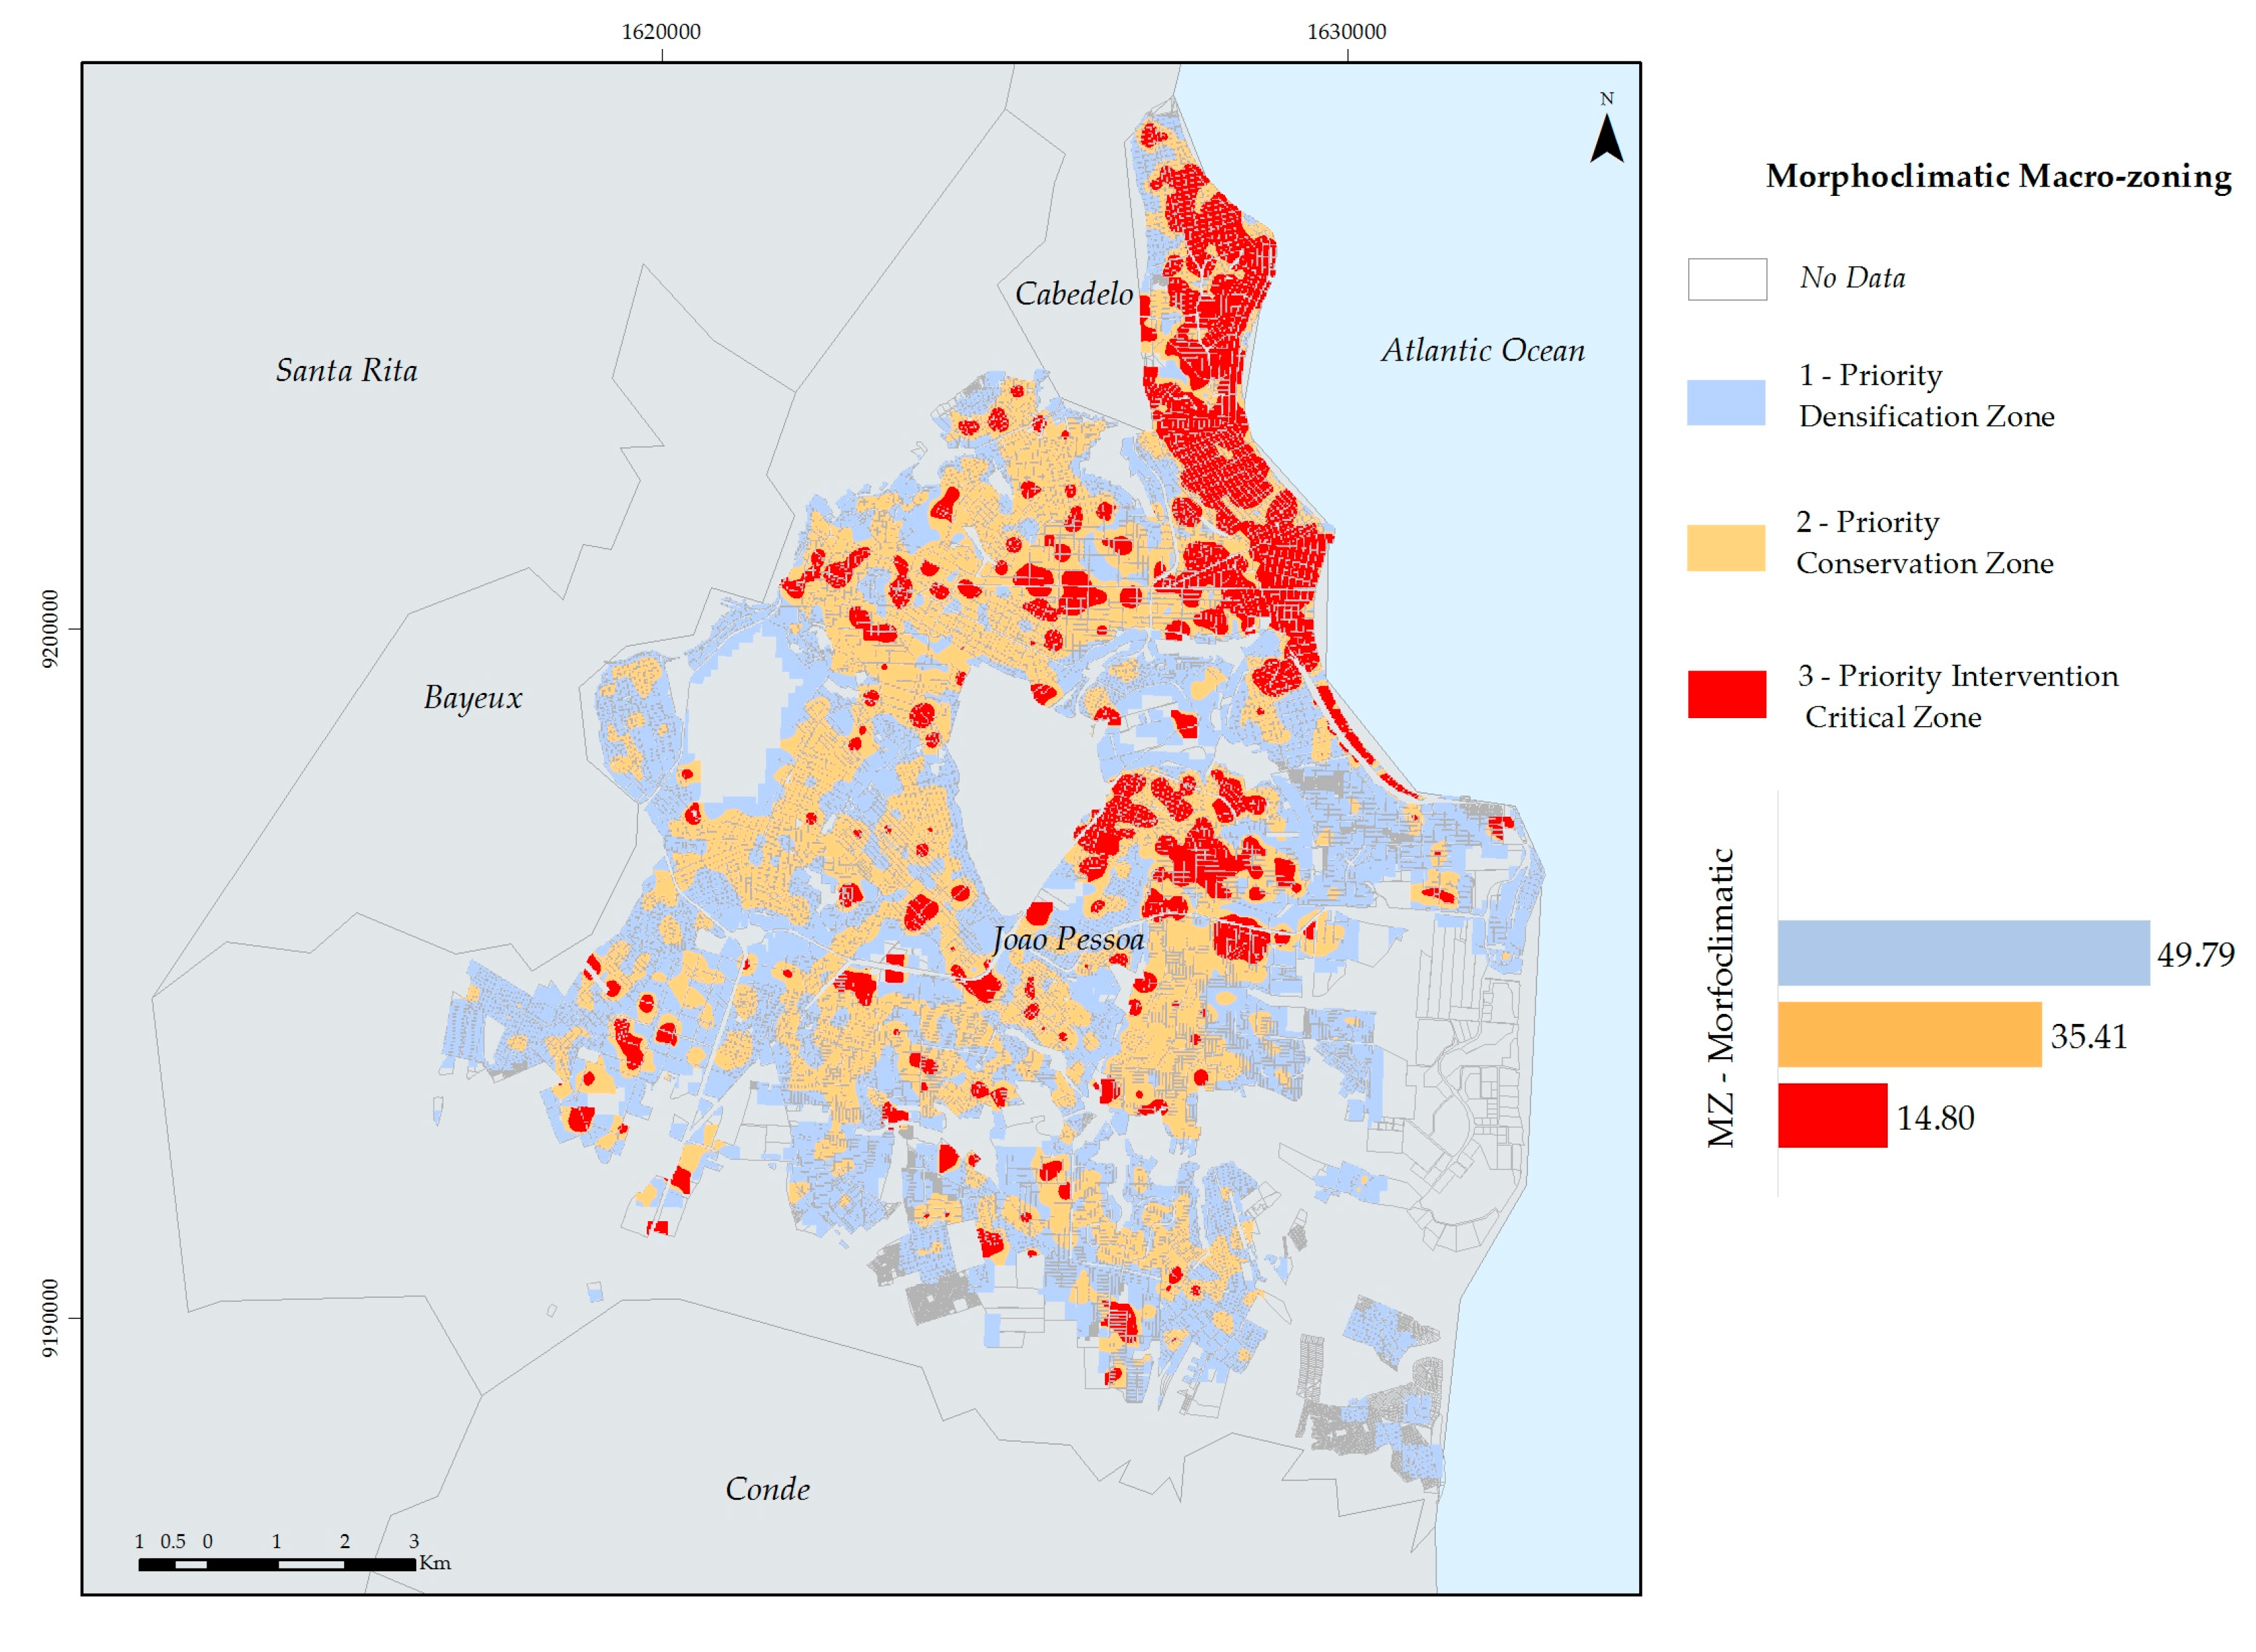
Based on the presented results, it is possible to visualize the areas in which urban planning may act to promote improvements in environmental and health quality, and on the population’s bioclimatic comfort level, based on the urban form analysis. The planner may readily identify the characteristics of the urban spaces and visualize existing problems to make appropriate decisions regarding the planning process. It is possible to link layers between maps to obtain a more precise response and provide guidelines in a simplified way, strengthening the analysis (
Figure 9).
Based on the analysis of urban indicators, the final map shows a new macro-zoning proposal for the city of João Pessoa (
Figure 9). In this stage, we defined three classes for purposes of action on urban planning: critical priority intervention areas with 14.80%, priority conservation areas represent 35.41%, and priority densification areas correspond to 49.79% of the urban space system in João Pessoa.
4. Discussion
The results of the study of morphological indices for the urban spaces of João Pessoa presented a higher concentration in the first classes of the histograms, forming a global analysis of the urban form with low density, impermeability, verticality, roughness, and porosity indices, considering an analysis unit similar to an urban block.
The analysis of the ISF morphological index shows a high distribution with higher frequency in the densifiable priority zone, a characteristic justified by the substantial number of built areas in this zone, followed by the densifiable non-priority and the non-densifiable zones. Thus, it is a city that is not yet wholly verticalized, but presents some districts and zones with density problems. The intensity of use and surface impermeabilization is directly related to the changes in the energy balance through the expansion of the area exposed to solar radiation. Such conditions configure the densifiable priority zone containing the possible areas with high levels of thermal discomfort and more intense heat islands on the surface and air. This scenario is also evident in some areas of the densifiable non-priority zone.
For the indices that control the aerodynamic performance of the airflow, such as Po, Z0, Vt, and H/W ratio, the critical values represent on average less than 10%. Using the cartographies produced, one may verify that the spatialization of the indices presented the highest values along the coastal zone (coastal strip), reflecting in a little expressive value. However, this is where the problems are, and where further studies are required.
The dominant wind regime in João Pessoa, as a fundamental element in heat dispersion, can be compromised in the coastal zone of the city. The direction and speed of the airflow are altered, corroborating to the increase in turbulence and on heat and particle concentration, since verticalization is mainly concentrated in this zone, acting as a wall to the effect of wind progression and its heat and pollutant dissipation function.
We also highlight the potential of vegetation in an urban environment as a regulating element of variables such as temperature and humidity, influencing the energy balance and contributing to reducing local temperatures and air pollution levels. However, vegetation in urban environments also needs to be planned so as not to form another roughness element, acting as a barrier to dominating wind and possibly being a fall risk when inserted along ventilation aisles.
Urban morphology, analyzed in this study through the ISF, BD, Vt, H/W ratio, Z0, and Po, represents an essential part in the definition of current and future spaces in which the urban planner may act with strategies to reduce existing problems and make appropriate decisions regarding the planning process. Such measures may maximize the benefits of well-being in urban areas, as well as promote heat dissipation to maximize thermal comfort in open spaces.
Based on the four urban climatic controls present in the urban space as mentioned in [
2], this study emphasized the urban structure (geometry characteristics) and the urban fabric (physical form, textiles) for delimiting the critical areas of priority intervention, which represent the urban spaces that are occluded, rough, impervious, and with large vertically and horizontally built volumes.
From a morphology viewpoint, urban planning may act to promote improvements to the thermal component through the implementation of blocks of smaller buildings instead of contiguous blocks, so to minimize the areas exposed to direct solar radiation, thus increasing the global radiation (shade effect) and the reflected radiation (short wavelength), to decrease the street-level infrared radiation. At the microscale, we recommend studying the solar trajectory at the building level, which allows better understanding of how the urban shapes modify the thermal component.
As a natural element capable of dissipating heat and pollutants, airflow depends on the presence of rough elements on surfaces and the non-obstruction of ventilation corridors. Therefore, it is necessary that the planners prioritize projects aimed at smaller urban shapes, with regular delimiting geometries and protrusions and recesses, which allow air to circulate among the buildings and not just over them, thus avoiding a juxtaposed spacial occupation. These urban form measures may produce reflexes in the energetic balance, bioclimatic comfort, and energy consumption.
Regarding the effect of the urban fabric, the layout of the road traffic system must be composed of easily navigable streets and trusses. The presence of great continuous blocks reduces the number of intersections and opportunities of interconnection among the open space systems destined for leisure and recreation with the built spaces. On the other hand, the urban fabric must also be analyzed with respect to its porosity, seeing that areas characterized by high buildings with narrow streets, in which the H/W ratio is high, reduce the fraction of visible sky, which in turn alters the radiation balance. Avoiding the increase in the number of floors in buildings and construction in interstitial spaces may be some measures to be promoted.
In principle, the ISF, BD, and Po indicators express the built density near the ground and the level of surface imperviousness. Therefore, it is known that these zones lack the presence of open spaces destined for the presence of urban green, and one may indicate measures such as the prioritization of using green roofs, walls, and pathways. The insertion of tree vegetation throughout the road traffic system is fundamental for the urban environmental quality and bioclimatic comfort. However, this measure must be accompanied by a detailed study of the natural ventilation and of the delimitation of ventilation corridors, since the vegetation also represents a rough surface element which, when disposed in the direction of the dominating southeast wind, may act as a barrier for the progression of airflow or even represent a risk of falling under strong wind conditions.
Critical areas of priority intervention and the priority conservation areas need, in the future, to be analyzed in a way that is integrated with two other controls mentioned in [
2]: urban cover (permeable natural cover) and urban metabolism (anthropic heat production). The analysis of the use and coverage of land using satellite images may represent another relevant tool for urban planning, seeing that industrial and residential uses and natural spaces present different climatic responses. Regarding urban metabolism, this study represents a significant tool in the delimitation of areas to be investigated in microscale details in the future, through local measurements.
5. Conclusions
From a climatic point of view, macro-zoning may not cover the complexity of the relation between urban morphology and climate. Therefore, this adjustment should be made within microzones, such as at a district level, fixing a value for each studied index, determining recommended percentages for the constructed area and vegetation in open spaces.
The urban form characterization model, as support for planning in a GIS environment, was shown, using lines, grids, and cells as analysis units, to be relevant and fundamental in the analysis of extensive urban areas. The cell, as a three-dimensional analysis unit representing a vertical profile from surface elements to the top of the UCL, makes it possible to characterize the effect of urban form with respect to different climatic variables.
Results show that it is possible to calculate the morphological indices efficiently, as well as to insert other types of indices, thus becoming a useful tool for urban planning that may be replicated in any other city depending on data availability, especially for large Brazilian cities that still lack this type of analysis. Nevertheless, given the complexity of the factors that influence local climate, other analyses such as urban fabric, urban cover, and urban metabolism [
2] may be part of a future climatic zoning model for the city.
This study evidenced the spatial variations of the different urban scenarios distributed in the city of João Pessoa. The analysis made it possible to know the urban conditions relevant to the planning process aiming to integrate parameters related to microclimate, and may be used to support urban planners’ decisions.
One may use the characterization of the morphological indices to support other analyses, correlations, and future discussions such as urban density analysis for climatic purposes, delineation of ventilation corridors, energy potential analysis, pollutant dispersion, wind energy potential, and environmental quality at the mesoscale.
There is an urgent need for collecting data through a measuring network of greenhouse gas emissions so they may be confronted with this study’s data, given that this comparison aids in the perception of possible areas with urban morphology problems for heat and pollutant dispersion, thus enabling future studies.
At the microscale, this study represents a guide for future research and interventions in the scope of the analysis of urban thermal comfort using computational simulations with numerical models to verify the thermal sensation of pedestrians in João Pessoa.
Dialogues, lectures, training sessions, and group meetings may be strategically beneficial to initiate this effort and sensitize urban planners of the benefits of introducing this theme into municipal legislation. That may be accomplished by presenting this study to city management with the respective spatial distributions, emphasizing the negative aspects of urban density on the city’s microclimate, as well as sensitizing the planners of this importance as a way to begin an attempt to reduce the gap between planners and researchers.


