Assessment of Field Compaction of Aggregate Base Materials for Permeable Pavements Based on Plate Load Tests


Department of Civil and Environmental Engineering, Pusan National University, Busan 46241, Korea
*
Author to whom correspondence should be addressed.
Sustainability 2018, 10(10), 3817; https://doi.org/10.3390/su10103817
Submission received: 27 September 2018
/
Revised: 12 October 2018
/
Accepted: 16 October 2018
/
Published: 22 October 2018
Abstract
:The permeable pavement is one of Low Impact Development technics that allows stormwater to infiltrate through the pavement surface and the underlying base layer, thereby reducing surface runoff and preventing water contamination. For permeable base layers of permeable pavements, open-graded aggregates are often used to infiltrate and store stormwater in the pore of aggregate base layers. The mechanical behavior of open-graded aggregates has not been a major interest of pavement industry and society, and therefore there is much less information known for behavior of compacted open-graded aggregates comparing to dense-graded materials. This study aims at investigating the mechanical behavior of compacted permeable or open-graded aggregate base materials based on field experiments. Five different open-graded aggregates were selected, and they were compacted in the field up to 12 passes with a 10-ton vibratory compaction roller. The mechanical behaviors of aggregates were evaluated by conducting plate load tests at 2, 4, 8, and 12 passes of roller. For the test conditions considered herein, the strain modulus at the first loading seems to provide more consistent results with respect to aggregate types and level of compaction than other stiffness measures from plate load tests.
1. Introduction
Increase in impervious areas due to urbanization has adversely affected the hydrologic cycle by reducing stormwater infiltration, increasing river peak flows, reducing groundwater baseflow, and increasing urban pollutant inflows into rivers [1,2]. The permeable pavements, one of most widely used Low Impact Development (LID) technics, is considered as an approach to solving this problem [3]. Unlike conventional impervious pavements, permeable pavements have pores that allow stormwater to infiltrate through the pavement surface and the underlying base layer, thereby reducing surface runoff and preventing water contamination [2].
For road pavements, compaction is a key process during construction because it directly affects the stability and durability of the pavement aggregate bases [4]. Therefore, proper compaction quality control (QC) is essential to achieving adequate engineering performance. In permeable pavements, for stormwater infiltration and retention, the base layer is composed of open-graded aggregates with even particle size distributions and large voids between particles unlike conventional (dense-graded) aggregate base materials. Despite the wide application of permeable pavements, reasonable specifications or standards for compaction QC of open-graded aggregate materials do not seem well established. Generally, the compaction quality of pavement base layers is assessed by density in terms of relative compaction, which is defined as the ratio of the field dry density to the maximum dry density [5]. The characteristics of these aggregates are different from those of conventional base materials, and it is difficult to define the maximum dry density and field density using conventional test methods [6,7,8,9,10].
With the recent adoption of the mechanistic-empirical pavement design (MEPDG) method, there have been increasing efforts to monitor compaction quality by evaluating the stiffness or strength of the compacted soil [4,11,12]. Modulus-based compaction QC directly measures the modulus, rather than the density, of the on-site compacted fill. The measured modulus has the advantage of being directly related to structural performance and design parameters. Various tests and devices for measuring modulus have been developed and are currently in use, including the plate load test (PLT) [13,14], light weight deflectometer (LWD) [15], soil stiffness gauge (SSG) [16], and dynamic cone penetrometer [17]. Several related studies using these tests and devices have also been conducted [4,5,12,18,19,20,21,22,23,24,25,26,27]. With these trends, the Interlocking Concrete Pavement Institution (ICPI) [1] and the American Society of Civil Engineers (ASCE) [28] have recommended assessing the compaction quality of permeable base layers using devices such as the LWD and SSG. However, since there are no standards or target modulus values for assuring proper compaction, it is difficult in practice to evaluate the quality of compaction even when these devices are used. Seoul Metropolitan City [29], ICPI [1], and ASCE [28] have suggested specifications based on the number of passes of a vibratory compaction roller, but it is hard to find the basis published for selecting such a number.
Given the challenges of using density-based compaction QC, assessing the compaction quality of pavement base layers by modulus-based methods can provide a valid alternative. However, there have been few studies attempting to elucidate the compaction characteristics of permeable base materials using the modulus values for proper quality control. The main objective of this study is to investigate and understand the mechanical behavior of open-graded aggregates in the field based on PLT, which can provide a valuable input in establishing the methods and specifications for QC of permeable aggregate bases.
2. Permeable Base and Compaction Quality Control
2.1. Permeable Base and Open-Graded Aggregates
The base of a road pavement, which is the layer installed directly below the surface layer, plays the important roles of receiving vehicular loads from the surface layer and supporting the surface layer itself [30]. In addition to these key functions, a permeable base should ensure adequate stormwater infiltration into the underlying pavement layers. Thus, unlike general base layers that are constructed with dense-graded aggregates, permeable bases use open-graded aggregates (Figure 1). In the United States, ASTM No. 57 aggregates are widely adopted for permeable base (choker course) [1,28]. In Korea, for example, Seoul Metropolitan City [29] proposed its own specification of open-graded aggregates bases for the permeable block pavements. Since open-graded aggregates have very uniform particle size distributions, and the fraction of fine particles is negligibly small, the base layers constructed with these aggregates contain large voids among particles. Stormwater infiltrates through or is retained in these voids, thus satisfying the hydrologic requirements of the permeable base.
2.2. Compaction Quality Control and Permeable Base
Compaction of the base layer is a significant process in the construction of permeable pavements and a key step towards achieving the desired engineering performance. Inadequate compaction of the base layer can undermine the stability and durability of the entire pavement [11]. Thus, compaction quality must be properly assessed during the construction of permeable pavements.
The most common criterion for ensuring adequate road base compaction quality is the relative compaction, the ratio of the field dry density to the maximum dry density. However, conventional density-based compaction control is hard to implement for open-graded aggregate bases. During the construction of the base layer, the relative compaction of the compacted lift should meet certain target values. Typically, the maximum dry density is obtained by the Proctor compaction test [6,7] and the field dry density is measured by the techniques such as sand-cone [8], rubber balloon [9], and nuclear density gauge [10] methods. However, because the characteristics of permeable base materials, which is open-graded aggregates, are different from those of typical soils, it is difficult to measure the maximum dry density and the field dry density with these conventional test methods. First, because the particles of open-graded aggregates are very large and uniform, it is difficult to meet the specifications of the Proctor test [6,7]. Moreover, the impact hammer used in the Proctor compaction test often breaks the large particles, and thus changes the specimens [31]. Second, in the sand-cone method, the shape of the test hole cannot be maintained due to the collapse of the aggregate, and sand replacement is not valid because the sand used for filling the test hole enters the voids and pore openings [8]. The rubber balloon test is also highly challenging due to problems with maintaining the shape of the hole, and the rupturing of the rubber due to the sharp edges of the aggregate particles [5,9]. The nuclear density gauge method may also be affected by the gravel and large particles or the large voids in the permeable base, and has not been calibrated for such condition. The safety of radioactive wave is also arguable resulting in implementation and management challenges [5,10,11].
As mentioned in the introduction, modulus-based compaction QC has received increasing attention due to its merits and validity. Because the measurement of field dry density and maximum dry density of open-graded aggregates is challenging, modulus-based compaction QC can make an effective alternative method for monitoring the compaction quality of permeable base layers. However, very few studies have been conducted on the modulus-based compaction QC of permeable base layers. Although some permeable pavement specifications such as those of the ICPI [1] and ASCE [28] have suggested the use of the LWD and SSG to assess compaction quality, there are no specific target modulus values in these specifications to ensure proper compaction. In addition, the ICPI and ASCE [1,28] have proposed at least four passes of a 10-ton vibratory compaction roller as a standard for achieving proper compaction, but, the proposed standards do not elaborate the basis for this specification.
3. Field Test
3.1. Test Materials
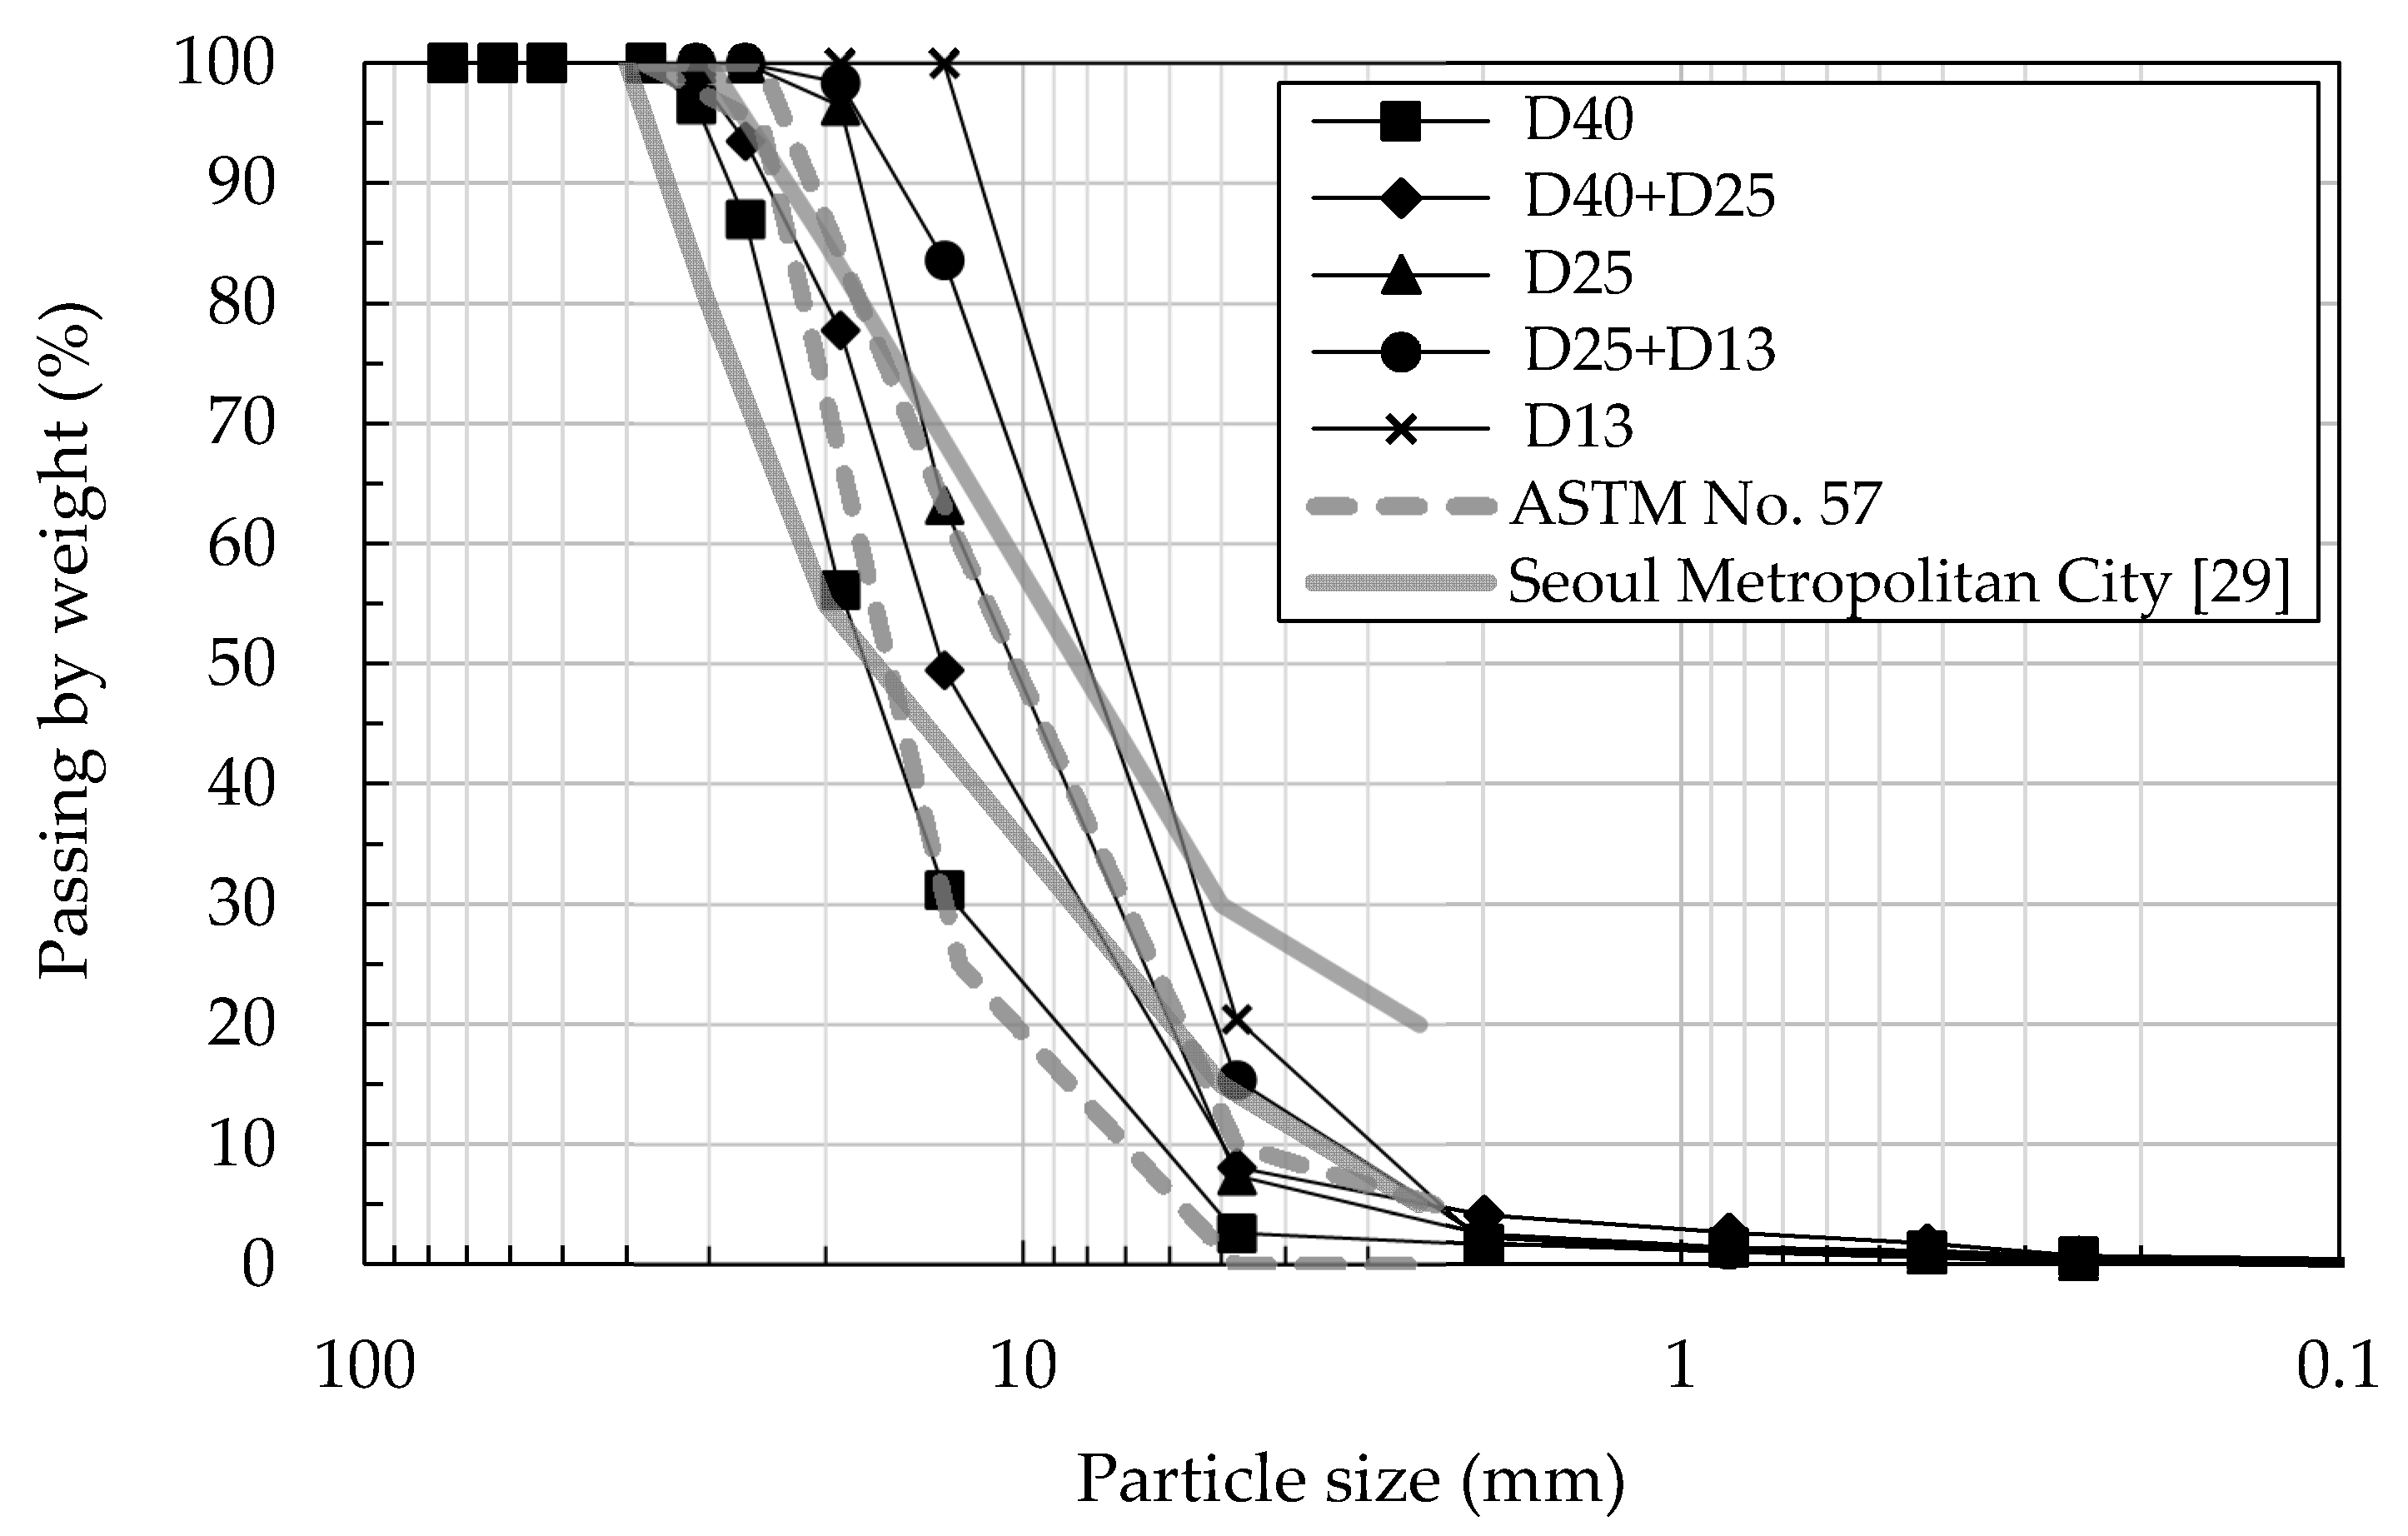
Three types of open-graded aggregates were used in the construction of the permeable base test bed; the maximum particle sizes of these aggregates were 40 mm (D40), 25 mm (D25), and 13 mm (D13), as they are presented in Figure 2. These rhyolite aggregates were brought to the field in air-dried condition two days before the test started. Two additional aggregates, “D40 + D25” and “D25 + D13”, were prepared by mixing their component aggregates in equal proportions by volume. The mixing was conducted by a backhoe excavator, and the volumes of the aggregates were approximated by the excavator bucket. The volumetric compositions, basic properties, and particle size distributions of the five open-graded aggregate test materials are presented in Table 3 and Figure 3. Figure 3 also presents the lower and upper bounds of particle size distribution of two specifications, the ASTM No. 57 and Seoul Metropolitan City [29]. The particle size distribution of D40+D25 was comparable to ASTM No. 57 (the material for choker layer in ICPI [1] and ASCE [28]) and specification of Seoul Metropolitan City [29].
3.2. Test Program
The test program in this study (Table 4) was set for each aggregate material. A 30-cm lift (first lift) was laid and compacted by 12 passes of a 10-ton vibratory compaction roller. After 2, 4, 8, and 12 passes, two (duplicate) PLTs were performed on each compacted aggregate. Another 30-cm lift (second lift) was laid on the first lift, and the previous compaction and PLT sequences were repeated. Thus, a total of 80 cases of PLT (5 materials, 2 lifts, 4 numbers of passes, and 2 tests) were performed. From the PLT results, the strain moduli for the first and second loading cycles (Ev1 and Ev2, respectively) and the modulus of subgrade reaction (defined at 2.5 mm of settlement; k2.5) were obtained.
3.3. Test Bed Construction and Test Procedure
The test bed was constructed at a site on the Yangsan campus of Pusan National University in South Korea. First, the site was excavated as shown in Figure 4. The overall plan dimensions of the excavated area were 3.7 × 20 m with a trapezoidal vertical cross-section, except the excavation for ramp needed for the entry of the construction and testing equipment. After excavation, the test bed was divided into the five sections using rubber partitions to isolate each test material (Figure 5a). The height of the lift (30 cm) was guided by the rubber partitions that has the same height with the lift. The unloaded aggregates were evenly spread with the bucket of the excavator to level the surface (Figure 5b). Thereafter, a 10-ton vibratory roller (Dynapac) was used to compact the aggregates (Figure 5c). The roller operated along the longitudinal direction of the test bed. After the specified number of roller passes (Table 4), the PLTs were performed for each test material to determine the modulus of the compacted lift (Figure 5d). After the tests on the first lift were completed, the second lift was laid on top of the first lift, and the compaction and PLT procedures were repeated.
The PLT was carried out in accordance with DIN 18134 [14] with some modifications considering the prevailing field conditions. In the loading process, a loading plate with a diameter of 30 cm was used without applying seating sand because the surface of aggregates right after compaction was very flat. The excavator was used to deliver the reaction force. The normal stress acting on the plate was measured by reading the hydraulic pressure acting on the hydraulic jack with the pressure measurement dial gauge. Before the test began, a preloading stress (~0.01 MPa) was applied for proper seating of the plate, and the displacement measurement dial gauge was set to zero. The loading cycle (first loading cycle) was applied in eight approximately equally spaced stages up to the planned maximum stress (~0.5 MPa); then, the load was reduced to 50% and 25% of the maximum stress successively, and finally back to the preloading stress. The reloading cycle (second loading cycle) was the same as the first loading cycle, but the last loading stage (the 8th stage) was not applied following the DIN 18134 [14]. The magnitude of preloading and maximum stresses varied slightly among tests accommodating equipment and field conditions. The test locations were offset from each other to minimize interference among the PLT measurements (Figure 6). The location of PLT in each aggregate bed is illustrated in Figure 6; the numbers 2, 4, 8, and 12 represent the number of roller passes, and the symbol “a” and “b” represent the first and second tests. Additional PLTs were also conducted on the subgrade by the test bed.
4. Results and Discussion
4.1. Modulus Calculation
The values of the strain modulus at the first loading Ev1 and the strain modulus at the second loading Ev2 were calculated based on the process specified in DIN 18134 [14]. The calculation method uses a second-order polynomial regression analysis to determine the stress–settlement curve for the first and second loading cycles. The determined curve is expressed by the following equation:
where is the settlement of the plate (mm), is the normal stress below the plate (MPa), , , and is the constant determined from second-order polynomial regression analysis (mm, mm/MPa, and mm/(MPa)2, respectively). The determined curves and constants are illustrated with the test results shown in Figure 7. In Figure 7, “a” and “b” represent the duplicate of the tests (Figure 6). The values of Ev1 and Ev2 were determined from the first and second regression curves, respectively, as follows:
where is the strain modulus (MPa), is the radius of the plate (mm), is the maximum normal stress below the plate (MPa).
For the calculation of the modulus of subgrade reaction at 2.5-mm displacement (k2.5), the average slope between the displacement of 0 and 2.5 mm on the regression curve of the first loading cycle (Figure 7) was used. The following is the equation for calculating k2.5:
where is the difference between the preloading stress and the stress corresponding to 2.5-mm displacement and is the displacement (therefore, 2.5 mm or 0.0025 m).
4.2. Relationship Between Roller Pass and Modulus
Figure 8 summarizes the changes in Ev1, Ev2, k2.5 and Ev1/Ev2 for the successive roller passes at which the PLTs were conducted. Each point in Figure 8 is the average of two test results (duplicate). The values of Ev1, Ev2, and k2.5 steeply increase up to four roller passes for most of the test materials and lifts. It is clear that Ev1 keeps increasing as the number of passes raises after four passes but with declined trends. Ev2 and k2.5 seem to somewhat reflect the change in materials with increasing number of passes, but they are not as sensitive or consistent to the number of passes as Ev1. It is noted that Ev2 is the strain modulus during reloading process and the material may be compressed and become denser during the first loading cycle, making Ev2 the consequence of the first loading rather than the measure of roller compaction. k2.5 is the stiffness measure of the aggregate at relative smaller strain level than Ev1, so that the effect of increased compaction level on highly nonlinear material may not be captured well by k2.5. From Figure 8a–c, it can be found that the minimum of four roller passes recommended by the ICPI and ASCE [1,28] is an efficient one, but one can expect hardening of the open-graded materials for larger number of roller passes than four.
The underlying subgrade layer could affect the results of PLTs, and the values of Ev1, Ev2 and k2.5 of subgrade were 69 MPa, 196 MPa, and 143 MPa/m, higher than those of all open-graded aggregates. Because the subgrade has a considerably higher stiffness than the permeable base layers, the Ev1 values of the first lift, built directly on the subgrade, are slightly higher than those of the second lift for most cases (Figure 8a), but certainly not significant. These differences are not captured by other modulus measures such as Ev2 and k2.5.
The strain modulus at reloading cycle (Ev2) showed high dependency on the material type. The permeable base layers composed of large particles at the lowest compaction level, in some cases, has higher Ev2 than the smaller particles at the highest compaction level. For example, D13 with 12 passes showed considerably lower Ev2 than D25 with 2 passes (Figure 8b). These results indicate that the selection of materials is very important, and the level of compaction does not compensate the mis-selection of the materials.
When the values of Ev1 of open-graded aggregates are compared to those of conventional (densely-graded) ground materials in literature (Table 1), Ev1 of open-graded aggregates are smaller than those of dense-graded materials with similar particle sizes (gravel), but rather close to those of dense-graded materials with smaller sizes (sand and clay). The values of Ev2 are, however, closer to densely-graded gravel materials rather than the densely-graded sand or clay. As such, more permanent deformation is expected in open-graded aggregates than in dense-graded aggregates, but the resilient deformation may be similar for these materials. When they are compared to the requirements in German [32] and Korean [33] guides, all the materials tested meet the requirement for Ev2 but not for Ev2/Ev1 and k2.5. This would be partially because the current requirements are setup focusing on dense-graded materials. For open-graded aggregates, it will be necessary to develop more suitable requirements for QC.
4.3. Relationship Between Materials and Modulus
The results in Figure 8 are reorganized in Figure 9 to present better the differences among materials. The values of Ev1 are higher for larger size of particles with a few variations (Figure 9a). The D13 sample, the smallest particles among the investigated, has the lowest values of Ev1, Ev2, and k2.5 for most cases. The values of Ev2 are mostly within a band of 80~130 MPa. The values of k2.5 do not seem consistent, possibly because they represent the slope of stress and displacement at very narrow range of displacement (2.5 mm).
4.4. Variations Between Modulus Measurements
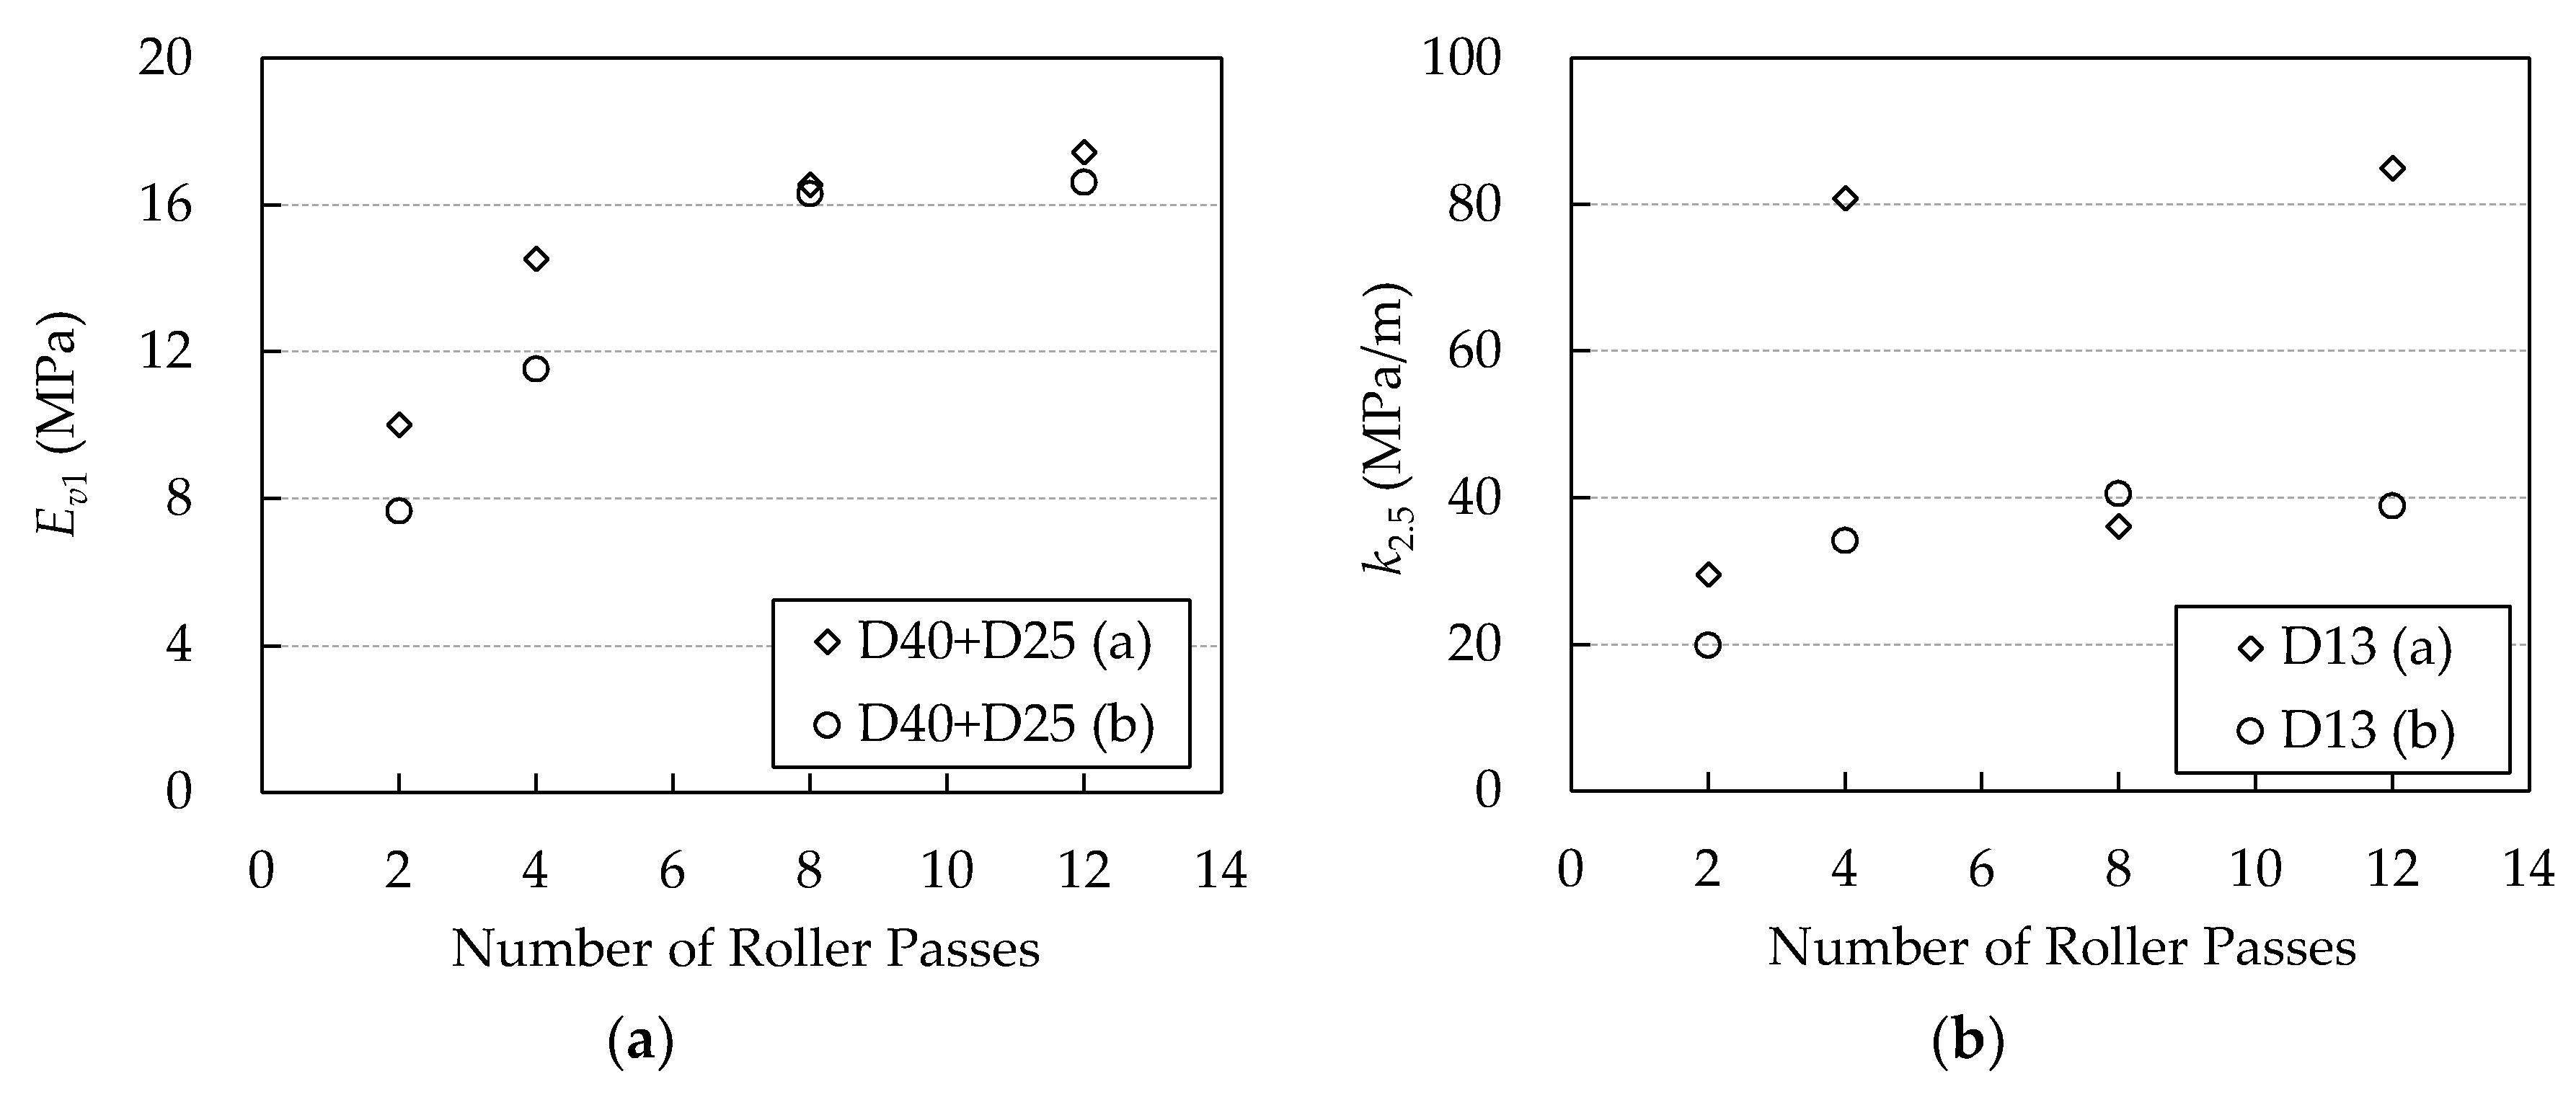
Figure 10 shows the examples of the modulus values obtained before averaging the measurements at two locations “a” and “b”. It can be found that Ev1, which measures slope of stress and displacement up to the maximum stress, presents more consistent results comparing to k2.5 that uses smaller portion of the stress-displacement curve (Figure 7). For dense-graded materials, this gap may be less significant; for open-graded materials that undergoes considerable amount of displacement, Ev1 and Ev2 give more consistent results. Table 5 summarized the variations of duplicate measurements for all the tests conducted, and for open-graded aggregates, Ev1 and Ev2 would be a more reliable measure for QC than k2.5.
5. Conclusions
The mechanical behavior of open-graded aggregates has not been a major interest of pavement industry and society, and therefore there is no much information available for behavior of compacted open-graded aggregates. Sets of PLTs have conducted to investigate the mechanical behavior of compacted permeable or open-graded aggregates. Based on the test results, the following findings were made:
- The values of Ev1, Ev2, and k2.5 steeply increased up to four roller passes for most of the test materials and lifts considered here. Ev1 clearly keeps increasing as the number of passes raises after four passes but with declined trends. The minimum of four roller passes recommended by the ICPI and ASCE [1,28] is efficient, but one can expect hardening of the open-graded materials for larger number of roller passes than four.
- The strain modulus at the second loading cycle (Ev2) showed high dependency on the material type. Large particles at the lowest compaction level, in some cases, had higher Ev2 than the smaller particles at the highest compaction level. The selection of materials is very important, and the level of compaction does not compensate the mis-selection of the materials.
- For open-graded aggregates that undergoes large deformation during PLT, the strain modulus Ev1 and Ev2 measures much wider range of stress and displacement than k2.5. As such, Ev1 and Ev2 give more consistent results. For open-graded aggregates, Ev1 and Ev2 would make a more reliable measure for QC than k2.5.
- When the results are compared to the requirements in German and Korean guides, all the materials tested meet the requirement for Ev2 but not for Ev2/Ev1 and k2.5. This would be partially because the current requirements are setup focusing on dense-graded materials. It will be necessary to develop more suitable QC requirements for the open-graded aggregate base.
Author Contributions
Conceptualization and methodology Y.-J.C., D.A., and J.A.; Validation, Y.-J.C., T.H.N., D.A., and J.A.; Formal Analysis, Y.-J.C.; Investigation, Y.-J.C. and J.A.; Resources, J.A.; Data Curation, Y.-J.C.; Writing—Original Draft, Y.-J.C.; Writing—Review & Editing, J.A.; Visualization, Y.-J.C.; Supervision, J.A.; Project Administration, J.A.; Funding Acquisition, J.A.
Funding
This research was supported by a grant from the Technology Advancement Research Program (grant No. 18CTAP-C132363-02) funded by the Ministry of Land, Infrastructure, and Transport of the Korean government.
Acknowledgments
The authors would like to thank the Ministry of Land, Infrastructure, and Transport of Korean government for the grant from Technology Advancement Research Program (grant No. 18CTAP-C132363-02).
Conflicts of Interest
The authors declare no conflict of interest.
References
- Smith, D.R. Permeable Interlocking Concrete Pavements, 4th ed.; Interlocking Concrete Pavement Istitute: Herndon, VA, USA, 2011; ISBN 978-1-4507-8440-5. [Google Scholar]
- Brattebo, B.O.; Booth, D.B. Long-term stormwater quantity and quality performance of permeable pavement systems. Water Res. 2003, 37, 4369–4376. [Google Scholar] [CrossRef]
- Kumar, K.; Kozak, J.; Hundal, L.; Cox, A.; Zhang, H.; Granato, T. In-Situ infiltration performance of different permeable pavements in a employee used parking lot—A four-year study. J. Environ. Manag. 2016, 167, 8–14. [Google Scholar] [CrossRef] [PubMed]
- Abu-Farsakh, M.; Alshibli, K.A.; Nazzal, M.; Seyman, E. Assessment of In-Situ Test Technology for Construction Control of Base Courses and Embankments; FHWA/LA.041389; Louisiana Transportation Research Center: Boton Rouge, LA, USA, 2004. [Google Scholar]
- Berney, E.S., IV; Mejias-Santiago, M.; Kyzar, J.D. Non-Nuclear Alternatives to Monitoring Moisture-Density Response in Soils; ERDC/GSL TR-13-6; U.S. Army Engineer Research and Development Center Geotechnical and Structures Laboratory: Vicksburg, MS, USA, 2013. [Google Scholar]
- ASTM International. Standard Test Methods for Laboratory Compaction Characteristics of Soil Using Modified Effort (56,000 ft-lbf/ft3 (2700 kN-m/m3)); ASTM D1557; ASTM International: West Conshohocken, PA, USA, 2012. [Google Scholar]
- ASTM International. Standard Test Methods for Laboratory Compaction Characteristics of Soil Using Standard Effort (12,400 ft-lbf/ft3 (600 kN-m/m3)); ASTM D698; ASTM International: West Conshohocken, PA, USA, 2012. [Google Scholar]
- ASTM International. Standard Test Method for Density and Unit Weight of Soil in Place by Sand-Cone Method; ASTM D1556/D1556M; ASTM International: West Conshohocken, PA, USA, 2015. [Google Scholar]
- ASTM International. Standard Test Method for Density and Unit Weight of Soil in Place by the Rubber Balloon Method; ASTM D2167; ASTM International: West Conshohocken, PA, USA, 2015. [Google Scholar]
- ASTM International. Standard Test Methods for In-Place Density and Water Content of Soil and Soil-Aggregate by Nuclear Methods (Shallow depth); ASTM D6938 REV A; ASTM International: West Conshohocken, PA, USA, 2017. [Google Scholar]
- Nazzal, M. Non-Nuclear Methods for Compaction Control of Unbound Materials; National Cooperative Highway Research Program Synthesis 456; Transportation Research Board: Washington, DC, USA, 2014. [Google Scholar]
- Meehan, C.L.; Tehrani, F.S.; Vahedifard, F. A comparison of density-based and modulus-based in situ test measurements for compaction control. Geotech. Test. J. 2012, 35, 387–399. [Google Scholar] [CrossRef]
- ASTM International. Standard Test Method for Repetitive Static Plate Load Tests of Soils and Flexible Pavement Components, for Use in Evaluation and Design of Airport and Highway Pavements; ASTM D1195/D1195M; ASTM International: West Conshohocken, PA, USA, 2009. [Google Scholar]
- Deutsches Institut fur Normung E.V. Soil—Testing Procedures and Testing Equipment—Plate Load Test; DIN 18134; Deutsches Institut fur Normung E.V.: Berlin, Germany, 2012. [Google Scholar]
- ASTM International. Standard Test Method for Measuring Deflections Using a Portable Impulse Plate Load Test Device; ASTM E2835; ASTM International: West Conshohocken, PA, USA, 2011. [Google Scholar]
- ASTM International. Standard Test Method for Measuring Stiffness and Apparent Modulus of Soil and Soil-Aggregate In-Place by Electro-Mechanical Method; ASTM D6758; ASTM International: West Conshohocken, PA, USA, 2018. [Google Scholar]
- ASTM International. Standard Test Method for Use of the Dynamic Cone Penetrometer in Shallow Pavement Applications; ASTM D6951/D6951M; ASTM International: West Conshohocken, PA, USA, 2018. [Google Scholar]
- Kim, D.; Park, S. Relationship between the subgrade reaction modulus and the strain modulus obtained using a plate loading test. In Proceedings of the 9th World Congress on Railway Research, Lille, France, 22–26 May 2011. [Google Scholar]
- Alshibli, K.A.; Abu-Farsakh, M.; Seyman, E. Laboratory evaluation of the geogauge and light falling weight deflectometer as construction control tools. J. Mater. Civ. Eng. 2005, 17, 560–569. [Google Scholar] [CrossRef]
- Hufenus, R.; Rueegger, R.; Banjac, R.; Mayor, P.; Springman, S.M.; Bronnimann, R. Full-scale field tests on geosynthetic reinforced unpaved roads on soft subgrade. Geotext. Geomembr. 2006, 24, 21–37. [Google Scholar] [CrossRef]
- Jimenez, J.R.; Ayuso, J.; Agrela, F.; Lopez, M.; Galvin, A.P. Utilisation of unbound recycled aggregates from selected CDW in unpaved rural roads. Resour. Conserv. Recycl. 2012, 58, 88–97. [Google Scholar] [CrossRef]
- Sulewska, M.J. The control of soil compaction degree by means of LFWD. Balt. J. Road Bridge Eng. 2012, 7, 36–41. [Google Scholar] [CrossRef]
- Umashankar, B.; Hariprasad, C.; Kumar, G.T. Compaction quality control of pavement layers using LWD. J. Mater. Civ. Eng. 2016, 28. [Google Scholar] [CrossRef]
- Wersall, C.; Nordfelt, I.; Larsson, S. Resonant roller compaction of gravel in full-scale tests. Transp. Geotech. 2018, 14, 93–97. [Google Scholar] [CrossRef]
- Lenke, L.R.; McKeen, R.G.; Grush, M. Evaluation of a Mechanical Stiffness Gauge for Compaction Control of Granular Media; NM99MSC-07.2; New Mexico State Highway & Transportation Department: Albuquerque, NM, USA, 2001. [Google Scholar]
- Maher, A.; Bennert, T.; Gucunski, N. Evaluation of the Humboldt Stiffness Gauge; FHWA-NJ-2002-002; New Jersey Department of Transportation: Trenton, NJ, USA, 2002. [Google Scholar]
- Wiman, L.G. Accelerated Load Testing of Pavements: HVS-NORDIC Tests at VTI Sweden 2003–2004; VTI rapport 544A; Swedish National Road and Transport Research Institute: Linköping, Sweden, 2006. [Google Scholar]
- Eisenberg, B.E.; Lindow, K.C.; Smith, D.R. Permeable Pavements, 1st ed.; American Society of Civil Engineers: Reston, VA, USA, 2015; ISBN 978-0-7844-7867-7. [Google Scholar]
- Seoul Metropolitan City. Design, Construction and Maintenance Standards of Permeable Block Pavement; Ver. 2.0; Seoul Metropolitan City: Seoul, Korea, 2013. [Google Scholar]
- AASHTO. AASHTO Guide for Design of Pavement Structures; AASHTO: Washington, DC, USA, 1993; Volume 1, ISBN 1-56051-055-2. [Google Scholar]
- Cetin, A.; Kaya, Z.; Cetin, B.; Aydilek, A.H. Influence of laboratory compaction method on mechanical and hydraulic characteristics of unbound granular base materials. Road Mater. Pavement Des. 2014, 15, 220–235. [Google Scholar] [CrossRef]
- Kim, D.; Choi, C.; Kim, S.J.; Yu, J.Y.; Yang, S.C. Study on the subgrade reaction modulus (K30) and strain modulus (Ev). J. Korean Soc. Railw. 2007, 10, 264–270. [Google Scholar]
- Research Society of Road and Traffic. Additional Technical Contractual Conditions and Guidelines for Earthwork in Road Construction and Technical Testing Instructions for Soil and Rock in Road Construction; ZTVE-StB 94; Research Society of Road and Traffic: Koln, Germnay, 1994. [Google Scholar]
- Ministry of Land, Infrastructure and Transport. Standard Specification for Road Construction; Ministry of Land, Infrastructure and Transport: Sejong, Korea, 2015.
- Deutsches Institut fur Normung E.V. Earthworks and Foundations—Soil Classification for Civil Engineering Purposes; DIN 18196; Deutsches Institut fur Normung E.V.: Berlin, Germany, 2011. [Google Scholar]
Figure 1.
Conceptual illustration of pavement base materials; (a) Open-graded aggregates; (b) Dense-graded aggregates.
Figure 1.
Conceptual illustration of pavement base materials; (a) Open-graded aggregates; (b) Dense-graded aggregates.
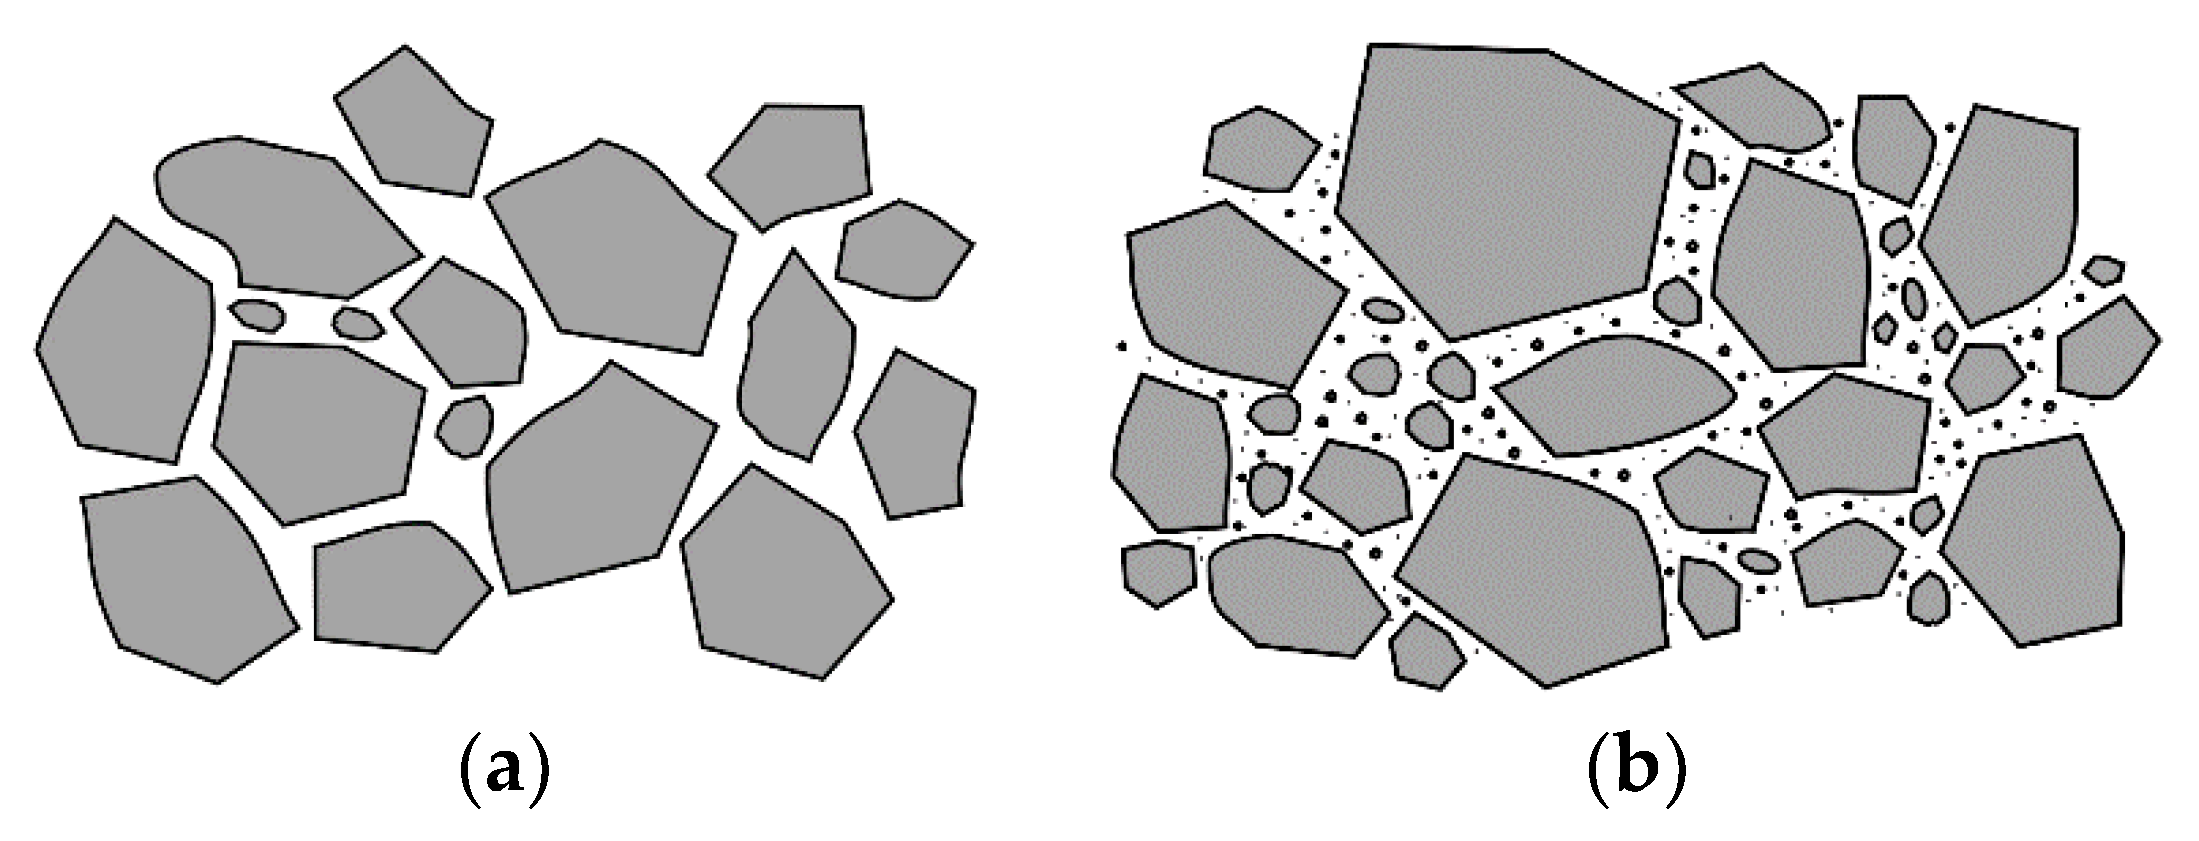
Figure 2.
Three types of open-graded aggregates used to construct the test bed. The maximum particle sizes are: (a) 40 mm (D40); (b) 25 mm (D25); (c) 13 mm (D13).
Figure 2.
Three types of open-graded aggregates used to construct the test bed. The maximum particle sizes are: (a) 40 mm (D40); (b) 25 mm (D25); (c) 13 mm (D13).
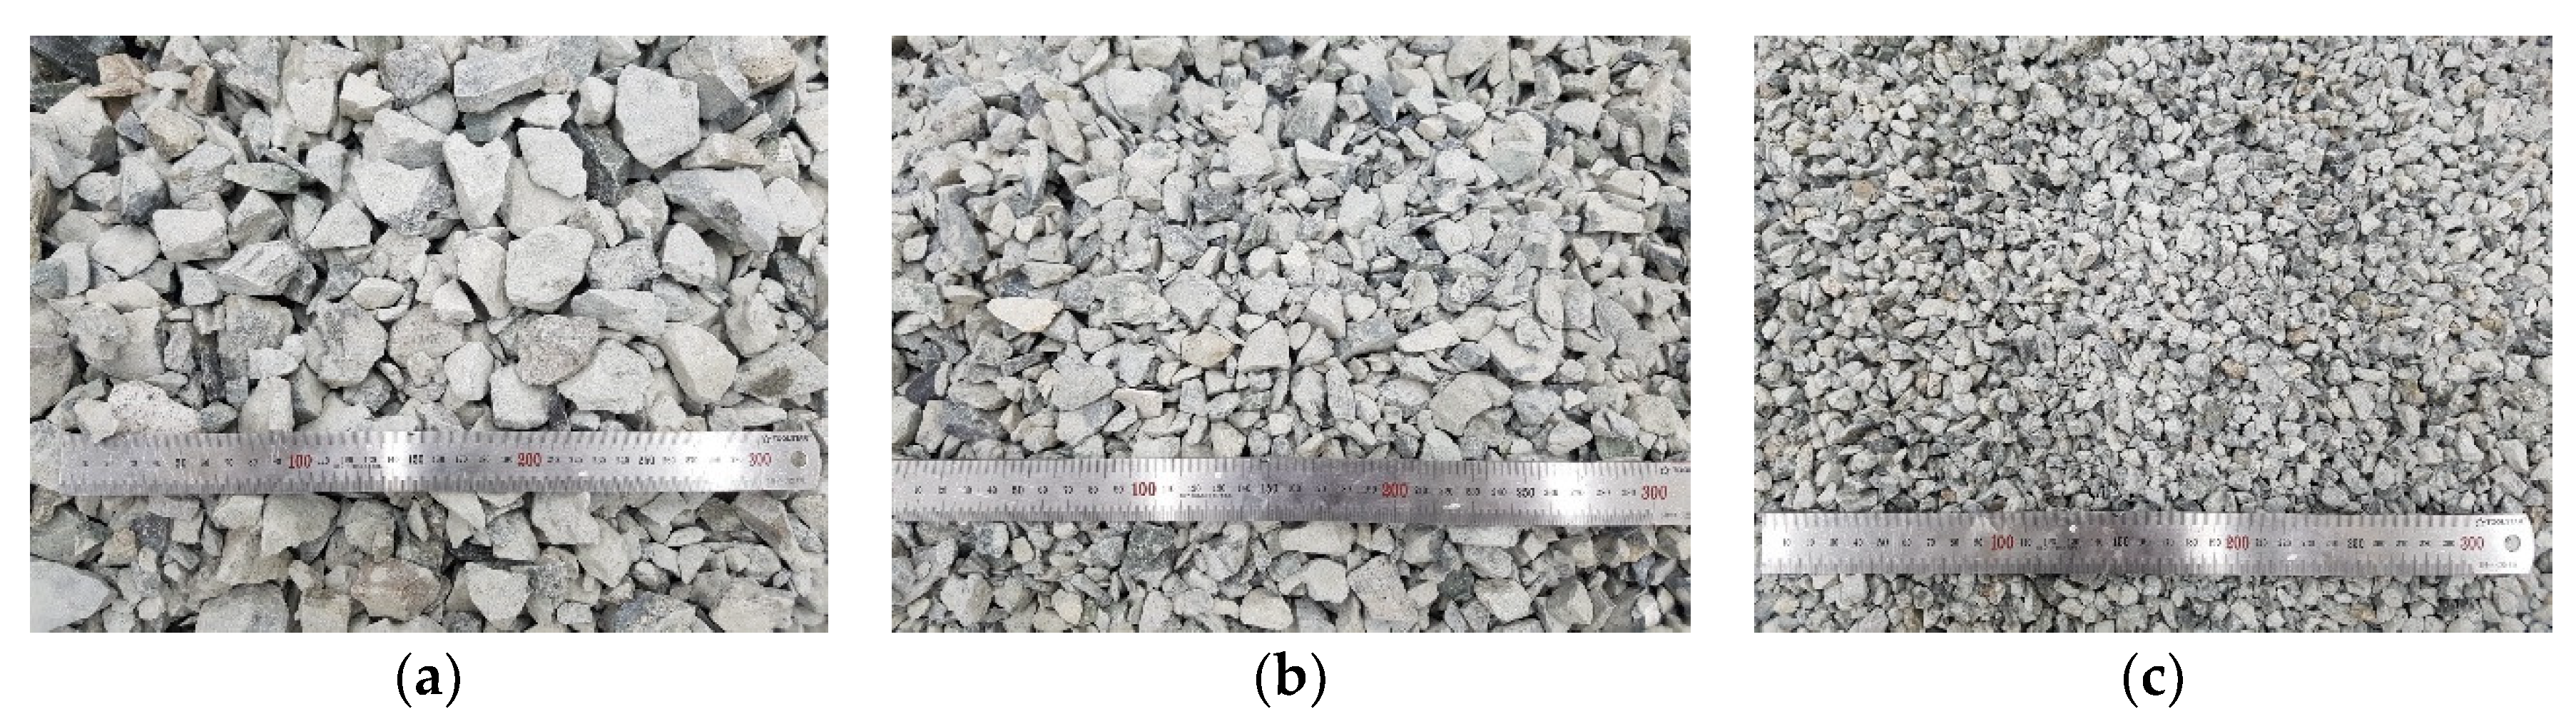
Figure 3.
Particle size distribution of test materials and specifications.

Figure 4.
Test bed layout: (a) Cross-sectional view; (b) Plan view.
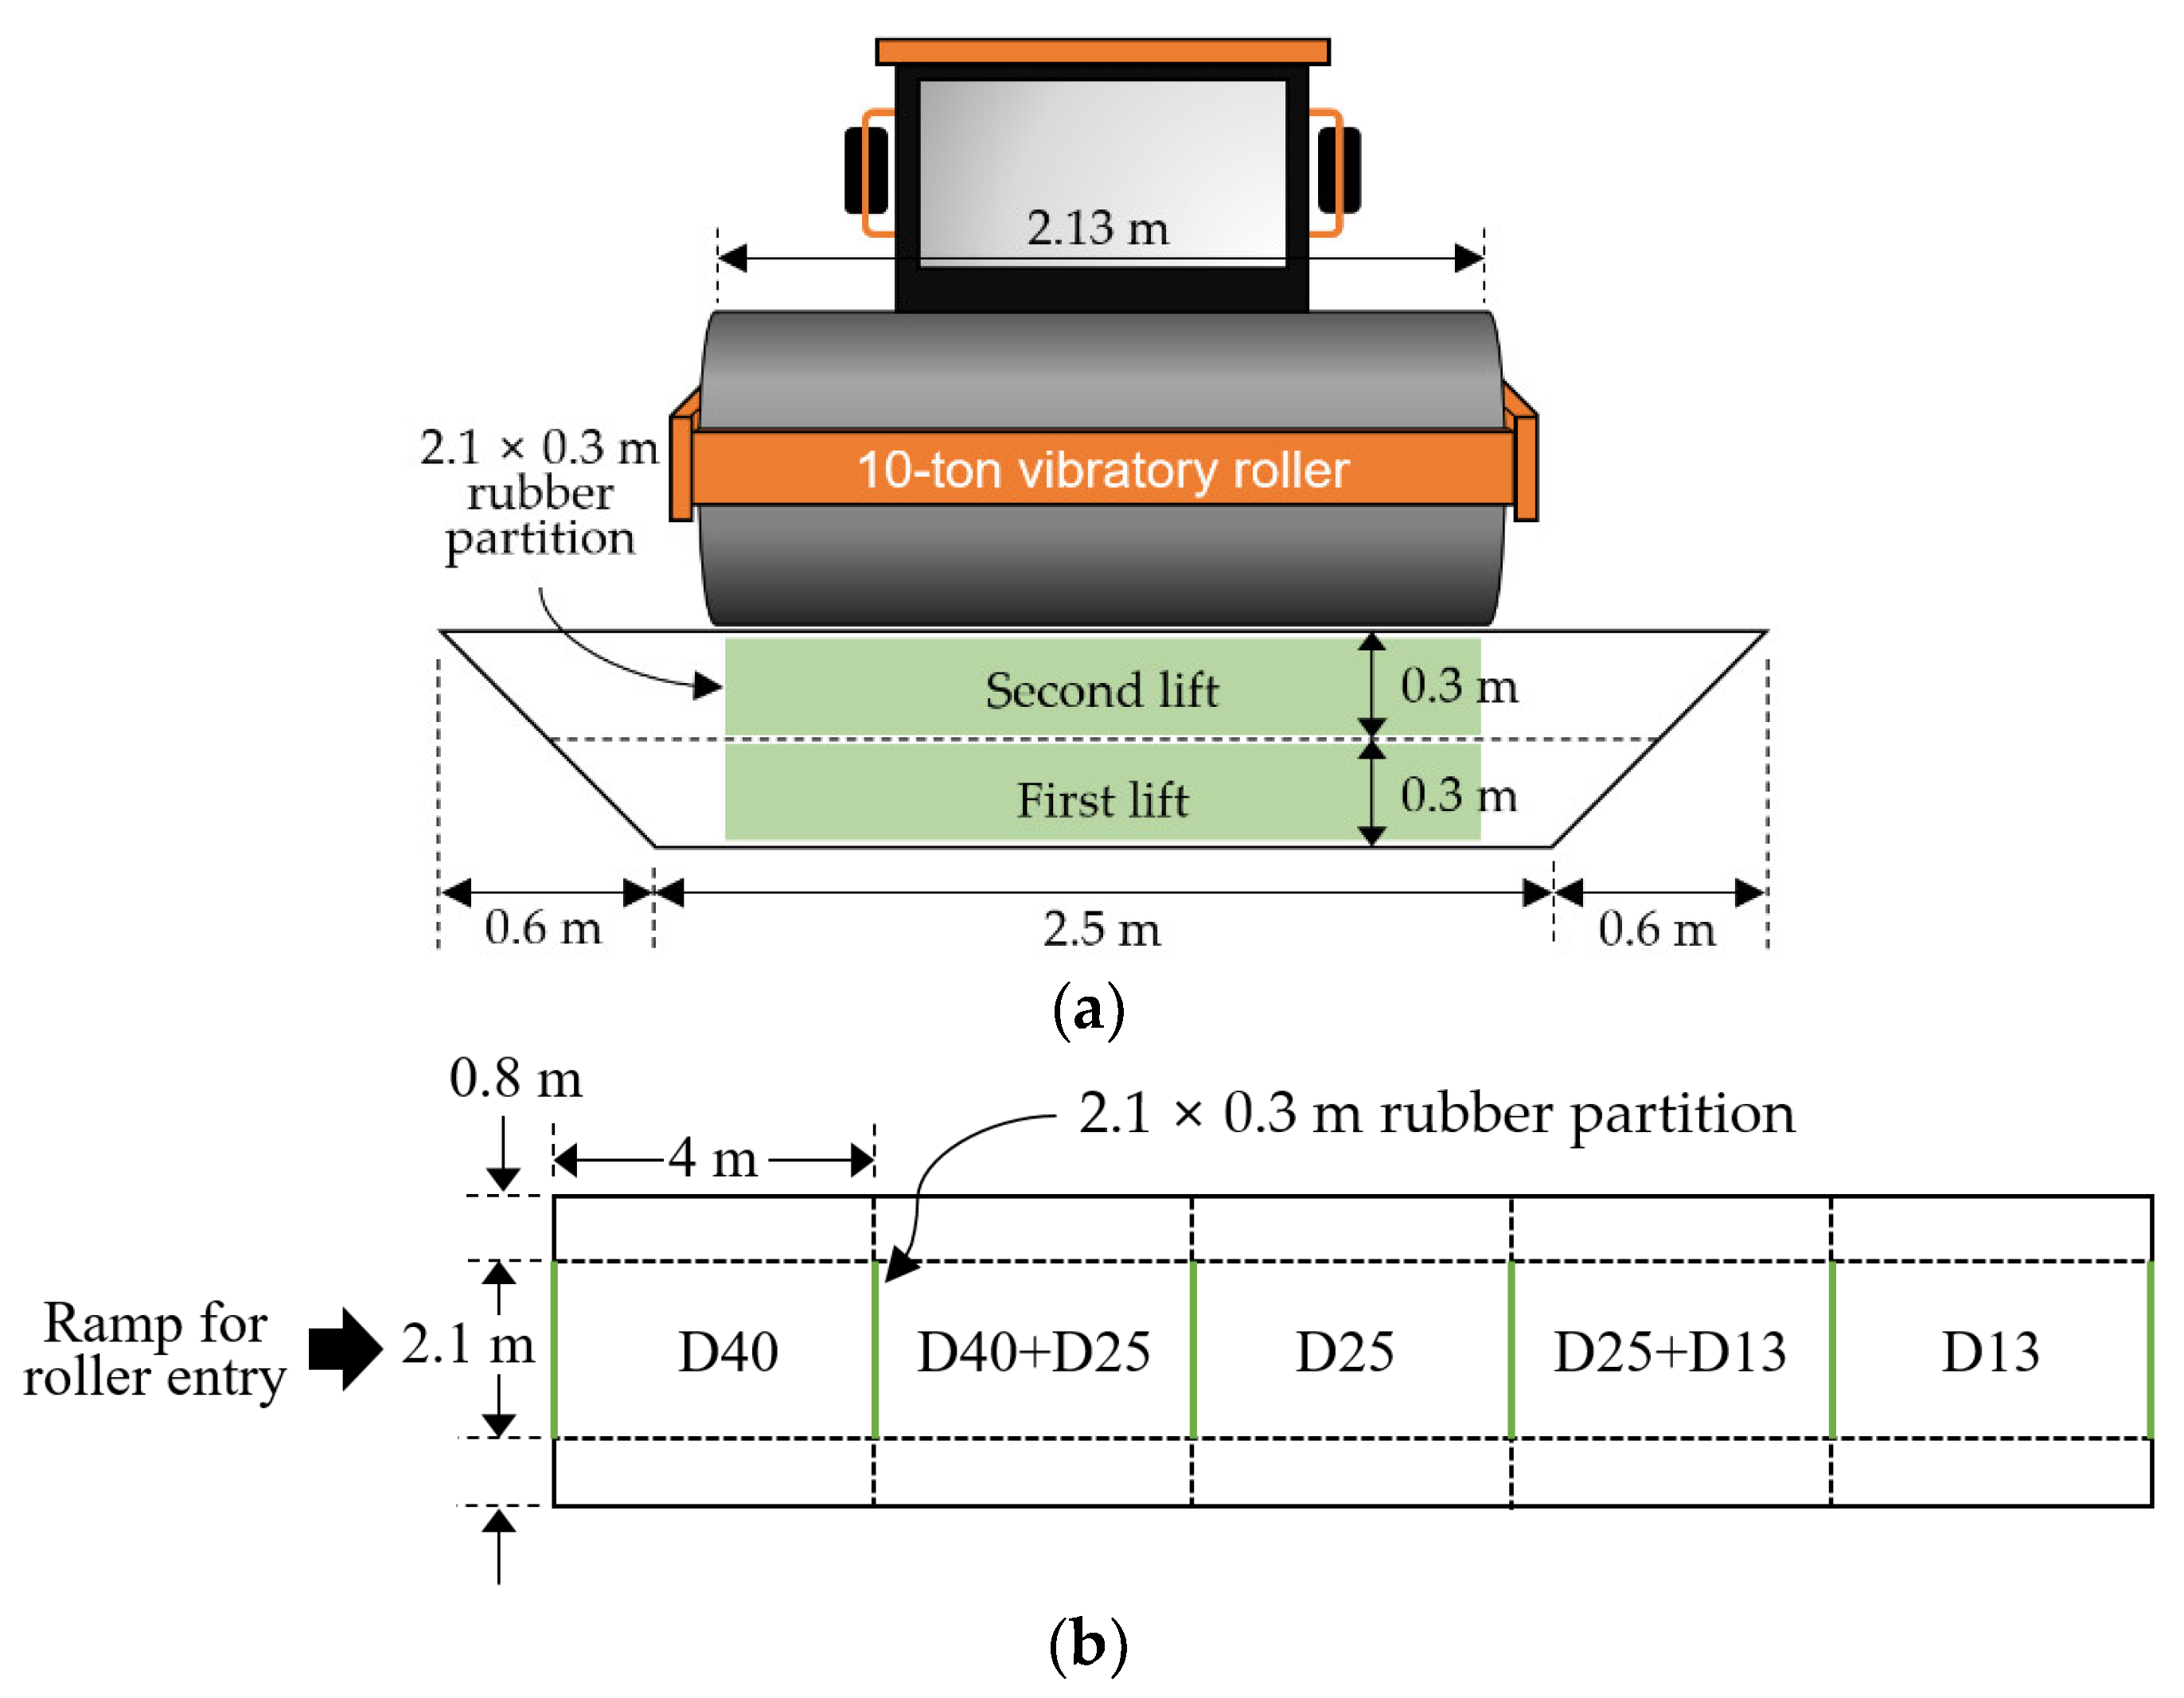
Figure 5.
Test bed construction and test procedure: (a) Test bed excavation and test section separation; (b) Lift construction; (c) Compaction; (d) PLT.
Figure 5.
Test bed construction and test procedure: (a) Test bed excavation and test section separation; (b) Lift construction; (c) Compaction; (d) PLT.
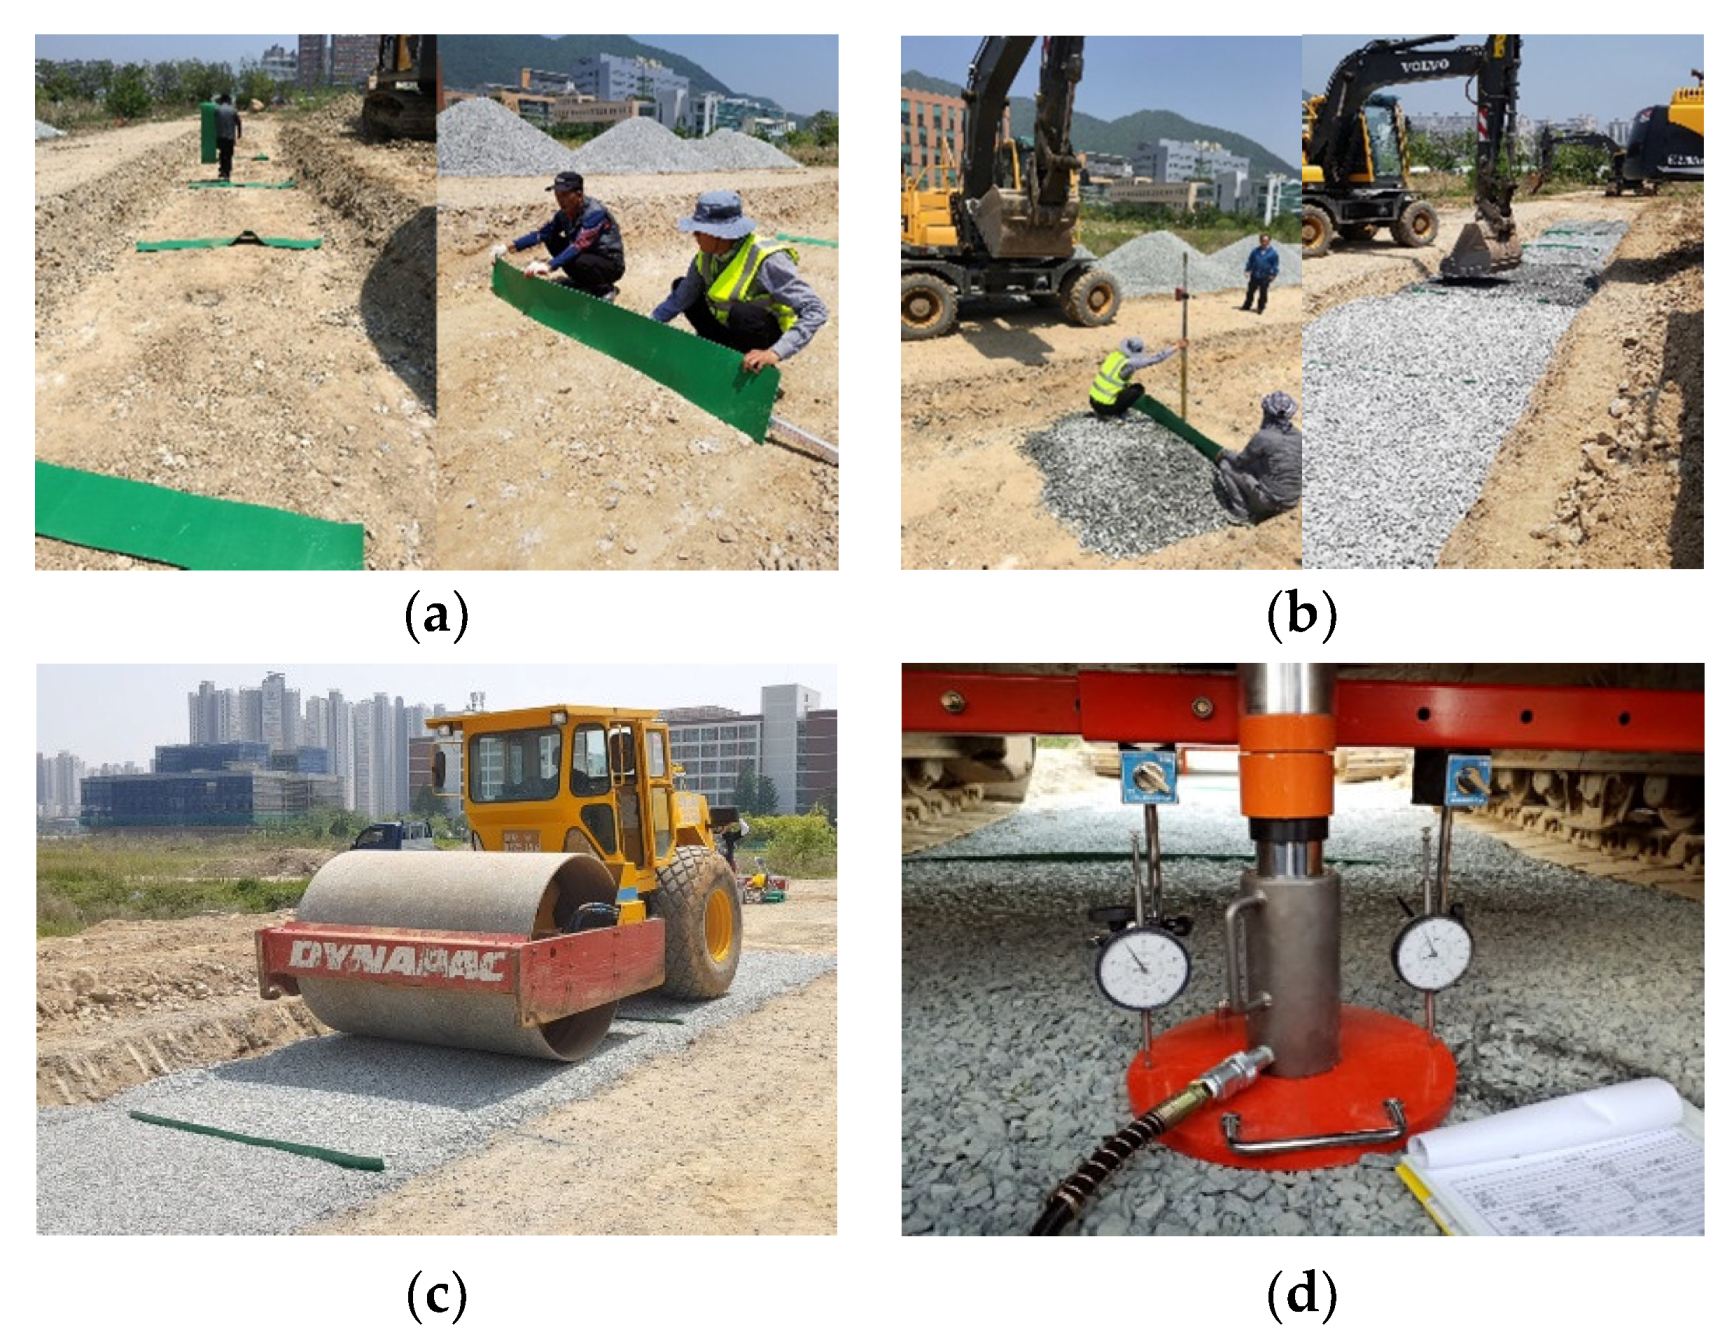
Figure 6.
Layout of test locations on a test bed section.
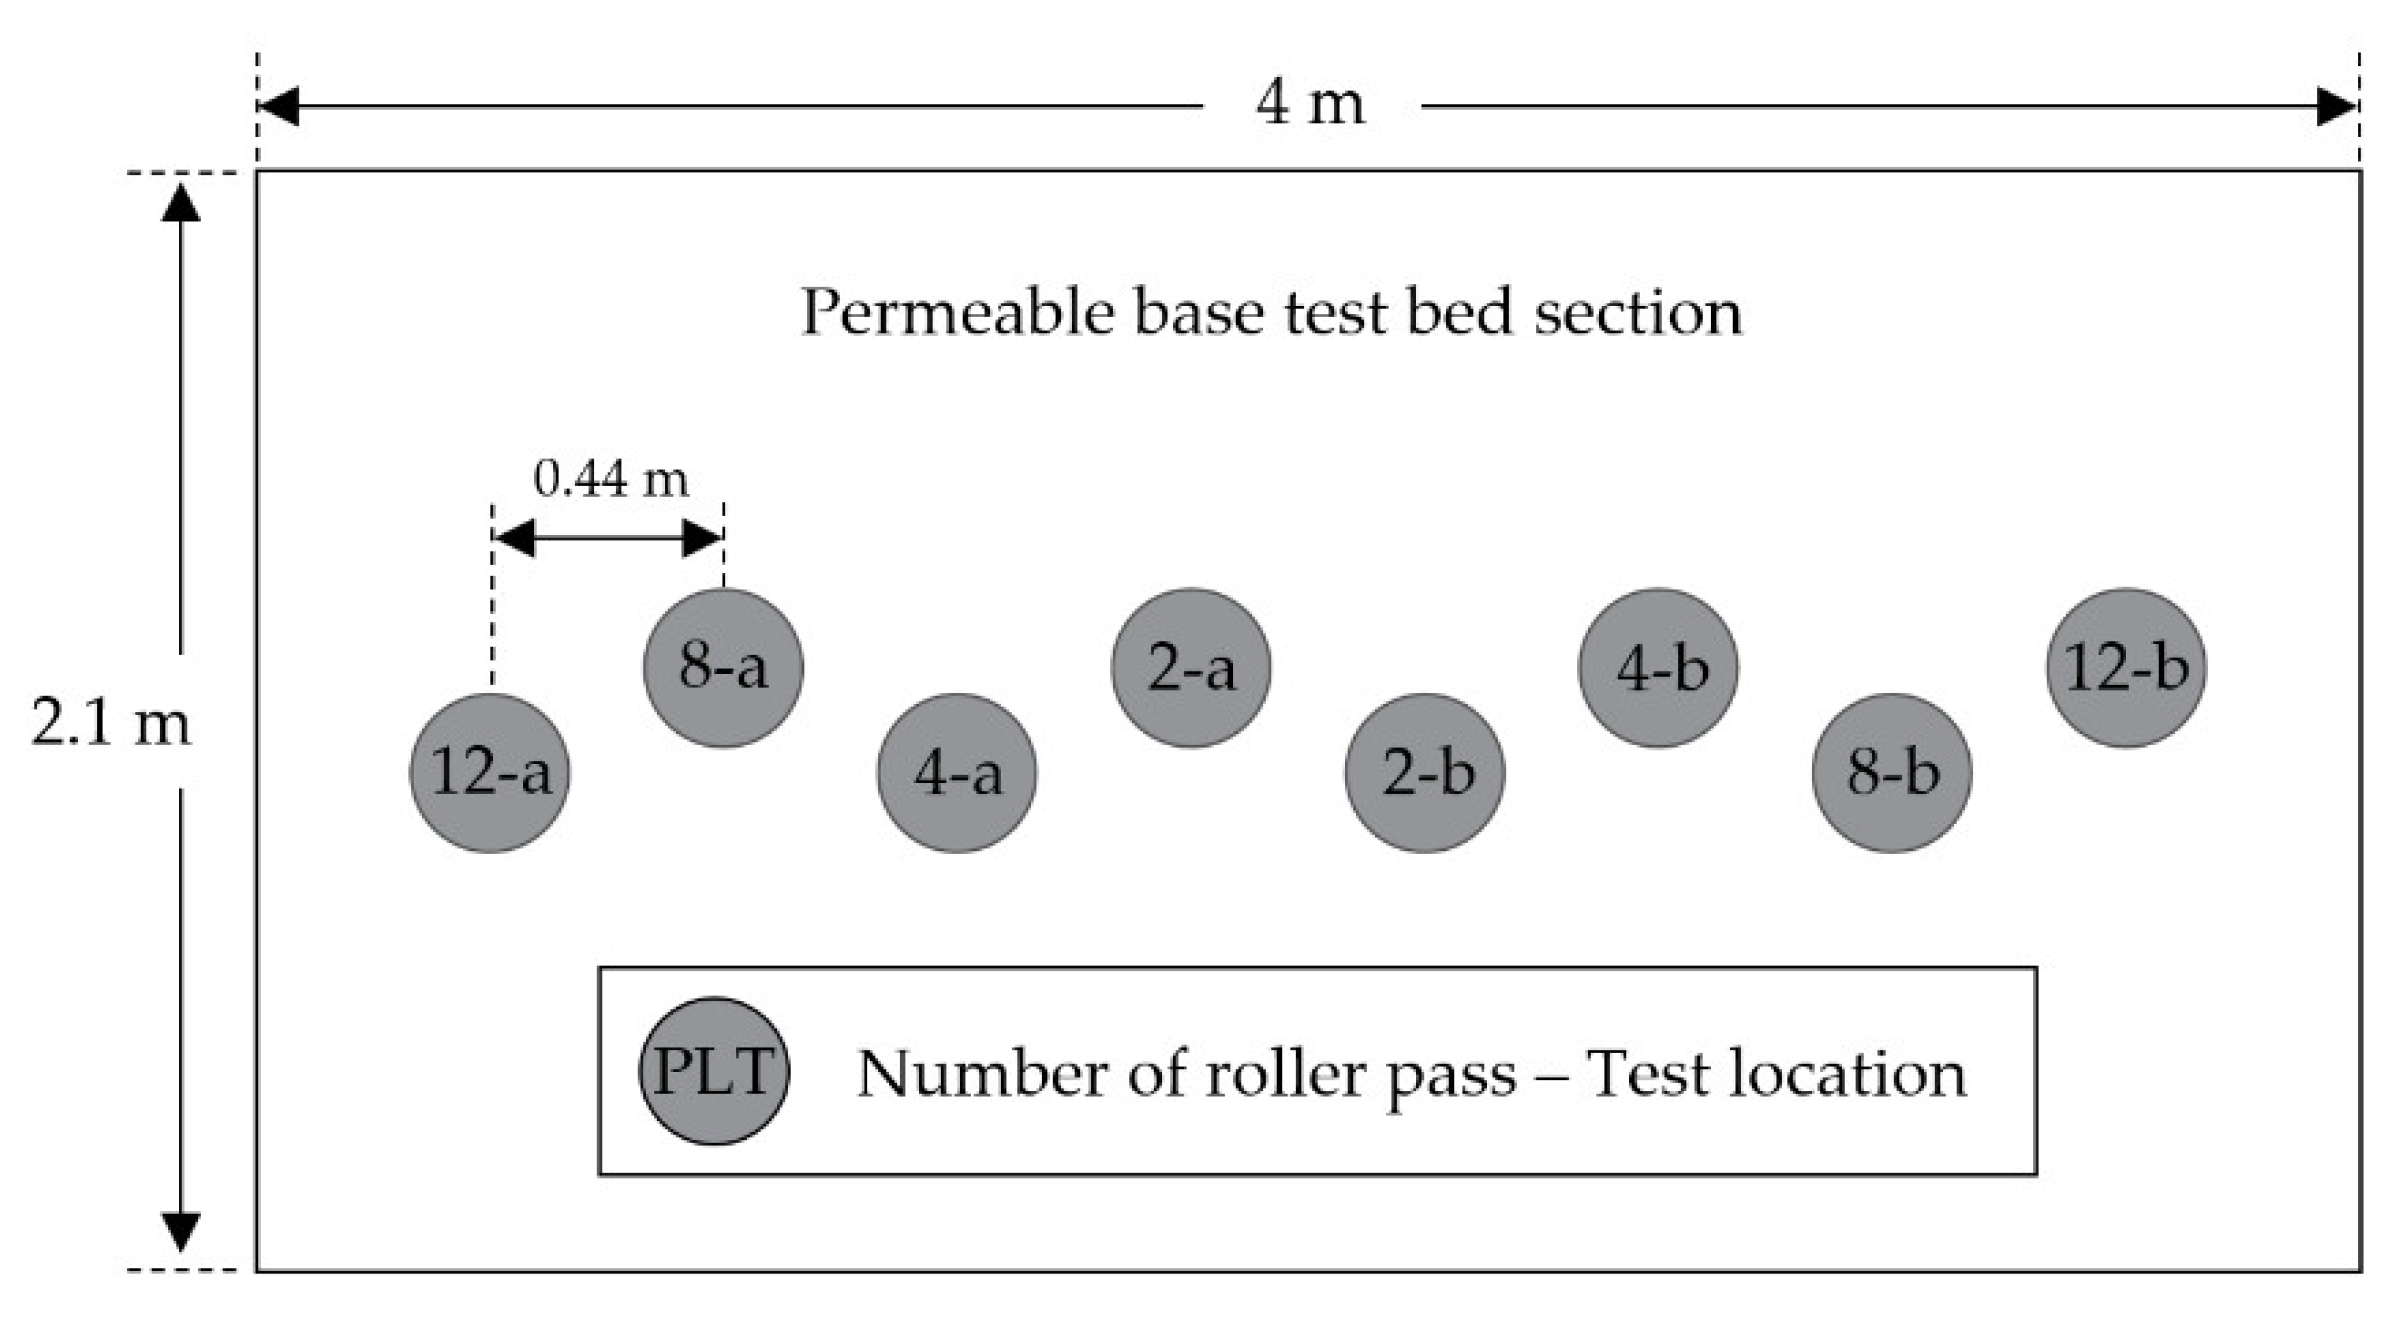
Figure 7.
Examples of stress-settlement curves in the first lift: (a) D25 at locations “a” and “b” after 4 roller passes; (b) D25 at locations “a” and “b” after 12 roller passes.
Figure 7.
Examples of stress-settlement curves in the first lift: (a) D25 at locations “a” and “b” after 4 roller passes; (b) D25 at locations “a” and “b” after 12 roller passes.

Figure 8.
Relationship between number of roller passes and modulus measures: (a) Ev1; (b) Ev2; (c) k2.5; (d) Ev2/Ev1.
Figure 8.
Relationship between number of roller passes and modulus measures: (a) Ev1; (b) Ev2; (c) k2.5; (d) Ev2/Ev1.

Figure 9.
Relationship between materials and modulus measures: (a) Ev1; (b) Ev2; (c) k2.5; (d) Ev2/Ev1.
Figure 9.
Relationship between materials and modulus measures: (a) Ev1; (b) Ev2; (c) k2.5; (d) Ev2/Ev1.
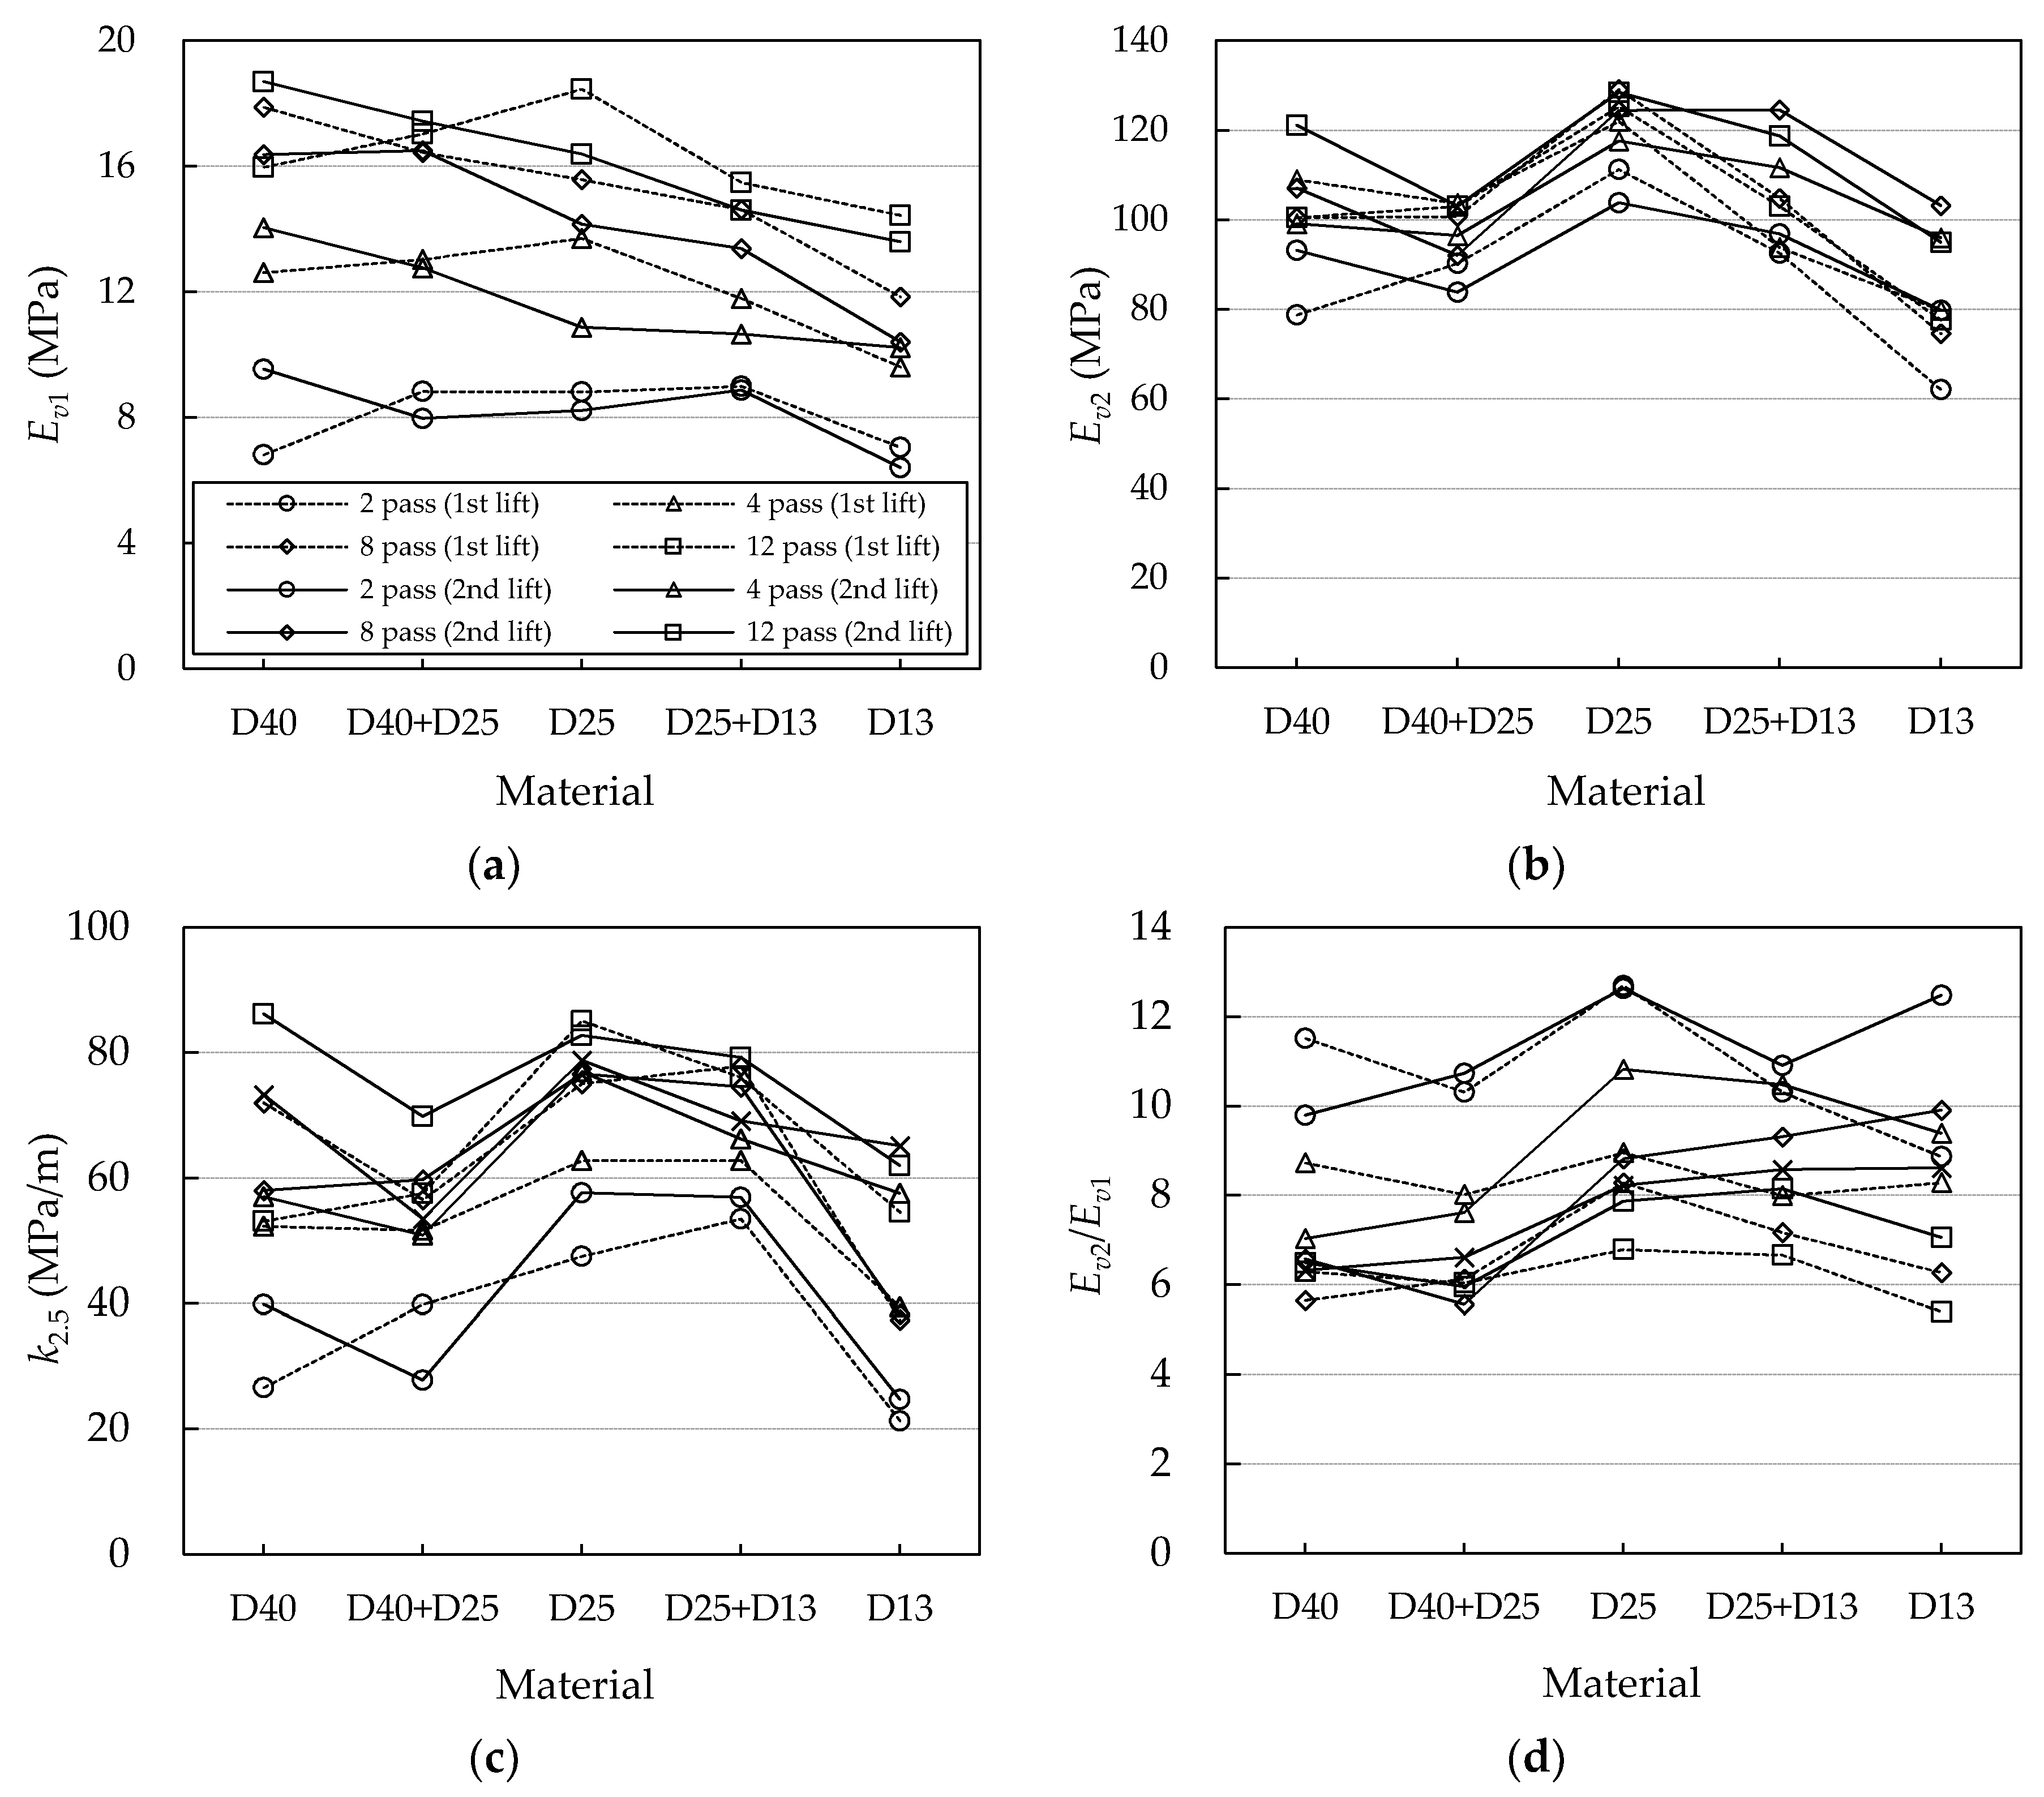
Figure 10.
Examples of modulus measurements before averaging: (a) Ev1 measurements at location a and b in D40+D25 of first lift; (b) k2.5 measurements at location a and b in D13 of second lift.
Figure 10.
Examples of modulus measurements before averaging: (a) Ev1 measurements at location a and b in D40+D25 of first lift; (b) k2.5 measurements at location a and b in D13 of second lift.


Table 1.
Moduli of dense-graded ground materials evaluated by PLT 1 in literatures.
| Literature | Soil Type | MDD 2 (g/cm3) | OMC 3 (%) | RC 4 (%) | MC 5 (%) | Ev16 (MPa) | Ev27 (MPa) |
|---|---|---|---|---|---|---|---|
| Wiman [27] | Fine sand subgrade | 1.72 3 | 14.4 3 | 99–101 | 5.3–9.9 | 35–36 | 97–107 |
| Natural gravel | 2.18 3 | 3.7 3 | 99.7 | 2.4 | 65 | 190 | |
| Crushed rock aggregate | 2.17 3 | 4.7 3 | 99.8 | 2.7 | 61 | 185 | |
| Granular base | 2.35 3 | 4.5 3 | 95.8 | 2.2 | 77.6 | 191 | |
| Kim and Park [18] | Poorly graded gravel | 2.27 | - | - | 5.9 | 23–53 | 48–137 |
| Kim et al. [32] | Silty sand | - | - | - | - | 11~15 | 21~28 |
| Lean clay | - | - | - | - | 12~23 | 18~37 |
1 Plate load test; 2 Maximum dry density from the standard Proctor test; 3 Optimum moisture content from the standard Proctor test; 4 Relative compaction; 5 Moisture content when PLT is conducted; 6 Strain modulus for first loading cycle; 7 Strain modulus for second loading cycle.
Table 2.
Modulus-based compaction specifications.
| Literature | Country | Material | Requirement | Corresponding RC (%) | ||
|---|---|---|---|---|---|---|
| Ev2 (MPa) | Ev2/Ev1 | k2.5 (MPa/m) | ||||
| ZTVE-StB 94 [33] | Germany | GW, GI, GU, GT 1 | ≥70 | - | - | ≥98 |
| - | - | ≤2.5 | - | - | ||
| Standard specification for road construction [34] | Korea | Subbase | - | - | ≥294 2 | ≥95 |
1 German soil classification according to DIN 18196 [35]; 2 Modulus of subgrade reaction defined at 2.5-mm settlement using a 30-cm loading plate.
Table 3.
Basic information of the test materials.
| Test Material | Lithology | Material Composition by Volume | Cu 1 | Cc 2 | Specific Gravity | Abrasion Rate (%) | ||
|---|---|---|---|---|---|---|---|---|
| D40 | D25 | D13 | ||||||
| D40 | Rhyolite | 100% | - | - | 2.88 | 1.19 | 2.67–2.75 | 12.8 |
| D40 + D25 | 50% | 50% | - | 2.99 | 1.08 | 9.8 | ||
| D25 | - | 100% | - | 2.48 | 1.02 | 10.3 | ||
| D25 + D13 | - | 50% | 50% | 2.84 | 1.16 | 11.2 | ||
| D13 | - | - | 100% | 2.79 | 1.16 | 12.3 | ||
1 Coefficient of uniformity; 2 Coefficient of curvature.
Table 4.
Test program.
| Test Materials | Lift | Number of Roller Passes |
|---|---|---|
| D40 | First (30 cm) Second (30 cm) | 2 4 8 12 |
| D40 + D25 | ||
| D25 | ||
| D25 + D13 | ||
| D13 |
Table 5.
Coefficients of variation of modulus measures.
| Modulus | Coefficient of Variation (CV) | |
|---|---|---|
| Maximum (%) | Mean (%) | |
| Ev1 | 16.1 | 5.3 |
| Ev2 | 22.4 | 4.5 |
| k2.5 | 40.6 | 10.5 |
© 2018 by the authors. Licensee MDPI, Basel, Switzerland. This article is an open access article distributed under the terms and conditions of the Creative Commons Attribution (CC BY) license (http://creativecommons.org/licenses/by/4.0/).
Share and Cite
MDPI and ACS Style
Choi, Y.-J.; Ahn, D.; Nguyen, T.H.; Ahn, J. Assessment of Field Compaction of Aggregate Base Materials for Permeable Pavements Based on Plate Load Tests. Sustainability 2018, 10, 3817. https://doi.org/10.3390/su10103817
AMA Style
Choi Y-J, Ahn D, Nguyen TH, Ahn J. Assessment of Field Compaction of Aggregate Base Materials for Permeable Pavements Based on Plate Load Tests. Sustainability. 2018; 10(10):3817. https://doi.org/10.3390/su10103817
Chicago/Turabian StyleChoi, Yong-Jin, Donghyun Ahn, Tan Hung Nguyen, and Jaehun Ahn. 2018. "Assessment of Field Compaction of Aggregate Base Materials for Permeable Pavements Based on Plate Load Tests" Sustainability 10, no. 10: 3817. https://doi.org/10.3390/su10103817
Note that from the first issue of 2016, this journal uses article numbers instead of page numbers. See further details here.