Inter-Firm Cooperation and Collaboration in Shipper—Shipping Company Relationships for Enhancing Sustainability


1
Ministry of Oceans and Fisheries of South Korea, Sejong-si 30110, Korea
2
Plymouth Business School, University of Plymouth, Plymouth PL4 8AA, UK
3
School of Economics & Trade, Kyungpook National University, 80 Daehak-ro, Buk-gu, Daegu 41566, Korea
*
Author to whom correspondence should be addressed.
Sustainability 2018, 10(10), 3714; https://doi.org/10.3390/su10103714
Submission received: 13 September 2018
/
Revised: 13 October 2018
/
Accepted: 13 October 2018
/
Published: 16 October 2018
(This article belongs to the Section Economic and Business Aspects of Sustainability)
Abstract
:This paper aims to reveal the relationship between cooperation, trust, and sustainability, and to uncover whether cooperation, trust, and sustainability is nested within collaboration in shipper–shipping company relationships. Structural equation modeling identified that cooperation has a positive effect on trust, which partially mediates the impact of cooperation on sustainability. Sub-constructs of cooperation included transparency, fairness, and mutuality. Fairness is the prime antecedent of trust, and developing fairness can create more effective and high-quality relationships among firms. A fuller theoretical model reveals how inter-firm cooperation may progress to collaboration, and why transparency does not necessarily lead to trust.
1. Introduction
Globalization created great uncertainty as traditional supply chain relationships involving cooperation, collaboration, and competition between firms transformed into internecine competition between supply chains [1,2]. In response, if inter-firm collaboration can resolve distorted demand information, which generates bullwhip effects, collaboration may offer competitive advantages [3]. The benefits of collaborative relationships include risk sharing, the acquisition of complementary resources, reduced transaction costs, improved productivity, and enhanced performance [4]. Collaboration can also create opportunities for firms to reduce the inherent costs of exploiting and monitoring new markets, and avoid the risks of having to internalize non-core activities.
In the summer of 2016, financial difficulties forced Hanjin Shipping Company to cease trading, causing $120 million in losses for 329 shippers and severely impacting other supply chain members through delivery delays and broken contracts. Later, shippers wasted resources on searching for alternative shipping transport service providers and endured rising freight rates [5], illustrating how supply chain partners benefit from cooperating and collaborating with vulnerable partners.
Definitions of collaboration vary [6], but most emphasize process integration and sometimes extend beyond inter-firm transactions [7]. Collaboration is rarely differentiated from cooperation, inviting examination of the constructs involved. Accordingly, this research aims to conceptualize inter-firm collaboration more comprehensively as viewed through alternative philosophical lenses that differentiate collaboration from cooperation. The relationship between shippers and shipping companies provides a case study of inter-firm cooperation and collaboration. The literature examining the diverse collaborative relationships between potential shippers spanning suppliers, manufacturers, distributers, retailers, exporters, and importers is sparse, offering a propitious research opportunity.
2. Theoretical Background and Hypotheses
2.1. Some Theoretical Perspectives
Inter-firm cooperation and collaboration may be viewed through theoretical lenses, which include transaction cost theory (TCT), resource-based theory (RBT), resource dependency theory (RDT), contingency theory (CT), social exchange theory (SET), and social capital theory (SCT) [1,7].
Primarily, TCT focuses on whether a transaction is performed more efficiently within one vertically integrated firm, or by autonomous contractors governed by the market outside the firm [8]. Transaction costs can arise from the specificity of assets, uncertainty, or transaction frequency, leading to market failure, which favors vertical integration [9]. Inter-firm cooperative and collaborative relationships can reduce transaction costs and increase transaction stability by reducing the opportunistic behavior of partners [1].
A resource-based view “attempts to explain firm sustainable competitive advantage as stemming from firm resources that are rare, valuable, hard or impossible to imitate or duplicate, and hard to substitute” ([10], p. 96). RBT focuses on the resources and capabilities that are available within a firm as a source of competitive advantage [11]. A firm’s resources include factors that it possesses or governs, whereas capabilities include a firm’s capacity to utilize such tangible or intangible resources effectively. If a firm’s intangible resources and capabilities include a cooperative and collaborative network with other firms, RBT offers a theoretical basis for cooperation and collaboration. Relational theory (RT) involves applications of RBT to inter-organizational relations [12] or a complementary theory to RBT, which seeks the origin of competitive advantage from inter-firm networks [11].
According to RDT, because firms rely on exchanges with each other to acquire necessary resources, uncertainty fosters cooperation between partners and creates dependence on the other party [13]. Only with cooperation and support from partners can firms respond to market demand. RDT and RBT often imply collaboration between firms to improve their performance [14].
CT proposes that the best way to manage an organization varies with the organizational environment. A good ‘fit’ is attained when an organization performs well in its matching with an environment [15], but business environments vary and moderate the relationship between organization and performance. Within a fast-changing environment, collaboration between companies can enhance ‘fit’.
SET explores how the interactions of actors in an exchange process are influenced by rewards and costs [16]. When actors compare the rewards and costs of an exchange procedure, they decide to participate in the exchange and make relationships that can maximize benefits and minimize costs [17]. SET literature has identified inter-firm cooperative and collaborative exchange relationships including justice, followed by trust and commitment [18].
Social capital implies “networks together with shared norms, values, and understandings that facilitate cooperation within or among groups” ([19], p. 41). The likelihood of opportunism and correspondingly expensive monitoring processes may be reduced by the high levels of trust that are inherent in social capital, which consequently reduce transaction costs. Social capital may encourage cooperative behavior and offer a kind of resource that a firm can mobilize [20].
2.2. Cooperation and Collaboration
Spekman et al. [21] introduced a step function to show a transition from open market negotiations to cooperation, coordination, and collaboration. Cooperation is an incipient relationship that differs from collaboration. Collaboration involves higher levels of trust and commitment. Golicic et al. [22] proposed that collaboration is the highest level of inter-firm relationship. Cooperation involves less trust, commitment, and mutual dependence, and is less active than collaboration. The extent of trust and commitment discriminates between the three concepts. In this work, differences between cooperation and collaboration depend on the existence of trust and sustainability. Sustainability is postulated to include commitment and long-term orientation. Coordination, cooperation, and collaboration are not differentiated, because coordination is one form of cooperation [18].
2.3. Operational Definitions and Hypotheses Development
2.3.1. Cooperation
Cooperation is a transparent business partnership process in which partners work together treating each partner justly and equally on the basis of mutuality for common goals and benefits. Cooperation is a subset of collaboration that is comprised of transparency, fairness, and mutuality. Collaboration involves a business partnership process in which partners aim to sustain a long-term cooperative relationship based on trust. Sub-constructs of collaboration involve cooperation, trust, and sustainability. Each sub-construct is derived from relevant literature on inter-firm cooperation and collaboration. Cooperation is proposed as an antecedent of trust, rather than a consequence [23], hence:
Hypothesis 1 (H1).
Cooperation between partners has a positive effect on trust between them.
2.3.2. Transparency
Transparency implies the extent to which a partner has an open and transparent relationship, involving concepts of information-sharing, communication, and formalization.
Information-sharing is an important component of cooperation and a primary form of collaboration [24]. Realistic, up-to-date, and detailed information exchange can enhance the efficiency and visibility of inter-firm relationships [25]. To enhance information-sharing between maritime transport participants, as an example, the European Commission initiated a research project regarding the e-Maritime Strategic Framework and Simulation based Validation (e-Mar) [26]. Collaborative communication is more frequent, more bidirectional, uses better information modes, and has enhanced indirect influences. Formalization is the degree to which manifest rules and procedures regulate decision-making, and is integral to improved collaborative relationships [2]. Well-established formalization can enhance the transparency between immediate parties. Information-sharing underpins trust-building [27]. Hence, the proposition:
Hypothesis 2 (H2).
Transparency has a positive effect on trust between partners.
2.3.3. Fairness
Fairness signifies the extent to which one partner treats another fairly and justly, invoking concepts of justice and reciprocity [28]. Fairness can be conceptualized within collaborative buyer–supplier relationships and can affect cooperation levels between partners [1], but fairness is under-researched in supply chains. Conventionally, procedural and distributive justice defined fairness [29]. Procedural justice describes how fairly a firm and its personnel deal with a partner [28]. Distributive justice defines how an equitable distribution is ensured between partners, is commensurate with their contributions, and assures satisfactory levels of cooperation [30]. Since the development of trust between partners requires justice in interactions [31], proposition three is:
Hypothesis 3 (H3).
Fairness has a positive effect on trust between partners.
2.3.4. Mutuality
Mutuality implies the extent to which a partner treats another partner as an equal business partner and is willing to support the other partner on the basis of mutual understanding. Mutuality involves exchange relationships between organizations [6] based on goal congruence, decision synchronization, resource sharing, joint problem-solving, joint performance measurement, and joint knowledge creation. Goal congruence implies the degree to which partners perceive that the attainment of their common objectives satisfies their respective objectives. Decision synchronization refers to the degree to which partners engage in joint decision-making. Resource sharing signifies “the process of leveraging capabilities and assets and investing in capabilities and assets with partners” ([7], p. 6620). Problem-solving implies settling matters such as disagreements and conflicts between partners and unexpected disasters [24]. Joint performance measurement is required to encourage suitable behaviors and make effective collaboration possible [32]. Joint knowledge creation identifies the extent to which partners understand better and react to markets and environments.
Mutuality embraces popularly identified components of cooperation or collaboration. Min et al. [25] cited joint planning, joint problem-solving, joint performance measurement, and leveraging resources and skills as instances of collaboration. Cao et al. [7] cited goal congruence, decision synchronization, resource sharing, and joint knowledge creation as collaborative enablers. In this study, these components are merged into mutuality, implying that collaboration may create trust [25] and that:
Hypothesis 4 (H4).
Mutuality has a positive effect on trust between partners.
2.3.5. Trust
Trust is the extent to which a partner can be trusted in terms of trustworthiness, good faith, benevolence, and fulfillment of obligations. Credibility and honesty [33] or credibility and benevolence [34] are components of trust. Credibility is a firm’s belief about the sincerity and the fulfillment of the obligation of its partner [23]. Trust can contribute to decreasing transaction costs, anxiety, and uncertainty between partners, and restrain a partner’s opportunistic behavior [35].
2.3.6. Sustainability
Sustainability implies the extent to which one partner continuously sustains and strengthens its relationship with a partner, based on commitment and long-term orientation. Commitment is “an implicit or explicit pledge of relational continuity between exchange partners” ([31], p. 19). A committed partner wants to continue a relationship and is content to work to maintain the relationship [18]. Long-term orientation signifies a partner’s orientation or desire toward having a long-term relationship with a particular partner, which is associated with an interest in both current and future outcomes and accomplishing future goals [35]. The construction, maintenance, and enhancement of long-term relationships with partners can lead to effective inter-firm relationships.
Concerning the relationship between trust and sustainability, a positive relationship between trust and commitment is identified [36,37]. Since a partner’s commitment to a relationship can be increased by incremented levels of trust [18], and trust is a primary element of establishing a long-term orientation [35], it is proposed that:
Hypothesis 5 (H5).
Trust has a positive effect on sustainability between partners.
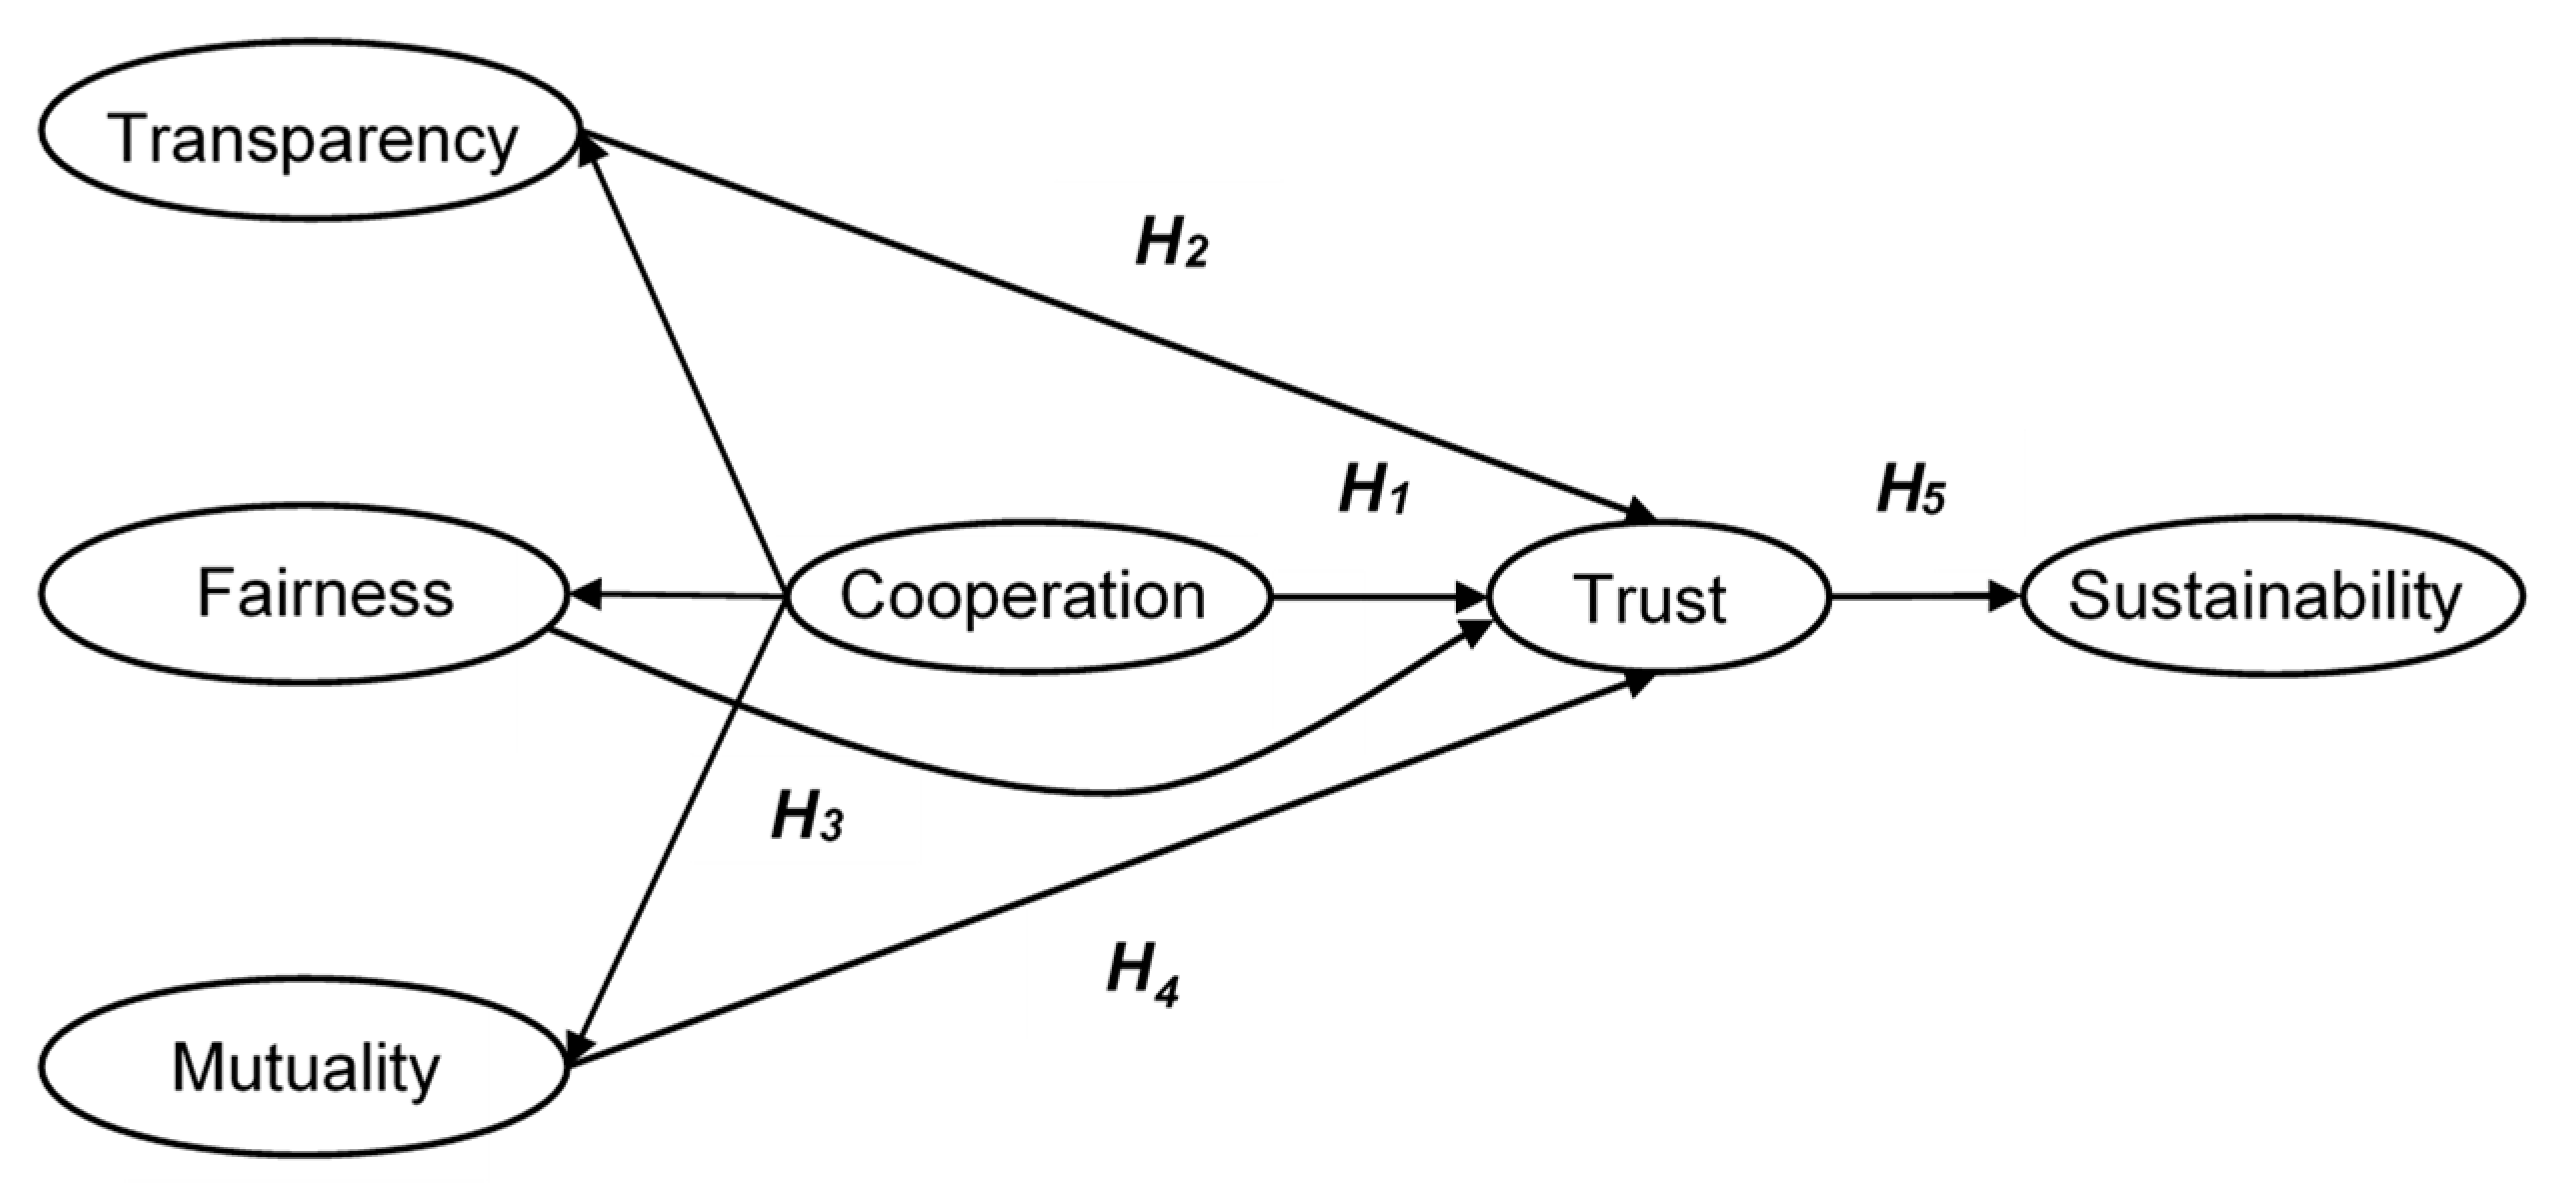
Figure 1 summarizes the relationships between the components of collaboration and corresponding hypotheses. Cooperation and its sub-constructs such as transparency, fairness, and mutuality are proposed as influences on sustainability via the mediating variable, trust.
3. Methodology
3.1. Developing Measurement Scales
All of the measurement scales adopted seven-point Likert scales anchored by strongly disagree (=1) and strongly agree (=7). An incipient list of 76 items compiled from the existing literature was distributed to 11 industrial experts who were instructed to discard any items that were unclear or inappropriate for describing shipping company–shipper relationships. Forty items remained to define collaboration after removing all of the items on which over 70% of respondents agreed that deletion was appropriate. Following content analysis to remove items that overlapped or implied similar intent, 24 items remained to define collaboration.
To clarify sub-constructs such as transparency, mutuality, and sustainability, two-round Q-sorting to establish content adequacy and verify that the sub-constructs that existed engaged six public officers, nine academics, and 10 practitioners in South Korea. Twenty-four items and five sub-constructs were emailed to experts, who were asked to select the one sub-construct that was most closely connected to each item. The second-round Q-sorting demonstrated an overwhelming 97% agreement rate and verified that the sub-constructs definitely existed.
Pilot testing in June 2016 engaged 34 practitioners who were representative of Korea’s shipping industry and highlighted only typographical changes. Empirical Cronbach measures of reliability significantly >0.7 including transparency (0.925), fairness (0.919), mutuality (0.972), trust (0.960), and sustainability (0.925) implied <8% probability of an asymptotic bias. Appendix A shows the items selected.
3.2. Sample and Data Collection
The analysis and interpretation of data is complex in dyadic research, particularly given power imbalances between parties. The shipping industry is highly competitive, and shippers typically have more power in service supplier–customer relationships [37]. Within this environment, the usual practice in relationship research of examining one side of the relationship was adopted [38].
South Korea’s shipping industry offers a useful context within which to study inter-firm cooperation and collaboration, hosting in 2016 79 M deadweight tonnes of registered vessels. South Korea also hosts six top liner shipping companies. Large shippers include Samsung, Hyundai, and Lotte and globally, South Korea is the sixth largest steel producer, fifth largest steel consumer, fourth largest importer of iron ore, and fifth largest consumer of coal [39].
In May 2016, South Korea hosted 183 ocean-going and 723 coastal shipping companies [40]. The Korea Shipowners’ Association provided contact data for all of the ocean-going companies and 241 coastal shipping companies. An email questionnaire survey was distributed to senior employees in shipping companies in July followed by two reminder emails and two reminder phone calls. Of the 174 responses, 167 were usable, excluding one with missing data and six that did not engage fully. A total response rate of 25.5% and active response rate of 39.0% [41] implied a representative sample (Table 1).
Armstrong and Overton [42] reasoned that non-respondents are likely to mimic the responses of late respondents, and tested for a non-response bias by comparing the central tendency of the responses of early and late respondents. Applying this reasoning, independent samples t-tests for 24 item variables yielding no statistically significant differences at p < 0.05 between the first 30 and last 30 respondents imply that a non-response bias is unlikely.
3.3. Data Purification for Structural Equation Modeling
To purify the initial sample, an exploratory factor analysis of items with maximum likelihood and direct oblimin using SPSS 23 identified two free-standing indicator variables: MUT2 and SUS1. Hence, for measurement and structural models, 15 items for cooperation, and 22 items for collaboration (Appendix A) were retained (see Table 2).
Using AMOS 22, SEM first tested the construct validity of a measurement model, before estimating and testing a theoretical model.
3.4. Measurement Model
3.4.1. First-Order Factor Measurement Model for Cooperation
Convergent validity was examined using standardized factor loading, average variance extracted (AVE), reliability, and model fit statistics. The overall model χ2 is 273.07 with 87 degrees of freedom (df) and p = 0.000. However, χ2 goodness-of-fit statistics should be reported alongside one absolute and one incremental fit index [43]. This sample of 167 observations suits standardized root mean residual (SRMR) measures. The calculated SRMR (=0.039) is below 0.05, which is a conservative threshold [44], and the TLI (=0.922) and CFI (=0.935) exceed 0.90, indicating a good model fit. All of the standardized factor loadings and corresponding squared factor loadings exceed the critical thresholds of 0.7 and 0.5, respectively. All of the factor loadings are statistically significant at p < 0.01; critical AVE thresholds of 0.5 are exceeded for all of the sub-construct factor loadings, and the criterion for adequate reliability (0.7) is satisfied [43]. For all of the sub-constructs, reliabilities are acceptable, and Cronbach’s α exceeds 0.7, strongly implying a valid model (Table 3).
To establish the discriminant validity, the square roots of the AVEs for each factor and values of inter-factor correlation associated with the factors were compared [43]. All of the square roots of AVEs exceeded the corresponding pairwise correlation estimates among sub-constructs, implying no problems regarding discriminant validity (Table 4).
Unidimensionality was supported by significant standardized regression weights >0.7, a good model fit, and standardized residuals <2.58 [45].
3.4.2. First-Order Factor Measurement Model for Collaboration
Additional sub-constructs of trust and sustainability were added in the measurement model for collaboration. Convergent validity was strongly supported by goodness-of-fit indices (χ2 = 507.88, df = 199; SRMR = 0.043; TLI = 0.914; CFI = 0.926), factor loading estimates (all >0.7, statistically significant at p < 0.01), AVEs (0.746 to 0.814 > 0.5), construct reliabilities (0.914 to 0.961 >0.7), and Cronbach’s α (0.914 to 0.960 >0.7) (Table 5).
Discriminant validity was supported (Table 6), and the evidence supported the unidimensionality of this model with all of the standardized regression weights >0.7; this indicated a good model fit and that all of the standardized residuals were within the recommended values.
3.5. Validation of Second-Order Constructs
Specification of the second-order factor is justified by statistically significant estimates and a good model fit. The efficiency of a second-order factor model can be assessed by the target (T) coefficient [46], where 0.8 < T < 1.0 demonstrates the existence of a second-order construct [47] and the efficiency of the second-order structure.
3.5.1. Second-Order Factor Measurement Model for Cooperation
Strong paths were statistically significant with p < 0.01. The second-order construct (cooperation) explains respectively 81%, 87%, and 81% of the variation in the first-order factors of transparency, fairness, and mutuality, and critical values of fit indices were fully satisfied (2 = 273.07, df = 87; SRMR = 0.039; TLI = 0.922, CFI = 0.935). The T coefficient (=1.0), provided good evidence of the existence of a higher order construct, i.e., cooperation. Relations between the first-order factors could be completely explained in terms of the second-order factor [46].
3.5.2. Second-Order Factor Measurement Model for Collaboration
Estimates from the second-order factor (collaboration) to the first-order factors showed a strong statistically significant relationship at p < 0.01, and collaboration explained respectively 76% (transparency), 86% (fairness), 85% (mutuality), 72% (trust), and 68% (sustainability) of the variation. Model fit indices satisfied the recommended thresholds (2 = 525.28, df = 204; SRMR = 0.047; TLI = 0.913, CFI = 0.923), and the T coefficient (= 0.967) indicated that the second-order construct exists and the second factor model is efficient.
3.5.3. Common Method Bias
Organizations operating in multiple shipping sectors were offered one response per sector and multiple responses comprised one-tenth of the total responses, reducing the risk of the common method bias. Widaman’s [48] three-model comparison was also deployed (Table 7). Significant ∆χ2 statistics and improved model fit indices comparing models M0 and M2 indicated that the possibility was minimized but impossible to eliminate, given the research design. Comparing models M0 with M1 and M1 with M2 the significance difference identified convergent and discriminant validity [49].
3.6. Structural Model and Hypotheses Tests
3.6.1. Structural Model for Collaboration with First-Order Factors
The structural model provided evidence of a good model fit (2 = 535.186, df = 202; SRMR = 0.064; TLI = 0.909, CFI = 0.920), with SRMR values ≤0.08 considered “acceptable” [50].
Hypotheses H3, H4, and H5 were supported by significant and positive path estimates (Table 8), but because the dependence relationship of trust from transparency was not significant, H2 was rejected. The overall predictive validity of this structural model was supported given that three paths corresponded to the hypotheses, but one did not [43].
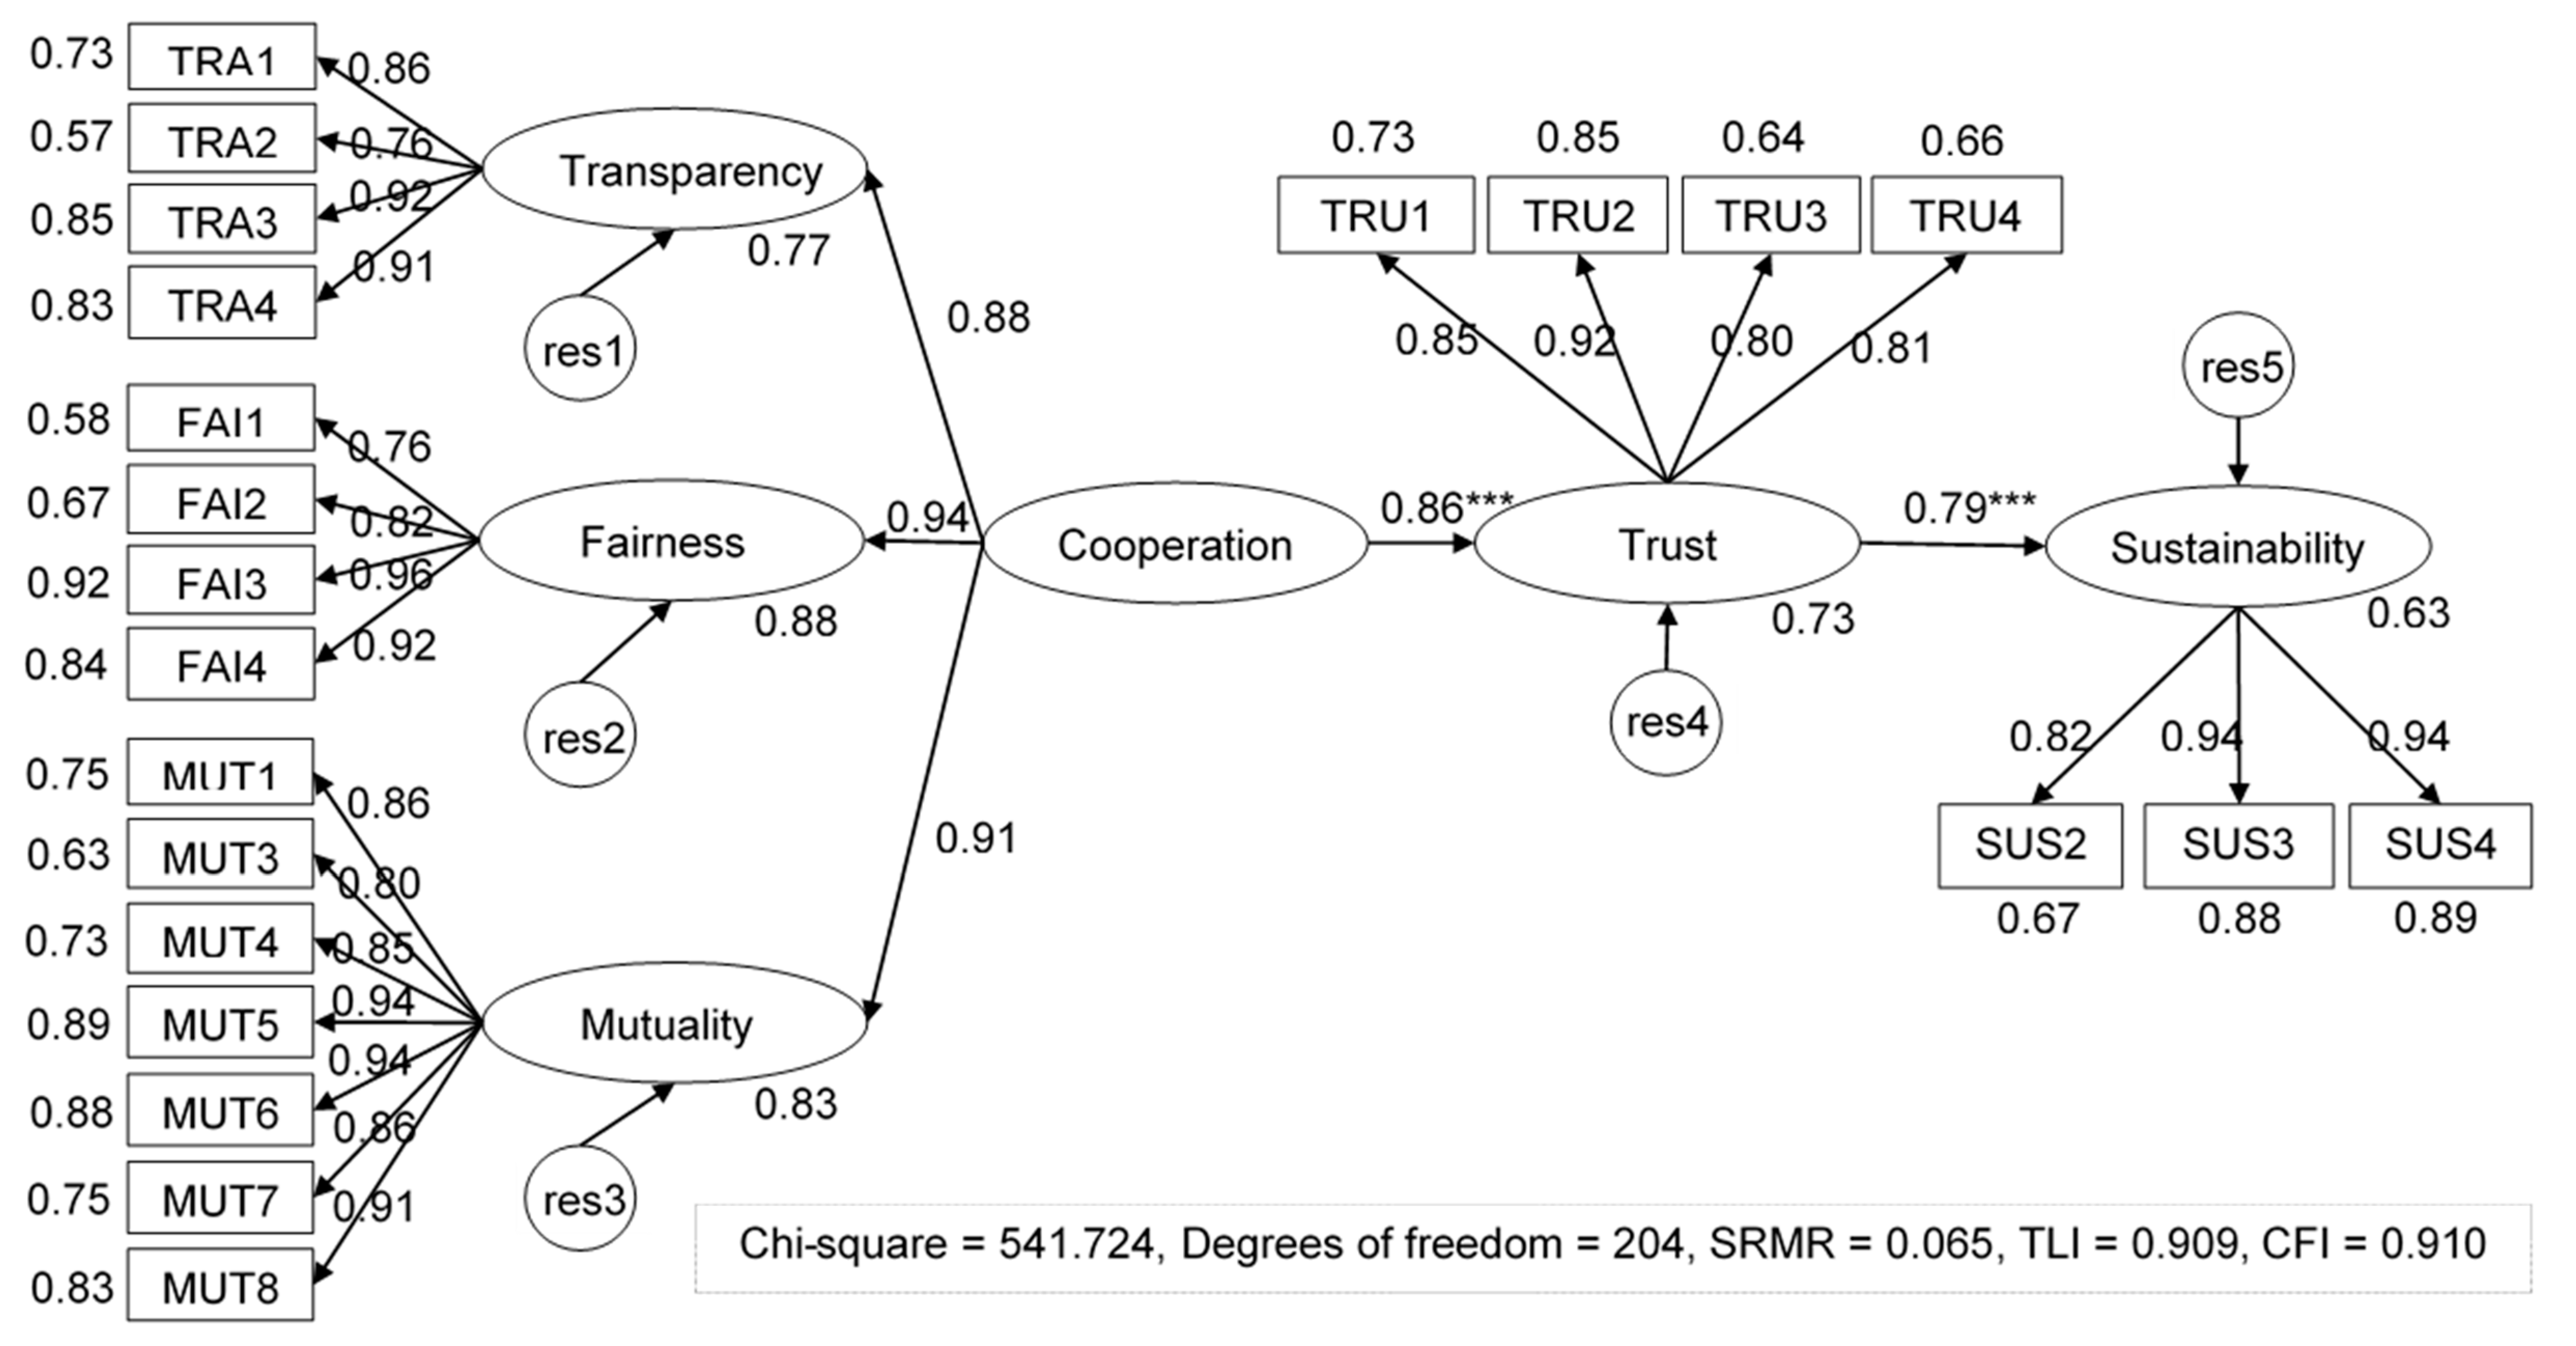
3.6.2. Structural Model for Collaboration with Second-Order Factor
When the second-order construct, cooperation, was imposed to test Hypothesis H1 (Figure 2), goodness-of-fit statistics (χ2 = 541.724, df = 204; SRMR = 0.065; TLI = 0.909; CFI = 0.910) were acceptable. All of the regression weights were significant at p < 0.01, and a path coefficient of 0.86 (t-value = 10.22) supported Hypothesis H1.
3.6.3. Test for Mediational Effects of Trust
The mediating role of trust was tested using Holmbeck’s [51] approach. First, the path (0.81) directly linking cooperation to sustainability was significant at p < 0.01 (χ2 = 359.555, df = 131; SRMR = 0.043; TLI = 0.923; CFI = 0.934). Second, two paths connecting cooperation to trust (0.86) and trust to sustainability (0.79) were significant at p < 0.01 (χ2 = 541.724, df = 204; SRMR = 0.065; TLI = 0.909; CFI = 0.919). Third, the direct path was added to the second model, and the direct effect from cooperation to sustainability was reduced to 0.56 (χ2 = 518.276, df = 203; SRMR = 0.045; TLI = 0.914; CFI = 0.925). A χ2 difference test between the second and third models was significant at p < 0.01 (∆χ2 = 23.45, ∆df = 1), implying that trust partially mediated the relationship between cooperation and sustainability.
4. Discussion and Implications
4.1. Implications for Theory
This research developed more comprehensive models of inter-firm cooperation and collaboration by synthesizing relevant theories and extending the theories underlying cooperation and collaboration to the relationships between shipping companies and shippers. As an example, the essential conceptions of SET such as fairness, trust, commitment, and long-term orientation were adapted within supply chain contexts. Relationships among the concepts including fairness → trust, and trust → commitment and long-term orientation were strongly supported.
A fuller definition of inter-firm cooperation and collaboration embraced philosophical aspects of inter-firm relationships together with process integration. The extant literature highlighted incentive alignment, particularly distributive justice, but this study introduces procedural justice within fairness. Relationship strength consisting of trust and commitment [35] was extended to include a long-term orientation involving sustainability.
Spekman et al. [22] and Golicic et al. [23] differentiated between cooperation and collaboration. In this study, cooperation is nested within collaboration as a subset of collaboration, and the process was demonstrated whereby cooperation can advance to collaboration i.e., cooperation → trust → sustainability.
This research identified transparency, fairness, and mutuality as dimensions of cooperation, and by adding trust and sustainability, defined five dimensions of collaboration. The T coefficient supported the existence of the second-order factors, viz. cooperation and collaboration. Differentiation between cooperation and collaboration depends on the existence of trust and sustainability. Hence, inter-firm cooperation is characterized as involving transparent, fair, and mutual relationships between parties. Inter-firm cooperative relationships become collaborative or truly cooperative when based on trust, commitment, and long-term orientation.
4.2. Implications for Managers
This research invites practitioners to identify and understand what constitutes inter-firm cooperation and collaboration, extending beyond business integration (i.e., mutuality in this study) into philosophical and cultural perspectives. The properties of cooperation and collaboration identified underpin the building of truly cooperative and collaborative attitudes in engaging with supply chain partners.
Significant and positive path estimates indicated that fairness and mutuality foster trust (H3 and H4), which subsequently leads to sustainability (H5). The greatest impact on trust belonged to fairness (H3, path coefficient 0.50). The weaker partner considers fairness as the essential antecedent of trust, supporting Kumar et al.’s [29] argument that a vulnerable party is sensitive to infringement of fairness by more powerful partners. Dominant partners should endeavor to share profits and burdens with weaker partners and ensure procedural fairness, in order to develop effective and high-quality relationships.
Considering the mediating role of trust, an inter-firm cooperative relationship can be sustainable in the long-term when based on trust. However, the process of building trust needs continuous cooperative endeavors between partners [25]. Moreover, a weaker party is obliged to cooperate when its powerful partners exert coercive power [1]. The stronger party should continuously develop and implement substantive methods to draw sincere trust from vulnerable partners to enjoy long-term benefits through cooperation, including higher quality and lower costs [4].
Hypothesis H2 (transparency → trust) was rejected, but this finding is open to interpretation. Reverse causality may be attained if trust can also positively influence higher levels of information-sharing and quality [52]. Alternatively, exploratory modeling of the likelihood of the causality between components of cooperation can be examined [43,44]. Models that added new paths including transparency → fairness and transparency → mutuality to the structural model for collaboration with first-order factors, and demonstrated an acceptable goodness-of-fit (χ2 = 566.543, df = 204; SRMR = 0.075; TLI = 0.902; CFI = 0.913). Transparency simultaneously played an antecedent role of both fairness and mutuality (path coefficients 0.87 and 0.84, respectively). Common sense supports the view that transparency is fundamental to a cooperative relationship, and essential for enhancing fairness and mutuality between partners. One expert commented: “…powerful partners tend to favor the simplest contract…additional requests…are inclined to be asked verbally…[and] cannot be ignored in light of the partners’ superior status”. Simple agreements are clearly and transparently understood, but can hinder trust-building, and frequent contact with a dominant partner can burden weaker partners. Transparency does not necessarily lead to improved trust, but may cause reductions where trust has not yet developed. After cooperation has been established through transparency, fairness, and mutuality, trust can be fostered and enhanced by cooperation (H1). As for H5 (Trust → Sustainability), given that trust among the shippers and shipping companies can realize the higher level of sustainability, the weaker members should also develop and implement methods to foster trust from their influential supply chain partners. However, because building trust is not an easy task, and trust has to be earned over time, shipping companies’ managers should prove continuously and with patience that their promises are kept, and complicated expectation or needs of shippers are met in daily interactions.
5. Conclusions
In this study, cooperation between firms directly affected trust and indirectly affected sustainability, but the components of collaboration may further initiate a virtuous circle. As partners come to trust each other, enhanced mutual cooperation is likely [25], and a long-term orientation between partners often stimulates diverse cooperative behaviors [4], which invite further empirical research. Besides, this cooperation behavior can be applied into other logistics areas such as last-mile logistics, as Perboli et al. [53] notably suggested.
Research into alternative functional stances may offer interesting avenues for future research. This paper reports the views of shipping service providers, but future work might investigate how influential partners may hold differing opinions about how collaboratively they interact with vulnerable partners, or how collaboration between weaker partners affects them.
Generalization of the model of inter-firm relationships that was presented depends on how closely other research contexts mirror the conditions reported herein. Since each new inter-firm relationship is distinctive, experts would need to re-examine each item carefully. This implies that conclusions that joint demand forecasts and joint inventory management cannot be applied to the relationship between shippers and shipping companies may not be attained elsewhere. Furthermore, this study agrees that different views from one side can be derived from the other side. Albeit, the views of only one side (shipping firms) were examined in this study. The potential challenges might result in the common methods variance via the single informant design. The influential supply chain members also have opinions on how collaboratively they are treating their weaker SC partners, as well as on the collaboration levels of shipping companies toward them. To alleviate the concern about the assessment of only shipping companies, future research needs to be conducted based on data from both sides.
Author Contributions
C.-S.K. shaped a research idea, conducted the main analysis and wrote the research approach. J.D. reshaped the research idea and methodological knowledge. Y.-J.S. provided research ideas, collected data, and helped to implement the analysis.
Funding
This research received no external funding.
Conflicts of Interest
The authors declare no conflict of interest.
Appendix A. Measurement Items
- Transparency (four items)
- (1)
- Shippers exchange relevant and timely information with our firm (TRA1).
- (2)
- Shippers and our firm communicate smoothly through channels such as regular or casual meetings between executives or staff (TRA2).
- (3)
- Shippers make communication with our firm open and two-way (TRA3).
- (4)
- The cooperative and collaborative relationship between shippers and our firm is understood clearly and transparently through prior agreements (TRA4).
- Fairness (four items)
- (1)
- Shippers do not discriminate against our firm compared with other shipping companies (FAI1).
- (2)
- Shippers try to comply with regulations related to business transactions, including the standard form of contract and laws related to fair trade including the ‘Monopoly Regulation and Fair Trade Act’ and ‘Fair Transactions in Subcontracting Act’ (FAI2).
- (3)
- Shippers make an effort to guarantee reasonable and just profits for our firm (FAI3).
- (4)
- Shippers make an effort to bear reasonably and justly any additional risks, burden, and costs related to delivery with our firm (FAI4).
- Mutuality (eight items)
- (1)
- Overall, shippers understand our firm’s services well and are willing to provide any necessary assistance (MUT1).
- (2)
- Shippers are willing to share their facilities and equipment such as docks, cranes, and delivery vehicles with our firm (if shippers have such facilities and equipment) (MUT2).*
- (3)
- Shippers are willing to provide financial support such as bank loan guarantees, which are required to procure vessels for our firm (if shippers have such financial capabilities) (MUT3).
- (4)
- Shippers are willing to assist our firm in overcoming difficulties when our firm is faced with difficulties (MUT4).
- (5)
- Shippers and our firm, as equal business partners, settle together common cooperative and collaborative implementation plans or objectives (MUT5).
- (6)
- Shippers and our firm, as equal business partners, decide together the availability level of our facilities and equipment (MUT6).
- (7)
- Shippers and our firm, as equal business partners, together identify customer needs related to delivery and try to improve delivery quality jointly (MUT7).
- (8)
- Shippers and our firm, as equal business partners, review together the performance of our firm (MUT8).
- Trust (four items)
- (1)
- Overall, shippers are trustworthy (TRU1).
- (2)
- We believe the good faith of shippers when it comes to the relationship between shippers and our firm (TRU2).
- (3)
- We believe that shippers fulfill their contractual obligations (TRU3).
- (4)
- We believe that shippers benefit our firm (TRU4).
- Sustainability (four items)
- (1)
- The relationship between shippers and our firm is stable (SUS1) *.
- (2)
- The relationship between shippers and our firm will last and be strengthened over time (SUS2).
- (3)
- Shippers try to maintain their relationship with our firm, including developing new business plans or ideas together (SUS3).
- (4)
- Shippers try to enhance continuously their relationship with our firm, including expanding jointly new markets (some overseas) (SUS4).
Note. * MUT2 and SUS1 were deleted following exploratory factory analysis.
References
- Kim, K.K.; Park, S.-H.; Ryoo, S.Y.; Park, S.K. Inter-organizational Cooperation in Buyer–Supplier Relationships: Both Perspectives. J. Bus. Res. 2010, 63, 863–869. [Google Scholar] [CrossRef]
- Daugherty, P.J.; Richey, R.G.; Roath, A.S.; Min, S.; Chen, H.; Arndt, A.D.; Genchev, S.E. Is Collaboration Paying off for Firms? Bus. Horiz. 2006, 49, 61–70. [Google Scholar] [CrossRef]
- Rached, M.; Bahroun, Z.; Campagne, J.-P. Decentralised Decision-Making with Information Sharing vs. Centralised Decision-Making in Supply Chains. Int. J. Prod. Res. 2016, 54, 7274–7295. [Google Scholar] [CrossRef]
- Kalwani, M.U.; Narayandas, N. Long-Term Manufacturer-Supplier Relationships: Do They Pay off for Supplier Firms? J. Mark. 1995, 59, 1–16. [Google Scholar] [CrossRef]
- Kyunghyang News. Available online: http://biz.khan.co.kr/khan_art_view.html?artid=201710262108015&code=920100 (accessed on 28 October 2017).
- Thomson, A.M.; Perry, J.L.; Miller, T.K. Conceptualizing and Measuring Collaboration. J. Public Adm. Res. Theory 2009, 19, 23–56. [Google Scholar] [CrossRef]
- Cao, M.; Vonderembse, M.A.; Zhang, Q.; Ragu-Nathan, T.S. Supply Chain Collaboration: Conceptualisation and Instrument Development. Int. J. Prod. Res. 2010, 48, 6613–6635. [Google Scholar] [CrossRef]
- Geyskens, I.; Steenkamp, J.-B.E.M.; Kumar, N. Make, Buy, or Ally: A Transaction Cost Theory Meta-Analysis. Acad. Manag. J. 2006, 49, 519–543. [Google Scholar] [CrossRef]
- Williamson, O.E. Markets and Hierarchies, Analysis and Antitrust Implications: A Study in the Economics of Internal Organisation; Free Press: New York, NY, USA, 1975; ISBN 10: 0029353602. [Google Scholar]
- Bromiley, P.; Rau, D. Operations Management and the Resource Based View: Another View. J. Oper. Manag. 2016, 41, 95–106. [Google Scholar] [CrossRef]
- Dyer, J.H.; Singh, H. The Relational View: Cooperative Strategy and Sources of Interorganisational Competitive Advantage. Acad. Manag. Rev. 1998, 23, 660–679. [Google Scholar] [CrossRef]
- Acedo, F.J.; Barroso, C.; Galan, J.L. The Resource-Based Theory: Dissemination and Main Trends. Strat. Manag. J. 2006, 27, 621–636. [Google Scholar] [CrossRef]
- O’Toole, T.; Donaldson, B. Relationship Governance Structures and Performance. J. Mark. Manag. 2000, 16, 327–341. [Google Scholar] [CrossRef]
- Ramanathan, U.; Gunasekaran, A. Supply Chain Collaboration: Impact of Success in Long-Term Partnerships. Int. J. Prod. Econ. 2014, 147, 252–259. [Google Scholar] [CrossRef]
- Betts, S.C. Contingency Theory: Science or Technology? J. Bus. Econ. Res. 2003, 1, 123–130. [Google Scholar] [CrossRef]
- Molm, L.D. Affect and Social Exchange: Satisfaction in Power-Dependence Relations. Am. Sociol. Rev. 1991, 56, 475–493. [Google Scholar] [CrossRef]
- Nunkoo, R.; Ramkissoon, H. Power, Trust, Social Exchange and Community Support. Ann. Tour. Res. 2012, 39, 997–1023. [Google Scholar] [CrossRef]
- Morgan, R.M.; Hunt, S.D. The Commitment-Trust Theory of Relationship Marketing. J. Mark. 1994, 58, 20–38. [Google Scholar] [CrossRef]
- Organsation for Economic Co-operation and Development (OECD). The Well-Being of Nations: The Role of Human and Social Capital; Organsation for Economic Co-operation and Development: Paris, France, 2001. [Google Scholar]
- Adler, P.S.; Kwon, S.-W. Social Capital: Prospects for a New Concept. Acad. Manag. Rev. 2002, 27, 17–40. [Google Scholar] [CrossRef] [Green Version]
- Spekman, R.E.; Kamauff, J.W.; Myhr, N. An Empirical Investigation into Supply Chain Management. Supply Chain Manag. Int. J. 1998, 3, 53–67. [Google Scholar] [CrossRef]
- Golicic, S.L.; Foggin, J.H.; Mentzer, J.T. Relationship Magnitude and Its Role in Interorganisational Relationship Structure. J. Bus. Logist. 2003, 24, 57–75. [Google Scholar] [CrossRef]
- Anderson, J.C.; Narus, J.A. A Model of Distributor Firm and Manufacturer Firm Working Partnerships. J. Mark. 1990, 54, 42–58. [Google Scholar] [CrossRef]
- Kumar, G.; Nath Banerjee, R. Supply Chain Collaboration Index: An Instrument to Measure the Depth of Collaboration. Benchmark. Int. J. 2014, 21, 184–204. [Google Scholar] [CrossRef]
- Min, S.; Roath, A.S.; Daugherty, P.J.; Genchev, S.E.; Chen, H.; Arndt, A.D.; Richey, R.G. Supply Chain Collaboration: What’s Happening? Int. J. Logist. Manag. 2005, 16, 237–256. [Google Scholar] [CrossRef]
- Perboli, G.; Musso, S.; Rosano, M.; Tadei, R.L.; Godel, M. Synchro-Modality and Slow Steaming: New Business Perspectives in Freight Transportation. Sustainability 2017, 9, 1843. [Google Scholar] [CrossRef]
- Kwon, I.-W.G.; Suh, T. Trust, Commitment and Relationships in Supply Chain Management: A Path Analysis. Supply Chain Manag. Int. J. 2005, 10, 26–33. [Google Scholar] [CrossRef]
- Konovsky, M.A. Understanding Procedural Justice and Its Impact on Business Organizations. J. Manag. 2000, 26, 489–511. [Google Scholar] [CrossRef]
- Kumar, N.; Scheer, L.K.; Steenkamp, J.-B.E. The Effects of Supplier Fairness on Vulnerable Resellers. J. Mark. Res. 1995, 32, 54–65. [Google Scholar] [CrossRef]
- Harland, C.; Zheng, J.; Johnsen, T.; Lamming, R. A Conceptual Model for Researching the Creation and Operation of Supply Networks. Br. J. Manag. 2004, 15, 1–21. [Google Scholar] [CrossRef] [Green Version]
- Dwyer, F.R.; Schurr, P.H.; Oh, S. Developing Buyer-Seller Relationships. J. Mark. 1987, 51, 11–27. [Google Scholar] [CrossRef]
- Slone, R.E. Leading a Supply Chain Turnaround. Harv. Bus. Rev. 2004, 82, 114–121. [Google Scholar] [PubMed]
- Eyuboglu, N.; Ryu, S.; Tellefsen, T. Current and Future Interdependence: Effects on Channel Relationships. J. Mark. Channels 2003, 11, 3–26. [Google Scholar] [CrossRef]
- Wang, C.L.; Siu, N.Y.M.; Barnes, B.R. The Significance of Trust and Renqing in the Long-Term Orientation of Chinese Business-to-Business Relationships. Ind. Mark. Manag. 2008, 37, 819–824. [Google Scholar] [CrossRef]
- Ganesan, S. Determinants of Long-Term Orientation in Buyer-Seller Relationships. J. Mark. 1994, 58, 1–19. [Google Scholar] [CrossRef]
- Bove, L.L.; Johnson, L.W. Customer Relationships with Service Personnel: Do We Measure Closeness, Quality or Strength? J. Bus. Res. 2001, 54, 189–197. [Google Scholar] [CrossRef]
- Golicic, S.L. A Comparison of Shipper and Carrier Relationship Strength. Int. J. Phys. Distrib. Logist. Manag. 2007, 37, 719–739. [Google Scholar] [CrossRef]
- Golicic, S.L.; Mentzer, J.T. An Empirical Examination of Relationship Magnitude. J. Bus. Logist. 2006, 27, 81–108. [Google Scholar] [CrossRef]
- United Nations Conference on Trade and Development (UNCTAD). Review of Maritime Transport 2017; UNCTAD/RMT/2016; United Nations Conference on Trade and Development: Geneva, Switzerland, 2017; ISBN 978-92-1-112922-9. [Google Scholar]
- Ministry of Oceans and Fisheries (MOF). Government’s Internal Data; Ministry of Oceans and Fisheries: Sejong, Korea, 2016.
- Neuman, W.L. Social Research Method; Pearson: Harlow, UK, 2014; ISBN 9781292020235. [Google Scholar]
- Armstrong, J.S.; Overton, T.S. Estimating Nonresponse Bias in Mail Surveys. J. Mark. Res. 1977, 14, 396–402. [Google Scholar] [CrossRef]
- Hair, J.F.; Black, W.C.; Babin, B.J.; Anderson, R.E. Multivariate Data Analysis; Pearson: Essex, UK, 2014; ISBN 978-0138132637. [Google Scholar]
- Byrne, B.M. Structural Equation Modelling with AMOS: Basic Concepts, Applications, and Programming; Routledge: London, UK, 2010; ISBN 978-1138797031. [Google Scholar]
- Medsker, G.J.; Williams, L.J.; Holahan, P.J. A Review of Current Practices for Evaluating Causal Models in Organizational Behavior and Human Resources Management Research. J. Manag. 1994, 20, 439–464. [Google Scholar] [CrossRef]
- Marsh, H.W.; Barnes, J.; Hocevar, D. Self-Other Agreement on Multidimensional Self-Concept Ratings: Factor Analysis and Multitrait–Multimethod Analysis. J. Pers. Soc. Psychol. 1985, 49, 1360–1377. [Google Scholar] [CrossRef]
- Cao, M.; Zhang, Q. Supply Chain Collaborative Advantage: A Firm’s Perspective. Int. J. Prod. Econ. 2010, 128, 358–367. [Google Scholar] [CrossRef]
- Widaman, K.F. Hierarchically Nested Covariance Structure Models for Multitrait-Multimethod Data. Appl. Psychol. Meas. 1985, 9, 1–26. [Google Scholar] [CrossRef] [Green Version]
- Min, S.; Mentzer, J.T. Developing and Measuring Supply Chain Management Concepts. J. Bus. Logist. 2004, 25, 63–99. [Google Scholar] [CrossRef]
- Hu, L.T.; Bentler, P.M. Cutoff Criteria for Fit Indices in Covariance Structure Analysis: Conventional Criteria Versus New Alternatives. Struct. Equ. Model. Multidiscip. J. 1999, 6, 1–55. [Google Scholar] [CrossRef]
- Holmbeck, G.N. Toward Terminological, Conceptual, and Statistical Clarity in the Study of Mediators and Moderators: Examples from the Child-Clinical and Pediatric Psychology Literatures. J. Consult. Clin. Psychol. 1997, 65, 599–610. [Google Scholar] [CrossRef] [PubMed]
- Li, S.; Lin, B. Accessing Information Sharing and Information Quality in Supply Chain Management. Decis. Support Syst. 2006, 42, 1641–1656. [Google Scholar] [CrossRef]
- Perboli, G.; Rosano, M.; Saint-Guillain, M.; Rizzo, P. A Simulation-Optimization Framework for City Logistics. An Application on Multimodal Last-Mile Delivery. IET Intell. Transp. Syst. 2018, 12, 262–269. [Google Scholar] [CrossRef]
Figure 1.
Research model.

Figure 2.
Structural model for collaboration including cooperation. *** p < 0.01.


Table 1.
Demographic data for 167 respondents.
| Variables | Percentage |
|---|---|
| Type of shipping registered | |
| Coastal shipping | 46.7 |
| Ocean-going shipping | 53.3 |
| Type of vessel | |
| Container | 9.6 |
| Bulk carrier | 39.5 |
| Tanker | 30.5 |
| Others | 20.4 |
| Work experience | |
| Less than five years | 10.8 |
| 5–9 years | 16.8 |
| 10–19 years | 53.8 |
| Over 20 years | 18.6 |
| Job title | |
| Staff/Assistant manager | 11.4 |
| Manager/Deputy department manager | 32.3 |
| Department manager | 34.7 |
| (Senior) Director/Chief executive officer (CEO) | 21.6 |
| Number of employees | |
| Fewer than 10 | 10.8 |
| 10–49 | 35.9 |
| 50–99 | 25.7 |
| 100–199 | 12.6 |
| More than 200 | 15.0 |
| Contract period | |
| Less than one year | 32.9 |
| 1–2 years | 33.5 |
| 3–9 years | 16.8 |
| More than 10 years | 16.8 |
Table 2.
Descriptive statistics for collaboration.
| Number of Items | Mean (Standard Deviation) | Cronbach’s α | |
|---|---|---|---|
| Transparency | 4 | 4.13 (1.36) | 0.920 |
| Fairness | 4 | 4.01 (1.41) | 0.925 |
| Mutuality | 7 | 3.55 (1.43) | 0.960 |
| Trust | 4 | 4.61 (1.23) | 0.914 |
| Sustainability | 3 | 4.02 (1.38) | 0.924 |
Table 3.
Confirmatory factor analysis results for sub-constructs of cooperation.
| Sub-Constructs | Items | Standardized Regression Weight | t-Value | Squared Multiple Correlations | Standard Error | Construct Reliability | AVE | Cronbach’s α |
|---|---|---|---|---|---|---|---|---|
| Transparency | TRA1 | 0.857 | 16.378 *** | 0.734 | 0.055 | |||
| TRA2 | 0.752 | 12.607 *** | 0.566 | 0.063 | 0.921 | 0.745 | 0.920 | |
| TRA3 | 0.921 | 19.559 *** | 0.849 | 0.049 | ||||
| TRA4 | 0.913 | 1 | 0.834 | 1 | ||||
| Fairness | FAI1 | 0.759 | 13.031 *** | 0.575 | 0.057 | |||
| FAI2 | 0.818 | 15.136 *** | 0.669 | 0.056 | 0.923 | 0.752 | 0.925 | |
| FAI3 | 0.962 | 23.062 *** | 0.925 | 0.047 | ||||
| FAI4 | 0.916 | 1 | 0.84 | 1 | ||||
| Mutuality | MUT1 | 0.864 | 16.969 *** | 0.746 | 0.054 | |||
| MUT3 | 0.795 | 14.18 *** | 0.632 | 0.067 | ||||
| MUT4 | 0.852 | 16.422 *** | 0.726 | 0.056 | ||||
| MUT5 | 0.946 | 21.795 *** | 0.894 | 0.046 | 0.961 | 0.779 | 0.960 | |
| MUT6 | 0.939 | 21.323 *** | 0.882 | 0.047 | ||||
| MUT7 | 0.864 | 16.999 *** | 0.747 | 0.053 | ||||
| MUT8 | 0.907 | 1 | 0.823 | 1 | ||||
| Chi-square = 273.066, Degrees of freedom = 87, SRMR = 0.039, TLI = 0.922, CFI = 0.935 | ||||||||
1 Not estimated because loading was fixed at 1.0, *** p < 0.01. AVE: average variance extracted.
Table 4.
Discriminant validity of the sub-constructs of cooperation.
| Transparency | Fairness | Mutuality | |
|---|---|---|---|
| Transparency | 0.86 1 | ||
| Fairness | 0.84 *** | 0.87 1 | |
| Mutuality | 0.81 *** | 0.84 *** | 0.88 1 |
1 Square root of the AVE for each sub-construct, *** p < 0.01.
Table 5.
Confirmatory factor analysis results for the sub-constructs of collaboration.
| Sub-Constructs | Items | Standardized Regression Weight | t-Value | Squared Multiple Correlations | Standard Error | Construct Reliability | AVE | Cronbach’s α |
|---|---|---|---|---|---|---|---|---|
| Transparency | TRA1 | 0.857 | 16.398 *** | 0.735 | 0.055 | |||
| TRA2 | 0.754 | 12.651 *** | 0.568 | 0.063 | 0.921 | 0.746 | 0.920 | |
| TRA3 | 0.920 | 19.493 *** | 0.847 | 0.050 | ||||
| TRA4 | 0.913 | 1 | 0.833 | 1 | ||||
| Fairness | FAI1 | 0.761 | 13.121 *** | 0.578 | 0.057 | |||
| FAI2 | 0.822 | 15.331 *** | 0.675 | 0.055 | 0.924 | 0.754 | 0.925 | |
| FAI3 | 0.958 | 23.025 *** | 0.917 | 0.047 | ||||
| FAI4 | 0.918 | 1 | 0.843 | 1 | ||||
| Mutuality | MUT1 | 0.864 | 17.125 *** | 0.747 | 0.053 | |||
| MUT3 | 0.798 | 14.346 *** | 0.636 | 0.066 | ||||
| MUT4 | 0.855 | 16.704 *** | 0.732 | 0.056 | ||||
| MUT5 | 0.942 | 21.785 *** | 0.887 | 0.046 | 0.961 | 0.779 | 0.960 | |
| MUT6 | 0.937 | 21.429 *** | 0.878 | 0.047 | ||||
| MUT7 | 0.866 | 17.183 *** | 0.749 | 0.052 | ||||
| MUT8 | 0.910 | 1 | 0.829 | 1 | ||||
| Trust | TRU1 | 0.852 | 13.023 *** | 0.725 | 0.079 | |||
| TRU2 | 0.932 | 14.824 *** | 0.868 | 0.077 | 0.914 | 0.780 | 0.914 | |
| TRU3 | 0.812 | 12.146 *** | 0.659 | 0.079 | ||||
| TRU4 | 0.812 | 1 | 0.659 | 1 | ||||
| Sustainability | SUS2 | 0.814 | 15.536 *** | 0.662 | 0.053 | |||
| SUS3 | 0.941 | 23.005 *** | 0.885 | 0.040 | 0.929 | 0.814 | 0.924 | |
| SUS4 | 0.945 | 1 | 0.893 | 1 | ||||
| Chi-square = 507.879, Degrees of freedom (df) = 199, Standardized root mean residual (SRMR) = 0.043, TLI = 0.914, CFI = 0.926 | ||||||||
1 Not estimated because loading was fixed at 1.0, *** p < 0.01.
Table 6.
Discriminant validity of the sub-constructs of collaboration.
| Transparency | Fairness | Mutuality | Trust | Sustainability | |
|---|---|---|---|---|---|
| Transparency | 0.864 1 | ||||
| Fairness | 0.839 *** | 0.868 1 | |||
| Mutuality | 0.810 *** | 0.842 *** | 0.883 1 | ||
| Trust | 0.681 *** | 0.792 *** | 0.774 *** | 0.853 1 | |
| Sustainability | 0.697 *** | 0.762 *** | 0.771 *** | 0.762 *** | 0.902 1 |
1 Square root of the AVE for each sub-construct, *** p < 0.01.
Table 7.
Comparison of fit of three models.
| Null (M0) | One factor (M1) | Second-Order Factor (M2) | M0–M1 | M1–M2 | ||
|---|---|---|---|---|---|---|
| Cooperation | χ2 | 2973.2 | 633.0 | 273.0 | 2340.2 *** | 360.0 *** |
| df | 105 | 90 | 87 | 15 | 3 | |
| SRMR | 0.633 | 0.067 | 0.039 | SI | SI | |
| TLI | 0 | 0.779 | 0.922 | SI | SI | |
| CFI | 0 | 0.811 | 0.935 | SI | SI | |
| Collaboration | χ2 | 4412.8 | 1228.1 | 525.2 | 3184.7 *** | 702.9 *** |
| df | 231 | 209 | 204 | 22 | 5 | |
| SRMR | 0.607 | 0.069 | 0.047 | SI | SI | |
| TLI | 0 | 0.731 | 0.913 | SI | SI | |
| CFI | 0 | 0.756 | 0.923 | SI | SI | |
*** p < 0.01, SI: Significantly improved.
Table 8.
Structural parameter estimates of first-order factors of collaboration.
| Structural Relationship | Standardized Regression Weight | t-Value | Accept/Reject |
|---|---|---|---|
| Transparency → Trust (H2) | −0.057 | −0.521 | Reject |
| Fairness → Trust (H3) | 0.501 | 4.047 *** | Accept |
| Mutuality → Trust (H4) | 0.424 | 3.868 *** | Accept |
| Trust → Sustainability (H5) | 0.793 | 10.987 *** | Accept |
| Goodness-of-fit indices χ2 = 535.186 (df = 202), SRMR = 0.064, TLI = 0.909, CFI = 0.920 | |||
*** p < 0.01.
© 2018 by the authors. Licensee MDPI, Basel, Switzerland. This article is an open access article distributed under the terms and conditions of the Creative Commons Attribution (CC BY) license (http://creativecommons.org/licenses/by/4.0/).
Share and Cite
MDPI and ACS Style
Kim, C.-S.; Dinwoodie, J.; Seo, Y.-J. Inter-Firm Cooperation and Collaboration in Shipper—Shipping Company Relationships for Enhancing Sustainability. Sustainability 2018, 10, 3714. https://doi.org/10.3390/su10103714
AMA Style
Kim C-S, Dinwoodie J, Seo Y-J. Inter-Firm Cooperation and Collaboration in Shipper—Shipping Company Relationships for Enhancing Sustainability. Sustainability. 2018; 10(10):3714. https://doi.org/10.3390/su10103714
Chicago/Turabian StyleKim, Chang-Soo, John Dinwoodie, and Young-Joon Seo. 2018. "Inter-Firm Cooperation and Collaboration in Shipper—Shipping Company Relationships for Enhancing Sustainability" Sustainability 10, no. 10: 3714. https://doi.org/10.3390/su10103714
Note that from the first issue of 2016, this journal uses article numbers instead of page numbers. See further details here.