The Impact of Perceived Value on Farmers’ Regret Mood Tendency

1
The Research Base on Rural Land Resources Use and Protection, School of Economics and Management, Jiangxi Agriculture University, 1101 Zhimin Street, Changbei Economic and Technological Development Zone, Nanchang 330045, China
2
China Institute for Micro, Small and Medium-sized Enterprises, Qilu University of Technology (Shandong Academy of Sciences), 3501 Daxue Rd., Jinan 250000, China
3
College of Business Administration, Inha University, Incheon 22212, Korea
4
School of Agricultural Economics and Rural Development, Renmin University of China, No. 59 Zhongguancun Street, Haidian District, Beijing 100872, China
*
Author to whom correspondence should be addressed.
Sustainability 2018, 10(10), 3650; https://doi.org/10.3390/su10103650
Submission received: 12 September 2018
/
Revised: 3 October 2018
/
Accepted: 3 October 2018
/
Published: 11 October 2018
(This article belongs to the Special Issue Challenges on the Asian Models and Values for the Sustainable Development)
Abstract
:Based on a survey of the poverty alleviation resettlement (PAR) farmers in China, this paper aims to investigate the relationship between the expected value, perceived value and regret mood of the relocated farmers. The results show that the expected value can positively affect the perceived value, and the latter negatively impact the regret mood of the PAR farmers. On average, the farmers with regret and non-regret sentiments are approximately fifty/fifty in percentage terms. Internal factors, such as demand levels, and external factors, such as relocation costs, also have significant effects on the regret mood of farmers after they have relocated. However, those factors have significant differences in their impacts on poor and non-poor households. Several political implications are also provided.
1. Introduction
The purpose of poverty alleviation resettlement (PAR) is to encourage farmers in rural poverty-stricken areas to relocate to help improve their living conditions [1,2]. During 2011–2015, more than 3.94 million farmers in poverty-stricken areas were relocated within China. This number is almost 1.37-times than that of the previous 10 years. As a part of this process, the government has constructed many resettlement houses and supported infrastructure and the development of public facilities, including education, health and cultural facilities in the resettlement areas, thus improving the living conditions for the relocated farmers. Under the government’s guidance on developing modern agriculture and service industries, the relocated farmers have significantly increased their incomes and gradually abolished poverty. However, relocation can force those farmers that are affected to face many challenges in terms of the changes in their lifestyles [3], living patterns [4] and cultural practices [5,6] in their new living environments. As they hate the change, some people in poverty-stricken areas may hold a negative attitude towards relocation. As far as motivation is concerned, no matter whether the farmers are active or passive in their attitude to the relocation, they are required to relocate [1,7]. However, the discomfort caused by the expected changes might induce the relocated farmers to want to return to their original poverty-stricken places, thus resulting in the failure of the relocation projects. Drawing on those perspectives, using a survey in Jiangxi Province in China, we examine how the expected and perceived value of relocation can influence the mood of the relocated farmers, thus shedding light on the analysis of expectations for the work of relocation.
2. Literature Review
The poverty alleviation resettlement (PAR) targets poor people in poverty-stricken areas by helping them relocate to other areas voluntarily. With the help of advanced productivity and living conditions in the resettlement areas, the policy of so-called targeted poverty alleviation in China aims to help the relocated people gradually move out of poverty and become wealthy by adjusting to the new economic structure and the increased income channels [8]. The intention of this policy is that the targeted people are willing to move to the resettlement places for the purpose of pursuing better living and working conditions, thus transcending their lives of poverty. In theory, resettlement can refer to international immigration and internal migration. In the literature, both types of resettlement share similar characteristics and purposes. Immigration destinations are countries or regions with better economic conditions and social welfare. The data from the Migration Policy Institute (MPI) show that more than 79 million immigrants came to the United States and became legal residents by 2016. During the period of 2011–2016, 1.2 million immigrants settled in Canada. Therefore, the complexity of international and intranational migration has become a part of globalization [9]. Many researchers are concerned with the issues raised in the destination countries or receiving areas because of resettlement [10]. These issues include urban population growth [11], the expenditure on public resources—including education [12,13], welfare and unemployment [14]—human genetic changes [15,16] and even the fears of local people [17]. Some researchers also focus on the social adaptability, health benefits and poverty reduction experienced by the relocated people. Becerra and Quijano et al. [18] suggested that the government could help the relocated people reduce poverty through education and language training. Language training appears to be very effective in reducing the poverty of low-income people, while education is only beneficial to newly relocated people who have received higher education. With respect to improving the health conditions, the decline in immigrants’ health might be due to changes in dietary habits, etc. This implies that there is a significant gap in nutrition and health, which creates obstacles in achieving maximum health equity [19]. As evidenced, illness is one of the major causes of familial poverty [20]. In sum, unbalanced welfare and environmental conditions are the important causes of resettlement. Several studies focus on the gap in the living environments between rural areas and urban cities. For example, Sørensen [21] focused on the rural-urban differences in life satisfaction in the European Union. Rural dwellers are found to have a significantly higher life satisfaction than city dwellers when considering the socio-economic factors to be constant. Berry and Okulicz-Kozaryn [22] suggested that there is a gradient in subjective well-being (happiness) that rises from its lowest levels in large central cities to its highest levels on the small-town/rural periphery in the United States. D’Acci [23] suggests how to improve the positional value for urban cities. However, at low levels of economic development, there might exist substantial gaps favoring urban over rural areas in income, education and occupational structure and, consequently, a large excess life satisfaction in urban areas over rural areas [24]. In some developing countries, such as China, resettlement can be affected by the gap in environmental conditions among the regions. For example, Gao et al. [25] identified the factors for the inter-regional immigration in China. They suggested that the income gap, poverty and a reduction of demand for labor in rural areas are the driving forces behind immigration. Liu et al. [26] found that in terms of PAR in China, there might be livelihood vulnerability arising from the different relocation characteristics. They also suggested that the PAR generally achieves the target of livelihood vulnerability reduction. Furthermore, Xiao et al. [27] constructed a model to evaluate the quality of livelihood recovery of the resettlement. They suggested that life reconstruction, development reconstruction and safety reconstruction contribute to the quality of recovery of the resettlement. While the deterioration of environmental conditions can lead to immigration, immigration might also lead to environmental changes in the immigrant destinations [28].
Expected value theory is an influential theory in motivation psychology. Many researchers employ expected value, perceived value and regret emotion tendency in the areas of consumer purchasing behavior. The theory posits that the motivation of an individual to accomplish various tasks is determined by the expectations of the success of the task and the values it gives to the task. The greater the probability that an individual believes he or she will reach the desired value, the greater is the incentive value derived from the expected value and the motivation for the individual to accomplish the task [29]. In the meantime, the expected value also has an impact on perceived value and satisfaction [30]. Therefore, increased perceived value leads to consumers’ expected raised and reduced regret moods [31,32].
Regarding the application of expected value theory, it is worthwhile doing further research on the motivation tendency of the immigrants in the following areas. First, the existing studies employ life indices to examine the effects of immigration on poverty alleviation through a comparison of the scores measured by the indices before and after immigration has occurred. However, there is no consensus on the use of a common life index; thus, the estimation results are diverse. Second, several studies focus on the social adaptability of the immigrants in terms of social culture transformation and the living capability from a static point of view. However, the studies on the psychological changes of immigrants are scarce. To this end, we have constructed a dynamic behavioral model called “expected value-perceived value-emotional tendency”. The model employs expectancy differences in human behavior to determine the levels of the satisfaction of the relocated people through an investigation into the regret mood. Therefore, in this paper, we empirically analyze the impact of the expected value of farmers on the perceived value, based on the survey data of 348 relocated farmers, which verifies the impact of the perceived value on the relocated people’s regret mood tendency.
3. Related Theories and Hypotheses
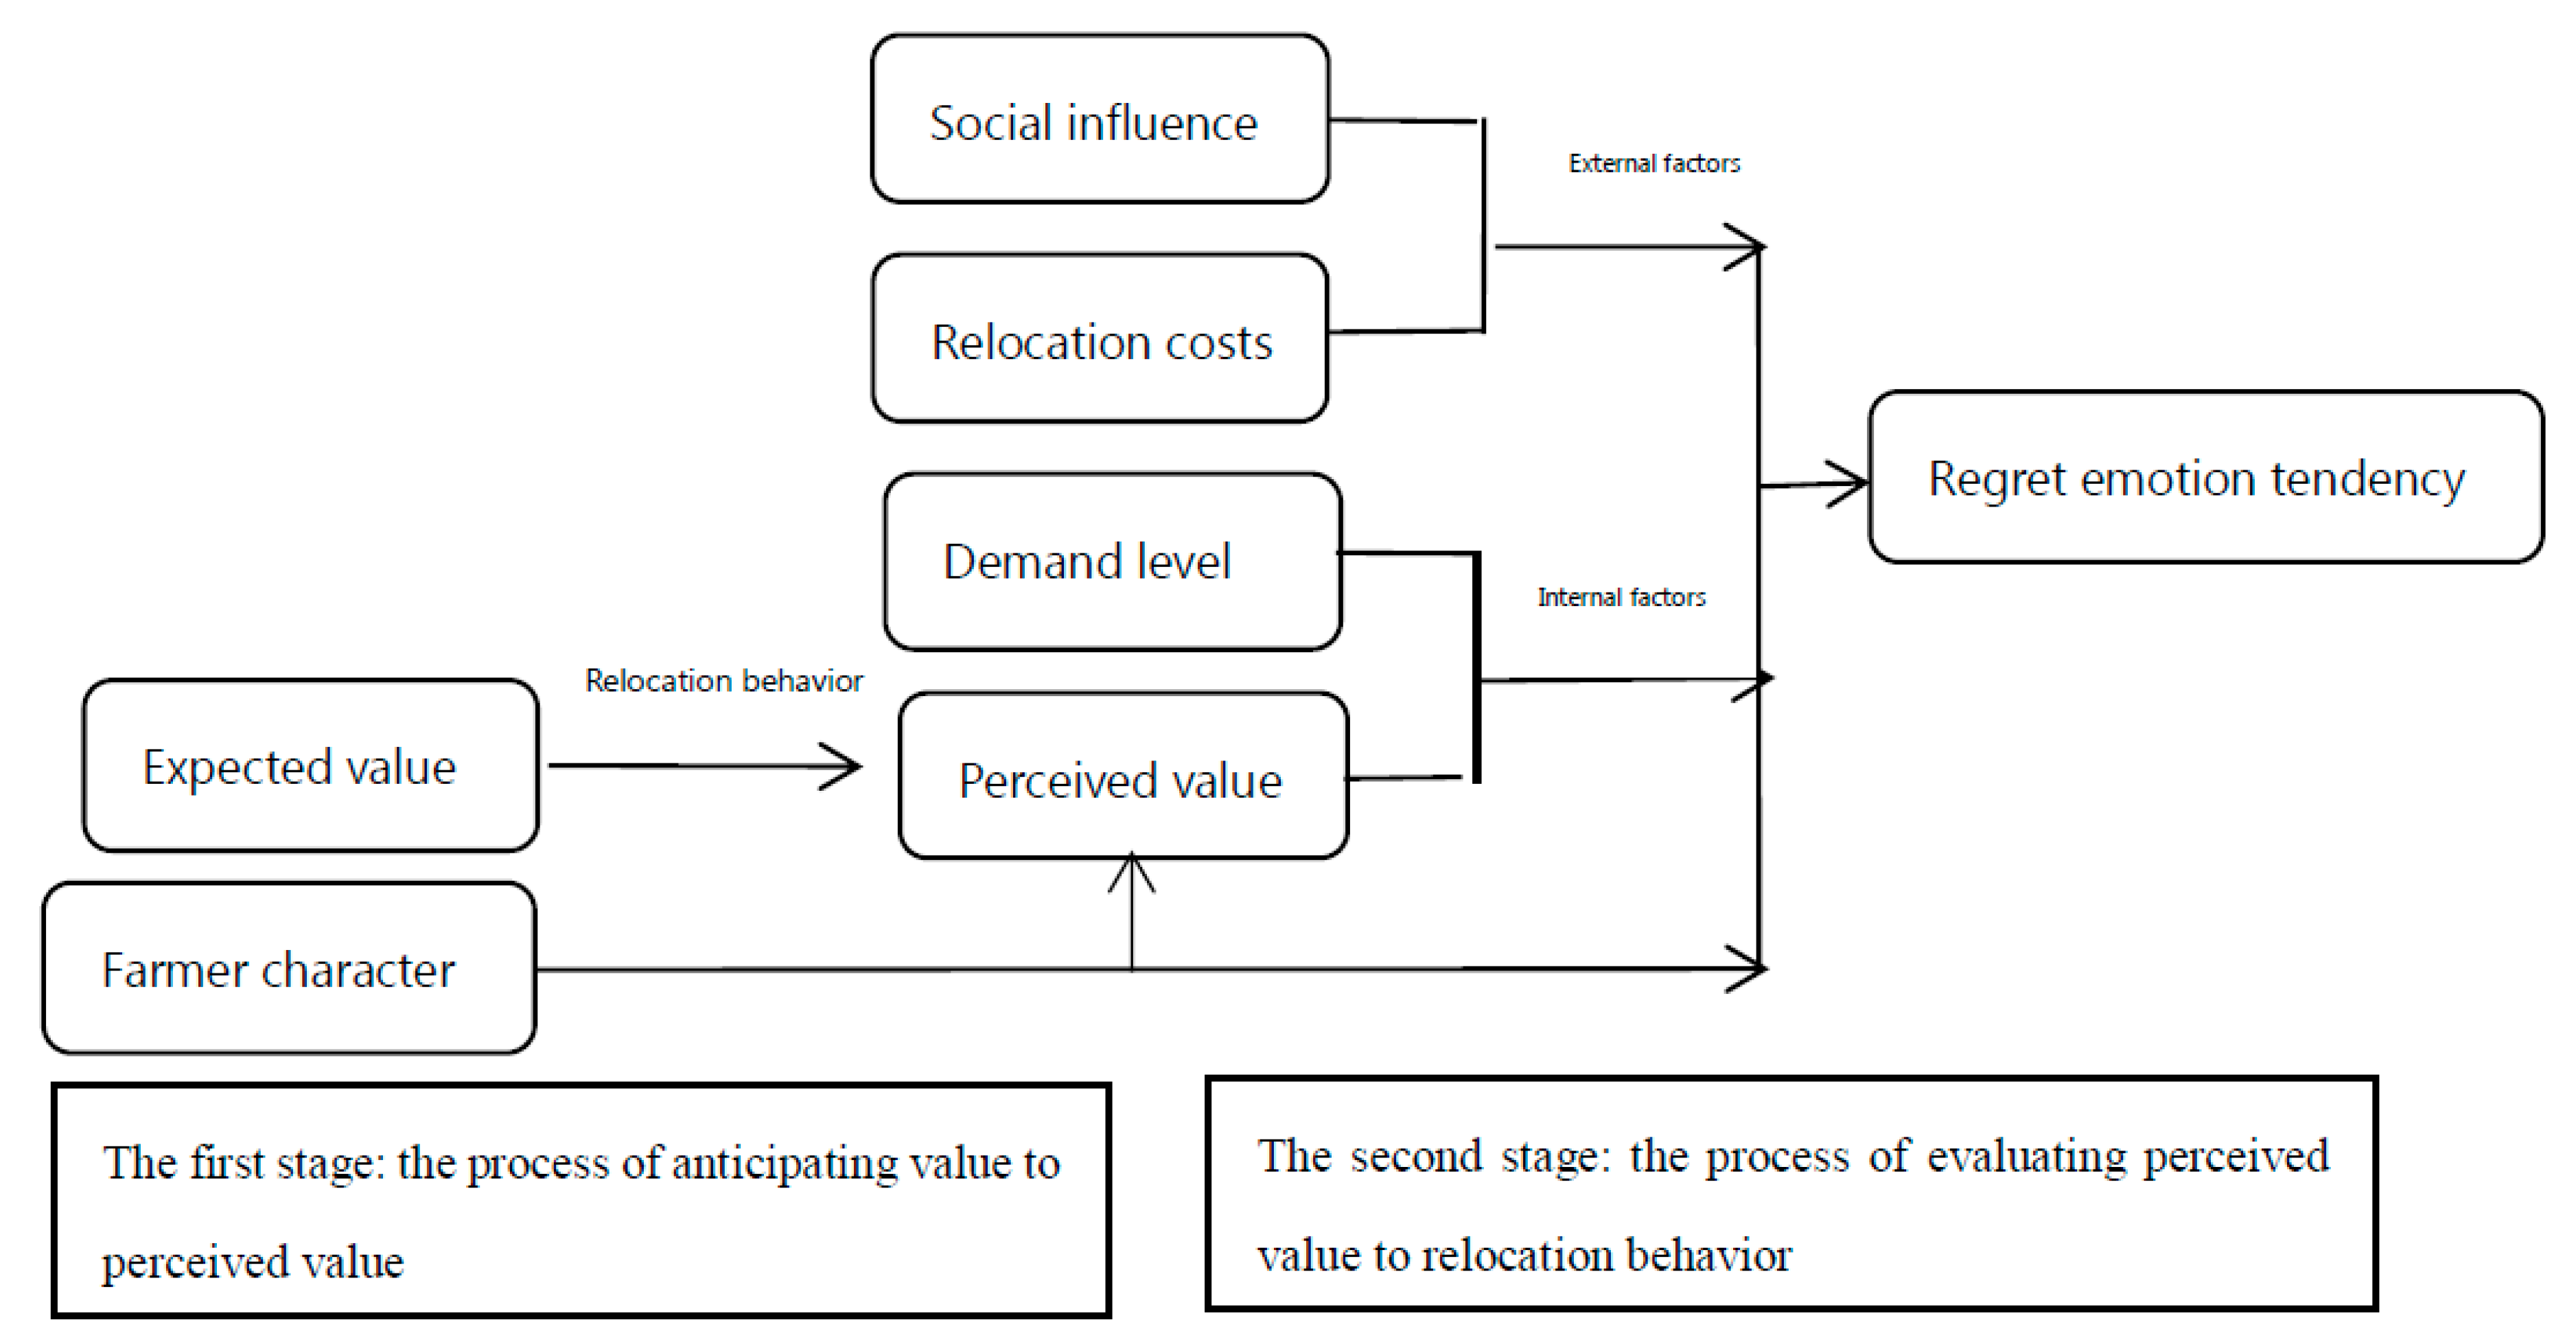
Most research on satisfaction is in the field of consumer behavior, which focuses on consumer purchasing behavior. A consumer has the expected value on a product that results in the purchase behavior relating to a product. The consumer then gains the consumption experience when using the product. In the process, perceived value is formed. After using the product for a period, the consumer evaluates the product, and this post-purchase evaluation is often reflected by post-purchase psychological emotions. The positive behavior is to recommend others to buy this kind of product. In contrast to this, negative behavior is called the regret mood, which results in the consumer either refusing to buy the product again or returning it. The regret mood has a significant and negative influence on the other consumers [33]. The effect of regret emotion on purchase behavior also fits in with the expectation difference theory paradigm. First, Oliver [34] suggests that the consumer’s purchase of a product follows the expected value of the product before purchase. Second, the product purchased by a consumer is superior to the product options that have been evaluated and abandoned [30,31]. Once the purchase does not meet either of the above two propositions, this leads to the regret mood. Therefore, based on the consumer behavior theory, we set a propensity model of relocation behavior, as shown in Figure 1.
As one of the fundamental theories of motivational psychology, expectation value theory posits that the individual’s motivation to accomplish a certain task is determined by the likelihood of his/her success in the task and the value assigned to it. The greater the likelihood of reaching the goal, the greater is the incentive value obtained from this goal, and the greater is the motivation to accomplish the task. Genders, ages and incomes can affect the expectations for completing a task [35]. PAR could be viewed as a purchase decision-making act, which is the process of purchasing housing and living conditions at the relocation site under the guidance of the government. The initial motivation of the farmers to relocate is to increase their incomes and to improve their living, educational and ecological environments. In sum, it is to increase the expected value. Their motivation to relocate could be caused by their own expectations or the needs of the government. The greater the value farmers expect from relocation, the greater enthusiasm they have for participating in it.
In comparison, perceived value is a subjective assessment of the effectiveness of a product or service; it refers to the residual value after deducting the cost of obtaining the product or service. The formation of perceived value has two stages: the first stage is the individual’s process of the perception of acquiring the product or service utility, which is also the process of comparing the perceived value with its expected value; the second stage is the result of the evaluation of the individual’s combined total gains and losses, in which the individual combines the results of the previous phase to make a satisfactory or unsatisfactory evaluation, which is the result of an individual’s subjective perception of value [36]. The perceived value of the relocated farmers also has the two stages. In the first stage, the farmers experience a period of living in the resettlement place and compare it with the expected value. As a result, the relocated farmers will have a perceived value of the PAR. This perception mainly comes from their personal experience of lifestyles and cultural practices. It also depends on their own feelings or conversations with friends and relatives and on the government’s propaganda and other channels. In the second stage, considering the perceived value and the degree of demand and the cost of relocation, the farmer will make an overall evaluation of the relocation behavior, which can lead to the regret mood or a certain degree of regret. This degree of regret could be affected by internal demands, external relocation costs and the adoption of channels. Based on the above discussions, we have the following hypotheses.
Hypothesis 1.
The expected value has a positive effect on the perceived value of the relocated farmers.
A person’s expected value can predict the extent to which an action will meet a person’s goals before he/she decides to relocate for the policymakers. Both the farmers and the government expect that the relocation can improve the living conditions for the relocated farmers, including living environments, children’s education environments, the ecological environment, etc. The higher the farmers’ expected value is, the more value the farmers will perceive when they relocate [37]. Therefore, the expected value has a positive effect on the experiential value of the farmers.
The formation of perceived value is the process of value experience and evaluation. It can be a kind of innermost spiritual satisfaction that creates memory or produces a good aftertaste, which gives the policymakers an emotional perception through an economic experience [38]. In theory, the perceived value of the relocation has four secondary indicators. First, publicity can produce the perceived benefits of relocation. Second, the farmers intuitively perceive the benefits of the relocation. Third, the farmers know the benefits of the relocation through the channels of their neighborhood and folks. Fourth, the farmers learn the benefits of the relocation through the media. The higher is the level of the perceived value, the lower is the likelihood that the farmers will have regret after relocation. Therefore, we suggest that the perceived value has a negative impact on the regret mood of the relocated farmers.
Hypothesis 2.
Perceived value has a negative impact on the farmers’ regret mood tendency.
The degree of demand is the degree of the urgent needs of the farmers to pursue certain types of life according to their own family circumstances. Two indicators are survival and the educational needs. According to Maslow’s theory of the need hierarchy of human beings, the farmers’ regret mood of relocation depends on the differences in the needs of the farmers. Although the perceived value is not large, the high degree of the farmers’ needs can cause their regret mood tendency to be weakened [39]. Therefore, the degree of demand has a negative impact on the farmers’ regret mood tendency in relation to the relocation.
Hypothesis 3.
The degree of demand has a negative impact on the farmers’ regret mood tendency.
PAR addresses the costs of relocating farmers from their original locations to the resettlement sites, including economic and emotional costs. Economic cost refers to the economic expenditure on housing purchases and land acquisition at the resettlement site, and on the relocation itself. The emotional cost is attributable to the loss of belongings, an increase in communication costs and the emotional energy consumed in adapting to the lifestyle and cultural practices at the resettlement sites. For the relocated farmers, the higher the relocation cost is, the more serious the regret mood tendency of PVI will be. Therefore, we have the following hypothesis.
Hypothesis 4.
The cost of PAR has a positive impact on the farmers’ regret mood tendency.
Social influence theory posits that team behavior, intentionally or unintentionally, has an impact on personal behavior, manifested as obedience or disobedience. The main social impact arises from four areas: ➀ being affected by relatives and friends; ➁ being affected by local cadres; ➂ being affected by resettlement policies; and ➃ being affected by the resettlement sites. Being affected by relatives and friends refers to the mentality of a subordinate. Being affected by the local cadres is due to obedience or disobedience. Being affected by resettlement sites arises from the psychology of self-judgment. Those social influences can have a significant impact on the farmers’ emotions in different ways. Thus, Hypothesis 5 is as follows.
Hypothesis 5.
Social influences have an important impact on the regret mood tendency of the farmers.
4. Data and Methods
4.1. Data and Variable Description
The data in this study are based on a survey that was conducted in 2016 on farmers from three counties or cities—Jiujiang, Ji’an and Ganzhou—in Jiangxi Province. With the assistance of the local governments, the survey has been conducted by distribution and on-site interviews. The three counties have been randomly selected from the relocation-related counties or cities, which include one poverty-stricken county and two resettlement-related counties or cities. The survey subjects are farmers who have been relocated for more than three years. The sample is comprised of 360 respondents randomly selected from the three counties or cities. We have received 348 valid responses for analysis.
According to the classification of the implementation policy of the Chinese PAR, the sample consists of 154 poor households and 194 non-poor households. As shown in Table 1, the average age of the householders is 49.586 years old, 50.922 years old for poor householders and 48.526 for non-poor householders. Additionally, males account for 55.17% in the sample and females for 44.83%. Their average educational background is junior high school level. For a family, the labor force is 3.10, 3.23 for the poor householders and 3 for non-poor householders. The measurement of these variables has been derived from their questionnaire. The questions have been designed in the form of 5-point Likert scales. Likert scales are quite widely used in the literature because they are one of the most reliable ways to measure opinions, perceptions and behaviors [40]. For this, the average social intentions can be derived by averaging the sum of the total scores using Luckett scales [41]. In this survey, a 5-point Likert scale provided a range of answer options, from “strongly disagree” to “strongly agree”. The variables of interest and control variables are described as follows.
The degree of education of a householder is as follows: 1 for illiterate, 2 for elementary school, 3 for junior high school, 4 for high school/technical secondary school/vocational high/technical school and 5 for university/college and above.
4.1.1. Independent Variables
Expected value: Based on the on the expected value in the survey, 39.65% of the farmers strongly agreed on the need to improve the ecological environments. In addition, 62.07% of the rural farmers agreed and strongly agreed on the need to improve the living and educational environments, and their attitudes were very optimistic. With respect to raising income levels, 60.09% of the farmers more or strongly agreed that this was a need, as shown in Table 2. As expected, the poor households have higher expected values for the relocation than the non-poor households.
Regret mood: Overall, the farmers with regret and non-regret sentiments were approximately fifty/fifty in percentage. About 47.70% of the farmers had a high level of regret mood; 18.97% had a neutral attitude; and 33% had no regret mood. The shape of the farmers’ moods can be plotted as an “N” type. The farmers who chose “strongly disagreed” and “more agreed” in relation to their regret mood were 102 and 114, respectively. In comparison, the poor households had a higher level of regret mood than the non-poor households, which may imply a lower level of adaptability for the poor households.
4.1.2. Internal Factors
Perceived value: Table 3 indicates that the perceived value after the PVI is high with an average of 4.05 or more. With respect to the intuitive experience of the value, the number of farmers who strongly agreed on the benefits of the PAR is 223, accounting for 89.90% of the sample. In addition, 66% of the farmers strongly agreed on the PAR benefits through publicity, the introduction by neighbors and news media account. It appeared that the poor households have lower perceived values than the non-poor households except the value of news media in Table 3.
Demand level: Survival and educational demands were the two primary demands made by the farmers. Table 3 shows that 289 farmers agreed or strongly agreed on the urgency of survival needs, accounting for 83.06% of the sample at an average score of 4.327. The proportion of the farmers who professed an urgent need for education accounts for 46.84% at an average of 4.109. The poor households are in greater urgent need of survival than the non-poor households, which is a strong motivation for their relocation. In comparison, the non-poor households have a higher level of education needs. This implies that they are in urgent need of improving educational conditions for their children.
4.1.3. External Factors
Social impact: The farmers’ regret mood of relocation tends to be seriously affected by the different channels of the society. In Table 4, 60.92% of the farmers who “more agreed” or “strongly agreed” on the fact that they are affected by their friends and relatives could be interpreted as a congregational mentality. Those who are susceptible to cadres or policies follow obey psychology, and this accounted for more than half of the total sample. In comparison, the 136 farmers who are affected by the resettlement conditions are rational. Poor households are particularly vulnerable to the influence of relatives, friends and cadres, and their average values are higher than the non-poor households by 0.199 and 0.134, respectively. Their average influence on policy propaganda is lower than that of non-poor households, and poor households are more concerned about the conditions of resettlement.
Relocation cost: Most farmers do not regard the costs of the relocation as high, which is mainly due to the capital support, time and effort. To assist the farmers in relocating easily, the government provided a significant amount of support in terms of human and material resources. Given that the total costs remain the same, the more the government spent, the less was the farmers’ expenditure. In Table 4, the average emotional cost of poor households is slightly higher than that of the non-poor households. This can be interpreted as poor households consume more emotional energy than non-poor households while adapting to the living patterns, cultural practices and other aspects of resettlement.
4.2. Research Methods
In the relocation process, the farmers experienced two stages of psychological change. In the first stage, the expected value before the relocation transferred into the perceived value after the relocation. In the second stage, the farmers evaluated the relocation according to the regret mood based on the first stage experience. Therefore, there are two steps in the methods of this paper. We first employ an ordered logit model (OLM) as the baseline method to examine the influence of the expected value of the farmers on the perceived value, then use the OLM to verify how the farmers’ perceived value affects their regret emotional tendency after the relocation. In addition, the farmers’ regret emotional tendency after the relocation can be affected by many factors, such as farmers’ demands, relocation costs, social influence, etc.
OLM is designed to analyze multiple ordered variables. A prerequisite for the model’s application assumes that the regression coefficients of the independent variables should be identical when an ordered category changes [42]. However, this assumption is hard to meet in practice. Therefore, a generalized ordered logit model (GOLM) is normally used to sidestep the restricted requirement for the ordered logit model. In so doing, under the relaxed assumptions of proportional advantages, the OLM models can be estimated [43]. GOLM can be defined as follows.
where y takes the values of 1, …, M (M refers to as the number of the ordered variables) and j takes 1,2, ..., M − 1. The probability of the values is as follows.
the variables can be divided into five ordered categories, M = 5. j categories of ordered multi-category dependent variables are denoted by 1,2, ..., M − 1. j = 1 means that variable Category 1 is compared with Categories 2, 3, 4, 5. j = 2 means that the dependent variable Categories 1, 2 and 3, 4 and 5 are compared [44]. Stata13.0 is used to estimate the models.
5. Results and Discussions
To test the reliability of the variables, we estimated the values of Cronbach’s α for expected value, perceived value, need level, social impact and relocation cost. As shown in Table 2, Table 3 and Table 4, the estimation values are 0.912, 0.783, 0.778, 0.878 and 0.868, respectively. The results for the correlation test are shown in Table 5; the Pearson correlation coefficients are below 0.35. Table 5 shows that the maximum value of variance inflation factor is 1.71, which cancels out the potential issue of multicollinearity for the explanatory variables [45]. In an index variable, the corresponding component variables are independently linked to it and are equally important. This leads to the same weight for each of the component variables. Several research works suggest that equally-weighted explanatory variables cannot cause a problem in terms of the explanatory power [46,47]. Therefore, the index variables were derived from the weighted average of the component variables. In order to focus on the research questions, we only included the index variables in these models. The estimation results are presented in Models 1 and 4 of Table 6 and Table 7. Furthermore, the estimation results for poor households and non-poor households are reported in Models 2, 3, 5 and 6 of Table 6 and Table 7, respectively. The results show that all four models are significant in terms of LR tests, although the R2 values are not large.
5.1. The Expected Value and the Perceived Value
In Model 1 of Table 6, the expected value had a positive effect on the perceived value at a p-value of 1% and with an odds ratio value of 1.374. That is, while the expected value increased, the perceived value had a 1.374-times likelihood to increase. At the same time, the labor force was an important control variable affecting the perceived value of the farmers. The more laborers of households, the more perceived value of farmers was in the process of relocation. Models 2 and 3 showed that the influence of the expected value of poor households on value perception was declining at a significant level of 1%. In addition, the cultivated land area and labor force have become significant factors in influencing the perceived value of poor households. This implies that the perceived value of poor households was affected by the size of the cultivated land area and the labor force to a certain extent and strongly relied on the existing production components.
5.2. Regression Results of Farmers’ Regret Emotions Tendency
Table 7 shows that all the index variables, such as perceived value, demand level, relocation cost and social influence, have a significant impact on the regret mood of the relocated farmers at a p-value of 5%.
Perceived value: In Table 7, the perceived value had a negative effect on the farmers’ regret mood. When the perceived value of the relocated farmers increased, the probability of the regret mood was less likely to occur by 0.456-times. For the component variables of the perceived value, Table 3 shows that they are relatively low after publicity and the introduction by neighbors, which might affect the farmers’ regret mood. In the group regressions, the perceived value had a significant influence on the regret mood for non-poor and poor households. That is, it had a significant negative impact on the regret mood of non-poor households, but had no significant impact on the regret mood of poor households. This implies that poor households needed a longer time to improve their perceived values as compared to non-poor households. In addition to the services, it was also necessary to make poor households recognize the value of relocation.
Demand level: In terms of the index variable as shown in Table 7, the demand level has a positive effect on the farmers’ regret mood at the 1% statistical level. When the demand increased, the probability of incurring regret mood increased by 1.221-times. The higher were the survival and the educational demands, the more likely was the occurrence of the regret mood. This appears to contradict the expectations. The reasons for this could be the construction of supporting facilities that are provided by the resettlement sites. Many resettlement sites are established without the provision of supporting facilities, such as schools, because they are not constructed or lagged at the time. This leads to the problem in the children’s schooling, which results in its opposition, as expected.
Relocation cost: The relocation cost has a negative effect on the regret mood of the relocated farmers, especially for poor households. That is, the higher the relocation cost, the lower was the possibility of regret mood after the relocation. This might be related to the government’s massive support for relocation: the government invests heavily in building resettlement houses for the relocated farmers or in subsidies for housing purchase under the PVI policy. For example, according to the government’s PVI planning, during 2011–2015, up to 600 billion RMB Yuan were appropriated for the construction and related PVI costs of relocating about 9.91 million poor people. During this period, the total investments in the anti-poverty projects reached a figure of 950 billion RMB Yuan, including the investment in housing construction. In addition to the drastically increased budgets, the government introduced development-oriented and policy-oriented financial funds for the PVI. In 2017, the first batch of central budgetary investments in poverty alleviation and relocation projects in the survey regions were about 18.9 billion RMB Yuan for the construction of 2.42 million houses for poor people for the PVI. In the meantime, the local governments also had large financial investments in the PVI, and most of them provided a variety of relocation options for the farmers according to the local conditions. According to the specific conditions of their own families, the farmers could choose suitable relocation methods and resettlement sites. In sum, because of the large-scale relocation investments by the government, the farmers had more confidence in the relocation situations, thus their regret mood after the relocation was lower.
Social influence: Social influence means that one party intentionally or unintentionally impacts the other party’s behavior due to a certain relationship between the two parties. Table 6 indicates that social influence has a positive impact of 1% on the regret mood of the farmers. When the social influence increased by one unit, the probability of the regret mood increasing by one or more units was 2.320. In the group regression, the regret mood of non-poor households was significantly affected by social influences. Table 4 suggests that the social impact is mainly due to the lower than average level of influence of the cadres and settlements. The positive relationship between cadres’ influence and the regret mood could be related to the fact that the cadres’ exaggerating advocacy results in a larger deviation between the actual situation and cadres’ propaganda. The farmers who had preferences in relation to their resettlement locations were more likely to have regret mood, that is they were too concerned with the suitability of resettlement locations and ignored the facilities available there, such as surrounding traffic, education facilities, medical and health care, sports culture, shopping and entertainment opportunities and other public facilities.
Family characteristics: Family characteristics, such as whether a family is poor or not, the age of the head of the family, arable land size and labor force, had an important effect on farmers’ regret mood after the PAR: family poverty, the numbers in the labor forces and the age of the head of the family had a positive effect, whereas the size of the arable land had the opposite effect. The regret mood of the relocated poor farmers was higher than that of the non-poor farmers: the probability of the regret mood tendency of the poor farmers was 1.625-times that of non-poor farmers. This can be deduced by the fact that the living capacity and production capacity of poor farmers in the resettlement sites are relatively low. The greater was the number of rural laborers, the greater was the likelihood of the regret mood of the farmers. The negative effect of the arable land size on the regret mood can be interpreted by the fact that, in the process of the relocation, most of the farmland has already been transferred to the large-scale farmer by means of subleases on a lease basis. In addition, the living conditions in the resettlement areas are relatively comfortable; thus, those farmers may bear lower regret moods after the relocation. Moreover, the older the farmers were, the weaker was their ability to adapt to life and work in the resettlement places. Therefore, older people may have a greater likelihood of holding a regret mood.
6. Conclusions and Political Implications
By conducting a survey on the PAR farmers in China, we have examined the relationship between the expected value, perceived value and the regret mood of the farmers in this paper. The results show that the expected value can positively affect the perceived value, and the latter can have a negative impact on the regret mood of the PAR farmers. On average, the farmers with regret and non-regret sentiments are approximately fifty/fifty in percentage terms. The shape of the farmers’ moods can be plotted as an “N” type. The expected value has an important and significant impact on the perceived value of the relocated farmers. Internal factors, such as perceived value, demand levels, and external factors, such as relocation costs, have significant effects on the regret moods of farmers after they have relocated. However, those factors have significant differences in their impacts on poor and non-poor households.
Based on the above findings, this paper has several implications. First, the government should keep abreast of the existing difficulties faced by the farmers and explain relevant policies to help them better understand the advantages of the PAR. Second, it is necessary to scientifically and reasonably deal with the discomfort and contradictions raised during the relocation due to the transition and changes in their livelihood patterns, lifestyle and cultural practices. The government should focus on the construction of facilities in these resettlement areas. Third, the government should strengthen the training of cadres in relation to the resettlement policy and improve the quality and ability of the cadres. The government should not neglect the farmers’ various problems after the relocation in order to accomplish the target. Fourth, the government should pay attention to the levels of unemployment in these places of resettlement. Priority should be given to the relocated labor force in terms of employment opportunities and skill training. Lastly, considering the big differences in the characteristics of poor households and non-poor households, the governments should implement the classified policies in accordance with the expected values of poor and non-poor households and enhance their perceived values, thus relieving their regret mood.
However, due to the limitations of the sample size and cross-sectional data, two issues can be addressed in future research. First, future research can follow the existing research samples and observe the trend of farmers’ perceived value and psychological emotions. Second, the future research could apply this analysis to a wider sample of the PAR farmers.
Author Contributions
W.L. designed the research. M.C., Q.L. and J.Y. collected and analyzed the data. W.L. and D.X. wrote, reviewed and edited the paper.
Funding
The research was funded by National Natural Science Foundation of China (Nos. 71463025 and 71663029), the National Social Science Fund Project (No. 18AJY006), the Social Science Planning Project in Jiangxi Province (Nos. 17YJ12 and 18ZD01), the Outstanding Young Talent Funding Project in in Jiangxi Province (No. 2017BCB23043) and the Science and Technology Plan Project in Jiangxi Province (No. 20181BAA208050).
Conflicts of Interest
The authors declare no conflict of interest.
References
- Newland, K. Migration as a factor in development and poverty reduction: The impact of rich countries’ immigration policies on the prospects of the poor. In Impact of Rich Countries’ Policies on Poor Countries; Routledge: Oxfordshire, UK, 2017; pp. 187–213. [Google Scholar]
- Oberman, K. Poverty and immigration policy. Am. Political Sci. Rev. 2015, 109, 239–251. [Google Scholar] [CrossRef]
- Teye, J.K.; Yebleh, M.K. Living without economic assets: Livelihoods of liberian refugees in the Buduburam Camp, Ghana. J. Int. Migr. Integr. 2015, 16, 557–574. [Google Scholar] [CrossRef]
- Oestreicher, J.S.; Farella, N.; Paquet, S.; Davidson, R.; Lucotte, M.; Mertens, F.; Saint-Charles, J. Livelihood activities and land-use at a riparian frontier of the Brazilian Amazon: Quantitative characterization and qualitative insights into the influence of knowledge, values, and beliefs. Hum. Ecol. 2014, 42, 521–540. [Google Scholar] [CrossRef]
- Favell, A. Philosophies of Integration: Immigration and the Idea of Citizenship in France and Britain; Macmillan: London, UK, 1998. [Google Scholar]
- Banks, J.A. Cultural Diversity and Education; Routledge: Oxfordshire, UK, 2015. [Google Scholar]
- Zhou, E.Y.; Den, D. Practice and result of poverty alleviation and relocation: An analysis from the perspective of social and cultural transition. J. China Agric. Univ. 2017, 24, 69–77. (In Chinese) [Google Scholar]
- Feng, N.; Wei, F.; Zhang, K.H.; Gu, D. Innovating rural tourism targeting poverty alleviation through a multi-Industries integration network: The case of Zhuanshui village, Anhui province, China. Sustainability 2018, 10, 2162. [Google Scholar] [CrossRef]
- Czaika, M.; De Haas, H. The globalization of migration: Has the world become more migratory? Int. Migr. Rev. 2014, 48, 283–323. [Google Scholar] [CrossRef]
- Massey, D.S. The social and economic origins of immigration. Ann. Am. Acad. Political Soc. Sci. 1990, 510, 60–72. [Google Scholar] [CrossRef]
- Hegazy, I.R.; Kaloop, M.R. Monitoring urban growth and land use change detection with GIS and remote sensing techniques in Daqahlia governorate Egypt. Int. J. Sustain. Built Environ. 2015, 4, 117–124. [Google Scholar] [CrossRef]
- Betts, J.R.; Fairlie, R.W. Does immigration induce ‘native flight’ from public schools into private schools? J. Public Econ. 2003, 87, 987–1012. [Google Scholar] [CrossRef] [Green Version]
- Speciale, B. Does immigration affect public education expenditures? Quasi-experimental evidence. J. Public Econ. 2012, 96, 773–783. [Google Scholar] [CrossRef]
- Schmidt-Catran, A.W.; Spies, D.C. Immigration and welfare support in Germany. Am. Sociol. Rev. 2016, 81, 242–261. [Google Scholar] [CrossRef]
- Watson, J. Family ideation, immigration, and the racial state: Explaining divergent family reunification policies in Britain and the US. Ethn. Racial Stud. 2018, 41, 324–342. [Google Scholar] [CrossRef]
- Sexton, J.P.; Hangartner, S.B.; Hoffmann, A.A. Genetic isolation by environment or distance: Which pattern of gene flow is most common? Evolution 2014, 68, 1–15. [Google Scholar] [CrossRef] [PubMed]
- Brader, T.; Valentino, N.A.; Suhay, E. What triggers public opposition to immigration? Anxiety, group cues, and immigration threat. Am. J. Political Sci. 2008, 52, 959–978. [Google Scholar] [CrossRef]
- Becerra, D.; Quijano, L.M.; Wagaman, M.A.; Cimino, A.; Blanchard, K.N. How immigration enforcement affects the lives of older Latinos in the United States. J. Poverty 2015, 19, 357–376. [Google Scholar] [CrossRef]
- Dreyer, B.; Chung, P.J.; Szilagyi, P.; Wong, S. Child poverty in the United States today: Introduction and executive summary. Acad. Pediatr. 2016, 16, S1–S5. [Google Scholar] [CrossRef] [PubMed]
- Sanou, D.; O’Reilly, E.; Ngnie-Teta, I.; Batal, M.; Mondain, N.; Andrew, C. Acculturation and nutritional health of immigrants in Canada: A scoping review. J. Immigr. Minor. Health 2014, 16, 24–34. [Google Scholar] [CrossRef] [PubMed]
- Sørensen, J.F.L. Rural–urban differences in life satisfaction: Evidence from the European Union. Reg. Stud. 2014, 48, 1451–1466. [Google Scholar] [CrossRef]
- Berry, B.J.L.; Okulicz-Kozaryn, A. An urban-rural happiness gradient. Urban Geogr. 2011, 32, 871–883. [Google Scholar] [CrossRef]
- D’Acci, L. Monetary, subjective and quantitative approaches to assess urban quality of life and pleasantness in cities. Soc. Ind. Res. 2014, 115, 531–559. [Google Scholar] [CrossRef]
- Easterlin, R.A.; Angelescu, L.; Zweig, J.S. The Impact of modern economic growth on urban-rural differences in subjective well-being. World Dev. 2011, 39, 2187–2198. [Google Scholar] [CrossRef]
- Gao, T.; Ivolga, A.; Erokhin, V. Sustainable rural development in northern China: Caught in a vice between poverty, urban attractions, and migration. Sustainability 2018, 10, 1467. [Google Scholar] [CrossRef]
- Liu, W.; Xu, J.; Li, J. The Influence of poverty alleviation resettlement on rural household livelihood vulnerability in the western mountainous areas, China. Sustainability 2018, 10, 2793. [Google Scholar] [CrossRef]
- Xiao, Q.; Liu, H.; Feldman, M. Assessing livelihood reconstruction in resettlement program for disaster prevention at Baihe county of China: Extension of the impoverishment risks and reconstruction (IRR) model. Sustainability 2018, 10, 2913. [Google Scholar] [CrossRef]
- Hermans-Neumann, K.; Priess, J.; Herold, M. Human migration, climate variability, and land degradation: Hotspots of socio-ecological pressure in Ethiopia. Reg. Environ. Chang. 2017, 17, 1479. [Google Scholar] [CrossRef]
- Atkinson, J.W.; Birch, D. On the dynamics of action. Ned Tijdschr. Psychol. 1970, 2, 83–94. [Google Scholar]
- Inman, J.J.; Dyer, J.S.; Jia, J. A generalized utility model of disappointment and regret effects on post -choice valuation. Market. Sci. 1997, 16, 97–111. [Google Scholar] [CrossRef]
- Taylor, K.A. A regret theory approach to assessing consumer satisfaction. Market. Lett. 1997, 8, 229–238. [Google Scholar] [CrossRef]
- Eid, R.; EI-Gohary, H. The role of Islamic religiosity on the relationship between perceived value and tourist satisfaction. Tour. Manag. 2015, 46, 477–488. [Google Scholar] [CrossRef]
- Kim, Y.H.; Kim, D.J.; Wachter, K. A study of mobile user engagement (MoEN): Engagement motivations, perceived value, satisfaction, and continued engagement intention. Decis. Support Syst. 2013, 56, 361–370. [Google Scholar] [CrossRef]
- Oliver, R. A cognitive model of the antecedents and consequences of satisfaction decision. J. Market. Res. 1980, 17, 460–469. [Google Scholar] [CrossRef]
- Feather, N.T. Expectations and Actions: Expectancy-Value Models in Psychology; Lawrence Erlbaum Assoc Incorporated: Mahwah, NJ, USA, 1982. [Google Scholar]
- Patterson, P.G.; Spreng, R.A. Modelling the relationship between perceived value, satisfaction and repurchase intentions in a business-to-business, services context: An empirical examination. Int. J. Serv. Ind. Manag. 1997, 8, 414–434. [Google Scholar] [CrossRef]
- Kim, Y.J.; Njite, D.; Hancer, M. Anticipated emotion in consumers’ intentions to select eco-friendly restaurants: Augmenting the theory of planned behavior. Int. J. Hosp. Manag. 2013, 34, 255–262. [Google Scholar] [CrossRef]
- Lindquist, K.A.; Gendron, M.; Barrett, L.F.; Dickerson, B.C. Emotion perception, but not affect perception, is impaired with semantic memory loss. Emotion 2014, 14, 375–387. [Google Scholar] [CrossRef] [PubMed]
- Liao, C.; Lin, H.N.; Luo, M.M.; Chea, S. Factors influencing online shoppers’ repurchase intentions: The roles of satisfaction and regret. Inf. Manag. 2017, 54, 651–668. [Google Scholar] [CrossRef]
- De Vaus, D. Surveys in Social Research; Routledge: Oxfordshire, UK, 2013. [Google Scholar]
- Likert, R.A. A technique for the development of attitude scales. Educ. Psychol. Meas. 1952, 12, 313–315. [Google Scholar]
- Wolfe, R.; Gould, W. An approximate likelihood-ratio test for ordinal response models. Stata Tech. Bull. 1998, 42, 24–27. [Google Scholar]
- Baetschmann, G.; Staub, K.E.; Winkelmann, R. Consistent estimation of the fixed effects ordered logit model. J. R. Stat. Soc. Ser. A 2015, 178, 685–703. [Google Scholar] [CrossRef]
- Williams, R. Generalized ordered logit/partial proportional odds models for ordinal dependent variables. Stata J. 2006, 6, 58. [Google Scholar]
- O’brien, R.M. A caution regarding rules of thumb for variance inflation factors. Qual. Quant. 2007, 41, 673–690. [Google Scholar] [CrossRef]
- Lindell, M.K.; Whitney, D.J. Accounting for common method variance in cross-sectional research designs. J. Appl. Psychol. 2001, 86, 114. [Google Scholar] [CrossRef] [PubMed]
- Dawes, R.M.; Corrigan, B. Linear models in decision making. Psychol. Bull. 1974, 81, 95. [Google Scholar] [CrossRef]
Figure 1.
The propensity model of relocation behavior.

Table 1.
Control variables and descriptive statistics.
| Variable | Variable Interpretation | All Samples | Poor Households | Non-Poor Households | |||
|---|---|---|---|---|---|---|---|
| Mean | Std. Dev. | Mean | Std. Dev. | Mean | Std. Dev. | ||
| Age | The age of householder | 49.586 | 8.058 | 50.922 | 7.509 | 48.526 | 8.336 |
| Sex | The sex of householder (1 for male and 0 for female) | 0.552 | 0.498 | 0.545 | 0.500 | 0.557 | 0.498 |
| Degree of education | The degree of education of householder | 2.132 | 0.789 | 2.156 | 0.825 | 2.113 | 0.760 |
| Whether the household is poor * | Whether the farmers is poor household (1 for yes and 0 for no) | 0.443 | 0.497 | - | - | - | - |
| The amount of labor | The amount of labor in 16–60 years old | 3.103 | 1.074 | 3.234 | 1.034 | 3.000 | 1.096 |
| The area of arable land | The area of arable land owned by farmers | 4.622 | 2.393 | 4.686 | 2.152 | 4.572 | 2.573 |
* Note: The variable “Whether the household is poor” is the national poverty alleviation standard of the rural farmers with a per capita net income of 2736 RMB in 2013.
Table 2.
Independent variables and descriptive statistics.
| Index Variables | Component Variables | All Samples | Poor Households | Non-Poor Households | All Samples | |||
|---|---|---|---|---|---|---|---|---|
| Average | Std. Dev. | Average | Std. Dev. | Average | Std. Dev. | Cronbach’s α | ||
| Expected value | Raising the income level | 3.557 | 1.081 | 3.481 | 1.067 | 3.619 | 1.091 | 0.912 |
| Improving the living environment | 3.689 | 1.169 | 3.662 | 1.080 | 3.711 | 1.238 | ||
| Improving the educational environment | 3.753 | 1.117 | 3.701 | 1.097 | 3.794 | 1.133 | ||
| Improving the ecological Environment | 3.805 | 1.208 | 3.753 | 1.145 | 3.845 | 1.258 | ||
| Mood | Regret mood tendency | 3.000 | 1.464 | 3.311 | 1.439 | 2.753 | 1.439 | |
Table 3.
Internal factors and descriptive statistics.
| Index Variables | Component Variables | All Samples | Poor Households | Non-Poor Households | All Samples | |||
|---|---|---|---|---|---|---|---|---|
| Average | Std. Dev. | Average | Std. Dev. | Average | Std. Dev. | Cronbach’s α | ||
| Perceived value | Perceived value after publicity | 4.060 | 1.099 | 3.883 | 1.154 | 4.175 | 1.038 | 0.783 |
| Intuitive experience of the value | 4.39 | 0.902 | 4.316 | 0.904 | 4.453 | 0.899 | ||
| Value of the introduction by the neighbors | 4.06 | 1.107 | 3.974 | 1.108 | 4.093 | 1.107 | ||
| Value of news media | 4.13 | 0.967 | 4.142 | 0.881 | 4.103 | 1.033 | ||
| Demand level | Survival demand | 4.327 | 0.775 | 4.389 | 0.6890 | 4.278 | 0.836 | 0.778 |
| Educational demand | 4.109 | 0.951 | 4.013 | 0.935 | 4.185 | 0.959 | ||
Table 4.
External factors and descriptive statistics.
| Index Variables | Component Variables | All Samples | Poor Households | Non-Poor Households | All Samples | |||
|---|---|---|---|---|---|---|---|---|
| Average | Std. Dev. | Average | Std. Dev. | Average | Std. Dev. | Cronbach’s α | ||
| Social influence | Affected by the relatives and friends | 3.770 | 1.003 | 3.870 | 0.961 | 3.691 | 1.031 | 0.878 |
| Affected by the cadres | 3.574 | 1.031 | 3.649 | 1.007 | 3.515 | 1.049 | ||
| Affected by policies | 3.712 | 1.062 | 3.675 | 1.125 | 3.742 | 1.010 | ||
| Affected by the resettlement conditions | 3.718 | 1.217 | 3.805 | 1.199 | 3.649 | 1.230 | ||
| Relocation cost | High emotional cost | 2.649 | 1.232 | 2.714 | 1.208 | 2.597 | 1.252 | 0.868 |
| High economic cost | 2.494 | 1.228 | 2.481 | 1.183 | 2.505 | 1.264 | ||
Table 5.
Variables correlations.
| Variables | 1 | 2 | 3 | 4 | 5 | 6 | 7 | 8 | 9 | 10 | VIF | |
|---|---|---|---|---|---|---|---|---|---|---|---|---|
| 1 | Age | 1.000 | 1.01 | |||||||||
| 2 | Sex | −0.010 | 1.000 | 1.06 | ||||||||
| 3 | Educational background | 0.091 | −0.093 | 1.000 | 1.07 | |||||||
| 4 | Whether the household is poor | 0.148 * | 0.011 | 0.027 | 1.000 | 1.06 | ||||||
| 5 | Number of laborers | −0.008 | −0.033 | −0.050 | 0.108 | 1.000 | 1.25 | |||||
| 6 | The area of arable land | −0.077 | −0.012 | 0.084 | 0.024 | 0.344 ** | 1.000 | 1.34 | ||||
| 7 | Perceived value | −0.053 | −0.006 | −0.083 | −0.086 | 0.256 * | 0.145 * | 1.000 | 1.71 | |||
| 8 | Demand level | −0.009 | −0.010 | 0.000 | −0.024 | 0.276 * | 0.253 * | 0.106 | 1.000 | 1.70 | ||
| 9 | Relocation cost | −0.132 | −0.026 | −0.048 | 0.020 | 0.066 | 0.269 * | −0.219 * | −0.122 | 1.000 | 1.62 | |
| 10 | Social influence | 0.034 | −0.032 | 0.110 | 0.058 | 0.227 * | 0.196 * | 0.202 * | 0.122 | −0.212 * | 1.000 | 1.39 |
Note: *, ** means statistics at 10%, 5%.
Table 6.
The effects of expected value on the perceived value.
| Variables | Model (1) All Samples | Model (2) Poor Farmers | Model (3) Non-Poor Farmers | |||
|---|---|---|---|---|---|---|
| OR value | S.E. | OR value | S.E. | OR value | S.E. | |
| Variables of interest | ||||||
| Expected value | 1.374 *** | 0.132 | 1.332 * | 0.208 | 1.490 *** | 0.190 |
| Control variables | ||||||
| Age | 1.000 | 0.012 | 0.978 | 0.019 | 1.018 | 0.016 |
| Sex | 0.825 | 0.162 | 1.350 | 0.419 | 0.702 | 0.188 |
| Degree of education | 0.850 | 0.102 | 1.035 | 0.177 | 0.655 ** | 0.114 |
| Whether the household is poor | 0.682 ** | 0.132 | - | - | - | - |
| The amount of labor | 1.426 *** | 0.137 | 2.222 *** | 0.343 | 1.068 | 0.144 |
| The area of arable land | 1.039 | 0.046 | 1.153 * | 0.086 | 1.058 | 0.063 |
| Maximum likelihood | −411.085 | −302.657 | −383.985 | |||
| Significance level | 0.000 | 0.000 | 0.000 | |||
| R2 | 0.188 | 0.063 | 0.027 | |||
| Observations | 348 | 154 | 194 | |||
Note: *, **, *** means statistics at 10%, 5%, 1%.
Table 7.
The estimation results of the farmers’ regret mood.
| Variables | Model (4) All Samples | Model (5) Poor Farmers | Model (6) Non-Poor Farmers | |||
|---|---|---|---|---|---|---|
| OR Value | SE | OR Value | SE | OR Value | SE | |
| Variables of interest | ||||||
| Perceived value | 0.456 *** | −4.010 | 1.282 | 0.394 | 0.174 *** | 0.056 |
| Demand level | 2.221 *** | 3.870 | 2.264 *** | 0.830 | 3.339 *** | 1.035 |
| Relocation cost | 0.778 ** | −2.290 | 0.725 ** | 0.121 | 0.804 | 0.127 |
| Social influence | 3.320 *** | 7.040 | 1.314 | 0.359 | 7.361 *** | 1.913 |
| Control variables | ||||||
| Age | 1.098 *** | 6.380 | 1.115 *** | 0.027 | 1.08 9 *** | 0.022 |
| Sex | 1.184 | 0.800 | 1.518 | 0.494 | 0.758 | 0.225 |
| Educational background | 0.867 | −1.050 | 0.953 | 0.185 | 0.711 | 0.154 |
| Whether the household is poor | 1.625 ** | 2.290 | - | - | - | - |
| Number of laborers | 1.414 *** | 3.220 | 1.303 | 0.209 | 1.085 | 0.181 |
| The area of arable land | 0.826 *** | −3.680 | 0.824 | 0.070 | 0.873 | 0.064 |
| Log likelihood | −411.086 | −180.74 | −208.8 | |||
| LR value | 189.76 | 66.86 | 147.86 | |||
| Significance level | 0.000 | 0.000 | 0.000 | |||
| R2 | 0.188 | 0.1561 | 0.261 | |||
| Sample size | 348 | 154 | 194 | |||
Note: **, *** means statistics at 5%, 1%.
© 2018 by the authors. Licensee MDPI, Basel, Switzerland. This article is an open access article distributed under the terms and conditions of the Creative Commons Attribution (CC BY) license (http://creativecommons.org/licenses/by/4.0/).
Share and Cite
MDPI and ACS Style
Liao, W.; Xiang, D.; Chen, M.; Yu, J.; Luo, Q. The Impact of Perceived Value on Farmers’ Regret Mood Tendency. Sustainability 2018, 10, 3650. https://doi.org/10.3390/su10103650
AMA Style
Liao W, Xiang D, Chen M, Yu J, Luo Q. The Impact of Perceived Value on Farmers’ Regret Mood Tendency. Sustainability. 2018; 10(10):3650. https://doi.org/10.3390/su10103650
Chicago/Turabian StyleLiao, Wenmei, Dong Xiang, Meiqiu Chen, Jiangli Yu, and Qianfeng Luo. 2018. "The Impact of Perceived Value on Farmers’ Regret Mood Tendency" Sustainability 10, no. 10: 3650. https://doi.org/10.3390/su10103650
Note that from the first issue of 2016, this journal uses article numbers instead of page numbers. See further details here.