Study on Population Distribution Pattern at the County Level of China


1
Research Institute for Smart Cities, School of Architecture and Urban Planning, Shenzhen University, Nanhai Ave 3688, Shenzhen 518060, China
2
School of Architecture and Urban Planning, Shenzhen University, Nanhai Ave 3688, Shenzhen 518060, China
*
Author to whom correspondence should be addressed.
Sustainability 2018, 10(10), 3598; https://doi.org/10.3390/su10103598
Submission received: 2 August 2018
/
Revised: 28 September 2018
/
Accepted: 8 October 2018
/
Published: 10 October 2018
(This article belongs to the Special Issue Spatial Analysis of Urbanization towards Urban Sustainability)
Abstract
:With the accelerating urbanization process, the population increasingly concentrates in urban areas. In view of the huge population in China and a series of problems in the process of rapid urbanization, there are no unified measures for characterizing the population pattern. This study explores the distribution pattern of the Chinese population and proposes a spatial distribution structure of population using GIS (Geographic Information System) analysis. The main findings are as follows: (1) In 2015, the distribution of population density in China presents a pattern of high in the southeast and low in the northwest based on the county-level administrative regions. The population main lives in the southeast of China based on the “Hu Huanyong Line”. (2) There is a great difference of the spatial correlation between land area, population and GDP (Gross Domestic Product) in China. The economic concentration in China is higher than the population concentration. In the areas where population and GDP are aggregated, per capita GDP is higher. (3) Based on the areas with highly aggregated population and GDP, the spatial distribution structure of population of “1 + 4 + 11” for China’s urbanization is put forward, namely, one national-level aggregated area of population and GDP, 4 regional-level aggregated areas of population and GDP, and 11 local regionally aggregated areas of population and GDP. This spatial structure represents an attempt to explore the direction of China’s urbanization, and it can be used to optimize the spatial development pattern and provide scientific guidance for the future urbanization plan.
1. Introduction
Population distribution refers to the distribution of a population in a certain geographical space at a given time, or to the spatial form of a population [1]. Population size and population density are the main indicators of population distribution and are used to measure regional differences in population distribution. The spatial distribution pattern is closely related to climate, resources and environment and has typical scale characteristics [2]. With the accelerating urbanization process, the population increasingly concentrates in urban areas. In 2018, the global urban population reaches 4.2 billion, and the urbanization rate increases from 33.5% in 1960 to 55% in 2018 [3]. In the same period, the urbanization rate in China reaches 58.52%, which is higher than the world average but remains low compares with the developed countries in the world, such as the urbanization rate is 81.87% in the United States, 83.08% in the United Kingdom, and 94.44% in Japan [3,4]. At the same time, the world average population density increases from 23.00 people per km2 in 1960 to 55.72 people per km2 in 2018, while China’s population density is 150.14 people per km2 in 2018, which is 2.69 times the average population density in the world [4]. The area of China is more than 25 times that of Japan, Germany, the United Kingdom, and South Korea, but the population densities of those four countries are greater than the population density of China; the areas of Canada, the United States, and Australia are slightly different from that of China, while their population densities are far less than the population density in China. It can be seen that population distribution has significant regional differences. By analyzing the characteristics of population distribution and their patterns, the government could plan the population rationally considering the sustainable development of the population, resources, and environment.
After the Second World War, influenced by the spatial analysis school of thought in geography, the focus of Western scholars of population distribution was mainly analysis of the spatial distribution and its law variation by quantitative methods, and a series of theoretical models, such as the Clark model [5], the allometric model of growth between urban population and urban area [6], the index model [7] and the multicore model of urban population density [8], were put forward. In the 1970s, Western scholars began to pay attention to the suburbanization of the urban population. The research focused mainly on the changes in population distribution [9,10], the relationship between population density changes and social phenomena [11,12,13], population suburbanization and spatial structure [14,15] and so on.
In 1935, China’s population geographer Hu Huanyong proposed the differential line from southeast and northwest that reveals the population density distribution in China, namely, the Heihe-Tengchong Line, which is now called the “Hu Huanyong Line” [16]. In his research, 36% of the area southeast of the “Hu Huanyong Line” was inhabited by 96% of the population. There was a certain degree of overlap between this demonstration line and the rainfall line in the meteorological area, the dividing line of the geomorphological area, the dividing line of cultural transformation, and the ethnic line. Therefore, the “Hu Huanyong Line” was not only the population line of China but also the boundary of China’s ecological environment. Since the “Hu Huanyong Line” was put forward, Chinese scholars have conducted extensive research on population distribution, mainly focusing on the population distribution based on the “Hu Huanyong Line” [17,18], urbanization patterns based on population [19,20,21], and the relationship between the population and economic environment based on GIS spatial analysis methods and economic statistical methods [22,23,24].
China has a vast territory and large regional differences. It should build a regional development pattern with different characteristics and coordination based on its natural geography, resource endowments and economic-social development level and follows the general laws of the market economy. In 2000, the CPC Central Committee decided to implement a major decision-making strategy for the development of the western region. In 2003 and 2006, it decided to implement the strategy of rejuvenating the old industrial bases in the northeastern region and to promote the strategy for the rise of the central region. With the addition of the development strategy for the eastern region that started in 1979, China’s overall development strategy for the region took shape [25].
As far as China’s current urbanization development management system is concerned, the implementation of population spatial pattern in each city has undergone rigorous review and scientific argumentation, but the “discrete” review and argument has ultimately led to “systematic (spatial pattern of population for the whole China)” problems [26]. To solve these problems, we must analyze the population distribution at the national macro scale.
Scholars at home and abroad have conducted much research on population distribution [27,28], but there are few literatures that characterize the population spatial pattern followed by the cumulative percentage of population, GDP and surface area based on population density in view of the unique national conditions in China and the series of problems, such as mismatch between population urbanization and land urbanization, and environmental pollution, that have arisen in the process of rapid urbanization. At the same time, what kind of spatial distribution structure based on the characteristics of the population, is better for urbanization, different countries and regions for different research purposes, while the spatial distribution structure of the population has its own feature. For example, based on the selection criteria and principles of different urban agglomerated areas, the spatial distribution structure of China’s urban agglomerations included Shimou Yao’s “6 + 7” plan [29], Chaolin Gu’s “3 + 3 + 7 + 17” plan [30] and Chuanglin Fang’s “5 + 9 + 6” plan [31]. These programs have an important guiding role for proposing a new spatial structure of population of China in this paper.
To this end, this paper emphasizes the population distribution pattern at the county level of China in 2015 to reveal the relationship between the spatial distribution of land area, population and economy for proposing an innovative spatial distribution structure of population. These population spatial structures can enrich the research on population pattern, and provide a new thinking for the future urbanization of China.
2. Methodology
2.1. Data
In China, the administrative divisions are divided into the provincial administrative district, the prefecture-level administrative district, the county-level administrative district, and the town-level administrative district. The county-level administrative district includes city-governed district, county-level city, county, autonomous county, flag, autonomous flag, special zone, and forest area [32]. This study takes the county-level administrative district as the basic statistical unit and considers the city-governed districts (generally a prefecture-level city contains several city-governed districts) as a whole. The specific data are obtained from the “Chinese County Statistical Yearbook”, the “Chinese City Statistical Yearbook” and the Urban Planning and Design Institute of China, which include the vector database of the county administrative division in China and statistical data of county administrative areas, such as population and GDP in 2015 [33,34].
Based on research needs, the following preprocessing of some base maps and statistical data are carried out. (1) Comparative analysis is made of administrative divisions of 1:100,000 county administrative district maps and county-level statistical yearbook data of 2015. (2) Because the statistical yearbook data include the data of districts and counties-based at the county level, the data of each district are aggregated and integrated into the data of the corresponding city-governed districts. For this purpose, the city-governed districts are consolidated using Geographic Information System (GIS) technique (e.g., ArcGIS 10.2 software). For example, in Beijing in 2015 (pre-adjustment) under the jurisdiction of 16 city-governed districts, this paper merges 16 city-governed districts into a whole, and the demographic data of the population are similarly added and connected.
In accordance with the above principles, after preprocessing, there are 2209 counties in 2015, with the exceptions of Hong Kong Special Administrative Region, Macao Special Administrative Region, and Taiwan Province. After pretreatment, statistics and changes in the population-related indicators in China for 2015 are shown in Table 1.
It should be noted that the population in this study refers to the household registration population, which includes citizens who have registered permanent residence in the public security household registration management office of residence in accordance with the Regulations of the People’s Republic of China on Registration of Household Registration. The household registration population is different from the resident population. The resident population refers to the population that often lives in a certain area for a certain period of time (more than six months, including half a year). Given China’s special conditions, there are significant differences between the household registration population and the resident population in the administrative region. The resident population tends to be larger than the household registration population in large cities with large population influx, such as in Beijing, the resident population is 21.71 million and the household registration population is just 13.59 million (about 30% less) in 2017; while the resident population is often smaller than the household registration population in cities with large population outflows, such as in Chongqing, the resident population is just 30.75 million and the household registration population is 33.90 million (about 10% more) in 2017 [35,36].
2.2. Method
In this study, GIS spatial analysis, overlay analysis and statistical regression analysis are used to carry out the characteristic analysis of the population distribution pattern in China. The specific technical process is shown in Figure 1.
The main steps of the study are as follows:
- (1)
- Population, land area and GDP data are used to analyze the characteristics of the population distribution pattern in China at the county level. First, the characteristics of population density in 2015 is analyzed, and formed five classes of population areas by ranking the population density from high to low; second, the proportion of population and land area on both sides of the “Hu Huanyong line” are analyzed to reveal the pattern of Chinese population in 2015.
- (2)
- Based on the spatial distribution characteristics of population density, population, land area and GDP, the population density is ranked from high to low, and the correlation between cumulative percentage of land area and cumulative percentage of population and GDP is analyzed to reveal the efficiency of land in terms of population and economy in China.
- (3)
- Based on the overlapping distribution of population, GDP and land area, the spatial distribution structure of population is putted forward for the future urbanization.
3. Results
3.1. Population Distribution in China
Figure 2 shows the population density distribution of China in 2015. Five classes are determined by ranking the population density from high to low: (1) extremely dense population areas (population density greater than 500 people per km2); (2) dense population areas (population density greater than 200 people per km2 and less than 500 people per km2); (3) medium population areas (population density greater than 50 people per km2 and less than 200 people per km2); (4) sparse population areas (population density greater than 1 person per km2 and less than 50 people per km2); and (5) extremely sparse population areas (population density less than 1 person per km2).
In 2015, the distribution of population density based on the county level administrative regions shows a pattern of high in the southeast and low in the northwest. The total population is 1.38 billion, and the population density is 143.82 people per km2. The areas with high population density are mainly concentrated in the middle and lower reach of the Yellow River, the Yangtze River Delta, the Sichuan Basin, and the southeast coastal areas. The extremely dense population areas carry 51% of the population with 9% of the national land area and are distributed in urban areas such as the North China Plain, Shandong Peninsula, Shanghai, Chengdu, Chongqing, Wuhan, Guangzhou and Shenzhen; 13% of the country’s land area, considered a dense population area and containing 30% of the population, is mainly distributed in the plains surrounding the Northeast Plain, the middle and lower reaches of the Yellow River, the Yangtze River Delta, Central China, South China, and southwestern cities; the medium population areas covering 20% of the country’s land area and hosting 16% of the population are distributed in the areas of the Yunnan-Guizhou Plateau, Longxi Mountains, the mountains of the northeastern plains, and the surrounding areas of central China; 41% of the country’s land area, considered the sparse population area, carries only 3% of the population and concerns mainly Inner Mongolia, Xinjiang, most of the mountainous areas in western Sichuan, and the eastern part of the Qinghai-Tibet Plateau; the extremely sparse population area accounts for 17% of the country’s land area, but the area is almost unoccupied, mainly in southern Xinjiang, western Inner Mongolia and the Qinghai-Tibet Plateau.
Taking the seat of the government of Heihe City and Tengchong County as the endpoints, we draw the “Hu Huanyong Line” and use it as the boundary to divide the land into the southeast half and the northwest half of China. The county administrative district where the “Hu Huanyong Line” passes is designated by the seat of the county government that belongs to the southeast or the northwest half of China. Table 2 shows the proportion of the population on both sides of the “Hu Huanyong Line” of China in 2015. In northwest of the “Hu Huanyong Line”, 57.25% of the land area just supports 6.12% of the population, and the population density is 15.34 people/km2, while in southeast of the “Hu Huanyong Line”, 42.75% of the land area can carry 93.88% of the population, and the population density is 314.85 people/km2, 20.52 times that of the northwest of the “Hu Huanyong Line”. In short, it reveals that the population still main lives in the southeast of China.
3.2. The Overlapping Distribution of Land Area, Population and GDP
Based on the characteristics of the population distribution pattern in China, we can further explore the spatial correlation between land area, population and GDP, and then provide support for proposing a spatial distribution structure of population. The area that suitable for human habitation in China is 5.00 million km2, and it supports a population of 1.375 billion. Compared with China, the total area that suitable for human habitation of the United States is 7.50 million km2, and it supports a population of 321 million people, which is less than one-fourth of the Chinese population. The area that suitable for human habitation of Canada is 3.35 million km2, and it supports 35.85 million people, which is less than 3/100 of the Chinese population [4]. Therefore, the population densities are 275 people/km2 in China, 42.8 people/km2 in the United States, and 10.70 people/km2 in Canada. Hence, choosing the least land area to support the most people and seek a better population distribution pattern are the good means to adaptation of fast urbanization and sustainable development of China.
According to the order of population density from high to low, the cumulative percentages of land area, population and GDP are calculated, and the overlapping distribution characteristics of land area, population and GDP are analyzed. Figure 3 shows the distribution of population density as the base figure, and the blue area shows the overlapping area of population, GDP and land area according to the increase in the percentage of population, in which the unit of population is people, the unit of GDP is the Yuan, and the unit of land area is square kilometer. The analysis shows that 1% of the land area (76.1 thousand km2) supports 10% of the population (138 million) and 21% of the GDP (15.93 trillion Yuan); 30% of the population (413 million) lives in 4% of the land area (0.37 million km2) and produces 51% of the GDP (38.43 trillion Yuan); 60% of the population (0.826 billion) lives on 12% of the land area (1.11 million km2) and produces 76% of the GDP (57.49 trillion Yuan); and 38% of the land area (3.63 million km2) can carry 95% of the population (1.31 billion) and produce 96% of the GDP (73.05 trillion Yuan) in China. In general, the population mainly distributes in the southeast of “Hu Huanyong line”, and the areas with a large population are scattered in the north China plain, the Yangtze River Delta, the southeast coastal area, Wuhan metropolitan area, and Chengdu-Chongqing area.
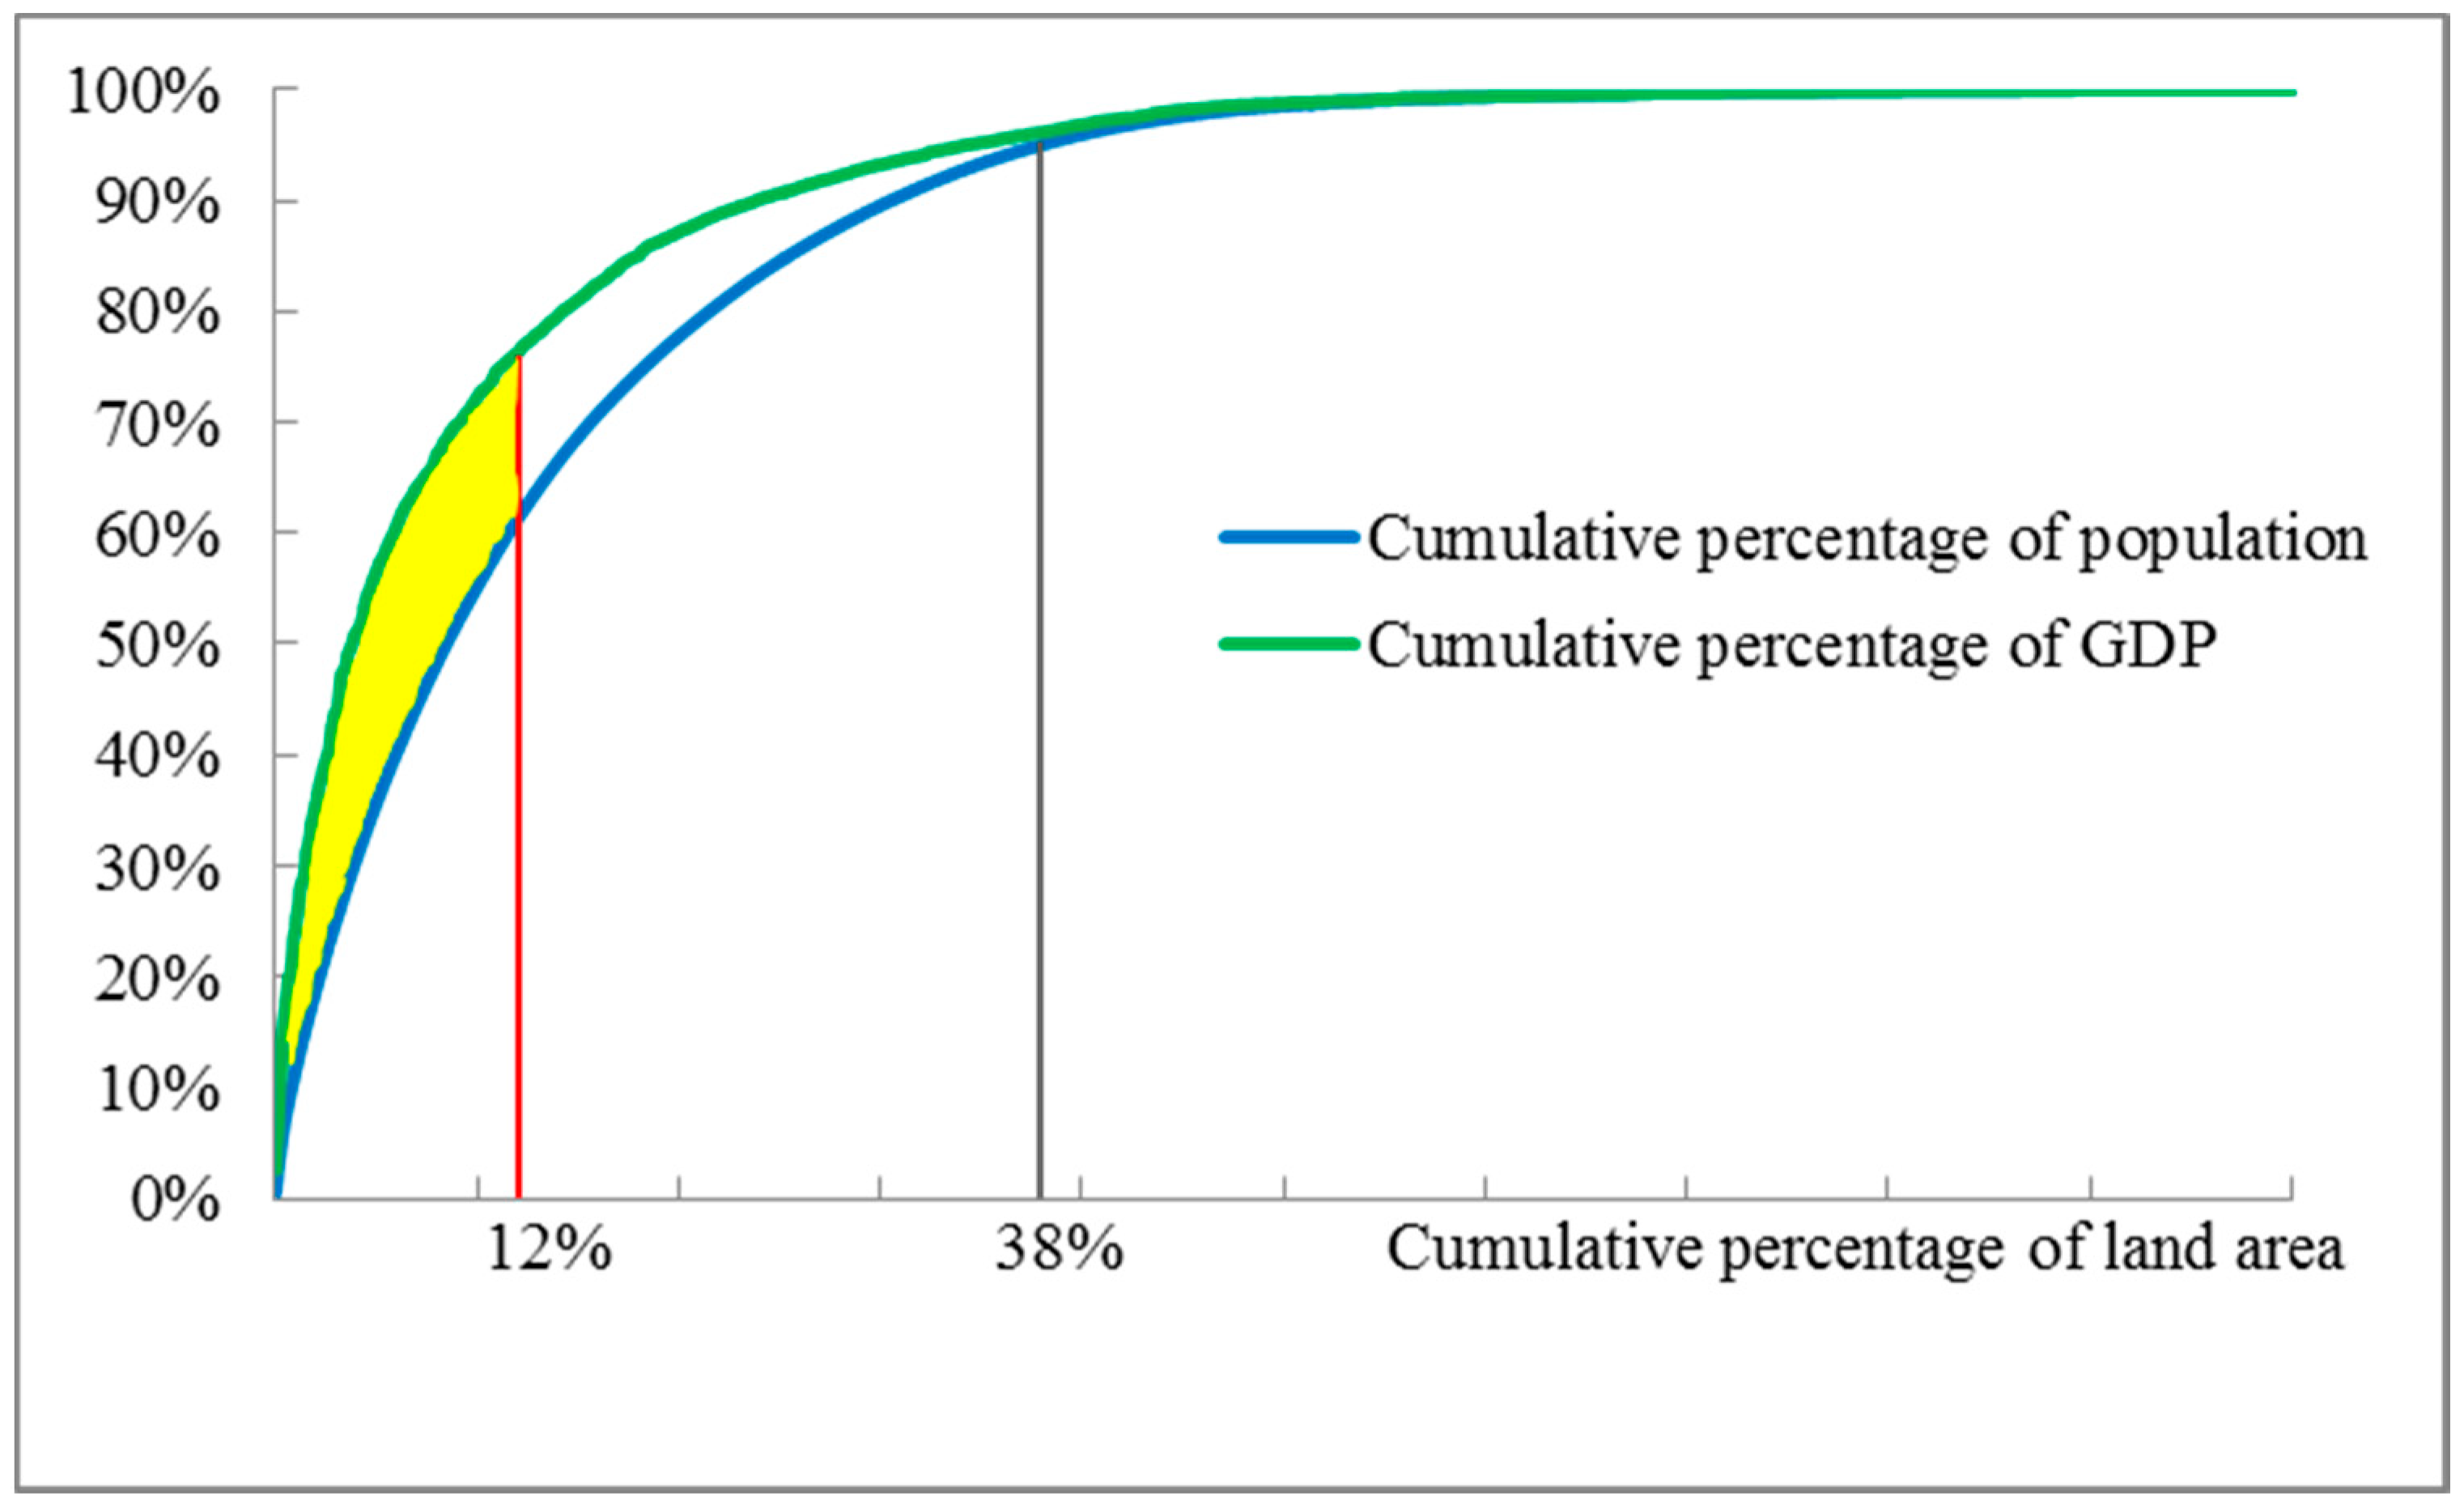
Figure 4 shows the cumulative percentage of land area, population and GDP sorted by population density from high to low. When the cumulative percentage of land area is 12%, the cumulative percentages of population and GDP reach 60% and 76%, respectively; when the cumulative percentage of land area reaches 38%, the cumulative percentages of population and GDP are 95% and 96%, respectively (see Figure 3c,d); beyond this, with the increase in the cumulative percentage of land area, the cumulative percentages of population and GDP increase slowly. In general, the area where the cumulative percentage of land area is less than 38% is part of the area where population and GDP are aggregated, and the degree of economic aggregation in these areas is higher than the degree of population aggregation, and the per capita GDP is higher. The area where the cumulative percentage of land area is less than 12% is the highly aggregated area of population and GDP (see the yellow area in Figure 4). The degree of economic aggregation in these areas is significantly higher than the degree of population aggregation, and these areas have the highest per capita GDP, which could lead them to become key development areas for urbanization in China.
3.3. Spatial Distribution Structure of Population
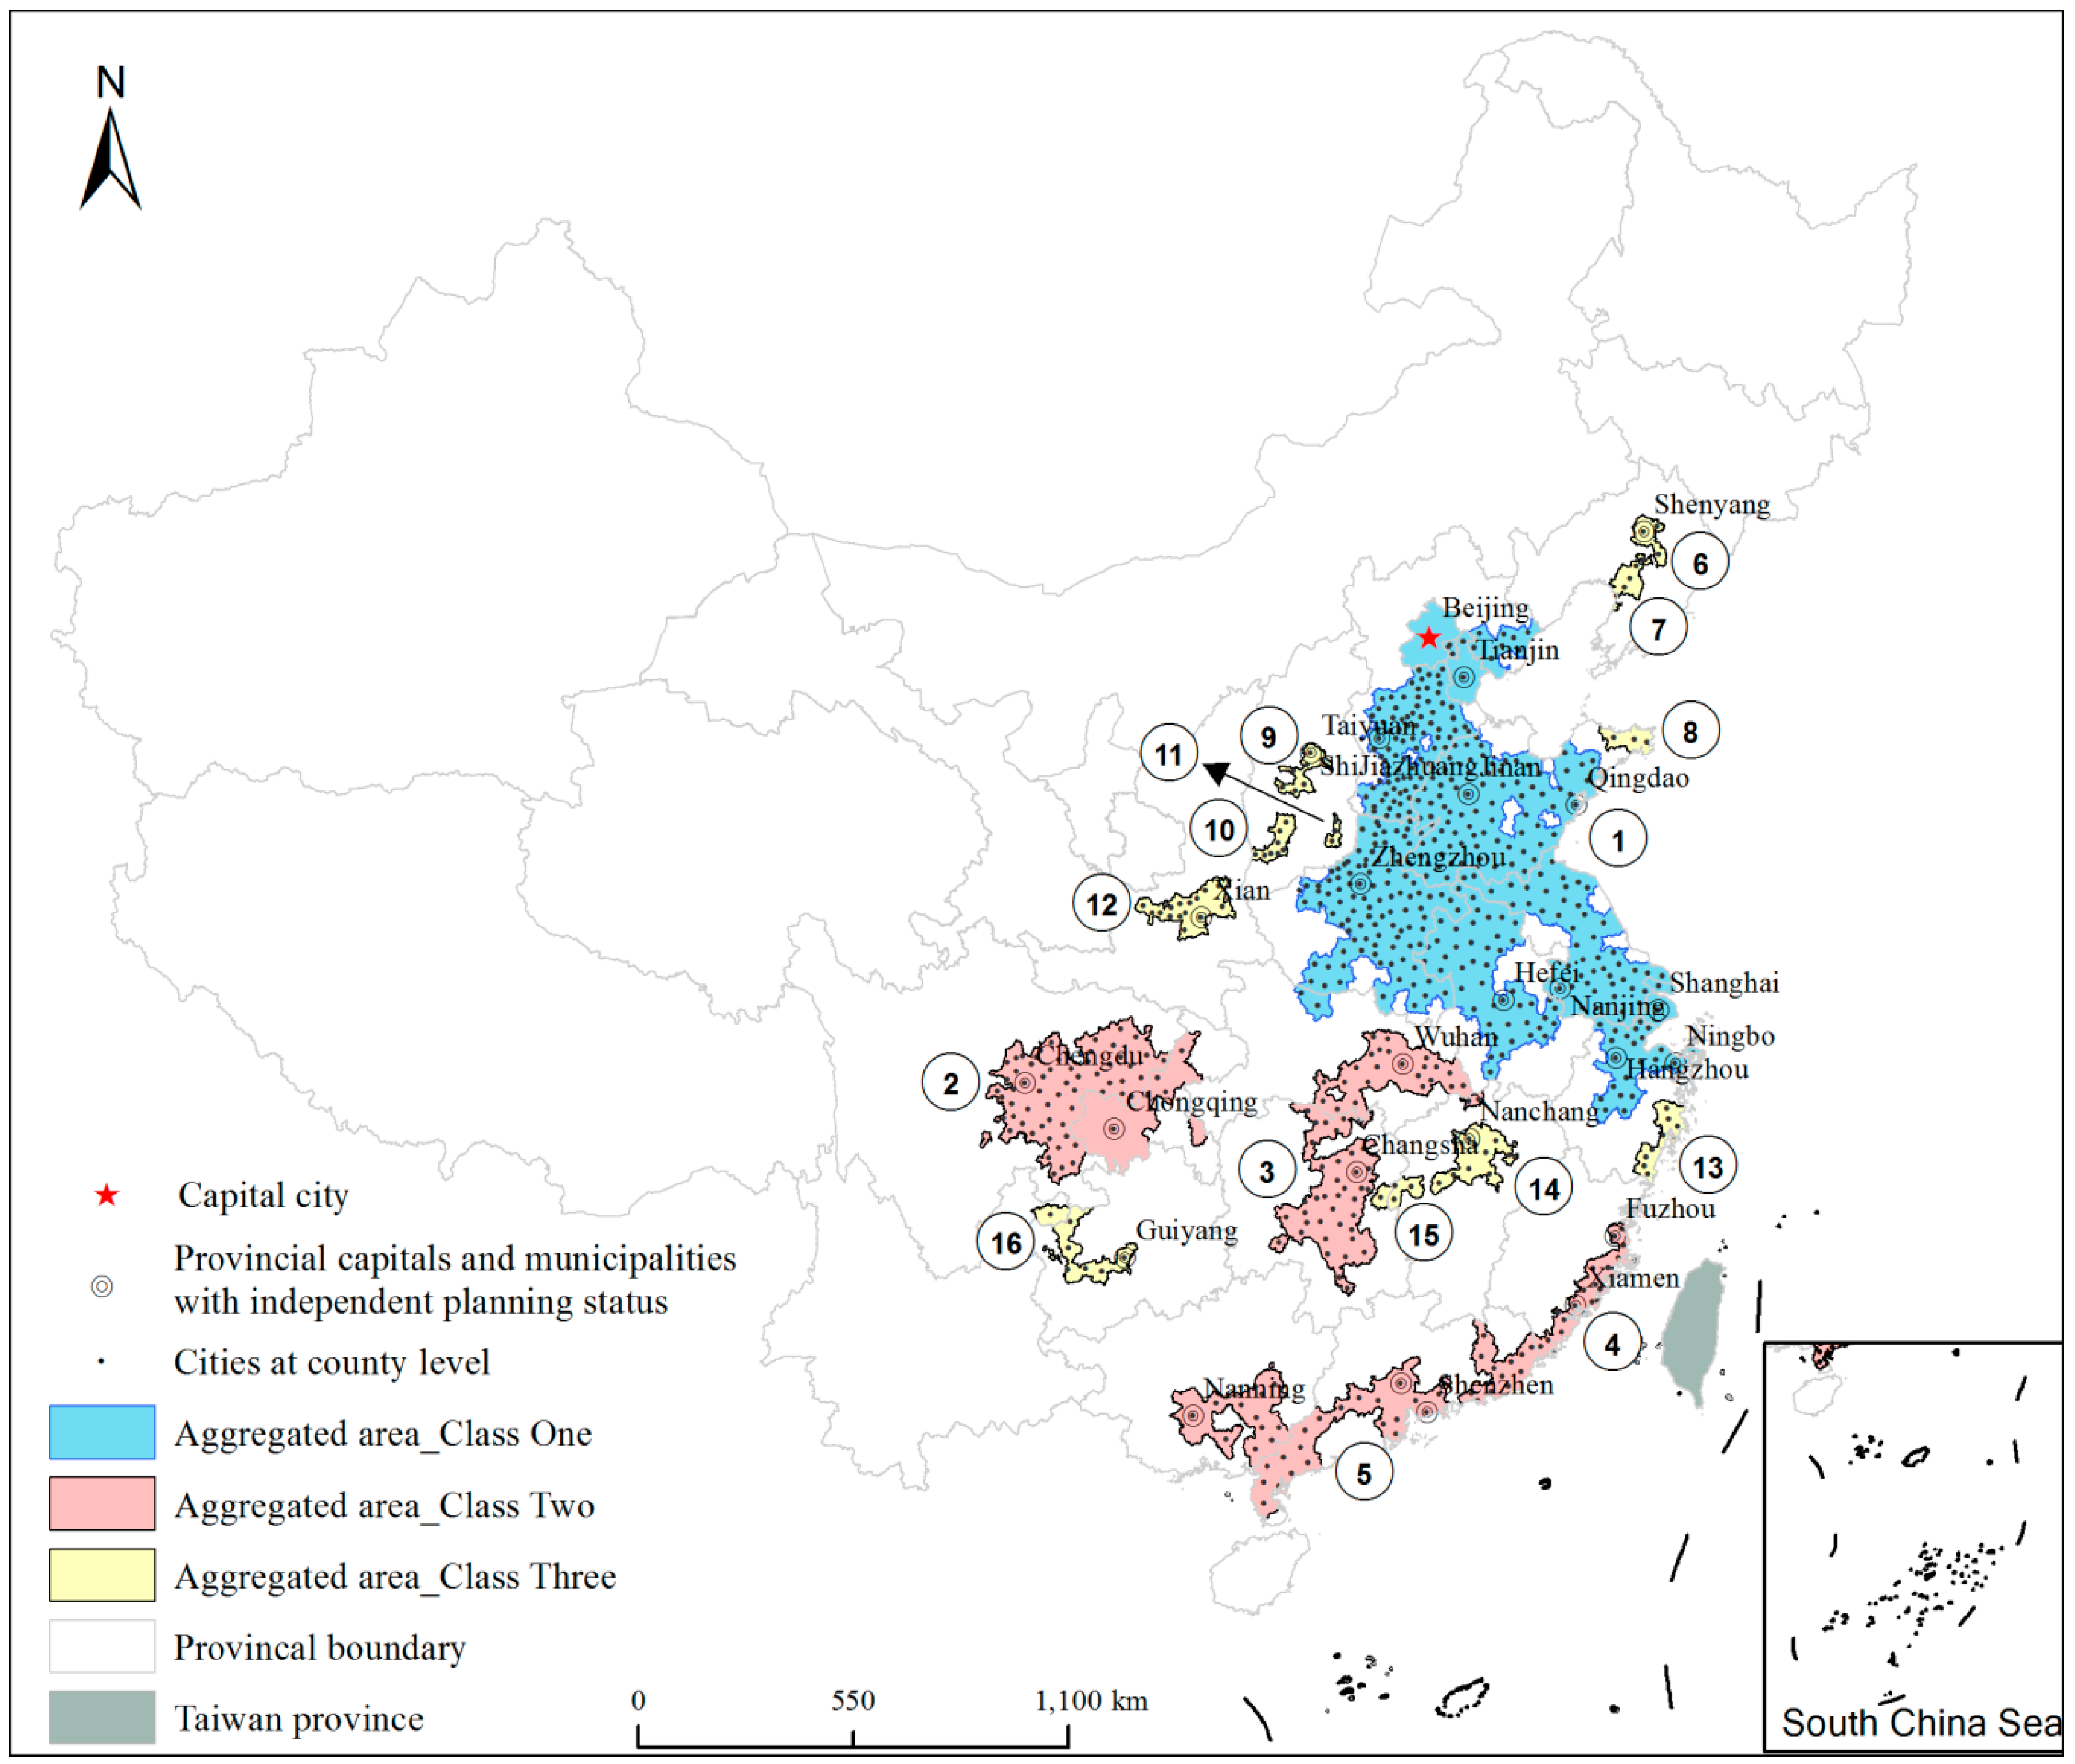
Based on Section 3.1 on the population distribution in China and Section 3.2 on the overlapping distribution of land area, population and GDP, the future trend of urbanization in China is mainly concentrated in the areas of highly aggregated population and GDP (see the yellow area in Figure 4). Through spatial superposition analysis, we propose a spatial distribution structure of population with the aggregated areas of population and GDP are shown in Figure 5. By referring to various standards for the identification of urban agglomerations at home and abroad [37,38,39,40], such as the indicators of number of cities, population size, per capita GDP, and the level of urbanization which are differential in different research and thinking, and combining the characteristics of this study, the identification criteria for aggregated areas of population and GDP are determined as follows: (1) the population density from high to low of the county-level administrative districts reveals a cumulative percentage of land area less than 12%, a cumulative percentage of population less than 60% and a cumulative percentage of GDP less than 76%; (2) the number of county-level administrative districts is greater than or equal to 3; and (3) the county-level administrative districts are contiguous. Based on the above principles, the key areas for the future development of urbanization in China are proposed following the spatial distribution structure of population of “1 + 4 + 11” pattern: 1 nationally aggregated area of population and GDP, 4 regionally aggregated areas of population and GDP, and 11 local regionally aggregated areas of population and GDP. The analysis shows that in total, 675 counties belongs to the aggregated areas of population and GDP, with a population of 764 million, an area of 1,209,200 km2, and a GDP of 51.08 trillion Yuan, which accounts for 10.72% of the land area, 55.56% of the total population and 67.22% of the GDP. According to the number of counties and the size of the aggregated area of population and GDP, the aggregated area of population and GDP is divided into three categories: (1) the Class_One aggregated area of population and GDP with the quantity of 1; (2) the Class_Two aggregated area of population and GDP with the quantity of 4; and (3) the Class_Three aggregated area of population and GDP with the quantity of 11 (Table 3).
The nationally aggregated area of population and GDP, crossing Beijing, Tianjin, Hebei Province, Shandong Province, Henan Province, Anhui Province, Jiangsu Province, Shanghai and Zhejiang Province with 408 county-level administrative districts and taking as centers the important provincial capitals, municipalities and cities such as Beijing, Tianjin, Shijiazhuang, Jinan, Qingdao, Zhengzhou, Hefei, Nanjing, Shanghai, Hangzhou and Ningbo, is the largest aggregated area of population and GDP in China. The region has a population of 434 million, an area of 561,700 km2 and a GDP of 29.38 trillion Yuan and represents 5.85% of the total land area, 31.56% of the population and 38.66% of GDP; this is the most important urbanized area.
The regionally aggregated area of population and GDP consists of 4 regions with 192 county-level administrative districts, which are the aggregated area of Cheng Yu with Chongqing and Chengdu as the centers, the aggregated area of central Yangtze River with Wuhan and Changsha as the centers, the aggregated area of the west side with Fuzhou and Xiamen as the centers, and the aggregated area of Guangdong and Guangxi with Guangzhou, Shenzhen and Nanning as the centers. The region has a population of 253 million, an area of 361,700 km2 and a GDP of 16.83 trillion Yuan and accounts for 3.77% of the total land area, 18.40% of the population and 22.15% of the GDP, which is important for the development of urbanization in China.
The local aggregated area of population and GDP includes 11 regions with 75 county-level administrative areas, namely, the aggregated area of central Liaoning with Shenyang as the center, the aggregated area of eastern Liaoning with Yingkou as the center, the aggregated area of coastal Shandong with Yantai as the center, the aggregated area of central Shanxi with Taiyuan as the center, the aggregated area of western Shanxi with Linfen as the center, the aggregated area of eastern Shanxi with Changzhi as the center, the aggregated area of Guanzhong with Xi’an as the center, the aggregated area of eastern Zhejiang with Wenzhou as the center, the aggregated area of central Jiangxi with Nanchang as the center, the aggregated area of Xiang-Gan junction with Yichun as the center, and the aggregated area of central Guizhou with Guiyang as the center. The population of the region is 0.77 billion, the area is 105,800 km2, and the GDP is 4.87 trillion Yuan, and the region occupies 1.10% of the total land area, supports 5.60% of the population and produces 6.41% of the GDP, representing the main area for the development of urbanization in China.
4. Discussions
4.1. Population Distribution and National Strategy
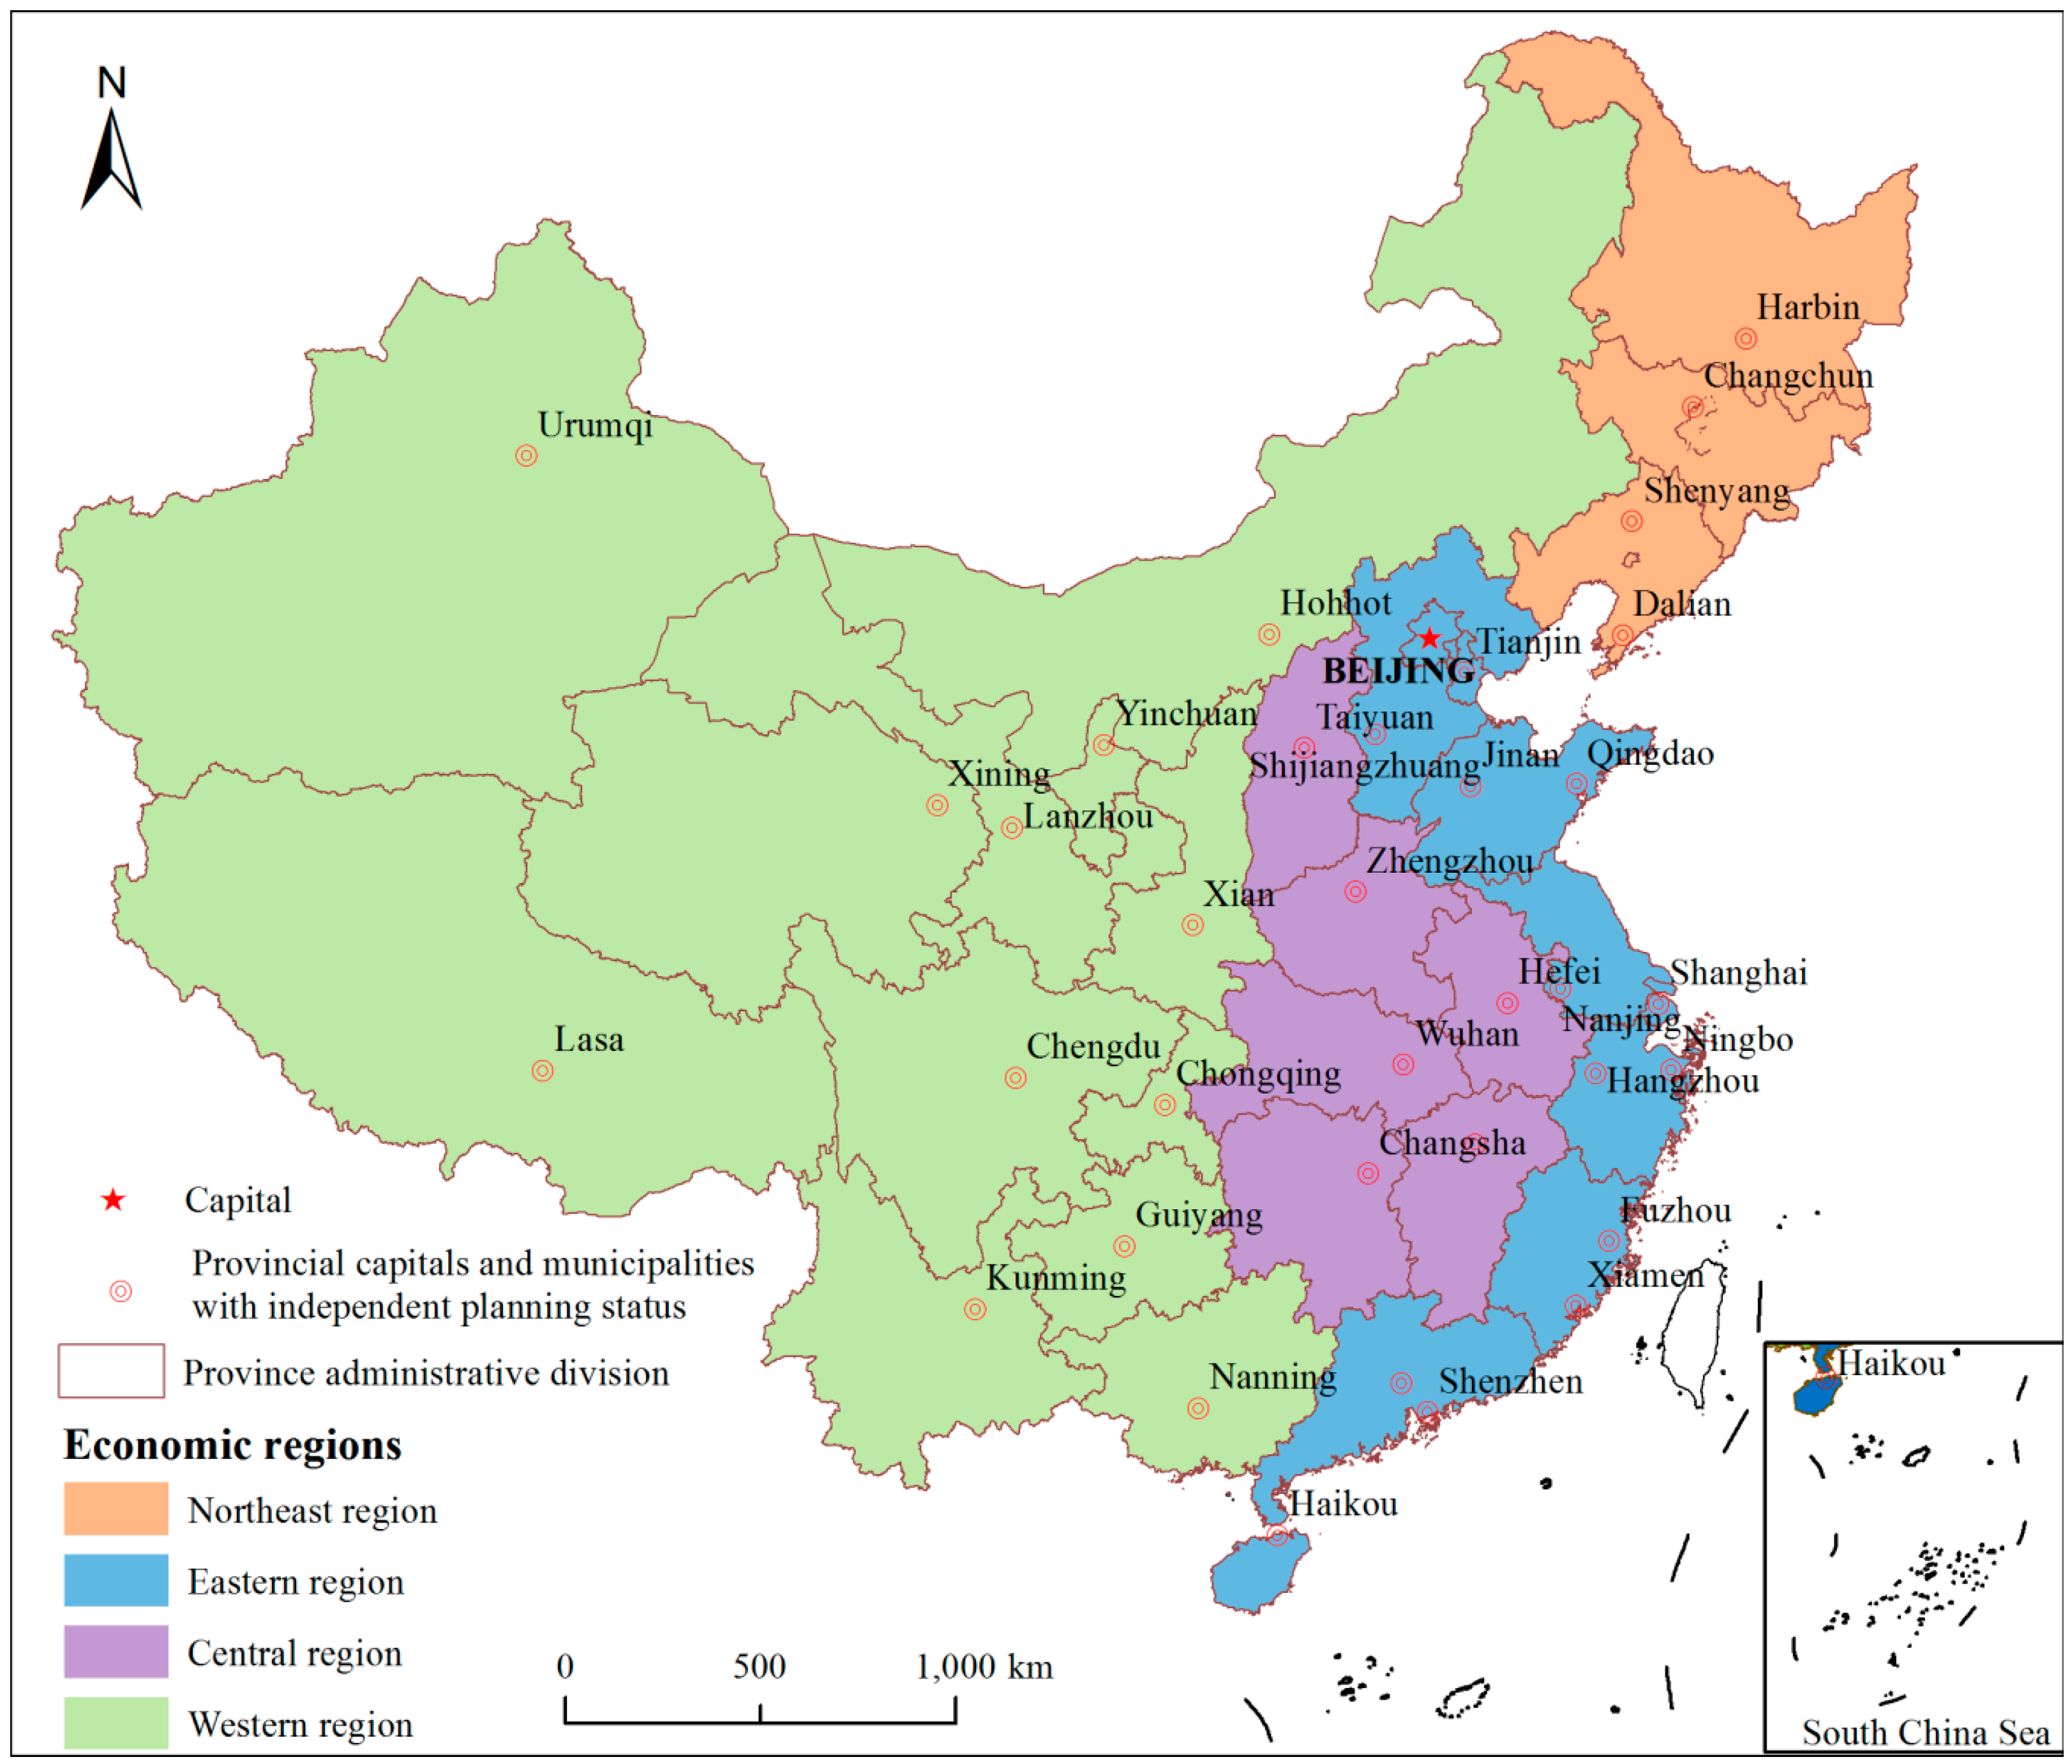
According to the new situation in China’s accelerated economic and social development, the country is divided into four major economic regions (see Figure 6): the eastern region, which includes Beijing, Tianjin, Hebei Province, Shanghai, Jiangsu Province, Zhejiang Province, Fujian Province, Shandong Province, Guangdong Province and Hainan Province; the northeast region, which includes Liaoning Province, Jilin Province and Heilongjiang Province; the central region, which includes Shanxi Province, Anhui Province, Jiangxi Province, Henan Province, Hubei Province and Hunan Province; and the western region, which includes Inner Mongolia, Guangxi, Chongqing, Sichuan Province, Guizhou Province, Yunnan Province, Tibet, Shanxi Province, Gansu Province, Qinghai Province, Ningxia and Xinjiang [41]. The main contents of the economic and social development in the various regions are the development of the western region, the revitalization of the northeast region, the rise of the central region, and the development that takes the lead in the eastern region.
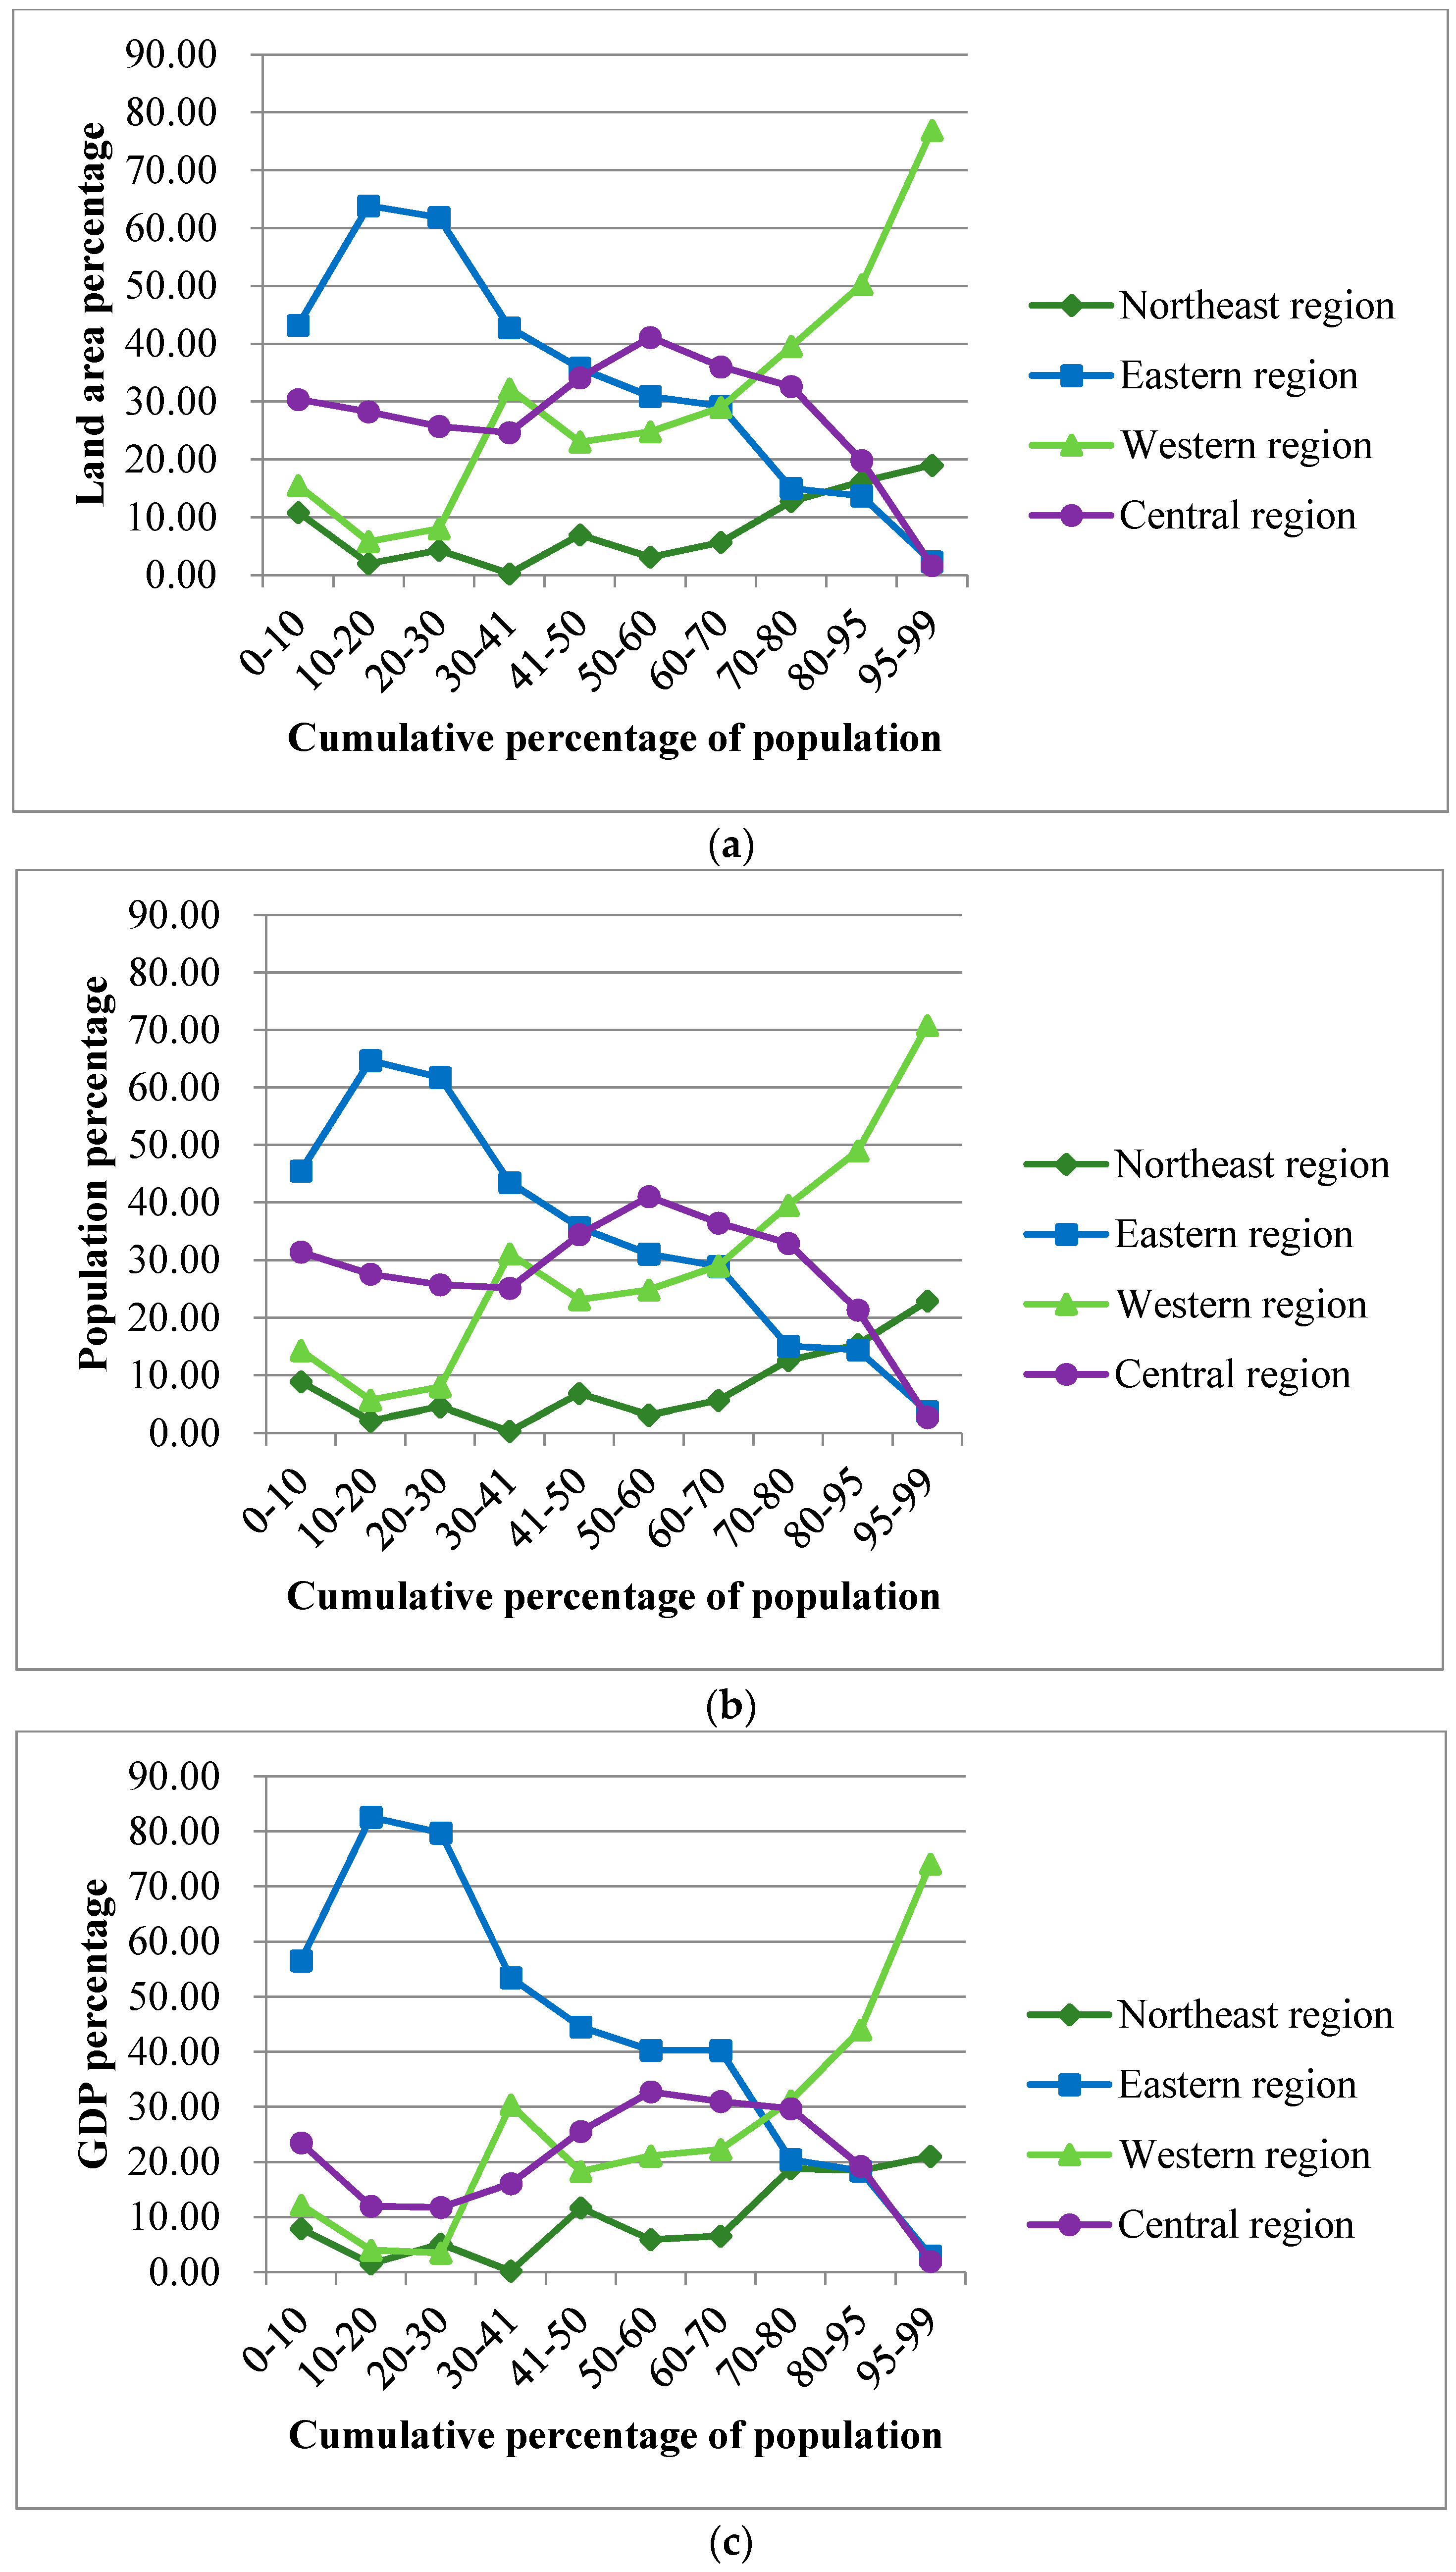
Based on the four major economic regions and the overlapping distributions of land area, population and GDP as the cumulative percentage of population increases with population density, shown in Figure 3, the percentages of land area, population and GDP in different intervals by cumulative percentage of population are portrayed in the four major economic regions in Figure 7. The land area percentage (Figure 7a), population percentage (Figure 7b) and GDP percentage (Figure 7c) at different intervals of cumulative percentage of population in the four major economic regions have similar distribution characteristics. The land area percentage, population percentage and GDP percentage in the eastern region are reduced as the cumulative percentage of population increases; the land area percentage, population percentage and GDP percentage in the western region increase following the increase in the cumulative percentage of population; the land area percentage, population percentage and GDP percentage in the central region first increase and then decrease following the increase in the cumulative percentage of population, while in the northeast region, the land area percentage, population percentage and GDP percentage are very low until the cumulative percentage of population reaches a level between 80% and 99%.
The land area percentage, population percentage and GDP percentage are the highest in the eastern region when the cumulative percentage of population is in the intervals of 0–50%, which means that the eastern region aggregated the most population and GDP in China. The land area percentage and population percentage are the highest in the central region, and the GDP percentage is still the highest in the eastern region when the cumulative percentage of population is in the intervals of 50–70%, which means the central region has the biggest potential to carry enough population for urbanization. The land area percentage, population percentage and GDP percentage are the highest in the western region when the cumulative percentage of population is in the intervals of 70–99%, which means the western region supports less population and produces the least GDP.
In summary, in the process of China’s urbanization, the eastern region has remained the focus of development, and the rise of the central region has been effective. Despite the strategy of developing the western region and the strategy of rejuvenating the old industrial bases in the northeast, the urbanization effects in the western and northeast regions are still significantly lower than the effects in the eastern and central regions. Since the implementation of the overall regional development strategy, the regional development gap has continuously narrowed, the self-development capabilities of the central, western and northeast regions have increased, the regional economy in China has undergone positive changes, and the development strategy of the “four regions” has been successful to a certain degree [42]. In contrast, the separation of economic ties between regions has restricted the application of regional comparative advantages, formed a policy-to-region comparison and not been conducive to the overall urbanization process in China [21].
4.2. Division of Spatial Distribution Structure of Population
Prof. Shimou Yao of the Nanjing Institute of Geography and Limnology, Chinese Academy of Sciences, pointed out in the proposed “6 + 7” scheme for the classification of spatial distribution structure of population in China that Chinese urban agglomerations can include 6 super large urban agglomerations and 7 urban agglomerations with similar urban agglomerations [29]; Prof. Chaolin Gu of Tsinghua University proposed the spatial structure of “3 + 3 + 7 + 17” for China’s urban system, which contained 3 metropolitan areas, 3 large urban areas, 7 urban agglomerated areas and 17 urban development areas [30]; Prof. Fang of the Chinese Academy of Sciences proposed the spatial pattern of “5 + 9 + 6” for urban agglomerations in China, which was focused on establishing 5 national-level urban agglomerations, steadily building 9 regional urban agglomerations and guiding the development of 6 local agglomerations [31]. In general, these are the main spatial pattern for describing urban agglomerations of China, the common characteristics are as follows: (1) based on municipal administrative units; (2) similar classification criteria, such as population size, per capita GDP, number of cities; (3) all proposed for China’s better urbanization.
To break the restrictions of the previous urban agglomerations with municipal administrative units as the basic unit, the “1 + 4 + 11” program uses the county as the basic unit, which can more accurately reflect the aggregate effect of China’s population and GDP; at the same time, the cumulative percentages of land area, population and GDP are sorted by population density from the highest to the lowest to better describe the distribution pattern of China’s population and propose the reasonable spatial distribution structure of population based on the highest aggregated population and GDP for China’s key urban development areas.
Figure 5 shows the distribution characteristics of key urban development areas in China. It can be seen that the aggregated areas of population and economy growth of the “1 + 4 + 11” program are all located east of the “Hu Huanyong” line, which takes the important guiding role for the population distribution pattern in China. Hence, China’s population and economic development will continue to focus east of the “Hu Huanyong” line; that is, the future direction of China’s urbanization is still in eastern and central China, which represents the areas of aggregated population and GDP.
In this research, we select two indicators of population and GDP to characterize the population distribution pattern. Later, the ecological environment, such as rainfall, water resources and other limiting factors, can be added to describe the spatial distribution structure of population. It would thus have a more reasonable pattern, better environment, and more suitable urbanization area for human habitation and life.
5. Conclusions
Based on county-level administrative regions, this study proposes a spatial distribution structure of population as the key development areas in China. The main conclusions are as follows:
- (1)
- In 2015, the distribution of population density of China based on the county-level administrative regions presents a pattern of high in the southeast and low in the northwest. The areas with high population density are mainly concentrated in the middle and lower reaches of the Yellow River, the Yangtze River Delta, the Sichuan Basin and the southeastern coastal area. The population densities differ significantly on both side of the “Hu Huanyong Line”, and the population main lives in the southeast of China. In the study of Chen et al. (2016), the Chinese population showed a trend of migration to the northwest of the country from 1933 to 2010, while the whole distribution pattern of population has not changed [18]. Therefore, our results are consistent with Chen et al. (2016)’s study although this study uses the household population, and Chen et al. (2016) uses the census data, namely, there is inconsistency in the population statistics. This study considers that the analysis of the distribution pattern of population by household population demographics can more accurately reflect the current status of urbanization in China.
- (2)
- There is a great difference of the spatial correlation between land area, population and GDP in China. Based on the population density from high to low, the cumulative percentages of population and GDP are increase with the cumulative percentage of land area. The economic concentration is higher than the population concentration. In the areas with highly aggregated population and GDP, per capita GDP is higher. These regions can be used as main development areas for urbanization in China.
- (3)
- Based on the areas with highly aggregated population and GDP, the spatial distribution structure of population of “1 + 4 + 11” for China’s urbanization is put forward, including one national-level aggregated area of population and economic production, 4 regional-level aggregated areas of population and economic production and 11 local regional aggregated areas of population and economic production, which would account for 10.72% of the land area, support 55.56% of the total population and produce 67.22% of the GDP. This spatial distribution structure enriches the theoretical characterization of population, and also points out the future direction of China’s urbanization according to the aggregation of population and GDP.
In this study, we propose the spatial distribution structure of population of “1 + 4 + 11” for urbanization based on the overlapping distribution of land area, population and GDP in an attempt to explore the future direction of China’s urbanization. This spatial structure can be used to formulate the spatial development pattern and provide scientific guidance for the future urbanization of China. It selects only two indicators of population and GDP to characterize the population distribution pattern. More indicators, such as rainfall, water resources and other limiting factors, can be added to better optimize the spatial distribution structure of population, enrich the index system of population structure and build a more efficient and sustainable development of urbanization in China.
Author Contributions
B.H. conceptualized this research and contributed extensively to data curation and formal analysis; M.L. contributed to the methodology, investigation and writing of this research; R.G. and Y.C. gave the ideas to validate the conceptualization and methodology; Y.L. and Y.F. provided many suggestions for improving and modifying this article.
Funding
This research was funded by “China Postdoctoral Science Foundation (grant number: 2018M633108)”.
Acknowledgments
The authors are grateful for the Project of “Spatial Pattern of Land Using Big Data Resources” and “Connection value of transportation network based on breaking points model” of Shenzhen University. We would like to thank Xi Kuai and Zhilu Yuan, research staff at the Research Institute for Smart Cities, and the respondents of the survey.
Conflicts of Interest
The authors declare no conflict of interest.
References
- Clarke, J.I. Population geography. Prog. Hum. Geogr. 1980, 4, 385–391. [Google Scholar] [CrossRef] [PubMed]
- Li, S.C.; Cai, Y.L. Some scaling issues of geography. Geogr. Res. 2005, 23, 16–26. [Google Scholar] [CrossRef]
- The World Bank. World Development Indicators. Available online: https://data.worldbank.org (accessed on 7 June 2018).[Green Version]
- Food and Agriculture Organization of the United Nations. FAOSTAT. Available online: www.fao.org/faostat/en/#home (accessed on 7 June 2018).
- Clark, C. Urban population densities. J. R. Stat. Soc. Ser. A 1951, 114, 490–496. [Google Scholar] [CrossRef]
- John, Q.S.; Warntz, W. Physics of population distribution. J. Reg. Sci. 1958, 1, 99–121. [Google Scholar] [CrossRef]
- Newling, B.E. The spatial variation of urban population densities. Geogr. Rev. 1969, 59, 242–252. [Google Scholar] [CrossRef]
- Berry, B.J.L.; Kim, H.M. Challenges to the Monocentric Model. Geogr. Anal. 2010, 25, 1–4. [Google Scholar] [CrossRef]
- Griffith, D.A. Modelling urban population density in a multi-centered city. J. Urban Econ. 1981, 9, 298–310. [Google Scholar] [CrossRef]
- Crols, T.; Vanderhaegen, S.; Canters, F.; Engelen, G.; Poelmans, L.; Uljee, I.; White, R. Downdating high-resolution population density maps using sealed surface cover time series. Landsc. Urban Plan. 2017, 160, 96–106. [Google Scholar] [CrossRef]
- Clark, D.E.; Cushing, B.M. Rural and urban traffic fatalities, vehicle miles, and population density. Accid. Anal. Prev. 2004, 36, 967–972. [Google Scholar] [CrossRef] [PubMed]
- Guimond, L.; Simard, M. Gentrification and neo-rural populations in the Québec countryside: Representations of various actors. J. Rural Stud. 2010, 26, 449–464. [Google Scholar] [CrossRef]
- Hagedoorn, P.; Vandenheede, H.; Vanthomme, K.; Gadeyne, S. Socioeconomic position, population density and site-specific cancer mortality: A multilevel analysis of belgian adults, 2001–2011. Int. J. Cancer 2017, 142, 23–35. [Google Scholar] [CrossRef] [PubMed]
- Graves, P.E.; Clawson, M. Rural to urban migration: Population distribution patterns. Surv. Agric. Econ. Lit. 1981, 3, 362–390. Available online: https://works.bepress.com/philip_graves/79/ (accessed on 7 June 2018).
- Hudson, J. Density and pattern in suburban fringes. Ann. Assoc. Am. Geogr. 1973, 63, 28–39. [Google Scholar] [CrossRef]
- Hu, H.Y. Distribution of China’s Population—Attached statistical table and density chart. Acta Geogr. Sin. 1935, 2, 33–74. [Google Scholar]
- Hu, Z.C.; Wang, Y.L.; Liu, Y.S.; Long, H.L.; Peng, J. Spatio-temporal patterns of urban-rural development and transformation in east of the “hu huanyong line”, China. ISPRS Int. J. Geo-Inf. 2016, 5, 24. [Google Scholar] [CrossRef]
- Chen, M.X.; Gong, X.H.; Li, Y.; Lu, D.D.; Zhang, H. Population distribution and urbanization on both sides of the Hu Huanyong Line: Answering the Premier’s question. J. Geogr. Sci. 2016, 26, 1593–1610. [Google Scholar] [CrossRef] [Green Version]
- Fan, J.; Tao, A.; Ren, Q. On the Historical Background, Scientific Intentions, Goal Orientation, and Policy Framework of Major Function-Oriented Zone Planning in China. J. Resour. Ecol. 2010, 4, 289–299. [Google Scholar] [CrossRef]
- Fang, C.; Wang, J. A Theoretical Analysis of Interactive Coercing Effects between Urbanization and Eco-environment. Chin. Geogr. Sci. 2013, 23, 147–162. [Google Scholar] [CrossRef]
- Chen, M.; Liu, W.; Lu, D. Challenges and the way forward in China’s new-type urbanization. Land Use Policy 2016, 55, 334–339. [Google Scholar] [CrossRef] [Green Version]
- Deng, C.; Min, L.I.; Jin, Y.B. Spatial-Temporal Variation Characteristics and Main Influence Factors Analysis of Population Distribution Pattern in Hunan Province. Econ. Geogr. 2017, 37, 41–48. [Google Scholar]
- Tan, S.; Li, Y.; Song, Y.; Luo, X.; Zhou, M.; Zhang, L.; Kuang, B. Influence factors on settlement intention for floating population in urban area: A China study. Qual. Quant. 2017, 51, 147–176. [Google Scholar] [CrossRef]
- Xu, W.P.; Jiang, H.; Li, Y.W. Study on Difference between the Environmental Effects of Population Agglomeration and Economic Agglomeration in China: Based on Analysis of Provincial Panel Data. Ecol. Econ. 2018, 34, 123–127. [Google Scholar]
- Qian, Y.Y.; Weingast, B.R. China’s transition to markets: Market-preserving federalism, Chinese style. J. Econ. Policy Reform 1996, 1, 149–185. [Google Scholar] [CrossRef]
- Mayer, J. The fallacy of composition: A review of the literature. World Econ. 2010, 25, 875–894. [Google Scholar] [CrossRef]
- Lu, C. A framework of evolution and optimization of regional population distribution for sustainable development in China. Eur. J. Biochem. 2015, 238, 88–96. [Google Scholar] [CrossRef]
- Guan, X.; Wei, H.; Lu, S.; Su, H. Mismatch distribution of population and industry in china: Pattern, problems and driving factors. Appl. Geogr. 2018, 97, 61–74. [Google Scholar] [CrossRef]
- Yao, S.M. Urban Agglomerations of China; University of Science and Technology of China Press: Hefei, China, 2006. [Google Scholar]
- Gu, C.L.; Yu, T.F.; Li, W.M. Urbanization in China: Pattern, Process and Mechanism; Science Press: Beijing, China, 2008. [Google Scholar]
- Fang, C.L.; Bao, C.; Ma, H.T. Urban Agglomeration Development in China; Science Press: Beijing, China, 2016. [Google Scholar]
- Ministry of Civil Affairs of the People’s Republic of China. Administrative Division of the People’s Republic of China; Chinese Social Publishing House: Beijing, China, 2017.
- National Bureau of Statistics of China. China County Statistical Yearbook; China Statistics Press: Beijing, China, 2016.
- National Bureau of Statistics of China. China City Statistical Yearbook-2016; China Statistics Press: Beijing, China, 2016.
- Beijing Municipal Bureau of Statistics. Beijing Statistical Bulletin on National Economic and Social Development in 2017. Available online: http://www.bjstats.gov.cn/zxfb/201802/t20180225_393332.html (accessed on 3 September 2018).
- Chongqing Statistics. Chongqing Statistical Bulletin on National Economic and Social Development in 2017. Available online: http://www.cqtj.gov.cn/tjsj/shuju/tjgb/201803/t20180316_447954.htm (accessed on 3 September 2018).
- Gottmann, J. Megalopolis or the urbanization of the northeastern seaboard. Econ. Geogr. 1957, 33, 189–200. [Google Scholar] [CrossRef]
- Zhou, Y.X.; Laurence, J.; Ma, C. Economic restructuring and suburbanazation in China. Urban Geogr. 2000, 21, 205–236. [Google Scholar] [CrossRef]
- Yao, S.M.; Liu, T. The evolution of urban spatial structure in the open area of southeastern coastal China. Urban Geogr. 2013, 16, 561–576. [Google Scholar] [CrossRef]
- Stimson, E.B.R.; Stough, R.R.; Nijkamp, P. Endogenous regional development: Perspectives, measurement and empirical investigation. J. Reg. Sci. 2011, 51, 1022–1024. [Google Scholar] [CrossRef]
- National Bureau of Statistics of China. Available online: http://www.stats.gov.cn/ztjc/zthd/sjtjr/dejtjkfr/tjkp/201106/t20110613_71947.htm (accessed on 7 June 2018).
- Guan, X.; Wei, H.; Lu, S.; Dai, Q.; Su, H. Assessment on the urbanization strategy in China: Achievements, challenges and reflections. Habitat Int. 2018, 71, 97–109. [Google Scholar] [CrossRef]
Figure 1.
Technical flow of population distribution pattern at the county level of China.
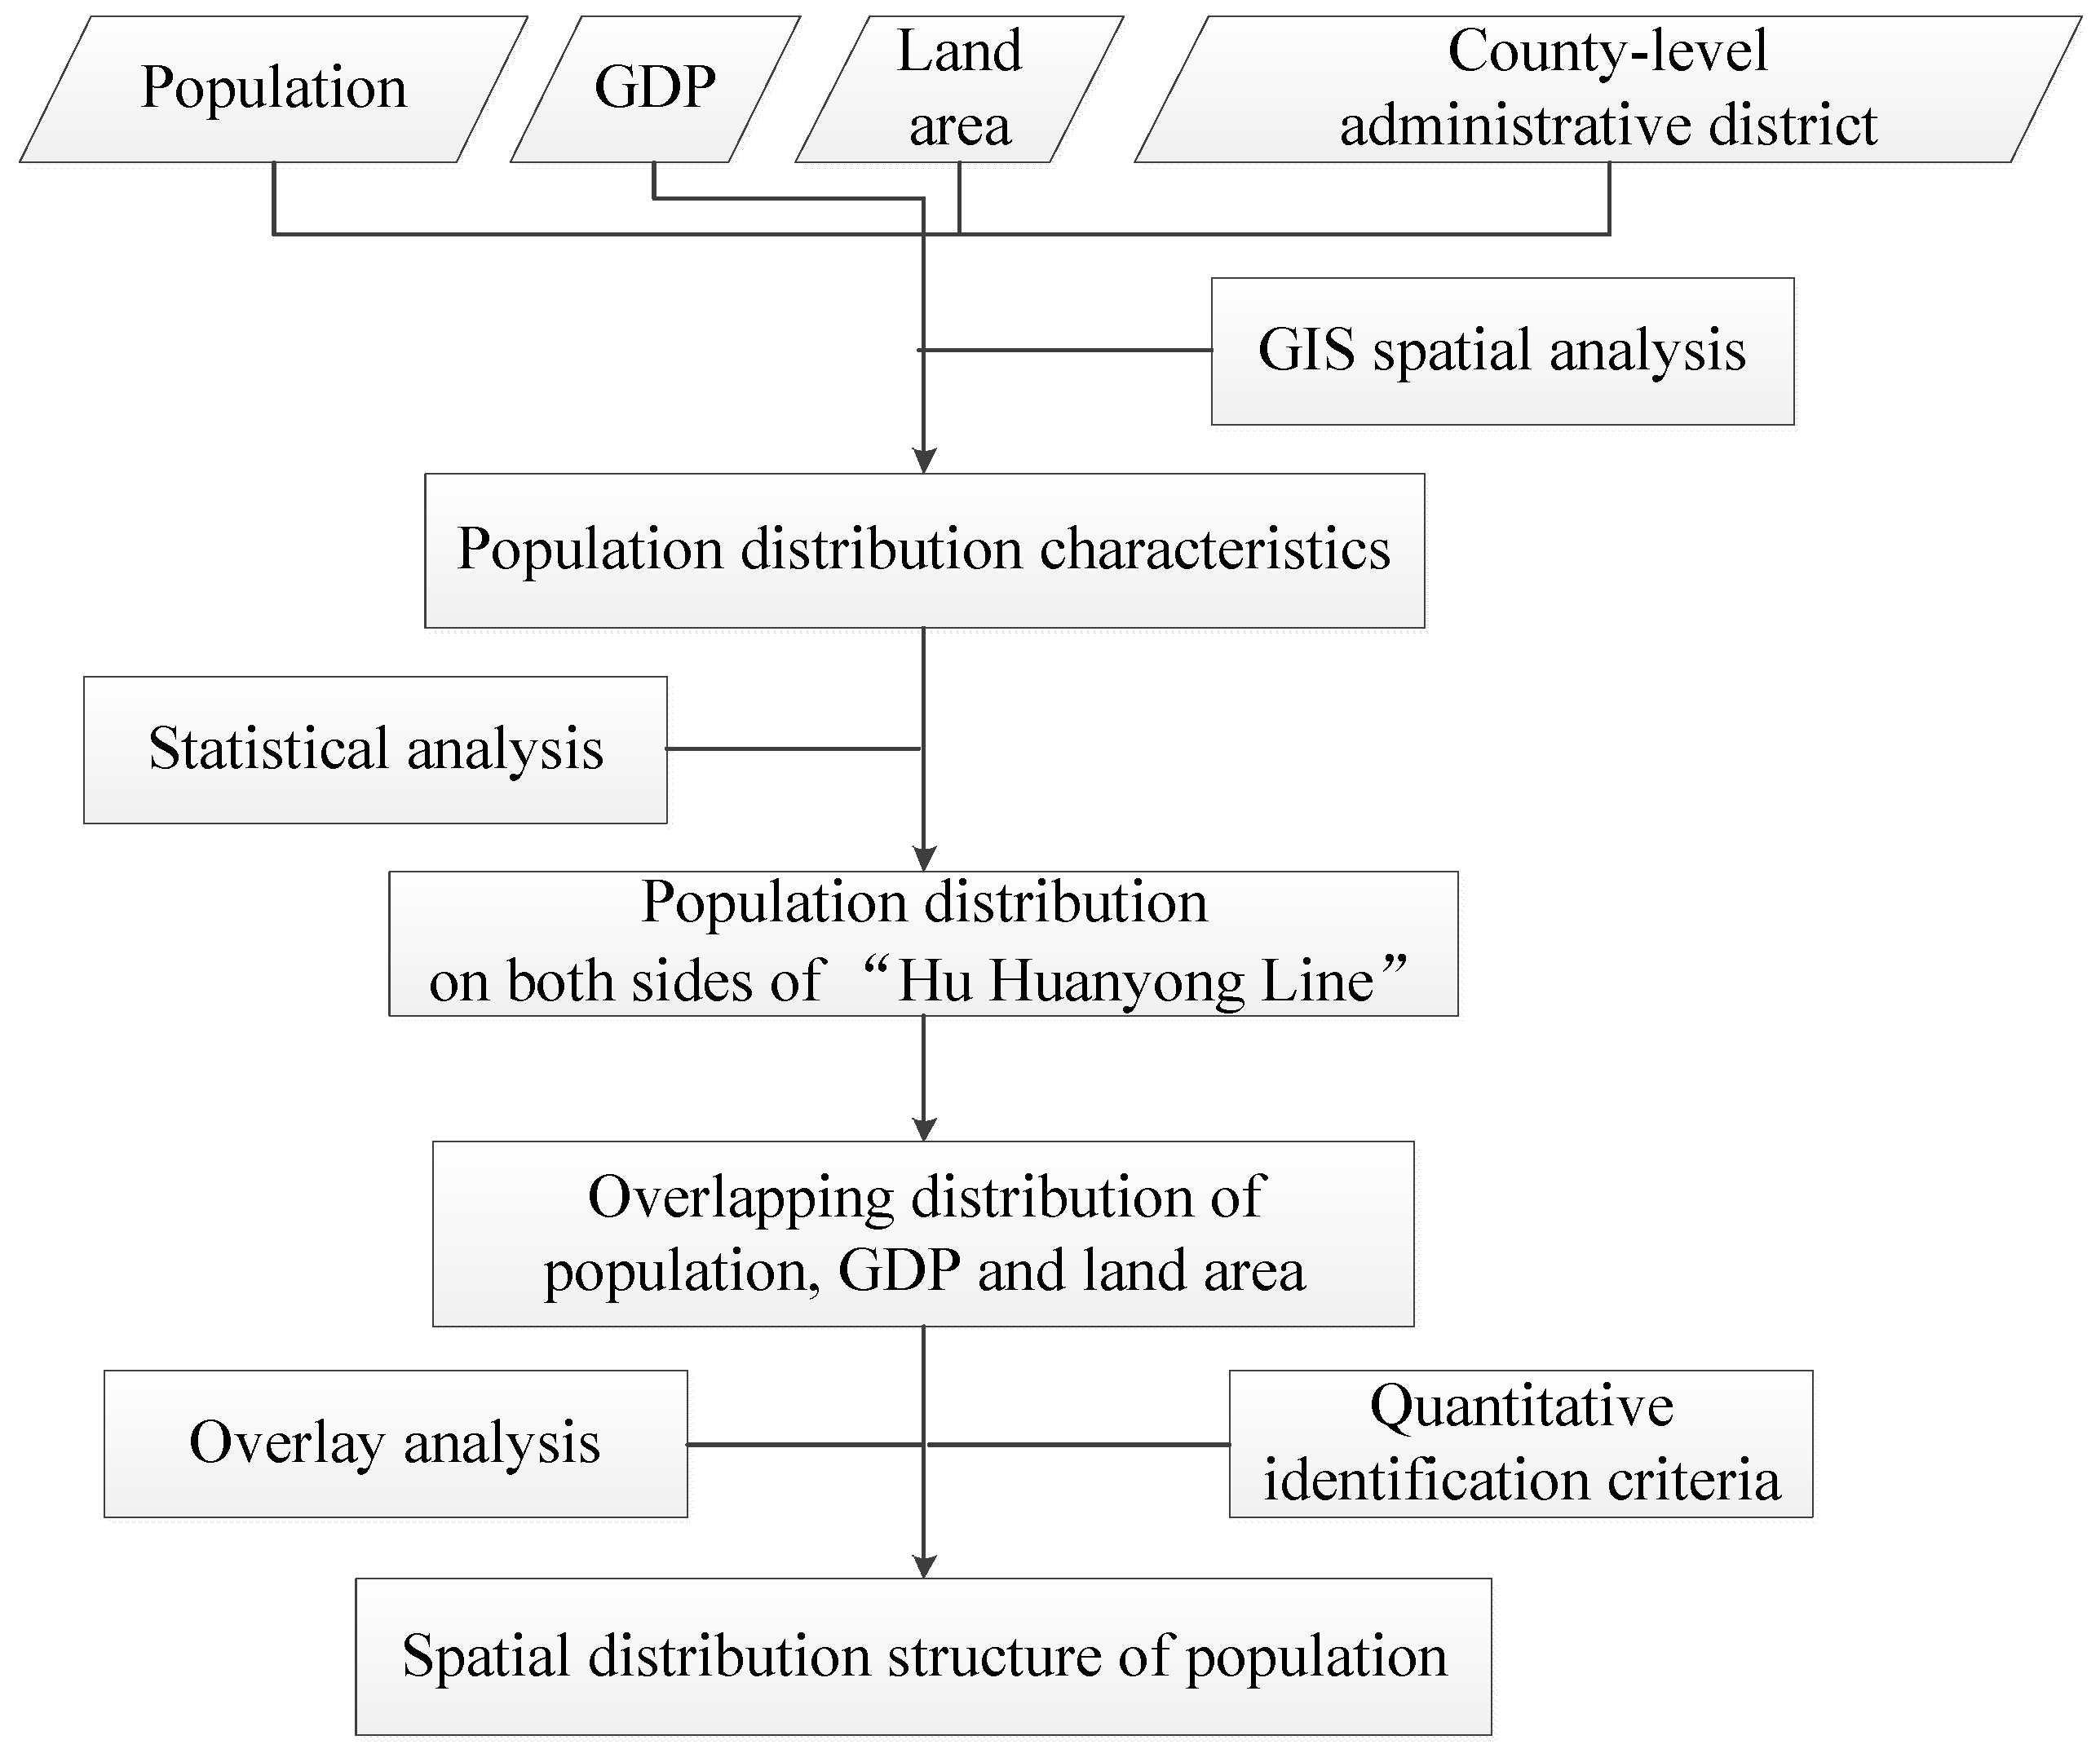
Figure 2.
Population distribution pattern of China in 2015.
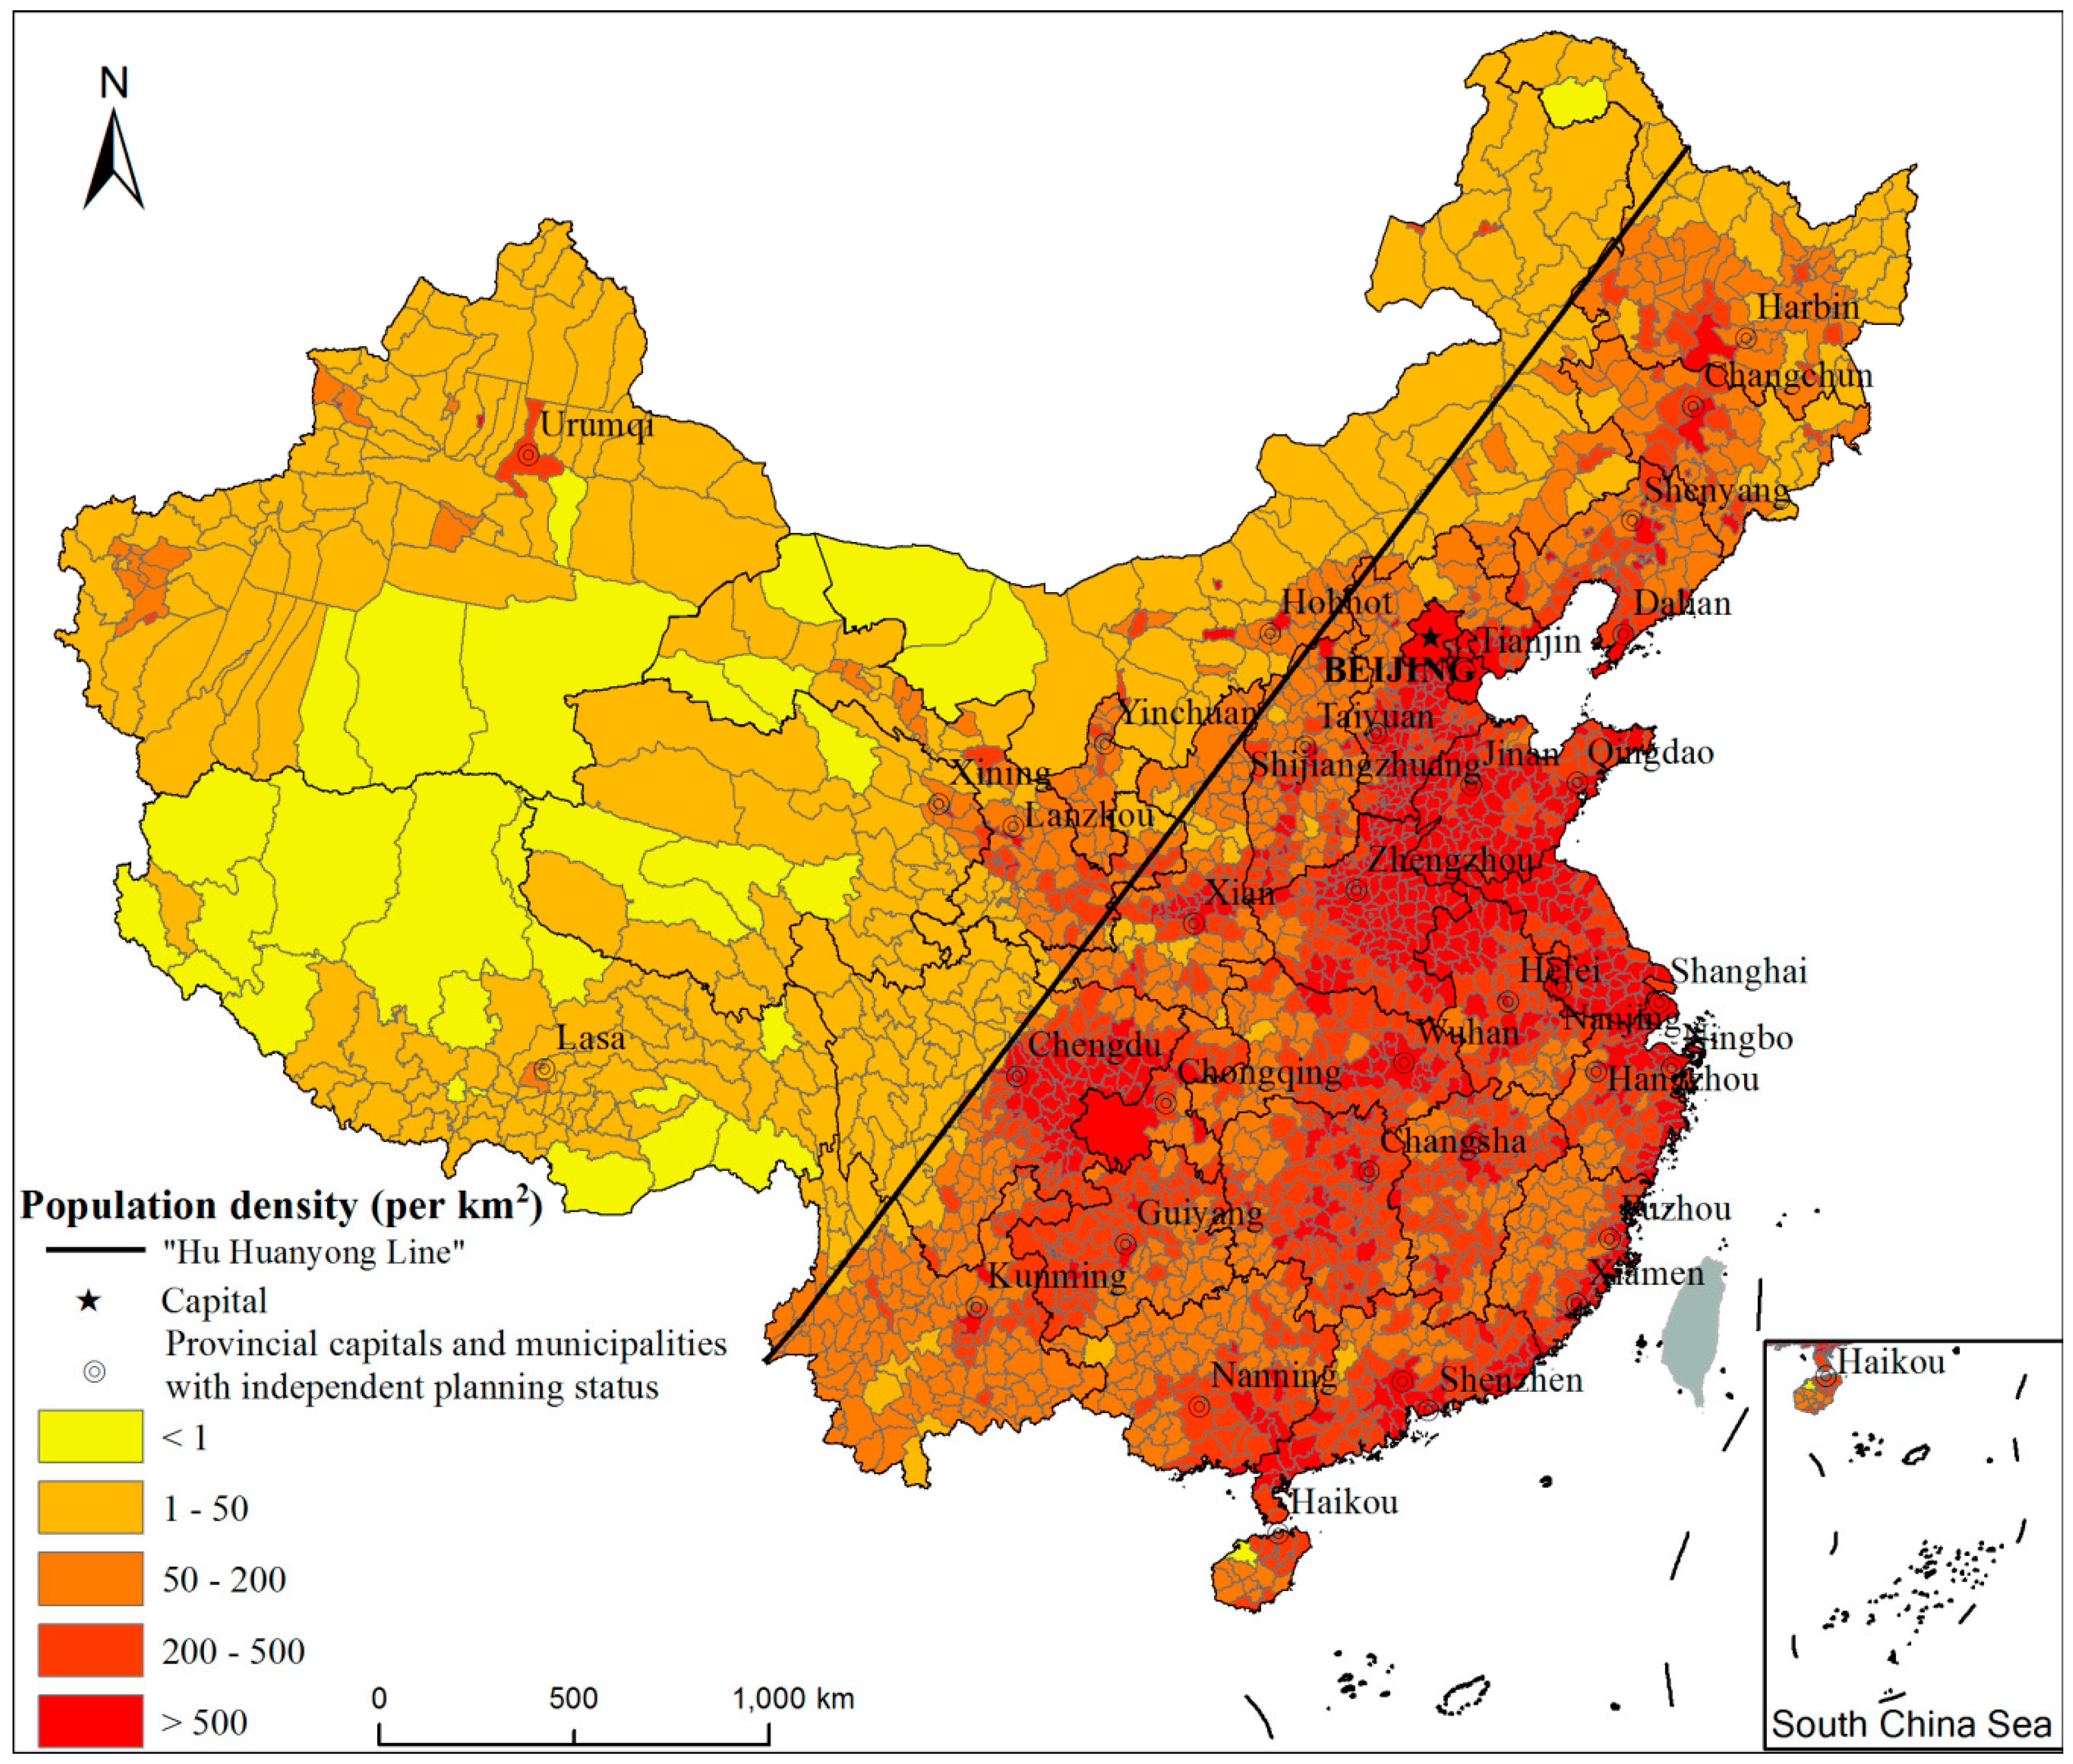
Figure 3.
The overlapping distribution of land area, population and GDP with the increase of the cumulative percentage of population; (a) the cumulative percentages of land area and GDP are 1% and 21% when the cumulative percentage of population is 10%; (b) the cumulative percentages of land area and GDP are 4% and 51% when the cumulative percentage of population is 30%; (c) the cumulative percentages of land area and GDP are 12% and 76% when the cumulative percentage of population is 60%; and (d) the cumulative percentages of land area and GDP are 38% and 96% when the cumulative percentage of population is 95%, among them, the cumulative percentages of population use integers which can describe the changes simply.
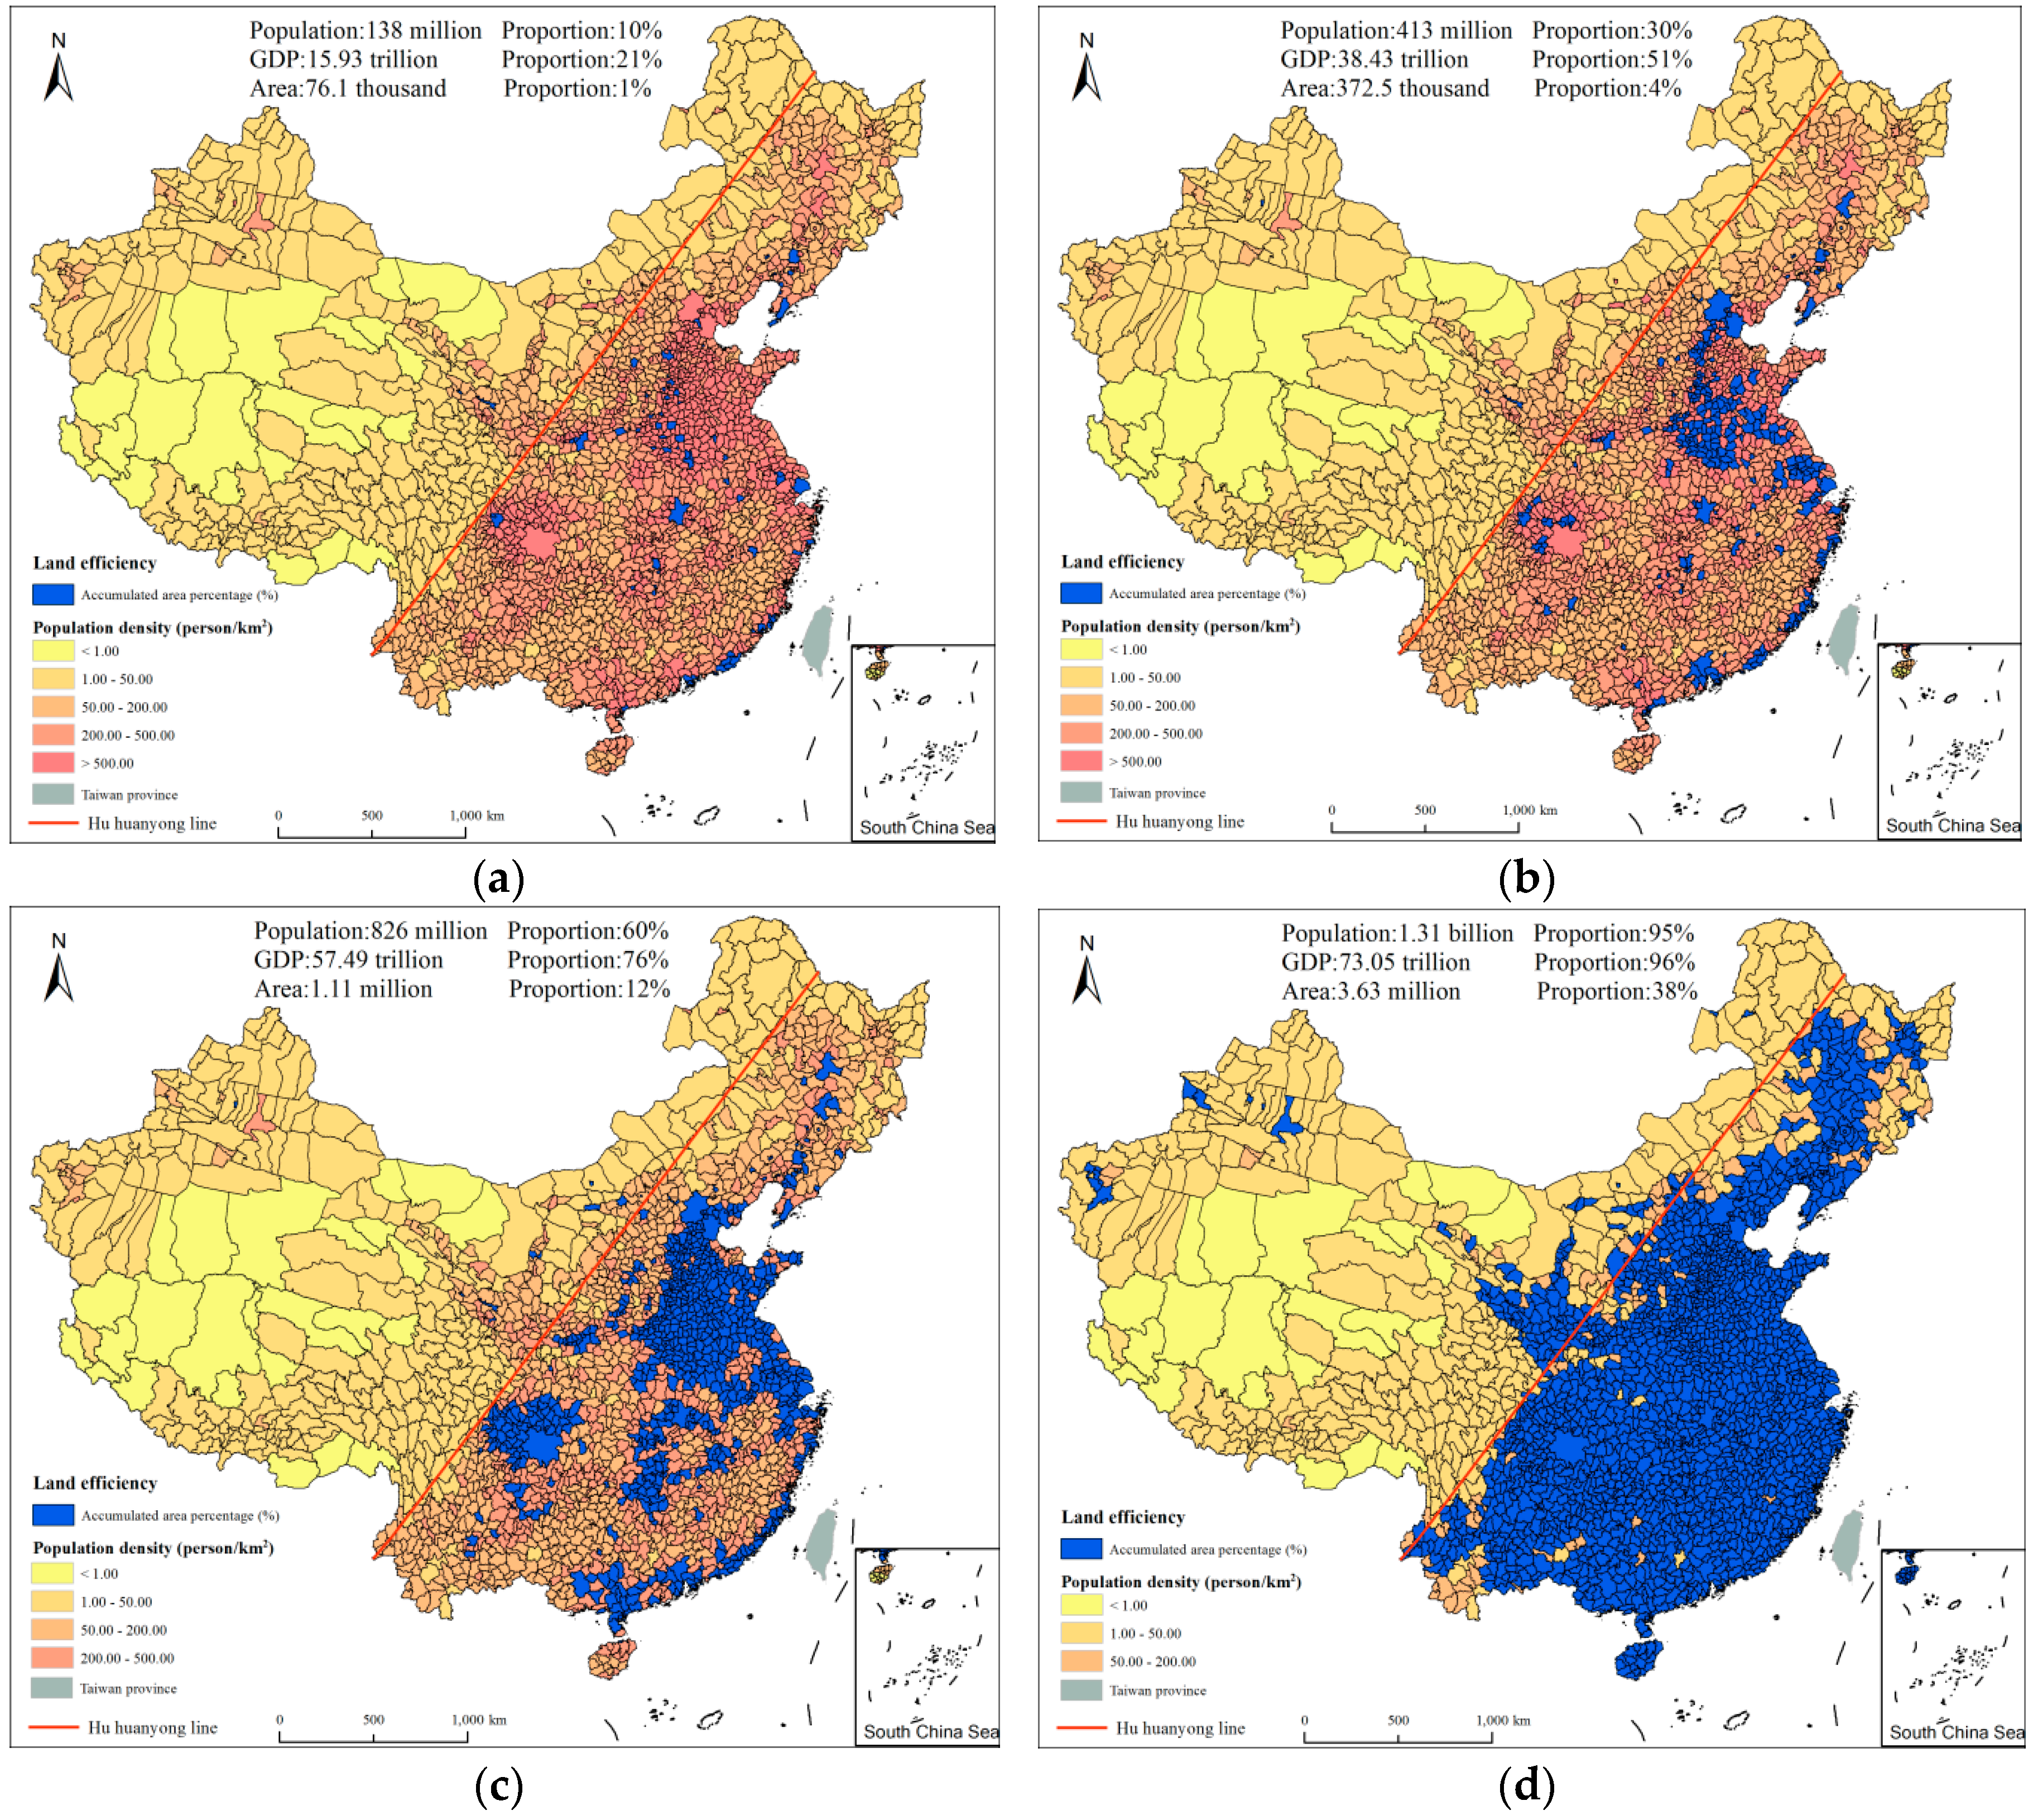
Figure 4.
The cumulative percentage of land area, population and GDP sorted by population density from the highest to the lowest.
Figure 4.
The cumulative percentage of land area, population and GDP sorted by population density from the highest to the lowest.

Figure 5.
Spatial distribution structure of population for the future urbanization in China, among them, the numbers in the map are correspondent with those in Table 3.
Figure 5.
Spatial distribution structure of population for the future urbanization in China, among them, the numbers in the map are correspondent with those in Table 3.

Figure 6.
Four major economic regions of China.

Figure 7.
Description of the land area percentage (a), population percentage (b) and GDP percentage (c) in different intervals of cumulative percentage of population in the four major economic regions.
Figure 7.
Description of the land area percentage (a), population percentage (b) and GDP percentage (c) in different intervals of cumulative percentage of population in the four major economic regions.


Table 1.
Population-related statistics for the years 2015.
| Index | 2015 |
|---|---|
| Number of counties | 2209.00 |
| Area (Ten thousand km2) | 956.37 |
| Population (100 million) | 13.75 |
| Population density (person/km2) | 143.82 |
| GDP per capita (Ten thousand Yuan /person) | 5.52 |
| GDP per area (Ten thousand Yuan/km2) | 794.55 |
| Construction land per capita (m2/person) | 283.64 |
Table 2.
The proportion of population on both sides of the “Hu Huanyong line” of China in 2015.
| Year | Northwest of the “Hu Huanyong Line” | ||
| Area Proportion (%) | Population Percentage (%) | Population Density (People/km2) | |
| 2015 | 57.25 | 6.12 | 15.34 |
| Year | Southeast of the “Hu Huanyong Line” | ||
| Area Proportion (%) | Population Percentage (%) | Population Density (People/km2) | |
| 2015 | 42.75 | 93.88 | 314.85 |
Table 3.
Characteristics of spatial distribution structure of population.
| ID | Name | Population (100 Million) | Area (10 Thousand km2) | GDP (Trillion Yuan) | Class | Regions |
|---|---|---|---|---|---|---|
| 1 | Aggregated area of northern and eastern China | 4.34 | 56.17 | 29.38 | 1 | Taking Beijing, Tianjin, Shijiazhuang, Jinan, Qingdao, Zhengzhou, Hefei, Nanjing, Hangzhou and Ningbo as the centers |
| 2 | Aggregated area of Cheng Yu | 0.89 | 13.45 | 3.90 | 2 | Taking Chongqing and Chengdu as the centers |
| 3 | Aggregated area of central Yangtze River | 0.64 | 9.94 | 3.72 | 2 | Taking Wuhan and Changsha as the centers |
| 4 | Aggregated area of the west side | 0.41 | 4.18 | 2.29 | 2 | Taking Fuzhou and Xiamen as the centers |
| 5 | Aggregated area of Guangdong and Guangxi | 0.59 | 8.60 | 6.92 | 2 | Taking Guangzhou, Shenzhen and Nanning as the centers |
| 6 | Aggregated area of central Liaoning | 0.08 | 0.64 | 0.76 | 3 | Taking Shenyang as the center |
| 7 | Aggregated area of eastern Liaoning | 0.05 | 0.68 | 0.38 | 3 | Taking Yingkou as the center |
| 8 | Aggregated area of coastal Shandong | 0.04 | 0.69 | 0.53 | 3 | Taking Yantai as the center |
| 9 | Aggregated area of the central Shanxi | 0.06 | 0.74 | 0.35 | 3 | Taking Taiyuan as the center |
| 10 | Aggregated area of western Shanxi | 0.04 | 0.64 | 0.10 | 3 | Taking Linfen as the center |
| 11 | Aggregated area of eastern Shanxi | 0.02 | 0.18 | 0.07 | 3 | Taking Changzhi as the center |
| 12 | Aggregated area of Guanzhong | 0.15 | 1.68 | 0.80 | 3 | Taking Xian as the center |
| 13 | Aggregated area of eastern Zhejiang | 0.11 | 1.13 | 0.72 | 3 | Taking Wenzhou as the center |
| 14 | Aggregated area of central Jiangxi | 0.11 | 1.92 | 0.66 | 3 | Taking Nanchang as the center |
| 15 | Aggregated area of Xiang-Gan junction | 0.04 | 0.65 | 0.15 | 3 | Taking Yichun as the center |
| 16 | Aggregated area of central Guizhou | 0.09 | 1.64 | 0.36 | 3 | Taking Guiyang as the center |
| Total | Aggregated areas | 7.64 | 102.92 | 51.08 | - | Southeastern China |
© 2018 by the authors. Licensee MDPI, Basel, Switzerland. This article is an open access article distributed under the terms and conditions of the Creative Commons Attribution (CC BY) license (http://creativecommons.org/licenses/by/4.0/).
Share and Cite
MDPI and ACS Style
Li, M.; He, B.; Guo, R.; Li, Y.; Chen, Y.; Fan, Y. Study on Population Distribution Pattern at the County Level of China. Sustainability 2018, 10, 3598. https://doi.org/10.3390/su10103598
AMA Style
Li M, He B, Guo R, Li Y, Chen Y, Fan Y. Study on Population Distribution Pattern at the County Level of China. Sustainability. 2018; 10(10):3598. https://doi.org/10.3390/su10103598
Chicago/Turabian StyleLi, Minmin, Biao He, Renzhong Guo, You Li, Yu Chen, and Yong Fan. 2018. "Study on Population Distribution Pattern at the County Level of China" Sustainability 10, no. 10: 3598. https://doi.org/10.3390/su10103598
Note that from the first issue of 2016, this journal uses article numbers instead of page numbers. See further details here.