Tourism and Environmental Pollution: Evidence from the One Belt One Road Provinces of Western China


1
School of Economics, Lanzhou University, Lanzhou 730000, China
2
Department of Management and Humanities, Universiti Teknologi PETRONAS, Seri Iskandar 32610, Malaysia
3
Faculty of Economics and Administrative Sciences, Cag University, Tarsus/Mersin 33800, Turkey
4
School of Economics and Management, Southeast University, Nanjing 211189, China
*
Author to whom correspondence should be addressed.
Sustainability 2018, 10(10), 3520; https://doi.org/10.3390/su10103520
Submission received: 12 August 2018
/
Revised: 16 September 2018
/
Accepted: 26 September 2018
/
Published: 30 September 2018
(This article belongs to the Section Environmental Sustainability and Applications)
Abstract
:The rapid economic development of China and the industrial shift from its eastern to western provinces have resulted in significant negative impacts on the environment. Recently, tourism has emerged as an alternative for economic and environmental development, but it is a double-edged sword. Without the required measures to protect environment, the opportunity cost of tourism is environmental degradation. The western part of China holds a significant advantage for the development of travel and tourism (T&T), due to One Belt One Road (OBOR), unique ancient culture and spectacular variety of natural scenic spots. This region is among the less explored and less developed, but important, parts of China. Taking this point into consideration, this paper aims to examine the impact of tourism on the environmental pollution of five provinces located in the heart of OBOR over the period of 1991–2016. To explore this link, we used the fully modified ordinary least squares (FMOLS) approach and Gregory-Hansen test for robustness check. We applied the Zivot-Andrews unit root test to deal with structural breaks in data. Our results confirm a negative impact of tourism on environment for Ningxia, Qinghai, Gansu, and Shanxi. However, tourism improves the environmental quality of Xinjiang. The negative impact of energy consumption and GDP growth is significant than tourism. Our findings suggest that the relationship varies for different provinces in the same region depending on the specific provincial features and government policies. Furthermore, tourism development has great potential to improve the economic and environmental sustainability in these provinces.
1. Introduction
Sustainability is a broad topic due to its application in various disciplines and sectors. Recently, the world has been shifting focus on sustainable development (SD). The concept of SD is rooted back in 1987 and the Brundtland Commission report defined SD as seeking “to meet the needs and aspirations of the present without compromising the ability to meet those of the future” [1]. The three basic pillars of SD include environmental, social, and economic sustainability, and the coordinated connection among three factors is necessary to achieve SD. The environmental sustainability deals with the confinement of human activities without deteriorating the capacity of ecosystem. However, the optimal use of available resources and the usage of artificial or manmade resources to increase the profit and market value are termed as economic sustainability. Similarly, the social aspect of sustainability focuses on the well-being of masses and encourages the participation and utilization of local capital for the common good [2]. These three aspects are interlinked and they have significant impact on eco-system. For survival, humans are dependent on eco-system in the form of clean environment, social and economic needs. As a feedback, the survival and quality of eco-system is transformed by humans. For example, energy consumption, deforestation, waste generation in land and ocean, as well as the corresponding carbon emission from these activities can adversely affect these services for future generations. The United Nation (UN) proposed 17 Sustainable Development Goals (SDGs) to deal with this challenging situation. The roots of economic and social development are connected with the strong ecological foundation. The goal fourteen and fifteen are focused on a strong and clean eco-system that provides bases for sustainable development with the help of the sustainable use of resources available in current eco-system. Likewise, the emphasis to control climate change and protect the environment with innovative industrial infrastructure and environment friendly production are the modern steps towards sustainability. Additionally, the promotion of modern eco-friendly economic sectors and the use of renewable energy sources to reduce the carbon emission to footer the sustainable development is the central agenda of these goals [3].
Taking the concept of SD into consideration, the sustainable tourism has been committed to generate economic, social, and environmental benefits for society. Nevertheless, this sector has significant impact on environment and this point motivates the present study to investigate the relationship between tourism and environmental pollution for One Belt One Road (OBOR) provinces of Western China. The Northwest provinces are known for arid climate, scarce water resources and less economic development. Among other SD issues, the fresh water demand from tourists might cause serious water sustainability issues for a region with an already fragile ecological environment and rapid tourism development can overwhelm the environmental impacts of tourism in this region [4]. Therefore, the investigation of the relationship between tourism and pollution for this region can be significant contribution the environmental sustainability of Western China.
Tourism currently stands among the largest and fastest growing economic sectors worldwide due to its significant contribution in host economy. As one of the fastest growing industry, tourism in general has significant impact on employment, revenue generation, and cultural promotion of host country. Recent statistics from the World Travel and Tourism Council [5] show that the total contribution of travel and tourism (T&T) to GDP is 8272.3 billion in 2017 and expected to rise from 10.4 to 11.7% of GDP in 2028. This will turn the total economic share into 12,450.1 billion after a decade. The direct share of this sector in GDP is 2570.1 billion in 2017, and by the year 2028, this sum is expected to be 3890 billion i.e., 3.6% of total GDP of the world. By virtue of its promising growth, this sector is capable of creating 100 million jobs in the coming decade. Furthermore, in 2017, T&T created 313,221,000 jobs i.e., 9.9% of total employment. These numbers will be increased by up to 413,556,000 i.e., 11.6% of total employment by 2028. The direct contribution in job creation is 3.8% for 2017 and it will grow up to 4.2% after a decade. Similarly, T&T has a significant impact on the exports and investment worldwide. The industry generated a total sum of 1494.2 billion visitors’ exports in 2017. This sum is forecasted to grow from 6.5 to 6.9% of total exports in the decade ahead. Likewise, the investment share of T&T sector will rise from 4.5 to 5.1% of total investment in the next decade [5].
After policy reforms, China has been opening up in terms of trade, investment, and international relations. Moreover, it has been attracting millions of tourists around the world. At present, China is one of the most visited countries after France, Spain, and the United States of America (USA) and earning billions of dollars per year as tourist receipts. The recent statistics of Chinese Cultural and Tourism Ministry indicate a significant increase in domestic and international tourist trips. In the first half of 2017, 2.54 billion domestic tourist trips are recorded with a growth rate of 13.5% than last year. The significant number of tourists belongs to the urban areas. These domestic trips generate a huge sum of revenues reaching 2.17 trillion Yuan and this contribution is 15.8% greater than that of previous year. Likewise, the international tourism growth is also steady for China. For the first half of 2017, 69.5 million inbound trips are recorded that are 2.4% higher than the last year. The international trips reach to 14.25 million, an increase of 5.8% that adds a significant amount of revenues. The contribution from international tourism rises up to 60.1 billion with an increase of 5.8% than the last year. This indicates that the spillover effect from T&T generates a positive effect to the several economic sectors, such as manufacturing, transporting, and infrastructural development in the host country. The T&T contribution to Chinese’s economy is worthy to discuss. China is the economic giant of Asia and an emerging power in the world, ranked at second in terms of tourism contribution to economy, and stands at sixth position for the long-term growth forecasts in tourism by 2028. At present, the share of tourism to GDP is 1349.3 billion that is 11% of GDP and this share is expected to grow at 6.6% during the next year. By the end of 2028, the T&T share is expected to rise to 2731.5 billion, which is approximately 12.9% of GDP growth. This industry is significantly contributing in employment sector. China is second than none in terms of the T&T share in job creation. The total contribution in employment for 2017 is 10.3% will rise to 14.7% after a decade. The tourism driven investment and exports are currently stood at 5.2 and 3%, respectively, in 2017. This share will grow with excellent rates in the coming decade to support the sustainable growth of the industry and its share to the overall development for China [6].
Global warming has been emerging as one of the important challenges for human race. The climate change and its impact on society gained significant attention from academic circles recently. Generally, the rapid growth of manufacturing sector in developing and advanced economies is blamed for environmental pollution due to immense energy consumption and the carbon emission from development related activities. At present, the tourism led growth is an open secret, but the energy consumption and tourist related activities are linked with the environmental degradation. By the virtue of its remarkable growth, tourism is not just an industry, but it became a sector influencing different industries. The tourism has a significant impact on environment as it directly and indirectly promotes carbon emission. Therefore, despite of its remarkable contribution to economy, tourism is no longer considered as a smokeless industry. The accommodation and various facilities for tourist involve the consumption of energy and add to the environmental degradation. Generally speaking, the overflow of tourists increase waste and decrease available natural resources at the places which already face the problem of scarcity. The excessive water use and increasing waste at natural sites may cause soil erosion, increase air, water and land pollution and eventually destroy the original source of attraction for tourists. The more alarming fact is tourism is a significant contributor in global carbon emission, mainly through the transportation, use of electricity, and housing facilities for tourists. However, the eco-friendly attempts from the government may provide the best alternative to the traditional tourism and it eventually leads to the positive environmental impacts of tourism on the host nation.
The recent data from the World Bank shows a significant increase in carbon emission that may trigger the economic and environmental loss. At present, China is the largest emitter and approximately taking more than a quarter of overall emission around the globe. The rapid industrial growth is the key contributor towards this huge consumption. Moreover, as among the largest tourist destinations, a large amount of energy consumption and CO2 emission is also associated with the T&T industry. The northwest part of China is considered to be underdeveloped than other parts in terms of economy and ecological conditions. The arid climate, shortage of water and land pollution is the common feature of western provinces. Taking the underdevelopment of this region into account, the government initiated a development plan that turned into One Belt One Road (OBOR) initiative [7]. On one hand, the transfer of industrial sector from the eastern to western part under the development plan increased the interaction among the regions and upgraded the infrastructure. This industrial shift had obvious effects on the economic development, but the industrial sector had negative impact on the already fragile environment. The significant use of energy augmented the carbon emission and added to the environmental pollution.
On the other hand, despite of its arid climate, this region holds historical, cultural, and spectacular beauties to attract the tourists around the world. The range of tourist attractions varies from ancient Buddhist, Hui, and other minorities to the shining lakes, snow covered high peaks, and the vast deserts. The recent developments in tourism enhance the volume of tourists in the western region and the unique location of these five provinces has made them the backbone of OBOR as well. Thus, the T&T might have an important role related to the environmental pollution that should be explored. Generally, the increasing number of tourists results in the high consumption of carbon and ultimately affects the environment. However, this relationship is tricky, as, on the one hand, we cannot overlook the positive contribution of this industry towards economy and environment as well and on the other hand the possibility of environmental degradation is also high with the tourism and related activities by the tourists. Therefore, to explore the exact impact of tourism on the environment with the support of quantitative analysis and logical reasoning, a detailed study is indispensable for these provinces.
The available literature focuses the developed regions and used the panel data to explore this issue. The visible vacuum is available in current literature regarding a detailed study about the important part of the OBOR region. Therefore, the present study adds to the literature by investigating the five important provinces (Gansu, Ningxia, Xinjiang, Shanxi, and Qinghai) individually taking the annual tourist arrivals and carbon emission as the main variables and explores the impact of tourism on the environmental pollution using the data from 1991 to 2016. This study will contribute to literature by exploring the specific characteristics of an individual province that may influence the tourism and pollution relationship for the less developed places of a dynamic region, thus, offering a novel aspect of this import connection for China and other developing countries. To the best of our knowledge, this is a unique contribution as none of the previous studies investigated this association for the five OBOR provinces individually and compare the findings to promote the sustainable eco-friendly development with the help of tourism.
The rest of the paper is organized, as follows: the review of recent studies is presented in Section 2. The Section 3 elaborates the overview and conceptual framework of the study. Section 4 deals with data, variables, and methodology. Section 5 offers our findings and supporting discussion. Finally, we conclude our findings and offer detailed policy implications in Section 5.
2. Literature Review
The studies about tourism, growth and pollution are relatively scarce. Previously, the main stream of researchers is extensively studied the economic development and T&T association. The economic impact of this industry is in light, but significant vacuum is available about its environmental effects. For instance, examining the long run equilibrium of tourism development, growth, and environment, Katircioglu [8] reveals that energy use increase due to tourist’s arrival and this not only contributes to the economic development, but the climate of Turkey. Investigating the long run association between tourism, energy, and carbon emission for Cyprus, Katircioglu et al. [9] found that a long run relationship is running from energy consumption and tourism to CO2 emission. Furthermore, the conditional causality indicates that tourism has negative impact on environment and increases the energy consumption. Using tourist led CO2 emission from electricity, heating, and transport sectors for Malaysia, Ng et al. [10] confirms through bound test a long run association among these variables and a further confirmation through the Vector Error Correction Model (VECM) causality approach. Using the panel data of European countries, Arbulú et al. [11] support the Environmental Kuznets Curve (EKC) hypothesis and suggest that there is a significant relationship between tourism and waste generation. Examining the impact of domestic and foreign tourist on the CO2 emission in Spain, Cadarso et al. [12] found that tourism is a major contributor to carbon emission and both domestic and internationals trips enhances the carbon emission level. The imports of oil and air travel foster the emission and total augmentation increased up to 100 percent in Spain. Furthermore, improvements in industrial and tourism production are necessary to cut down the emission. It is argued in recent literature that tourism and pollution have feedback relationship. The pollution level may affect the tourist arrivals. The findings from panel Autoregressive Distributed Lag (ARDL) approach show that the impact of various emissions on tourist receipts is mixed for ten major tourist destinations [13].
Rauf et al. [14] enlarged that, Belt and Road Initiative (BRI) 47 nations by counting time frame of 1980 to 2106, where panel dynamic estimations declared that energy usage, financial development, urbanization intensity, gross fixed capital formation, and growth output damagingly led to ecological worsening, except trade openness is negatively associated with CO2 emissions. Furthermore, cross-country, long-run assessments delivered mix results for 47 states. The enquiry advocating that forceful travels in the direction of condensed utilization of fossil fuels energy sources, green economy familiarity into the masses, and reliance on renewable energy can lessen the future challenges and panoramas in BRI nations. Likewise, Rauf et al. [15] explored the EKC hypothesis in BRI 65 states at continental bases, where outcomes under Mean Group modeling offer robust testimony and being courtesy of EKC found in each of the six continental regions. Meanwhile, Pooled mean group (PMG) model certified the EKC only in developed economies, but invalid for other regions. The encouraging memory amid energy consumption and CO2 emission concerned the administrations, to formulate plans for limiting the extent of carbonization and directs energy consumption practices for tolerating environment to its earliest spot. The Chinese 1978 open up reforms, shifted the economic evolution phenomenon within the China very abruptly, where the structural sectors growth, i.e., Service, Industry, and Agriculture segments contribute massively towards for strengthening magnitude of economy in this era of rivalry [16]. The extracted outcomes explained that, services, industry, agriculture, trade openness, and energy consumption antagonistically depreciate the atmospheric surroundings. The solid regulations and guidelines to administer carbon levies on structure divisions and focusing on green economy might preclude environment quality appropriately.
Both developing and developed countries are focusing on the CO2 reduction without affecting the sustainable development. Focusing on the tourism sector, Romero et al. [17] investigated the link between tourists stay and the electricity consumption for Spain. The results indicated that the EKC hypothesis is not valid in the case of Spain during 1999–2013. The tourists stay significantly increasing the energy consumption and the quantity of consumption varies for different provinces. The Balearic Islands, the Canary Islands, Gerona, Tarragona, and Malaga are among the highest consuming provinces. Additionally, the use of energy efficiency measures and the renewable energy can improve the environmental situation. Taking the data of advanced and developing countries from various regions [18] validate the CO2 emission and tourism relationship. The energy use and economic development also contributes to the CO2 emission. Furthermore, investment, growth, and health sector development promote tourism. Incorporating FDI and trade to the tourism connection with CO2 emission and GDP growth for European Union (EU) countries [19] conclude that tourism enhances economic development in the EU. However, the role of tourism in environmental degradation varies among EU regions. Whether it may improve the climate or cause pollution depends upon the measures to encourage the sustainable tourism. Using the panel data of selected South East Asian countries, Jahromi et al. [20] confirm the existence of EKC and a significant impact of tourism of environmental pollution. Additionally, energy and economic development are the significant contributors of CO2 emission. Tiwari et al. [21] analyzed dynamics of the relationship between tourism, energy consumption, and climate change for 25 Organisation for Economic Co-operation and Development (OECD) countries during 1995–2005. The results of Impulse Response Function (IRFs) show that the response of tourism in one SD shock in climate change and energy consumption and response of climate change emissions to tourism is marginally positive. Ozturk [22] explored different factors that affect tourism development in the panel of 34 developed and developing countries, over the period of 2005–2013. Energy consumption, air pollution, health expenditures, and economic growth played a vital role to change tourism development indicators in the region. The results confirmed the long-run association between the energy, environment, growth, and tourism indicators in the panel of selected 34 countries. The results of fully modified ordinary least squares (FMOLS) indicate that health expenditures have a positive relationship with the tourism indicators, while energy consumption exerts a negative association with the tourism indicators in the region.
Using the VECM and causality approach for ten worldwide tourist destinations, Jebli and Hadhri [23] identify a one-way causal link from CO2 to GDP, a feedback response between energy and GDP, tourism, and growth. However, tourism improves environmental conditions as there is a negative relationship between tourism and CO2 emission, but this link is vice versa for GDP and CO2. Accessing the link between tourism growth and environmental quality, Sghaier et al. [24] draw several conclusions for Morocco, Tunisia, and Egypt. The long run association between tourism and GDP proves true at different significance levels. Moreover, the tourism and environmental connection varies; such as, the impact is negative for Egypt and positive for Tunisia. Additionally, EKC hypothesis is also valid for three economies. Taking three South East Asian economies into account, Azam et al. [25] provide the mixed evidence regarding tourism impact on pollution in Malaysia, Thailand, and Singapore. This link is positive for Malaysia and negative for other two economies. Ozturk [22] investigate EKC hypothesis by utilizing the ecological footprint as an environment indicator and GDP from tourism as the economic indicator. The results from the time series generalized method of moments (GMM) and the system panel GMM revealed that the number of countries that have a negative relationship between the ecological footprint and its determinants (GDP growth from tourism, energy consumption, trade openness, and urbanization) is more existent in the upper middle- and high-income countries.
The present study focuses on China to explore this link for relatively infantile region. Only a few studies are available to explore the tourism and environmental association, especially at the provincial level. Using the data over the period from 1990 to 2012, Tang et al. [26] investigated the influence of various sectors emission on overall CO2 emission. The results indicate that total emission increased significantly for this period. The transportation sector is responsible for 80% emissions and the total economic contribution of T&T is significant than the corresponding emission. Calculating the carbon emission from tourism in specific province of China, Wu et al. [27] found that the total emission increased in five provinces during 2009 to 2011. The emission in Hainan reported at the lowest and Hubei placed at the top among other provinces. A U-shaped trend is observed for carbon emission in Zhejiang, Shandong and Hubei. However, Beijing is the only region with a continuous downward trend in carbon emission.
Quantifying the direct and indirect carbon emission from tourism, Meng et al. [28] stated that the emission from T&T increased with the passage of time but the total share of this industry is much lower than the manufacturing sector for China. Using the regional panel data to examine the association among tourism, economic growth, and pollution, Zhang and Gao [29] found no evidence for EKC in Central China and the hypothesis is weakly supported in Eastern and Western parts. The panel causality method indicated mixed results for various regions. The tourism led growth hypothesis proves true in all regions and the link between economic growth and carbon emission is also significant. Examining the eco-efficiency of tourism for 53 Chinese cities, Liu et al. [30] concluded that majority of cities still have significant room for improvement and they are currently not efficient. The tourism has negative impact on environment and this effect varies in terms of efficiency and pollution for all cities. However, financial and environmental indicators are positively associated with the eco-efficiency of coastal cities.
Qiu et al. [31] calculated and decomposed the tourism and CO2 link for China and found that tourism is a significant contributor of carbon emission in China and the emission level increased continuously. Several factors including tourism are responsible for huge consumption, but transportation stands at the top. The impact of tourism on environment and its intensity is different for various parts of China. Using highway toll gate data for Jiangsu province, Jin et al. [32] concluded that self-driving tourism augmented the carbon emission and the south part is more concentrated than north. Additionally, the role of county government is crucial to determine and control carbon emission. As the largest emitter, emission reduction is the priority of China. The identification of major factors responsible for this huge augmentation is necessary before solution. While using the Stochastic Impacts by Regression on Population, Affluence and Technology (STIRPAT) model, Shuai et al. [33] confirmed that economic development, urbanization, industrial development, and energy consumption in various sectors and infrastructural investment are main sources against huge carbon emission. Additionally, economic growth is the top contributor and the urbanization is the most significant factor in reducing carbon emission. Taking coordination and system theory into consideration, Yuan et al. [34] empirically examined the coordinated growth of an environment-tourism-economy system in western Hunan from 2001 to 2012. The results confirmed that this system could not achieve the desired results for environmental improvements. The environmental development is slow, and the rapid economic development affects the environmental sustainability. However, the industrial reforms and environmental management can improve the current situation of this province. Evaluating the efficiency of China’s Two Control Zones (TCZ) policy to control the emission of sulfur dioxide (SO2) in targeted areas, [35] found that the positive impact of regulations on environment. The results from a unique firm-level data set for the period from 1999–2009 indicated that the strict environmental regulations helped to reduce the industrial pollution in the TCZ prefectures and the previously more polluted targeted and non-targeted areas. The closer look on newly established firms also produced a positive impact on the environment. Furthermore, the policy change has more significant impact on the Chinese Coastal areas and the evaluation of officials also has a prominent impact on the environmental pollution control.
Exploring the economic and environmental impact of tourism for the city level data, Lu et al. [4] stated that the economic development of Gansu province improved gradually. By and large, significant differences exist among cities in the tourism development and environmental protection measures. Recently, local government focused to improve tourism and control pollution, but the environmental protection status needs significant improvements and more coordinated efforts.
The recent literature endorses the remarkable role of tourism industry and the improved environmental quality to the economic progress of a country. Also, it enlightens the threats of increasing environmental degradation due to tourist upsurges and eventual carbon emission. At present, the evidence is mixed and mostly studies consider the developed countries.
3. Data and Methodology
To investigate this association, our key variables are the tourist arrivals. Following the literature, we employed CO2 emission as a proxy variable for environmental degradation. We calculated CO2 by multiplying the emission factors with the standard consumption of coal, oil and gas in kg due to unavailability of provincial data. We also used GDP per capita and energy as our control variables. The GDP is measured as constant 2000 Renminbi (RMB) and energy as kg of oil equivalent per capita. We collected our data from China Statistical Yearbook and National Bureau of Statistics of China. We used annual data for all the variables for five provinces of China namely: Gansu, Ningxia, Xinjiang, Shanxi and Qinghai. We used the time series data for individual province from 1991 to 2016. The natural log of our data is used for analyses. An individual model is applied to capture the true impact of tourism on environment pollution in the western part of the One Belt One Road (OBOR) initiative.
To deal with the unit root problem, we used the Zivot and Andrews test [36]. This technique is more suitable than other tests to deal with structural breaks in data at various points. Furthermore, unlike the general ADF method, this approach is capable to handle the structural breaks in data. The presence of structural breaks in the data may possibly affect the properties of time series data. The conventional unit root tests have the limited ability to deal with this issue. Perron [37] initially argued that in the case of structural breaks in data the null of non-stationary is under-rejected and it might produce ambiguous conclusions about the stationary features. Alternatively, the break points are treated as unknown in this test, which is the advanced form of the Perron test. Therefore, we applied the unit root test for testing the unit root in our data [36]. Unlike the general Augmented Dickey Fuller (ADF) method, this approach is capable to handle the structural breaks in data and produce more adequate results.
The general econometric form of this test can be defined, as follows:
DUt denotes the dummy variables use for mean shift with time break for an individual point, while DTt is used for time break in the series. The null hypothesis for unit root break date states that the series has a unit root with an unknown structural break point or c = 0. The other case states that the series is stationary where c < 0. This test reproduces all the possible break points and estimates them consecutively. It does not include the end sample points during break point selection.
We applied the fully modified ordinary least squared (FMOLS) method that was developed by Phillips and Hansen [38] to investigate the impact of tourism on five important Chinese provinces of OBOR. The general of regression after including our variables can be described, as follows:
Where, indicates an error term and refers to the intercept. The carbon emission is the dependent variable and GDP per capita, energy and tourism are used as independent variables. The FMOLS is an advanced version of Ordinary Least Squares (OLS) to provide more specific results and efficiency in several aspects. The corrections in original OLS can be used to determine the important empirical effects of this new version. The FMOLS uses standard Wald test based on asymptotic Chi-square statistical interpretation. Generally, this method takes endogeneity and serial correlation into consideration. It provides more options for investigators to find out the differences between both of the techniques, as it offers impartial estimators of co-integrating regressions in a single equation. Furthermore, this method is asymptotically balanced and is suitable in the existence of mix normal asymptotic. For detailed discussion, we start from a simple regression:
In this equation, the independent variables are of order 1(1) and not co-integrated. Therefore, the stationary process for independent variables is needed to separate the vector of drift from a stationary variable. This method assumes a strict stationary procedure with zero mean and a fixed positive-definite covariance matrix. The FMOLS estimation can be retrieved in two stages. The dependent variable is reformed for the long-run T interdependence and the residual of OLS estimator are also calculated. This will lead us to the following equation:
In this equation, for t = 2, 3, …, n and . Whereas, the long run variance for can be derived, as follows:
where,
Whereas, is the lag window with horizon m.
Let’s suppose:
The second stage of FMOLS for β calculations can be expressed, as follows:
For the robustness check, we applied the Gregory-Hansen approach to test the co-integration among our variables for the potential structural breaks and to confirm a long run association between tourism and CO2 emission for our sample. We verified the long run connection using three cases i.e., change in levels, change in trend, and change in regime. This is the extension of available conventional method. This approach uses the general hypothesis of no co-integration and effective in the case of possible regime shift. This method can detect the link among variables in the presence of a break in intercept and slope coefficients. For such cases, the conventional ADF test is not a smart choice [39,40]. The three different models with various assumptions are; level shift, level shift with trend, and regime shift. The general mathematical forms of three models, respectively, are as follows:
We used this test framework to determine the possible break and the break date in the data. The test uses the highest absolute ADF test value for break selection. The calculated value is compared against the critical value to decide the status of a series. In the econometric model, Y is the dependent, X is an independent variable, and k represents the break date in a data series.
4. The Overview and Theoretical Background of the Study
After the reforms and opening up policy, the tourism sector developed substantially in China. At present, China stands among the top most visited countries in the world. In fact, this sector is considered to be an important growth factor in modern economy. As the modern world is focusing on sustainable development and shifting toward the green economy with the application of sustainability and eco-efficiency. This sector is considered as a pillar of sustainable development because of numerous benefits to domestic economy, including job creation, improvement of living standards, and promoting native culture. However, despite the remarkable contribution of tourism in the world and Chinese economy, this is not a smokeless industry at all. The rapid development of tourism industry also significantly contributes to the energy consumption and it affects the environment with the increased level of carbon emission [41,42]. Pigram [43] initially investigated the link between tourism and environment and suggested that the relationship between these two could be described as significantly negative, slightly negative, and positive. The relationship automatically varies after reaching the threshold level. The elasticity between these two variables due to the country specific factors defines the ultimate impact of tourism on the environmental pollution. The tourism has both biophysical and socio-cultural environmental effects. For instance, tourism caused atmospheric pollution due to use of energy to facilitate the tourists. The air quality in a tourist region has been significantly condensed due to the emission of smoke, sulfur dioxide, nitrogen oxides and other harmful gases due to energy consumption. The tourist activities might deteriorate the natural environment and beauty. The waste generation can turn a beautiful place into a dump. The deterioration of vegetation causes serious pollution problems. A comfortable and peaceful environment enhances the tourist experience. However, the tourism significantly adds to the noise pollution. This includes the physical noise and the use of transportation vehicles; infrastructural machinery causes fatigue to the visitors and spoils the pleasure of tourists [44].
Since last three decades, the tourism flourished all over the China. The Western Chinese provinces are less developed but strategically very important because of OBOR initiative. This initiative gave a hand to discover the hidden beauty of this region and introduces an alternative way for sustainable development in the form of tourism. The coal based industrial development and energy consumption significantly deteriorated the natural environment in this region.
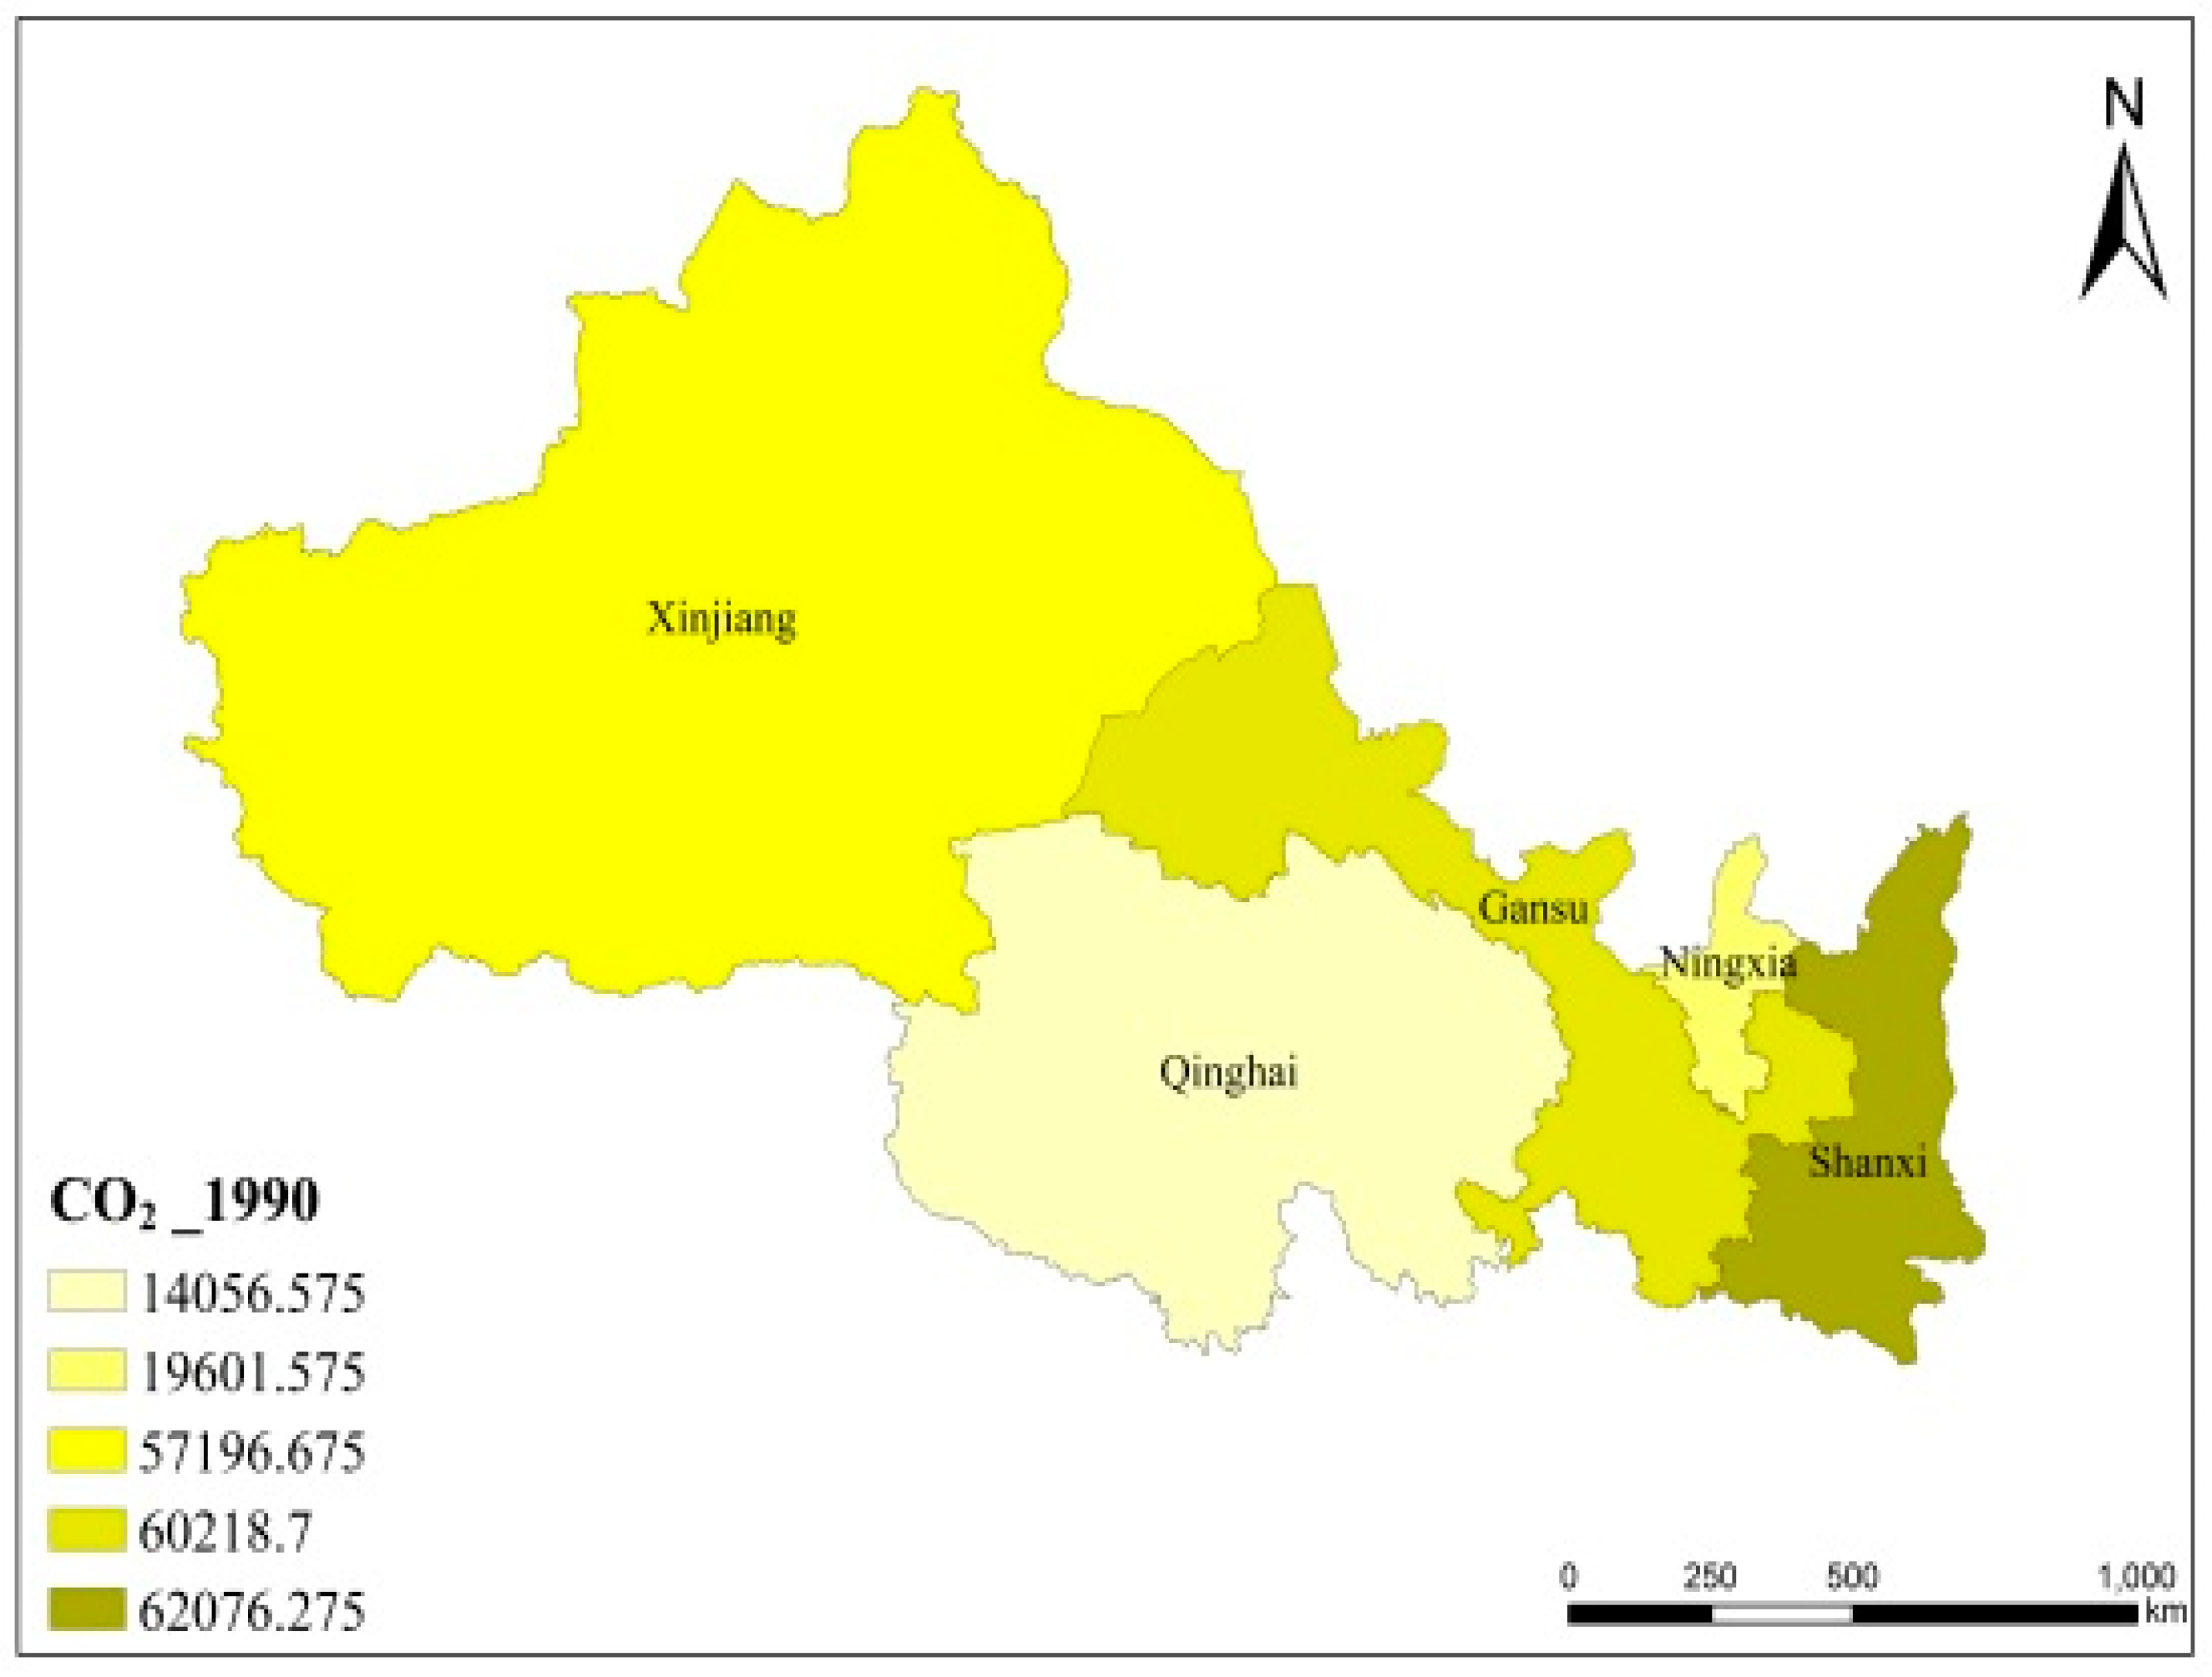
Figure 1 indicates the five provinces of Northwest China included in the present study. The tourism industry has a great potential to work as an alternative source for sustainable development, because these provinces attracted a significant volume of tourists during last two decades.
Figure 2 and Figure 3 show the tourist arrivals in our sample. At start, the Shanxi stands at the top, followed by Xinjiang and Gansu in terms of tourist flows. The Qinghai has merely ten thousand visitors and the Ningxia did not host any visitor during 1990. Interesting, the T&T industry has significantly been growing during the two and half decade period in all of the provinces. The visitor number has been increasing throughout the period. Although the aggregate numbers of visitors are not high, the government efforts can promote tourism in these less developed provinces. It can be noticed that the tourist arrivals have significantly increased in Xinjiang than other provinces, this shows that the transformation of Xinjiang economy from heavy industry to eco-friendly sector can improve the environmental conditions without hindering the economic development. Similarly, other provinces, especially Gansu, Qinghai, and Ningxia still have a great vacuum to fill in the promotion of T&T.
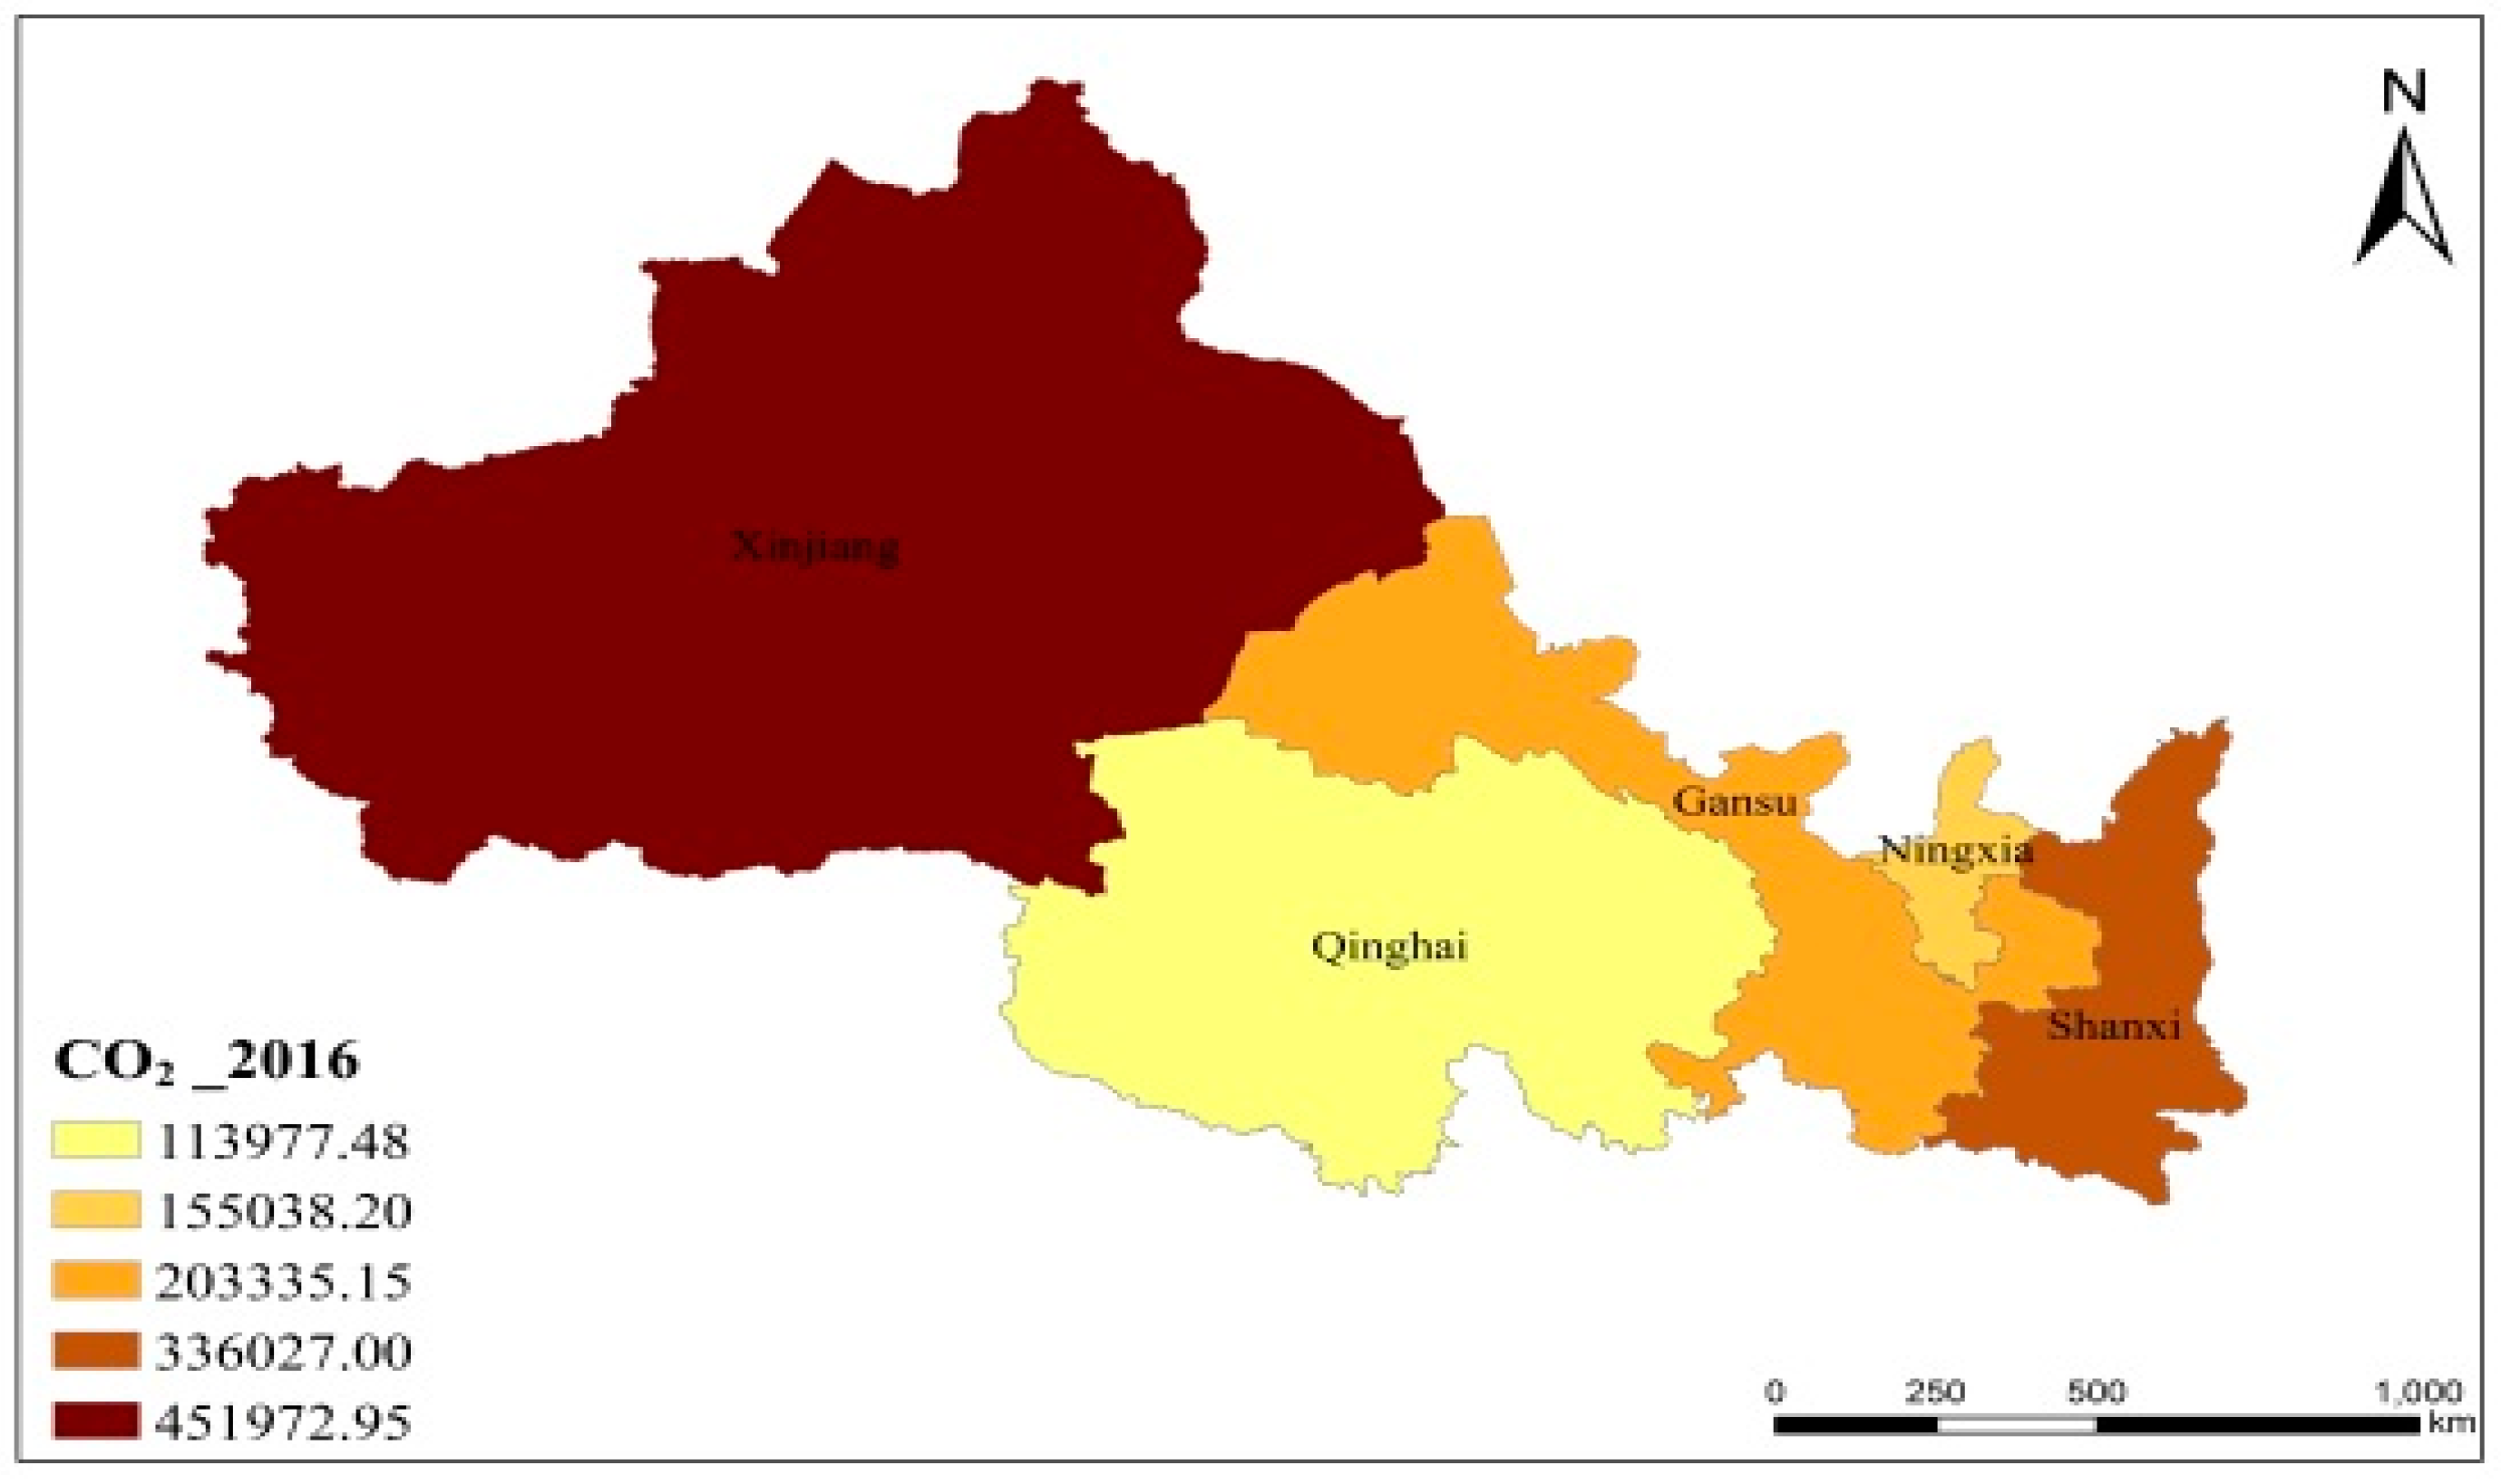
Figure 4 and Figure 5 represent the carbon emission for individual province. Qinghai and Ningxia are persistently well performing than other three provinces. The inconsistency of emission among northwest provinces is quite significant. For instance, the overall emission has been increasing during these years, but the Xinjiang surpasses Gansu and Shanxi. Both Xinjiang and Shanxi are the main energy producers in China and the coal mining with the rapid industrial development of west because the OBOR program added fuel to fire. The Xinjiang is also under a heavy industrial development process, but this region has a great potential for tourism economy to cope up the development and environmental problem. The rapid increase of CO2 with already arid and fragile climate has pointed out an alarming problem of environmental pollution because of high production and consumption of energy. Additionally, the tourism is also not a smokeless industry, but the promotion of green tourism and related policy might have significant impact to improve the environment. Therefore, an analytical investigation is necessary to examine the real impact of tourism on environment in this important OBOR region.
Thus, taking the pro and cons of this industry into account, it is difficult to decide the impact of tourism on the environmental pollution of this region. Therefore, the purpose of this study is to investigate the relationship between tourism and environmental pollution of each province on individual bases and to provide the policy suggestion for each province based on the specific features of these provinces.
5. Empirical Results and Discussion
We started our analyses from checking the unit root problem in our variables. The unit root test results for five provinces are presented in Table 1. The estimations state that some variables are stationary at level and others are at 1st difference. For example, in the case of Gansu and Qinghai, all of the variables have unit root problem at level, but become stationary at the first difference. The values of all variables for Gansu and Qinghai province at level are lower than the given level of significance and the breaks occur in various years for all the variables. Alternatively, the calculated values become significant at first difference and the variables become free from unit root problem. The break years also changed after taking the 1st difference of the variables. The GDP of Ningxia is stationary at level and rest of the variables turn stationary at first difference. The break years are different at both levels for Ningxia. The estimated values of carbon emission, tourism and energy consumption are significantly higher than the given level at first difference, indicating that variables are stationary. The tourism variable of Xinjiang and Shanxi is free from unit root problem at level and all other variables are stationary after taking the first difference. However, the break dates for all variables are different at both levels for the five provinces in our sample. Overall, the trend is mixed, but all the variables are stationary, and the estimated values are within the 5% level of significance for all provinces.
The mixed results of stationary properties for our variables justify the fully modified ordinary least squares (FMOLS) approach. For this proceeding with our model, we used CO2 as the dependent variable and tourist arrivals, GDP, and energy consumption as the independent variables to confirm the effect of tourism of environmental degradation for the five provinces of OBOR. Additionally, we included GDP2 to check the presence of Environmental Kuznets Curve (EKC). The FMOLS estimations are presented in Table 2.
The results of Gansu province indicate that tourism is a significant factor to pollute the environment. This specifies that the tourism related activities foster the carbon emission and they have a significant negative impact on environment. The coefficient of energy positively linked with CO2 indicating that the energy consumption has an adverse impact on environment. Likewise, the economic development is also contributing to carbon augmentation. The positive and significant coefficient indicates that rapid economic growth is deteriorating the environment. Overall, our results indicate that both GDP and T&T augment energy consumption, which leads to carbon emission and cause environmental degradation. The coefficient of GDP square is positive provides no evidence for the validity of EKC for Gansu. The association between tourism and CO2 is negative for Ningxia and Qinghai. The coefficient is significant at 1 percent for both provinces, this indicates that T&T enhances the level of carbon emission and contaminate the environment. The coefficients of energy consumption and GDP show that both of the variables have negative impact on environment. The impact of energy consumption is more significant than GDP. Furthermore, GDP cannot validate the EKC as the coefficient remains positive. Thus, the services and industrial sectors are boosting the level of emission and adversely affecting the environment in both provinces. For Shanxi, the GDP and energy consumption coefficient are significant at 5%. The link between tourism and CO2 is also significant. The significant connection between economic development and carbon emission illustrate that the industrial sector consumes more energy than T&T and both sectors are responsible for environmental degradation. Besides, the positive value of GDP2 does not support the existence of EKC in Shanxi.
Taking the results of Xinjiang into consideration, our estimations support a positive impact of tourism on environment. The coefficient of tourism is negative, indicating that T&T assists in reducing the level of carbon emission and improve the environmental quality. Conversely, there is a direct inverse relationship between energy use and CO2, as the significant positive coefficients states that increased energy consumption leads to environmental degradation. Similarly, the positive coefficient of GDP indicates that the economic development, especially in the manufacturing sector also boosts the CO2 and adulterates the environment. The value of GDP remains positive and it confirms that the EKC hypothesis is not valid for Xinjiang. The huge western province with abundant energy resources is a secret heaven for international and domestic tourists. This province is situated in the heart of the Silk Road and offers versatile travel attractions, including the natural scenic spots, meadows, high peaks, and the vast deserts. The rich culture and the ancient places have been seeking the attention of tourists around the world.
The positive impact of tourism illustrates that the natural beauty of Xinjiang is itself a significant factor in this association, as it helps to reduce the level of carbon emission. Likewise, the destination image, traveling facilities, suitable infrastructure and improved hygienic arrangements for tourists automatically uplift the environmental safety. On the same note, it promotes the sense of responsibility in local residents and government to protect the environment for sustainable tourism development. On the other hand, the excessive exploration of natural resources, such as oil, gas, and coal are the main culprit of environmental degradation. Our results indicate that the growth of tourism sector is an important factor that can significantly control the CO2 emission and promote the green economy in Xinjiang. Our findings are similar with the results of Qiu et al. [31] stated that tourism is a significant contributor of carbon emission in China and the emission level increased continuously. The impact of tourism on environment and its intensity is different for various parts of China. Similarly taking Gansu into account Lu et al. [4] confirmed that the environmental protection status needs significant improvements and more coordinated efforts.
We checked the robustness of our estimations using co-integration test for each province. The results of the Gansu province are reported in Table 3.
The estimations designate a long run co-integration relationship among the variables. For instance, for change in level, the test values are significant at 5% with 17 breakpoints. The break date is 2001 for three tests. The calculated values of ADF and Zt tests are significant at three given levels. The critical values are lower than calculated values in absolute terms indicating a long term connection among variables. For the change in level and trend, the test values are significant with different breakpoints. The number of breakpoints is 8 and 13 for ADF, Zt, and Za, respectively, and the test critical values are lower than calculated values at three given levels of significance. The break year is 2006; different from previous case but the long run association has been confirmed again. The third case of Gansu province also confirms the long run relationship, as the estimated values are significant and higher than the critical values in absolute terms. The total breakpoints are 20 and the breaks occur in 2004. Overall, variables are found to be co-integrated in the long run while using the three different scenarios, but the breakpoints and break period is different for three cases in Gansu province.
Table 4 presents the results of the Qinghai province. The estimated values of ADF and Zt tests specify a long run connection among variables for three different assumptions of co-integration. In all cases, the major breakpoints are 11 and the data breaks mostly occur in 2000. The breakpoints and year are different only for the ADF test of change in trend and regime.
The estimated values for the long run co-integration of Ningxia province are illustrated in Table 5. Both ADF and Zt estimations are significant in all cases. This provides the evidence of long run association. The major break year is 1994, but it varies in few cases.
The results of Shanxi province indicate that the estimated values of ADF and Zt tests under the first case are significant at given level of significance (Table 6). The remaining two assumptions also confirm the existence of a long run link among the variables. For three assumptions, the breaks occur in 1995 with eight breakpoints except couple of cases.
Finally, the results of our fifth province are presented in Table 7. As per the estimations of our previous provinces, the co-integration test values are greater than the critical values in absolute terms. This explains that the tourism and carbon emission with other control variables are linked in long run for Xinjiang. The ADF and Zt values are significant at 5% level of significance. In most cases the break occurs in 2001 with 24 breakpoints. Overall, the results of co-integration test verify the FMOLS estimations, as the variables are connected in the long run for five provinces.
The studies about the environmental impact of tourism are relatively scarce. Among the available studies, only a few studies are focused on China. Using the data for individual province of the North West part of OBOR to explore this link is a dimension not yet explored. The literature provides various findings for different parts of China. Our estimations also confirm mix results for five provinces [25,29]. In the majority of provinces, the tourism impact is negative. For instance, the Qinghai province is one the favorite travel spot for domestic and international tourists. The Qinghai Lake and other cultural places are attractive destinations and T&T plays an important role in economic development of this province. The coordination between development, T&T, and environment is lacking, because of less environmental protection education and waste that is generated during the golden season. The plastic waste is huge at scenic points and the visitors throw garbage in the lake which deteriorates the environment. The tourist left the beautiful natural places so polluted that it termed as “Garbage Shame” at national media. Likewise, poor administration and lack of transport and other tourist facilities add to the overall negative impact on the environment. On the other hand, the industrial transfer to the Qinghai province increased the level of waste water, gas, and smoke as the counter environmental protection measures are less effective. The significant link between energy consumption and carbon emission indicates that the industrial sector deteriorates the environment more than tourism. Although the industrial and tourism sectors are augmenting the carbon emission level, the aggregate quantity has been decreasing in Qinghai [45].
Gansu province is an important part of OBOR and is located in the heart of northwest China. This province is well known for its arid climate and insubstantial atmosphere. Since the last decade, the tourists have been frequently visiting this historically and culturally rich part. According to the national statistics, the share of tourism to GDP is grown from 10 to 25 percent and the total revenue from tourism increased from 2 to 121 billion RMB during the last decade. On the one hand, significant room is available for development due to Belt and Road Initiative, but on the other hand, the overexploitation of natural resources significantly deteriorated the natural environment. Additionally, the lack of tourism development strategy, less effective utilization of available resources and the lack of environmental protection measures have been overwhelming the environment of Gansu [4]. The negative impact link between tourism and CO2 certifies the current situation.
Shanxi province is situated in North China and it is surrounded by the mountains from west and the Yellow River to its east. Its location gives Shanxi beautiful peaks, undulating hills, and numerous valleys, establishing naturally captivating ecological landmarks with northern China features. Likewise, Shanxi has nearly 3000 years history that attracts countless tourists from all over the world. The province named as cultural museum of China due to its rich culture with ancient wonders, Buddhists temples and unique domestic features [46]. This shows that tourism plays a crucial role in the socio-economic development of this province. At present, the T&T is an important pillar of economic development after the mining industry. Shanxi is among the top producer and user of coal energy, which leads to the continuous growth of carbon emission. The tourism and energy consumption both have a negative impact on the environmental quality and the coefficient of energy consumption is more significant. Therefore, the tourism development policy might change the scenario in future for Shanxi.
Recently, the interaction of Ningxia with other provinces through high speed railway attracted more tourists. Before the president visit in 2016, the contribution of this industry was low. Since then, this province made significant efforts to promote its T&T industry with highlighting the desert tourism and the rich Hui culture with the bond of the Yellow River. At present, Ningxia is counted among the top five provinces and autonomous regions in terms of T&T development. This province falls among the most underdeveloped places in terms of economy in China. The industrial growth is started, but, because of underdevelopment, both industrial and tourism sectors are deteriorating the environment. Although, the recent measures to cut down the emission and energy consumption have significantly improved the environmental conditions, but the aggregate effect is still negative [47]. Similarly, the rapid population growth, decreasing forest lands, and water waste add fuel to the fire. Thus, the preservation of natural resources and development of T&T can become an important pillar to reduce the environmental pollution in Ningxia.
Located in the west of China, Xinjiang occupies one-sixth of total Chinese territory. This province is ideally located near Europe and connects China with Central Asia through the Economic Corridor. This area is naturally blessed with forest lands, meadows, and a vast desert. Xinjiang possess astonishing lakes, and ancient domestic cultural spots. For instance, United Nations Educational, Scientific and Cultural Organization (UNESCO) included Tianshan among the World Nature Heritage Site list. Additionally, it is a remarkable tourist attraction due to outstanding snow-capped peaks and glacier-capped mountains [48]. On the other hand, the rapid economic and industrial development has been severely polluting the environment. Xinjiang is ranked among the morbid places in China due to immense carbon emission. The positive link between tourism and environmental pollution indicates that the transformation of traditional development with eco-friendly growth can improve the environment. Xinjiang has a vast area with less population and spectacular tourist spots to develop tourism based green economy and to lessen the emission impact on environment.
6. Conclusions and Policy Implications
Tourism is among the important sectors of economy for sustainable development of a country. Besides economic benefits, tourism can promote cultural heritage and it brings the masses together. This may help to improve the image of a country and bring harmony among people from different parts of the world. This industry has both economic and environmental effects and these effects might significantly influence the sustainable environment of a country.
This study aimed to explore the impact of tourism on the environmental pollution in OBOR provinces of China. The Zivot-Andrews unit root test results designated a mixed trend among variables for five provinces. For Gansu and Qinghai, all of the variables are not stationary at levels but become stationary at 1st difference. The response of variables is also mixed for Ningxia showing all other variables with unit root problem at levels, except GDP. Nevertheless, all of the variables become stationary after taking the first difference with different breakpoints for both levels. In the case of Shanxi and Xinjiang, tourism is stationary at level and other variables become free from unit root at first difference.
The results of unit root test set the platform to apply the FMOLS for further analyses. The FMOLS results for Gansu showed that economic development significantly contributes to CO2 emission. The association between energy consumption and CO2 emission is also positive and significant. The coefficient of tourism confirms that the tourist arrivals considerably contaminate the environment. The Environmental Kuznets Curve (EKC) hypothesis is not valid for Gansu. In the case of Ningxia and Qinghai, the results suggested that both industrial and service sectors, including tourism, foster the CO2 emission and adversely affect the environment. The coefficients of energy consumption and GDP show that both of the variables have a negative impact on environment; the impact of energy consumption is more significant than GDP. Furthermore, GDP2 cannot validate the EKC, as the coefficient remains positive in both provinces. Taking other factors as constant, tourism increases environmental pollution and the share of industrial sector outweighs service sector for Shanxi; the coefficients of GDP and energy consumption are more significant in Shanxi than Qinghai and Ningxia. The link between tourism and CO2 is also significant. This illustrates that the industrial sector consumes more energy than T&T and both of the sectors are responsible for environmental degradation. Besides, the positive value of GDP2 does not support the existence of EKC in Shanxi.
Taking the results of Xinjiang into consideration, our estimations support a positive impact of tourism on the environment in Xinjiang. The coefficient of tourism is negative, indicating that T&T assists in reducing the level of carbon emission and improve the environmental quality. Conversely, the direct inverse relationship between energy use and CO2 emission indicates that increased energy consumption leads to environmental degradation. Similarly, the economic development, especially in the manufacturing sector, also increases the CO2 emission and contaminates the environment. Additionally, the EKC hypothesis is not valid for Xinjiang because the coefficient sign did not change. Thus, the development in tourism sector can be helpful to reduce the huge carbon emission in Xinjiang. To check the robustness of our estimations, we used the Gregory-Hansen test. The test statistics confirm a long run co-integration among our variables. Thus, the relationship between tourism and environmental degradation varies for the western provinces of the OBOR and these outcomes are robust while using various assessment techniques.
Our findings have several important aspects of tourism and pollution relationship for the underdeveloped regions of China and it could be used for other developing regions as well. The relationship is complex and needs to be handled with immense attention. The natural environment and scenic points in western part of China are an attraction for tourists, but the strict regulations are required to promote the positive impact of tourism. At present, the negative impact from tourism and energy use in several sectors outweighs the positive effect in majority of our sample. The main factors of environmental degradation in the northwestern part of OBOR are the coal based industrial development, coal mining, arid climate, and the overall underdevelopment of area and masses. To improve the environmental situation and to develop the tourism sector, the government should engage the local community to promote tourism and environmental protection. For example, the environmental protection workshops can be helpful to train and motivate locals to protect environment and job opportunities for natives as guides; these workshops can be useful to reduce poverty through job creation and educating native people to promote environment-friendly tourism. Similarly, government should promote flora and fauna, not only in remote areas, but also in cities and homes to reduce the impact of CO2 emission.
Besides, the government of China and local governments of developing and underdeveloped regions should act proactively to design policies for the industrial sector. The economic development of a country cannot be compromised, but the implementation of ecofriendly methods should be encouraged. For this, the government should promote the use of low carbon technology. Monetary incentives in the form of tax reduction should be offered to those industries that are promoting low carbon energy production, building of infrastructure and ecofriendly transport system to enhance sustainable growth with the help of tourism. The incentives and penalties will reduce CO2 emission from industrial sector, the main culprit of pollution, and they will provide plenty of space for government to promote green tourism. Finally, the local governments of the OBOR provinces should work in collaboration with other regions to develop the tourism sector and improve the environment. This includes policy and technical assistance from developed regions in terms of tourist attraction and environmental protection.
Last but not least, these provinces should focus on an ecofriendly energy source to make their industrial sector environment-friendly without cutting down its share in economic development, because this region is the backbone of the OBOR initiative. This initiative can raise the region as an economic giant and it has the potential to attract surges of foreign and domestic tourists for the sustainable development of this region and China. The positive impact of tourism on Xinjiang proves that the suitable policy measures can cut down the CO2 emission from the industrial sector and eventually reduce the pollution in this region. Thus, the domestic and central government should increase the tourist facilities and promote the rich culture and famous scenic spots of these provinces to boost the T&T sector in these provinces. The findings and above discussion confirm that the impact of tourism on environment depends on several factors including the nature of destination, activities of tourists, various facilities for tourists, and the concerned policies of the government to protect the environment.
Our study has important managerial implications. Relevant authorities of both central and provincial governments should step up to promote low carbon tourism at industrial level particularly for OBOR provinces of Western China. Low carbon tourist products using the modern technology should be promoted to reduce CO2 emission. Thus, provincial and central governments need to initiate aggregate efforts to raise the contribution of tourism in the sustainable development of this region. Although the findings of our study are interesting and valuable to promote the sustainability and eco-efficiency in Western provinces of China, this study has certain limitations too. For instance, the energy consumption is a major factor in environmental degradation and tourism is a significant contributor to this consumption. The energy consumption in tourism sector has different forms including consumption in road and air transportation, electricity consumption and heating. In present study, we use the energy consumption as an aggregate factor due to data limitation. This, somehow, limits the significance of our work.
Taking the aforementioned limitation into account, using our study as a base, some useful researches can be conducted on the subject of connection between energy consumption of a specific sector and environmental pollution. Similarly, the future studies can be focused on investigating the relationship between tourism and environmental pollution for other OBOR regions, as well as for the underdeveloped and less explored tourist destinations in China and other developing countries.
Authors Contributions
For this research article, all authors contributed to writing, editing, and overall improvement of this study. The initial work on idea generation and analyses are carried out by Fayyaz Ahmad and Muhammad Umar Draz. The data collection and supportive work is done by Lijuan Su. The critical suggestions and amendments in the first draft from Ilhan Ozturk significantly improved the quality of study. The improvement in literature and formatting is done by Abdul Rauf.
Funding
The study was funded by Gansu philosophy and social science planning office (No. 406000/057000019).
Acknowledgments
The authors are grateful to the academic editor and two anonymous referees for their invaluable comments and suggestions.
Conflicts of Interest
The authors declare no conflict of interest.
References
- World Commission on Environment and Development. Our Common Future. Available online: http://www.un-documents.net/our-common-future.pdf (accessed on 31 August 2018).
- Olawumi, T.O.; Chan, D.W.M. A scientometric review of global research on sustainability and sustainable development. J. Clean. Prod. 2018, 183, 231–250. [Google Scholar] [CrossRef]
- United Nations General Assembly. Transforming Our World: The 2030 Agenda for Sustainable Development. Available online: https://sustainabledevelopment.un.org/post2015/transformingourworld (accessed on 10 July 2018).[Green Version]
- Lu, C.; Li, W.; Pang, M.; Xue, B.; Miao, H. Quantifying the economy-environment interactions in tourism: Case of Gansu Province, China. Sustainability 2018, 10, 711. [Google Scholar] [CrossRef]
- World Travel and Tourism Council. Travel and Tourism Economic Impact 2018—World. Available online: https://www.wttc.org/-/media/files/reports/economic-impact research/regions-2018/world2018.pdf (accessed on 31 August 2018).
- World Travel and Tourism Council. Travel and Tourism: Economic Impact 2018—China. Available online: https://www.wttc.org/-/media/files/reports/economic-impact research/countries-2018/china2018.pdf (accessed on 5 September 2018).
- Huang, Y. Understanding China’s Belt & Road Initiative: Motivation, framework and assessment. China Econ. Rev. 2016, 40, 314–321. [Google Scholar] [CrossRef]
- Katircioğlu, S.T. Testing the tourism-induced EKC hypothesis: The case of Singapore. Econ. Model. 2014, 41, 383–391. [Google Scholar] [CrossRef]
- Katircioglu, S.T.; Feridun, M.; Kilinc, C. Estimating tourism-induced energy consumption and CO2 emissions: The case of Cyprus. Renew. Sustain. Energy Rev. 2014, 29, 634–640. [Google Scholar] [CrossRef]
- Ng, T.H.; Lye, C.T.; Lim, Y.S. A decomposition analysis of CO2 emissions: Evidence from Malaysia’s tourism industry. Int. J. Sustain. Dev. World Ecol. 2016, 4509, 1–12. [Google Scholar] [CrossRef]
- Arbulú, I.; Lozano, J.; Rey-Maquieira, J. Tourism and solid waste generation in Europe: A panel data assessment of the Environmental Kuznets Curve. Waste Manag. 2015, 46, 628–636. [Google Scholar] [CrossRef] [PubMed]
- Cadarso, M.Á.; Gómez, N.; López, L.A.; Tobarra, M.Á.; Zafrilla, J.E. Quantifying Spanish tourism’s carbon footprint: The contributions of residents and visitors: A longitudinal study. J. Sustain. Tour. 2015, 23, 922–946. [Google Scholar] [CrossRef]
- Tugcu, C.T.; Topcu, M. The impact of carbon dioxide (CO2) emissions on tourism: Does the source of emission matter? Theor. Appl. Econ. 2018, XXV, 125–136. [Google Scholar]
- Rauf, A.; Liu, X.; Amin, W.; Ozturk, I.; Rehman, O.; Sarwar, S. Energy and Ecological Sustainability: Challenges and Panoramas in Belt and Road Initiative Countries. Sustainability 2018, 10, 2743. [Google Scholar] [CrossRef]
- Rauf, A.; Liu, X.; Amin, W.; Ozturk, I.; Rehman, O.; Hafeez, M. Testing EKC hypothesis with energy and sustainable development challenges: A fresh evidence from Belt and Road Initiative economies. Environ. Sci. Poll. Res. 2018. [Google Scholar] [CrossRef] [PubMed]
- Rauf, A.; Zhang, J.; Li, J.; Amin, W. Structural changes, energy consumption and Carbon emissions in China: Empirical evidence from ARDL bound testing model. Struct. Chang. Econ. Dyn. 2018. [Google Scholar] [CrossRef]
- Pablo-Romero, M. del P.; Pozo-Barajas, R.; Sánchez-Rivas, J. Relationships between tourism and hospitality sector electricity consumption in Spanish Provinces (1999–2013). Sustainability 2017, 9, 480. [Google Scholar] [CrossRef]
- Zaman, K.; Shahbaz, M.; Loganathan, N.; Raza, S.A. Tourism development, energy consumption and Environmental Kuznets Curve: Trivariate analysis in the panel of developed and developing countries. Tour. Manag. 2016, 54, 275–283. [Google Scholar] [CrossRef]
- Paramati, S.R.; Shahbaz, M.; Alam, M.S. Does tourism degrade environmental quality? A comparative study of Eastern and Western European Union. Transp. Res. Part D Transp. Environ. 2017, 50, 1–13. [Google Scholar] [CrossRef]
- Sherafatian-Jahromi, R.; Othman, M.S.; Law, S.H.; Ismail, N.W. Tourism and CO2 emissions nexus in Southeast Asia: New evidence from panel estimation. Environ., Dev. Sustain. 2017, 19, 1407–1423. [Google Scholar] [CrossRef]
- Tiwari, A.K.; Ozturk, I.; Aruna, M. Tourism, Energy Consumption and Climate Change in OECD Countries. Int. J. Energy Econ. Policy 2013, 3, 247–261. [Google Scholar]
- Ozturk, I. The relationships among tourism development, energy demand, and growth factors in developed and developing countries. Int. J. Sustain. Dev. World Ecol. 2016, 23, 122–131. [Google Scholar] [CrossRef]
- Jebli, B.M.; Hadhri, W. The dynamic causal links between CO2 emissions from transport, real GDP, energy use and international tourism. Int. J. Sustain. Dev. World Ecol. 2018, 25, 568–577. [Google Scholar] [CrossRef]
- Sghaier, A.; Guizani, A.; Ben Jabeur, S.; Nurunnabi, M. Tourism development, energy consumption and environmental quality in Tunisia, Egypt and Morocco: A trivariate analysis. GeoJournal 2018, 1–17. [Google Scholar] [CrossRef]
- Azam, M.; Mahmudul Alam, M.; Haroon Hafeez, M. Effect of tourism on environmental pollution: Further evidence from Malaysia, Singapore and Thailand. J. Clean. Prod. 2018, 190, 330–338. [Google Scholar] [CrossRef]
- Tang, Z.; Shang, J.; Shi, C.; Liu, Z.; Bi, K. Decoupling indicators of CO2 emissions from the tourism industry in China: 1990–2012. Ecol. Indic. 2014, 46, 390–397. [Google Scholar] [CrossRef]
- Wu, P.; Han, Y.; Tian, M. The measurement and comparative study of carbon dioxide emissions from tourism in typical provinces in China. Acta Ecol. Sin. 2015, 35, 184–190. [Google Scholar] [CrossRef]
- Meng, W.; Xu, L.; Hu, B.; Zhou, J.; Wang, Z. Quantifying direct and indirect carbon dioxide emissions of the Chinese tourism industry. J. Clean. Prod. 2016, 126, 586–594. [Google Scholar] [CrossRef]
- Zhang, L.; Gao, J. Exploring the effects of international tourism on China’s economic growth, energy consumption and environmental pollution: Envidence from a regional panel analysis. Renew. Sustain. Energy Rev. 2016, 53, 225–234. [Google Scholar] [CrossRef]
- Liu, J.; Zhang, J.; Fu, Z. Tourism eco-efficiency of Chinese coastal cities—Analysis based on the DEA-Tobit model. Ocean Coast. Manag. 2017, 148, 164–170. [Google Scholar] [CrossRef]
- Qiu, X.; Fang, Y.; Yang, X.; Zhu, F. Tourism eco-efficiency measurement, characteristics, and its influence factors in China. Sustainability 2017, 9, 1634. [Google Scholar] [CrossRef]
- Jin, C.; Cheng, J.; Xu, J.; Huang, Z. Self-driving tourism induced carbon emission flows and its determinants in well-developed regions: A case study of Jiangsu Province, China. J. Clean. Prod. 2018, 186, 191–202. [Google Scholar] [CrossRef]
- Shuai, C.; Chen, X.; Wu, Y.; Tan, Y.; Zhang, Y.; Shen, L. Identifying the key impact factors of carbon emission in China: Results from a largely expanded pool of potential impact factors. J. Clean. Prod. 2018, 175, 612–623. [Google Scholar] [CrossRef]
- Yuan, Y.; Jin, M.; Ren, J.; Hu, M.; Ren, P. The dynamic coordinated development of a regional environment-tourism-economy system: A case study from Western Hunan Province, China. Sustainability 2014, 6, 5231–5251. [Google Scholar] [CrossRef]
- Chen, B.; Cheng, Y.S. The impacts of environmental regulation on industrial activities: Evidence from a quasi-natural experiment in Chinese prefectures. Sustainability 2017, 9, 571. [Google Scholar] [CrossRef]
- Zivot, E.; Andrews, D.W.K. Further evidence on the great crash, the oil-price shock, and the unit-root hypothesis. J. Bus. Econ. Stat. 1992, 10, 251–270. [Google Scholar] [CrossRef]
- Perron, P. Testing for a unit root in a time series with a changing mean. J. Bus. Econ. Stat. 1990, 8, 153–162. [Google Scholar] [CrossRef]
- Phillips, P.C.B.; Hansen, B.E. Statistical Inference in Instrumental Variables Regression with I(1) Processes. Rev. Econ. Stud. 1990, 57, 99. [Google Scholar] [CrossRef]
- Gregory, A.W.; Hansen, B.E. Residual-based tests for cointegration with regime shifts in models. J. Econom. 1996, 70, 99–126. [Google Scholar] [CrossRef]
- Gregoiy, A.W.; Hansen, B.E. Tests for Cointegration in Models with Regime and Trend Shifts. Oxf. Bull. Econ. Stat. 1996, 58, 555–560. [Google Scholar] [CrossRef]
- Jiang, W.; Zhu, L.; Li, J.; Deng, W. Study on the effect of tourism on the ecological environment of mountain Emei and protective strategy. Chin. J. Environ. Sci. 1996, 17, 48–50. [Google Scholar]
- Xie, C.; Zheng, X. An analysis of the destruction to the tourist ecosystem by holiday tour peaks and its countermeasure. Tour. Sci. 2001, 3, 33–35. [Google Scholar]
- Pigram, J.J. Environmental implications of tourism development. Ann. Tour. Res. 1980, 7, 554–583. [Google Scholar] [CrossRef]
- Zhong, L.; Deng, J.; Song, Z.; Ding, P. Research on environmental impacts of tourism in China: Progress and prospect. J. Environ. Manag. 2011, 92, 2972–2983. [Google Scholar] [CrossRef] [PubMed]
- Jiang, Q.; Tang, C.; Zhan, J.; Zhang, W.; Wu, F. Environmental cost and pollution risk caused by the industrial transfer in Qinghai Province. Front. Earth Sci. 2014, 8, 362–374. [Google Scholar] [CrossRef]
- Cao, X. Challenges and potential improvements in the policy and regulatory framework for sustainable tourism planning in China: The case of Shanxi Province. J. Sustain. Tour. 2014, 23, 455–476. [Google Scholar] [CrossRef]
- Li, J.; Zheng, G.; Liu, H.; Wang, L.; Tang, Z.; Shi, H.; Guo, W.; Wang, H. Situation Analysis of Ningxia Province. Available online: http://www.fao.org/fileadmin/templates/cpesap/Data/Ningxia/SASNingxiawp.pdf (accessed on 6 September 2018).
- Wang, B.; Yang, Z.; Han, F.; Shi, H. Car tourism in Xinjiang: The mediation effect of perceived value and tourist satisfaction on the relationship between destination image and loyalty. Sustainability 2017, 9, 22. [Google Scholar] [CrossRef]
Figure 1.
Study site map.
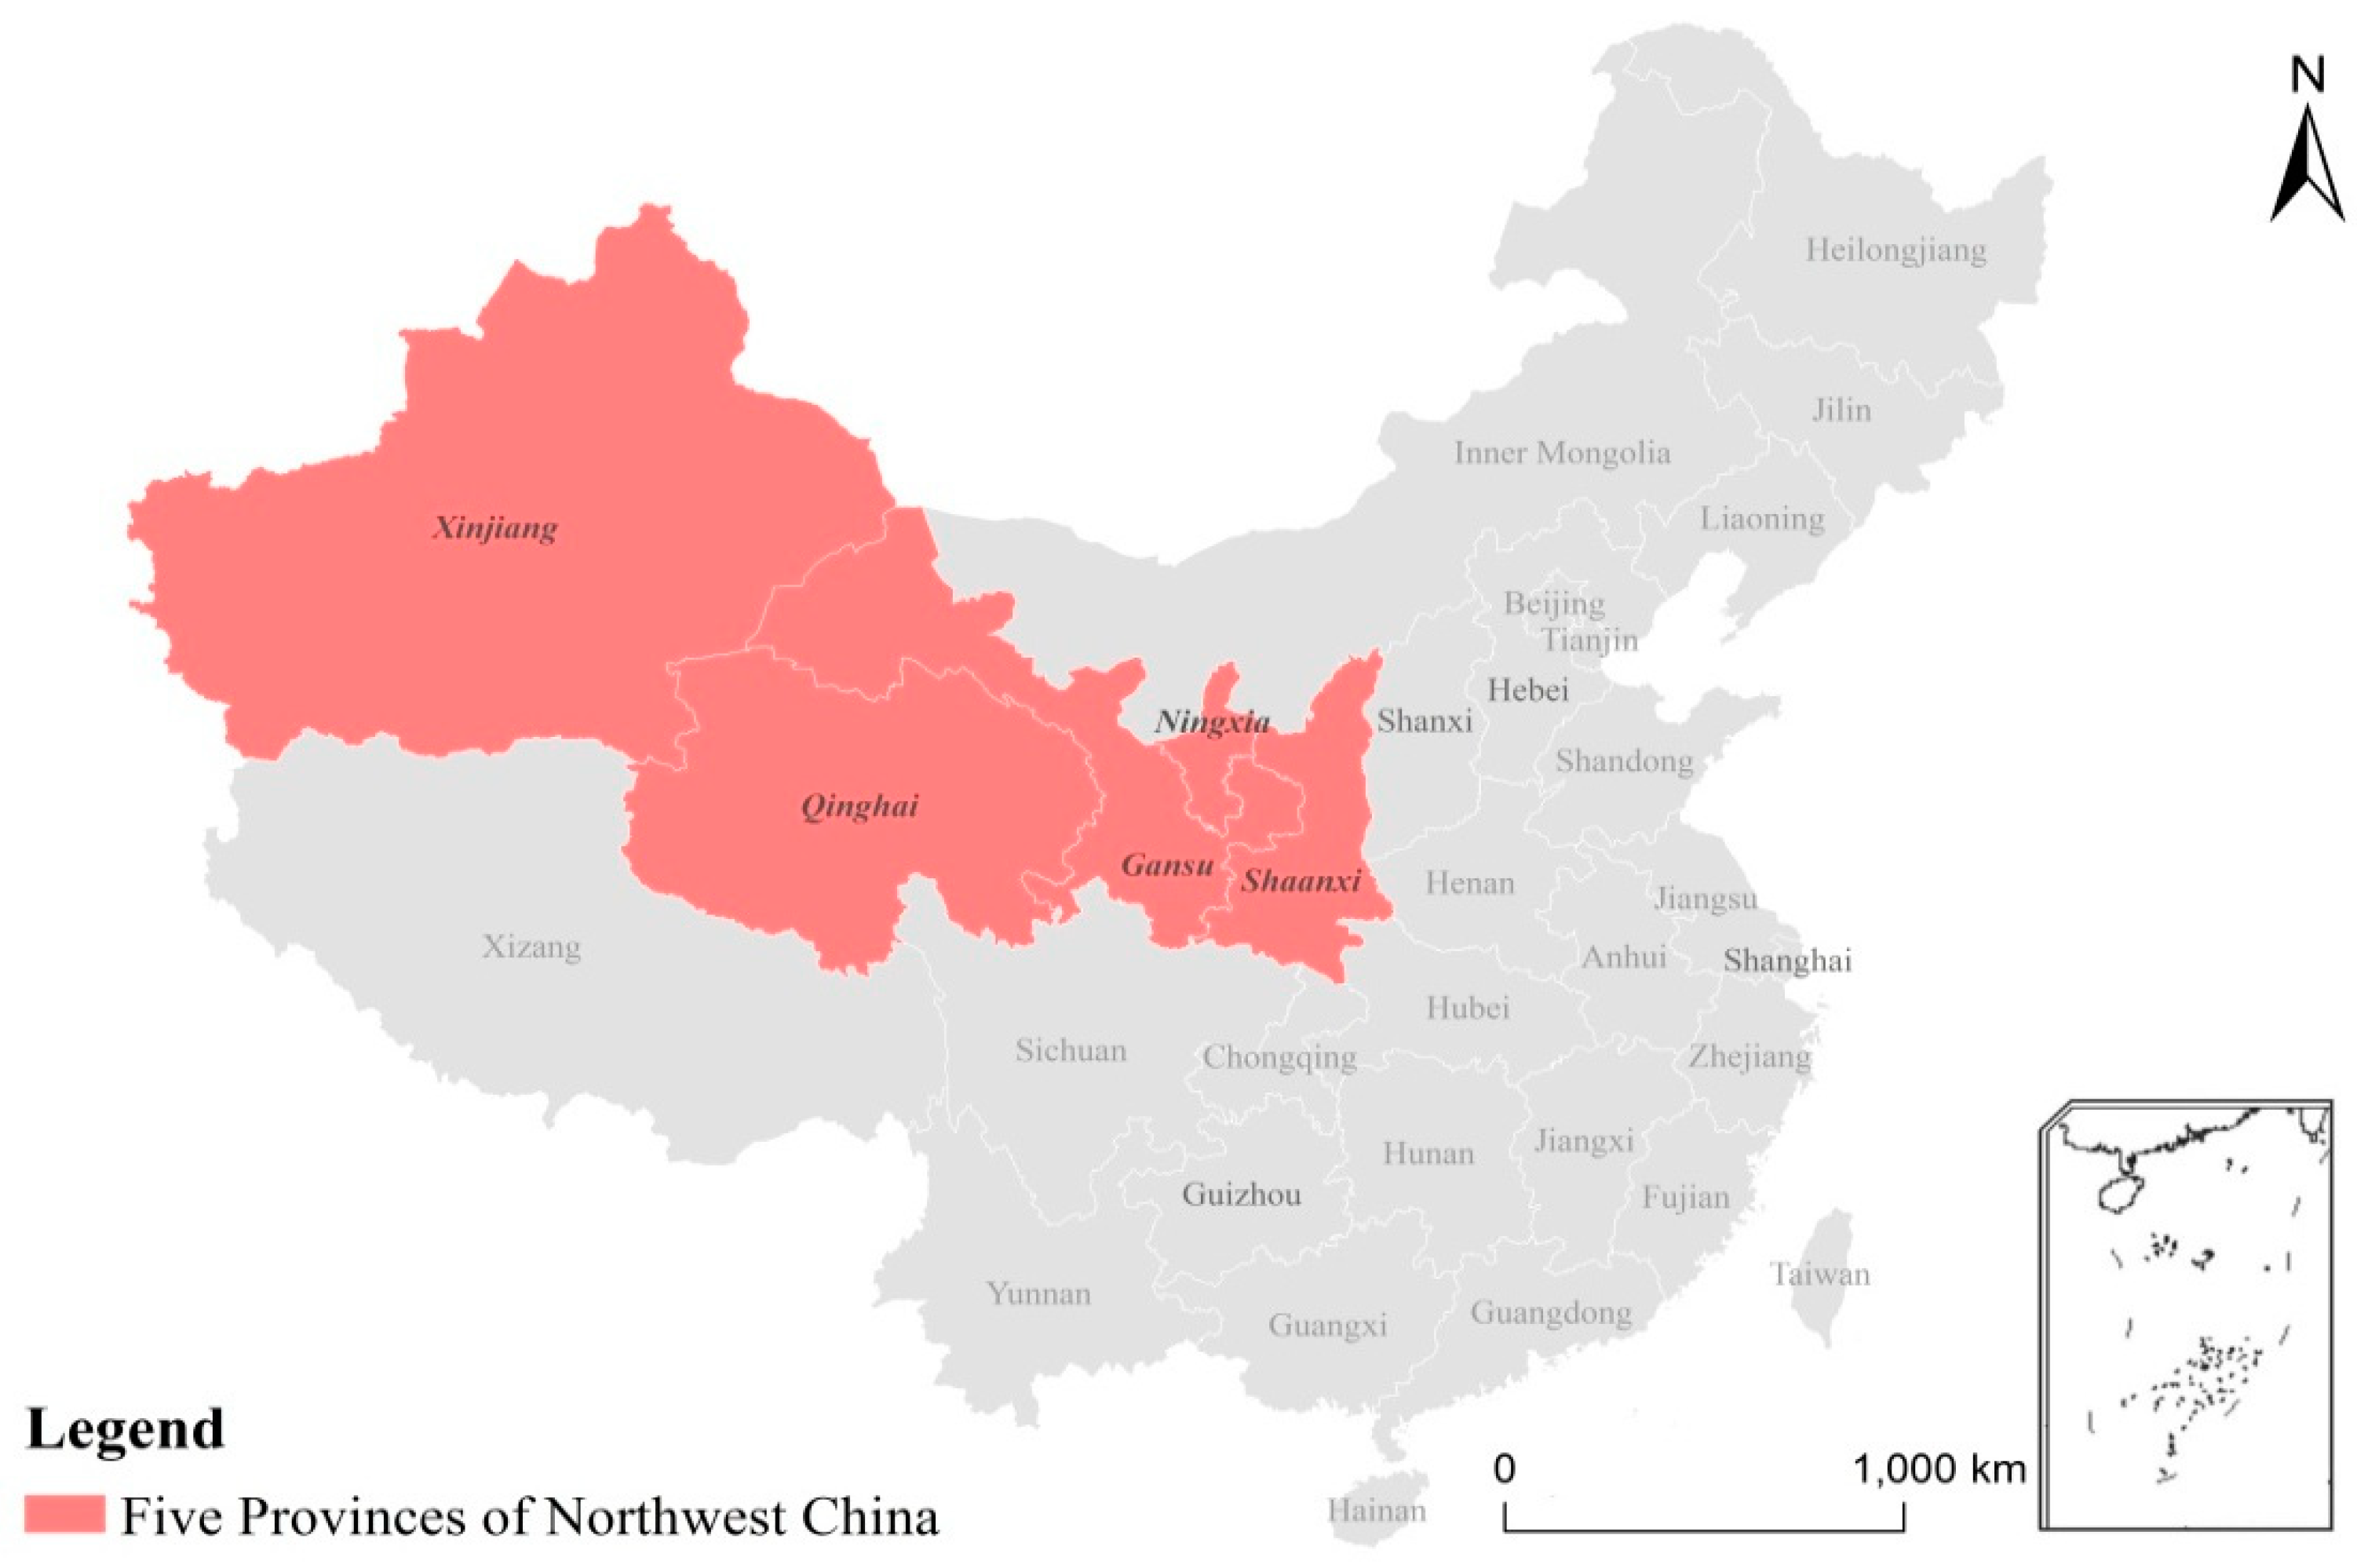
Figure 2.
Tourist arrivals in five provinces in 1990 (in thousands).
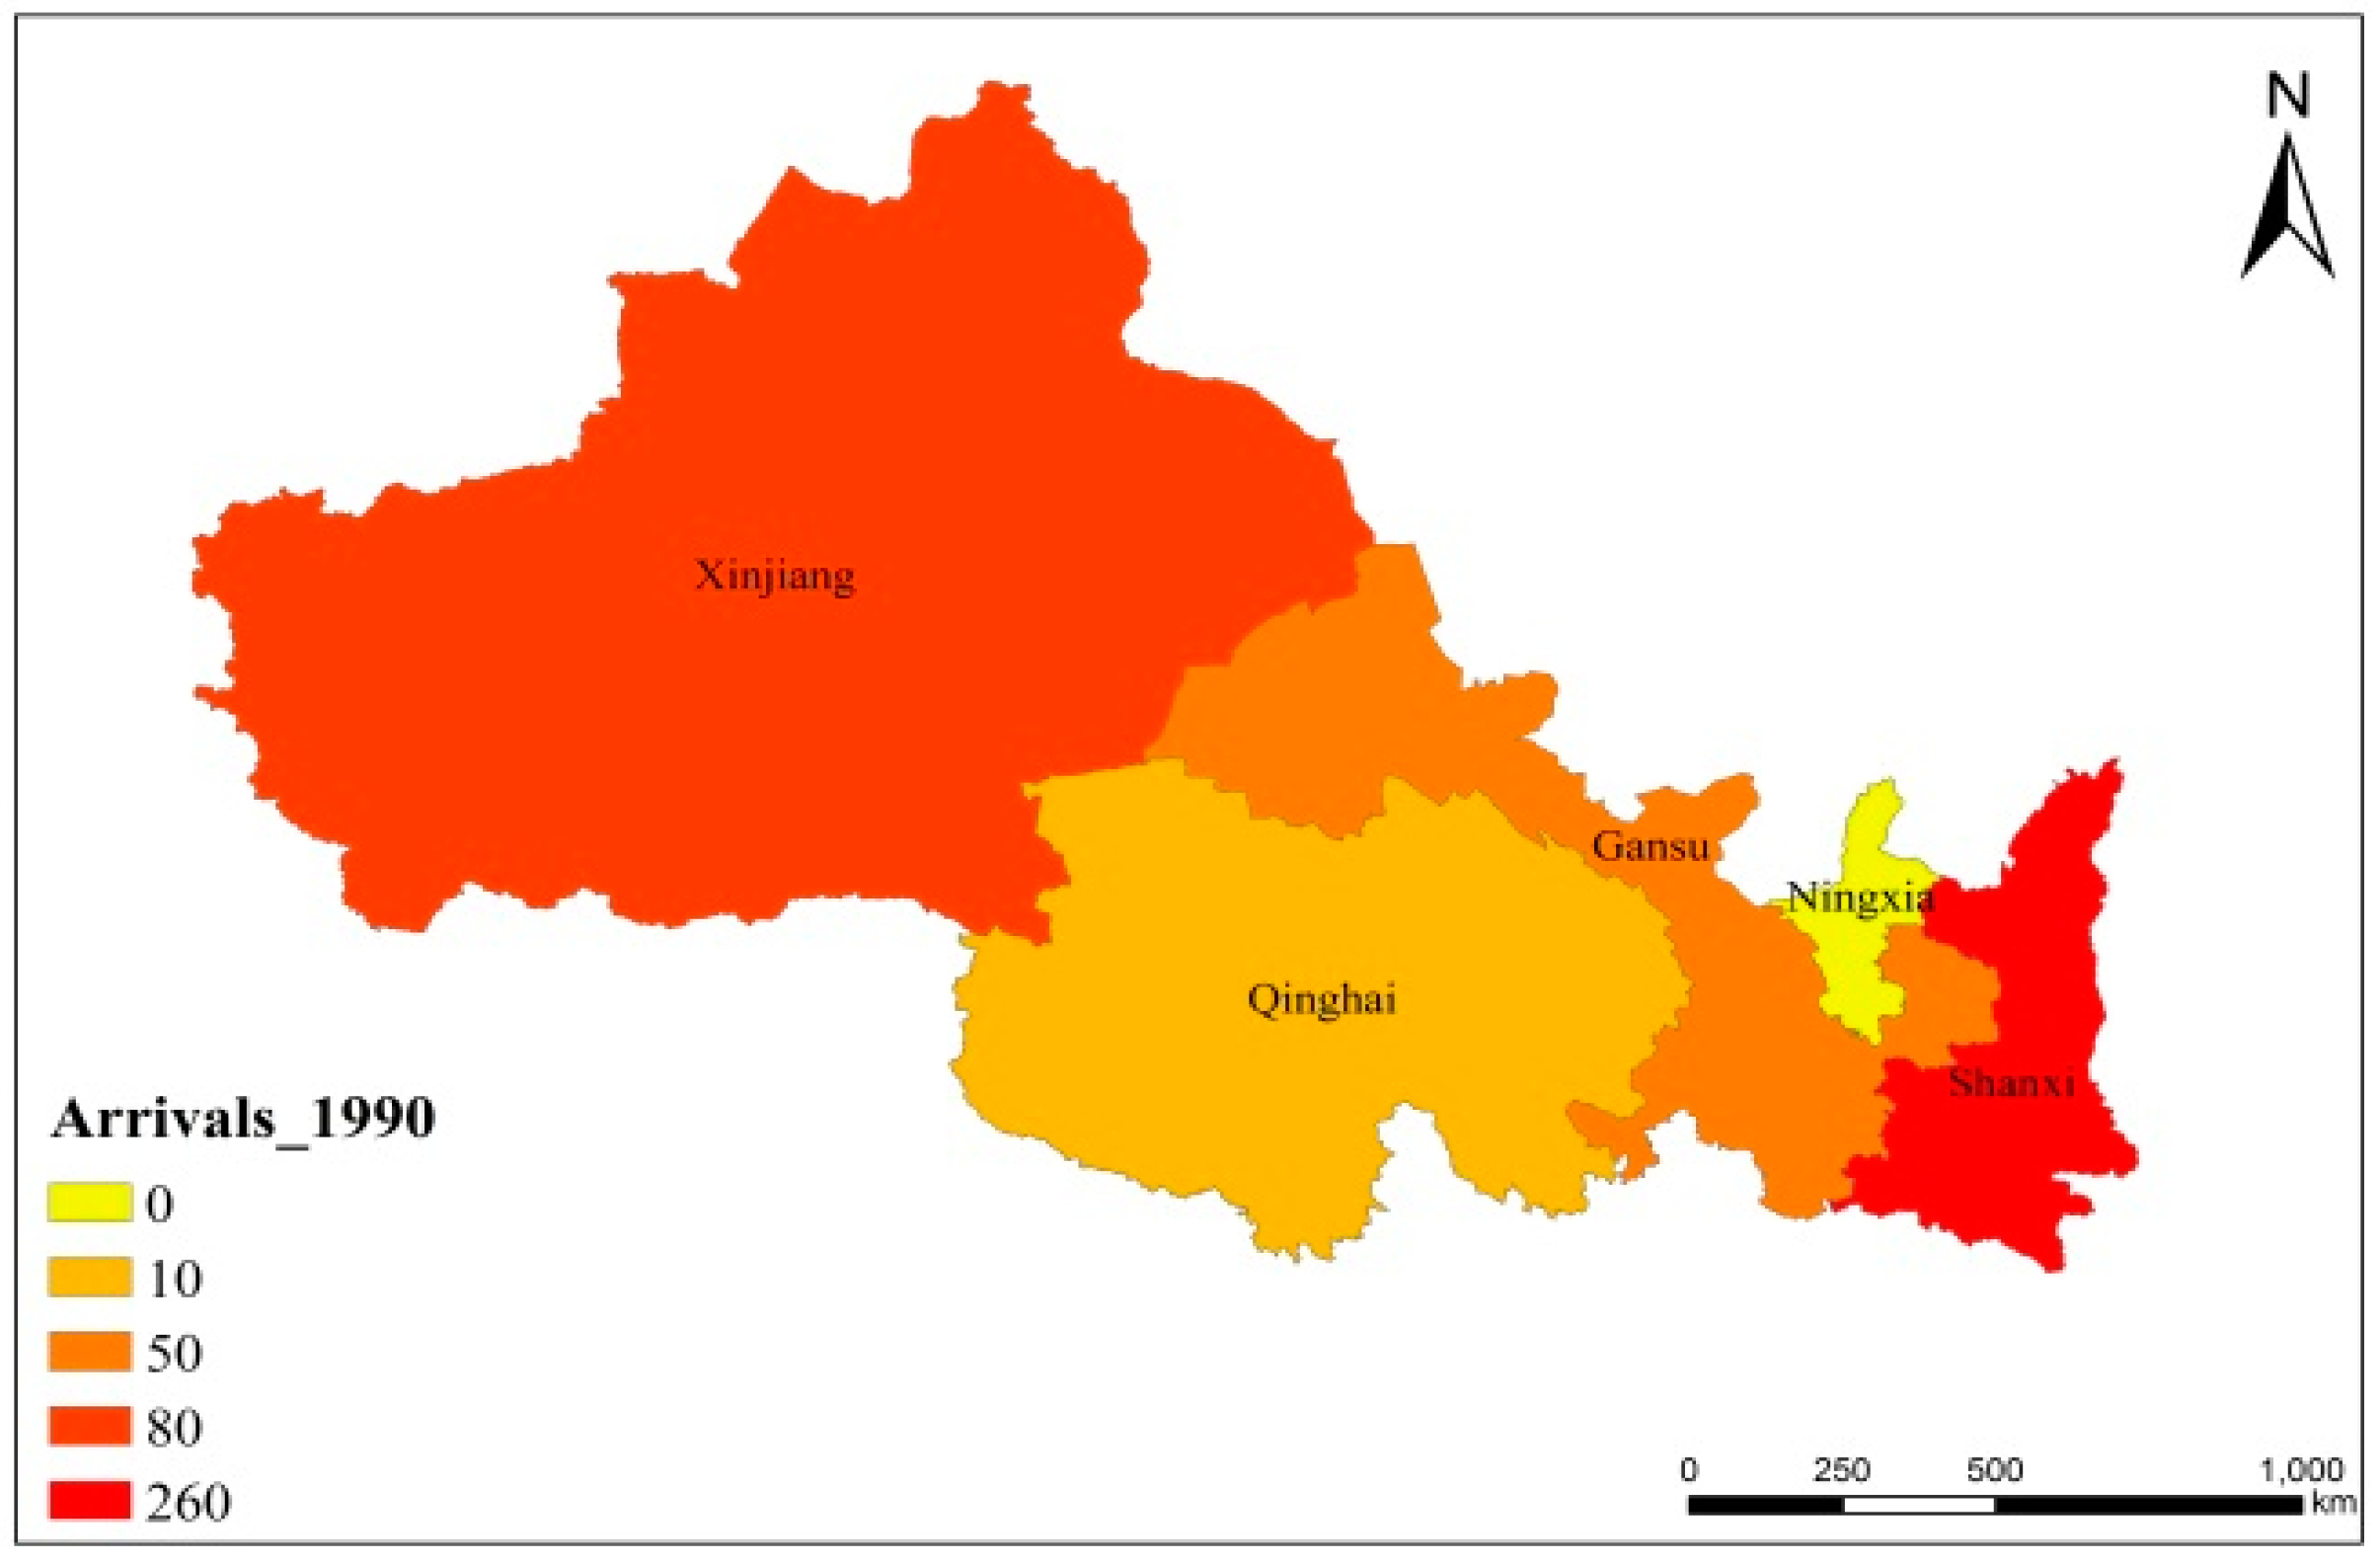
Figure 3.
Tourist arrivals in five provinces in 2016 (in thousands).
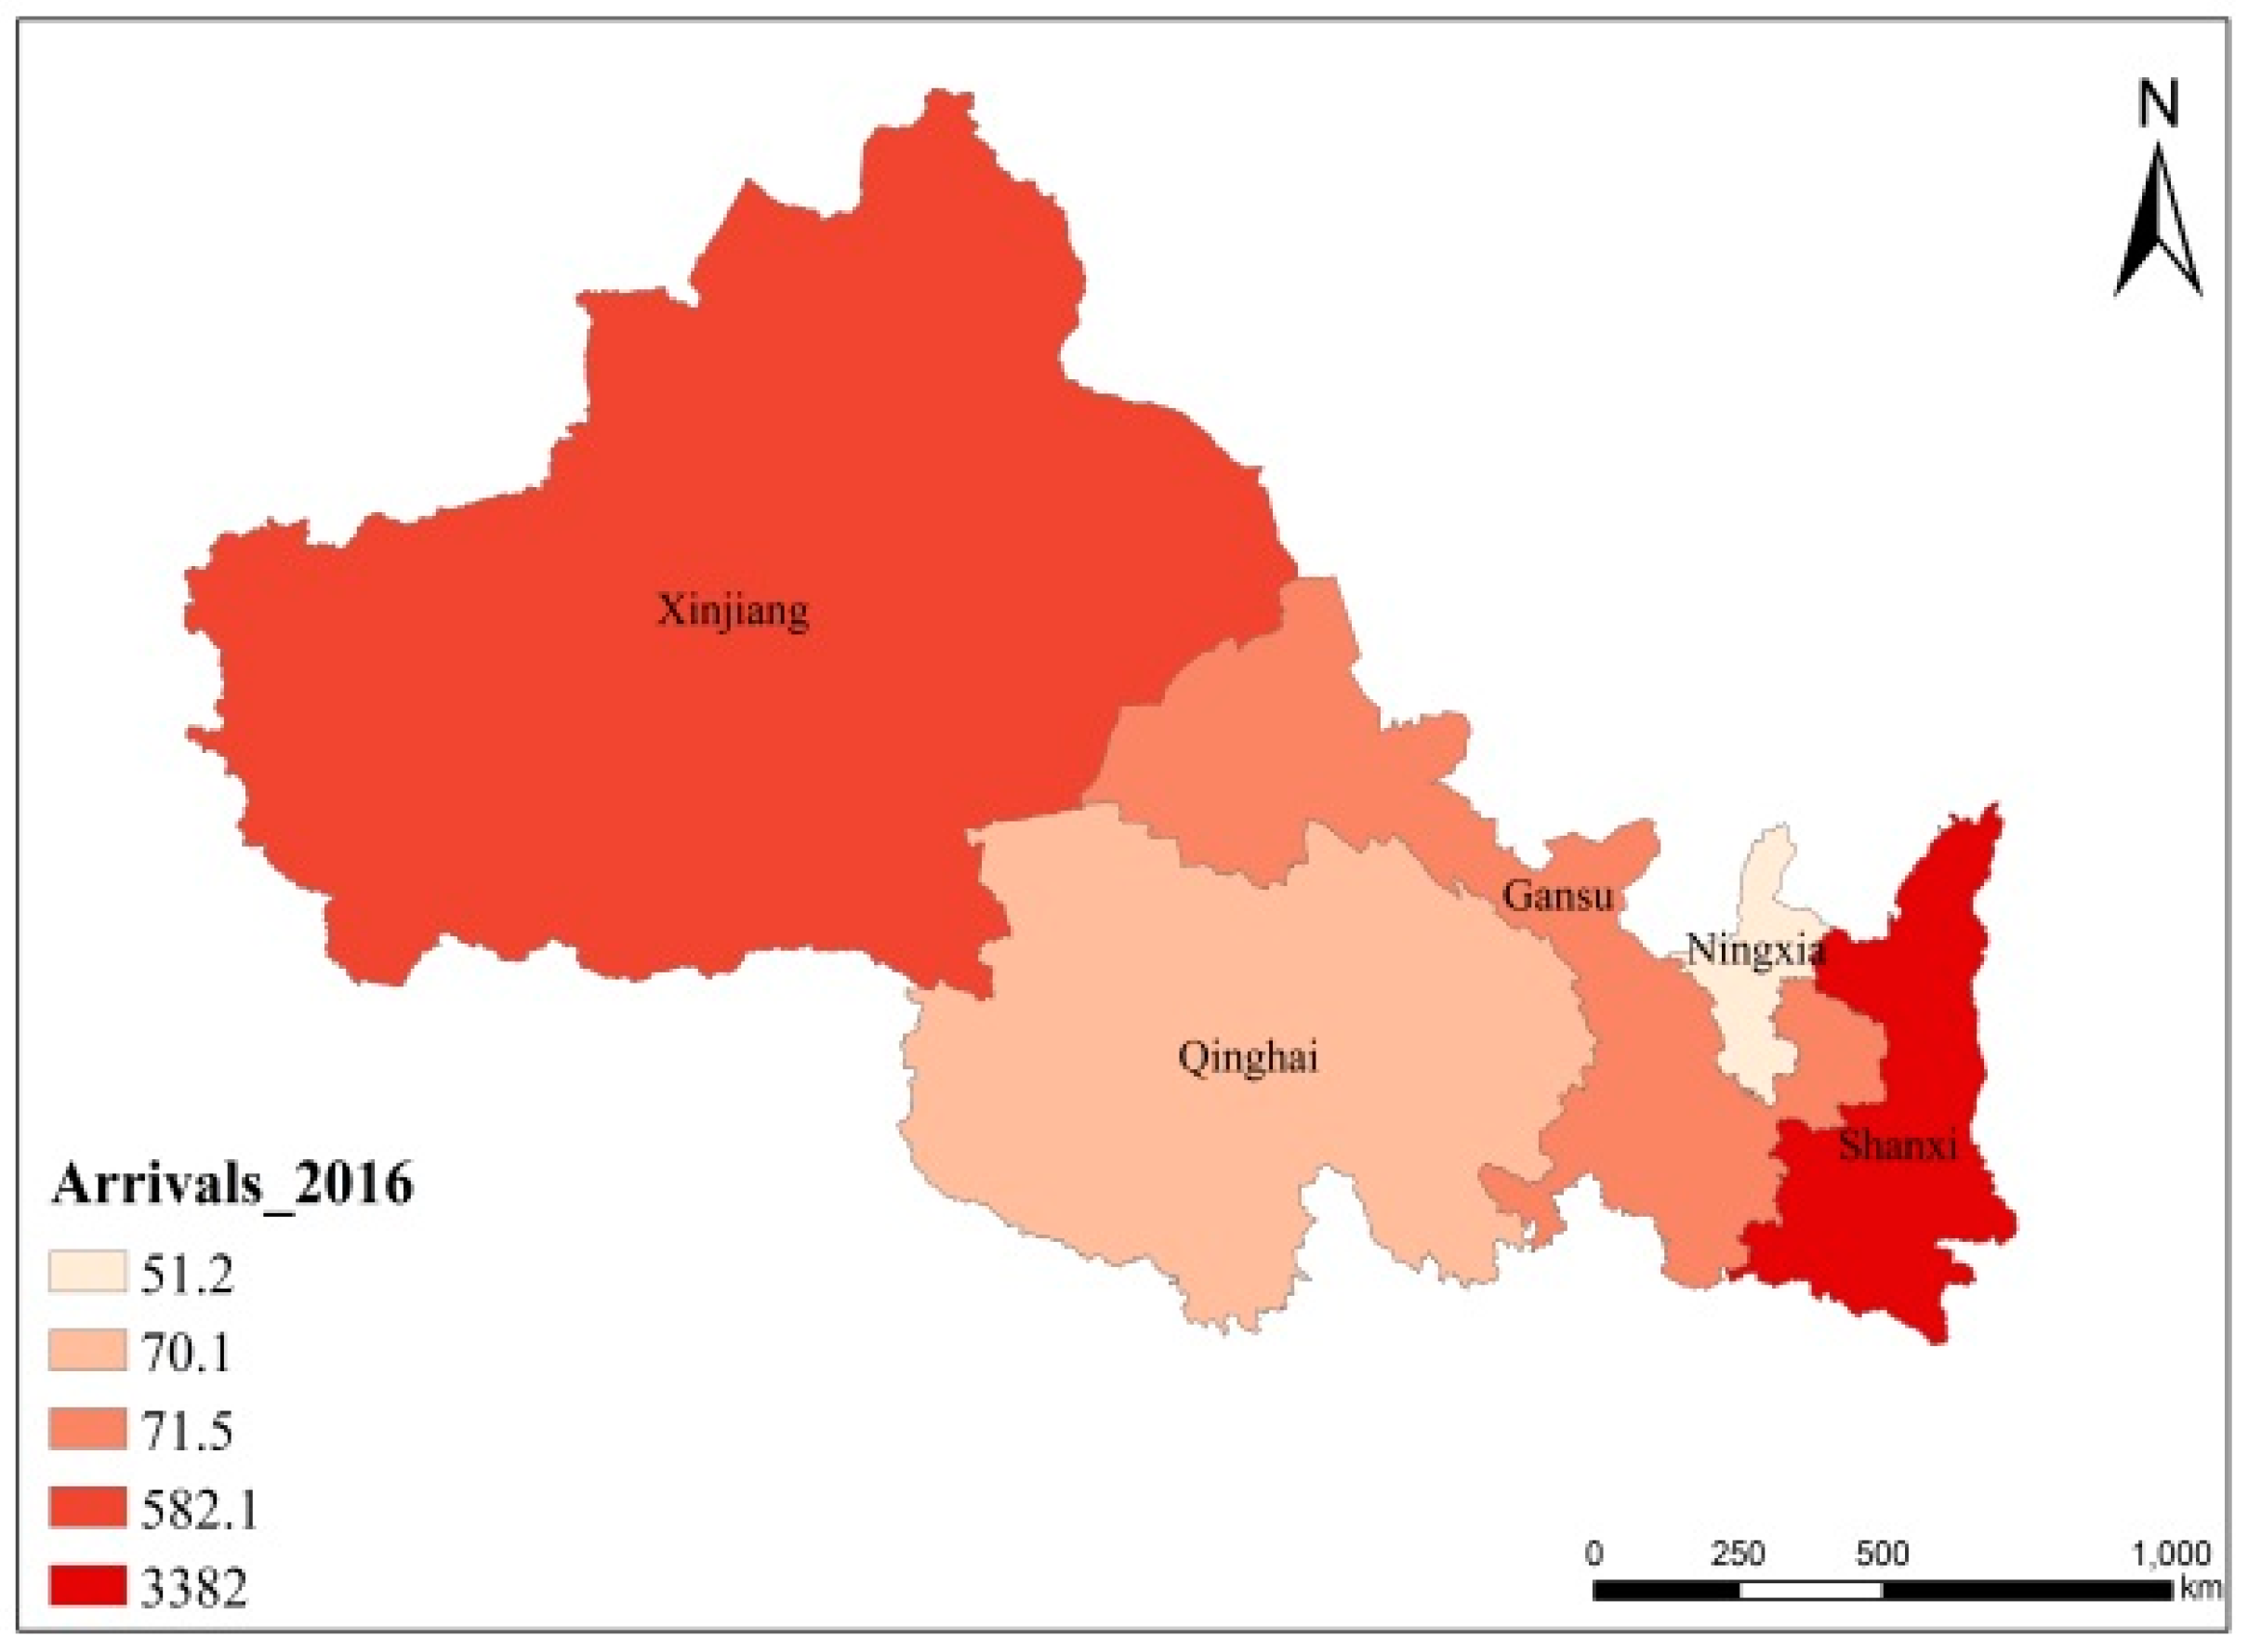
Figure 4.
CO2 emission in five provinces in 1990 (in thousand tons).

Figure 5.
CO2 emission in five provinces in 2016 (in thousand tons).

Table 1.
Unit Root Test with Structural Breaks.
| Provinces & Variables | Z&A Test for Level | Z&A Test for 1st Difference | ||
|---|---|---|---|---|
| Gansu | T-Stat | Break | T-Stat | Break |
| CO2 | −3.97 | 2002 | −5.40 | 1997 |
| TR | −3.03 | 2007 | −7.54 | 2008 |
| GDP | −2.50 | 2003 | −6.01 | 2004 |
| EU | −3.04 | 2001 | −5.86 | 2002 |
| Ningxia | ||||
| CO2 | −3.79 | 2001 | −5.59 | 2000 |
| TR | −3.47 | 2009 | −7.06 | 2010 |
| GDP | −4.98* | 2006 | −5.74 | 2010 |
| EU | −3.56 | 2001 | −6.37 | 2003 |
| Qinghai | ||||
| CO2 | −2.23 | 2003 | −5.58 | 2011 |
| TR | −3.43 | 1999 | −6.55 | 2008 |
| GDP | −2.89 | 2003 | −6.61 | 2013 |
| EU | −2.34 | 2010 | −5.14 | 2001 |
| Shanxi | ||||
| CO2 | −3.82 | 2003 | −6.19 | 1999 |
| TR | −5.45* | 2003 | −6.26 | 1992 |
| GDP | −3.92 | 1992 | −6.75 | 2013 |
| EU | −2.28 | 2003 | −5.43 | 1999 |
| Xinjiang | ||||
| CO2 | −2.91 | 2002 | −5.19 | 1999 |
| TR | −5.14 * | 2006 | −6.41 | 1991 |
| GDP | −2.36 | 1990 | −5.47 | 2014 |
| EU | −3.19 | 2004 | −5.53 | 2009 |
Note: * indicates that variables are stationary at level. The level of significance is 5%. TR represents tourist arrivals and EU stands for energy use.
Table 2.
Fully modified ordinary least squares (FMOLS) Estimations.
| Variables | Gansu | Ningxia | Qinghai | Shanxi | Xinjiang | |||||
|---|---|---|---|---|---|---|---|---|---|---|
| EU | 7.15 | 14.17 * | 1.84 | 6.34 * | 5.61 | 2.62 * | 4.06 | 8.65 * | 3.22 | 15.72 * |
| GDP | 0.19 | 3.57 * | 0.59 | 1.46 *** | 0.08 | 0.53 *** | 0.31 | 2.49 * | 0.05 | 0.62 *** |
| GDP2 | 0.33 | 6.20 * | 0.62 | 1.80 ** | 0.45 | 3.04 * | 0.54 | 4.38 * | 0.34 | 3.68 * |
| TR | 0.02 | 2.21 * | 0.07 | 0.44 *** | 0.04 | 0.93 *** | 0.02 | 0.68 *** | −0.02 | −1.25 *** |
| Const. | 4.14 | 99.11 * | 4.04 | 10.83 * | 2.23 | 10.31 * | 3.82 | 9.35 * | 3.34 | 6.43 * |
| R2 | 0.98 | 0.85 | 0.98 | 0.85 | 0.98 | |||||
| Adj. R2 | 0.96 | 0.80 | 0.97 | 0.80 | 0.97 | |||||
Note: “*, **, ***” represent the level of significance at 5, 10, and 1%, respectively. The values with * are the t-statistic of coefficients. TR represents tourist arrivals and EU stands for energy use.
Table 3.
Co-integration Test for Gansu Province.
| Gregory-Hansen Test for Co-Integration with Regime Shifts: Change in Level | ||||||
|---|---|---|---|---|---|---|
| Estimations | t-Stat | Breakpoint | Date | Asymptotic Critical Values | ||
| 1% | 5% | 10% | ||||
| ADF | −7.82 | 17 | 2001 | −5.77 | −5.28 | −5.02 |
| Zt | −7.90 | 17 | 2001 | −5.77 | −5.28 | −5.02 |
| Za | -42.51 | 17 | 2001 | −63.64 | −53.58 | −48.65 |
| Change in Level and Trend | ||||||
| ADF | −7.35 | 8 | 2006 | −6.89 | −6.32 | −6.16 |
| Zt | −7.47 | 13 | 2006 | −6.89 | −6.32 | −6.16 |
| Za | −38.99 | 13 | 2006 | −90.84 | −78.87 | −72.75 |
| Change in Regime | ||||||
| ADF | −7.76 | 20 | 2004 | −6.51 | −6.00 | −5.75 |
| Zt | −7.88 | 20 | 2004 | −6.51 | −6.00 | −5.75 |
| Za | −42.70 | 20 | 2004 | −80.15 | −68.94 | −63.42 |
Table 4.
Co-integration Test for Qinghai Province.
| Gregory-Hansen Test for Co-Integration with Regime Shifts: Change in Level | ||||||
|---|---|---|---|---|---|---|
| Estimations | t-Stat | Breakpoint | Date | Asymptotic Critical Values | ||
| 1% | 5% | 10% | ||||
| ADF | −6.22 | 11 | 2000 | −5.77 | −5.28 | −5.02 |
| Zt | −6.35 | 11 | 2000 | −5.77 | −5.28 | −5.02 |
| Za | −32.83 | 11 | 2000 | −63.64 | −53.58 | −48.65 |
| Change in Level and Trend | ||||||
| ADF | −7.21 | 13 | 2002 | −6.89 | −6.32 | −6.16 |
| Zt | −7.17 | 11 | 2000 | −6.89 | −6.32 | −6.16 |
| Za | −34.99 | 11 | 2000 | −90.84 | −78.87 | −72.75 |
| Change in Regime | ||||||
| ADF | −6.57 | 5 | 1994 | −6.51 | −6.00 | −5.75 |
| Zt | −6.71 | 11 | 2000 | −6.51 | −6.00 | −5.75 |
| Za | −33.78 | 11 | 2000 | −80.15 | −68.94 | −63.42 |
Table 5.
Co-integration Test for Ningxia Province.
| Gregory-Hansen Test for Co-Integration with Regime Shifts: Change in Level | ||||||
|---|---|---|---|---|---|---|
| Estimations | t-Stat | Breakpoint | Date | Asymptotic Critical Values | ||
| 1% | 5% | 10% | ||||
| ADF | −5.36 | 6 | 1992 | −5.77 | −5.28 | −5.02 |
| Zt | −5.91 | 8 | 1994 | −5.77 | −5.28 | −5.02 |
| Za | −32.39 | 8 | 1994 | −63.64 | −53.58 | −48.65 |
| Change in Level and Trend | ||||||
| ADF | −6.35 | 8 | 1994 | −6.89 | −6.32 | −6.16 |
| Zt | −7.47 | 13 | 1999 | −6.89 | −6.32 | −6.16 |
| Za | −38.99 | 13 | 1999 | −90.84 | −78.87 | −72.75 |
| Change in Regime | ||||||
| ADF | −6.30 | 16 | 2002 | −6.51 | −6.00 | −5.75 |
| Zt | −7.87 | 8 | 1994 | −6.51 | −6.00 | −5.75 |
| Za | −40.65 | 8 | 1994 | −80.15 | −68.94 | −63.42 |
Table 6.
Co-integration Test for Shanxi Province.
| Gregory-Hansen Test for Co-Integration with Regime Shifts: Change in Level | ||||||
|---|---|---|---|---|---|---|
| Estimations | t-Stat | Breakpoint | Date | Asymptotic Critical Values | ||
| 1% | 5% | 10% | ||||
| ADF | −6.11 | 8 | 1995 | −5.77 | −5.28 | −5.02 |
| Zt | −6.77 | 8 | 1995 | −5.77 | −5.28 | −5.02 |
| Za | −22.63 | 8 | 1995 | −63.64 | −53.58 | −48.65 |
| Change in Level and Trend | ||||||
| ADF | −6.43 | 30 | 2007 | −6.89 | −6.32 | −6.16 |
| Zt | −9.58 | 8 | 1995 | −6.89 | −6.32 | −6.16 |
| Za | −38.87 | 8 | 1995 | −90.84 | −78.87 | −72.75 |
| Change in Regime | ||||||
| ADF | −6.85 | 11 | 2008 | −6.51 | −6.00 | −5.75 |
| Zt | −8.68 | 8 | 1995 | −6.51 | −6.00 | −5.75 |
| Za | −27.57 | 8 | 1995 | −80.15 | −68.94 | −63.42 |
Table 7.
Co-integration Test for Xinjiang Province.
| Gregory-Hansen Test for Co-Integration with Regime Shifts: Change in Level | ||||||
|---|---|---|---|---|---|---|
| Estimations | t-Stat | Breakpoint | Date | Asymptotic Critical Values | ||
| 1% | 5% | 10% | ||||
| ADF | −5.96 | 25 | 2002 | −5.77 | −5.28 | −5.02 |
| Zt | −8.00 | 24 | 2001 | −5.77 | −5.28 | −5.02 |
| Za | −48.67 | 24 | 2001 | −63.64 | −53.58 | −48.65 |
| Change in Level and Trend | ||||||
| ADF | −7.69 | 16 | 1993 | −6.89 | −6.32 | −6.16 |
| Zt | −9.06 | 24 | 2001 | −6.89 | −6.32 | −6.16 |
| Za | −53.12 | 24 | 2001 | −90.84 | −78.87 | −72.75 |
| Change in Regime | ||||||
| ADF | −7.41 | 16 | 1993 | −6.51 | −6.00 | −5.75 |
| Zt | −8.40 | 24 | 2001 | −6.51 | −6.00 | −5.75 |
| Za | −50.62 | 24 | 2001 | −80.15 | −68.94 | −63.42 |
© 2018 by the authors. Licensee MDPI, Basel, Switzerland. This article is an open access article distributed under the terms and conditions of the Creative Commons Attribution (CC BY) license (http://creativecommons.org/licenses/by/4.0/).
Share and Cite
MDPI and ACS Style
Ahmad, F.; Draz, M.U.; Su, L.; Ozturk, I.; Rauf, A. Tourism and Environmental Pollution: Evidence from the One Belt One Road Provinces of Western China. Sustainability 2018, 10, 3520. https://doi.org/10.3390/su10103520
AMA Style
Ahmad F, Draz MU, Su L, Ozturk I, Rauf A. Tourism and Environmental Pollution: Evidence from the One Belt One Road Provinces of Western China. Sustainability. 2018; 10(10):3520. https://doi.org/10.3390/su10103520
Chicago/Turabian StyleAhmad, Fayyaz, Muhammad Umar Draz, Lijuan Su, Ilhan Ozturk, and Abdul Rauf. 2018. "Tourism and Environmental Pollution: Evidence from the One Belt One Road Provinces of Western China" Sustainability 10, no. 10: 3520. https://doi.org/10.3390/su10103520
Note that from the first issue of 2016, this journal uses article numbers instead of page numbers. See further details here.