Analyzing Trends of Dike-Ponds between 1978 and 2016 Using Multi-Source Remote Sensing Images in Shunde District of South China


1
Guangdong Key Laboratory for Urbanization and Geo-simulation, Guangdong Provincial Engineering Research Center for Public Security and Disaster, School of Geography and Planning, Sun Yat-Sen University, Guangzhou 510275, China
2
Guangzhou Zengcheng District Urban and Rural Planning and Surveying and Mapping Geographic Information Institute, Guangzhou 511300, China
3
Center of Geo-Informatics for Public Security, School of Geographic Sciences, Guangzhou University, Guangzhou 510006, China
4
Department of Geography and Geographic Information Science, University of Cincinnati, Cincinnati, OH 45221, USA
5
Department of Geography, the University of Alabama, Tuscaloosa, AL 35487, USA
*
Authors to whom correspondence should be addressed.
Sustainability 2018, 10(10), 3504; https://doi.org/10.3390/su10103504
Submission received: 27 August 2018
/
Revised: 26 September 2018
/
Accepted: 26 September 2018
/
Published: 30 September 2018
(This article belongs to the Special Issue The Long-Term Perspective of Human Impact on Landscape for Environmental Change and Sustainability)
Abstract
:Dike-ponds have experienced significant changes in the Pearl River Delta region over the past several decades, especially since China’s economic reform, which has seriously affected the construction of ecological environments. In order to monitor the evolution of dike-ponds, in this study we use multi-source remote sensing images from 1978 to 2016 to extract dike-ponds in several periods using the nearest neighbor classification method. A corresponding area weighted dike-pond invasion index (AWDII) is proposed to describe the spatial evolution of dike-ponds, both qualitatively and quantitatively. Furthermore, the evolution mechanisms of dike-ponds are determined, which can be attributed to both natural conditions and human factors. Our results show that the total area of dike-ponds in 2016 was significantly reduced and fragmentation had increased compared with the situation in 1978. The AWDII reveals that Shunde District has experienced three main phases, including steady development, rapid invasion and a reduction of invasion by other land use types. Most dike-ponds have now converted into built-up areas, followed by cultivated lands, mainly due to government policies, rural area depopulation, and river networks within Shunde. Our study indicates that the AWDII is applicable towards the evaluation of the dynamic changes of dike-ponds. The rational development, and careful protection, of dike-ponds should be implemented for better land and water resource management.
1. Introduction
Dike-ponds are a predominant and typical traditional agricultural production mode that was developed in the Pearl River Delta region of south China by local farmers [1]. Pond-breeding fish form in the low-lying, artificially dug fields, while clay in the dikes is used for planting mulberry-dominated trees, which thus form the basic dike-pond pattern. Dike-ponds represent the integration of terrestrial ecosystems (dike) and freshwater ecosystems (pond), and they have become one of the most important types of ecological landscapes in dense river network areas [2,3]. The land-water interaction between dikes and ponds is very significant because of the unique natural conditions of the area where dike-ponds are located, as well as their individual system characteristics. Dike-ponds not only effectively solve some natural environment problems that often occur in low-lying areas, and in turn preserve ecological balance, but they also create huge benefits in terms of driving economic growth [4]. The energy exchange, conversion, and material recycling processes within the system are intense and frequent. Dike-ponds are considered a model of traditional Chinese agriculture practices, and they are an important agricultural cultural heritage in the world [5,6].
Researchers have long sought a better understanding of the various aspects of dike-ponds. The study of dike-ponds began in 1980s whereby the basic structure and functions of dike-ponds was explained [4,7,8]. In addition, scholars also discussed the land–water interactions that occur between dikes and ponds. Such researchers measured the productivity of dike-ponds based on their natural environment, energy flow, material flow and the input and output of the major types of dike-pond (mulberry-dike-fish-pond, fruit-dike-fish-pond, sugar-dike-fish-pond and flower-dike-fish-pond) [9,10]. According to the available research on dike-ponds, reformation of the original dike-pond was conducted in low-lying lands such as Southeast Asia, North America, Australia, and other tropical and subtropical regions to introduce three-dimensional planting [11,12]. In the 1990’s, the Pearl River Delta region became a pioneer in reform and opening up, but was deemed to excessively pursue economic benefits. The situation led to the phenomenon of heavy fishpond breeding and light base planting. In-depth studies of dike-ponds fell into stagnation then, where the focus switched to merely analyzing the economic benefits that existing dike-ponds bring about [13,14,15,16]. At the beginning of 21th century, the traditional dike-pond had been severely damaged due to the high level of economic development in the Pearl River Delta. A series of subsequent ecological and environmental problems have aroused the attention of the public. For example [17,18,19], by being mainly focused on the repair and renovation of dike-ponds by exploring the mechanisms related to their construction and regulation. Zhao [20] and Wu [21] demonstrated the impact of the socio-economic development of dike-ponds, while other scholars [22,23] evaluated the ecological environment quality of dike-ponds. As a field of research, the agricultural landscape of dike-ponds provides a reference for the continuation of traditional ecological service functions, the restoration of agricultural ecosystems and the sustainable development of regional ecological economies [24,25,26,27].
At present, the study of dike-ponds includes a combination of field survey data of local areas, using geographic information systems (GIS) and remote sensing (RS) spatial analysis methods. The assistance of RS technology has the advantage of the timeliness of data acquisition in field investigations and their wide and large geographic coverage [28,29,30]. Some existing studies refer to the monitoring of land use changes both in terms of their distribution and area with multi-temporal data [30,31]. Ye used data from the Landsat TM from 1990, 2000, and 2006 to analyze dike-pond changes in the Pearl River Delta [32]. He divided the region into four types of dike-ponds based on a comprehensive expansion coefficient. Wang used data from three periods in 1990, 2000, and 2008 to extract the dike-pond distribution, while determining the dynamic change processes experienced by dike-ponds in the study area [33]. However, most of these analyses involved short time spans and were performed at only a single scale, making it difficult to obtain spatial information of multi-temporal dike-pond areas at larger scales, as well as the spatial distribution of dike-ponds before the 1980’s. Some studies stated that the Key Hole (KH) of Declassified Intelligence Satellite Photographs (DISP) series can scan both generally and in detail [34,35]. For the period from the 1960s to 1970s, the Pearl River Delta was a key area of interest for the United States, who archived considerable DISP data covering this region. Considering the available data, DISP images were selected as a source of RS data to determine the river network distribution and classify land use. Many literature works concluded that multi-source data can improve the image resolution and accuracy of land use classification [36,37,38,39]. Taking the Landsat Thematic Mapper(TM) images provided by the National Aeronautics and Space Agency (NASA) as a main data source, the evolution of dike-ponds from the 1980’s to the present can be realized with the help of KH-9 images [40,41,42].
Landscape patterns and their dynamic change processes are crucial parts of landscape ecology [43]. Human activities and their environmental effect are frequently discussed in the global change research [44]. The dike-ponds, which are typical ecological landscapes, are especially studied and explored with the help of pollen and palaeoecological records, within an interdisciplinary study [45,46,47]. Scholars have attempted to measure the conversion of land use quantitatively with feasible indexes, such as the freedom, dispersion, and goodness of construction land expansion [48,49,50]. Previous studies refer to other indices like the landscape expansion index (LEI) to better reveal spatio-temporal land use dynamics [51]. Unfortunately, the land use types that these indices determine remain relatively limited. For other types of land use which are not always considered, such as wetlands, and it is hard to use such indices to measure their dynamic change. Indeed, there exist very few publications regarding indices that effectively reflect the development trends of wetlands, especially dike-ponds. Therefore, evaluation methods and/or applicable models need to be further formulated. In the present study, we propose a new index called the area weighted dike-pond invasion index (AWDII), which is a variant of the landscape invasion index (LII). The modified parameter, which is based on the LEI, improves our ability to effectively evaluate dike-ponds.
The estimation and monitoring of dike-pond changes are necessary to establish an integrated land and water resource management system [52,53]. As a typical agricultural mode in the Pearl River Delta, it is of great practical significance to implement ecological agriculture construction and sustainable development of regional social economy in developed regions. Therefore, in this study we assemble a series of RS images that span 38 years and which have sufficient spatial resolution to classify land use and extract the distribution of dike-ponds for each period of research. A corresponding evaluation indicator is constructed to analyze the spatial evolution of dike-pond distributions, both qualitatively and quantitatively. By combining the natural environment characteristics in Shunde District with social economics, the factors which led to the dike-pond changes were performed.
2. Materials and Methods
2.1. Study Area
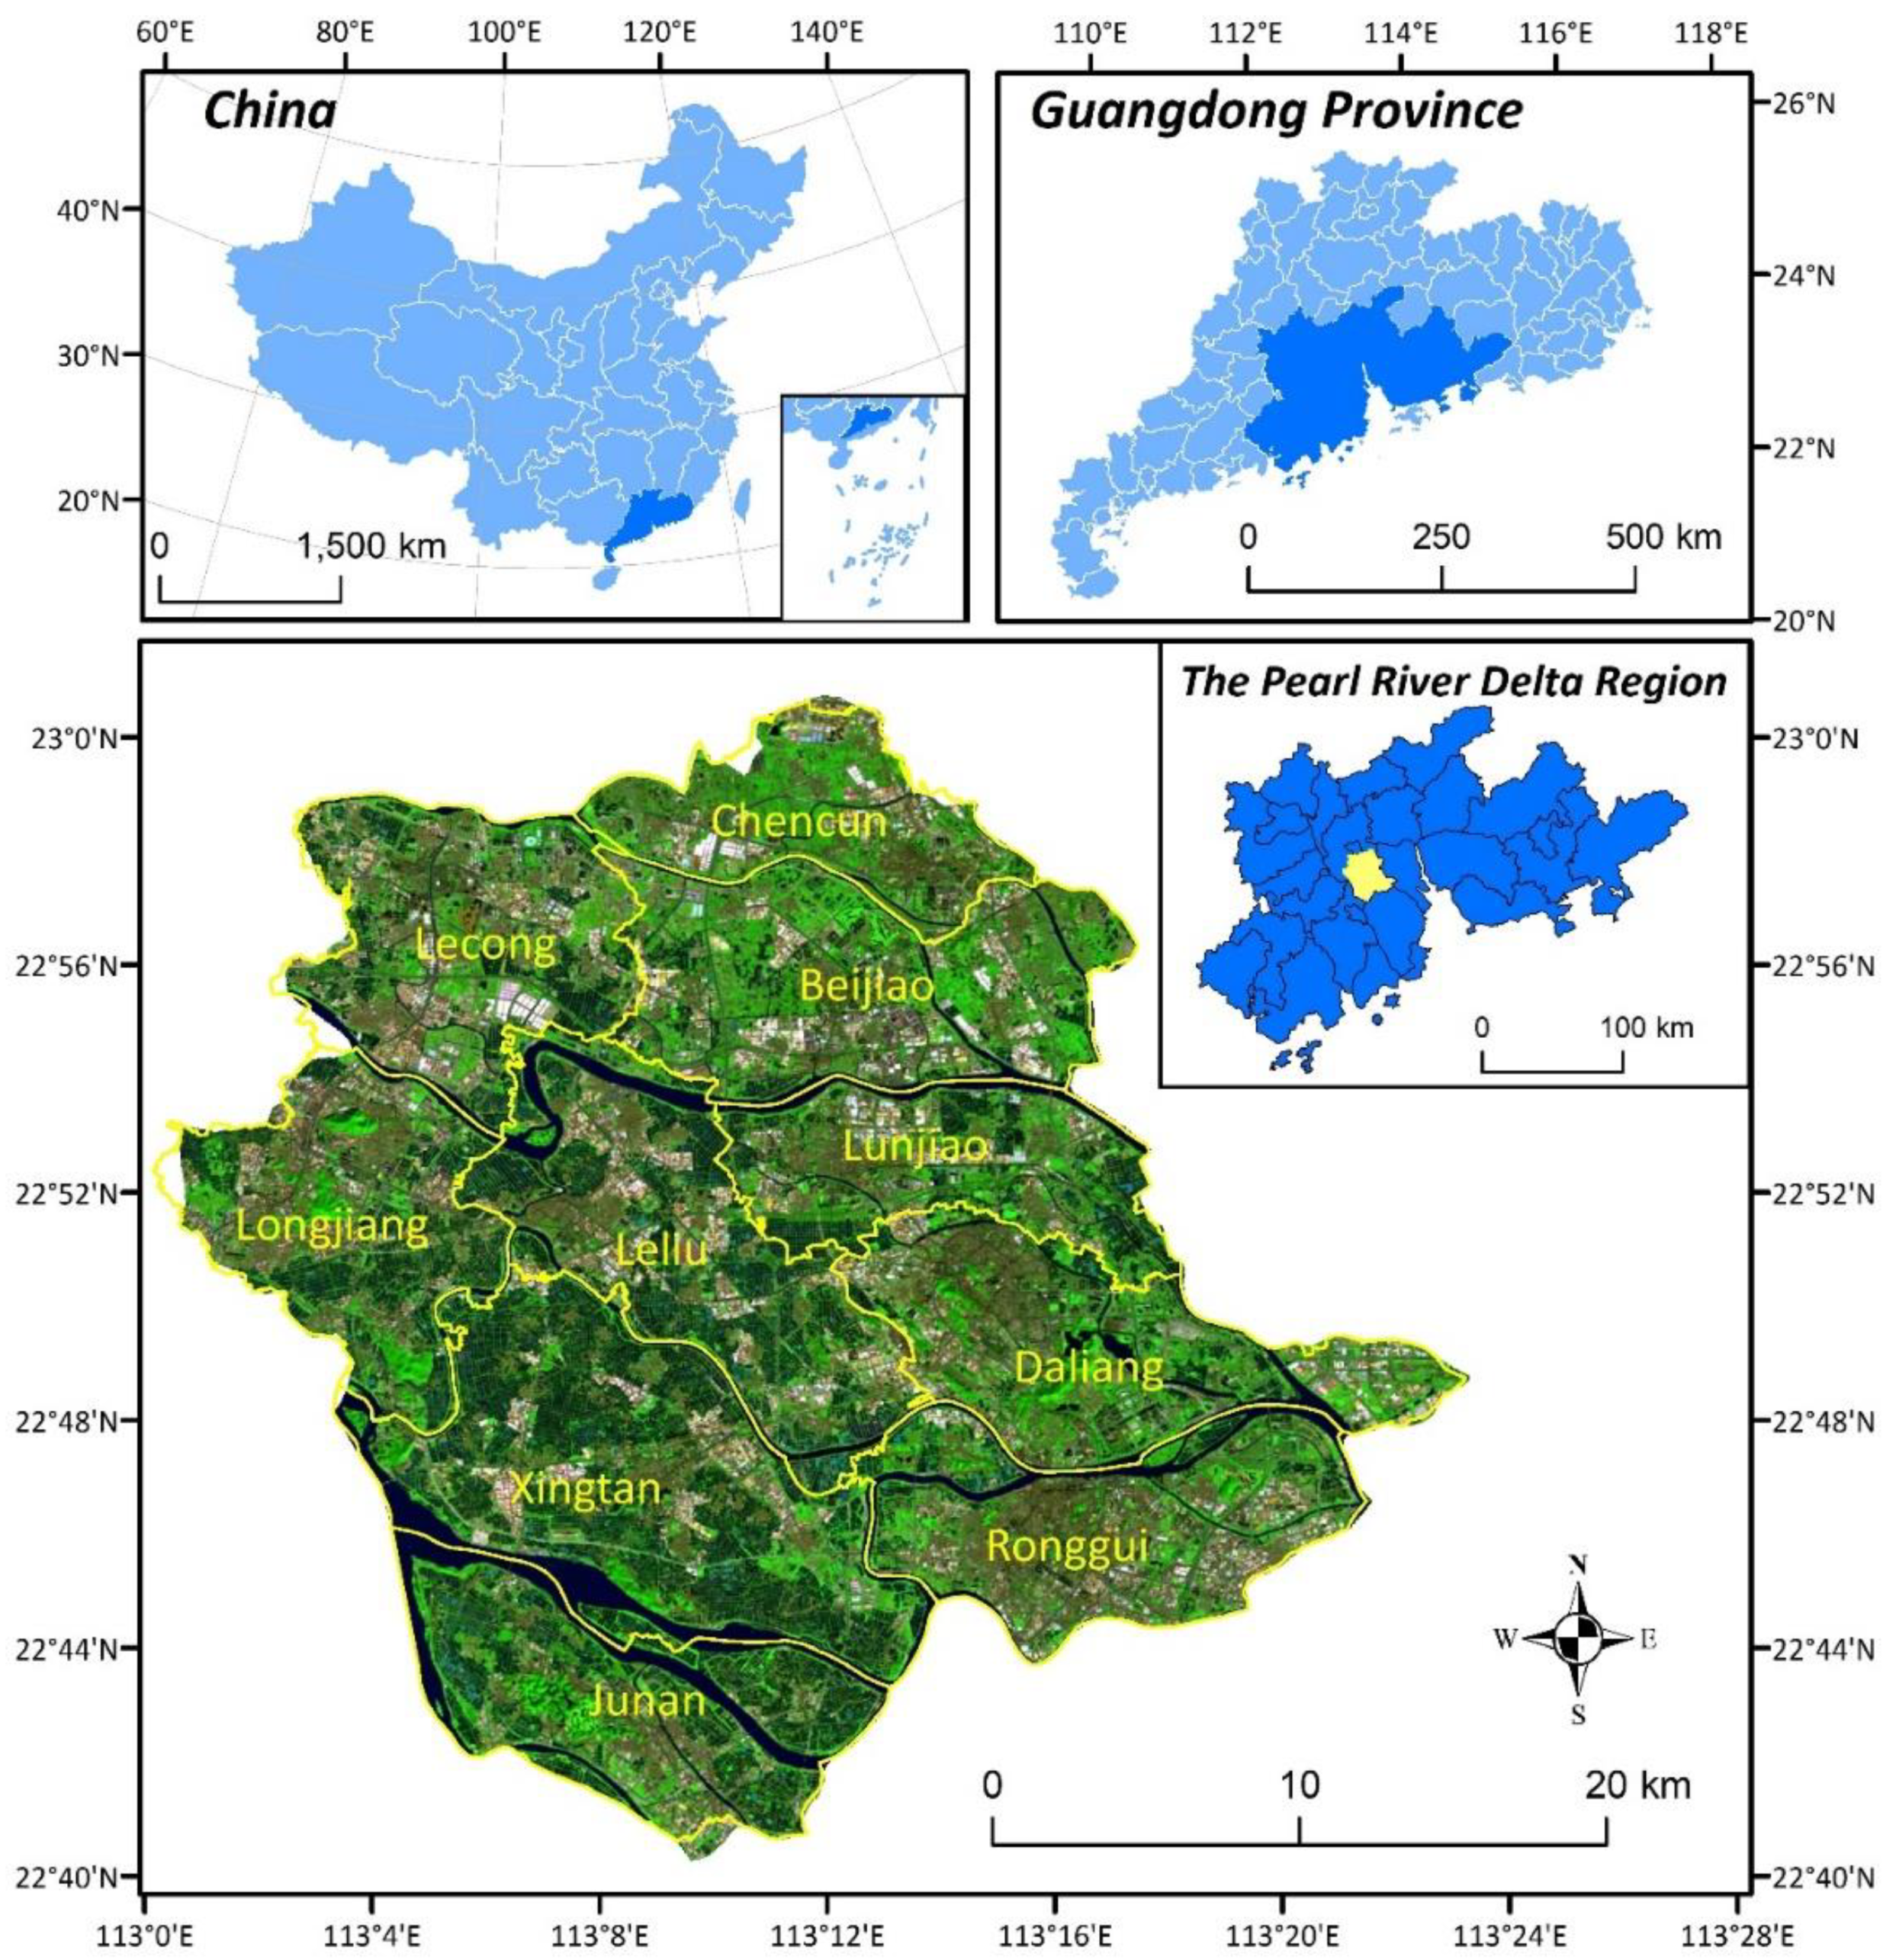
The study area, Shunde, is located at 22°40′15″–23°0′40″ N and 113°1′35″–113°23′30″ E in the Southern part of Foshan City, Guangdong Province. It covers an area of about 806 km2 (Figure 1). The area has a warm, humid, south Asian subtropical monsoon climate with sufficient sunshine, abundant precipitation, and other unique natural conditions. The territory has a flat land dominated by alluvial plains and rivers, while sporadic hillocks can be found in Southern and Western regions. The Northwest land is slightly higher than the Southwest, and the average elevation of most areas is 0.2 to 2 m above sea level [54]. Several rivers flow across Shunde District, including Xijiang River and the Shunde District Waterway. There are currently about 16 tributaries, and the total length of them reaches 210 km.
Shunde District has jurisdiction over 10 towns (Chencun, Junan, Xingtan, Longjiang, Lecong, Beijiao, Daliang, Ronggui, Lunjiao, and Leliu). These 10 towns are distributed on both sides of the main river channel in Shunde, which has become one of the main ways to communicate with the outside and has provided a link and means of interaction among the towns in the district.
2.2. Data and Pre-Processing
In this study, Declassified Intelligence Satellite Photographs (DISP) and Landsat MSS/TM/OLI images were used. To obtain a large time range of recorded RS data as far as possible, the Landsat MSS data were acquired on 2 November 1978, and the archived DISP data KH-9 is close to MSS data on time. KH-9 are single-band images with high spatial resolution, between 6 and 9 m, while the Landsat MSS images have low spatial resolution of about 78 m over four bands. To obtain enhanced images with both high spatial resolution and multispectral features, image fusion was performed. Among the available KH-9 images, we used two cloud-free images of good quality obtained on 17 December 1975 and 18 January 1976 (i.e., 1 month apart), respectively, which were combined to obtain an image that covered the entire study area (i.e., Shunde District). Dominated by agricultural developments between 1975 and 1978, Shunde District can be regarded as being constant due to only small changes occurring in land use over the three-year period. Therefore, image fusion was undertaken with the KH-9 image and the MSS image that was acquired 3 years later in 2 November 1978. Through several comparison experiments, it was found that the Brovey method resulted in a fused image of higher quality, which hence served as the data source for the subsequent analysis in 1978. To avoid inconsistency in resolutions, the resolution of Landsat images in 1978 was normalized to that of KH-9 image in 1975. The required image pre-processing varied according to the range of single scene images from the different data sources, the projection information of the images, and their application purposes (Table 1).
2.3. Classification and Accuracy Assessment
There are differences in the characteristics of the target categories between the fused and individual Landsat TM images. Interpretation of the two types of RS images in the fused MSS and KH-9 data (R:4 G:3 B:2) and Landsat TM image (R:7 G:5 B:3) band combinations are respectively displayed in Table 2 and described in Table 3.
ECognition Developer 9.0 was used for multi-scale image segmentation, the scale of which varied according to the spatial resolution of the image and the object characteristics. Through repeated experiments of setting the segmentation parameters, the segmentation scales of the seven period images were finally determined to be 70, 30, 15, 15, 15, 20, and 100, while other relevant parameters include the hue index (0.9), shape index (0.1), tightness index (0.5), and smoothness index (0.5). A certain number of classification features were selected from the mean, standard deviation, object length shape area, etc. of each object. Combination of these features was obtained to maximize the classification distance, and we used the nearest neighbor classification method to realize automatic classification of the RS images. Land use classification results were acquired after manually correcting the automatic classification result of each image. Classification validation is an integral and essential part of any image-classification process [55]. Therefore, the accuracy of the classification results was assessed by randomly collecting a certain number of sample objects for various types of ground objects to avoid contingency and improve the quality of accuracy evaluation. For the land use maps of earlier years, the relevant topographic maps, and photographs were considered to choose validation samples. The overall classification accuracy and global Kappa coefficient for each period from 1978 to 2016 were carried out.
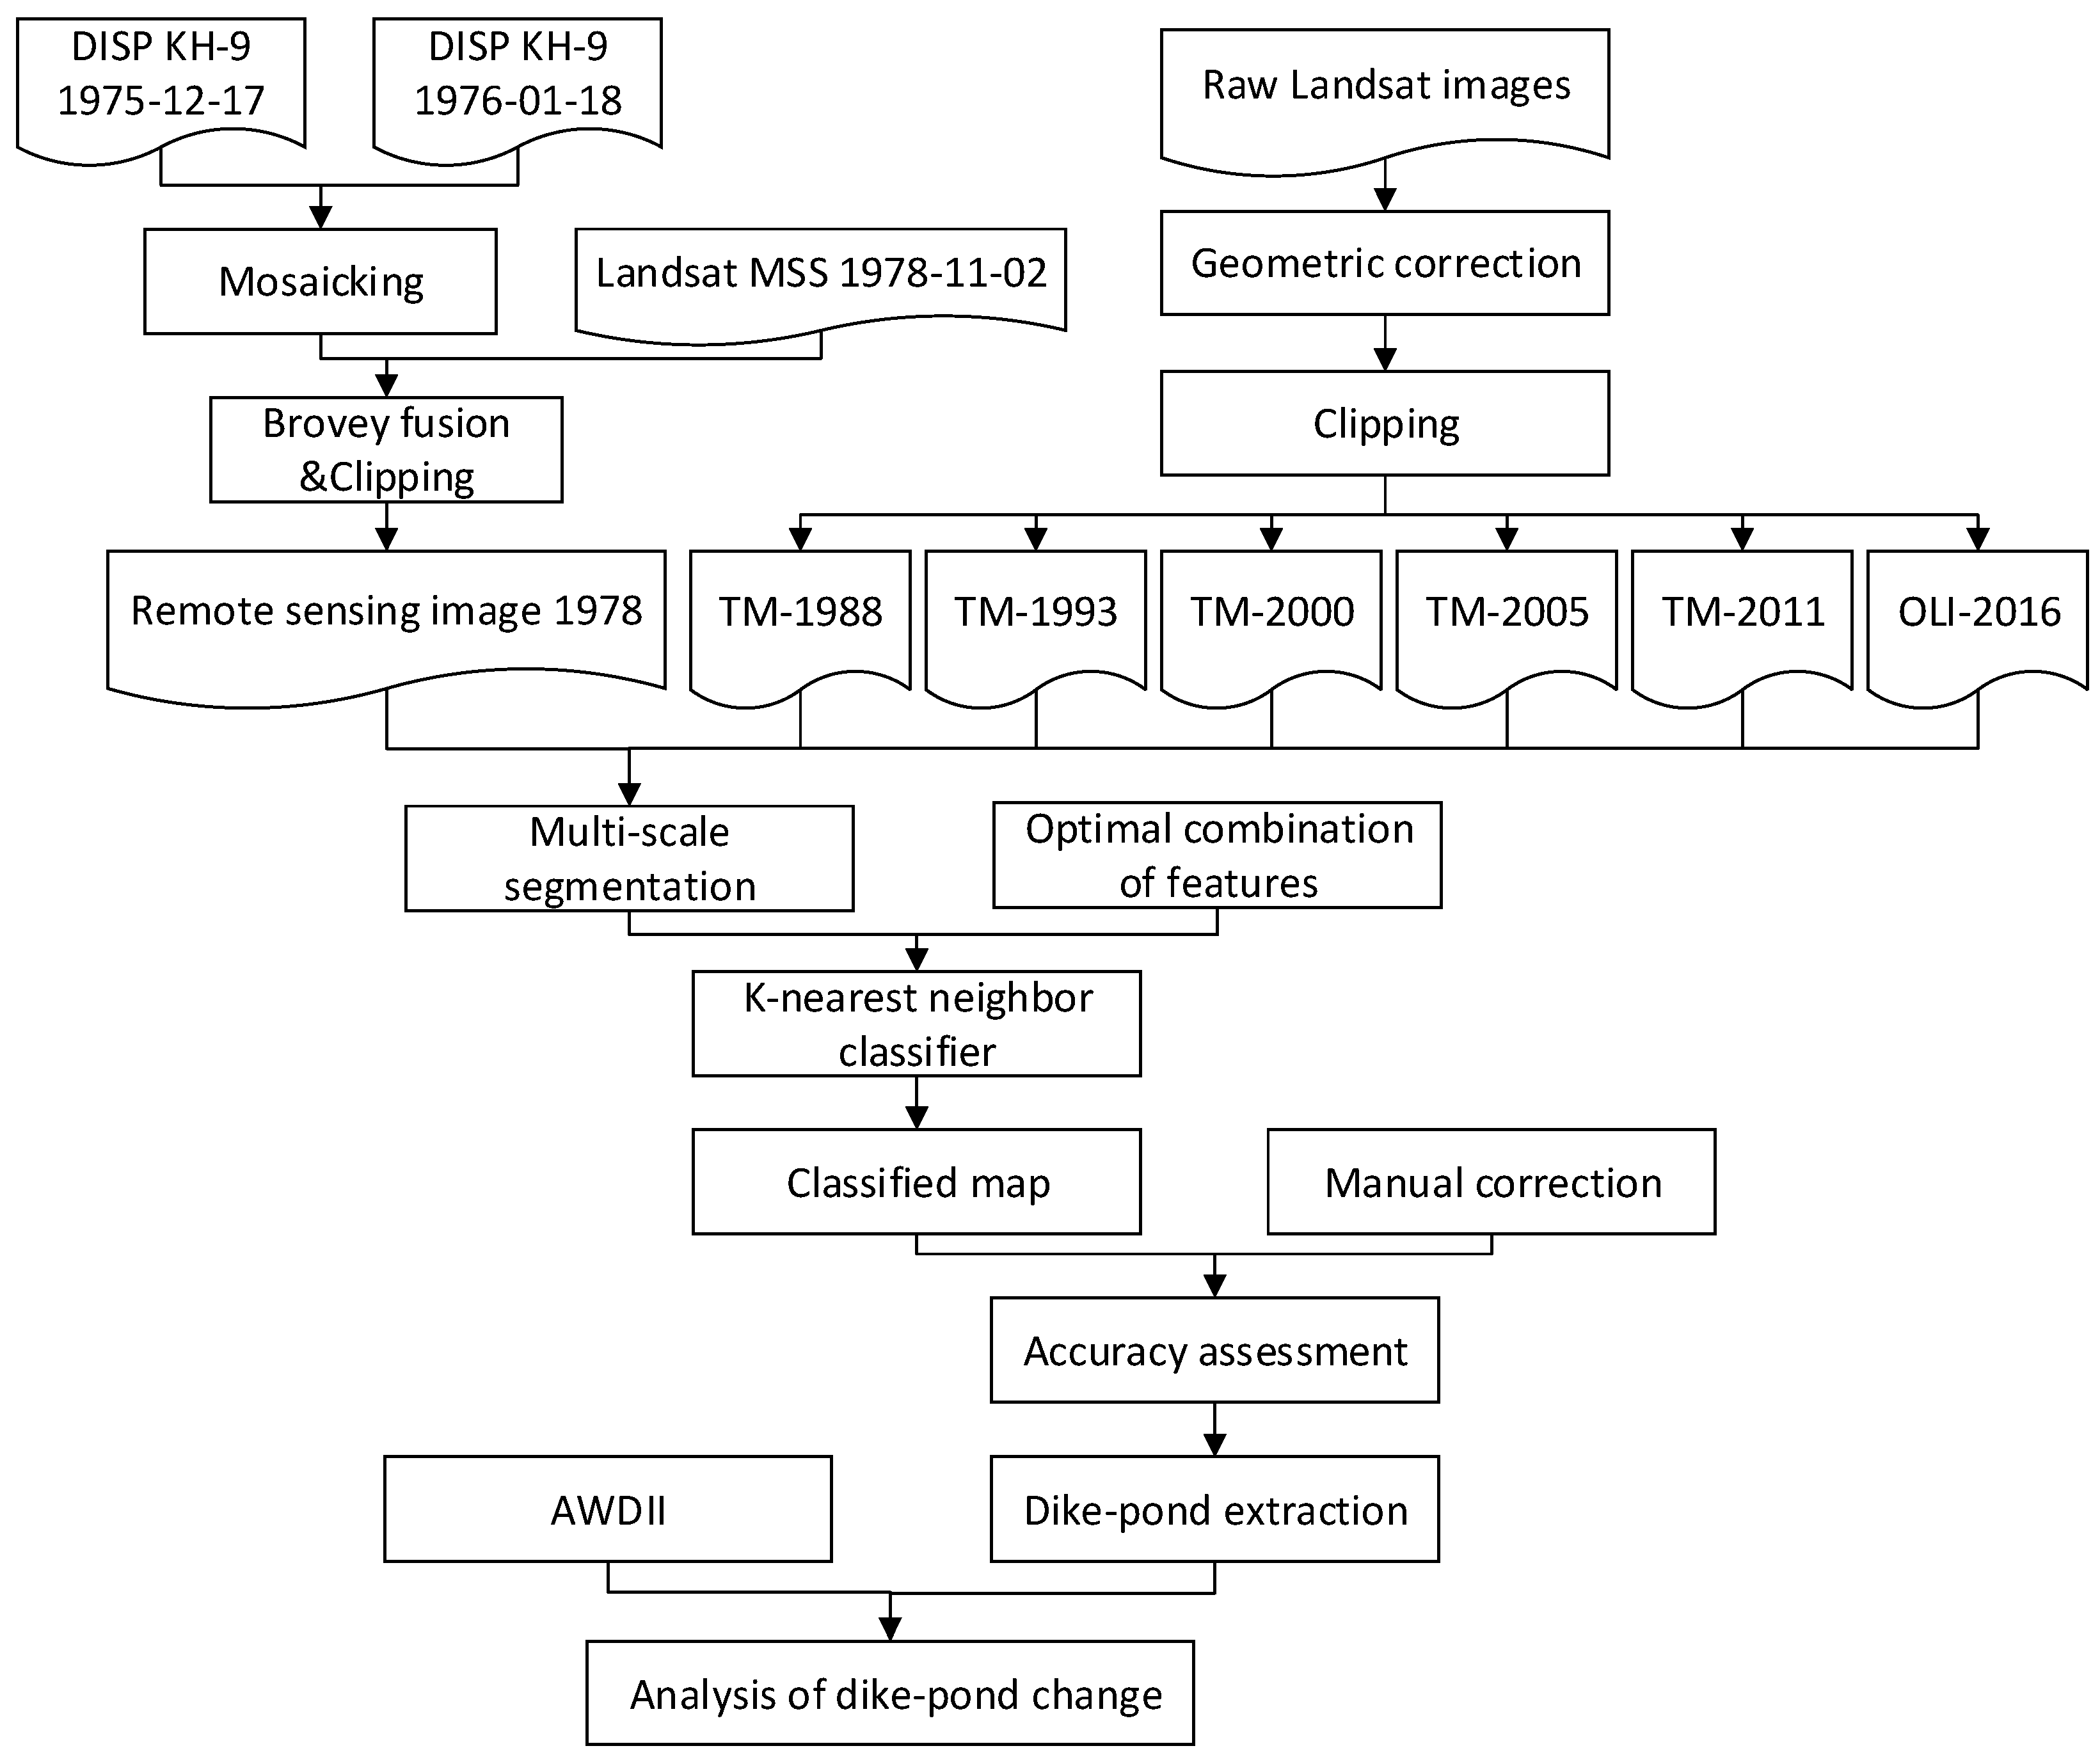
Figure 2 shows the workflow of the image pre-processing, classification, and analysis.
2.4. AWDII
The landscape expansion index (LEI) was proposed to identify three types of urban expansion, i.e., infilling type, edge-expansion type, and outlying type to analyze the dynamic changes of two or more temporal phases of landscape patterns [56]. At present, the LEI is usually applied to spatial patterns and process descriptions of construction land expansion [51,57,58]; however, it is difficult to use them to determine dynamical changes of landscape patterns that contain wetlands because they mostly fluctuate rather than present a single trend. In addition to the proposed definition and quantification index LEI [59], we also propose a landscape invasion index (LII) that can be used for cases where a certain land type invades another land type, and which can describe the spatial pattern and extent of the invasion within a specific stage. The LII can be calculated using Equation (1):
where is the original patch area, and Ai is the area of patch occupied by a certain landscape adjacent to the original patch. When A0 = 0, there is no original patch adjacent to the invading patch. At that time, LII = 1, that is, it belongs to the outlying invasion type. When Ai = 0, LII = −1, and the original patch does not invade any other landscape. When LII is between −1 and 1, the invasion mode is the edge-invasion type.
This study considers dike-ponds as the sole wetland research object. Therefore, the area weighted dike-pond invasion index (AWDII) is proposed, which can be calculated using Equation (2):
where is the LII of the invading patch i, n is the total number of patches in the invaded landscape, is the area of the invading patch i, and A is the total invaded area of the landscape. According to Equation (1), the value range of LII is [−1, 1], which implies that the range of AWDII is also [−1, 1]. The larger AWDII is, the larger the area of the invading dike-pond is relative to the original dike-pond area is, or in other terms, the more severely the dike-pond is being invaded.
3. Results
3.1. Land Use Classification Results and Accuracy Analysis
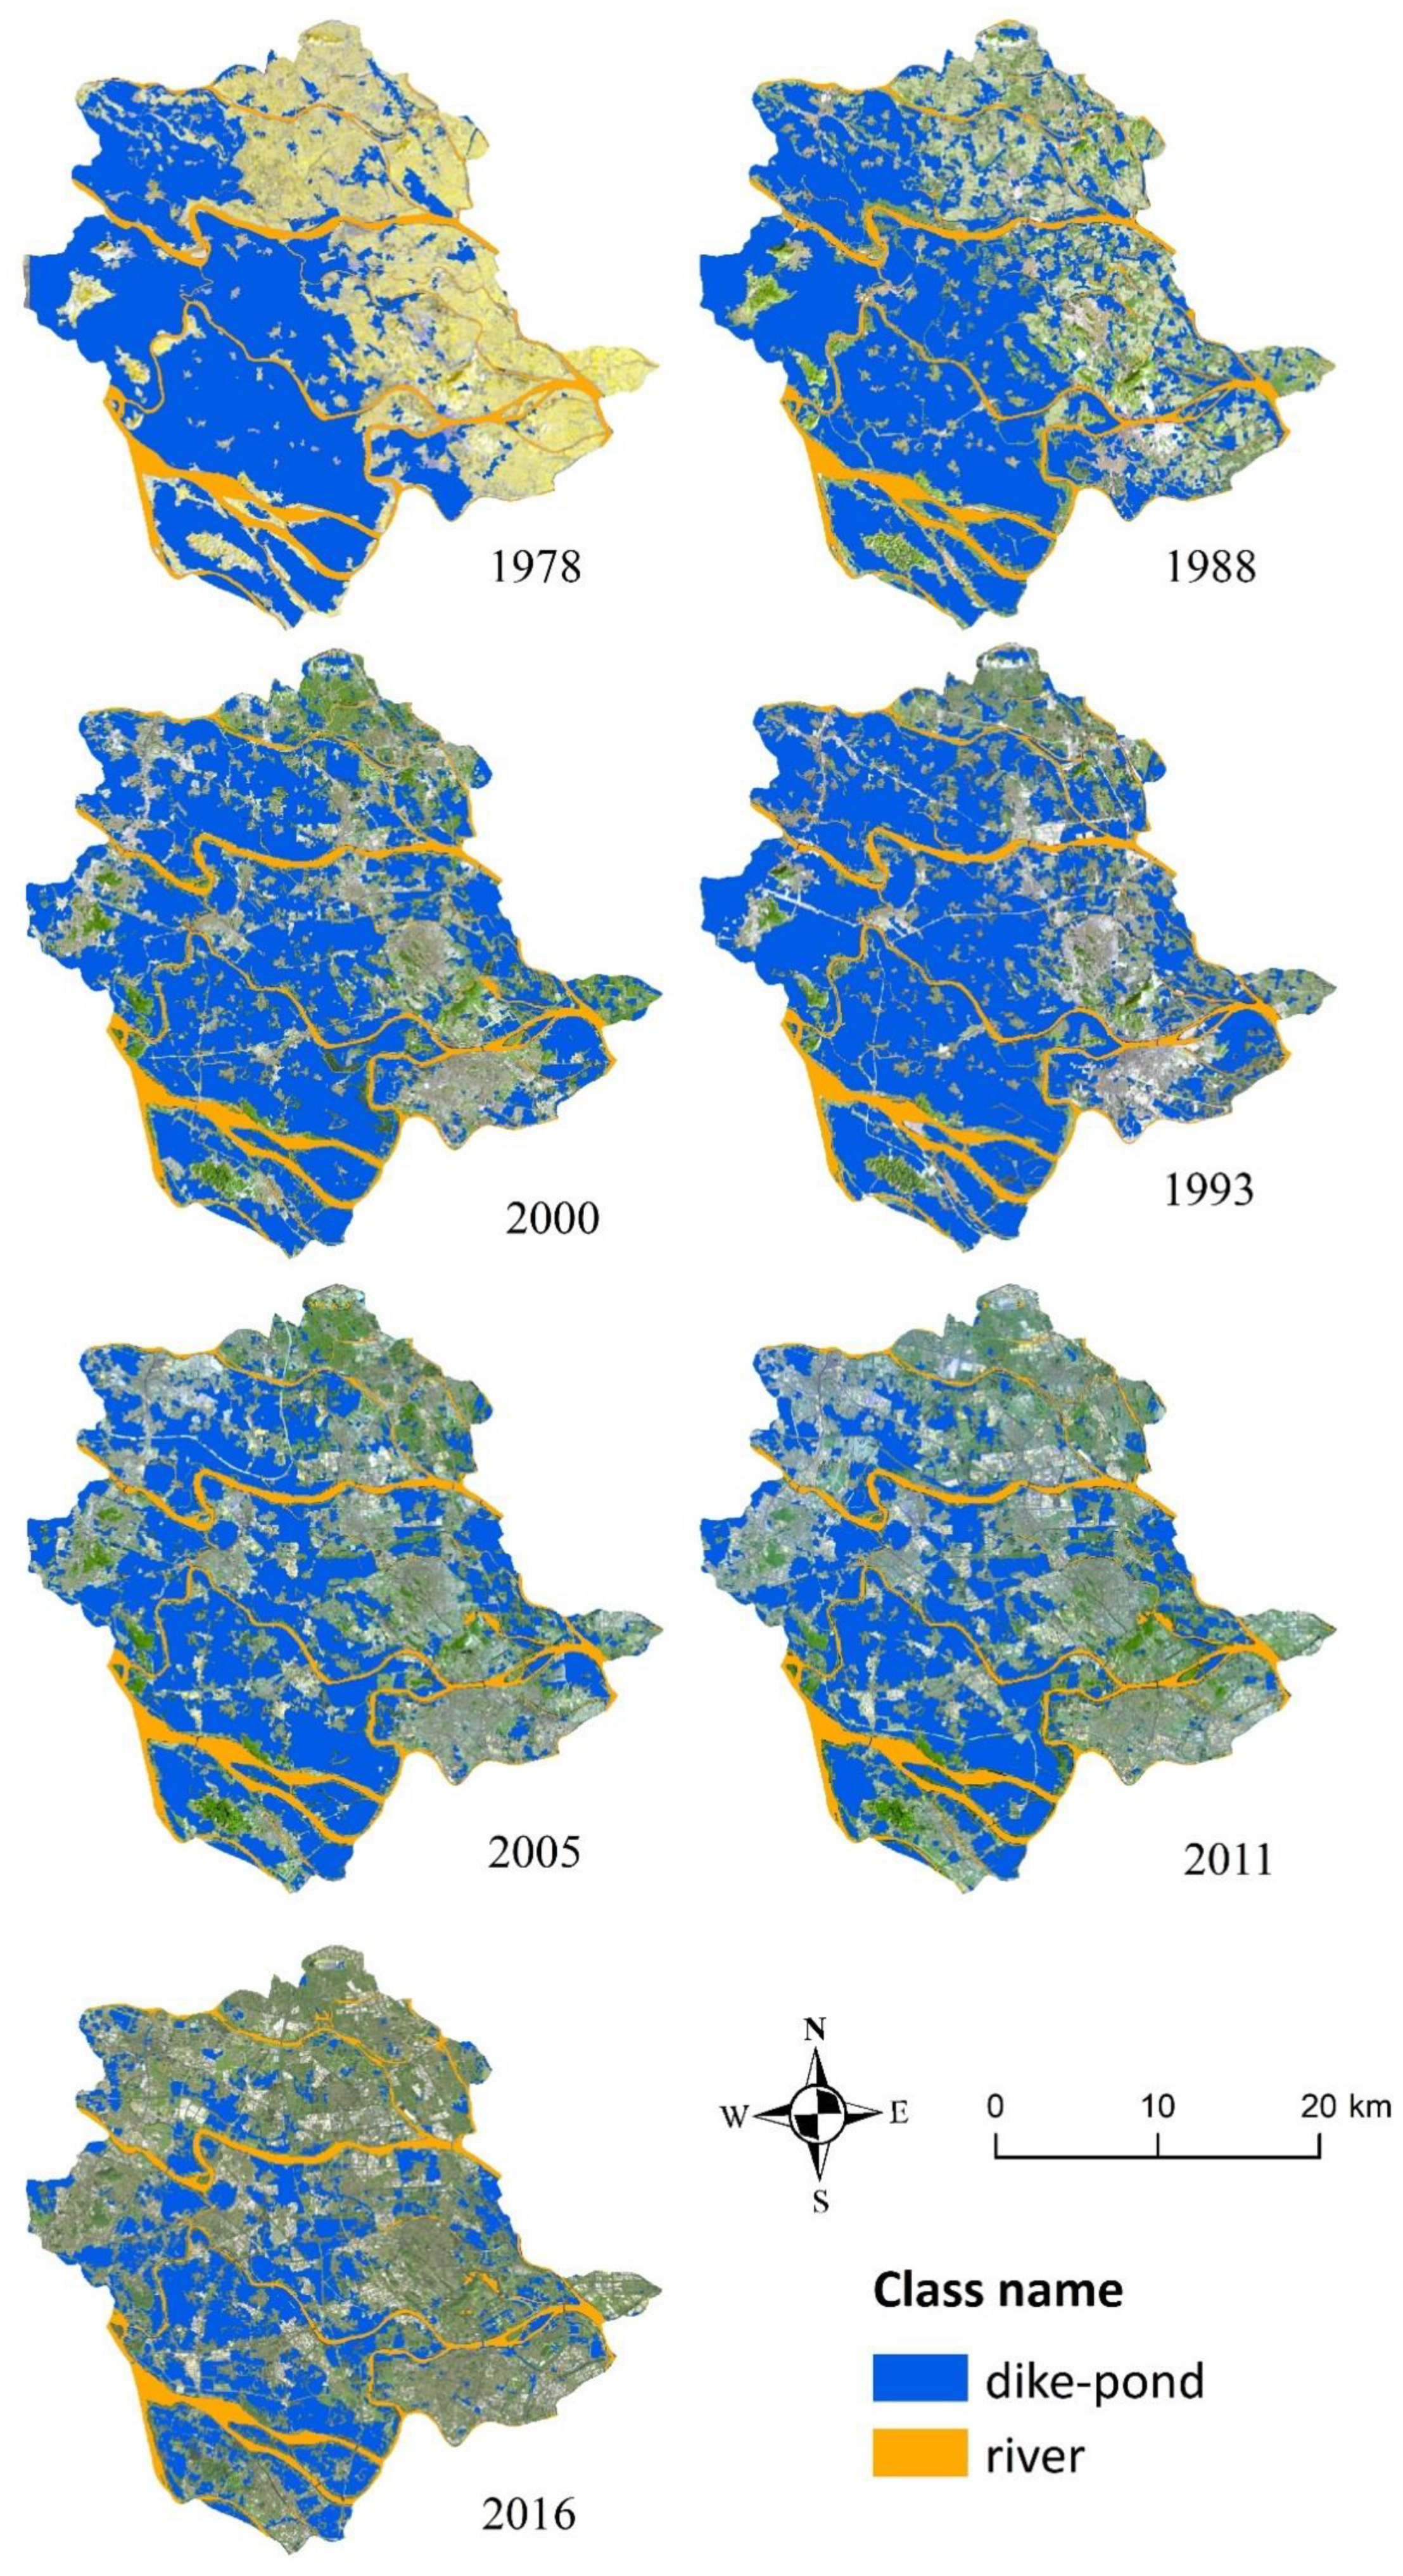
To analyze the land use distribution in Shunde, five land use types were identified including built-up areas, cultivated lands, dike-ponds, forests, and rivers. Figure 3 shows the superposition of an RS image with the results of the dike-pond extraction, which illustrates the distribution of the main research objects of this paper in each chosen period. The results of the seven periods (1978, 1988, 1993, 2000, 2005, 2011, and 2016) indicate that the total area of dike-ponds in 2016 was significantly reduced and more fragmented compared with 1978, i.e., after approximately 40 years of development. Comparing the classification results from 1978 to 2016, the trends of the dike-pond distribution changes were qualitatively obtained.
The dike-ponds extended from West to East between 1978 and 1988. In 1978, the dike-ponds were mainly in the Western, Central, and Southern regions of Shunde District, which were continuously distributed and densely packed. In 1988, the dike-ponds in these areas stayed constant and some began to appear in the Eastern parts of Shunde District, though overall they have a more scattered distribution. The distribution changed little from 1988 to 1993. Compared to1988, the dike-ponds in the Wstern, Central, and Southern regions remained lumped and densely distributed in 1993, while those in Eastern regions were scattered and distributed relatively compactly. Locally, the conversion to other land use types from dike-ponds and the contrary circumstances simultaneously existed. The fragmentation of dike-ponds in the Western and Central regions increased significantly between 1993 and 2000. The contiguousness of the dike-ponds in Shunde District was broken in 2000, where the largest changes occurred in the Western and Northern parts. It can be observed from the image from 2000 that these changes are mainly due to urban land expansion that occupied regions previously populated by dike-ponds. The land changes in the Central and Southern areas were relatively small, and they still contained the most concentrated distributions within the entire study area.
The changing trends of dike-pond distribution were basically the same both from 2000 to 2005 and from 2005 to 2011, that is, the distribution range of dike-ponds continued to shrink and the degree of fragmentation increased. Since 2000, the contiguous area of the dike-pond landscape in Shunde District was broken by other types of land use, and its area declined year by year. Dike-ponds in the Western, North-Central, and Eastern regions experienced the largest changes. By 2011, they were only sporadically distributed in these areas. In the South and South-Central parts, dike-ponds also shrank and the degree of fragmentation increased. However, compared with other regions, they were still more densely distributed, and became the main areas of dike-pond occurrence. The distribution pattern of dike-ponds has not changed substantially from 2011 to 2016, although its total area has further decreased due to invading, built-up areas. Throughout the whole study area, the fragmentation of dike-ponds became more obvious, especially in the Northwest and Eastern regions. Dike-ponds remained tightly spaced along the river networks, but were sparsely distributed in the Northern and Southern parts of Shunde. As of 2016, the total area of dike-ponds was less than one third of the entire study area.
The classification results were assessed by randomly collecting a certain number of sample objects, i.e., various types of ground objects, to determine the overall classification accuracy and global Kappa coefficient for each period from 1978 to 2016 (Table 4). Error matrix calculation information is shown in Appendix A. The results show that the overall accuracy of the RS image classifications during the seven periods from 1978 to 2016 is higher than 89%, and the Kappa coefficient is more than 0.86. The high classification accuracy demonstrates that the use of object-oriented methods and artificially assisted corrections to classify images can improve the classification efficiency compared with pure manual interpretation, and ensure the reliability of the classification results.
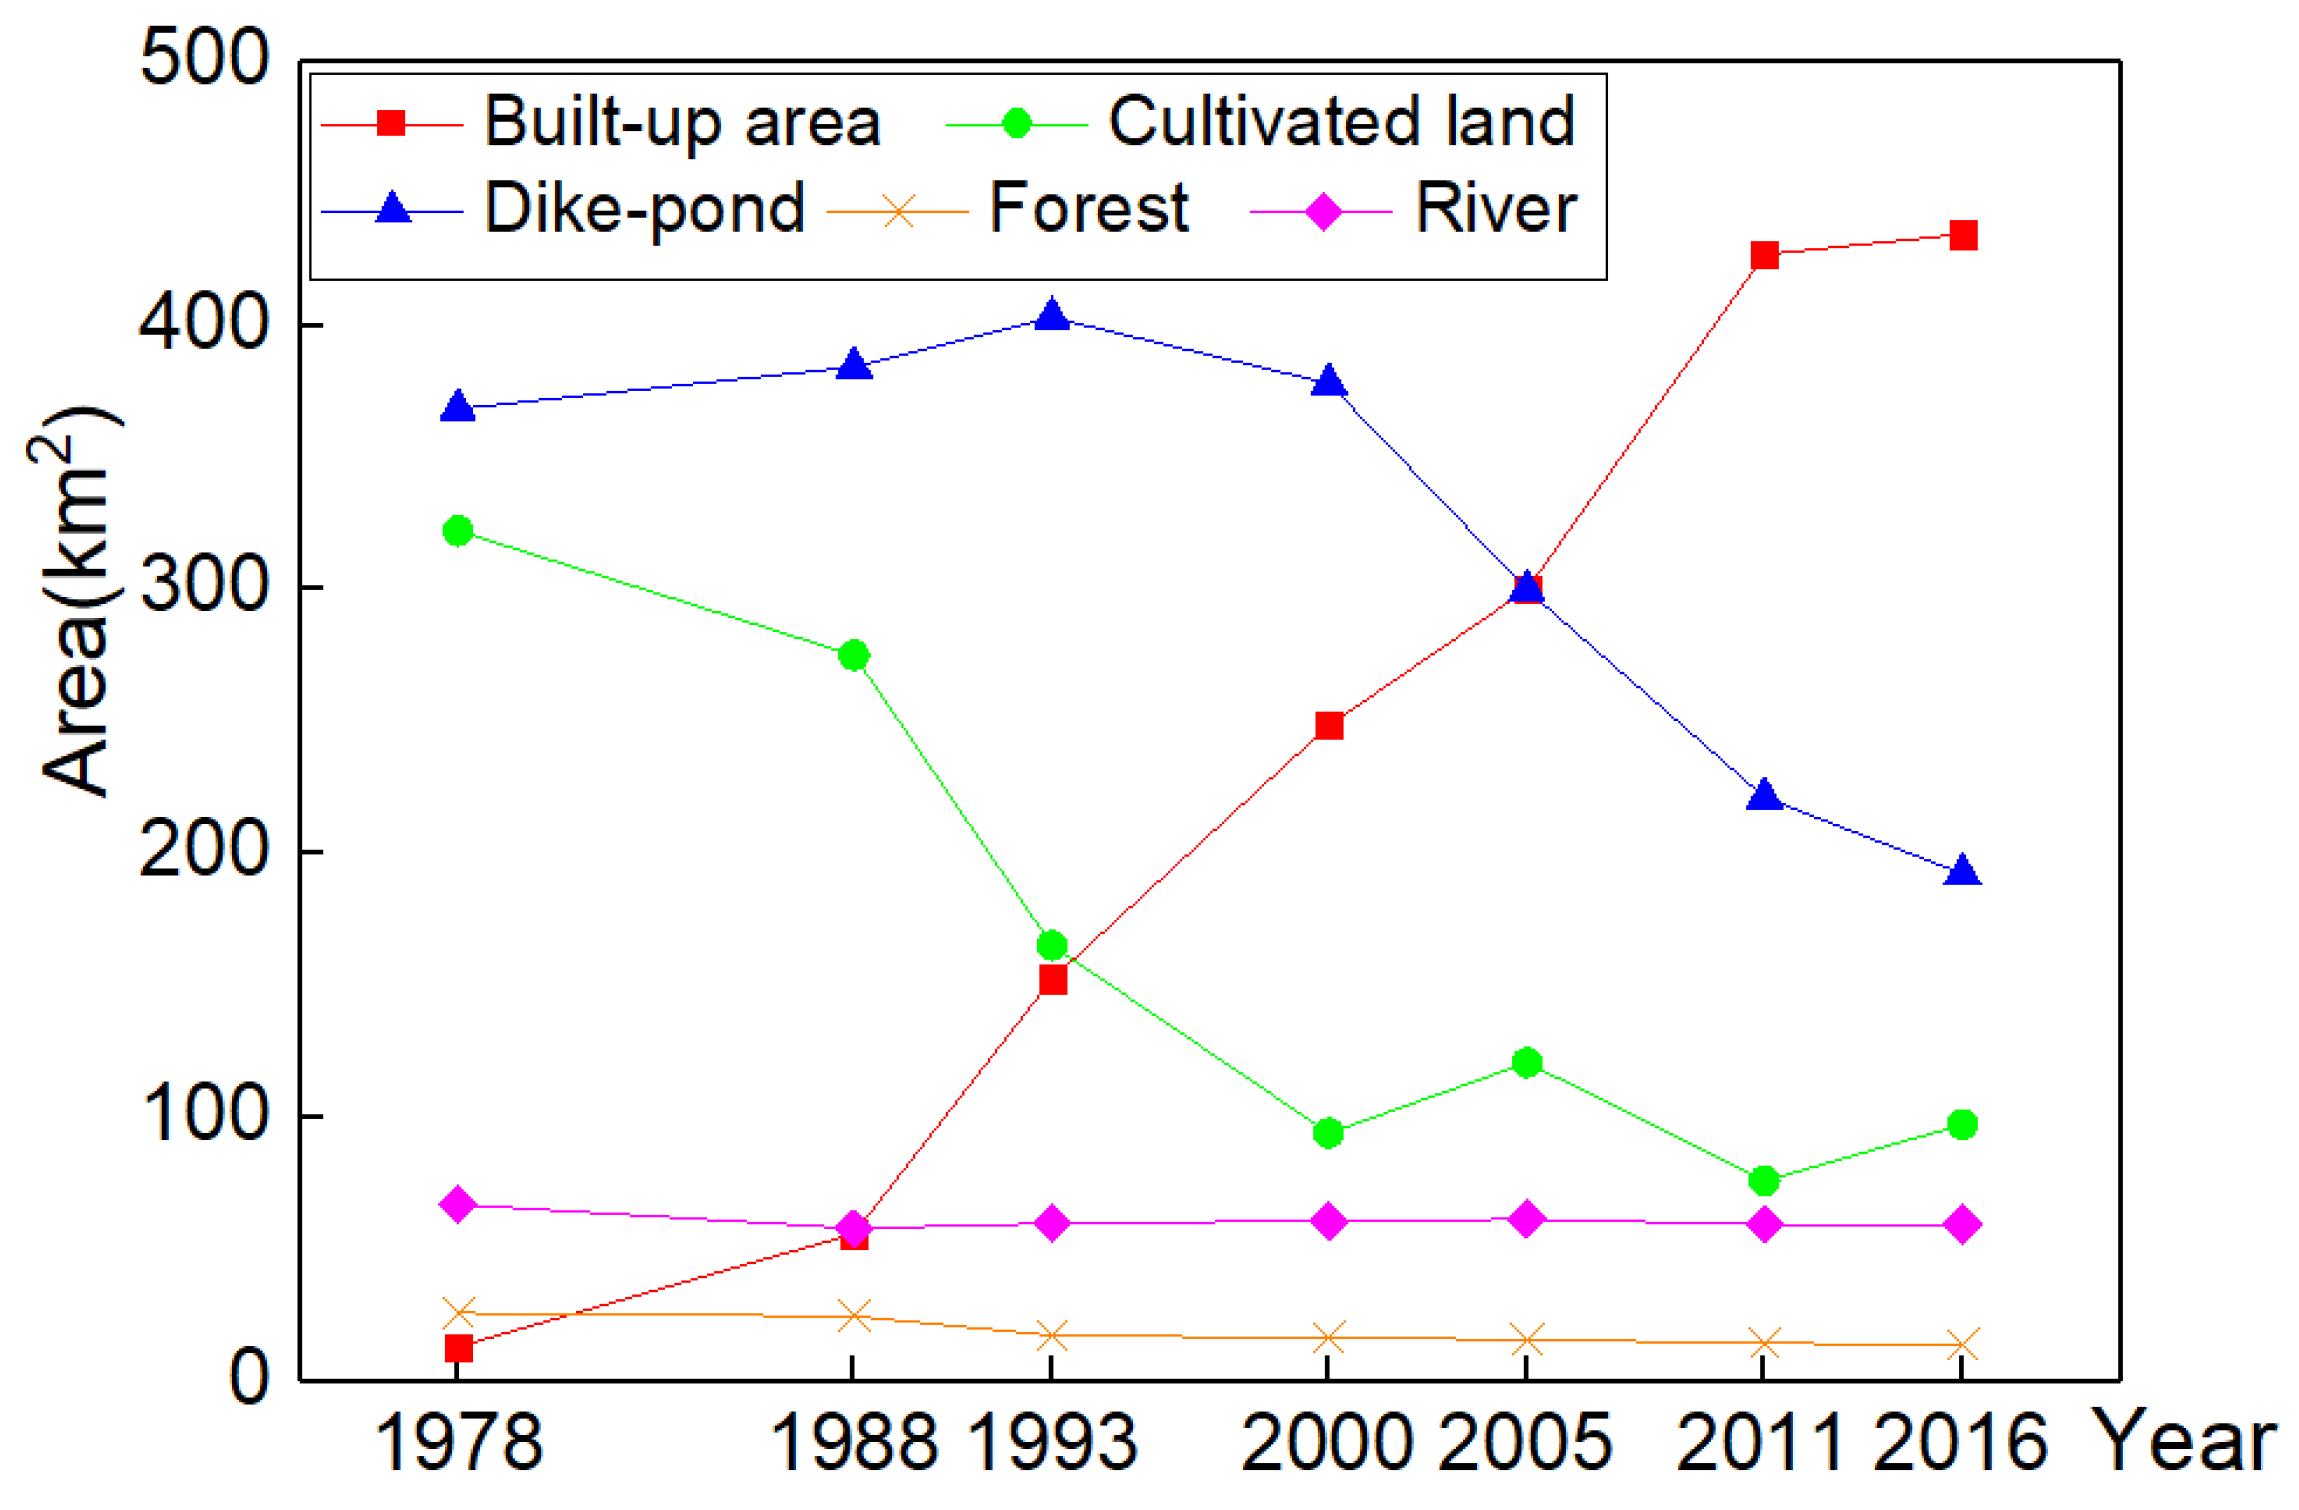
RS images from the seven periods from 1978 to 2016 were taken to calculate the area of each land use type and their relative proportion to the total area. The changes in land use over the past 38 years are given in Figure 4. Between 1978 and 2000, the area of dike-pond wetlands dominated all land use types in the study area, with an area ratio of over 45% and a maximum of 50%. The area of dike-pond wetlands increased first, reaching a peak in 1993, and then decreased, to become the second most prevalent land use type after 2000. Between 1978 and 1993, the proportion of cultivated land in the study area was in the second most dominant type, while the combined cultivated land plus dike-ponds in the area was more than 70%, which reached a peak of 86.62% in 1978. This reflects the dominant agricultural economy before the 1990’s in Shunde.
Over the past 38 years, the number of built-up areas in Shunde District has continued to increase, and it became the most prevalent land use type in the whole study area in 2005, accounting for 54.43% of the total area in 2016. The steady declining trend of forests reflect their increasing level of exploitation, while the area of rivers stayed stable at around 7.5% over the last 38 years. Since the area of forests and rivers was much smaller than the other land types, the absolute value of their area change was not very considerable. It can be observed from Figure 4 that the total area of forests and rivers remained relatively steady during the four-decade period.
3.2. Dike-Pond Trends
Next, we took the towns of Shunde District as land use units. With the land use classification results acquired for the seven periods from 1978 to 2016, information pertaining to the administrative scope of each town in Shunde District was obtained so that the distribution of dike-ponds in each town could be extracted. We calculated the area of dike-ponds in each town and their proportion of the overall dike-pond area in the district, which were also compared and analyzed for the different periods.
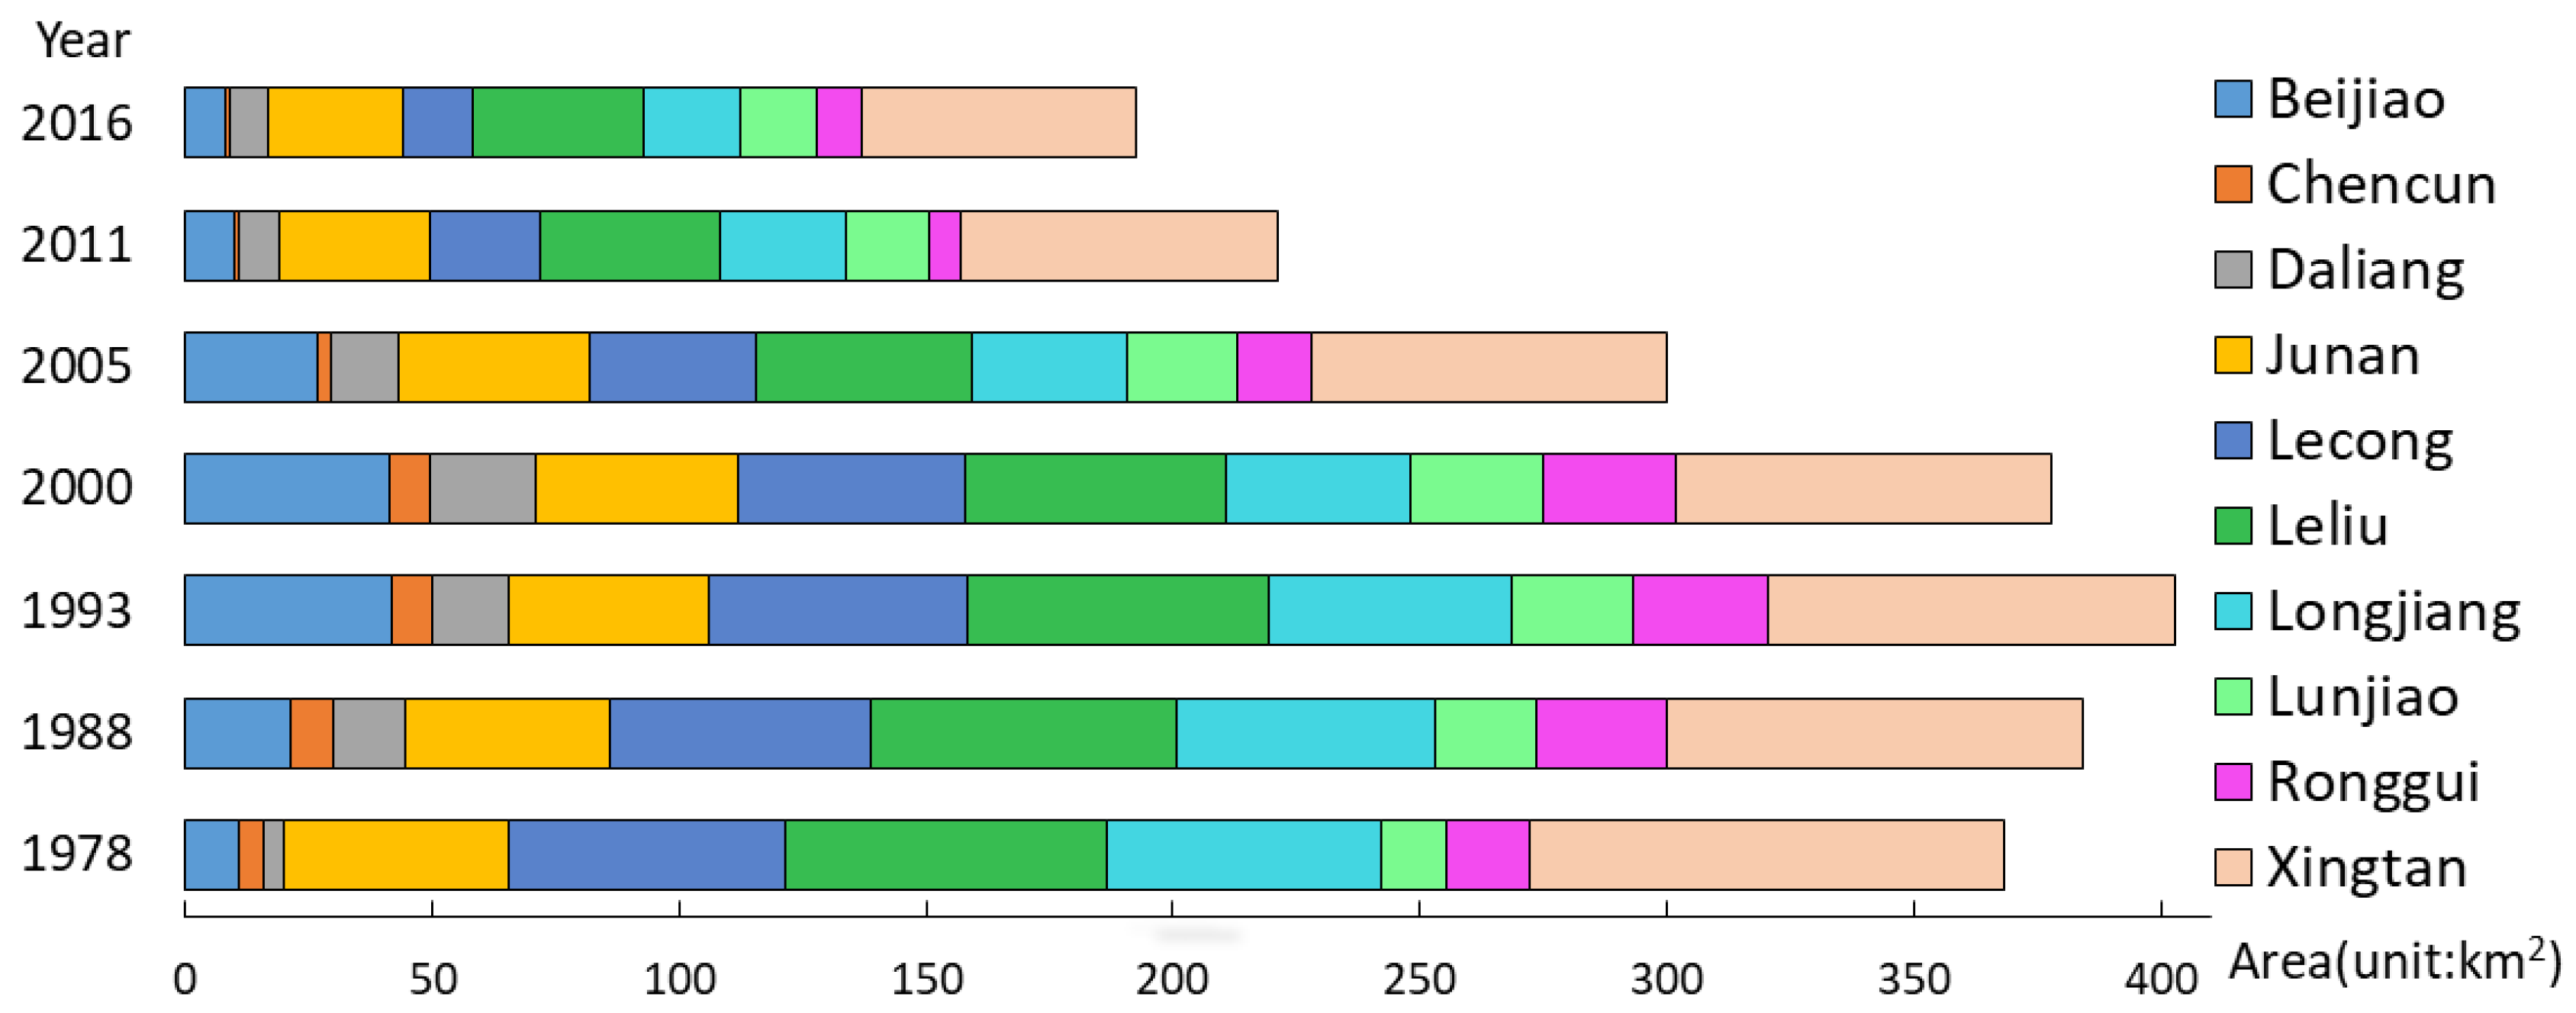
Figure 5 shows the relative dike-pond areas of all towns in each period. From 1978 to 2016, the dike-pond areas of Xingtan and Leliu are ranked first and second, respectively, among the 10 towns. The area of dike-ponds in Xingtan accounts for more than 20% of the total area of dike-ponds in the study area, while the proportion in Leliu were above 14%, where both decreased first and then increased, and which were accompanied by fluctuations in their relative proportions. Xingtan and the Leliu, which are located in the Southwest and Central part of Shunde, respectively, were within the main distribution area of dike-ponds in the overall scale analysis. Over the past 38 years, the area of dike-ponds in Chencun ranged from 0.86 to 8.51 km2, which is relatively small compared with other towns. It accounts for less than 3% of the total area of dike-ponds in Shunde and as low as 0.4% in 2011. Chencun is located in the Northern part of Shunde, and it has fewer areas compared with other towns. After 2000, the area of dike-ponds in each town showed a downward trend except for Ronggui, where its dike-pond area in 2016 was higher than that in 2011.
In can be concluded that the dike-pond distribution in the different towns was asymmetric according to the spatial analysis. Xingtan and Leliu in Shunde District contain the largest dike-pond areas, while Chencun has the smallest dike-pond area between 1978 and 2016.
We have shown here the difference between the dike-pond proportions of each town. In 1978, the dike-pond proportions of Xingtan and Longjiang were larger than the other towns, and were similar at 78.94% and 78.99%, respectively. In the process of extracting the dike-ponds, the spatial resolution and spectral characteristics of the images inevitably affected the accuracy of the classification results. Therefore, a difference of 0.05% in the dike-pond area proportion of Xingtan and Longjiang in 1978 can be neglected, and are hence considered to be approximately equal.
During the period from 1978 to 1988, the dike-pond area proportions of Xingtan and Longjiang were both more than 70%, and ranked in the top two. In 1993, the dike-pond proportion of Lecong began to surpass Longjiang and Xingtan, and was ranked first in Shunde. However, it fell down slightly to 60.49% followed after Xingtan with a decline of 2%. After 2000, the dike-pond proportion in Xingtan stayed the highest, though its proportion gradually decreased, and it was seen that Lecong and Junan were ranked second in 2000 and 2005, respectively. Leliu remained the second highest proportion after 2005. From our results, we predict that Xingtan might be the town with the largest proportion of dike-ponds in the near future.
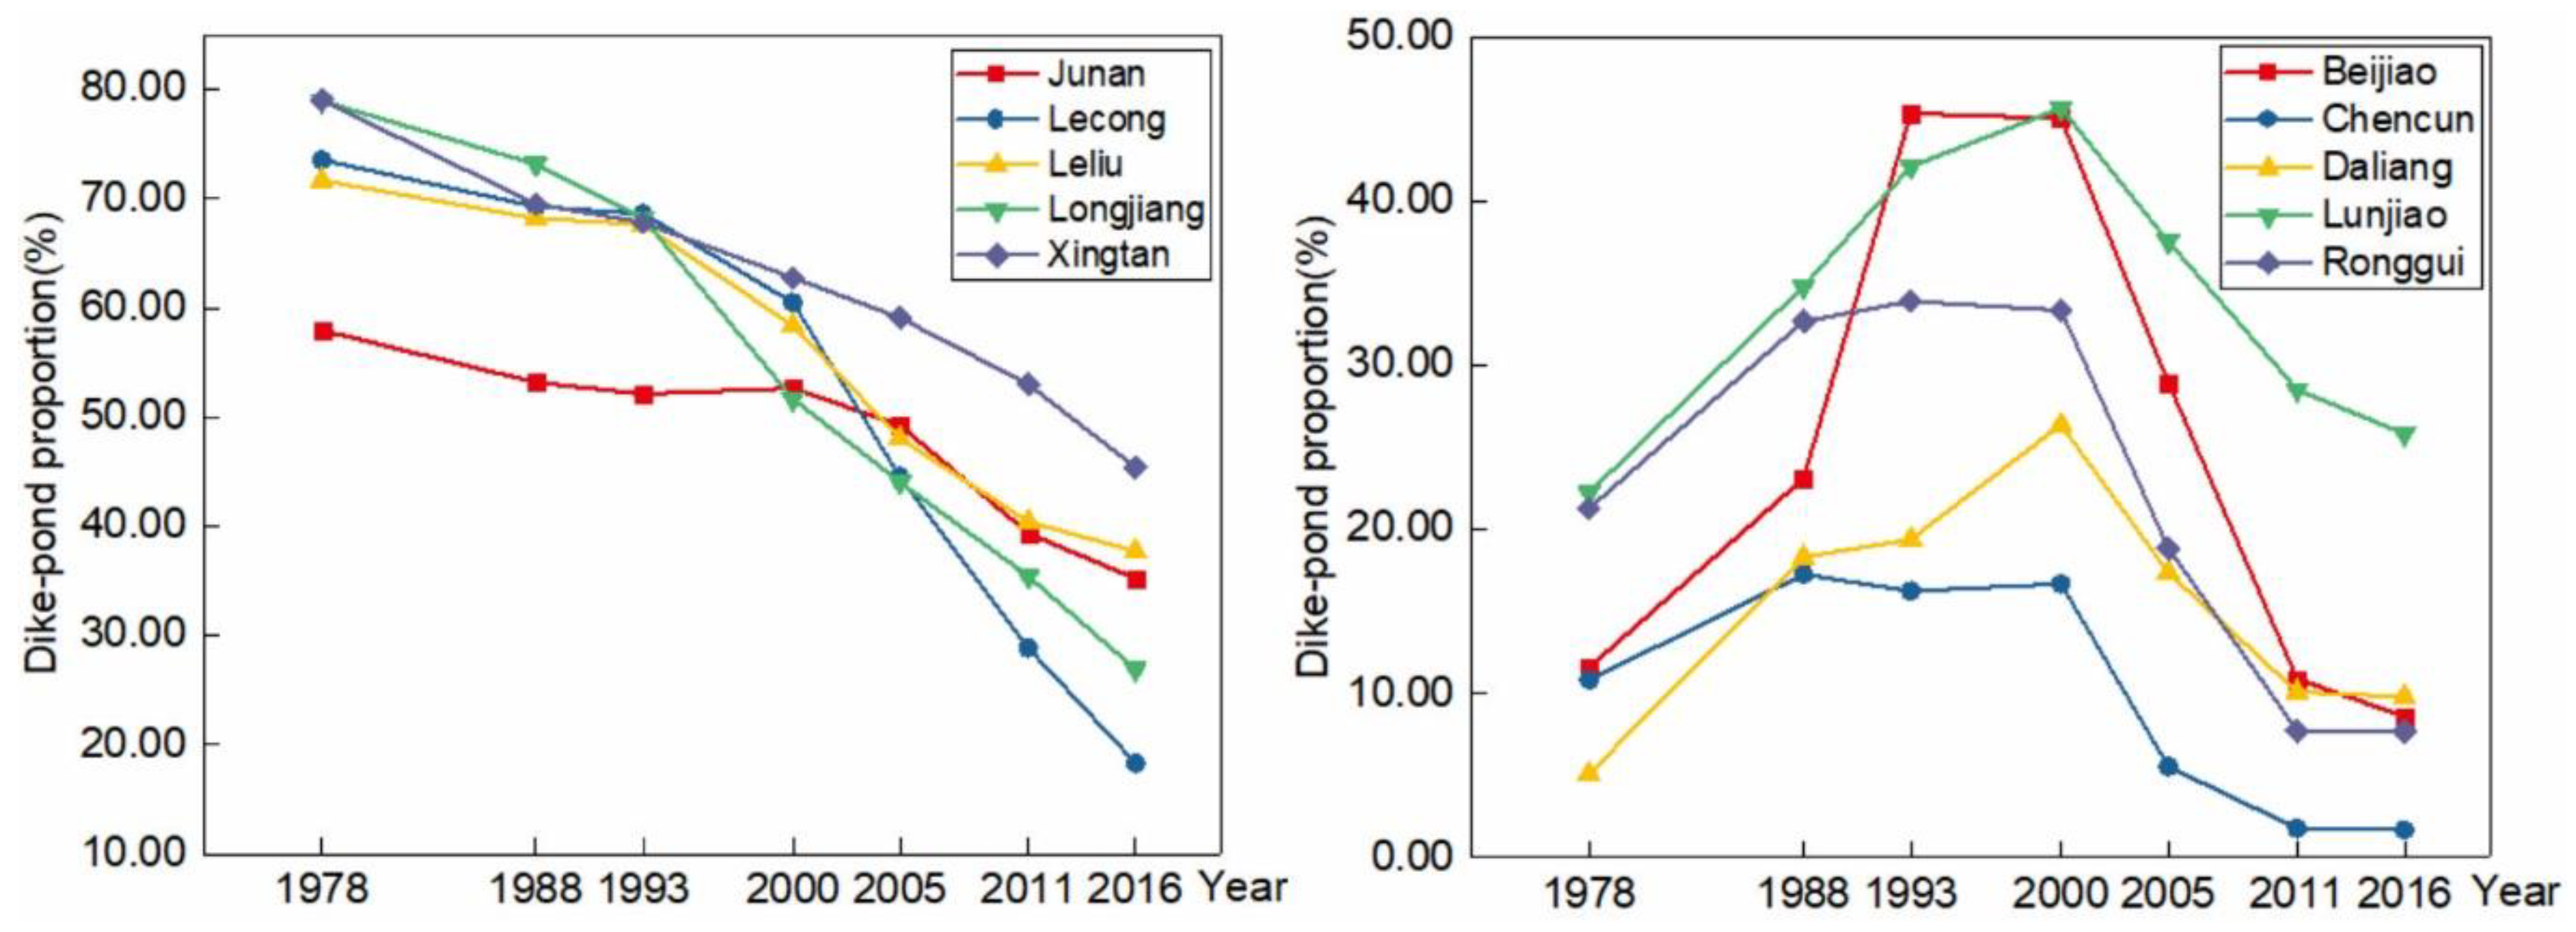
According to the above analysis, it can be summarized that the dike-pond area proportion of each town has changed in two ways over the past 38 years. The 10 towns were divided into two types with Class A, the proportion of which continuously decreased, and Class B, the proportion of which increased first and then decreased. The different trends are shown in Figure 6.
Based on the statistical data of dike-pond area in each town, the year (i.e., time) was used as the independent variable (x) and the dike-pond area was the dependent variable (y, unit: km2). Linear and quadratic polynomial functions were constructed to fit the evolution trends of the two types for the 10 towns, as classified in Table 5.
Each function fitting result had a high correlation coefficient, R2, (0.79 ≤ R2 ≤ 0.98), which was used to evaluate how well each function could effectively reflect the dike-pond area changes in each town. The dike-pond area proportion of the Class A towns decreased with different curvatures, in which Junan had the smallest curvature and Lecong had the largest. We can see from Figure 6 that the deceleration rate of dike-pond areas in each period was not the same. Among the five fitting curves, Xingtan has the highest degree of fitting, indicating that it decreased at a more uniform rate. As for the Class B towns, the rate of increase and decrease of the dike-pond areas in a given town was inconsistent from 1978 to 2016, and there was also a difference in the rates of decline between different towns. The curve of Beijiao was more symmetrical, that is, the rates of increase and decrease were both relatively consistent. Daliang and Lunjiao had similar increase and decrease rates. Comparatively, the dike-pond areas in Ronggui fell faster than those in Chencun.
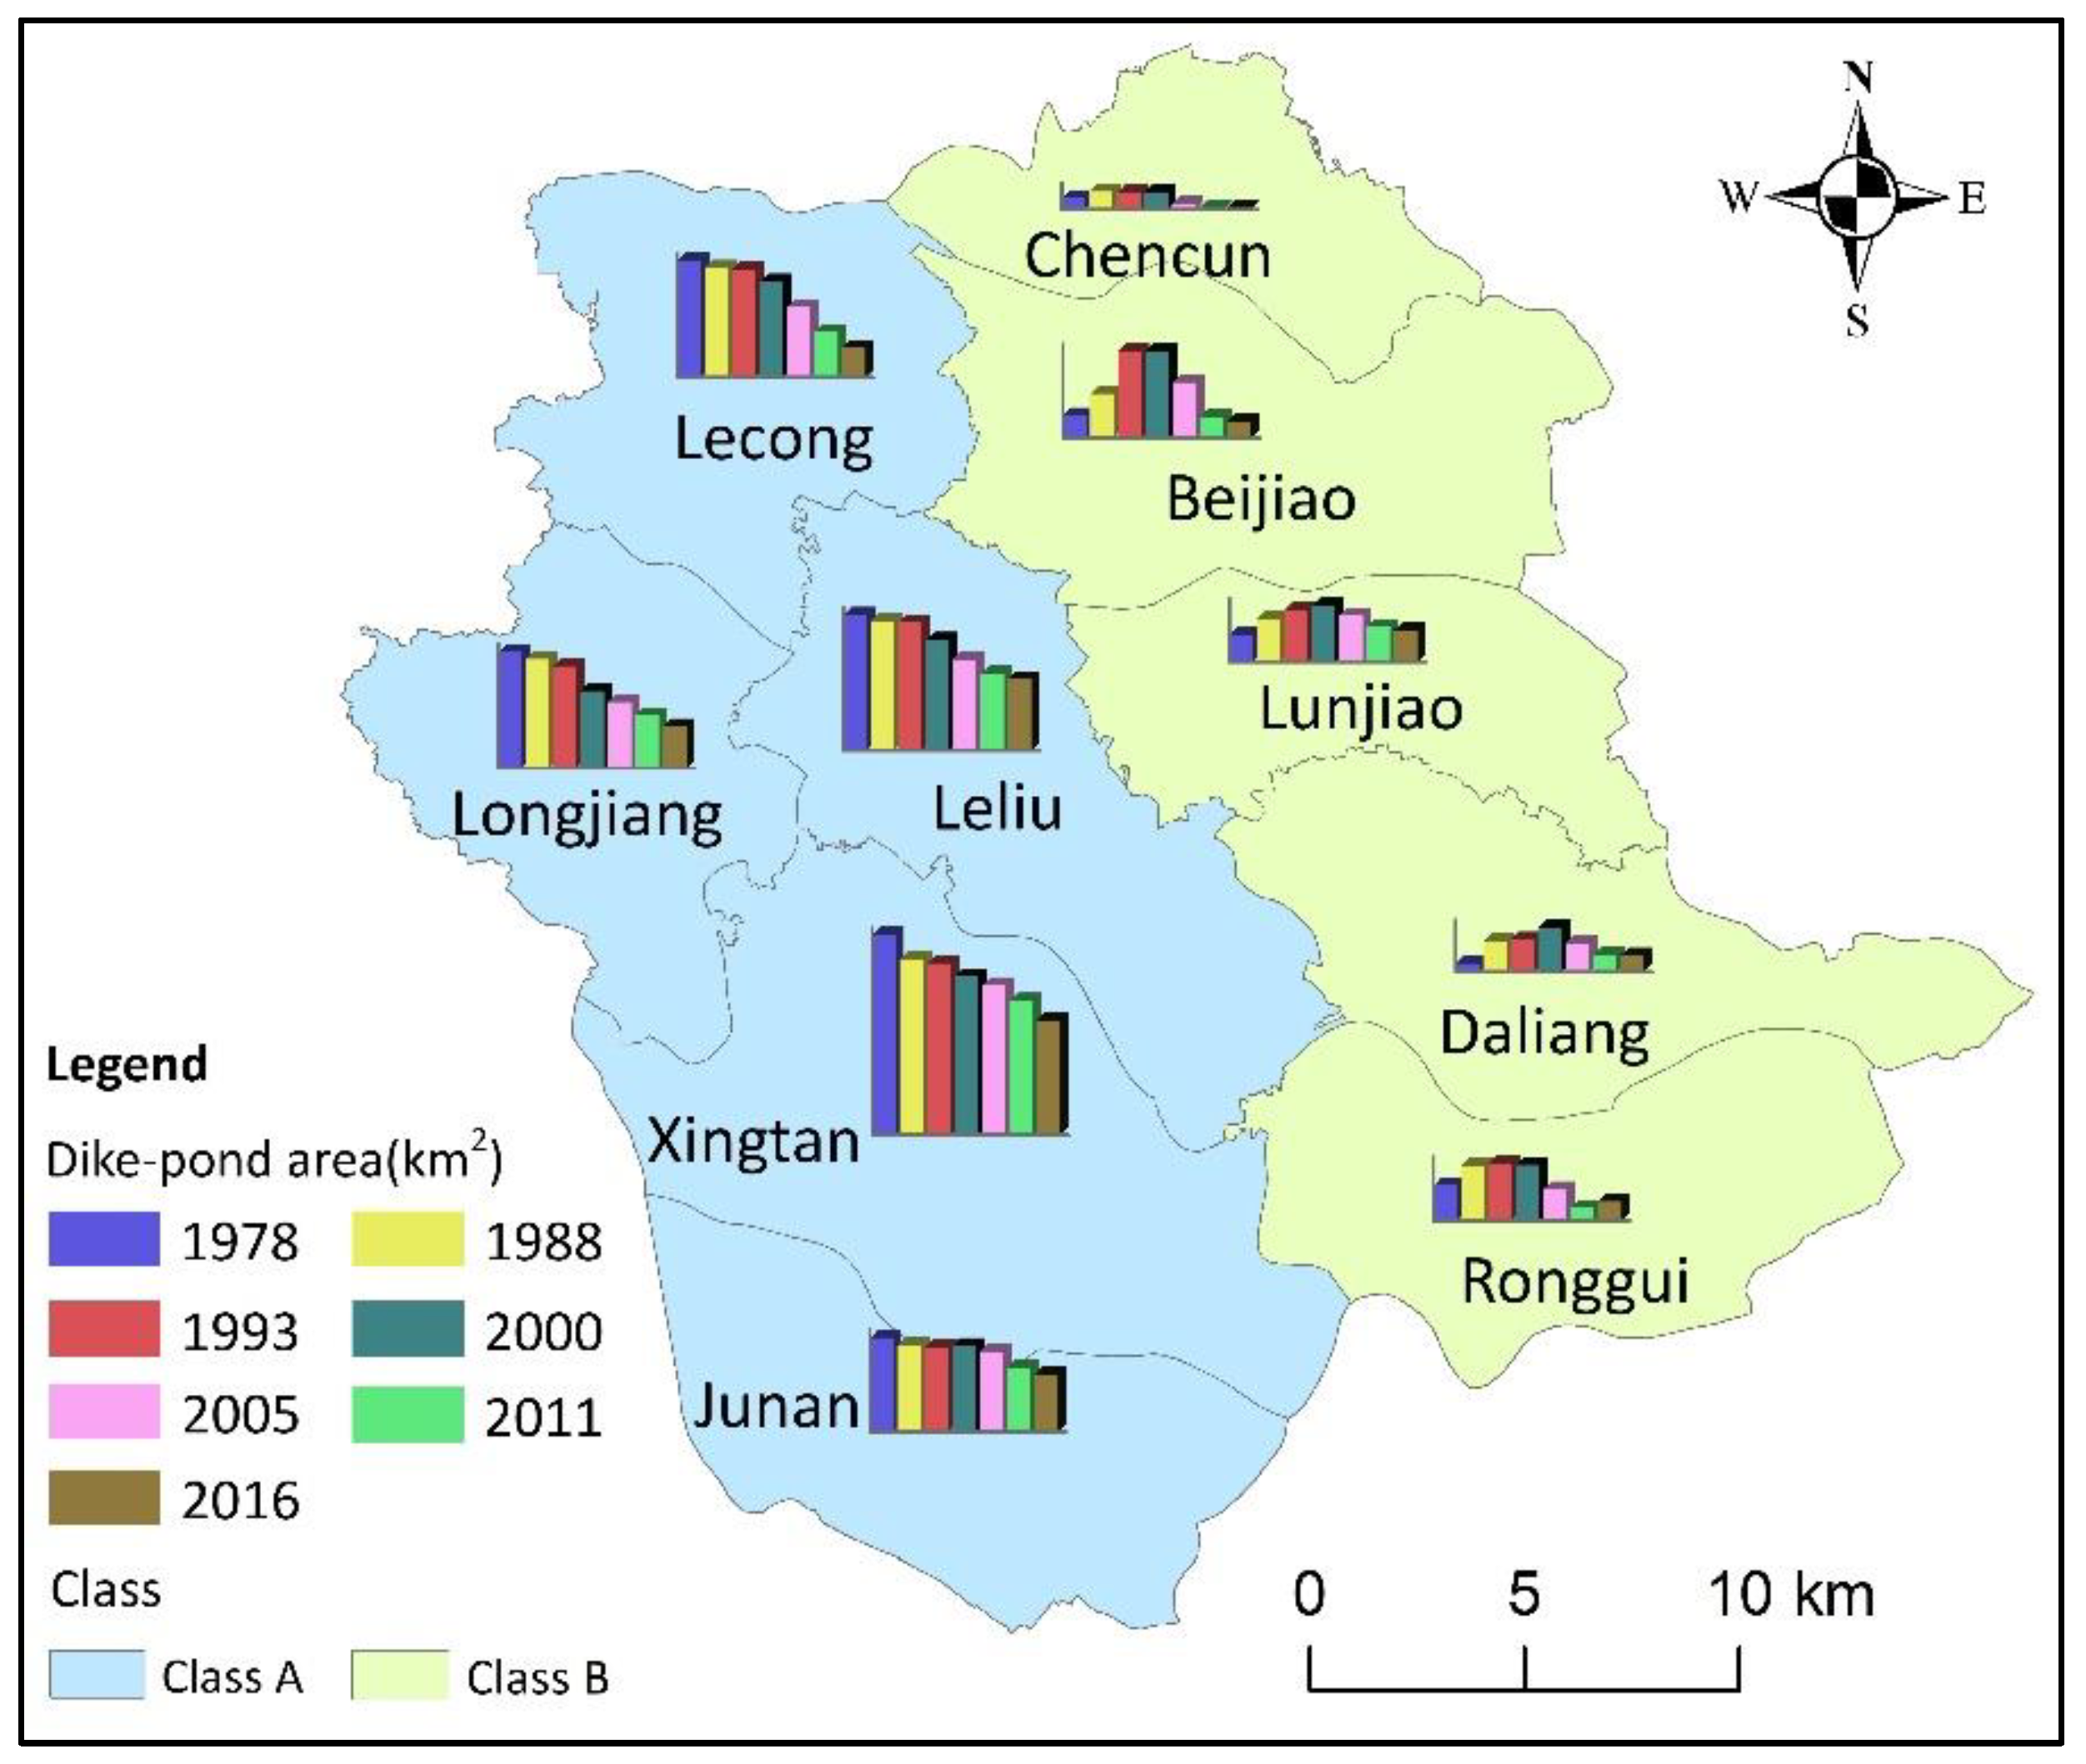
We marked two types of towns on the map of Shunde District (Figure 7) based on the data in Figure 5. This figure shows that the two types have obvious spatial differences, where Class A towns are located in Western, Central and Southern parts, and Class B towns are located in the East and North of Shunde. A combination of the spatial distribution map and the statistical data of the dike-pond area proportion in each town quantitatively reflect the evolution processes of the spatial distribution patterns of dike-ponds in Shunde. From 1978 to 2016, the dike-ponds were mainly distributed in the Western, Central and Southern regions, and they spread to the East and North between 1978 and 2000. After 2000, the dike-pond area in the Eastern and Northern parts decreased at a faster rate, but the dike-pond area proportion in the Northeast gradually returned to the historical level of 1978.
3.3. Invasion Evaluation of Dike-Pond
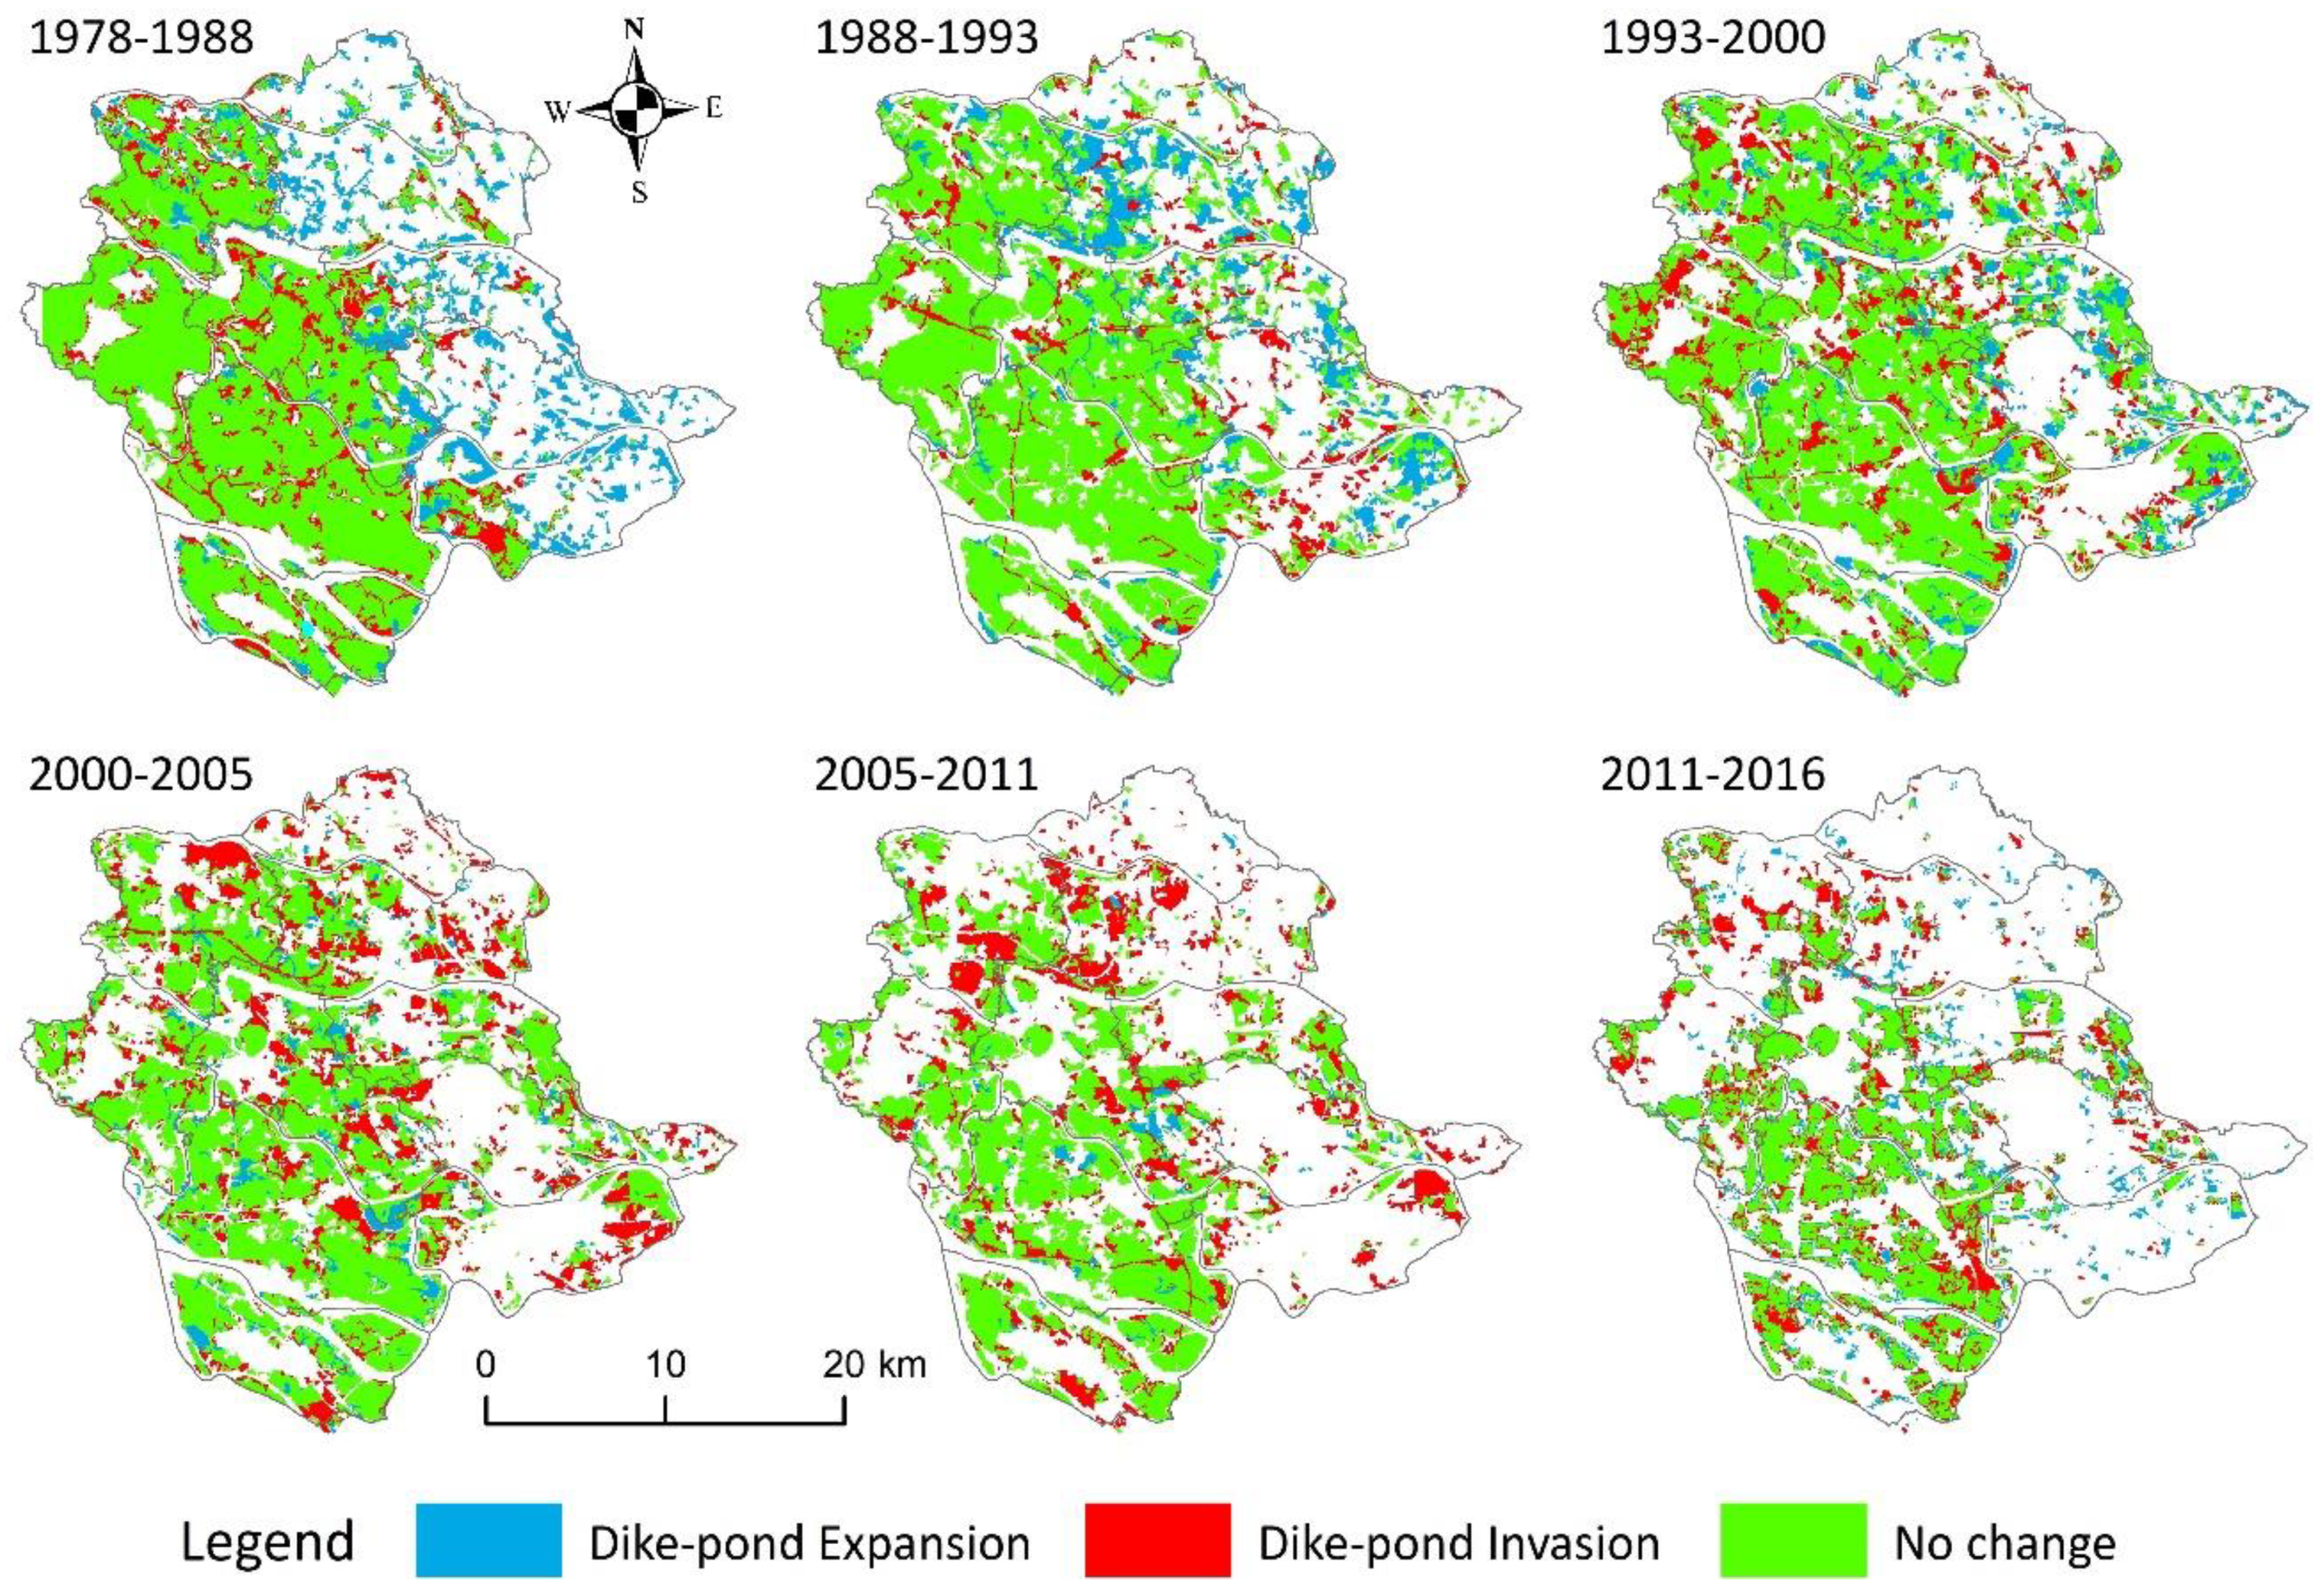
In this study, we used the AWDII to measure the spatial pattern and extent of dike-ponds being invaded by other land use types in each period. By overlaying and analyzing the conversion of dike-ponds and non-dike-ponds between different years, the transformation of dike-pond areas in each period was obtained (Figure 8). We first calculated the LII values of each patch, and then determined the AWDII of each area, which was used to evaluate the amount of invasion experienced by dike-ponds in each region (Table 6).
Between 1978 and 1993, the AWDII of Shunde District was −1, illustrating Shunde District was not invaded during this period. Among the towns, the AWDII values of Beijiao, Daliang, Lunjiao, and Ronggui remained at −1, and it could also be observed from Figure 8 that the area of these four towns kept increasing. Xingtan and Longjiang had the largest AWDIIs in 1978–1988 and 1988–1993, respectively, showing that they had experienced serious dike-pond invasion compared to the other towns.
During 1993–2005, the AWDII values of Shunde District rose from −0.871 to −0.439, mainly due to extensive reclamation of land and urban development. Dike-ponds began to be invaded by other land types, and the protection of dike-ponds was not as good as before. Between 1993 and 2000, Lecong and Leliu were occupied more densely than the other towns. After 2000, Chencun was the most seriously invaded, the AWDII of which reached to −0.2, followed by Ronggui (−0.395) and Daliang (−0.492).
The situation of expropriation of dike-ponds in 2005–2011 was slightly better than that in 2000–2005, but the invasion degree was larger. Among the ten towns, Chencun was occupied most heavily, the AWDII value of which was as high as −0.191, followed by Beijiao (−0.232) and Ronggui (−0.258).
Up to 2016, the ecological environment caused by the dike-pond invasion by other land types had attracted the public’s eye, following the development of modernization. In recent years, the situation of dike-pond invasion has improved compared with previous periods. However, it can be clearly concluded that dike-ponds in Lecong, Longjiang and Beijiao were still invaded in spite of the control. There was obvious protection for Ronggui and Chencun on account of the low AWDII values. On the whole, the dike-ponds in Shunde District experienced steady development, rapid invasion and a gradual reduction of invasion in the period from 1978 to 2016.
3.4. Comparison of Typical Dike-Pond Trends
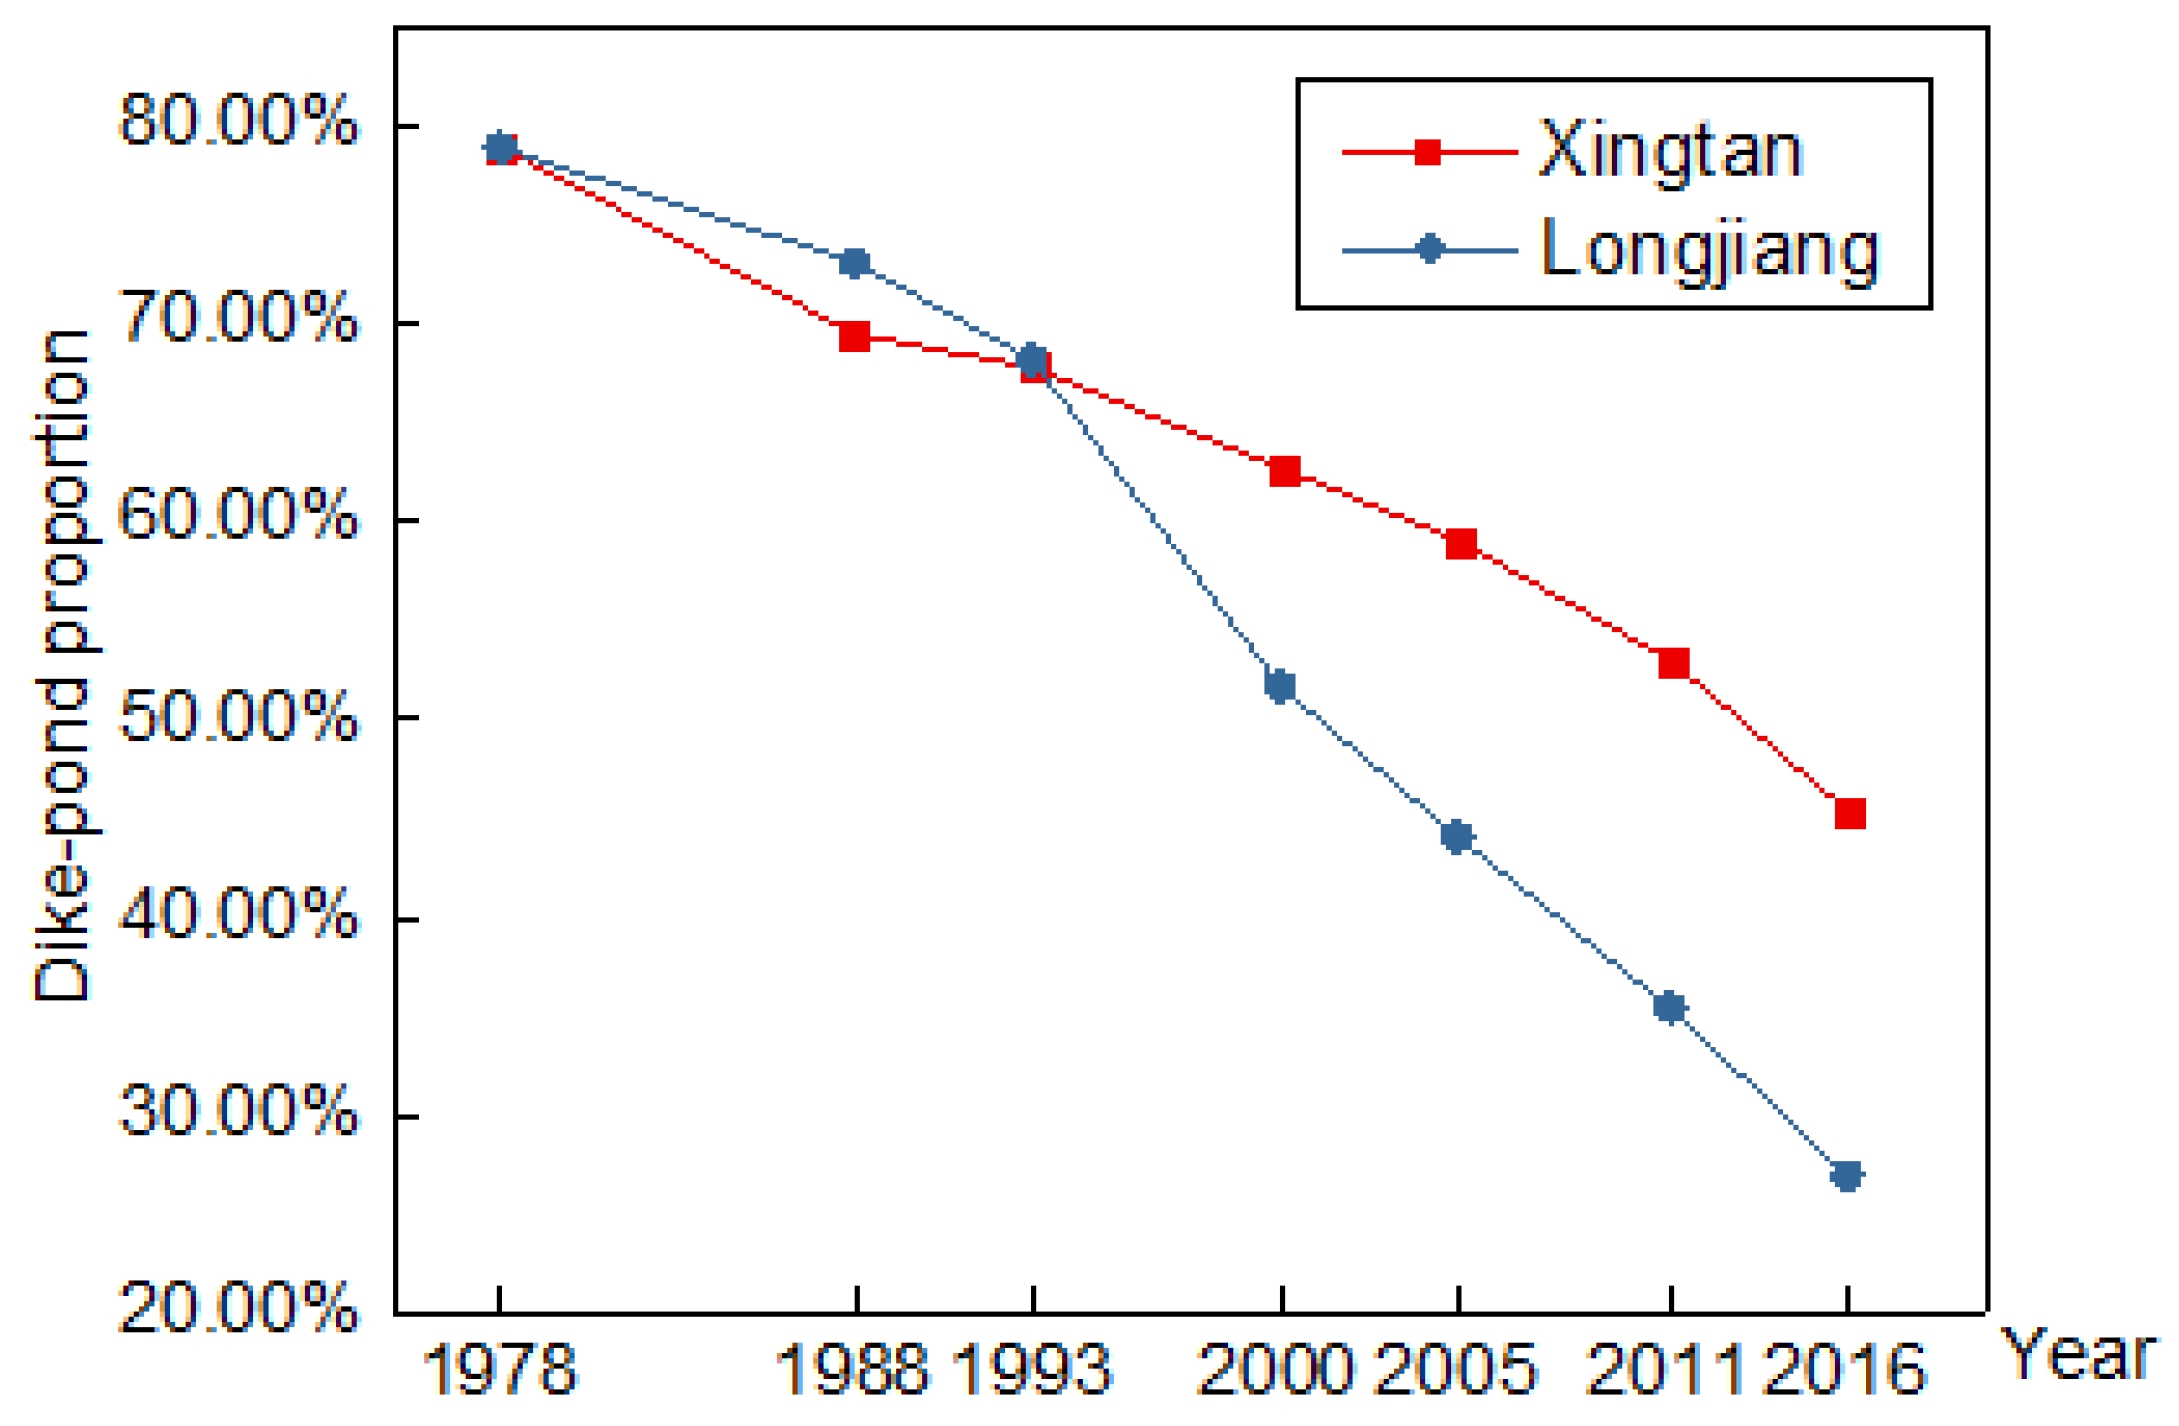
Two specific examples with different dike-pond evolutions were selected to describe their concrete changes. Figure 9 shows the changes in the dike-pond proportion of Xingtan and Longjiang (relative to the total area of the town) during the period from 1978 to 2016. As mentioned previously, in 1978, the proportions in Xingtan and Longjiang were 78.99% and 78.94%, respectively, which could be considered as them having the same starting point of their evolutionary trends. After approximately 40 years of development, the distribution scope in both towns has reduced. In 2016, the proportions in Xingtan and Longjiang decreased to 45.39% and slightly lower than 30%, respectively. The dike-pond change trend curves of the two towns are also displayed in Figure 9, which show that the decreasing trends of the two towns have been quite different since 1978, and especially after 1993, the dike-pond proportion of Longjiang dropped sharply. In contrast, the rate of decline of dike-ponds in Xingtan was relatively slow. Next, let us take 1993 as a boundary point, so that we further analyze two periods (i.e., before and after 1993). From 1978 to 1993, the decreasing trend of dike-pond proportion in both towns were similar, although the proportion in Xingtan was slightly lower than that in Longjiang in 1988. After 1993, the rate of decline in two towns began to diverge greatly. The decreasing rate of dike-pond proportion in Xingtan was scarcely different from that of the previous period, while Longjiang showed a drastic decline with a relatively larger rate from the previous period.
As a result of a Southern tour of the chief architect of reform and opening up to Guangdong Province in 1992, the pace of reform in the Pearl River Delta was accelerated by the major historic event. It could be inferred that the development of dike-ponds in Shunde District was mainly affected by the expansion of urban land use. Therefore, we speculate that Longjiang pushed forward a period of construction and urbanization, which meant that more dike-ponds were occupied by built-up areas after 1993.
Based on the changes of dike-ponds and the other types of land use in Xingtan and Longjiang, the reasons for the differences in their dike-pond evolutions is discussed. Xingtan, a well-known water town in the Pearl River Delta region, is densely intertwined with river networks in the Southwest of Shunde. Dike-ponds used to be the main agricultural form in Xingtan because of their contained fertile land. Since the reform and opening up, Xingtan has paid attention to the adjustment and optimization of agricultural structures while developing industry, where the science and technology industry, ecological agriculture, and water country culture form the three major industrial strategy foci of the town [60]. Table 7 shows the land use changes quantitatively in Xingtan from 1978 to 2016. In 1978, the area of dike-ponds accounted for a large proportion, 79.06%, of the total area of the town, while about 35.60% of the town’s dike-ponds were converted to built-up areas, where only slightly more than half of the dike-ponds were preserved. From 1978 to 2016, dike-ponds, cultivated lands, forests, and rivers were all converted to built-up areas to varying degrees, which increased from 2.01 to 38.69 km2, and accounted for 31.82% of the town’s total area in 2016. Despite the sharp change in dike-ponds and built-up areas, forests and rivers comprised only a little both in terms of area and proportion.
Longjiang is located in western Shunde. It has superior agricultural production conditions, and its river network is dense. When the dike-ponds in the Pearl River Delta emerged in the late Ming Dynasty [61], it also became a typical, and representative, type of argo-ecological model, which resulted in it being a major economic source. After the reform and opening up, Longjiang took manufacturing industry as the main body of economic development, the pillar industries of which include the manufacture of furniture, small household appliances, textiles, food, beverages, plastics, etc.
Table 8 shows the land use changes in Longjiang from 1978 to 2016. During this period, the proportion of dike-ponds in Longjiang decreased dramatically from 78.91% to 27.41% of the total town area. As of 2016, about 56.52% of the dike-pond area in Longjiang has been converted to built-up areas, and only about 33.29% of the dike-ponds have been preserved. While developing industry, Longjiang focused on developing its agriculture in terms of producing high yields, high quality, and high economic efficiency. Therefore, the dike-ponds and livestock breeding have been maintained. Apart from dike-ponds, a large proportion of cultivated lands and forests were converted to built-up areas, which increased from 0.63 to 38.54 km2, which account for a town proportion increase from 0.9% to 54.69%.
To sum up, the dike-pond area proportions of Xingtan and Longjiang both showed decreasing trends from 1978 to 2016, but they declined at very different rates after 1993. The rate of dike-pond curtailment in Xingtan remained steady after 1993, while that in Longjiang performed saliently.
3.5. Relationship between River Network and Dike-Ponds
In the territory of Shunde, several major rivers run through the area, which are a primary means of communication among the ten towns. The influence of the main river on each town can be considered as consistent. Outside the main river, the rivers in Shunde District are densely distributed. They compose the river network which is one of the objects analyzed in this paper. The limitation of spatial resolution made it difficult to obtain information on rivers from the KH-9 image. Visually comparing the KH-4A image obtained in 1967 and the KH-9 remote sensing image in 1978, the river network distribution in Shunde District was not significantly different between these two periods. Therefore, we used the high-resolution KH-4A image as a RS data source to obtain high-precision river network information.
The total length of the river network, the river network density (the ratio of the length of the river network to the total area of the town) and the dike-pond proportion in each town in Shunde District are shown in Table 9. Xingtan had the largest river length of 240.72 km, and its river network was also the largest, reaching 1.98 km per square kilometer. The length of the river network was only 76.67 km in Ronggui, which was the shortest, and its river network density was the smallest among the ten towns, which was only 0.96 km per square kilometer.
Comparing the dike-pond proportion in 1978 (Figure 5) with the river network information in 1967 (Table 9), in general, the trend of the river network density was in line with the trend of the dike-pond proportion (Figure 10). This means that the towns with the high density of river networks had a correspondingly larger proportion of dike-ponds. In particular, the density of river networks in Beijiao and Chencun were higher, but the proportion of dike-ponds did not correspondingly rise up. It is inferred that the relationship between the river network density and the proportion of dike-ponds in each town can be affected by other types of land use. To this end, a statistical analysis was performed on the land use classification information of 1978 in Shunde, which also considers the proportion of each type of land in each town (Table 10).
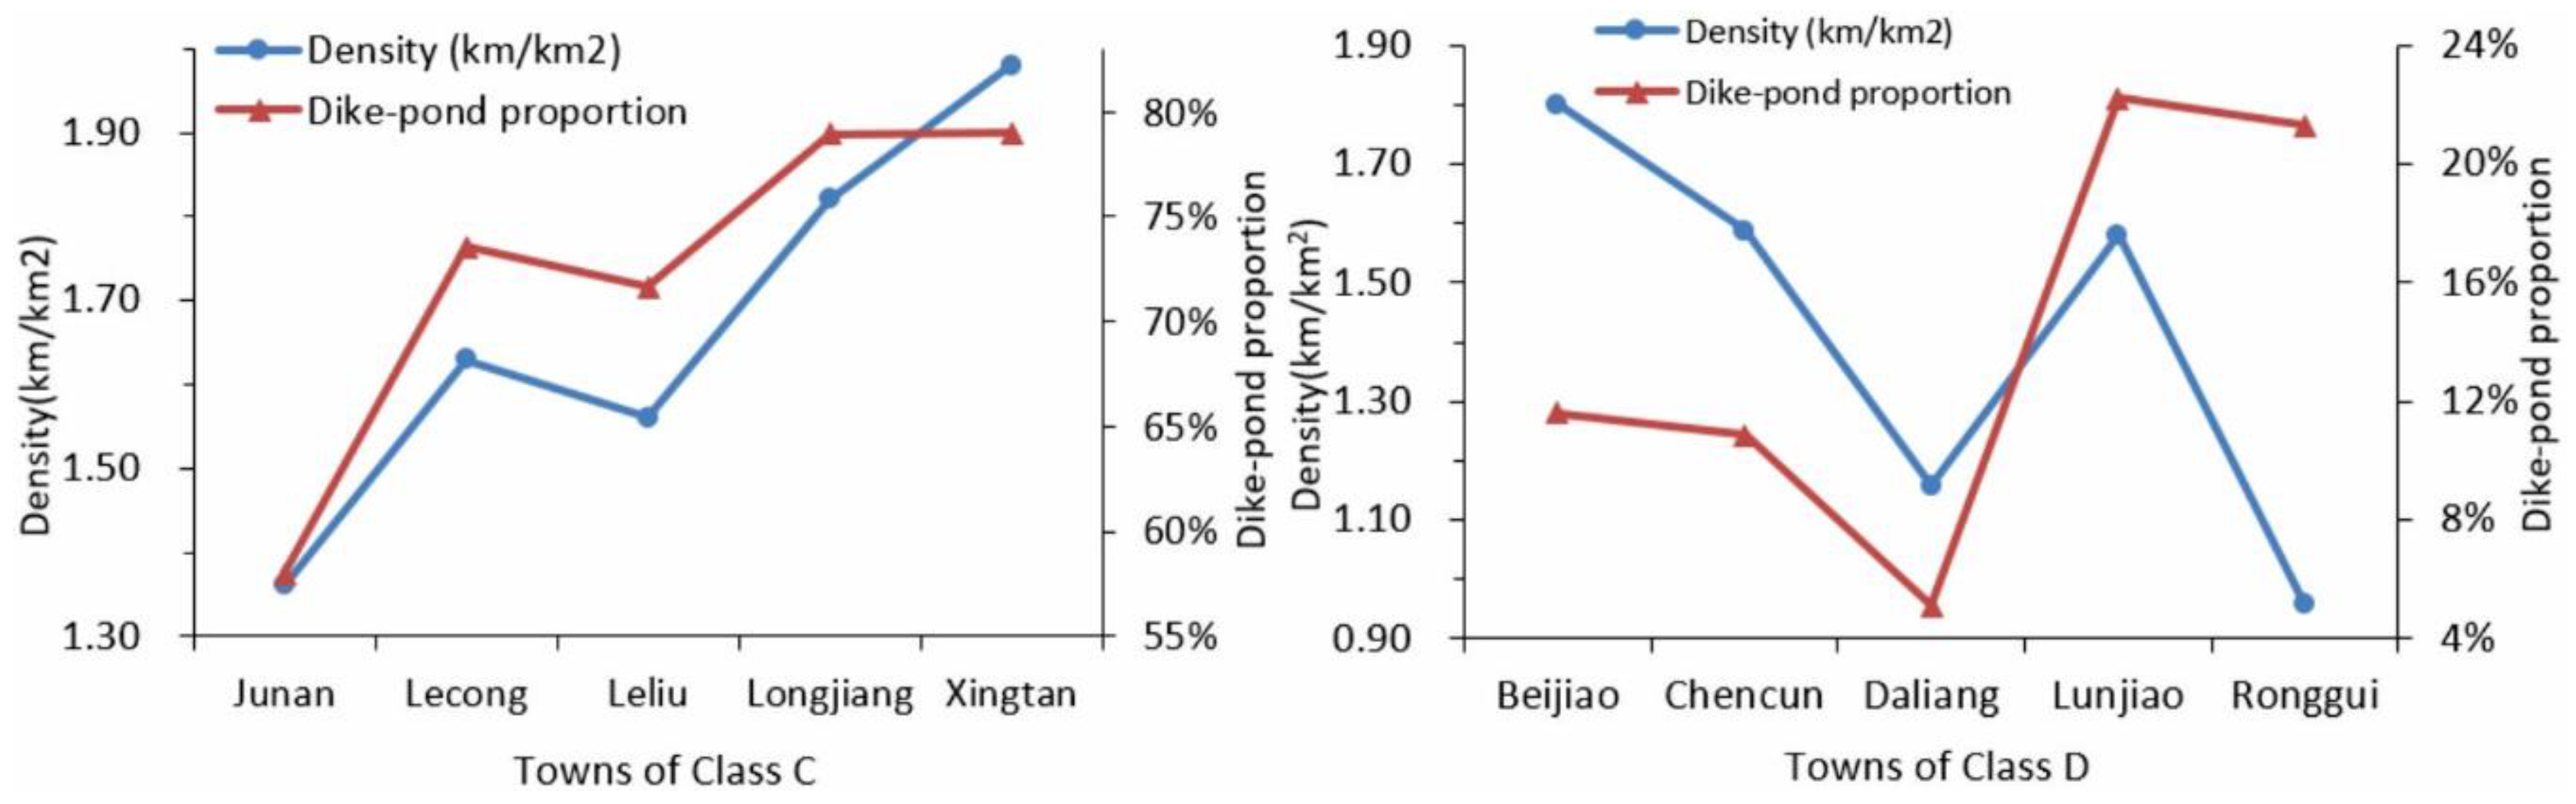
It can be concluded from Table 10 that the dike-ponds in Junan, Lecong, Leliu, Longjiang, and Xingtan accounted for the largest proportion of the total area of the town. For the other towns, cultivated land was the main land use type. This was taken as a basis to divide the towns in Shunde District into two categories. Junan, Lecong, Leliu, Longjiang, and Xingtan were classified as Class C, and the others were Class D. This has led to a deeper understanding of the C and D-class towns, of which the dominant land use types were dike-ponds and cultivated land, respectively. In practice, the rivers in the Class D towns are a rich source of water for agricultural lands other than dike-ponds. As a result, the trends of the two curves were not identical, as shown in Figure 10, when considering the proportion of dike-ponds and river network density of the two classes of towns.
The curves of the river network density and the dike-pond proportion (to the total area of the corresponding town) are shown in Figure 11. For the towns of Class C, their river network density curves are consistent with the trends of the dike-pond proportion curve, illustrating that the higher network density is, the higher dike-pond proportion is. For towns of Class D, the towns with high river network densities generally had large dike-pond proportions. In particular, Ronggui had a large dike-pond area but a low river network density. This is because Ronggui is surrounded by a main river channel, and its dike-ponds are mainly distributed along the main river channel. In the river network analysis, only the length of the river stream was considered and the main channel information was ignored, thus inferring that the main river channel had a greater impact on the distribution of dike-ponds than the inner stream of the river. It can be concluded that the river network density had the same influence on dike-ponds of both Class C and D. With an increase of river network density, the proportion of dike-ponds increase accordingly. In general, the river network density of Class C towns, dominated by dike-ponds, was higher than that of Class D.
4. Discussion
4.1. Impact of Government Policies on Dike-Pond Area Reduction
This study illustrated the government policies and river network both had significant influence on the evolution of dike-ponds in Shunde District. In order to discuss the decision-making activities of the government, especially the influence of local governments’ decision in terms of the evolution of dike-ponds in Shunde, we selected the two sites as the research objects, which had the same starting point but discrepant end points. That is, the difference of the dike-pond proportion of both towns in 1978 was relatively small, but larger in 2016 (Figure 9). In 1978, China began to implement reforms and an opening-up policy, where the south took a leading role compared with other regions in the country. As the Pearl River Delta region is at the forefront of reform and opening-up, industrial restructuring, urban development and other measures became more compact. Over the past 38 years, the proportion of built-up areas in Shunde District has increased from 1.68% to 54.43%. Under the influence of built-up areas and other types of land use, the number and spatial distribution pattern of dike-ponds in Shunde District have changed, from which it could be inferred that the country’s macroeconomic policies were inextricably linked to the evolution of dike-ponds in Shunde.
The dike-ponds in each town were analyzed, and it was shown that the total dike-pond area and its proportion (relative to the total area of the town) in different types of towns had different trends. Indeed, even in the same type of town, the evolution curve of dike-ponds was not exactly the same. The difference in the evolution of dike-ponds was closely related to the enthusiasm of local farmers for cultivation. The market demand, economic benefits, and social response brought about by farming products have a direct impact on the enthusiasm of farmers. Therefore, the policies of local government play an important, perhaps leading role, in the industrial structure and economic development of the whole region [62]. It was an important turning point in the process of China’s reform and opening up in 1992 because the pace of development began to accelerate across the country, especially in the Pearl River Delta. After reform and opening up, Xingtan and Longjiang adopted different development strategies driven by government policies in two directions. After about four decades, the two towns, which had the same evolutionary starting point, have large differences in their conservation of dike-ponds. The great policy has promoted the expansion of the built-up areas, which in turn led to a reduction of dike-pond area. It can be concluded that the country’s macroeconomic policies have had an indelible impact on dike-ponds.
4.2. Impact of River Network on Dike-Pond Distribution
Another important factor that affects dike-pond evolution is known as natural environment, more specifically, the river network. Some predecessors have conducted extensive research on the distribution area characteristics, ecological patterns, and system operation mechanisms of dike-ponds [63,64,65]. These investigations indicated that dike-ponds may be the most successful agro-ecological model for the transformation of low-lying waterlogged lands. In other words, the need for humans to transform low waterlogging land has promoted the formation and promotion of the dike-pond. From this, a main natural condition necessary for dike-pond construction must be a rich source of water.
After 1978, the dike-ponds in each town in Shunde District evolved with different trends under the influence of the national macro-policy and local government decision-making. Moreover, urbanization became a major factor in the evolution of dike-ponds after reform and opening up. Statistics showed that prior to reform and opening up, dike-ponds in Shunde District were dominant over other the types of land use in 1978. Therefore, in order to avoid the influence of other factors after the reform and opening up, the article took the dike-ponds in Shunde District that existed before the reform and explored the relationship between the distribution of the river network in Shunde District and the distribution of dike-ponds. More precisely, we explored the distribution of dike-ponds of the various towns in Shunde District in 1978 and the relationship with the river network distribution during this period. From what the study showed in 3.5, it can be inferred that the proportion of dike-ponds increase synchronously with a rise of river network density. Therefore, river network is another important factor besides government policies which is regarded as water resource of dike-ponds helping ecological cycle and large-scale development.
4.3. Impact of Rural Area Depopulation on Dike-Pond area Reduction
The migration of the rural population to the cities will affect the area of the dike-ponds from two aspects. First of all, the reduction of rural population is bound to decrease the effective development and management. The hysteretic sludge cleaning of dike-ponds will directly lead to insufficient water cycle. Additionally, the yield will not be able to keep up with the requirement due to the unsatisfied feeding, which will give rise to economic benefit reduction. In this case, a large amount of area of dike-ponds can be influenced in Shunde District. Secondly, the rural area depopulation can be a stimulus to the rise of urban population, thus increasing the urban burden to some extent and speeding up the process of urbanization. In need of more living space, more dike-ponds with relatively low economic output value are invaded by expanding urban construction area. As a result, the area of dike-ponds continue to decrease transferring to built-up area.
4.4. Changes of Dike-Pond Role in Water Management
Due to the long-term waterlogging in the low-lying areas of the Pearl River Delta in history, flood disasters were frequent in the past, thus bringing about original dike-ponds that helps drainage and disaster reduction. Since 1949, flood control in China has entered a new period of development [66]. The public concentrated on the construction and reinforcement of river embankments, opened new flood discharge channels, and completed water conservancy projects. Therefore, the flood control system of major rivers has been gradually enhanced and improved. The result of this is that the role of dike-ponds was gradually weakened in flood control and disaster mitigation.
In the 1970’s and 1980’s, the dike-ponds developed into an agricultural model with higher economic benefits [14]. Combining the terrestrial and aquatic ecosystems, the utilization efficiency of freshwater resources reached optimal. Moreover, considering its large amount of storage, the dike-ponds without industrial pollution are widely regarded as one of the main freshwater sources of domestic water in rural areas. As a result, the resource-based ecological service function has become the most essential part of water management.
With the acceleration of urbanization, the area of dike-ponds has been reduced, and the fragmentation has increased. While pipelines are generally installed in rural areas to supply water by reservoirs, the function of dike-ponds cannot be underestimated conserving water storage. Because the water level in dike-ponds is artificially controlled, the water is allocated to cultivated land for agricultural irrigation besides supplying the demand for its own aquatic products. Generating convenience and benefits, the major functions of dike-ponds has been changing with time and the current situation, but have always played a significant and irreplaceable role in water management.
4.5. Limitation
The development of dike-pond system can be influenced by many factors including natural environment and socio-economic aspects. Among them, the former contains regional climate, geological conditions, river basin locations, etc., while the latter includes population, regional agricultural structure, agricultural production efficiency, urbanization process, economic structure, macroeconomic policies, and so on. In the Results part of this paper, only government policies and river network were considered and discussed. In fact, some other factors such as irreversible urbanization process, also affect the evolution of dike-ponds. Thus, more research needs to be done on the contribution of different factors to dike-pond evolution.
In addition, the paper intends to analyze the relationship between dike-pond evolution and affecting factors from a quantitative point of view in the design of the experiment. However, the number of selected objects is relatively small that is not convincing enough. For example, only two representative towns were selected in the analysis of impact of government decisions on the dike-ponds. If more than a few can be chose for comparison, it will be more completely accepted.
In terms of the above discussion, a deeper exploration can be carried out from the following research. Firstly, the multi-temporal and high spatial resolution RS images of Shunde District is supposed to be acquired to explore the evolution characteristics of the internal structure in dike-ponds, comparing the differences between towns. What is more, combining with other non-RS data like statistical yearbooks and official reports, the factors affecting the dike-pond evolution can be analyzed more thoroughly and accurately, so as to provide a more comprehensive reference for the restoration and construction of dike-ponds. Lastly, we have already discussed the evolution and its factors regarding dike-ponds as target objects in the former part. However, in turn, considering that dike-pond is a typical wetland ecosystem, the area change and fragmentation of dike-ponds will also have a feedback effect on the environment, which is a significant field we can explore.
5. Conclusions
In this paper, DISP and Landsat images were used to derive land use information over the period from 1978 to 2016. Ultimately, seven land use maps were produced to extract the dike-pond distribution, which had a classification accuracy greater than 89% and a kappa coefficient of more than 0.86.
The results of comparison among the seven chosen periods indicate that the area of dike-ponds in 2016 was significantly reduced, and fragmentation had increased compared with that in 1978, after 38 years of development. It was seen that most of the dike-ponds that had disappeared by 2016 were due to their conversion into built-up areas, and to a lesser degree, cultivated land. Among the ten administrative regions in Shunde District, two main classes were constructed to describe the trend of dike-pond area proportion change of each town: Class A, where the proportion of dike-ponds continuously decreased, and Class B, where the proportion of dike-ponds increased first and then decreased. Combined with the calculated AWDII values, the dike-ponds in Shunde District experienced three main phases over the past 38 years: steady development, rapid invasion and a gradual reduction of invasion by other land use types. It indicated that AWDII are of great significance to explain other types of wetlands with fluctuated and complex trends. There are some main factors that may affect the evolution of dike-pond, namely government policies, the river network, and rural area depopulation, which all belong to socio-economic and the natural environmental factors.
To overcome the situation where dike-ponds showed a decreasing trend caused by continuous urbanization and intemperate cultivation, the harmony should be made a priority between economic development and ecological environment. Based on free satellite data and open source software, the processing workflow and eventual results can be used generally for spatio-temporal monitoring wetland evolution, more rational water resource management as well as supporting directives for the conversation of inland freshwater ecosystem.
Author Contributions
F.L., K.L. and H.T. designed the study, performed the experiments, analyzed the results and wrote the manuscript. L.L. contributed in designing the study, editing the manuscripts and providing funding to the project, and H.L. provided some useful suggestions for the paper’s results and discussions.
Funding
This research is founded by the National Science Foundation of China (Grant No. 41001291, 41531178), the Natural Science Foundation of Guangdong (Grant No. 2016A030313261), the Science and Technology Planning Project of Guangdong Province (Grant No. 2017A020217003).
Acknowledgments
The authors would like to thank the anonymous referees and the editors for their valuable comments, and also appreciate International Science Editing (http://www.internationalscienceediting.com) for editing this manuscript.
Conflicts of Interest
The authors declare no conflict of interest.
Appendix A. Error Matrix of Classification Accuracies in Shunde District from 1978 to 2016

Table A1.
Error matrix of classification in 1978.
| Sample Number | Evaluated Image | ||||||
|---|---|---|---|---|---|---|---|
| River | Forest | Built-up Area | Cultivated Land | Dike-Pond | Sum | ||
| Reference image | River | 57 | 1 | 3 | 1 | 2 | 64 |
| Forest | 0 | 56 | 1 | 2 | 0 | 59 | |
| Built-up area | 6 | 1 | 76 | 2 | 0 | 85 | |
| Cultivated land | 0 | 3 | 2 | 64 | 2 | 71 | |
| Dike-pond | 2 | 0 | 0 | 3 | 83 | 88 | |
| Sum | 65 | 61 | 82 | 72 | 87 | 367 | |
| Producer’s accuracy | 94.00% | 100.00% | 96.60% | 100.00% | 100.00% | - | |
| User’s accuracy | 100.00% | 100.00% | 96.60% | 95.00% | 100.00% | - | |
| Overall accuracy: 91.55%; Overall kappa coefficient: 0.894 | |||||||
Table A2.
Error matrix of classification in 1988.
| Sample Number | Evaluated Image | ||||||
|---|---|---|---|---|---|---|---|
| River | Forest | Built-up Area | Cultivated Land | Dike-Pond | Sum | ||
| Reference image | River | 43 | 0 | 2 | 1 | 1 | 47 |
| Forest | 0 | 45 | 1 | 2 | 0 | 48 | |
| Built-up area | 2 | 0 | 71 | 5 | 0 | 78 | |
| Cultivated land | 1 | 2 | 0 | 72 | 1 | 76 | |
| Dike-pond | 1 | 3 | 0 | 1 | 71 | 76 | |
| Sum | 47 | 50 | 74 | 81 | 73 | 325 | |
| Producer’s accuracy | 91.49% | 93.75% | 91.03% | 94.74% | 93.42% | - | |
| User’s accuracy | 91.49% | 90.00% | 95.95% | 88.89% | 97.26% | - | |
| Overall accuracy: 92.92%; Overall kappa coefficient: 0.911 | |||||||
Table A3.
Error matrix of classification in 1993.
| Sample Number | Evaluated Image | ||||||
|---|---|---|---|---|---|---|---|
| River | Forest | Built-up Area | Cultivated Land | Dike-Pond | Sum | ||
| Reference image | River | 61 | 1 | 2 | 1 | 1 | 66 |
| Forest | 0 | 67 | 1 | 2 | 1 | 71 | |
| Built-up area | 4 | 0 | 74 | 0 | 0 | 78 | |
| Cultivated land | 1 | 2 | 2 | 83 | 1 | 89 | |
| Dike-pond | 2 | 3 | 2 | 1 | 91 | 99 | |
| Sum | 68 | 73 | 81 | 87 | 94 | 403 | |
| Producer’s accuracy | 92.42% | 94.37% | 94.87% | 93.26% | 91.92% | - | |
| User’s accuracy | 89.71% | 91.78% | 91.36% | 95.40% | 96.81% | - | |
| Overall accuracy: 93.30%; Overall kappa coefficient: 0.916 | |||||||
Table A4.
Error matrix of classification in 2000.
| Sample Number | Evaluated Image | ||||||
|---|---|---|---|---|---|---|---|
| River | Forest | Built-up Area | Cultivated Land | Dike-Pond | Sum | ||
| Reference image | River | 55 | 1 | 3 | 2 | 1 | 62 |
| Forest | 0 | 55 | 3 | 0 | 4 | 62 | |
| Built-up area | 0 | 1 | 61 | 1 | 3 | 66 | |
| Cultivated land | 0 | 1 | 0 | 71 | 3 | 75 | |
| Dike-pond | 2 | 3 | 2 | 1 | 69 | 77 | |
| Sum | 57 | 61 | 69 | 75 | 80 | 342 | |
| Producer’s accuracy | 88.71% | 88.71% | 92.42% | 94.67% | 89.61% | - | |
| User’s accuracy | 96.49% | 90.16% | 88.41% | 94.67% | 86.25% | - | |
| Overall accuracy: 90.94%; Overall kappa coefficient: 0.886 | |||||||
Table A5.
Error matrix of classification in 2005.
| Sample Number | Evaluated Image | ||||||
|---|---|---|---|---|---|---|---|
| River | Forest | Built-up Area | Cultivated Land | Dike-Pond | Sum | ||
| Reference image | River | 38 | 2 | 0 | 5 | 1 | 46 |
| Forest | 1 | 46 | 2 | 0 | 0 | 49 | |
| Built-up area | 2 | 1 | 65 | 1 | 3 | 72 | |
| Cultivated land | 1 | 1 | 1 | 51 | 3 | 57 | |
| Dike-pond | 0 | 3 | 1 | 3 | 64 | 71 | |
| Sum | 42 | 53 | 69 | 60 | 71 | 295 | |
| Producer’s accuracy | 82.61% | 93.88% | 90.28% | 89.47% | 90.14% | - | |
| User’s accuracy | 90.48% | 86.79% | 94.20% | 85.00% | 90.14% | - | |
| Overall accuracy: 89.49%; Overall kappa coefficient: 0.868 | |||||||
Table A6.
Error matrix of classification in 2011.
| Sample Number | Evaluated Image | ||||||
|---|---|---|---|---|---|---|---|
| River | Forest | Built-up Area | Cultivated Land | Dike-Pond | Sum | ||
| Reference image | River | 53 | 0 | 0 | 1 | 3 | 57 |
| Forest | 0 | 45 | 1 | 1 | 0 | 47 | |
| Built-up area | 1 | 2 | 76 | 2 | 1 | 82 | |
| Cultivated land | 1 | 3 | 2 | 83 | 2 | 91 | |
| Dike-pond | 2 | 1 | 1 | 1 | 70 | 75 | |
| Sum | 57 | 51 | 80 | 88 | 76 | 352 | |
| Producer’s accuracy | 92.98% | 95.74% | 92.68% | 91.21% | 93.33% | - | |
| User’s accuracy | 92.98% | 88.24% | 95.00% | 94.32% | 92.11% | - | |
| Overall accuracy: 92.90%; Overall kappa coefficient: 0.910 | |||||||
Table A7.
Error matrix of classification in 2016.
| Sample Number | Evaluated Image | ||||||
|---|---|---|---|---|---|---|---|
| River | Forest | Built-up Area | Cultivated Land | Dike-Pond | Sum | ||
| Reference image | River | 51 | 0 | 1 | 1 | 2 | 55 |
| Forest | 0 | 47 | 2 | 0 | 1 | 50 | |
| Built-up area | 1 | 2 | 64 | 3 | 2 | 72 | |
| Cultivated land | 1 | 3 | 2 | 73 | 1 | 80 | |
| Dike-pond | 3 | 1 | 1 | 2 | 69 | 76 | |
| Sum | 56 | 53 | 70 | 79 | 75 | 333 | |
| Producer’s accuracy | 92.73% | 94.00% | 88.89% | 91.25% | 90.79% | - | |
| User’s accuracy | 91.07% | 88.68% | 91.43% | 92.41% | 92.00% | - | |
| Overall accuracy: 91.29%; Overall kappa coefficient: 0.890 | |||||||
References
- Zhong, G. A Deeper Realization of Mulberry Dike-Fish Pond System. Trop. Geogr. 1984, 4, 129–135. [Google Scholar]
- Zhong, G.; Cai, G. Eco-Economic Model of Basic (Cultivated Land) Pond System in China—A Case Study of the Pearl River Delta and the Yangtze River Delta. Ecol. Econ. 1987, 53, 15–20. [Google Scholar]
- Liao, X. Theory and Technology Mode of Mulberry Based Fish Pond Ecosystem in Low-Lying Water Ponds. Guangxi Seric 1999, 36, 30–31. [Google Scholar]
- Zhong, G. The Characteristics of Dike-Pond System and Practical Significance. Sci. Geogr. Sin. 1988, 45, 161–187. [Google Scholar]
- Ding, J.; Wen, Y.; Shu, Q. Studies on Sustainable Development of Aquaculture in the Dike-Pond Ecosystem. Chongqing Environ. Sci. 2001, 23, 12–14. [Google Scholar]
- Nie, C.; Luo, S.; Zhang, J.; Li, H.; Zhao, Y. The Dike-Pond System in the Pearl River Delta: Degradation Following Recent Land Use Alterations and Measures for Their Ecological Restoration. Acta Ecol. Sin. 2003, 23, 1851–1860. [Google Scholar]
- Zhong, G. The Structural Characteristics and Effects of the Dyke-Pond System in China. Outlook Agric. 1989, 18, 119–123. [Google Scholar]
- Zhong, G. The Types, Structure and Results of the Dike-Pond System in South China. GeoJournal 1990, 21, 83–89. [Google Scholar]
- Zhong, G. Some Problems About the Mulberry-Dike-Fish-Pond Ecosystem on the Zhujiang Delta. Chin. J. Ecol. 1982, 10–11. [Google Scholar] [CrossRef]
- Zhong, G. Mulberry-Dike-Fish-Pond on the Zhujiang Delta—A Complete Artificial Ecosystem of Land-Water Interaction. Acta Geogr. Sin. 1980, 35, 200–209. [Google Scholar]
- Korn, M. The Dike-Pond Concept: Sustainable Agriculture and Nutrient Recycling in China. Ambio 1993, 25, 6–13. [Google Scholar]
- Lo, C. Environmental Impact on the Development of Agricultural Technology in China: The Case of the Dike-Pond (‘Jitang’) System of Integrated Agriculture-Aquaculture in the Zhujiang Delta of China. Agric. Ecosyst. Environ. 1996, 60, 183–195. [Google Scholar] [CrossRef]
- Huang, Y.; Liu, T. Dike-Pond Ecosystes and Their Soils. J. South China Agric. Univ. 1995, 102–107. [Google Scholar]
- Li, H.; Luo, S. Eco-Economic Analysis on the Chinampa Systems in Maoming City. Rural Eco-Environ. 1992, 8, 41–45. [Google Scholar]
- Yang, Y. Problems and Countermeasures of Sustainable Development of Agricultural Ecology in the Pearl River Delta. Guangdong Agric. Sci. 1995, 14–16. [Google Scholar]
- Zhang, J.; Zhong, G. Analysis of Harmonizing Human and Geographic Environment Relationship in the Dike-Pond Econ-Ecological System. Ecol. Sci. 1993, 55–59. [Google Scholar]
- Li, H.; Ling, W.; Yang, J.; Zhang, M. Biremediation of the Hchs Residue in Sediments of Dike-Pond System by Growing Ipomoea Aquatic and Using Different Fertilizer. J. Agro-Environ. Sci. 2007, 26, 2251–2256. [Google Scholar]
- Li, H.; Luo, S.; Nie, C. Reconstruction and Control of Modern in Tensive Dike-Pond System in Shunde. Chin. J. Ecol. 2005, 24, 108–112. [Google Scholar]
- Zhu, G. Ponderation Over the Flood Control Functions of the Artifical Landforms in Prd. Trop. Geogr. 2012, 32, 378–384. [Google Scholar]
- Zhao, Y. The Effect of Scoeconomical Development on the Dike-Pond System in Zhujiang Delta. J. Zhongkai Agrotech. Coll. 2001, 14, 28–33. [Google Scholar]
- Wu, J. Land-Pool Farming and Economic Restructuring in Shunde County during the Times of Ming, Qing Dynasties and the Republic of China. Ancient Mod. Agric. 2011, 1, 96–104. [Google Scholar]
- Li, M.; Nie, C.; Long, X. Establishment of Indicator System for Assessing Eco-Environment Quality on Dike-Pond System. J. Agro-Environ. Sci. 2007, 26, 386–390. [Google Scholar]
- Lu, H.; Peng, S.; Lan, S.; Chen, F. Energy Value Evaluation of Dike-Pond Agro-Ecological Engineering Modes. Chin. J. Appl. Ecol. 2003, 14, 1622–1626. [Google Scholar]
- Han, X.; Yu, K.; Li, D.; Wang, S. Building the Landscape Security Pattern of Dike-Pond System with Urban Functions. Area. Res. Dev. 2008, 27, 107–110. [Google Scholar]
- Lin, M.; Feng, R.; Ji, S. Analysis on Mode Change and Landscape Pattern of the Dike-Pond Agriculture in Zhongshan. Guangdong Agric. Sci. 2014, 41, 184–189. [Google Scholar]
- Liu, K.; Wang, S.; Xie, L.; Zhuaang, J. Spatial Evolution Analysis of Dike-Pond Systems in Foshan City. Trop. Geogr. 2008, 28, 513–517. [Google Scholar]
- Yang, D.; Ye, C. Analyses and Simulation on Landscape Fragmentation of Dike—Pond Based on Ca Model in Pearl River Delta. Hubei Agric. Sci. 2016, 55, 3932–3937. [Google Scholar]
- Kennedy, R.E.; Townsend, P.A.; Gross, J.E.; Cohen, W.B.; Bolstad, P.; Wang, Y.Q.; Adams, P. Remote Sensing Change Detection Tools for Natural Resource Managers: Understanding Concepts and Tradeoffs in the Design of Landscape Monitoring Projects. Remote Sens. Environ. 2009, 113, 1382–1396. [Google Scholar] [CrossRef]
- Schneider, A. Monitoring land Cover Change in Urban and Peri-Urban Areas Using Dense Time Stacks of Landsat Satellite Data and a Data Mining Approach. Remote Sens. Environ. 2012, 124, 689–704. [Google Scholar] [CrossRef]
- Zurqani, H.A.; Post, C.J.; Mikhailova, E.A.; Schlautman, M.A.; Sharp, J.L. Geospatial Analysis of Land Use Change in the Savannah River Basin Using Google Earth Engine. Int J. Appl Earth Obs. 2018, 69, 175–185. [Google Scholar] [CrossRef]
- Hauser, L.T.; Nguyen Vu, G.; Nguyen, B.A.; Dade, E.; Nguyen, H.M.; Nguyen, T.T.Q.; Le, T.Q.; Vu, L.H.; Tong, A.T.H.; Pham, H.V. Uncovering the Spatio-Temporal Dynamics of Land Cover Change and Fragmentation of Mangroves in the Ca Mau Peninsula, Vietnam Using Multi-Temporal Spot Satellite Imagery (2004–2013). Appl. Geogr. 2017, 86, 197–207. [Google Scholar] [CrossRef]
- Ye, C. Change Characteristics and Spatial Types of Dike-Pond in the Pearl River Delta. J. East China Inst. Technol. 2013, 36, 315–322. [Google Scholar]
- Wang, X.; Xia, L.; Deng, S.; Pan, Z. Spatial Temporal Changes in Dike-Pond Land in Nanhai District Based on RS and GIS. Resour. Ind. 2011, 13, 55–60. [Google Scholar]
- Pang, Z. The Revelation of Contemporary American Photographic Reconnaissance Satellite. China Ordnance Ind. 2001, 57–60. [Google Scholar]
- Yang, X. An Overview of Foreign Reconnaissance Satellites. For. Space Technol. 1979, 43–48. [Google Scholar]
- Chen, B.; Chen, L.; Huang, B.; Michishita, R.; Xu, B. Dynamic Monitoring of the Poyang Lake Wetland by Integrating Landsat and Modis Observations. ISPRS J. Photogramm. 2018, 139, 75–87. [Google Scholar] [CrossRef]
- Liu, Y.; Li, R.; Yang, L. Image Classification Method in Landuse Dynamic Detection Based on Multi-Source Remote Sensing Data—A Case Study in the Loess Plateau of Northern Shaanxi Province. Bull. Soil Water Conserv. 2006, 26, 63–66. [Google Scholar]
- Ottinger, M.; Clauss, K.; Kuenzer, C. Large-Scale Assessment of Coastal Aquaculture Ponds with Sentinel-1 Time Series Data. Remote Sens-Basel. 2017, 9, 1–23. [Google Scholar] [CrossRef]
- Zhai, T.; Jin, G.; Deng, X.; Li, Z.; Wang, R. Research of Wuhan City Land Use Classification Method Based on Multi-Source Remote Sensing Image Fusion. Resour. Environ. Yangtze Basin 2016, 25, 1594–1602. [Google Scholar]
- He, Z.; Guan, L.; Kang, Q.; Wang, X.; Wang, C. Sustainable Development of Mulberry-Dike and Fish-Pond Farming in Pearl River Delta by Remote-Sensing Technology. Acta Sci. Nat. Univ. Sunyatseni 1998, 37, 68–73. [Google Scholar]
- Wang, X.; Kang, Q. Application of tm Image in Investigating Changes of Dike-Pond Land on the Pearl River Delta—Samples as Shunde Nanhai Dike-Pond Region. Remote Sens. Land Resour. 1997, 3, 8–14. [Google Scholar]
- Yee, A. New Developments in Integrated Dike-Pond Agriculture-Aquaculture in the Zhujiang Delta, China: Ecological Implications. Ambio 1999, 28, 529–533. [Google Scholar]
- Turner, M.G. Landscape Ecology: The Effect of Pattern on Process. Annu. Rev. Ecol. Syst. 1989, 20, 171–197. [Google Scholar] [CrossRef]
- Li, Y.; Zhou, L.; Cui, H. Pollen Indicators of Human Activity. Chin. Sci. Bull. 2008, 53, 1281–1293. [Google Scholar] [CrossRef]
- Mercuri, A.M. Genesis and Evolution of the Cultural Landscape in Central Mediterranean: The ‘Where, When and How’ through the Palynological Approach. Landsc. Ecol. 2014, 29, 1799–1810. [Google Scholar] [CrossRef]
- Xinwen, Z.; Chuanxiu, L.; Shuangxi, C.; Changsheng, H.; Zhuo, Z.; Haogang, D.; Min, Z.; Wen, C.; Fengmei, L.; Yiyong, L.; et al. Quantitative Reconstruction of Holocene Climate based on Pollen Data from Drill Hole qzk6 in Pearl River Delta. Geol. Bull. China 2014, 33, 1621–1628. [Google Scholar]
- Yang, S.; Zheng, Z.; Huang, K.; Zong, Y.; Wang, J.; Xu, Q.; Rolett, B.V.; Li, J. Modern Pollen Assemblages from Cultivated Rice Fields and Rice Pollen Morphology: Application to a Study of Ancient Land Use and Agriculture in the Pearl River Delta, China. Holocene 2012, 22, 1393–1404. [Google Scholar] [CrossRef]
- Almeida, C.M.D.; Monteiro, A.M.V.; Camara, G.; Soares-Filho, B.S.; Cerqueira, G.C.; Pennachin, C.L.; Batty, M. GIS and Remote Sensing as Tools for the Simulation of Urban Land-Use Change. Int. J. Remote Sens. 2005, 26, 759–774. [Google Scholar] [CrossRef]
- Bhatta, B.; Saraswati, S.; Bandyopadhyay, D. Quantifying the Degree-of-Freedom, Degree-of-Sprawl, and Degree-of-Goodness of Urban Growth from Remote Sensing Data. Appl. Geogr. 2010, 30, 96–111. [Google Scholar] [CrossRef]
- Kumar, J.A.V.; Pathan, S.K.; Bhanderi, R.J. Spatio-Temporal Analysis for Monitoring Urban Growth—A Case Study of Indore City. J. Indian Soc. Remote Sens. 2007, 35, 11–20. [Google Scholar] [CrossRef]
- Liu, X.; Li, X.; Chen, Y.; Tan, Z.; Li, S.; Ai, B. A New Landscape Index for Quantifying Urban Expansion Using Multi-Temporal Remotely Sensed Data. Landsc. Ecol. 2010, 25, 671–682. [Google Scholar] [CrossRef]
- Badjana, H.; Helmschrot, J.; Selsam, P.; Wala, K.; Flugel, W.; Afouda, A.; Akpagana, K. Land cover Changes Assessment Using Object-Based Image Analysis in the Binah River Watershed (Togo and Benin). Earth Space Sci. 2016, 2, 403–416. [Google Scholar] [CrossRef]
- Zhang, L.; Nan, Z.; Xu, Y.; Li, S. Hydrological Impacts of Land Use Change and Climate Variability in the Headwater Region of the Heihe River Basin, Northwest China. PLoS ONE 2016, 11, 1–25. [Google Scholar] [CrossRef] [PubMed]
- Liang, H. Study on Lucc in Typical County of the Pearl River Delta; Guangzhou University: Guangzhou, China, 2007. [Google Scholar]
- Sinha, P.; Kumar, L.; Drielsma, M.; Barrett, T. Time-Series Effective Habitat Area (eha) Modeling Using Cost-Benefit Raster Based Technique. Ecol. Inform. 2014, 19, 16–25. [Google Scholar] [CrossRef]
- Liu, X.; Li, X.; Chen, Y.; Qin, Y.; Li, S.; Chen, H. Landscape Expansion Index and Its Applications to Quantitative Analysis of Urban Expansion. Acta Geopgr. Sin. 2009, 64, 1430–1438. [Google Scholar]
- Zeng, Y.; He, L.; Jin, W.; Wu, K.; Xu, Y.; Yu, F. Quantitative Analysis of the Urban Expansion Models in Changsha-Zhuzhou-Xiangtan Metroplan Areas. Sci. Geogr. Sin. 2012, 32, 544–549. [Google Scholar]
- Zhou, X.; Chen, L.; Xiang, W. Quantitative Analysis of the Built-Up Area Expansion in Su-Xi-Chang Region, China. Chin. J. Appl. Ecol. 2014, 25, 1422–1430. [Google Scholar]
- Wu, P.; Zhou, D.; Gong, H. A New Landscape Expansion Index Definition and Quantification. Acta Ecol. Sin. 2012, 32, 4270–4277. [Google Scholar]
- Xingtan Government Online. Available online: http://www.shunde.gov.cn/xingtan/zjxt/?Sid=1 (accessed on 11 June 2018).
- Manqiang, W. An Analysis on the Status of Land-Use of Foshan Region in History; Ji’nan University: Guangzhou, China, 2012. [Google Scholar]
- Dai, W.; Si, S. Government Policies and Firms’ Entrepreneurial Orientation: Strategic Choice and Institutional Perspectives. J. Bus. Res. 2018, 93, 23–36. [Google Scholar] [CrossRef]
- Guo, C.X.; Xu, S.J. The New Visual Angle and Advance on Researches of the Dike-Pond System in China. Wetland Sci. 2011, 9, 75–81. [Google Scholar]
- Li, Y.; Liu, K.; Liu, Y.; Zhu, Y. The Dynamic of Dike-Pond System in the Pearl River Delta during 1964–2012; Springer: Cham, Switzerland, 2017; pp. 47–59. [Google Scholar]
- Ye, C.; Feng, Y. Ecological Risk Assessment for Pearl River Delta based on Land Use Change. Trans. Chin. Soc. Agric. Eng. 2013, 29, 224–232. [Google Scholar]
- Wuying, S. The Hubei Province and Flood Relief Study (1949–1956); Huazhong Normal University: Wuhan, China, 2013. [Google Scholar]
Figure 1.
Location of the study area.

Figure 2.
Workflow of the research.

Figure 3.
Distribution of dike-pond in Shunde District from 1978 to 2016.

Figure 4.
Changing area of land use types in Shunde District between 1978 and 2016.

Figure 5.
Stacked bar graph of dike-pond area of the 10 towns in Shunde District from 1978 to 2016.

Figure 6.
Two different evolution trends of dike-pond proportion in each town.

Figure 7.
Spatial distribution of the Class A and Class B towns in Shunde.

Figure 8.
Dike-pond expansion/invasion during each period.

Figure 9.
Comparison of dike-pond area proportions in Xingtan and Longjiang from 1978 to 2016.

Figure 10.
The relationship between river network density in 1967 and the dike-pond proportion in each town in 1978.
Figure 10.
The relationship between river network density in 1967 and the dike-pond proportion in each town in 1978.

Figure 11.
The relationship between river network density and dike-pond proportion.

Table 1.
Summary of the data used and pre-processing steps taken in this study.
| Satellite | Sensor | Acquisition Time | Geometric Correction | Image Mosaic | Image Clipping | Image Fusion |
|---|---|---|---|---|---|---|
| DISP | KH-4 | 1967-12-18 | √ * | √ | √ | √ |
| KH-9 | 1975-12-17/1976-01-18 | √ * | √ | √ | √ | |
| Landsat | MSS | 1978-11-02 | √ | × | √ | √ |
| TM | 1988-12-10, 1993-11-22, 2000-09-14, 2005-07-18, 2011-06-01 | √ | × | √ | × | |
| Landsat | OLI | 2016-12-07 | √ | × | √ | × |
Note: √ means the pre-processing step was implemented; × means the pre-processing step was not implemented; * means image rotation was implemented before geometric correction.
Table 2.
Comparison between the fused images (MSS and KH-9) and Landsat TM.
| Categories | Fusion Image Features (R:4 G:3 B:2) | Landsat TM Image Features (R:7 G:5 B:3) |
|---|---|---|
| Dike-pond |  |  |
| Built-up area |  |  |
| Cultivated land |  |  |
| Forest |  |  |
| River |  |  |
Table 3.
Description of the target categories.
| Categories | Descriptions | |
|---|---|---|
| Dike-pond | 1 | A combination of light blue or dark blue regular patches and surrounding yellow linear features which are meshed |
| 2 | A combination of dark blue regular patches and surrounding green linear features which are meshed | |
| Built-up area | 1 | Gray-black, uneven internal shade, irregular shape |
| 2 | Gray-purple, uneven internal shade, irregular shape | |
| Cultivated land | 1 | Light yellow or brown bar, uniform color shade, regular patches |
| 2 | Green, uniform color shade, relatively regular patches | |
| Forest | 1 | Brown, relatively uniform internal shade, darker in the middle part |
| 2 | Green, relatively uniform internal shade, darker in the middle part | |
| River | 1 | Light blue, uneven width, uniform internal shade, long curved lines |
| 2 | Dark blue, uneven width, uniform internal shade, long curved lines | |
Note: 1 means fusion image (R:4 G:3 B:2); 2 means Landsat TM image (R:7 G:5 B:3).
Table 4.
Overall accuracy assessment of the classification results.
| Accuracy Measures | Overall Accuracy (%) | Kappa Coefficient |
|---|---|---|
| 1978 | 91.55 | 0.894 |
| 1988 | 92.92 | 0.911 |
| 1993 | 93.30 | 0.916 |
| 2000 | 90.94 | 0.886 |
| 2005 | 89.49 | 0.868 |
| 2011 | 92.90 | 0.910 |
| 2016 | 91.29 | 0.890 |
Table 5.
Two types of dike-pond evolution fitting function on town.
| Types | Towns | Fitted Curves | Functions | R² |
|---|---|---|---|---|
| Class A | Junan |  | y = −0.0056x + 11.689 | 0.8344 |
| Lecong |  | y = −0.0153x + 31.022 | 0.8763 | |
| Leliu |  | y = −0.0101x + 20.703 | 0.9229 | |
| Longjiang |  | y = −0.0147x + 29.843 | 0.9666 | |
| Xingtan |  | y = −0.0083x + 17.115 | 0.9767 | |
| Class B | Beijiao |  | y = −0.0009x2 + 3.5686x−3561.3 | 0.7888 |
| Chencun |  | y = −0.0003x2 + 1.0258x−1020.6 | 0.8155 | |
| Daliang |  | y = −0.0004x2 + 1.7216x−1719.2 | 0.8328 | |
| Lunjiao |  | y = −0.0005x2 + 2.1476x−2144.5 | 0.9023 | |
| Ronggui |  | y = −0.0005x2 + 2.0255x−2016.9 | 0.8664 |
Table 6.
Calculated AWDII (area weighted dike-pond invasion index) values.
| Period Region | 1978–1988 | 1988–1993 | 1993–2000 | 2000–2005 | 2005–2011 | 2011–2016 |
|---|---|---|---|---|---|---|
| Beijiao | −1.000 | −1.000 | −0.986 | −0.474 | −0.232 | −0.652 |
| Chencun | −1.000 | −0.891 | −1.000 | −0.200 | −0.191 | −0.956 |
| Daliang | −1.000 | −1.000 | −1.000 | −0.492 | −0.409 | −0.944 |
| Junan | −0.847 | −0.962 | −1.000 | −0.879 | −0.665 | −0.807 |
| Lecong | −0.891 | −0.980 | −0.789 | −0.582 | −0.479 | −0.481 |
| Leliu | −0.908 | −0.983 | −0.759 | −0.699 | −0.726 | −0.875 |
| Longjiang | −0.890 | −0.874 | −0.610 | −0.742 | −0.673 | −0.642 |
| Lunjiao | −1.000 | −1.000 | −1.000 | −0.698 | −0.612 | −0.827 |
| Ronggui | −1.000 | −1.000 | −0.967 | −0.395 | −0.258 | −1.000 |
| Xingtan | −0.785 | −0.953 | −0.861 | −0.889 | −0.813 | −0.750 |
| Shunde | −1.000 | −1.000 | −0.871 | −0.439 | −0.456 | −0.570 |
Table 7.
Land use transfer matrix of Xingtan between 1978 and 2016 (unit: km2).
| 2016 1978 | Built-up Area | Cultivated Land | Dike-Pond | Forest | River | Total (1978) |
|---|---|---|---|---|---|---|
| Built-up area | 1.74 | 0.02 | 0.25 | 2.01 | ||
| 86.52% | 1.06% | 12.42% | 1.65% | |||
| Cultivated land | 1.79 | 2.18 | 2.87 | 0.10 | 0.37 | 7.32 |
| 24.44% | 29.82% | 39.28% | 1.38% | 5.08% | 6.02% | |
| Dike-pond | 34.22 | 10.03 | 51.13 | 0.66 | 0.08 | 96.13 |
| 35.60% | 10.44% | 53.19% | 0.69% | 0.08% | 79.06% | |
| Forest | 0.15 | 0.06 | 0.20 | 1.84 | 2.25 | |
| 6.66% | 2.66% | 8.79% | 81.89% | 1.85% | ||
| River | 0.79 | 0.40 | 0.82 | 0.23 | 11.64 | 13.88 |
| 5.69% | 2.89% | 5.93% | 1.68% | 83.80% | 11.42% | |
| Total (2016) | 38.69 | 12.70 | 55.28 | 2.84 | 12.09 | 121.59 |
| 31.82% | 10.45% | 45.46% | 2.33% | 9.94% | 100.00% |
Table 8.
Land use transfer matrix of Longjiang between 1978 and 2016(unit: km2).
| 2016 1978 | Built-up Area | Cultivated Land | Dike-Pond | Forest | River | Total (1978) |
|---|---|---|---|---|---|---|
| Built-up area | 0.63 | 0.63 | ||||
| 99.54% | 0.90% | |||||
| Cultivated land | 2.07 | 0.46 | 0.41 | 0.01 | 2.95 | |
| 70.08% | 15.68% | 14.03% | 0.21% | 4.19% | ||
| Dike-pond | 31.43 | 5.18 | 18.51 | 0.44 | 0.05 | 55.61 |
| 56.52% | 9.31% | 33.29% | 0.79% | 0.08% | 78.91% | |
| Forest | 4.07 | 1.42 | 0.15 | 2.77 | 8.42 | |
| 48.33% | 16.92% | 1.82% | 32.93% | 11.95% | ||
| River | 0.34 | 0.25 | 0.24 | 2.03 | 2.86 | |
| 11.89% | 8.76% | 8.23% | 71.12% | 4.06% | ||
| Total (2016) | 38.54 | 7.32 | 19.32 | 3.21 | 2.09 | 70.47 |
| 54.69% | 10.38% | 27.41% | 4.56% | 2.96% | 100.00% |
Table 9.
Length and density of the river network in each town in Shunde in 1967.
| Towns | Length (km) | Density (km/km2) |
|---|---|---|
| Beijiao | 165.06 | 1.80 |
| Chencun | 80.47 | 1.59 |
| Daliang | 92.71 | 1.16 |
| Junan | 105.72 | 1.36 |
| Lecong | 127.12 | 1.63 |
| Leliu | 141.79 | 1.56 |
| Longjiang | 134.31 | 1.82 |
| Lunjiao | 93.34 | 1.58 |
| Ronggui | 76.67 | 0.96 |
| Xingtan | 240.72 | 1.98 |
Table 10.
The proportion of various types of land use in each town in 1978.
| Towns | Built-Up Area | Cultivated Land | Dike-Pond | Forest | River |
|---|---|---|---|---|---|
| Beijiao | 1.06% | 80.93% * | 11.60% | 0.89% | 5.53% |
| Chencun | 1.66% | 81.94% * | 10.85% | 2.30% | 3.24% |
| Daliang | 1.87% | 79.88% * | 5.12% | 7.05% | 6.07% |
| Junan | 0.74% | 16.41% | 57.95% * | 7.20% | 17.69% |
| Lecong | 2.64% | 19.51% | 73.54% * | 0.00% | 4.31% |
| Leliu | 2.04% | 17.58% | 71.66% * | 0.56% | 8.16% |
| Longjiang | 0.89% | 4.18% | 78.94% * | 11.92% | 4.06% |
| Lunjiao | 1.03% | 67.85% * | 22.25% | 0.00% | 8.86% |
| Ronggui | 2.99% | 62.29% * | 21.30% | 2.08% | 11.34% |
| Xingtan | 1.65% | 6.01% | 78.99% * | 1.87% | 11.48% |
Note: * means the largest proportion of area in the town.
© 2018 by the authors. Licensee MDPI, Basel, Switzerland. This article is an open access article distributed under the terms and conditions of the Creative Commons Attribution (CC BY) license (http://creativecommons.org/licenses/by/4.0/).
Share and Cite
MDPI and ACS Style
Li, F.; Liu, K.; Tang, H.; Liu, L.; Liu, H. Analyzing Trends of Dike-Ponds between 1978 and 2016 Using Multi-Source Remote Sensing Images in Shunde District of South China. Sustainability 2018, 10, 3504. https://doi.org/10.3390/su10103504
AMA Style
Li F, Liu K, Tang H, Liu L, Liu H. Analyzing Trends of Dike-Ponds between 1978 and 2016 Using Multi-Source Remote Sensing Images in Shunde District of South China. Sustainability. 2018; 10(10):3504. https://doi.org/10.3390/su10103504
Chicago/Turabian StyleLi, Fengshou, Kai Liu, Huanli Tang, Lin Liu, and Hongxing Liu. 2018. "Analyzing Trends of Dike-Ponds between 1978 and 2016 Using Multi-Source Remote Sensing Images in Shunde District of South China" Sustainability 10, no. 10: 3504. https://doi.org/10.3390/su10103504
Note that from the first issue of 2016, this journal uses article numbers instead of page numbers. See further details here.