An Analysis Method for Interpretability of CNN Text Classification Model


School of Computer Science and Technology, Jilin University, Changchun 130012, China
*
Author to whom correspondence should be addressed.
Future Internet 2020, 12(12), 228; https://doi.org/10.3390/fi12120228
Submission received: 10 November 2020
/
Revised: 9 December 2020
/
Accepted: 9 December 2020
/
Published: 13 December 2020
(This article belongs to the Section Smart System Infrastructure and Applications)
Abstract
:With continuous development of artificial intelligence, text classification has gradually changed from a knowledge-based method to a method based on statistics and machine learning. Among them, it is a very important and efficient way to classify text based on the convolutional neural network (CNN) model. Text data are a kind of sequence data, while time sequentiality of the general text data is relatively weak, so text classification is usually less relevant to the sequential structure of the full text. Therefore, CNN-based text classification has gradually become a research hotspot when dealing with issues of text classification. For machine learning, especially deep learning, model interpretability has increasingly become the focus of academic research and industrial applications, and also become a key issue for further development and application of deep learning technology. Therefore, we recommend using the backtracking analysis method to conduct in-depth research on deep learning models. This paper proposes an analysis method for interpretability of a CNN text classification model. The method proposed by us can perform multi-angle analysis on the discriminant results of multi-classified text and multi-label classification tasks through backtracking analysis on model prediction results. Finally, the analysis results of the model can be displayed using visualization technology from multiple dimensions based on interpretability. The representative data set IMDB (Internet Movie Database) in text classification is verified by examples, and the results show that the model can be effectively analyzed when using our method.
1. Introduction
Text classification refers to automatically classify and mark text sets using a computer according to a certain classification system or standard. It finds the model of relationship between document features and document categories based on a set of marked training documents, and then uses the learned relationship model to make category judgments on new documents. With continuous development of artificial intelligence, text classification has gradually changed from a knowledge-based method to a method based on statistics and machine learning. At present, two basic deep learning algorithms for processing sequences are recurrent the neural network and one dimensional convolutional neural network [1]. Among them, is a very important and efficient way to classify text based on the convolutional neural network (CNN) model, because the CNN text classification model can achieve better prediction accuracy and consume fewer computing resources [2]. Kim Y trained the CNN on the pre-trained word vectors for experiments of sentence level classification task and proved that a simple CNN can obtain good results on multiple benchmarks with only a few super parameter adjustments and static vectors [3]. Kim, H proposed a kind of convolutional neural network for the task of emotion classification and proved the effectiveness of using a continuous convolutional layer for longer texts through experiments with three famous data sets. Therefore, CNN-based text classification has gradually become a research hotspot when dealing with issues of text classification.
The current research on CNN-based text classification can be roughly divided into the following two categories. One is research on the method of CNN-based text classification [4]. Wu YuJia et al. proposed a framework based on high utility neural networks for text classification. Which can effectively mine the importance of the text features and their association. MHUI (Mining High Utility Itemsets) from databases is an emerging topic in data mining. It can mine the importance and the co-occurrence frequency of each feature in the dataset. The co-occurrence frequency of the feature reflects the association between the text features. Using MHUI as the mining layer of HUNN (High Utility Neaural Networks), it is used to mine strong importance and association text features in each type, select these text features as input to the neural networks. Then, acquire the high-level features with a strong ability of categorical representation through the convolution layer for improving the accuracy of model classification [5]. L. Fu et al. proposed that the effectiveness of such techniques has not been assessed for the hierarchical text classification (HTC) yet. This study investigates the application of those models and algorithms on this specific problem by means of experimentation and analysis. They trained classification models with prominent machine learning algorithm implementations—fastText, XGBoost, SVM (Support Vector Machines), and Keras’ CNN—and noticeable word embeddings generation methods—GloVe, word2vec, and fastText—with publicly available data and evaluated them with measures specifically appropriate for the hierarchical context. FastText achieved an LCAF1 (Least Common Ancestors) of 0.893 on a single-labeled version of the RCV1(Ruters database) dataset [6]. Jin, R. proposed a new architecture of CNN based on multiple representations for text classification, by constructing multiple planes so that more information can be dumped into the networks, such as different parts of text obtained through a named entity recognizer or part-of-speech tagging tools, different levels of text embedding, or contextual sentences. Various large-scale, domain-specific datasets are used to validate the proposed architecture. It can obtain further gains in performance over state-of-the-art deep neural network models [7]. Wang, Lixia et al. proposed a method of CNN-based text classification for power failure in response to the characteristics of power failure text, input the processed data set information into this classification model to classify the short text of power failure. Experiments showed that the accuracy of the proposed classification model on the data set can reach 88.35%, and better classification effects were achieved [8]. Zhang T et al. mainly discussed the use of CNN to extract features from the comment text of blogs and shopping websites. The author believed that reasonable use of such information could help understand public opinions, and respond in a timely manner, help distributors improve product quality and service levels, and enable consumers to understand the commodities. The final experiment showed effectiveness of the method [9]. Xiaoli Zhao et al. proposed a dual-input convolutional neural network structure in response to the phenomenon that more and more depression patients use Weibo as a way of self-expression nowadays. This method could take the external features and semantic features of the text as input and compare the accuracy of algorithm classification through SVM and CNN. The final experiment showed that CNN could further improve the accuracy of classification. The other is research on text classification methods based on the CNN mixed model [10]. L. Fu et al. proposed an effective text classification framework. This framework is a CNN–BLSTM (Long Short Term Memory) network that mixes character-level and word-level features with different weights through content-based concatenation, which overcomes the difference in semantic relations in Chinese in Chinese word segmentation. This leads to the problem of ambiguity in word segmentation, and the proposed method makes up for such problems [11]. Zhang et al. proposed a CNN–LSTM–Attention coordination model. The author learned the vector representation of sentences in the CCLA(CNN-LSTM-Attention) unit. The semantic and emotional information of the sentences and their relationships are adaptively encoded into the vector representation of the document. Compared with other methods, the CCLA model can capture local and long-distance semantic and emotional information very well, and the effectiveness of the model is proven through experiments [12]. Kai Chen et al. proposed a compact CNN–DBLSTM (Long Short Term Memory) model. It has fewer parameters and low computational cost and can adapt to multiple receiving fields extracted based on CNN features. The author trained the compact CNN–DBLSTM by using the training set of the popular benchmark database, and finally combined this character model with the character trigram language model [13]. Usama, Mohd et al. proposed a new recurrent convolutional attention neural model for sentiment classification of the short text by using the attention mechanism with a recurrent convolutional neural network (RCNN). In the proposed model attention score is calculated by averaging hidden units (feature maps) generated from long short-term memory (LSTM). Then we combined this attention score with recurrent convolution-based encoded text features to obtain final sentence representation. Here, attention will be focused on important text features, and recurrent convolution makes full use of limited contextual information by processing sentence representation through different window sizes with specialized recurrent convolution operation [14]. She, Xiangyang proposed an algorithm that uses the Skip-Gram (continuous skip-gram) model and the continuous bag-of-words (CBOW) model in word2vec to represent words as vector, using CNN to extract local features of text, LSTM saves historical information, extracts contextual dependencies of text, and uses the feature vector output by CNN as the input of LSTM, using the Softmax classifier for classification [15]. Guo, Long et al. proposed a hybrid CNN–RNN attention-based neural network, named CRAN, which combines the convolutional neural network and recurrent neural network effectively with the help of the attention mechanism. We validate the proposed model on several large-scale datasets and compare it with the state-of-the-art models. Experimental results show that CRAN can achieve state-of-the-art performance on most of the datasets. In particular, CRAN yields better performance with much fewer parameters compared with a very deep convolutional networks with 29 layers, which proves its effectiveness and efficiency.
Machine learning, especially deep learning, model interpretability [16] has increasingly become the focus of academic research and industrial applications, and also has become a key issue for further development and application of deep learning technology. Therefore, we recommend using the interpretability of the model to analyze the CNN classification model and propose an analysis method for interpretability of the CNN text classification model. The greatest achievements of this paper are as follows:
- The analysis method for interpretability of the CNN text classification model. The method proposed by us can perform multi-angle analysis on the discriminant results of multi-classified text and multi-label classification tasks through backtracking analysis on model prediction results.
- Using the data visualization technology to display model analysis results. Finally, the method proposed by us can display the analysis results of the model using visualization technology from multiple dimensions based on interpretability.
The rest of this paper is arranged as follows. Section 2 introduces the analysis method that we recommend to use for interpretability of the CNN text classification model. Section 3 introduces how to use visualization technology to display and analyze the model analysis results. Section 4 evaluates our method through experiments. Section 5 discusses the related work, and summarizes the full text.
2. Interpretability Analysis Method
The overall process of the interpretability evaluation method proposed in this paper is shown in Figure 1. First, preliminary preprocessing was required for original text data, and the vectorized text after preprocessing was used as the input of the CNN text classification model. After calculation of the CNN text classification model, the category label of the text was obtained, then the category label was used as the input of the backtracking analysis model, and the contribution value of the words in the text was calculated through reverse backtracking. Finally, the analysis was performed according to interpretability of the model, and the analysis results were displayed in a visualized way. Next, we will introduce the internal structure of the CNN text classification model and the backtracking analysis model in detail.
2.1. Text Data Preprocessing
Text preprocessing mainly includes operations such as word segmentation, stop word removal, part-of-speech tagging, etc. The text characteristics of different languages are different, and the processing methods may be different. Here, we recommend decomposing the text into separate meaning signs, such as: words in English and words in Chinese. For a text composed of multiple identifiers, this method needs to transform each identifier into a distributed representation, which is used as the input of the CNN text classification model.
2.2. CNN Text Classification Model
Word embedding in the CNN-based text classification model is a method of converting words in the text into digital vectors. In order to use the standard machine learning algorithm to analyze them, it is necessary to take these vectors converted into numbers as input in digital form [17]. The method in this paper is to analyze based on the CNN text classification model. The structure of the CNN text classification model is generally as shown in Figure 2. In order to store word embeddings, we need a V*D matrix, where V is the size of the vocabulary, and D is the dimension of word embedding. The dimension of word embedding is a user-defined hyperparameter. The larger D is, the stronger the expressive ability of word embedding. In the model, the matrix is called the embedding layer. According to the text length and the classification performance indicators, multiple convolutional layers and pooling layers can be adopted to build the model. In general, for short text with a length of less than 50 words, we recommend using one convolutional pooling layer. Two convolutional pooling layers can be adopted for text with a length of 500 words or less. The structure and hyperparameters of the model can be determined with the deep learning model training method. The convolutional pooling layer is generally followed by a densely connected layer. Among them, common general pooling methods include max-pooling and average pooling. In this paper, the max-pooling method is used to achieve the effect of obtaining the maximum value, in each feature graph by the feature graph unit before the classification layer through global maximum pooling. Finally, the classification layer is connected according to the actual classification number, which can be two-class or multi-class.
It shall be noted that when it is required to perform multi-classification tasks at the classification layer, the number of target labels for multi-label classification is generally uncertain. For this reason, we recommend determining a target label S0. When predicting, it is still the k classes with the largest output scores, but only the classes with scores greater than S0 are output using S0 as the threshold.
2.3. Backtracking Analysis Model
The model is based on the results of CNN text classification (which can be single-label or multi-label). The important factors affecting the prediction results are tracked through backtracking analysis of labels calculated according to the model. Because the convolutional neural network is a representation of visual concepts learned, so convolution neural network suitable for visualization, for a given input, through the “class of each channel to the importance “ to “the strength of the activation of different channels in the input text” of the weighted space diagram, can show the convolution and pooling layer in the network output, in the process of the training of the model, each layer using forecast and parameter values will be stored in the model, we can move along the direction of the gradient layers of backtrack analysis. The reverse backtracking analysis model is shown in Figure 3. A text was classified based on the trained CNN text classification model mentioned in Section 2.2, and reverse backtracking was performed by category label. Reverse calculation of the predicted results was performed through multiple densely connected layers, pooling layers and convolutional layers, so as to calculate the degree of influence of all parts of the text vector value entered on the prediction results. This degree of influence was a quantitative value for each point of the input vector and was also the basic data source for the subsequent model interpretability analysis. In addition to observing and explaining the internal structure of the CNN model, the deconvolution network could also be used to solve problems encountered during model building and debugging. A better classification model was obtained by analyzing the internal results, and the keywords affecting the text were obtained through text restoration.
The calculation formulae of quantitative values are shown in Equations (1) and (2), where xi represents the value of each dimension in the embedded layer of the word, and μ represents the median of the embedded layer matrix:
3. Interpretability Analysis of the Model
The current visualization research based on the convolutional neural network is divided into three directions: gradient-based filter visualization [18], upper convolution network visualization [19], and image region extraction and display visualization [20]. This paper mainly uses the idea of image region extraction to extract and output text regions that contribute to improvement of classification confidence. The interpretability analysis method we proposed based on the CNN text classification model is based on the basic data of backtracking analysis, which can provide a multi-dimensional and in-depth visual analysis diagram for interpretability of the model’s prediction results. Based on these visual analysis diagrams, we can further carry out various analyses, such as text representation methods and text word styles.
3.1. Visualization Diagram of Comment Weight
The backtracking analysis in the previous section provided a quantitative value of the importance of the model input vector to the predicted results. In response to the classification results of a text, the importance vector matrix was standardized and normalized, and the importance of keywords in the text was mapped to the RGB color value between 0 and 255. The Keyword -RGB mapping table as shown in Figure 4 was made. The vertical axis of the diagram corresponds to each identifier of the text, and the horizontal axis corresponds to each dimension of distributed representation of the identifier. The color value indicates the importance of words in the text. In this way, we could understand distribution of importance through the diagram as a whole. The text identification bar on the left of the diagram contains three parts, and the rightmost contained the classified text identification grid. The color represented the importance of each indicator to the prediction results, and the importance of each indicator was the mean value of the importance of its corresponding distributed representation. The middle and the left contained digital grids, corresponding to the frequency within the group and the criticality within the group, respectively. The grid color indicated the level of the value. This visualization diagram contained the importance data of each distributed representation dimension of each identifier. If the information of the same identifier in multiple texts is summarized, further analysis can be carried out.
3.2. Comments on Comprehensive Analysis Diagram
Through the data obtained from the experiment, we designed a comprehensive analysis diagram, which includes a word relevance analysis graph, a positive high frequency vocabulary graph, a negative high frequency vocabulary graph and a comprehensive analysis text of the data. Since there are many words, the words can be filtered by setting the weight threshold. After analysis, it was suggested to control the threshold within the range of (0.73, 0.85). Meanwhile, taking into account that the weights of words in different comments are different, we recommend the use of the formula shown in Equation (3) for weighted calculation of word weights, where Wi represents the weight value in the text, the MaxWi represents the maximum weight value, and the drawing of a comprehensive analysis diagram based on the calculation results.
In the comprehensive analysis diagram, we can see the classification list of positive comments and negative comments obtained after the model analysis. After clicking on the comment title in the list, you will enter the detailed analysis page of the currently clicked comment. This page includes the comment keyword bubble chart, comment keyword statistics chart, comment mark text and intelligent analysis text. It can effectively help users analyze the analysis results of the model.
4. Experimental Design and Result Analysis
4.1. Experiment Environment
The experimental model and data processing in this paper were completed based on Python’s Keras, and the word embedding model used was word2vec.
4.2. Selection and Processing of Data Set
A commonly used data set, IMDB, in text classification application was used in the experiment to verify the application effects of our proposed method in the actual process. The IMDB data set contained 50,000 English texts of movie comments with obvious bias. Among them, there were 25,000 positive and negative samples, which were the positive and negative comments of users on the movie, respectively.
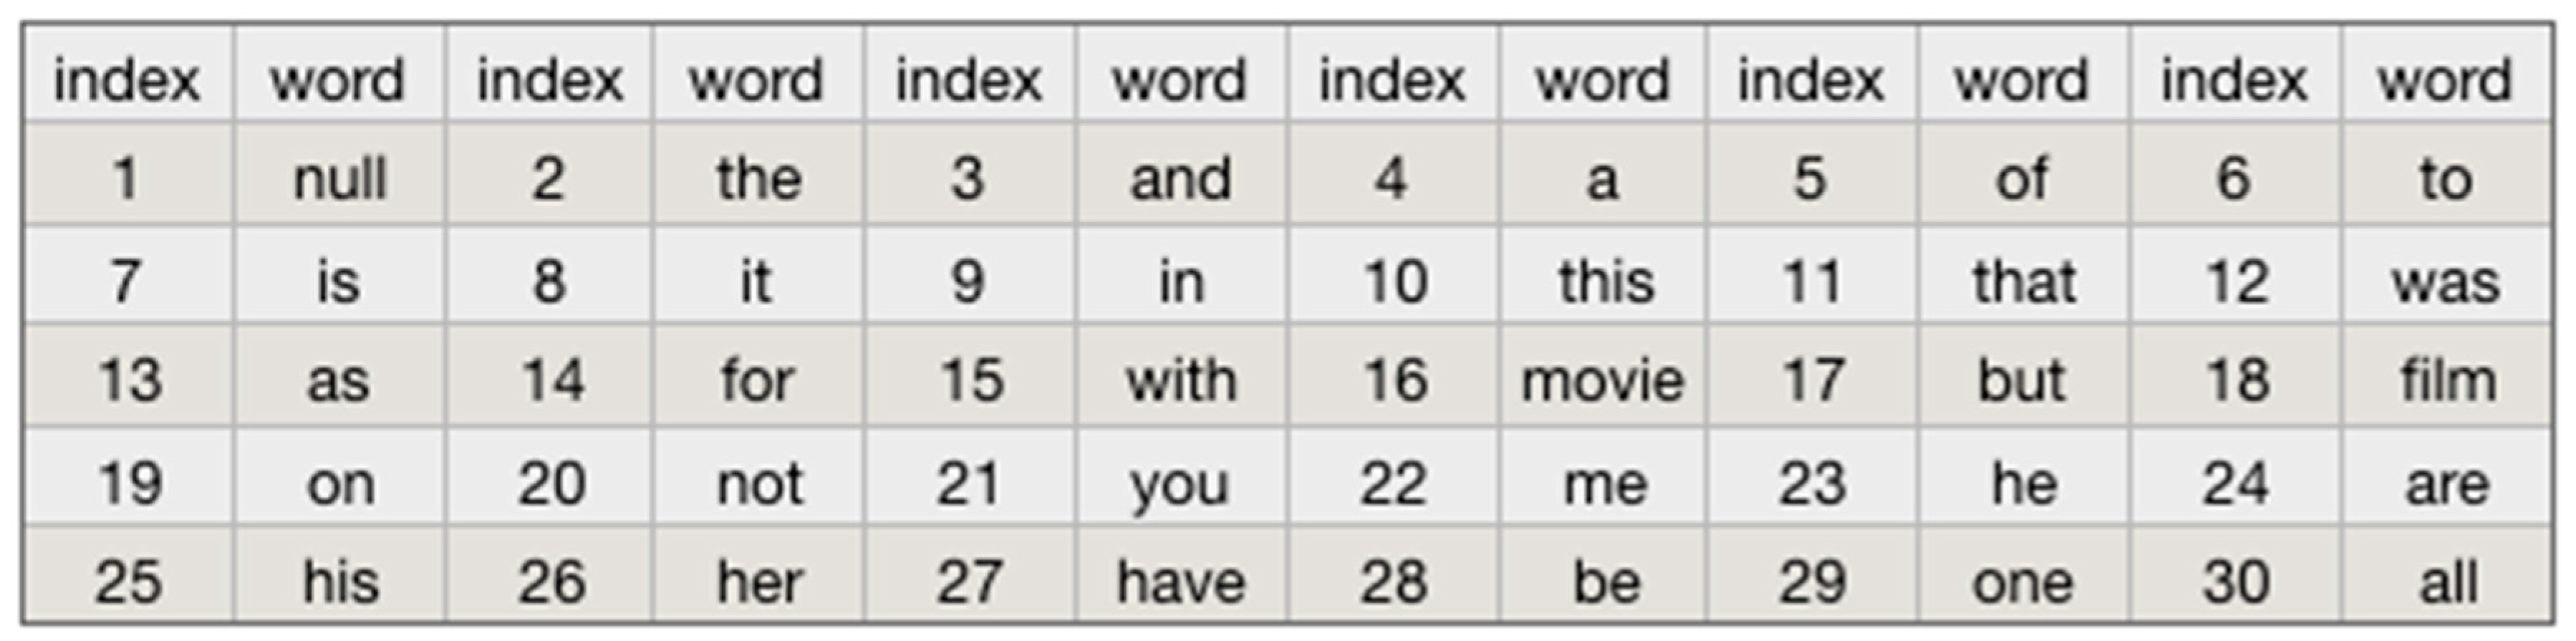
First of all, we shall design a dictionary with a fixed length, and the dictionary contains the words that appear in the data set. The position of the word in the dictionary shall be arranged in descending order according to the frequency of the word in the data set. After sorting, we obtain a word frequency dictionary with a size of 89,527 as shown in Figure 5. Where 0 does not represent any specific word, but is used to encode unknown words. In the experiment, we set the maximum number of words as 10,000, that is only 10,000 words in the article sorted by word frequency were extracted. After obtaining a dictionary, you can find the index of the word given in the dictionary. The word vector is to represent each word by its index in the dictionary. According to the actual situation, we suggest that each comment be uniformly constructed into a word vector with a length of 500, and the short text is filled with 0 (null) at the beginning of the sentence. Finally, input the word vector of each comment processed into the CNN text classification model.
4.3. Experiment Design
(A) CNN text classification model
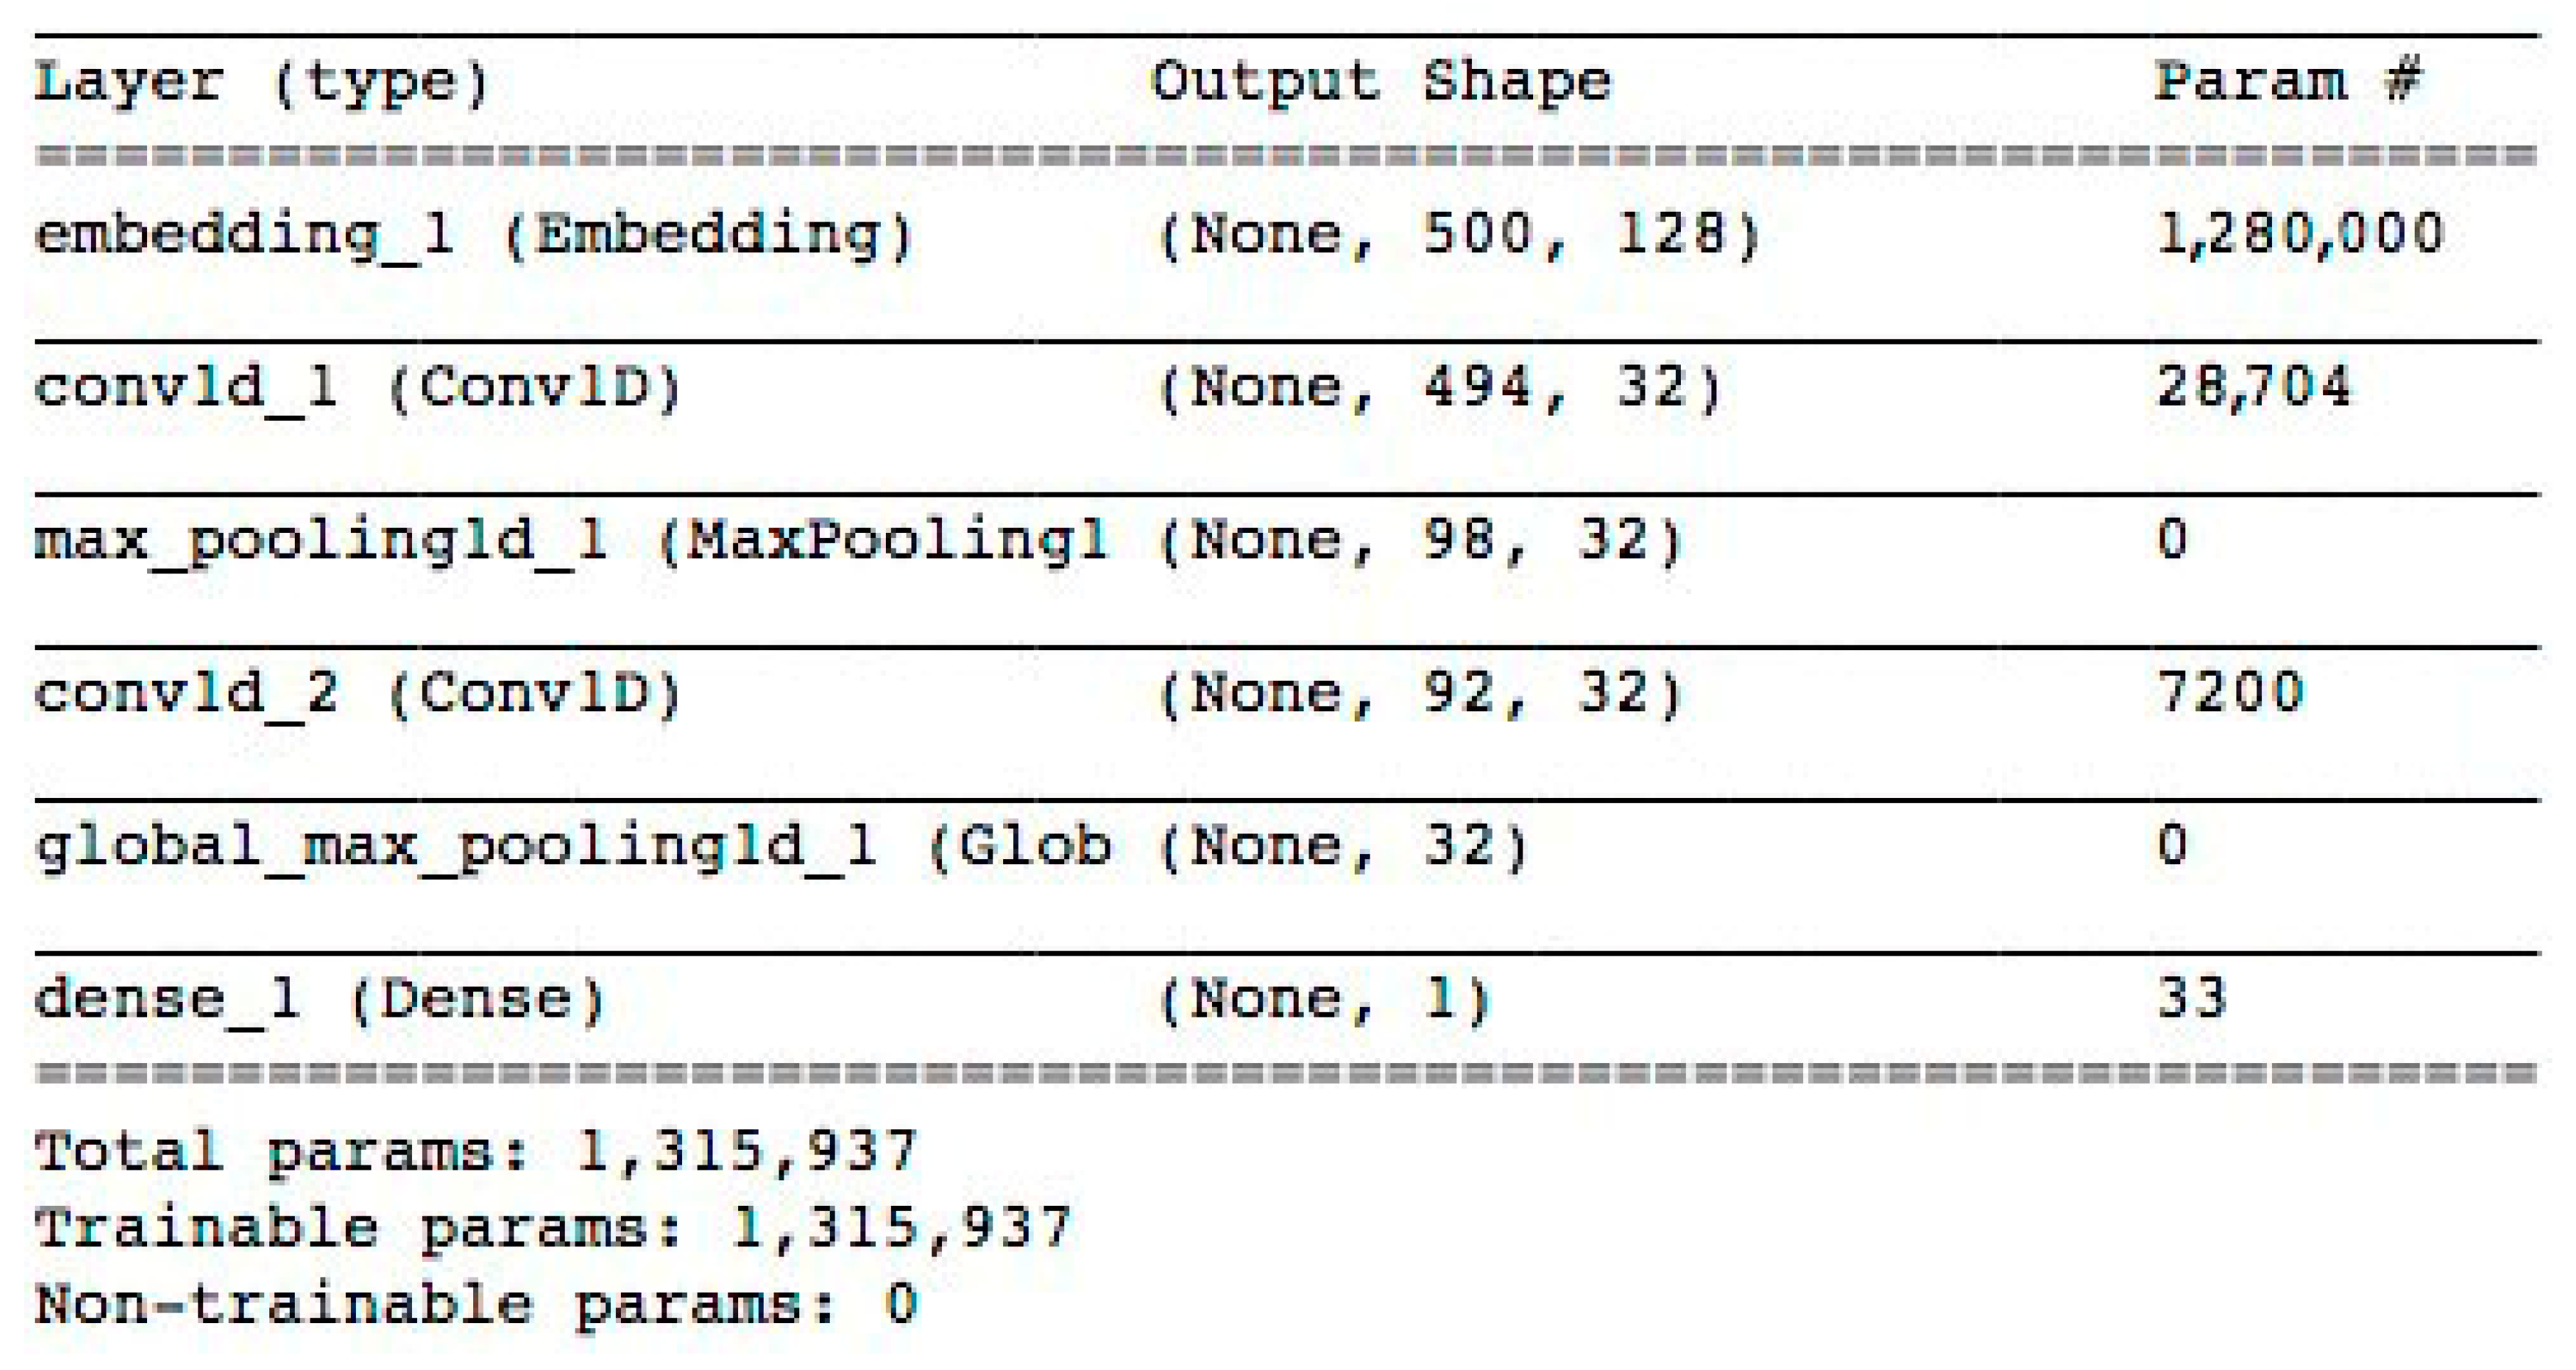
Based on the CNN model, this paper suggests combining word embedding with it, so that the performance of the CNN on sentiment text classification tasks can be optimized. The specific CNN text classification model is designed as follows: find the word embedding of each word appearing in each sample in the word vector list trained by the Skip-gram model, and combine it into an m*k two-dimensional matrix as the input of CNN. Where, m is the number of words contained in each comment in the data set, and k is the length of word embedding. In this experiment, m is uniformly controlled to 500 words, and 128 is selected as the length of each word embedding. The representation of CNN learning is more suitable for the visual, and dealing with non-time series problems consumes fewer resources. At the same time, in the experiments we found that for text within 50 words a convolution pooling layer can be set, and within 500 words of text two convolution pooling layer can be used, so according to the demand of the actual data, the CNN model uses two convolutional pooling layers. The convolutional pooling layer is followed by a densely connected layer. As the convolutional layer in the model uses multiple convolution kernels, sufficient local features are extracted, and the accuracy of the experimental model reaches 89%. Therefore, before the classification layer of the model, in order to reduce the parameters of the model, we use the global max-pooling method. The structure of the convolutional neural network in the model is shown in Figure 6, and the binary classification was used as the output of the final model.
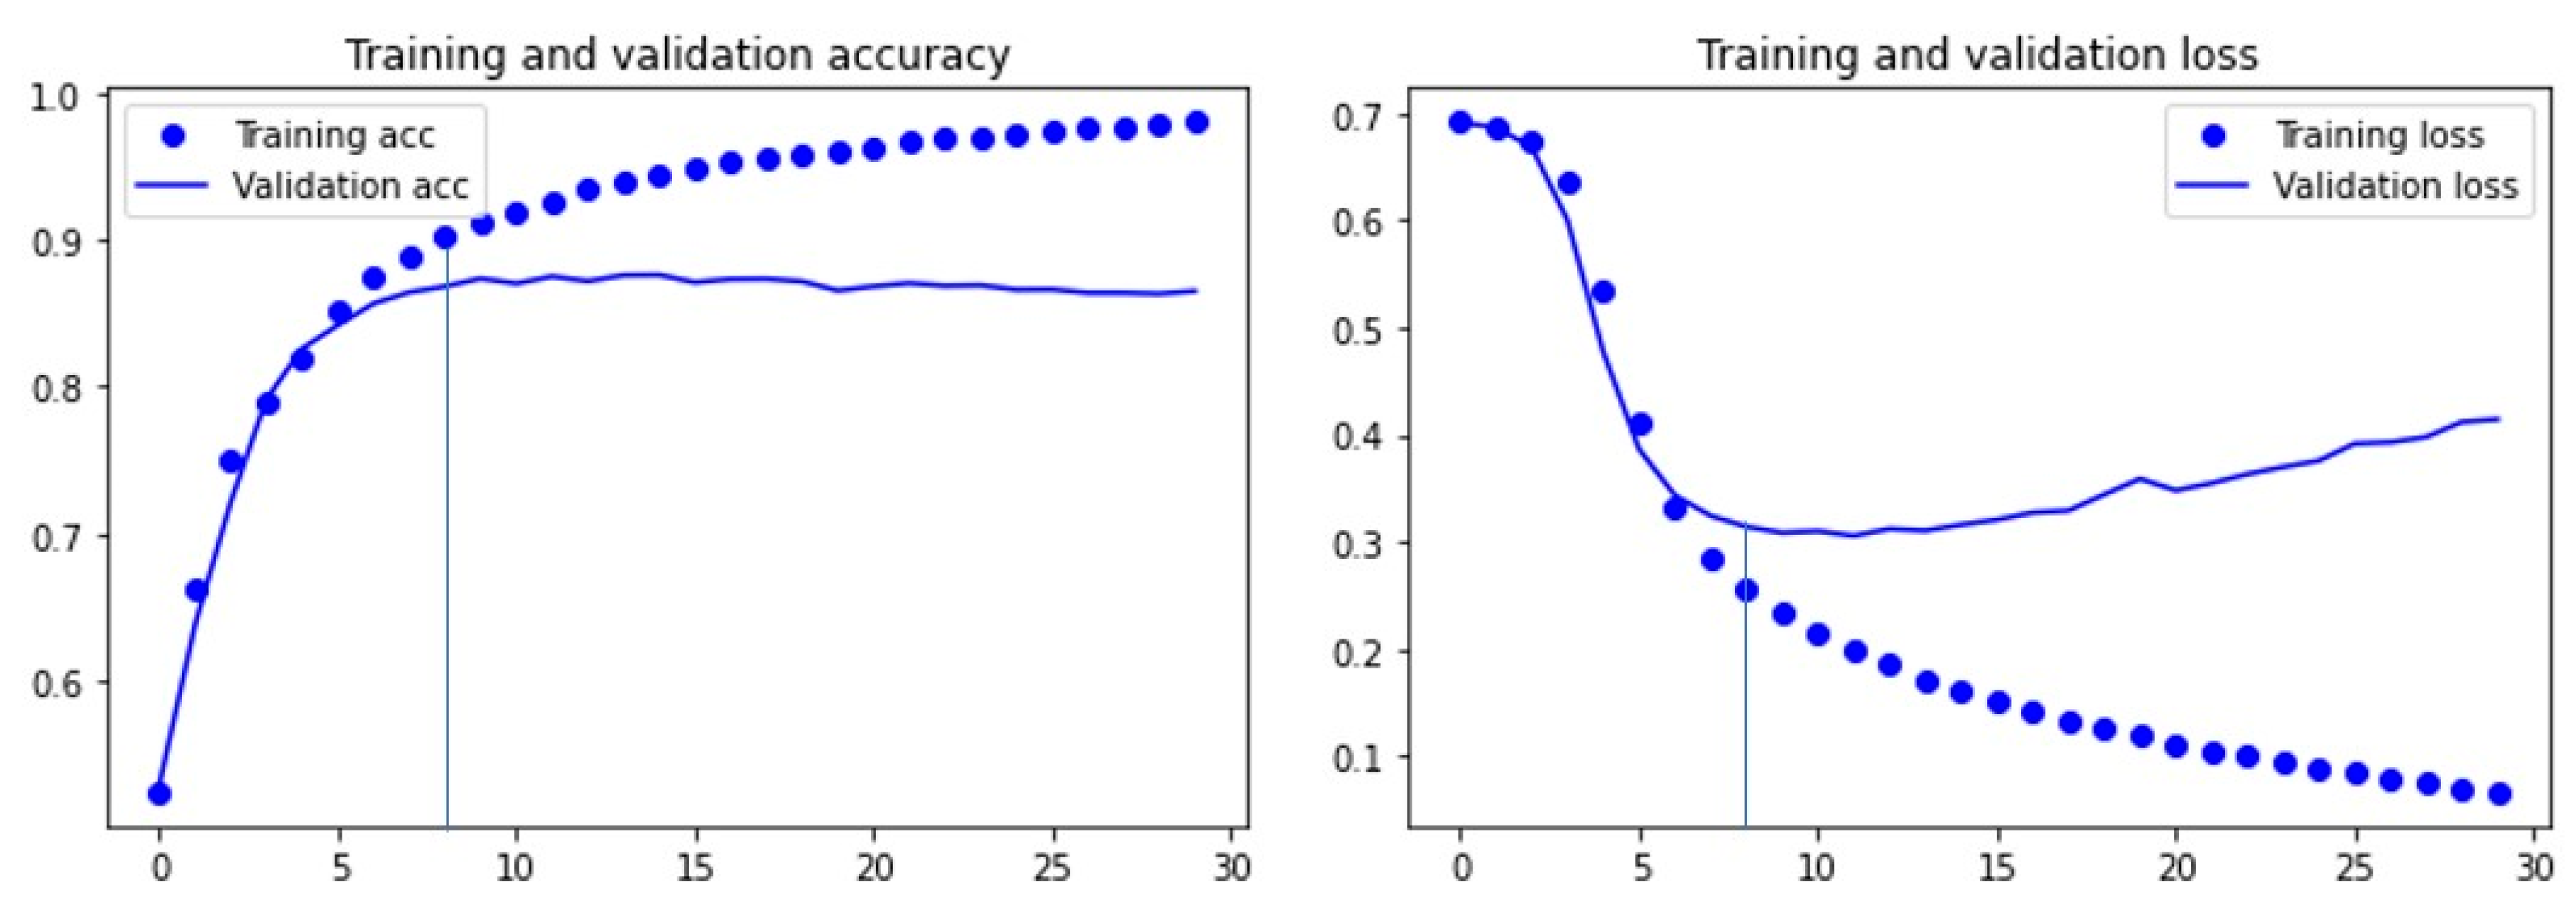
The CNN text classification model was iterated for 30 rounds, as shown in Figure 7; the horizontal axis represents the number of iterations, the vertical axis represents the accuracy in the left figure, and the vertical axis represents the loss in the right figure. For training and testing the process model accuracy and loss of the function curve, we conducted the test ten times. Through the test we can see from the picture that when the model is the eighth round of iteration the model is in the best condition, when the number of iterations is more than 10 rounds, model validation set loss gradually increased as a result, so we suggest the model number of iterations in round 8 for the best control.
One of the fundamental problems in machine learning is the contradiction between optimization and generalization. In this paper, multi-round iteration is used to train the model. In order to prevent the overfitting of the model, the optimal iteration times of the model can be determined. In the experiment, after 30 rounds of training, we found that the model began to overfitting after 8–10 rounds, and then set the number of iterations to 8 to retrain the model. Since the accuracy of the model affects the interpretability of the model, the prediction results obtained by using the model with the required accuracy are more meaningful, thus the interpretability and visualization results obtained by model backtracking analysis are meaningful. In the process of model training, the above methods are used to adjust the model to prevent overfitting.
(B) Backtracking analysis model
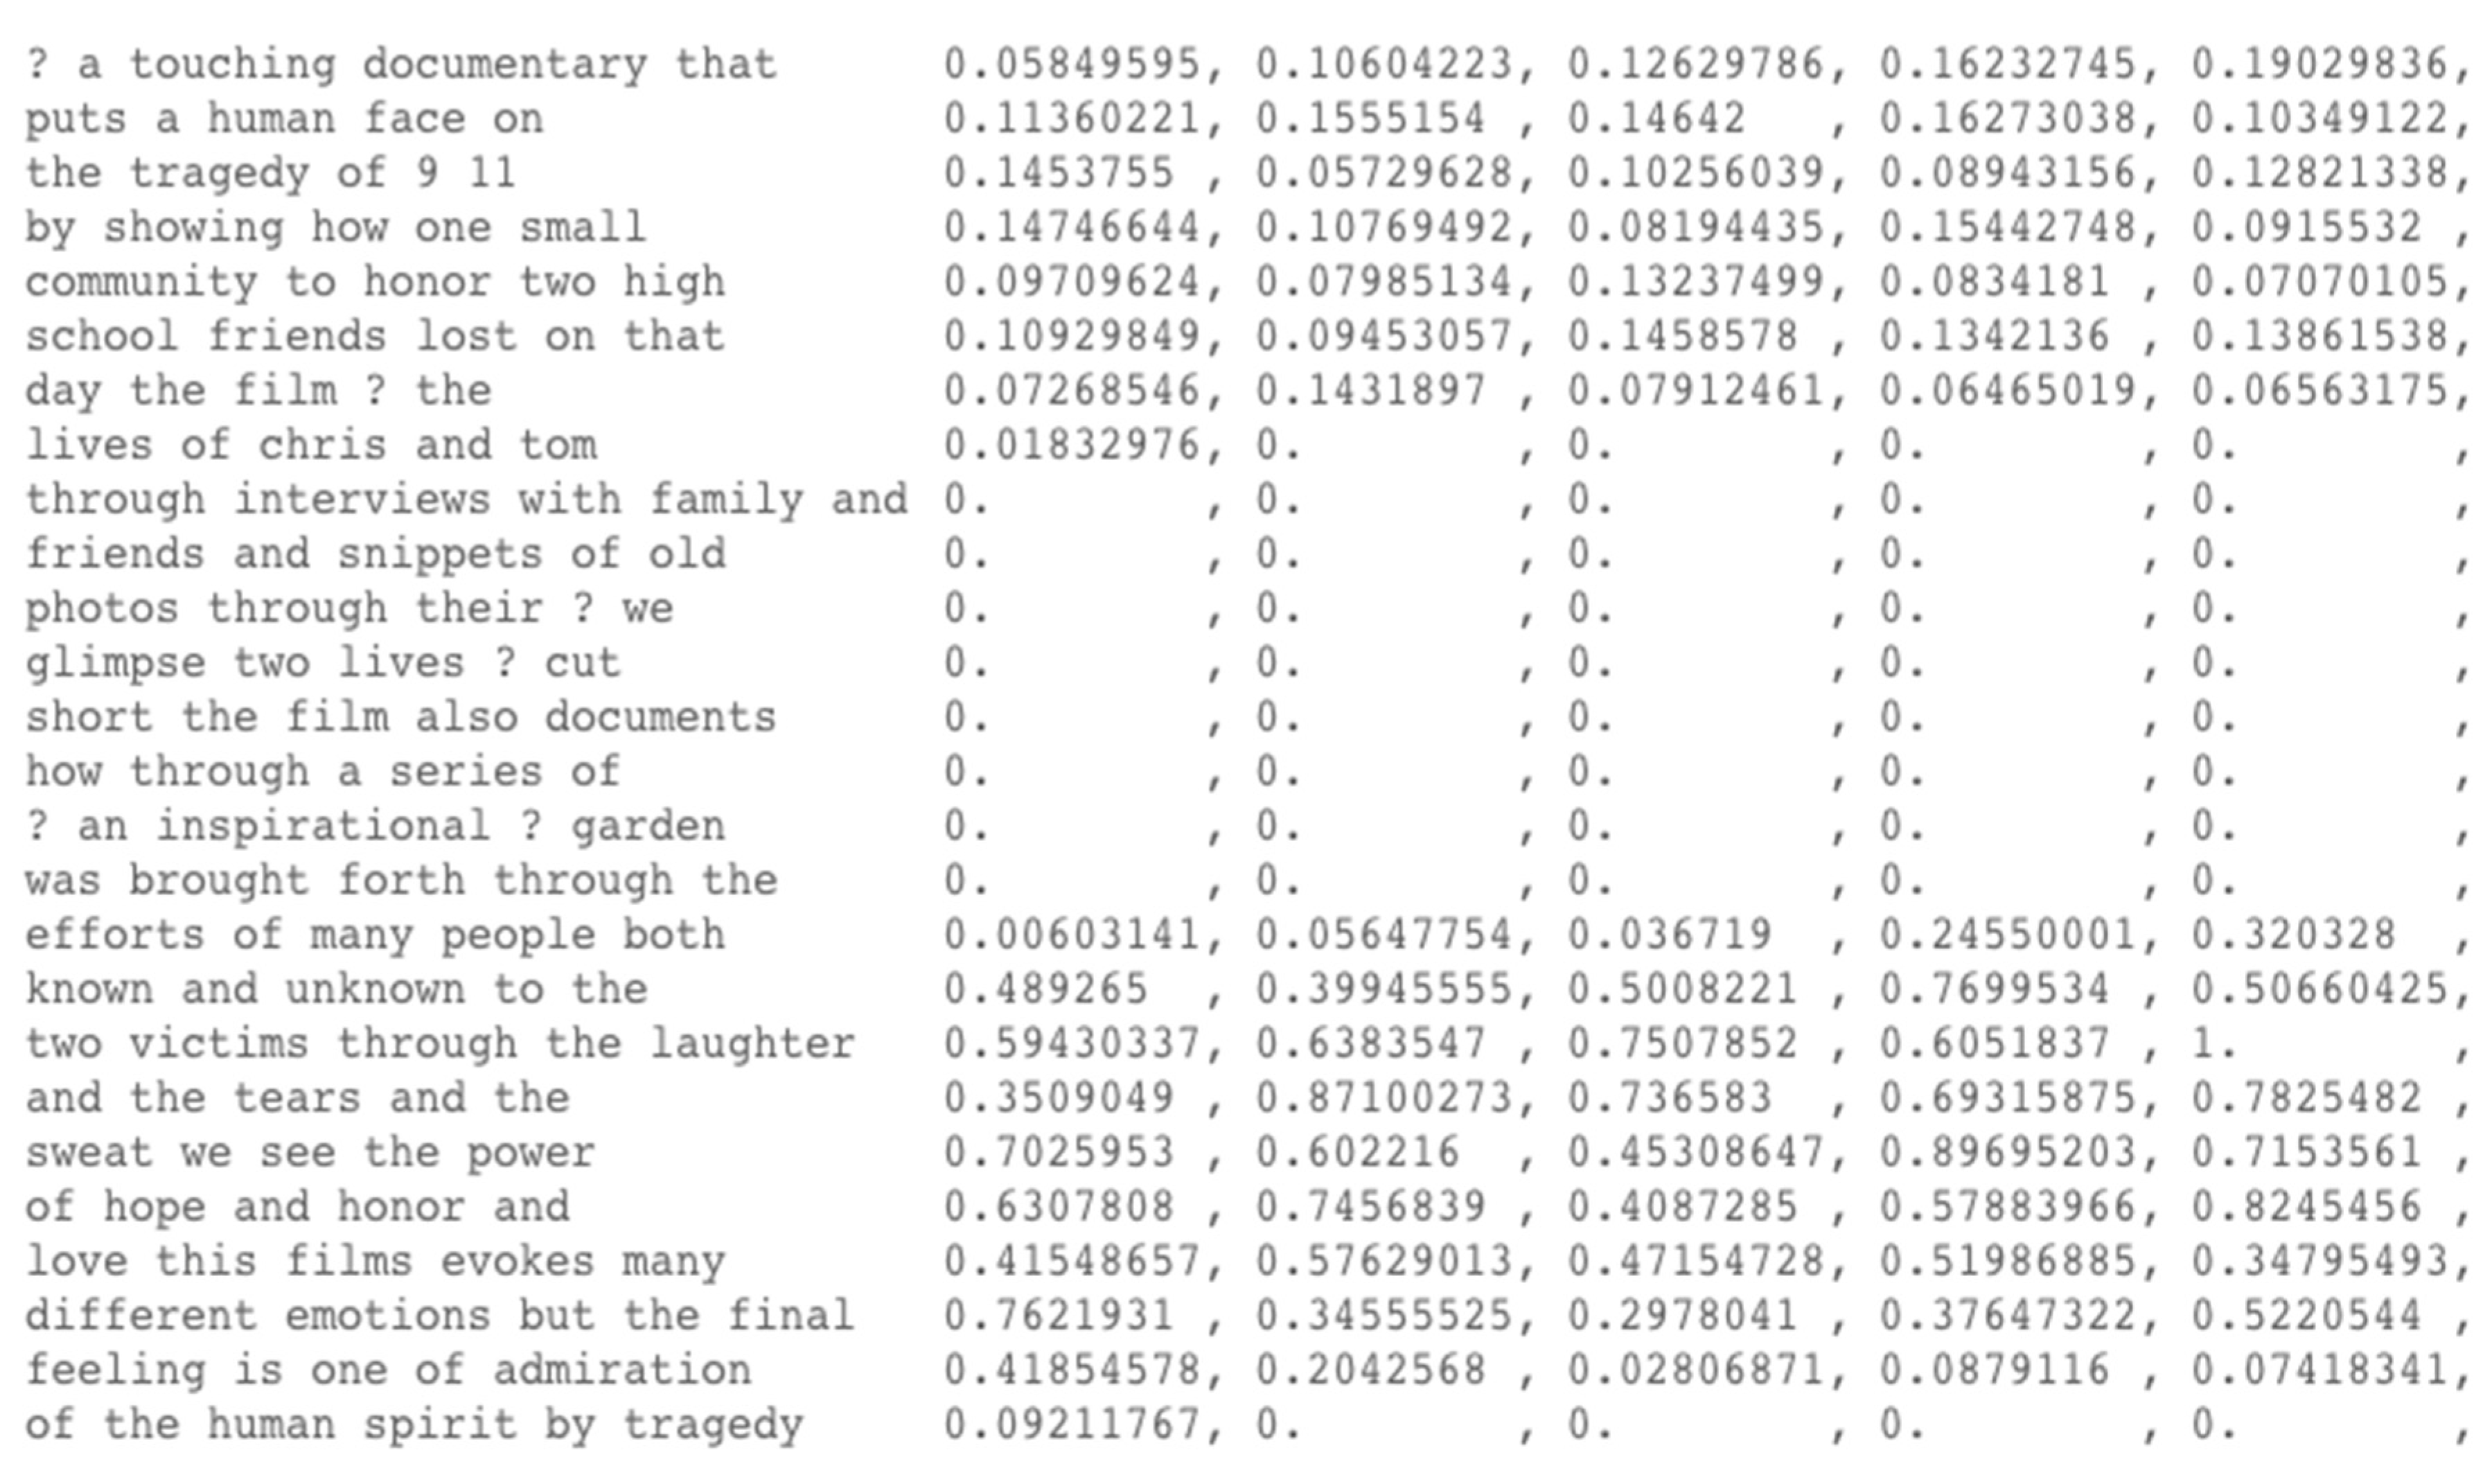
After calculation of the CNN text classification model, we obtained the category label of the current text. There were two types of labels in the experiment (positive evaluation and negative evaluation). According to the backtracking analysis method mentioned above, we first obtained the category labels output by the CNN text classification model, performed backtracking analysis on the key parts of the text that affected the model’s prediction results through deconvolution and depooling operations, and provided a basic data source for the subsequent visual analysis of experimental results. The results of backtracking analysis of a comment in the data set (No.14_8) were shown in Figure 8. The left side of the figure was the original text of the comment, and the comment was composed of 131 words. The right was the weight matrix of 131 words obtained after backtracking analysis. According to the judgment of the CNN text classification model, the comment was a positive evaluation. Next, we will use the visualization method to find the basis for judgment of the text classification model.
4.4. Visual Analysis of Experimental Results
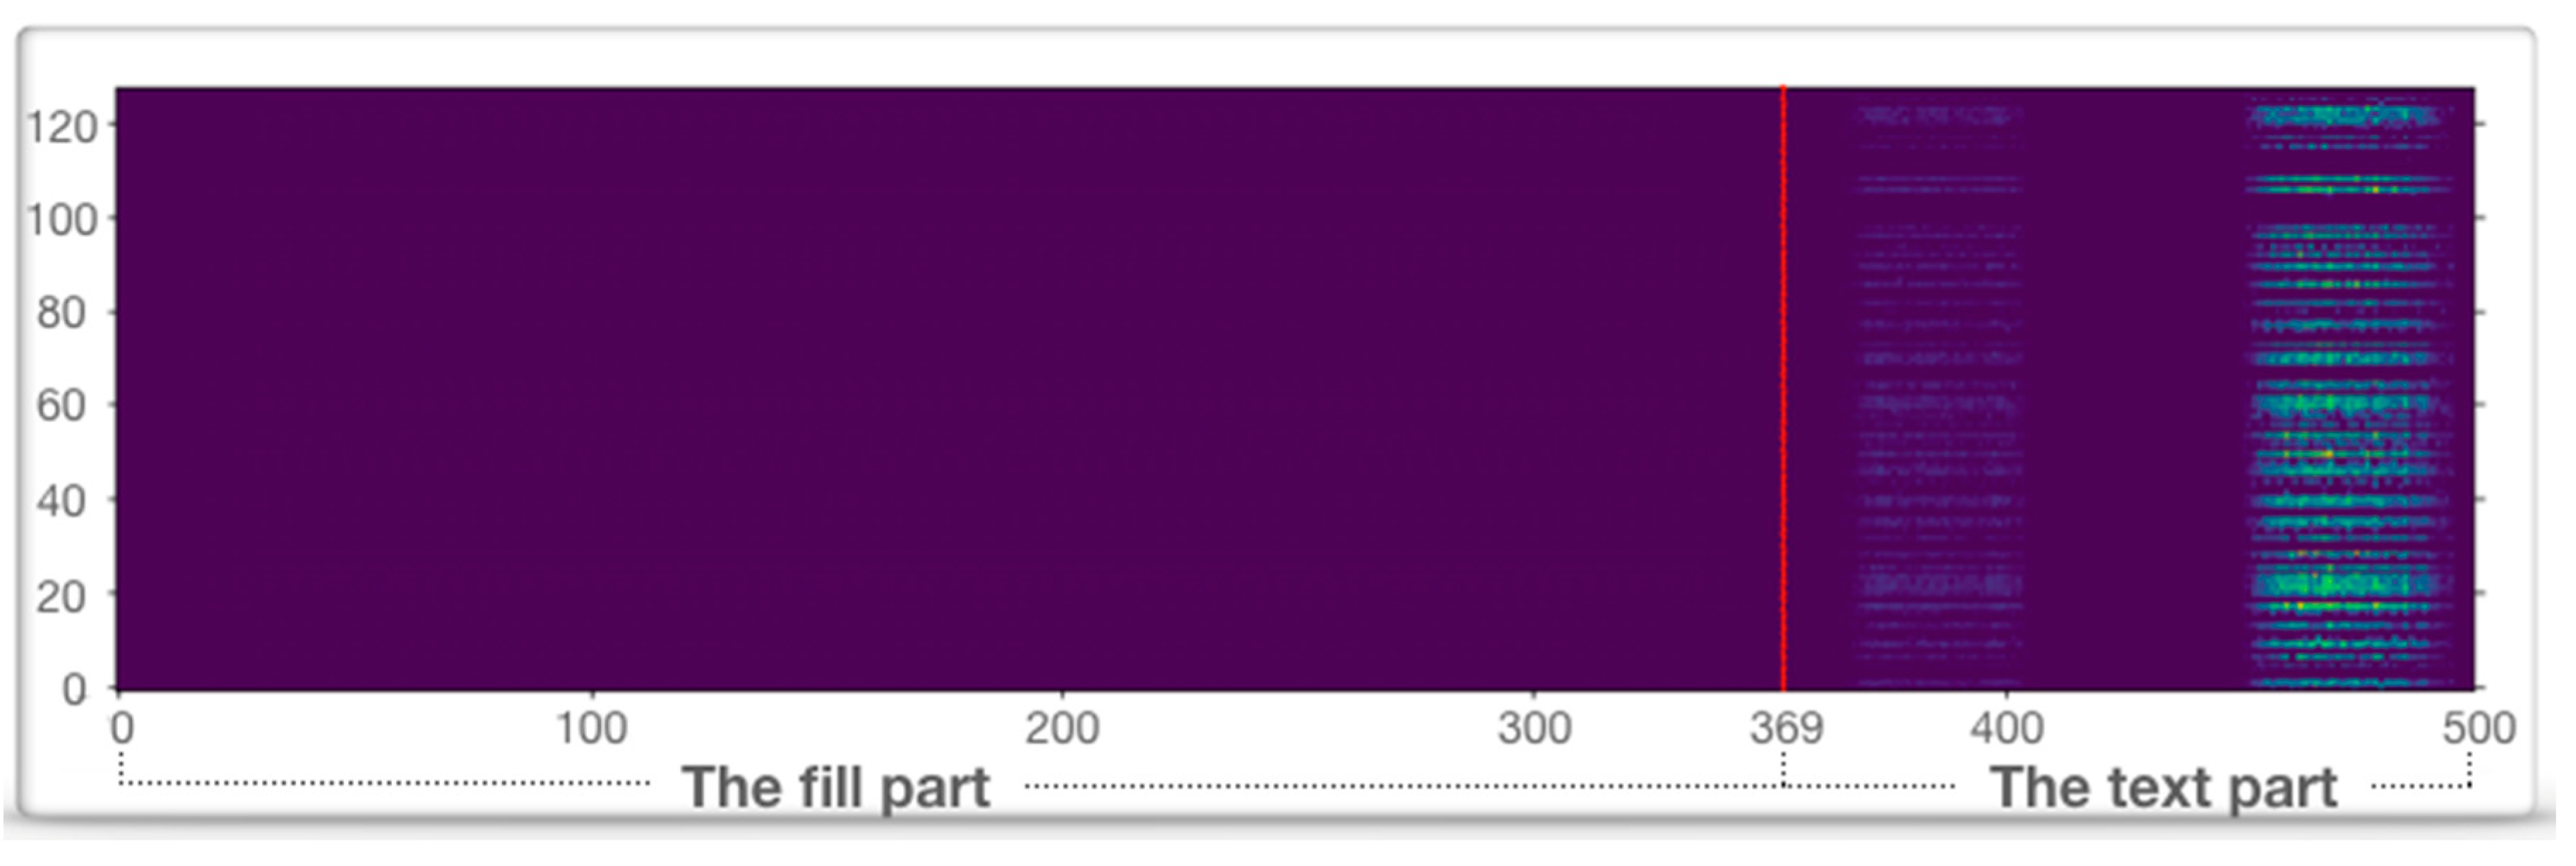
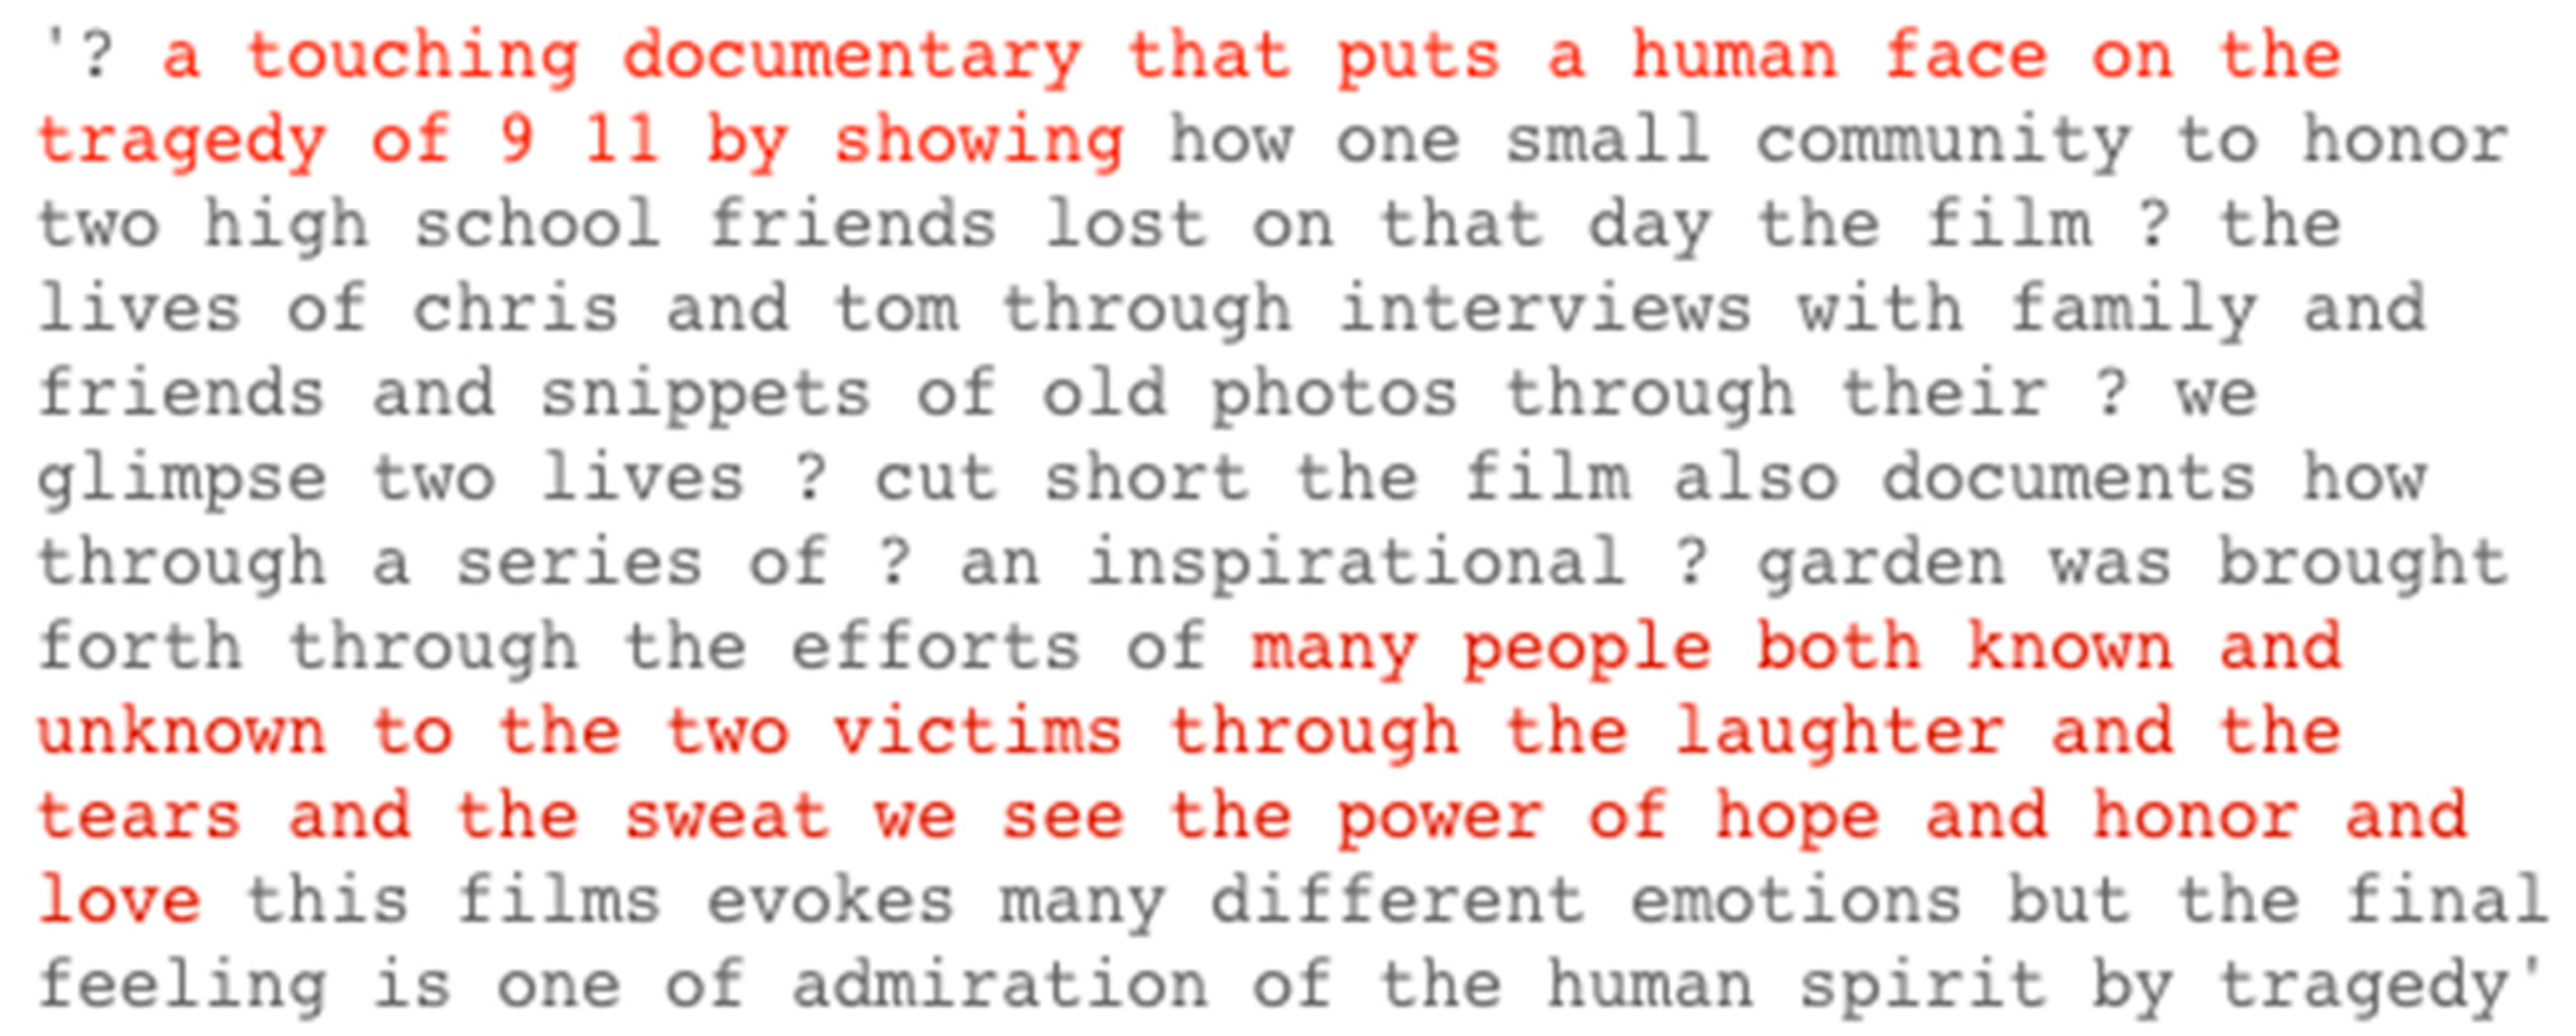
In order to evaluate and analyze model interpretability in more detail, we used data visualization technology. According to the weight matrix obtained by the backtracking model in Section 4.3, we performed standardization and normalization, mapped the importance of the keywords in the text to the RGB color value between 0 and 255, after that, all the weight values are uniformly compressed between (0, 1). Then we use the matlibplot library in python to visually display the weight matrix and obtained the visualized diagram of the word embedding weight (Figure 9). Since the current text consists of 131 words, the first 369 words of the text were filled text. The horizontal axis of the diagram corresponded to each identifier of the text, and the vertical axis corresponded to each dimension of distributed representation of the identifier. The color value indicated the importance of words in the text. At the same time, in order to further observe effects of the model, we integrated the embedding layer of the word according to calculation of the quantitative value, and magnified the result by 5 times for display (Figure 10). From the figure, we can see that the word weight at two positions in the comment had the darkest color. The area with the darkest color was between 461 words and 490 words, and the second was between 381 words and 397 words. According to the comparison between the results and the original text (Figure 11), we can find that two most important parts affecting model prediction expressed positive comments on the movie. In the experiments, we randomly sampled 1000 pieces of data from the dataset; the results are based on the interpretability model (including weight and weight visual figure), the two authors judged the emotional disposition of 1000 comments and got a Kappa coefficient of 0.67, that indicates high internal consistency, and both authors have high accuracy in judging the results, thus proving the effectiveness of the proposed method.
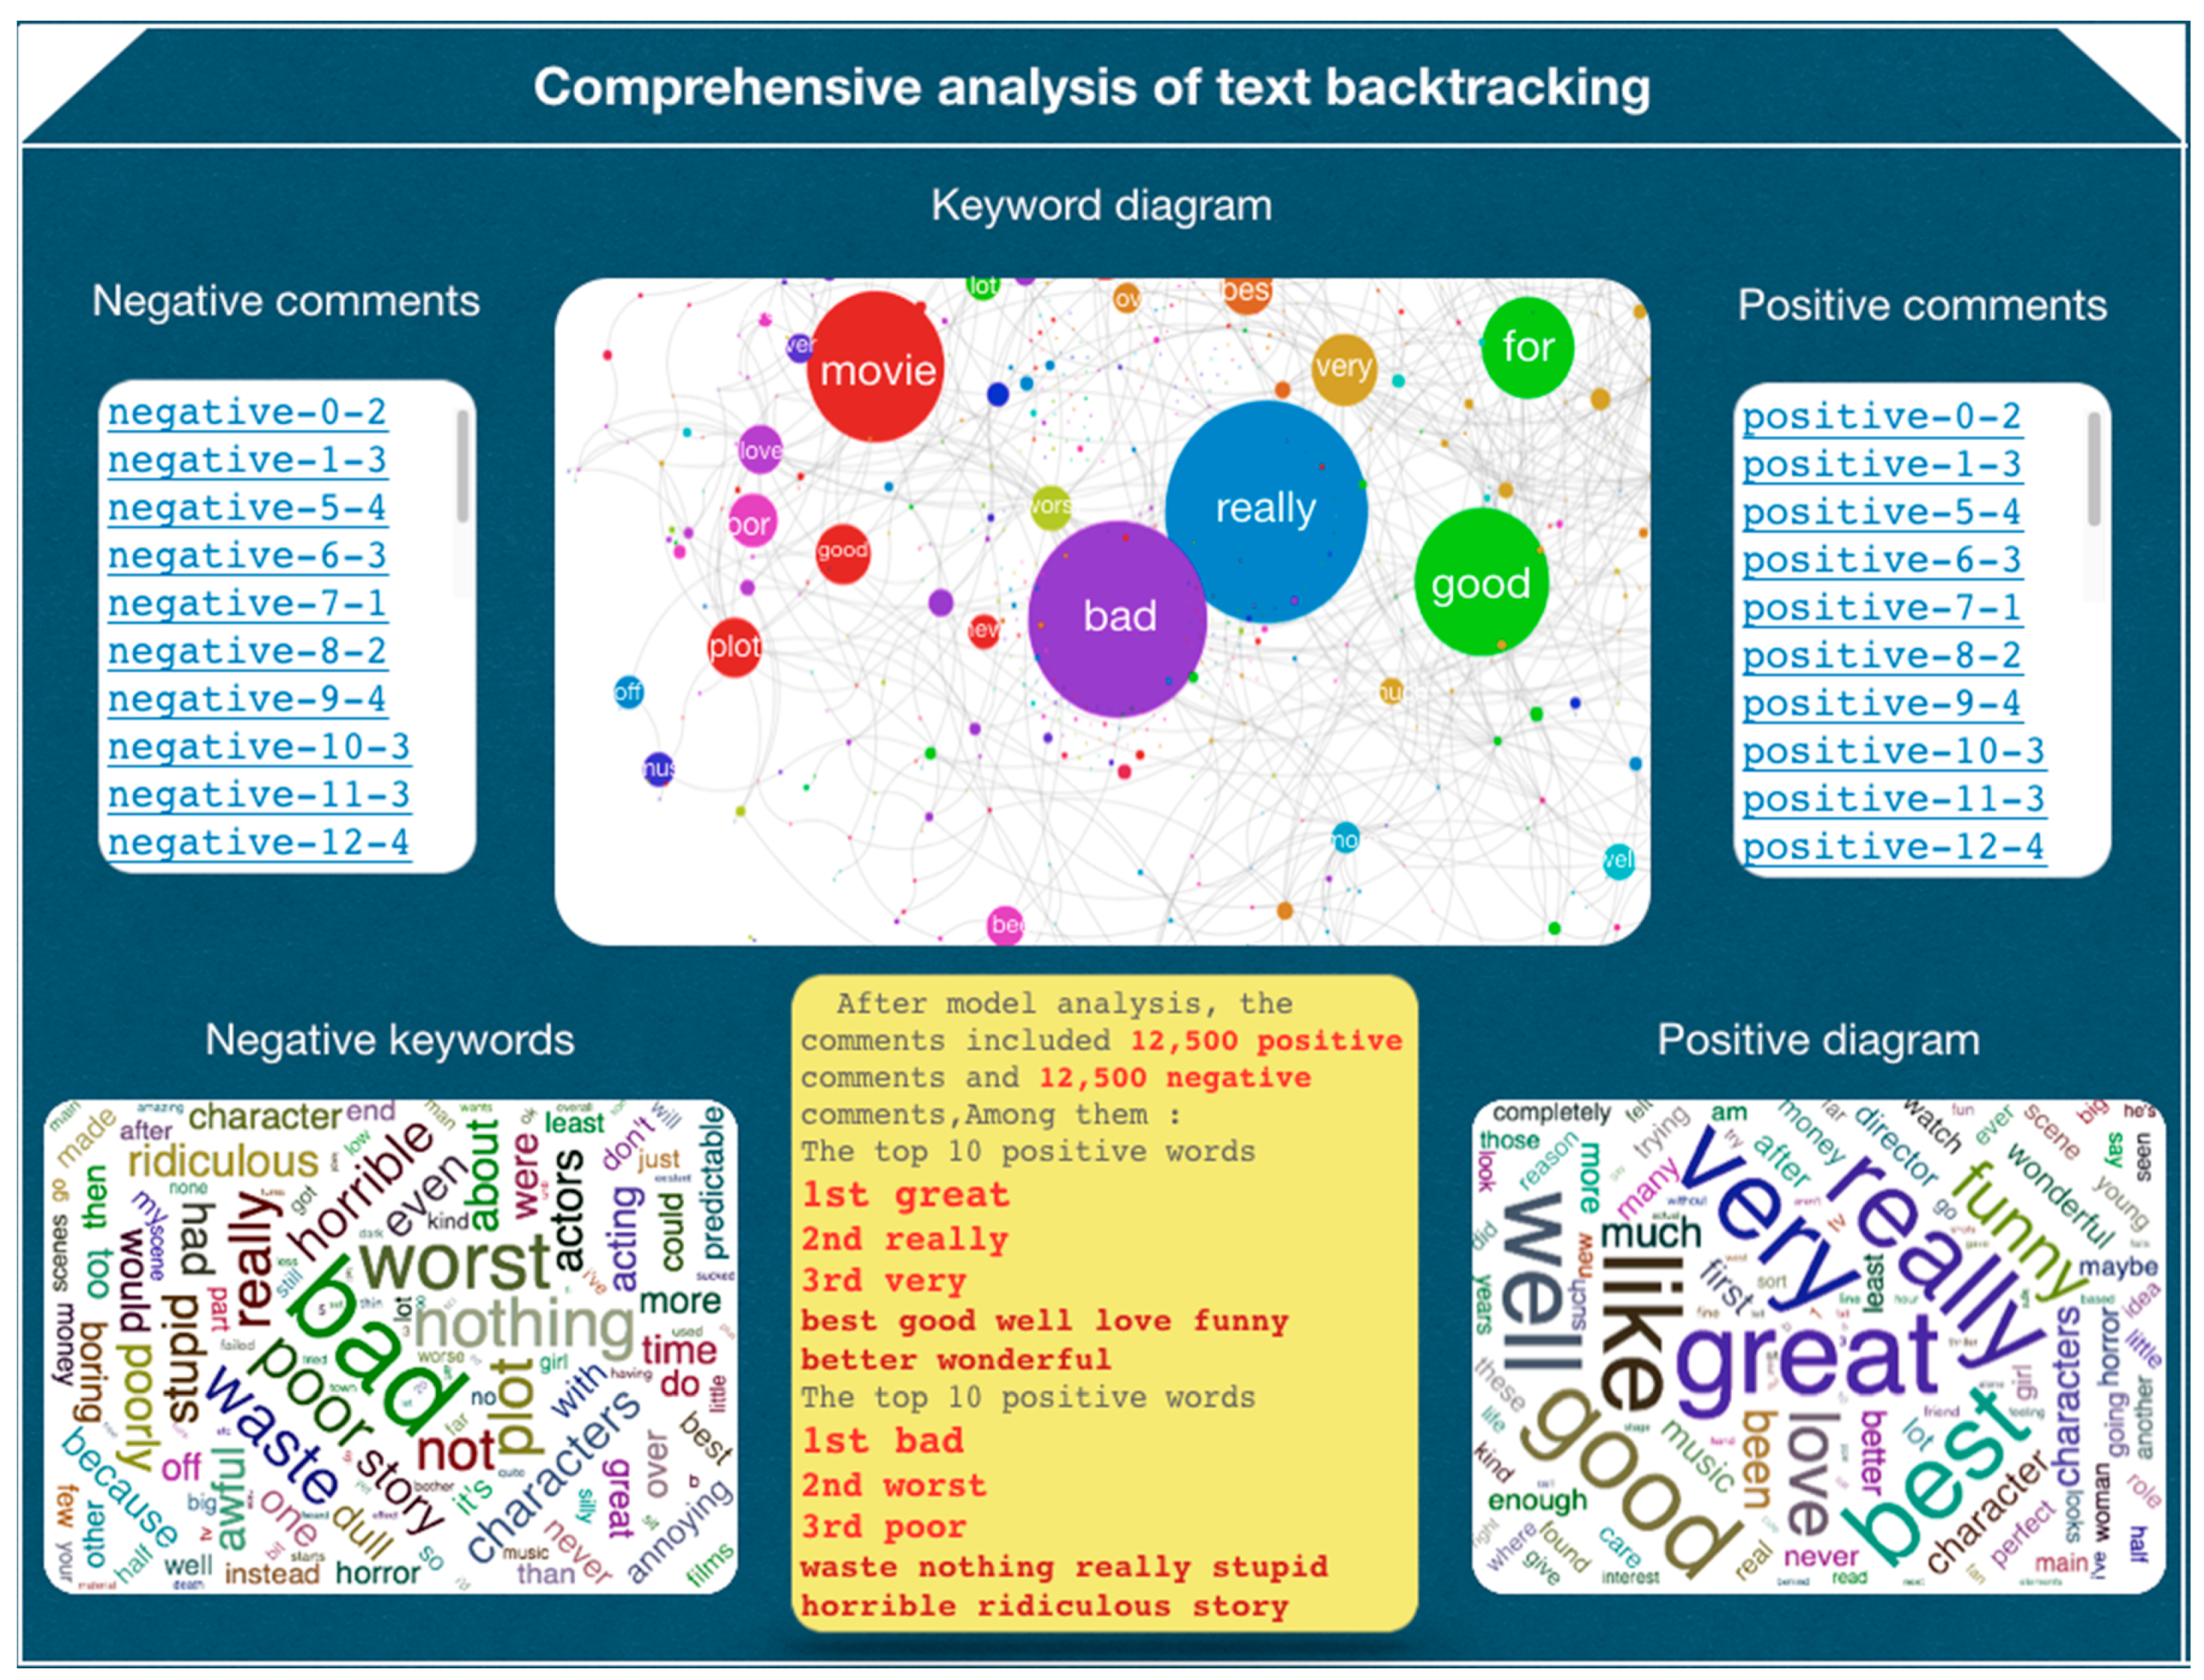
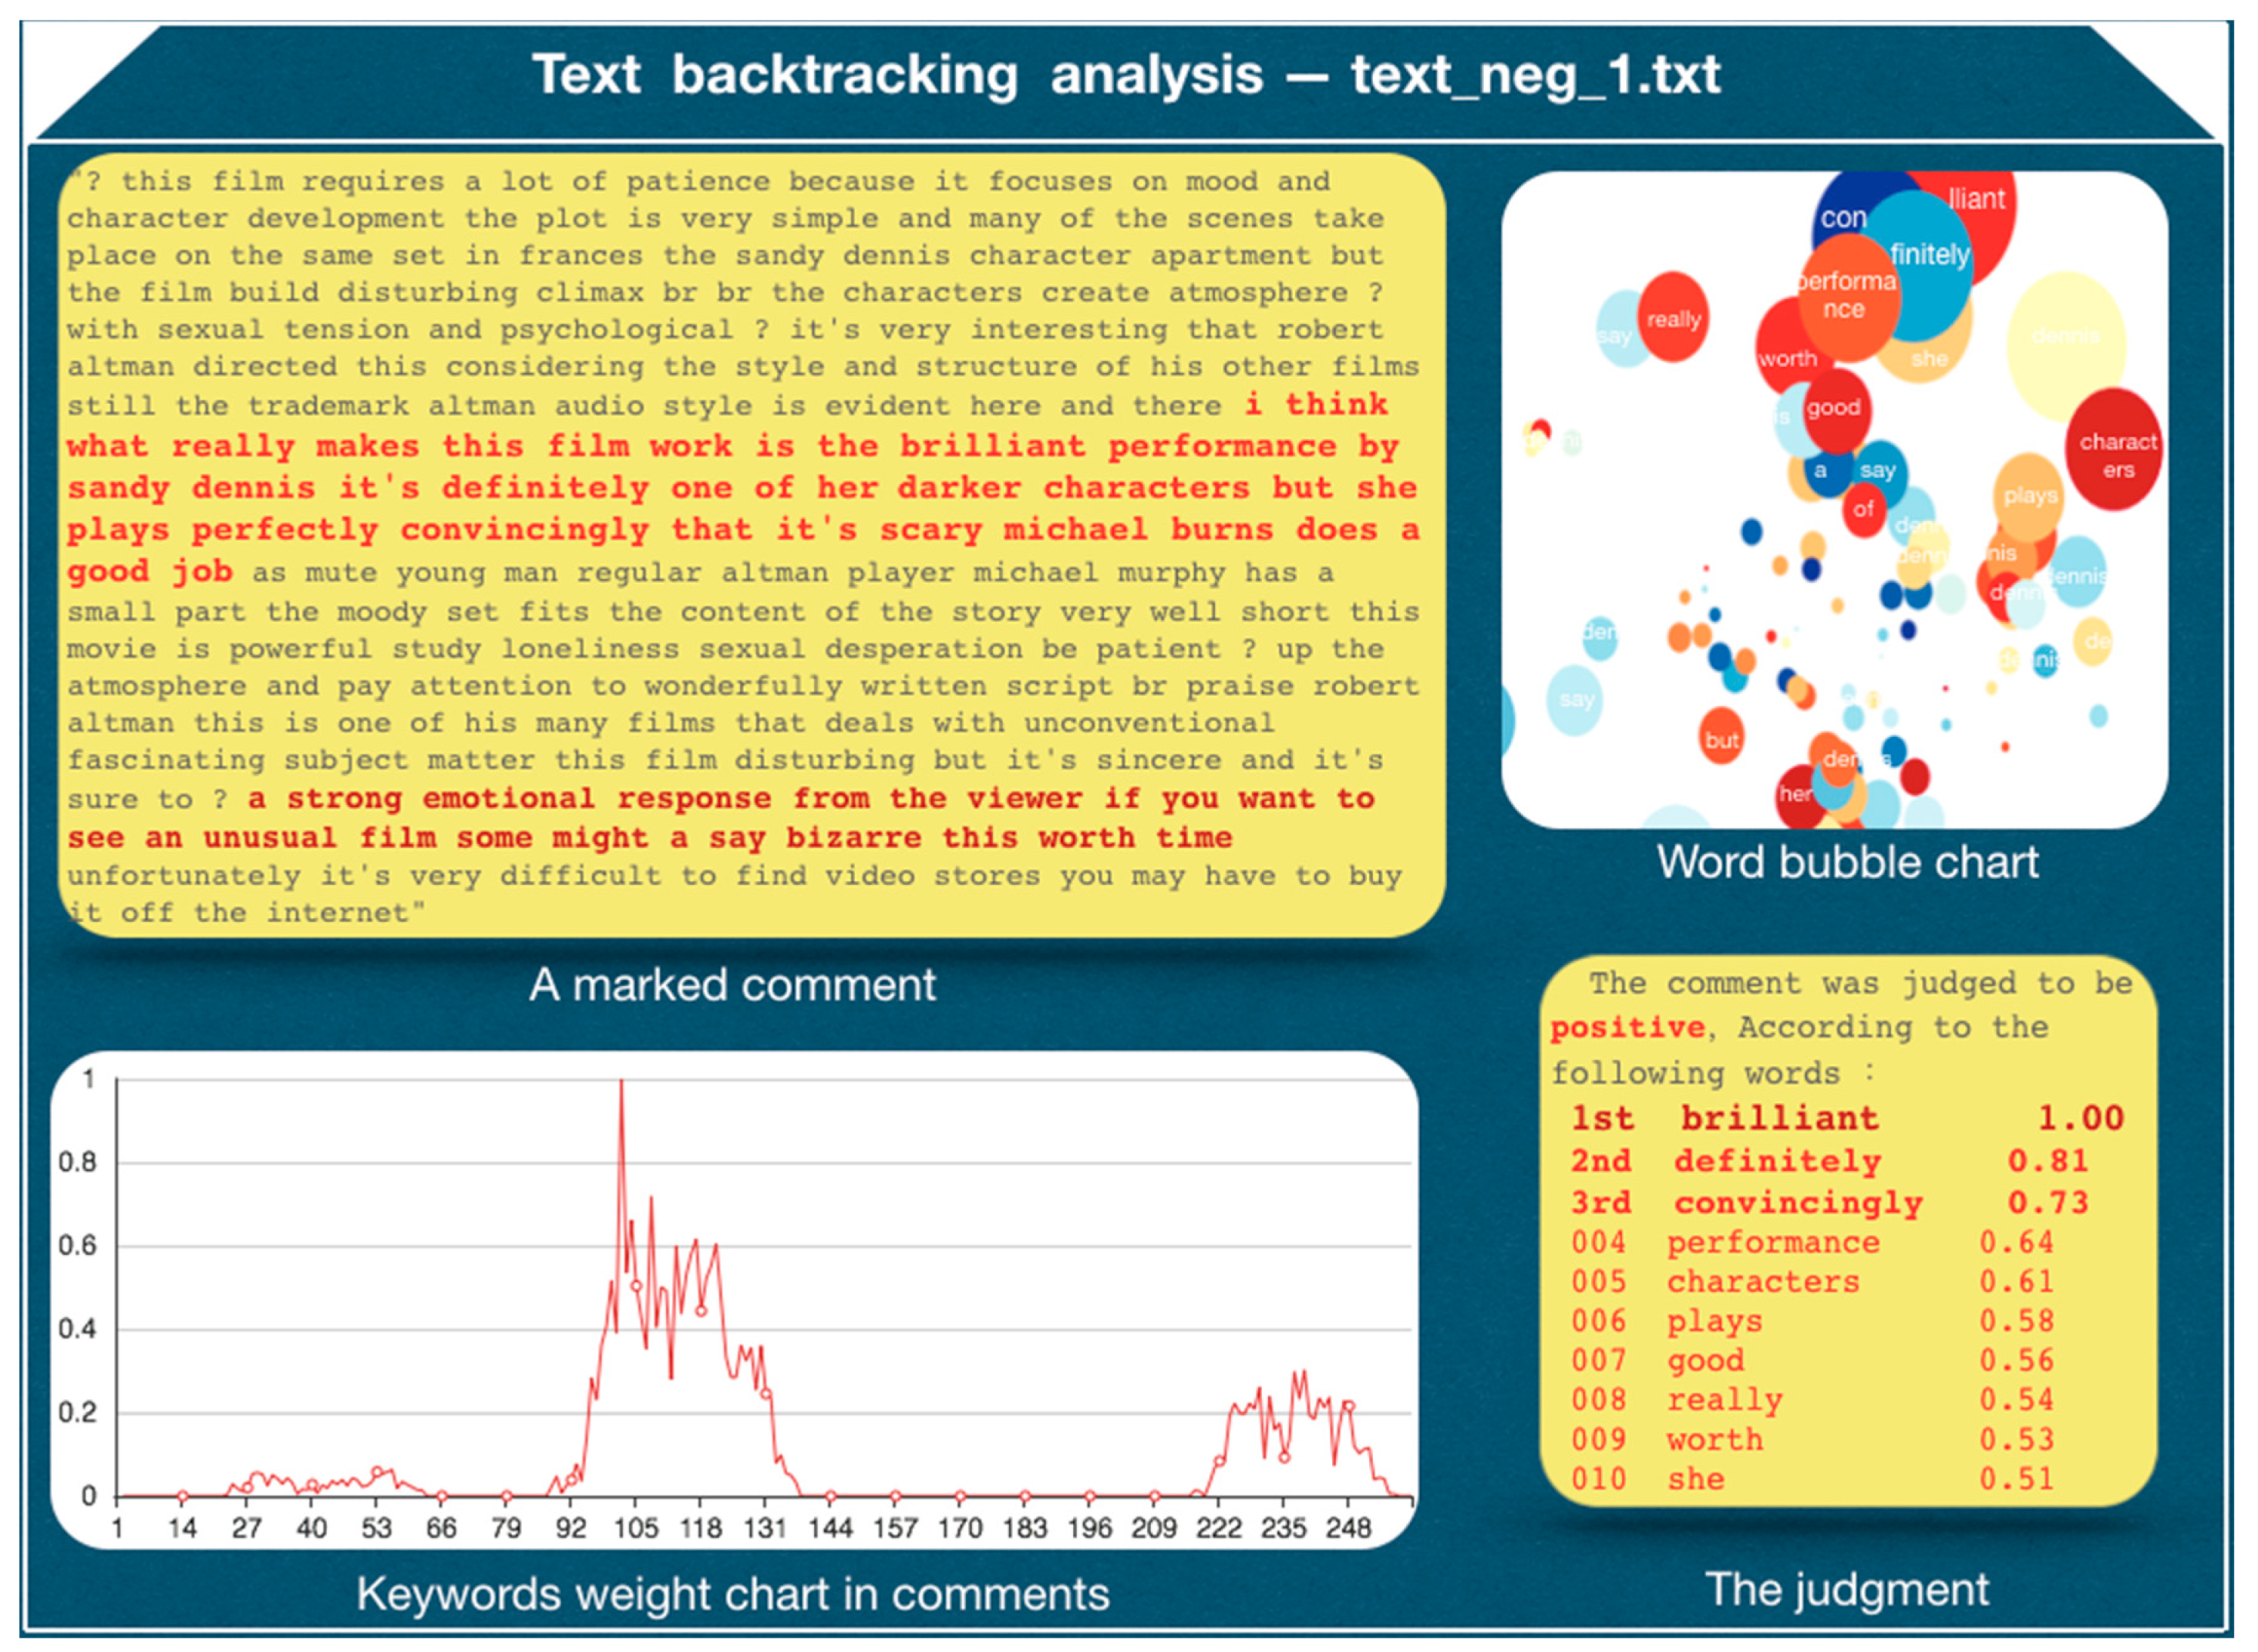
According to the experimental data, we conducted an overall analysis of the IMDB data set, and through the python’s Pyecharts generated a comprehensive analysis diagram of the text backtracking, which included comprehensive analysis of the comment text. From text analysis given in the figure, we could obtain that the three words with highest scores in the positive comments of IMDB data set were “great, really and very”, and the three words with top three scores in the negative comments were “bad, worst and poor”. The analysis results given by the backtracking analysis model were in line with our judgment. The experiment showed that the CNN text classification model proposed by us was interpretable. After clicking on a comment after model classification, the detailed analysis page of the current comment is shown in Figure 12 and Figure 13.
5. Discussion
Text sentiment classification has always been one of the important tasks in natural language processing. The visualization method is very important to the interpretability of the model, but at present, there is little research on the interpretability of the visualization, especially the research on the interpretability of the neural network model based on word embedding. This article attempts to use the backtracking analysis method to conduct in-depth analysis and research on the deep learning model and use the visualization method to demonstrate interpretability of the deep learning model in multiple dimensions. First, this paper proposes an analysis method for interpretability of the CNN text classification model. Construct the CNN text classification model, perform training and testing through the IMDB data set, track the category label obtained from the CNN text classification model through reverse backtracking by using the backtracking analysis model to the important factors that affect the prediction results, and finally, perform overall analysis on interpretability of the model through a visualization method. After verification by instances, the method proposed in this paper achieved the expected effects and realized reasonable interpretation of classification results of the text classification model. At the same time, our experiment also has limitations. The data source has limitations, although the method proposed in this paper can be applied to multi-classification problems, but only uses IMDB data set for verification, and we did not perform experimental verification on multi-classification problems and text data sets of different lengths. Next, we suggest that an interpretation method can be used to develop an evaluation tool for a deep neural network model. This tool can learn information in multiple perspectives, such as knowledge representation, input and output, etc. from the network, and evaluate robustness and generalization ability of the model through a large number of experiments. This will further improve trustworthiness of the model. Meanwhile, our model also has limitations. This paper mainly studies the interpretability of based on the CNN text classification model, excluding other types of models such as RNN. Next, we can also integrate the time series model RNN, establish a complete set of evaluation criteria for deep learning interpretability based on experiments, so that users truly feel that the decision results of the deep learning model are reasonable and credible.
Author Contributions
Data curation, B.T.; Formal analysis, P.C.; Funding acquisition, B.T.; Resources, B.T.; Visualization, P.C.; Writing—original draft, P.C.; Writing—review & editing, B.T. All authors have read and agreed to the published version of the manuscript.
Funding
This research received no external funding.
Conflicts of Interest
The authors declare no conflict of interest.
References
- Li, Y.; Wang, X.; Xu, P. Chinese Text Classification Model Based on Deep Learning. Future Internet 2018, 10, 113. [Google Scholar] [CrossRef] [Green Version]
- Kim, Y. Convolutional neural networks for sentence classification. arXiv 2014, arXiv:1408.5882. [Google Scholar]
- Kim, H.; Jeong, Y.-S. Sentiment Classification Using Convolutional Neural Networks. Appl. Sci. 2019, 9, 2347. [Google Scholar] [CrossRef] [Green Version]
- Wu, Y.; Li, J.; Song, C.; Chang, J. High Utility Neural Networks for Text Classification. Tien Tzu Hsueh Pao/Acta Eletronica Sin. 2020, 48, 279–284. [Google Scholar]
- Stein, R.A.; Jaques, P.A.; Valiati, J.F. An analysis of hierarchical text classification using word embeddings. Inf. Sci. 2019, 471, 216–232. [Google Scholar] [CrossRef]
- Jin, R.; Lu, L.; Lee, J.; Usman, A. Multi-representational convolutional neural networks for text classification. Neural Comput. Appl. 2019, 35, 599–609. [Google Scholar] [CrossRef]
- Wang, L.; Zhang, B. Fault Text Classification Based on Convolutional Neural Network. In Proceedings of the 2020 IEEE 7th International Conference on Industrial Engineering and Applications (ICIEA), Bangkok, Thailand, 16–21 April 2020; pp. 937–941. [Google Scholar] [CrossRef]
- Zhang, T.; Li, C.; Cao, N.; Ma, R.; Zhang, S.; Ma, N. Text Feature Extraction and Classification Based on Convolutional Neural Network (CNN); Zou, B., Li, M., Wang, H., Song, X., Xie, W., Lu, Z., Eds.; Data Science; ICPCSEE 2017; Communications in Computer and Information Science; Springer: Singapore, 2017; Volume 727. [Google Scholar]
- Zhao, X.; Lin, S.; Huang, Z. Text Classification of Micro-blog’s “Tree Hole” Based on Convolutional Neural Network. In Proceedings of the 2018 International Conference on Algorithms, Computing and Artificial Intelligence (ACAI’18), Sanya, China, 21–23 December 2018; pp. 1–5. [Google Scholar]
- Fu, L.; Yin, Z.; Wang, X.; Liu, Y. A Hybrid Algorithm for Text Classification Based on CNN-BLSTM with Attention. In Proceedings of the 2018 International Conference on Asian Language Processing (IALP), Bandung, Indonesia, 15–17 November 2018; pp. 31–34. [Google Scholar] [CrossRef]
- Zhang, Y.; Zheng, J.; Jiang, Y.; Huang, G.; Chen, R. A Text Sentiment Classification Modeling Method Based on Coordinated CNN-LSTM-Attention Model. Chin. J. Electron. 2019, 28, 120. [Google Scholar] [CrossRef]
- Chen, K.; Tian, L.; Ding, H.; Cai, M.; Sun, L.; Liang, S.; Huo, Q. A Compact CNN-DBLSTM Based Character Model for Online Handwritten Chinese Text Recognition. In Proceedings of the 2017 14th IAPR International Conference on Document Analysis and Recognition (ICDAR), Kyoto, Japan, 9–15 November 2017; pp. 1068–1073. [Google Scholar] [CrossRef]
- Usama, M.; Ahmad, B.; Singh, A.P.; Ahmad, P. Recurrent Convolutional Attention Neural Model for Sentiment Classification of short text. In Proceedings of the 2019 International Conference on Cutting-Edge Technologies in Engineering, Icon-CuTE, Uttar Pradesh, India, 14–16 November 2019; pp. 40–45. [Google Scholar]
- She, X.; Zhang, D. Text Classification Based on Hybrid CNN-LSTM Hybrid Model. In Proceedings of the 2018 11th International Symposium on Computational Intelligence and Design, ISCID, Hangzhou, China, 8–9 December 2018; pp. 185–189. [Google Scholar]
- Guo, L.; Zhang, D.; Wang, l.; Wang, H.; Cui, B. CRAN: A hybrid CNN-RNN attention-based model for text classification. In Proceedings of the 37th International Conference, ER 2018, Xi’an, China, 22–25 October 2018; pp. 571–585. [Google Scholar]
- Fei, W.; Bingbing, L.; Yahong, H. Interpretability for Deep Learning. Aero Weapon. 2019, 26, 39–46. (In Chinese) [Google Scholar]
- Huiping, C.; Lidan, W.; Shukai, D. Sentiment classification model based on word embedding and CNN. Appl. Res. Comput. 2016, 33, 2902–2905. [Google Scholar]
- Simonyan, K.; Vedaldi, A.; Zisserman, A. Deep Inside Con-volutional Networks: Visualising Image Classification Models and Saliency Maps. arXiv 2013, arXiv:1312.6034. [Google Scholar]
- Dosovitskiy, A.; Brox, T. Inverting Visual Representations with Convolutional Networks. In Proceedings of the IEEE Conference on Computer Vision and Pattern Recog-nition, LasVegas, NV, USA, 27–30 June 2016; pp. 4829–4837. [Google Scholar]
- Selvaraju, R.R.; Cogswell, M.; Das, A.; Vedantam, R.; Parikh, D.; Batra, D. Grad-CAM: Visual Explanations from Deep Networks via Gradient-Based Localization. In Proceedings of the 2017 IEEE International Conference on Computer Vision (ICCV), Venice, Italy, 22–29 October 2017. [Google Scholar]
Figure 1.
Analysis method of model interpretability.
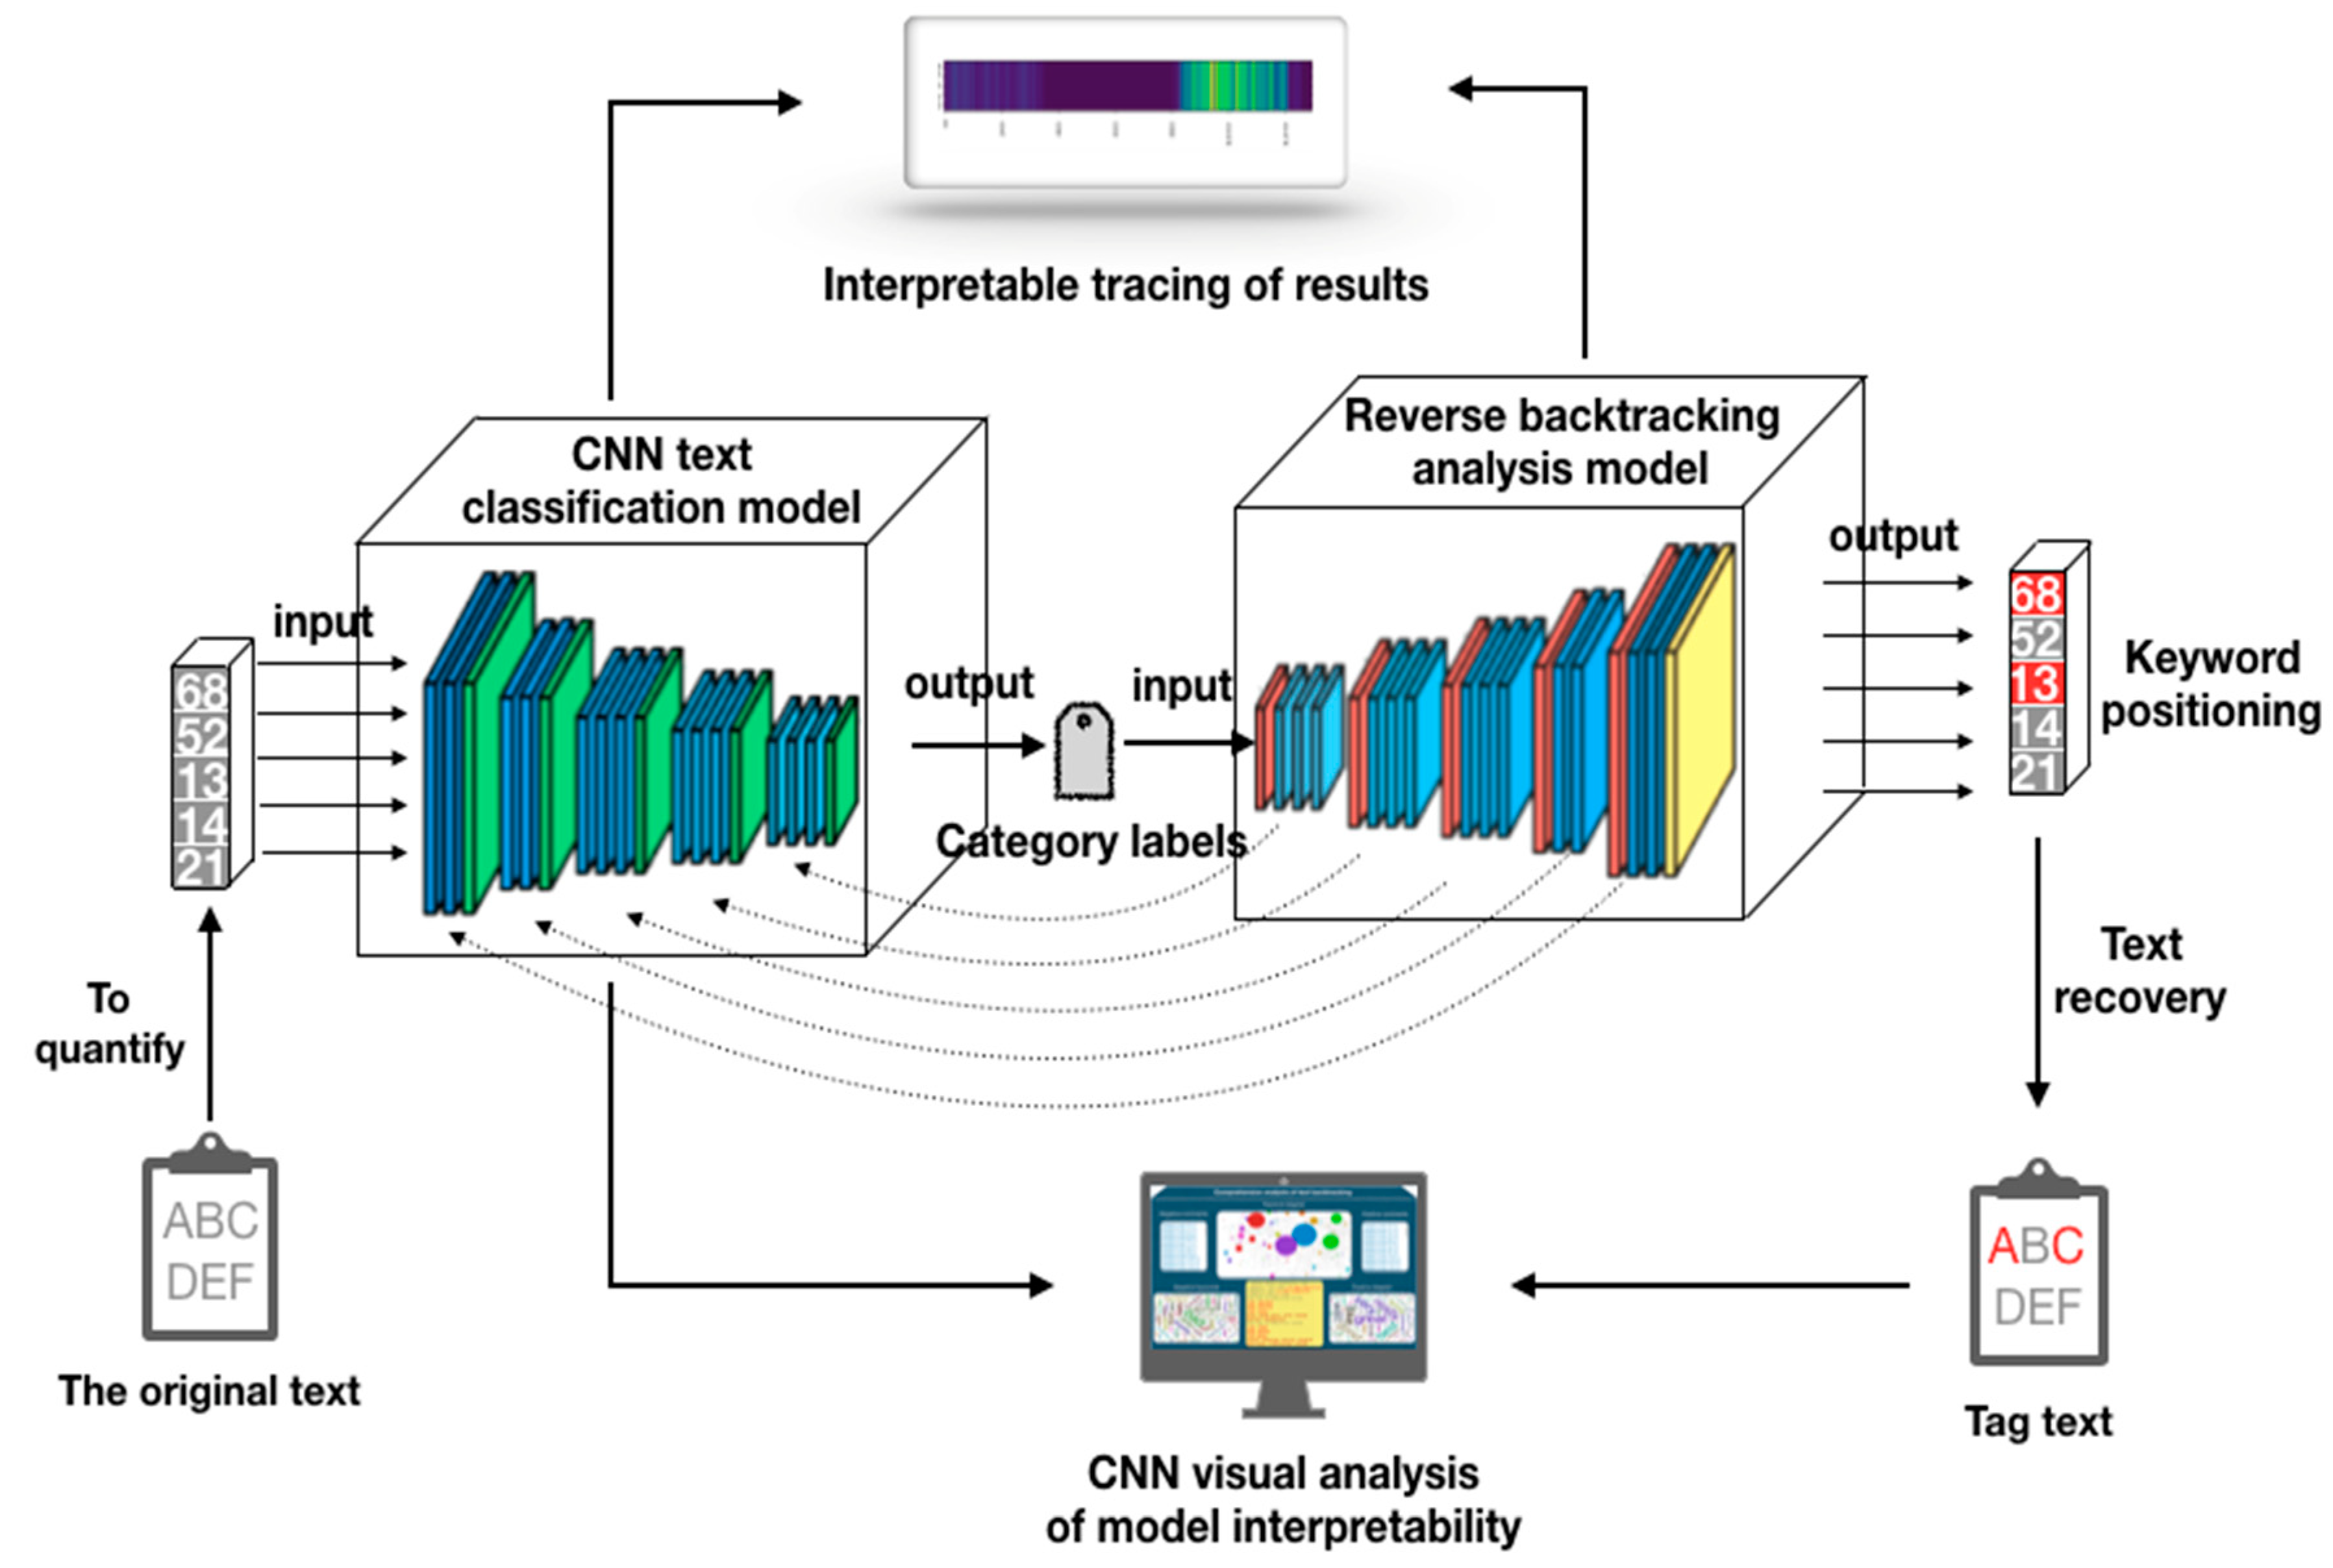
Figure 2.
Convolutional neural network (CNN)-based text classification model.
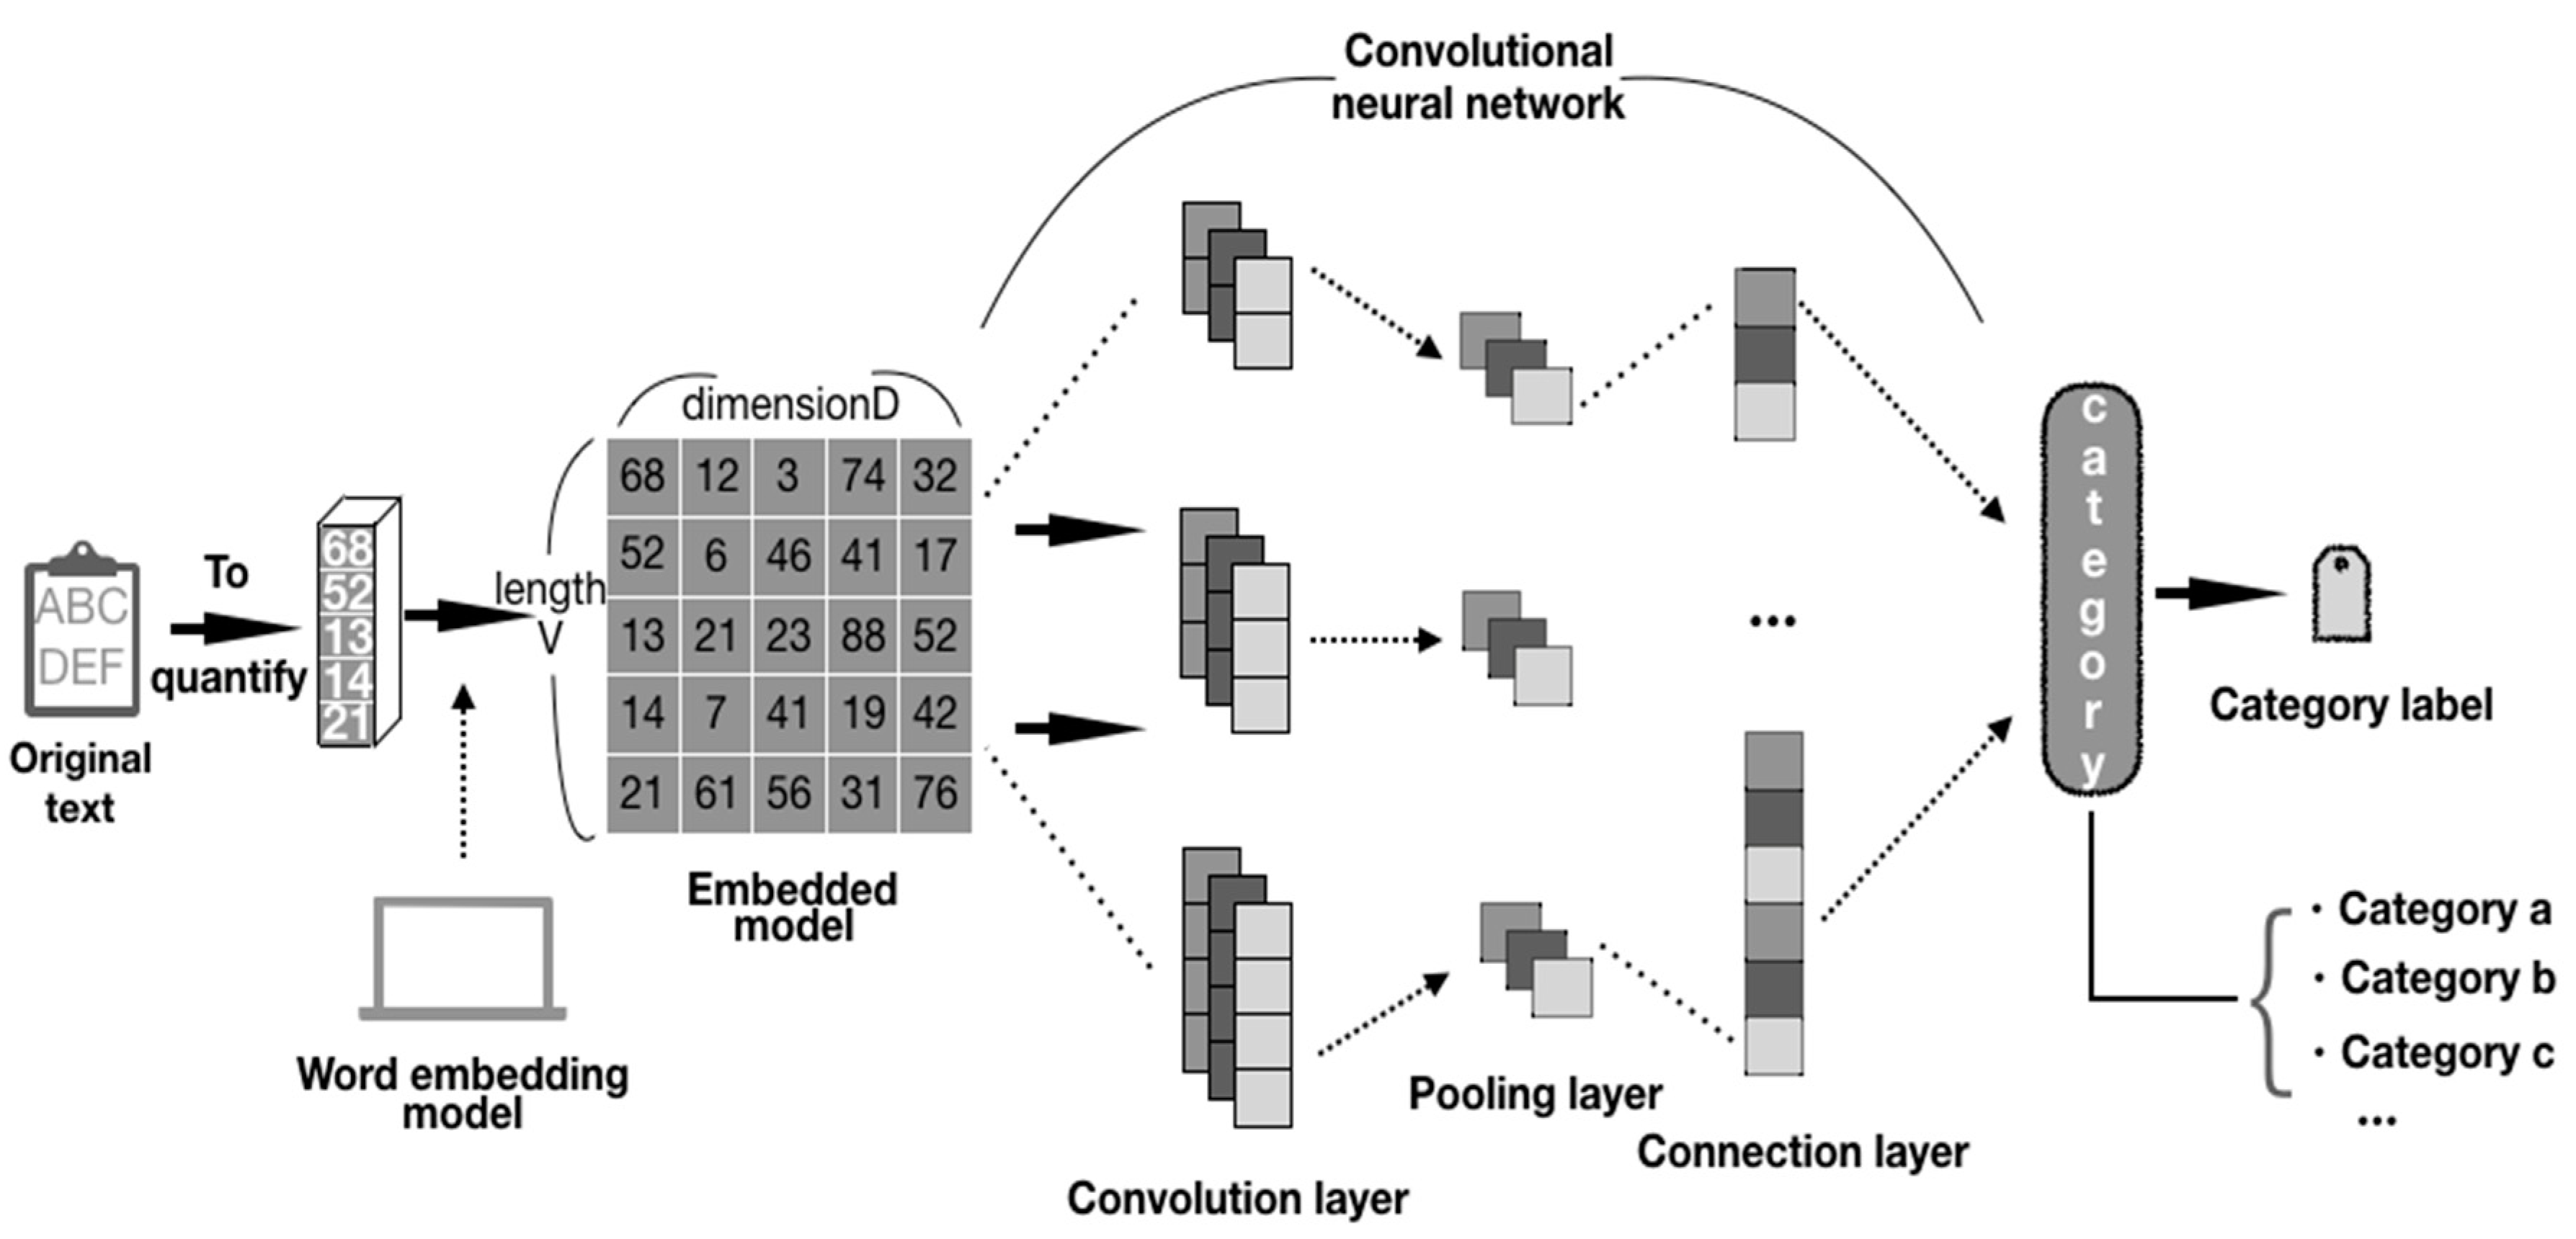
Figure 3.
Reverse backtracking analysis model.
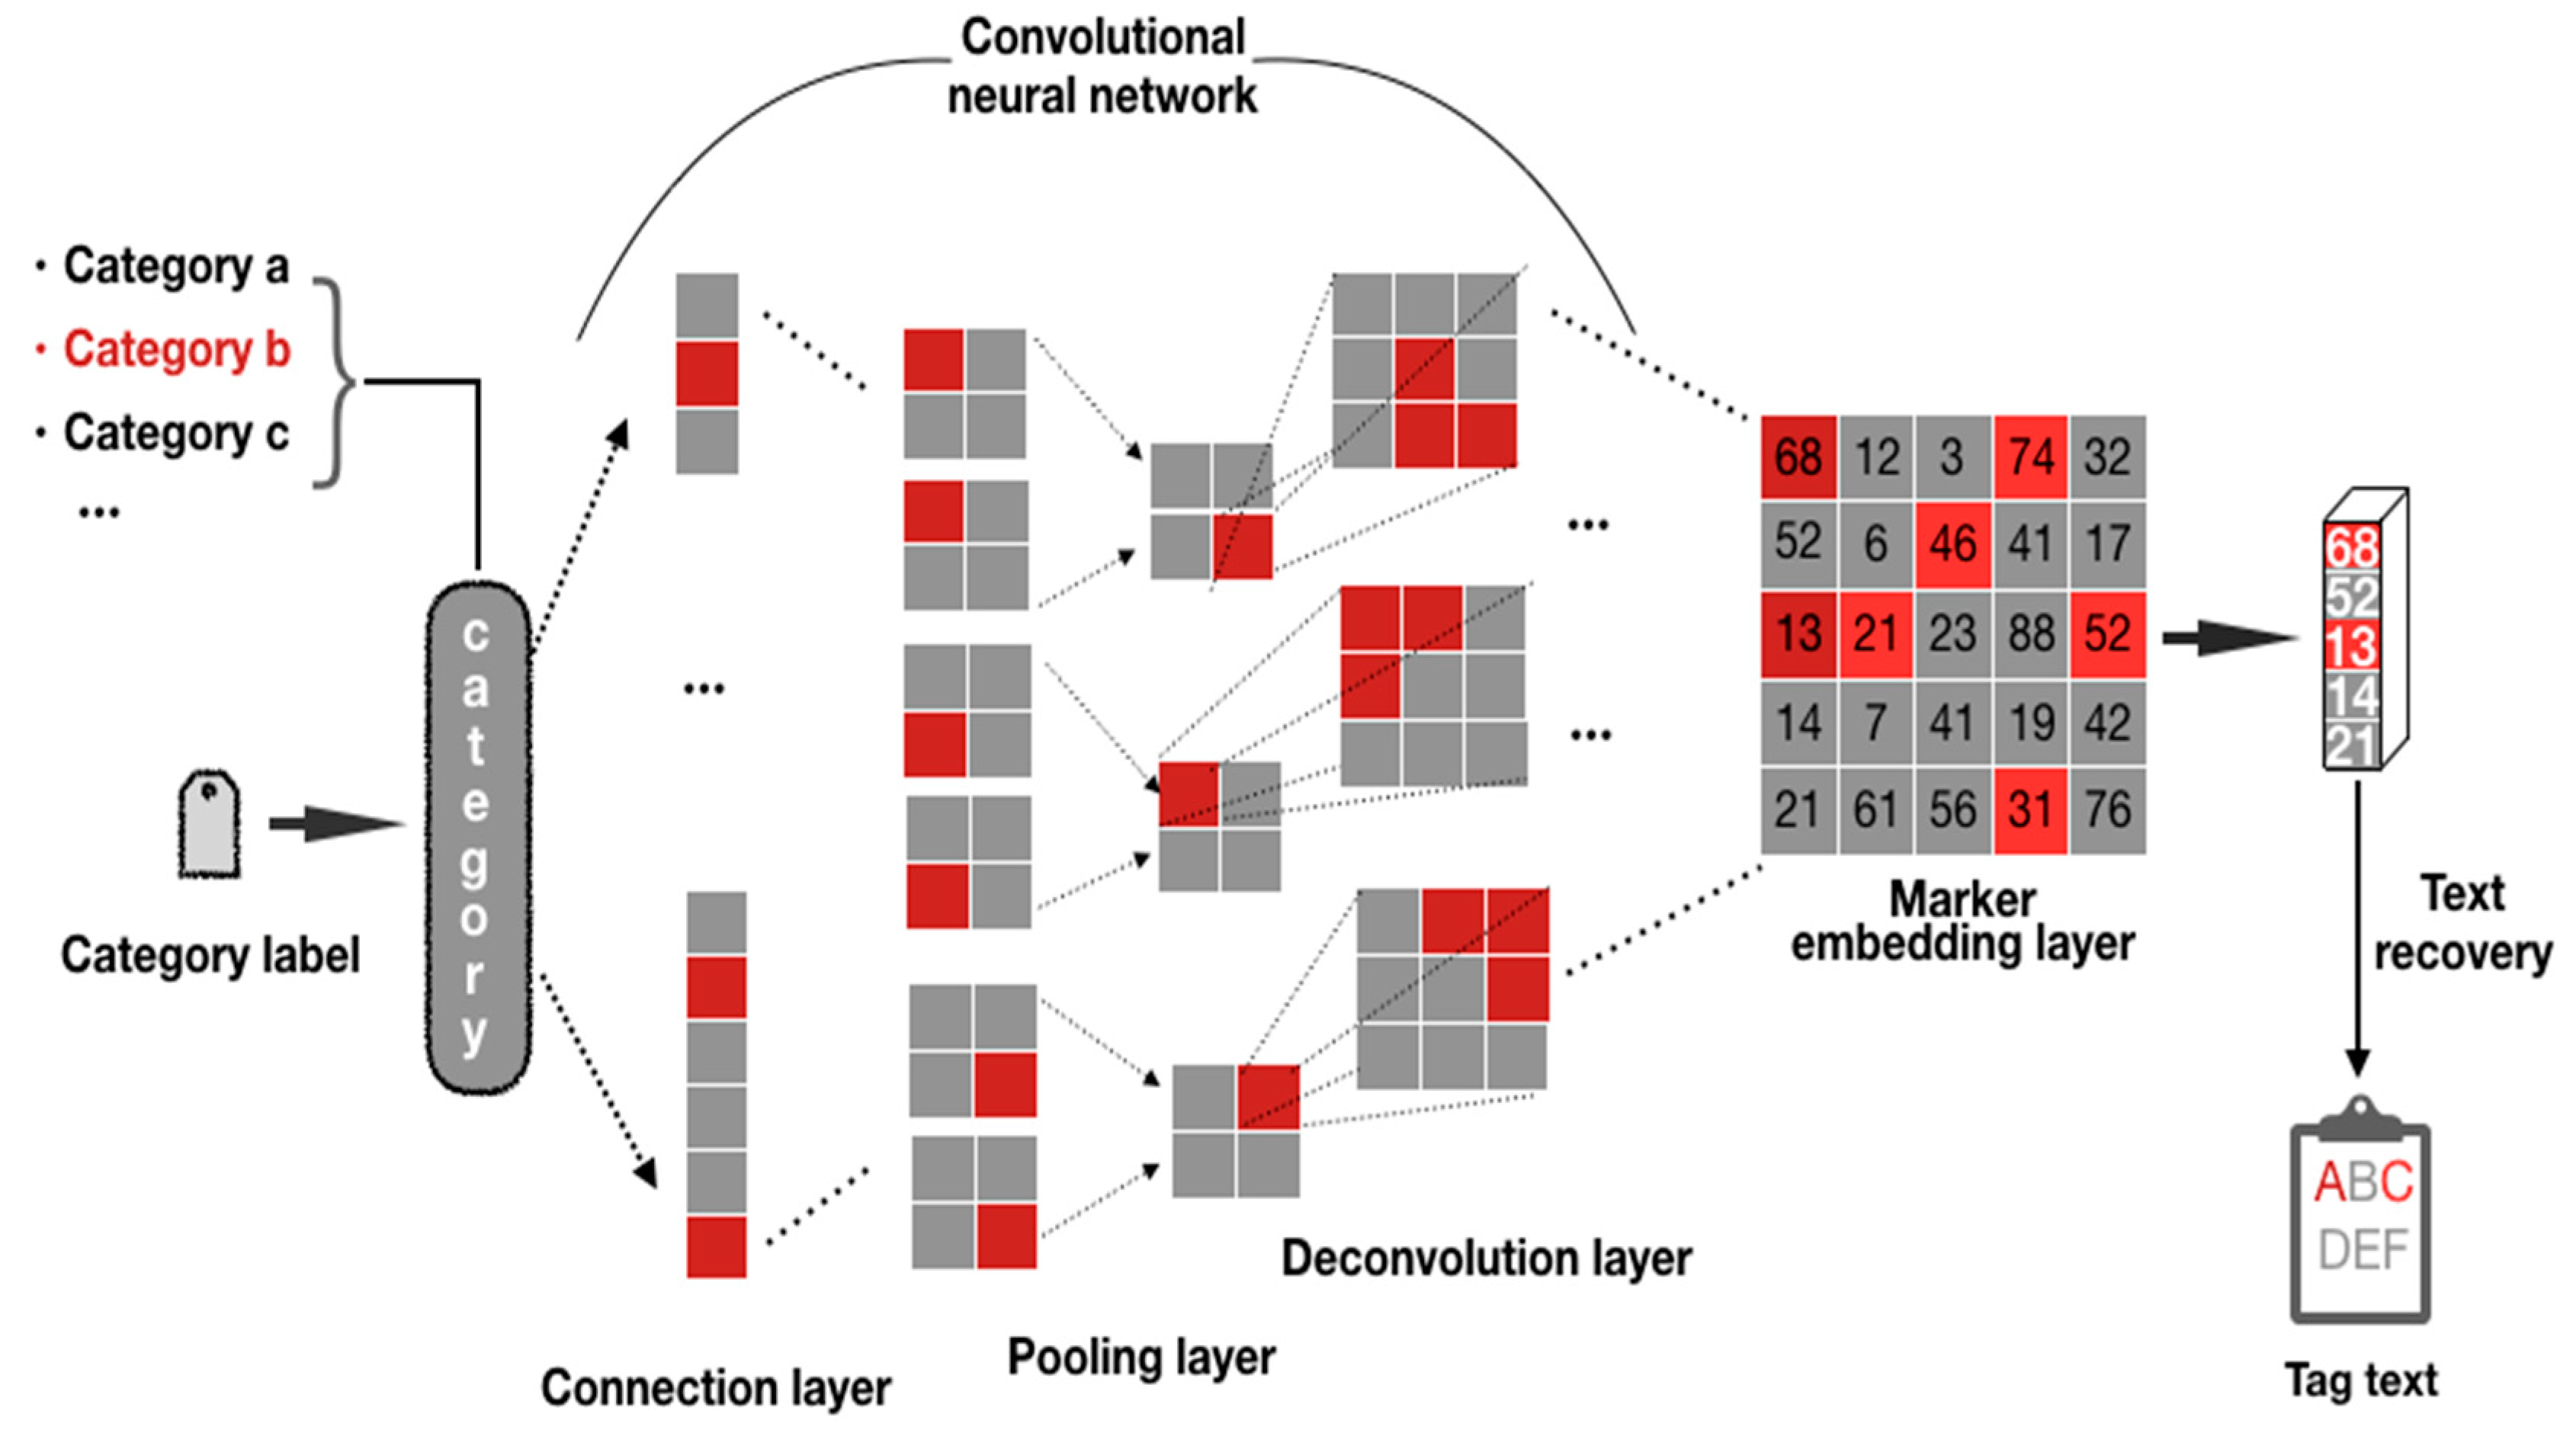
Figure 4.
Keyword–RGB mapping table.
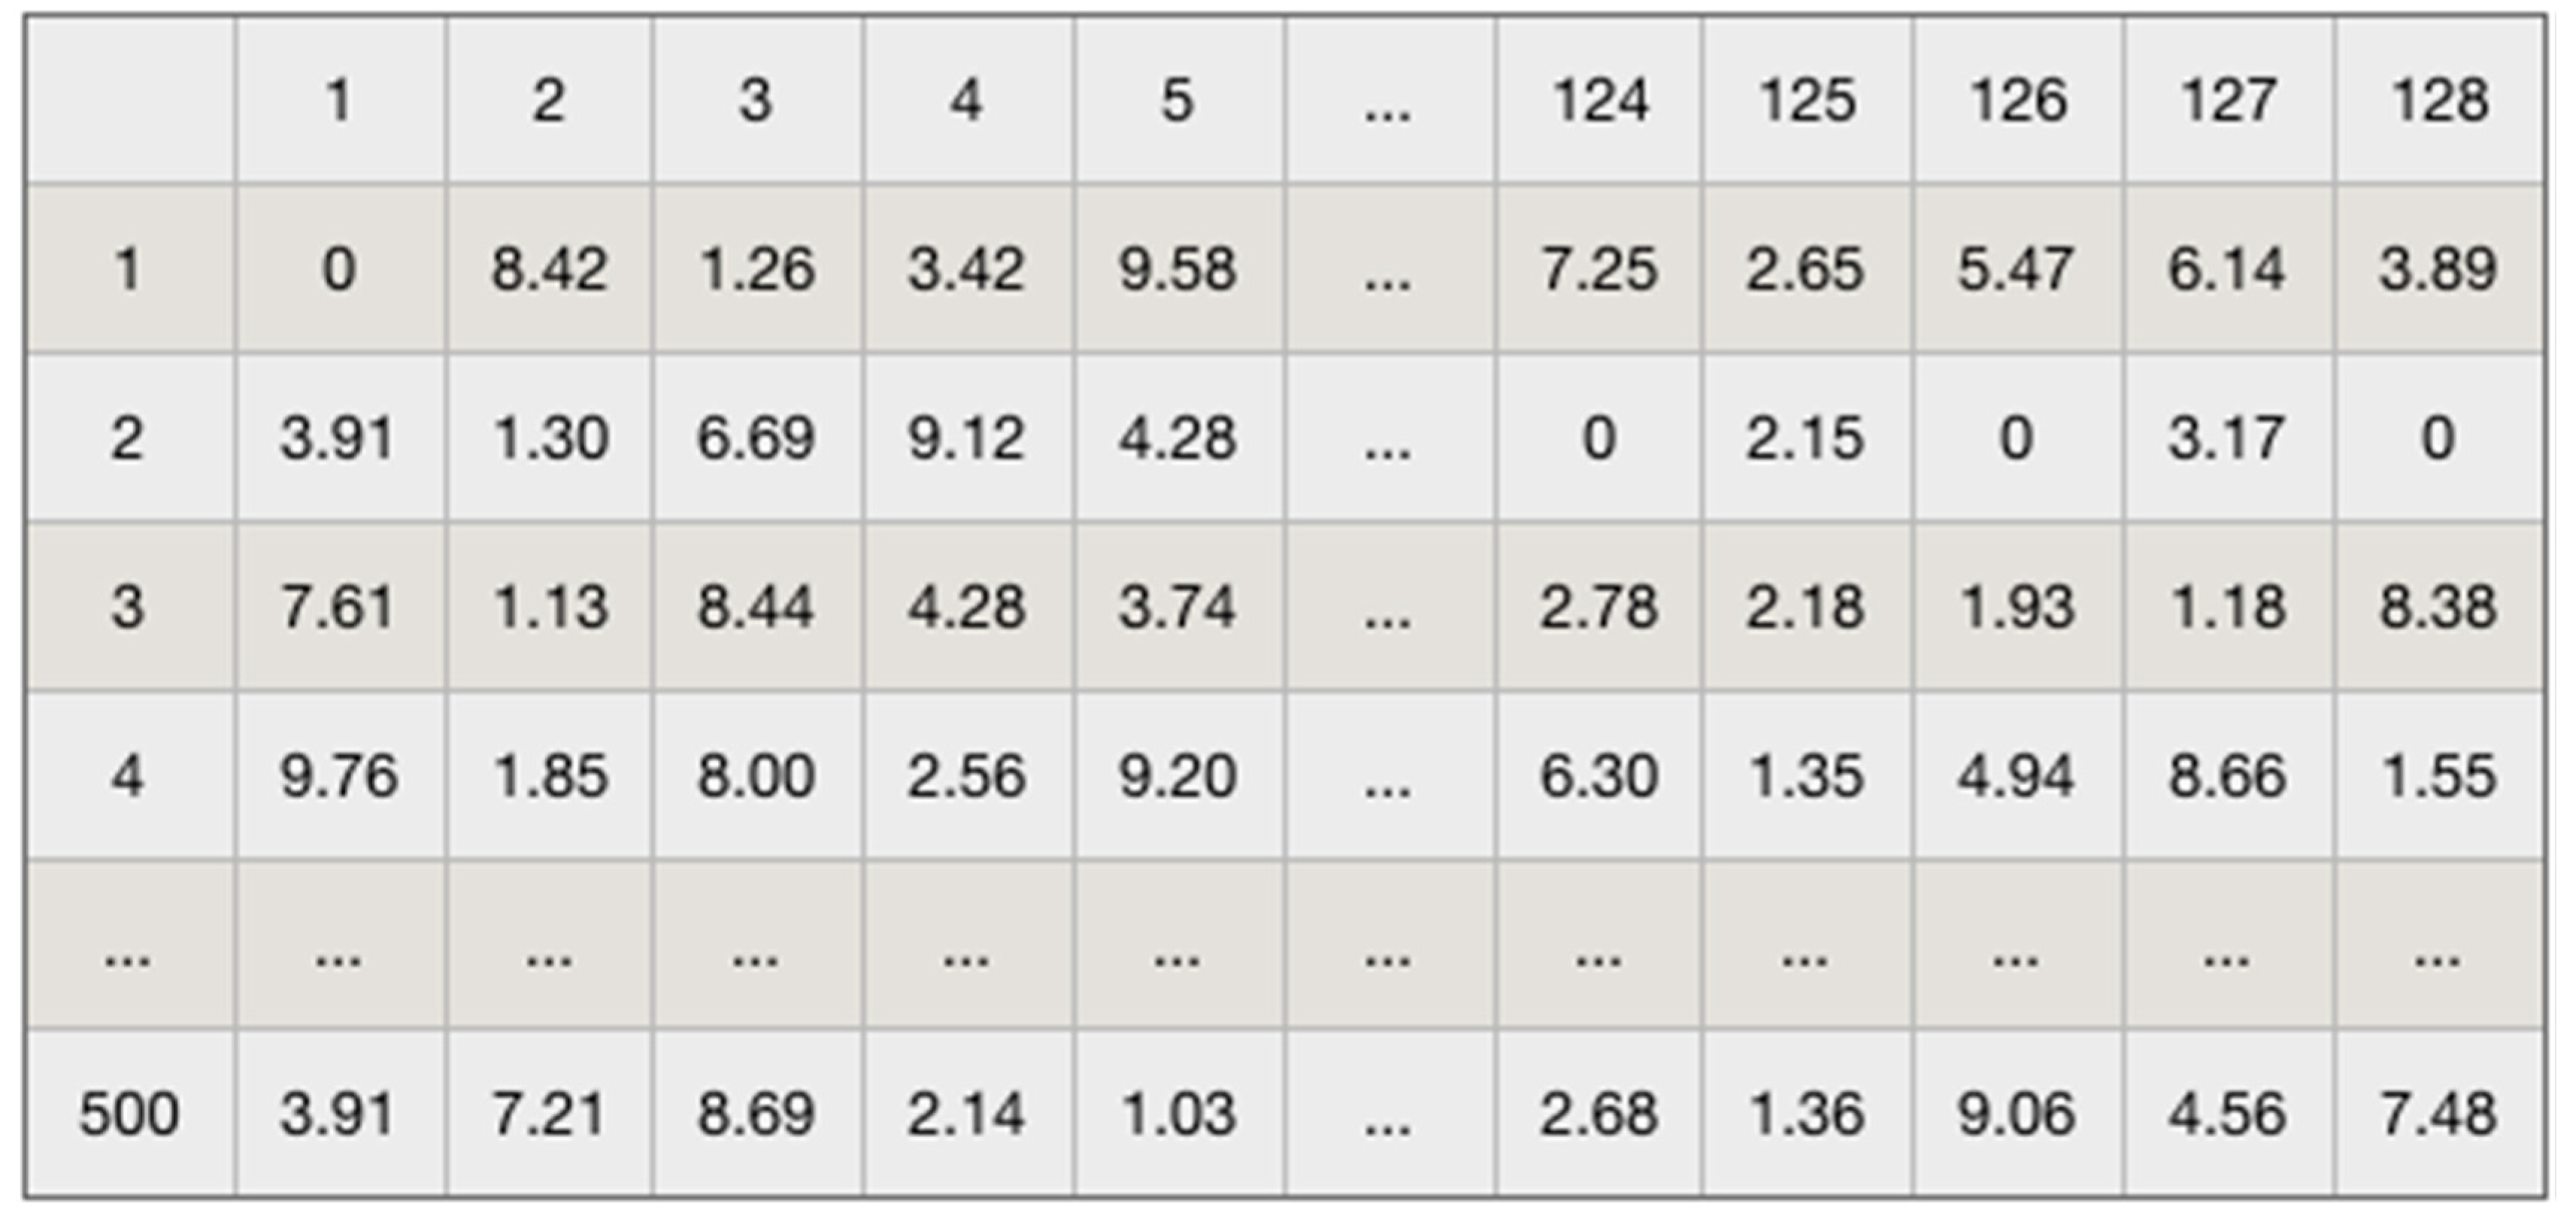
Figure 5.
Data set Word Frequency Dictionary (part).

Figure 6.
Structure diagram of convolutional neural network.

Figure 7.
Structure diagram of convolutional neural network.

Figure 8.
Comment number 14_8 and the weight matrix.

Figure 9.
Visualization of the words embedding weight 14_8.

Figure 10.
Visualization of the words weight 14_8.
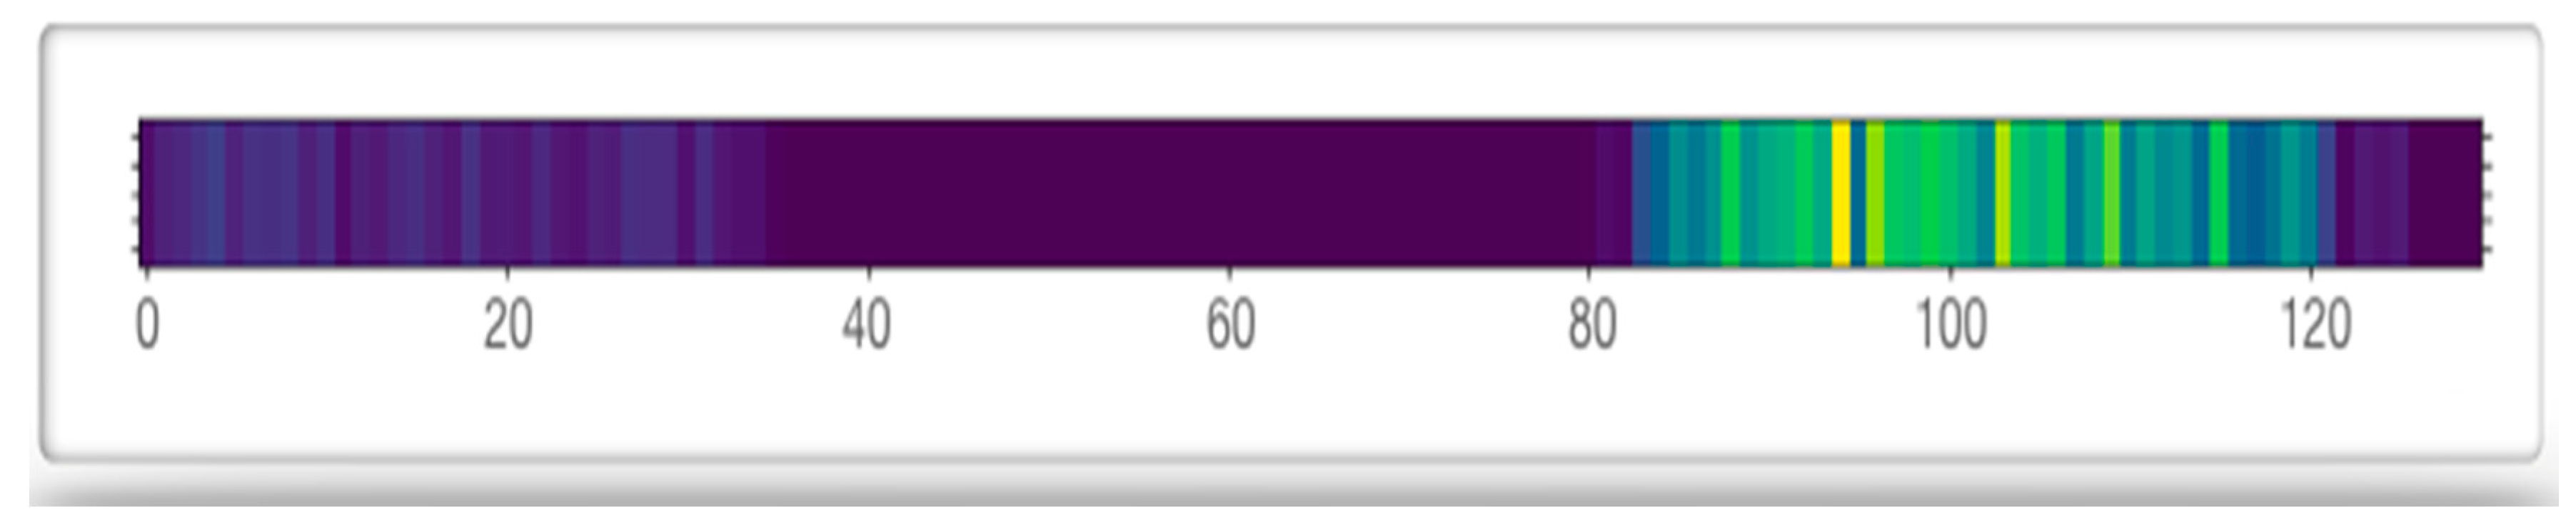
Figure 11.
Comment tag diagram numbered 14_8.

Figure 12.
Comprehensive analysis diagram of IMDB dataset.

Figure 13.
Detailed analysis of IMDB comments.

Publisher’s Note: MDPI stays neutral with regard to jurisdictional claims in published maps and institutional affiliations. |
© 2020 by the authors. Licensee MDPI, Basel, Switzerland. This article is an open access article distributed under the terms and conditions of the Creative Commons Attribution (CC BY) license (http://creativecommons.org/licenses/by/4.0/).
Share and Cite
MDPI and ACS Style
Ce, P.; Tie, B. An Analysis Method for Interpretability of CNN Text Classification Model. Future Internet 2020, 12, 228. https://doi.org/10.3390/fi12120228
AMA Style
Ce P, Tie B. An Analysis Method for Interpretability of CNN Text Classification Model. Future Internet. 2020; 12(12):228. https://doi.org/10.3390/fi12120228
Chicago/Turabian StyleCe, Peng, and Bao Tie. 2020. "An Analysis Method for Interpretability of CNN Text Classification Model" Future Internet 12, no. 12: 228. https://doi.org/10.3390/fi12120228
Note that from the first issue of 2016, this journal uses article numbers instead of page numbers. See further details here.