Article

Drought-Affected Populus simonii Carr. Show Lower Growth and Long-Term Increases in Intrinsic Water-Use Efficiency Prior to Tree Mortality

1
Key Laboratory of Tree Breeding and Cultivation of State Forestry Administration, Research Institute of Forestry, Chinese Academy of Forestry, Beijing 100091, China
2
Collaborative Innovation Center of Sustainable Forestry in Southern China, Nanjing Forestry University, Nanjing 210037, China
3
Beijing Key Laboratory of Ecologic Function Assessment and Regulation Technology of Green Space, Beijing Institute of Landscape Architecture, Beijing 100102, China
4
College of Landscape and Travel, Agricultural University of Hebei Baoding, Baoding 071000, China
*
Author to whom correspondence should be addressed.
Forests 2018, 9(9), 564; https://doi.org/10.3390/f9090564
Submission received: 20 August 2018 / Revised: 11 September 2018 / Accepted: 12 September 2018 / Published: 13 September 2018
(This article belongs to the Special Issue Physiological Responses to Abiotic and Biotic Stress in Forest Trees)

Abstract

:
The Three-North Shelter Forest (TNSF) is a critical ecological barrier against sandstorms in northern China, but has shown extensive decline and death in Populus simonii Carr. in the last decade. We investigated the characteristics—tree-ring width, basal area increment (BAI), carbon isotope signature (13Ccor), and intrinsic water-use efficiency (iWUE)—of now-dead, dieback, and non-dieback trees in TNSF shelterbelts of Zhangbei County. Results from the three groups were compared to understand the long-term process of preceding drought-induced death and to identify potential early-warning proxies of drought-triggered damage. The diameter at breast height (DBH) was found to decrease with the severity of dieback, showing an inverse relationship. In all three groups, both tree-ring width and BAI showed quadratic relationships with age, and peaks earlier in the now-dead and dieback groups than in the non-dieback group. The tree-ring width and BAI became significantly lower in the now-dead and dieback groups than in the non-dieback group from 17 to 26 years before death, thus, these parameters can serve as early-warning signals for future drought-induced death. The now-dead and dieback groups had significantly higher δ13Ccor and iWUEs than the non-dieback group at 7–16 years prior to the mortality, indicating a more conservative water-use strategy under drought stress compared with non-dieback trees, possibly at the cost of canopy defoliation and long-term shoot dieback. The iWUE became significantly higher in the now-dead group than in the dieback group at 0–7 years before death, about 10 years later than the divergence of BAI. After the iWUE became significantly different among the groups, the now-dead trees showed lower growth and died over the next few years. This indicates that, for the TNSF shelterbelts studied, an abrupt iWUE increase can be used as a warning signal for acceleration of impending drought-induced tree death. In general, we found that long-term drought decreased growth and increased iWUE of poplar tree. Successive droughts could drive dieback and now-dead trees to their physiological limits of drought tolerance, potentially leading to decline and mortality episodes.

1. Introduction

Drought-induced plant mortality is increasing globally as the earth continues to warm. Large-scale forest decline is expected to fundamentally affect carbon and water cycles, biodiversity, and goods and environmental services to local residents [1,2]. Drought-induced tree death has been recognized as an important ecological issue. However, it is not fully understood why some trees survive drought effectively while other coexisting individuals do not [3]. This insufficient understanding has stimulated investigation into the mechanisms of plant death by hydraulic failure [4,5], carbon starvation [6], and biological attack [3,7,8]. Earlier studies have revealed that the probability of tree death is related to height or diameter [9], with smaller trees showing a higher death rate than larger ones [10,11]. However, few studies have addressed whether tree size is related to the probability of tree death after periods of drought. An examination of tree-ring records found that dead trees had typically experienced slower (but highly varied) growth and greater responsiveness to water deficit [12]. In response to water deficit, trees limit their vigor or growth, leading to their decline. To better characterize this phenomenon, the long period of growth before drought-induced tree death needs to be quantified by new approaches. Other studies have reported that comparison of past radial growth trends among dead, dieback (severely defoliated), and non-dieback (slightly or not defoliated) trees may help to identify early warning signals of drought-triggered mortality [13,14].
During growth, plants respond differently to drought events of different durations and intensities, which are consistent with why some plants survive while others succumb [3]. Under drought stress, a plant may reduce its stomatal conductance to avoid hydraulic failure; this concomitantly slows its photosynthesis and carbon assimilation [15], creating increased δ13C and water-use efficiency (iWUE) [16]. Many studies have explored the relationship between iWUE and plant growth [17,18], water stress [19,20], and drought-induced plant mortality [14,21]. The iWUE was observed to increase substantially during dry spells, but increased iWUE could not improve tree growth sufficiently to compensate for water stress [18,22,23]. In a declined forest, some declining tree species had a lower iWUE compared with non-declining trees [24,25], but the reverse pattern was observed in other plants [14]. However, many research gaps still exist concerning variations in iWUE spanning the period from tree decline to death, or whether iWUE is an effective warning signal of accelerated drought-induced death.
The forests have served as an important ecological barrier in northern China since the initiation of the Three-North Shelter Forest (TNSF) program 1976. However, there has been large-scale decline of poplar trees in the TNSF in the past decade, and mortality since 2012. Recent surveys in Zhangbei County (Hebei Province, China) found that 80% of the TNSF stands planted in the county contained dieback poplar trees, with trees already dead or approaching death accounting for 1/3 of the area [26]. In Northern China, water availability is already limited and land-use changes are increasing the competition for water resources. These conditions will likely result in more serious water stress. This remarkable tree mortality has prompted studies on the characteristics of trees during the period prior to drought-induced death, with an aim to identify associated warning signals. Retrospective proxies (e.g., tree-ring data) are effective tools for analyzing past trends of tree growth [27]. Additionally, because tree-ring cellulose is a stable isotopic record of past environmental conditions during the assimilation of carbohydrates used for ring growth [22], the response of a tree to past water conditions is reflected in the δ13C signature of its rings. Thus, tree-rings are a probable source for identifying warning signals of dieback and death.
Surveys of the TNSF forests in Zhangbei County found that, even in the same poplar stand, some trees were now-dead or had died back whereas others remained healthy (i.e., no sign of dieback). The different fates of these trees are, however, difficult to explain from their water utilization histories, because there are no records of the impact of past environmental conditions on the growth, decline, and death of these trees. However, isotopic signatures of tree rings may provide an effective tool to identify factors related to their different fates. We hypothesized that now-dead, dieback, and non-dieback trees had different growths and iWUE during the long period of growth before the mortality of poplar trees in TNSF shelterbelts. Our specific goals were as follows: (1) to analyze differences in δ13C, iWUE, and basal area increment (BAI) among now-dead, die-back, and healthy (non-dieback) trees; (2) to reconstruct the past and recent growth trends of these three groups; and (3) to understand the long-term response of trees to drought, and identify early warning signals of drought-induced death. The overall aim of this study was to provide information for future studies on the growth sustainability, variability, and mortality of poplar trees in TNSF forests.

2. Materials and Methods

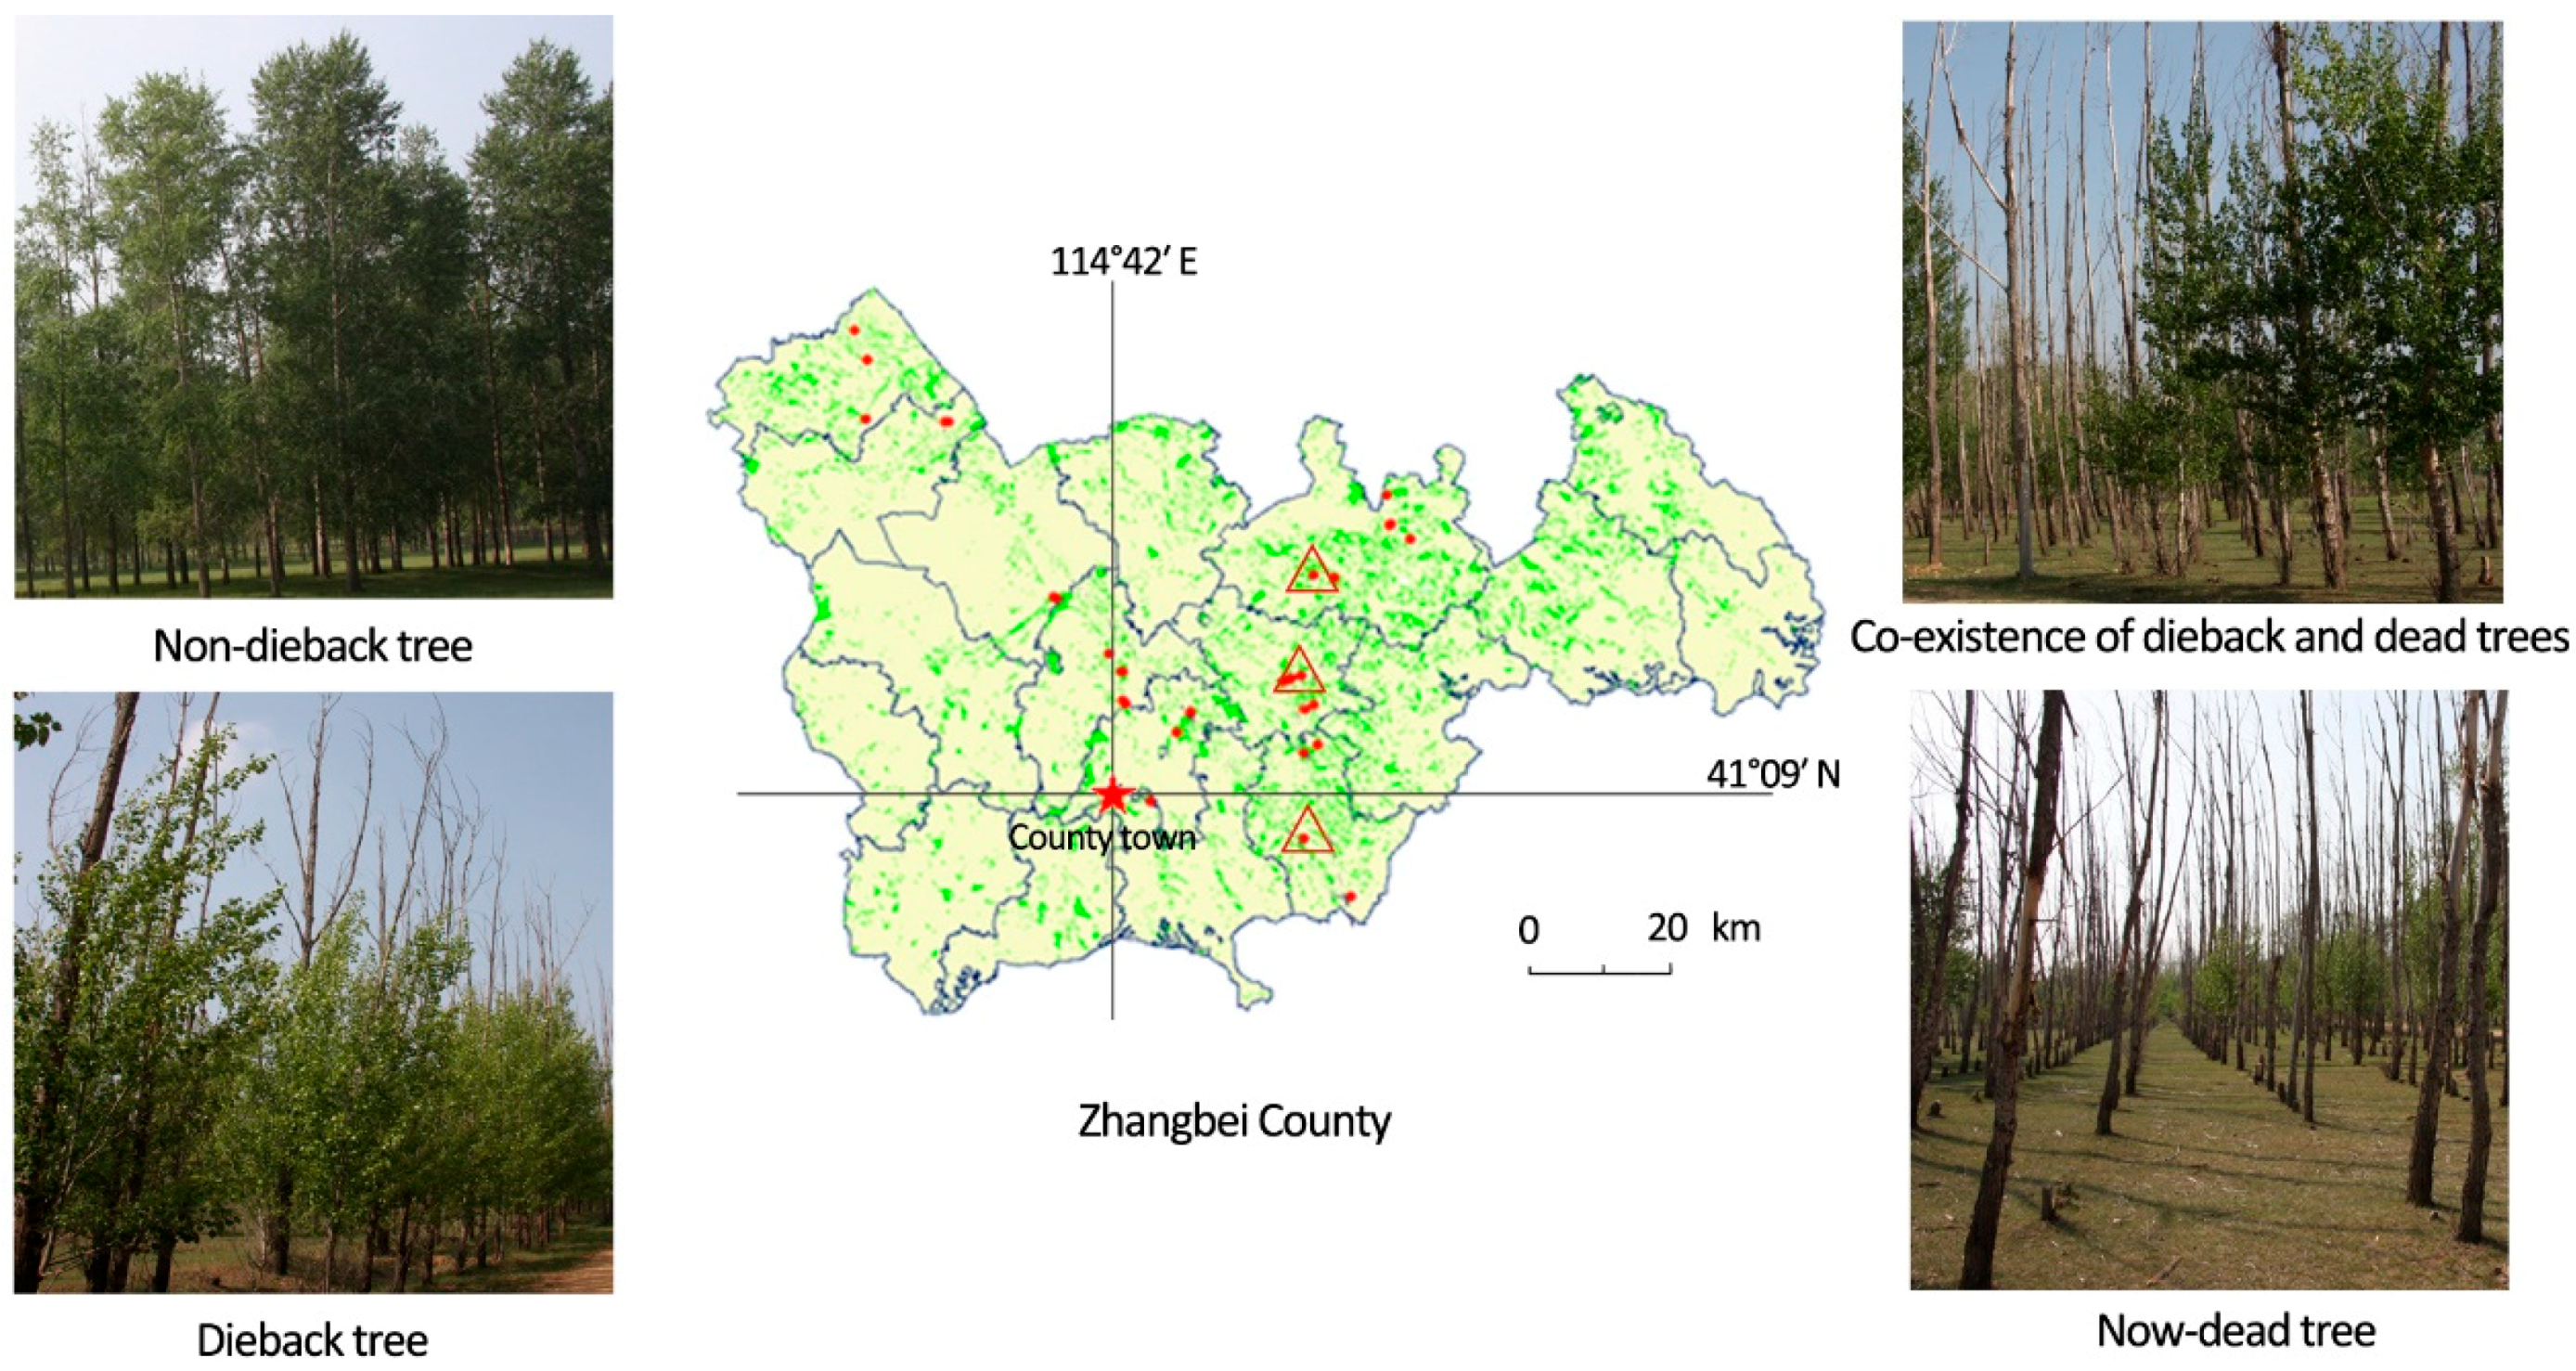
2.1. Experimental Sites and Sample Collection

Samples were collected from TNSF shelterbelts in Zhangbei County. Located at the southern edge of the Inner Mongolia Plateau, the county is characterized by a mid-temperate continental monsoon climate (a mean elevation of 1300 m, an annual mean temperature of 3.2 °C, annual precipitation of 300 mm, annual mean sunshine of 2897.8 h, an annual active accumulated temperature of 2448 °C, and a frost-free period of 90–110 day). Shelterbelts in the county comprise primarily Populus simonii Carr., a species tolerant to drought and cold. The trees typically sprout in May, grow rapidly in June–July, and enter defoliation–dormancy from September. They were planted as cutting seedlings in 1976, and the remaining trees are generally of the same age.
Twenty-six experimental sites of 100 m × 100 m were selected for analysis of poplar growth, dieback occurrence, and death. Following other studies [14,16,28], we used ‘non-dieback’ to describe healthy trees without dead branches, ‘dieback’ to describe poplar trees whose lower canopy was growing while the top was dead and dry, and ‘now-dead’ to describe those with no leaves and no living branches, which died in 2012. Samples were collected from three representative locations (Ertai Town Forest Farm, Xiaoertai Forest Farm, and Renjia Village). At each location, 18 trees (six non-dieback, six with 50% dieback shoots, six now-dead) were felled, and their diameters at breast height (DBH, 1.3 m) and heights were measured. Discs (5-cm thick) were collected at breast height for analyses of tree-ring width and carbon isotopes.

2.2. Tree-Ring Width and Carbon Isotope Analyses

The discs were dried, fixed, and surface-smoothed with the LignoTrim component of a LignoStation densitometry system (Rinntech, Heidelberg, Germany). The surfaces were scanned with the LignoScan component and the images were analyzed to determine tree width with the LignoVision component (precision, 20 μm). The ring series was cross-dated and checked using COFECHA software version 6.02P (Holmes, 1983) to eliminate potential errors. The BAI was calculated using Equation (1) [29]:
BAI = π ( R D n 2 R D n 1 2 )
where RD is the tree radius and n is the year of tree-ring formation.
The discs were dissected from bark to pith under a stereomicroscope to prepare tree-ring samples. To minimize carbon isotopic contamination, each sample was kept on a smooth glass slide during dissection. At least 0.5 g sample was obtained for each year. Samples were transferred into labeled tin capsules. Other studies have indicated that wholewood and cellulose have different isotopic values but similar trends in their variations [30], reflecting similar responses to climatic signals [31]. Therefore, wholewood δ13C was measured in the present study. Briefly, the samples were dried (70 °C, 48 h), milled to a powder, and sieved through an 80-mesh screen. The sieved particles were oxidized in an elemental analyzer (Flash EA1112 HT; Thermo Scientific, Waltham, MA, USA) to CO2 and analyzed with a mass spectrometer (DELTA V Advantage, Thermo Scientific; precision 0.1‰) to detect δ13C. The δ13C (‰) was calculated from Equation (2):
δ 13 C = ( R sample R standard 1 ) × 1000
where R is the ratio of 13C/12C. The standard was Vienna Pee Dee Belemnite (VPDB).
Since the Industrial Revolution in 1850, the use of 13C-deficient fossil fuel has caused an elevation in the atmospheric CO2 concentration and a decrease in δ13C. To compensate for this effect, measured δ13C values were corrected [31,32] by Equation (3):
δ13Ccor = δ13Ctree − (δ13Catm + 6.4)
where δ13Ctree represents the δ13C measured from the tree-ring sample; δ13Catm is the value of the atmospheric background; and δ13Ccor is the corrected value.
The δ13C for the pre-Industrial Revolution atmospheric CO2 was taken as −6.4‰. Data for atmospheric CO2 and δ13C between 1976 and 2003 were obtained from an earlier study [31], and data for 2004–2016 were obtained from the Earth System Research Laboratory (ESRL, National Oceanic & Atmospheric Administration of the United States; average of 22 monitoring sites) (http://www.esrl.noaa.gov/gmd/). After correction, the annual δ13C series for tree rings was obtained.

2.3. iWUE Calculation

Carbon isotope discrimination, Δ13C, was calculated [33] using Equation (4):
Δ 13 C = ( δ 13 C atm δ 13 C tree 1 + δ 13 C tree / 1000 )
where δ13Catm and δ13Ctree represent δ13C values for atmospheric CO2 and tree rings, respectively.
For C3 plants, Δ13C follows a linear relationship described by Equation (5):
Δ 13 C = a + ( b a ) C i C a
where Ci is the intercellular CO2 concentration, Ca is the atmospheric CO2, a is the discrimination due to diffusion of 13CO2 through stomata (a = 4.4‰), and b is fractionation discrimination by Rubisco against 13CO2 (b = 27‰).
Subsequently, iWUE was determined from the relationship between Δ13C and Ca [22,34] by Equation (6):
iWUE = A g s = ( C a C i 1.6 ) = C a ( b Δ 13 C ) 1.6 ( b a )
where 1.6 represents the ratio of diffusivities between water vapor and CO2 in the atmosphere.

2.4. Meteorological Data and Potential Evapotranspiration

Meteorological data (e.g., temperature, precipitation, relative humidity, wind rate, atmospheric pressure) recorded between 1976 and 2016 were retrieved from the Zhangbei County Meteorological Station (40.15° N, 114.70° E; elevation: 1393 m) near the experimental sites. Data were checked by Kendall’s test to ensure consistency, and were confirmed to be free of random variations, valid, and representative of the local climatic trend. Recording of the depth to groundwater at the town of Ertai only began in 1995, and we obtained these data from the City Water Resource Bureau.
Potential evapotranspiration (ET0) was estimated using the Penman-Monteith Equation (7) [35]:
ET 0 = 0.408 Δ ( R n G ) + γ 900 T + 273 μ 2 ( e s e d ) Δ + γ ( 1 + 0.3 μ 2 )
where ET0 represents potential evapotranspiration, Rn is net radiation from plant surfaces, G is soil heat flux, γ is the psychrometric constant, Δ is the slope of the saturated vapor pressure–temperature relationship, T is mean air temperature, μ 2 is wind speed at 2 m above the ground surface, e s is saturation vapor pressure, and e d is vapor pressure.

2.5. Data Analysis

Trees at the 26 experimental sites (Figure 1) were examined and classified into four levels of dieback (10–30%, 30–50%, 50–70%, and 70–90%) according to the proportion of dead crown relative to the whole crown. In the correlation analysis, median values (20%, 40%, 60%, and 80%) were used to represent the four levels. Dead trees had been observed at the beginning of our research in 2014, but their time of death had not been closely monitored. Plantation records showed that trees in the three locations had been planted in the same year. Therefore, the calendar year of death was determined to be 2013 by site investigation, and their tree-ring widths and 13C signatures at the end of 2012 were analyzed. Ring width, BAI, δ13Ccor, Δ13C, and iWUE were analyzed by a repeated measures ANOVA, where year was the repeated factor, and subsequent least significant difference (LSD) test with SPSS software (IBM SPSS Statistics 20, Chicago, IL, USA). A p-value < 0.05 was considered statistically significant. The responses of the tree-ring width, BAI, and iWUE to climatic factors for non-dieback, dieback, and now-dead trees were calculated using Pearson’s correlation coefficients based on monthly values in the growth season (May–September).

3. Results

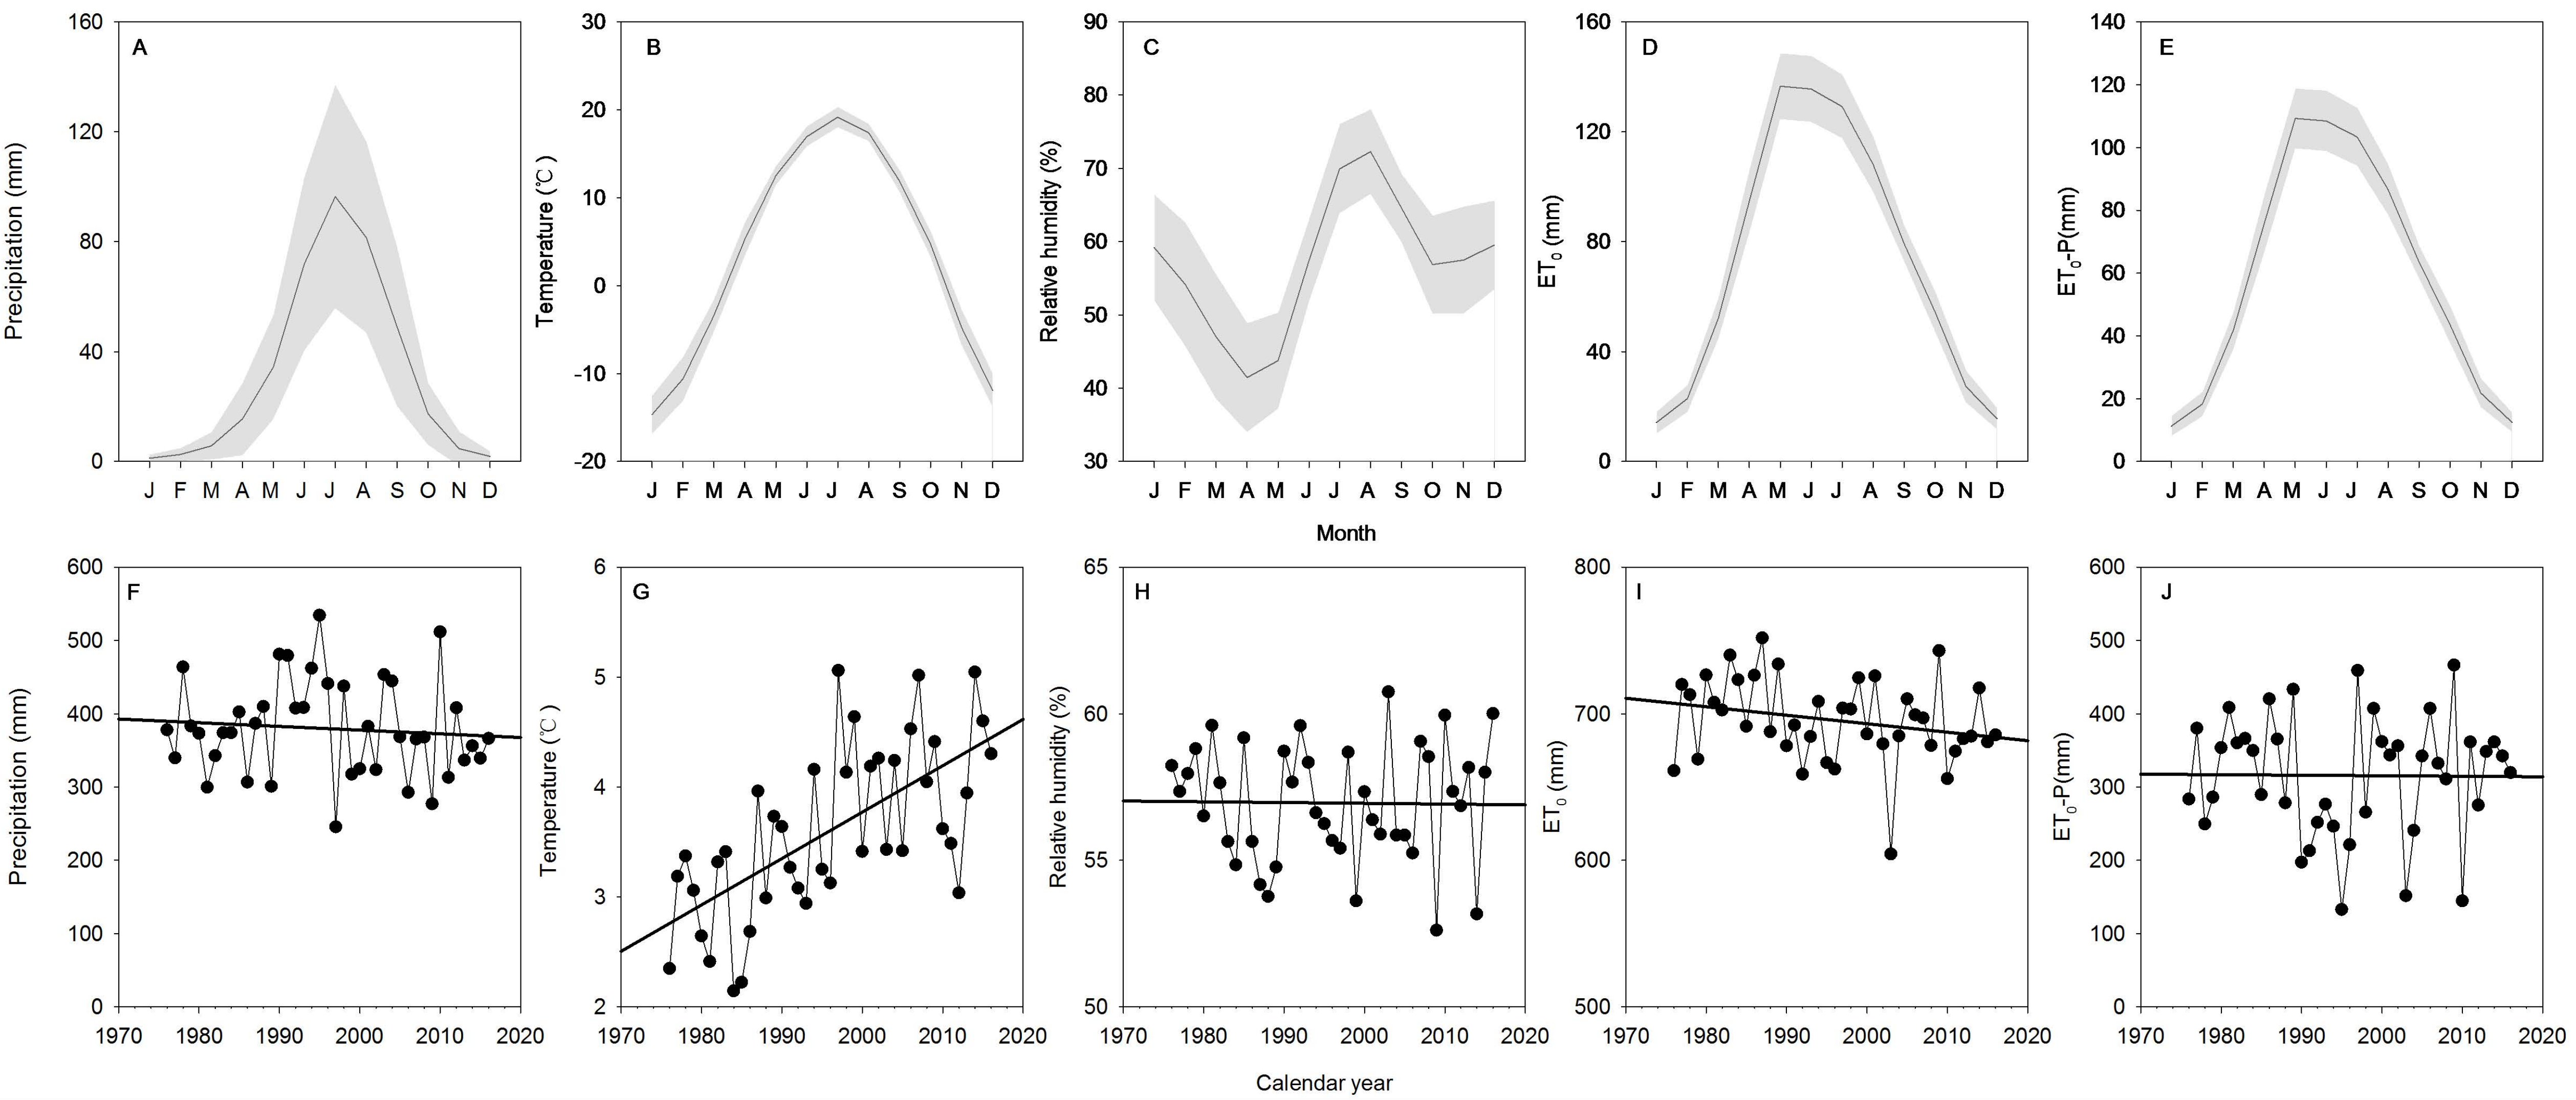
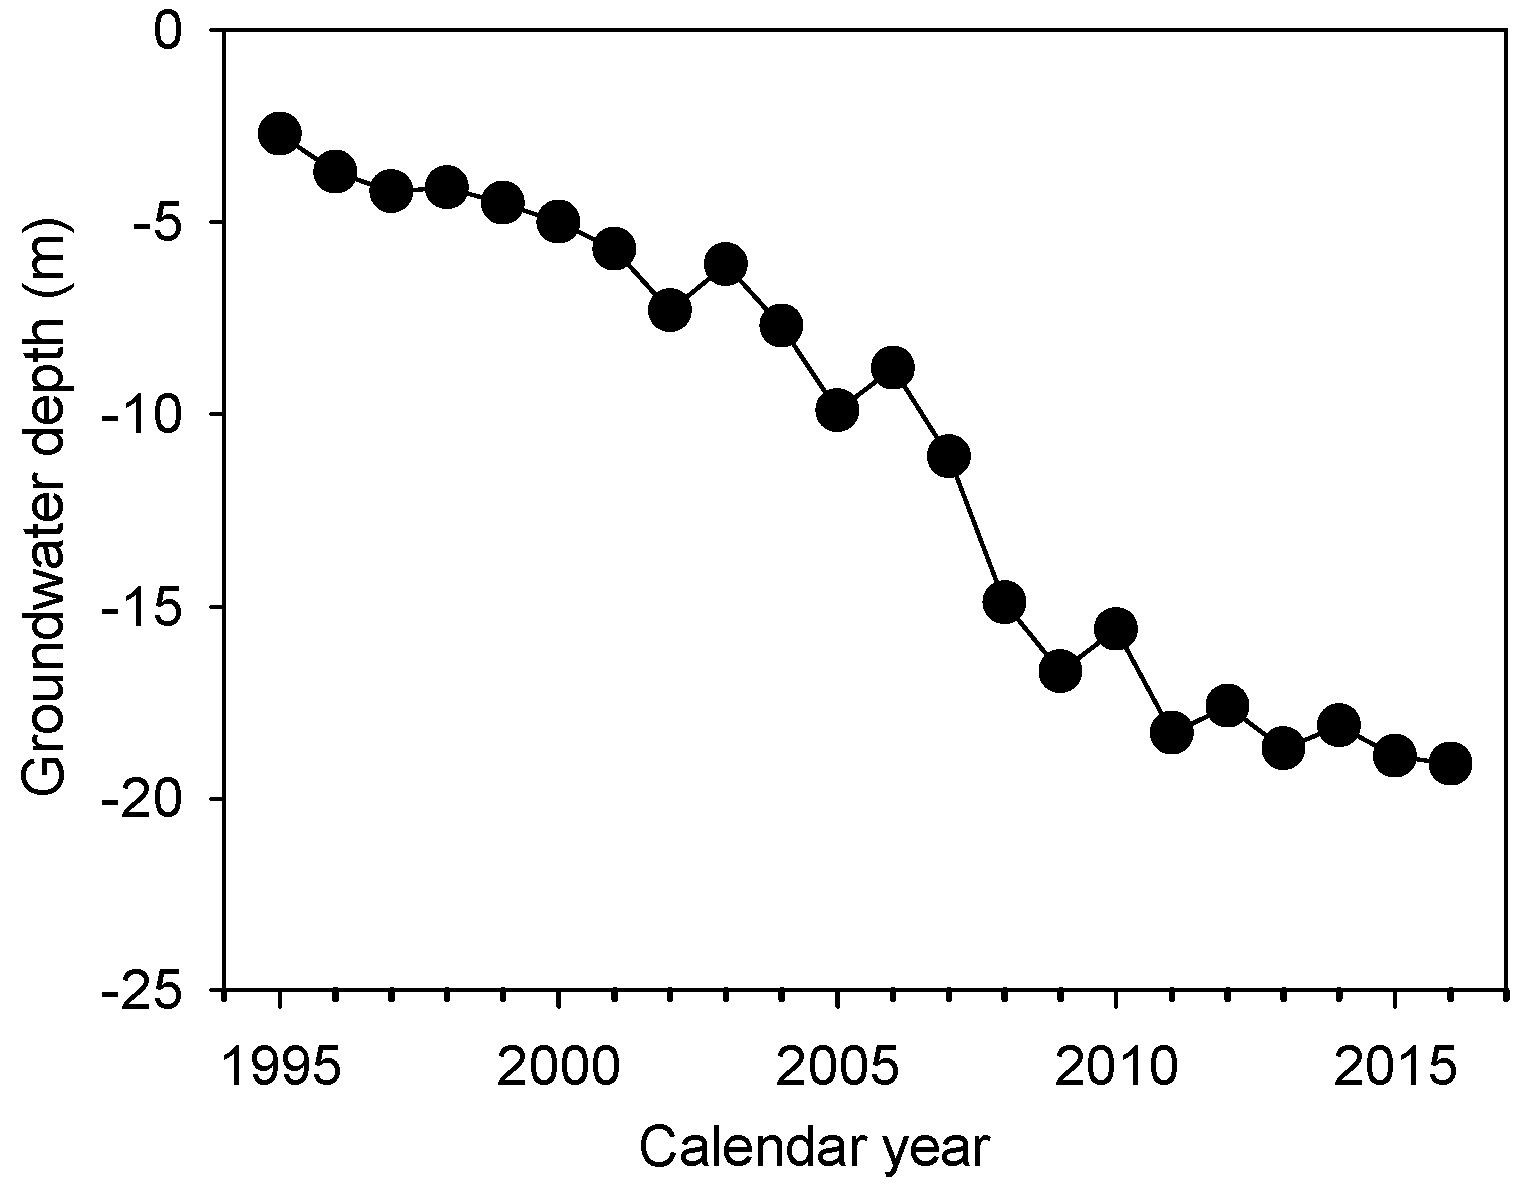
3.1. Meteorological Factors and Potential Evapotranspiration (ET0)

Monthly mean precipitation (Figure 2A) was uneven during the study period (1976–2016), with approximately 65% falling as a rain during June–August. The mean monthly temperature showed wide variations, ranging from −14.7 °C in January to 19.5 °C in July (Figure 2B). Relative humidity was lower in April–May and higher in July–August (Figure 2C), and exhibited a seasonal dry–wet cycle. Mean ET0 was highest in May, coinciding with low monthly mean precipitation, thereby leading to a severe water imbalance (ET0-P).
Between 1976 and 2016 (Figure 2F), total annual precipitation in Zhangbei County was consistently <540 mm (mean, 379.7 mm). Annual precipitation varied considerably during this period, creating alternate wet and drought years. An extreme drought (245.2 mm precipitation) occurred in 1997. The years 2006 and 2009 had only 292.2 and 276.8 mm precipitation, respectively. Overall, the annual precipitation tended to slightly decrease over time. The annual mean temperature (Figure 2G) was relatively low because of high local elevation, and fluctuated between 2.1 °C and 5.1 °C. However, it had been rising significantly (R2 = 0.43, p < 0.01), increasing by 1.72 °C over the 41-year period. The relative humidity (Figure 2H) varied between 52% and 61%, with a weak decreasing trend over time. Rather than increasing with temperature, the ET0 continued to decrease over time, which may have resulted from changes in vegetation cover associated with poplar die-off (Figure 2I). The ET0 substantially exceeded the precipitation level, indicating this county is in an arid area (Figure 2J). Overall, the meteorological data indicated that the region had been undergoing severe aridification over the past four decades, driven by decreasing precipitation and increasing temperature.
The groundwater depth (Figure 3) was <−4 m before 1998. It began to increase in 1999 and accelerated between 2002 and 2016, increasing from −6 to −19 m. Groundwater depth increased the water imbalance in the experimental area and aggravated local droughts.

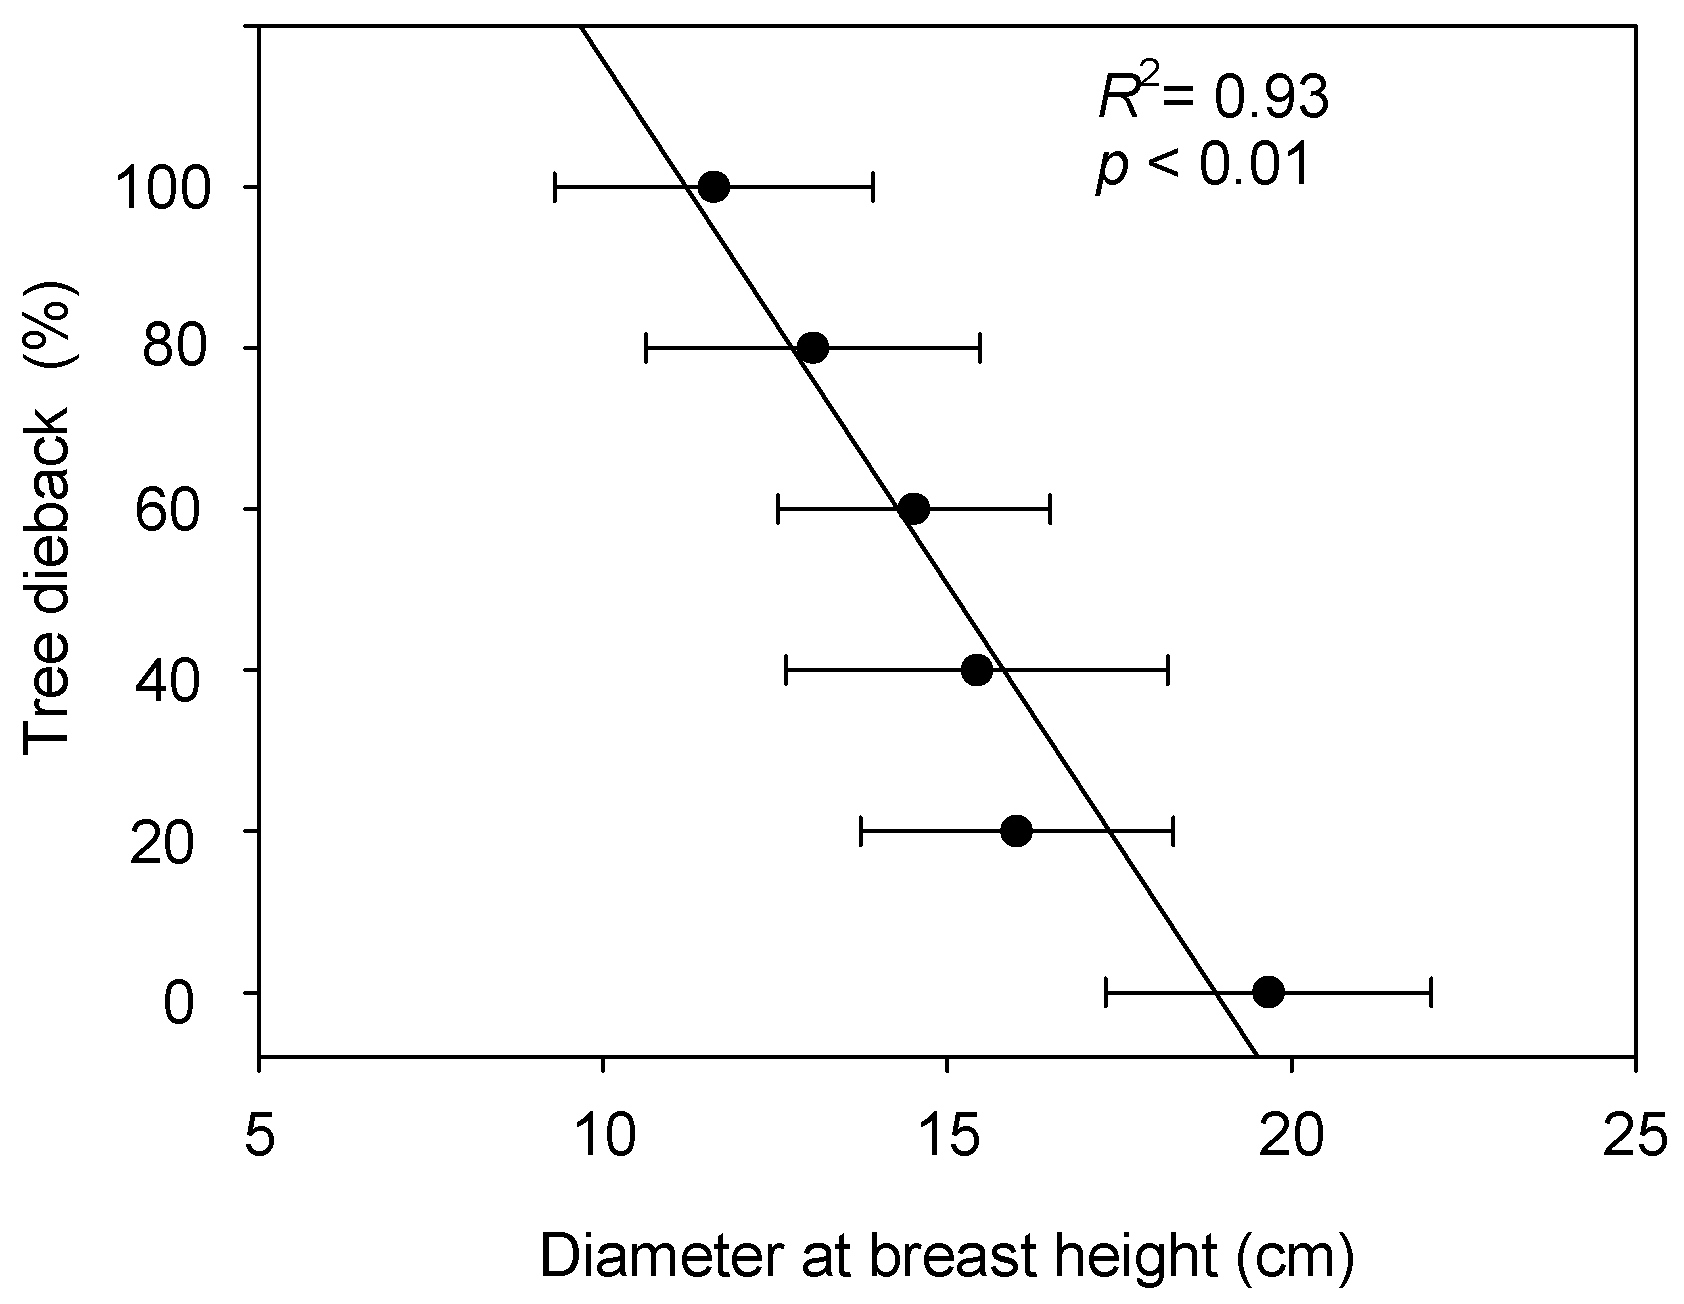
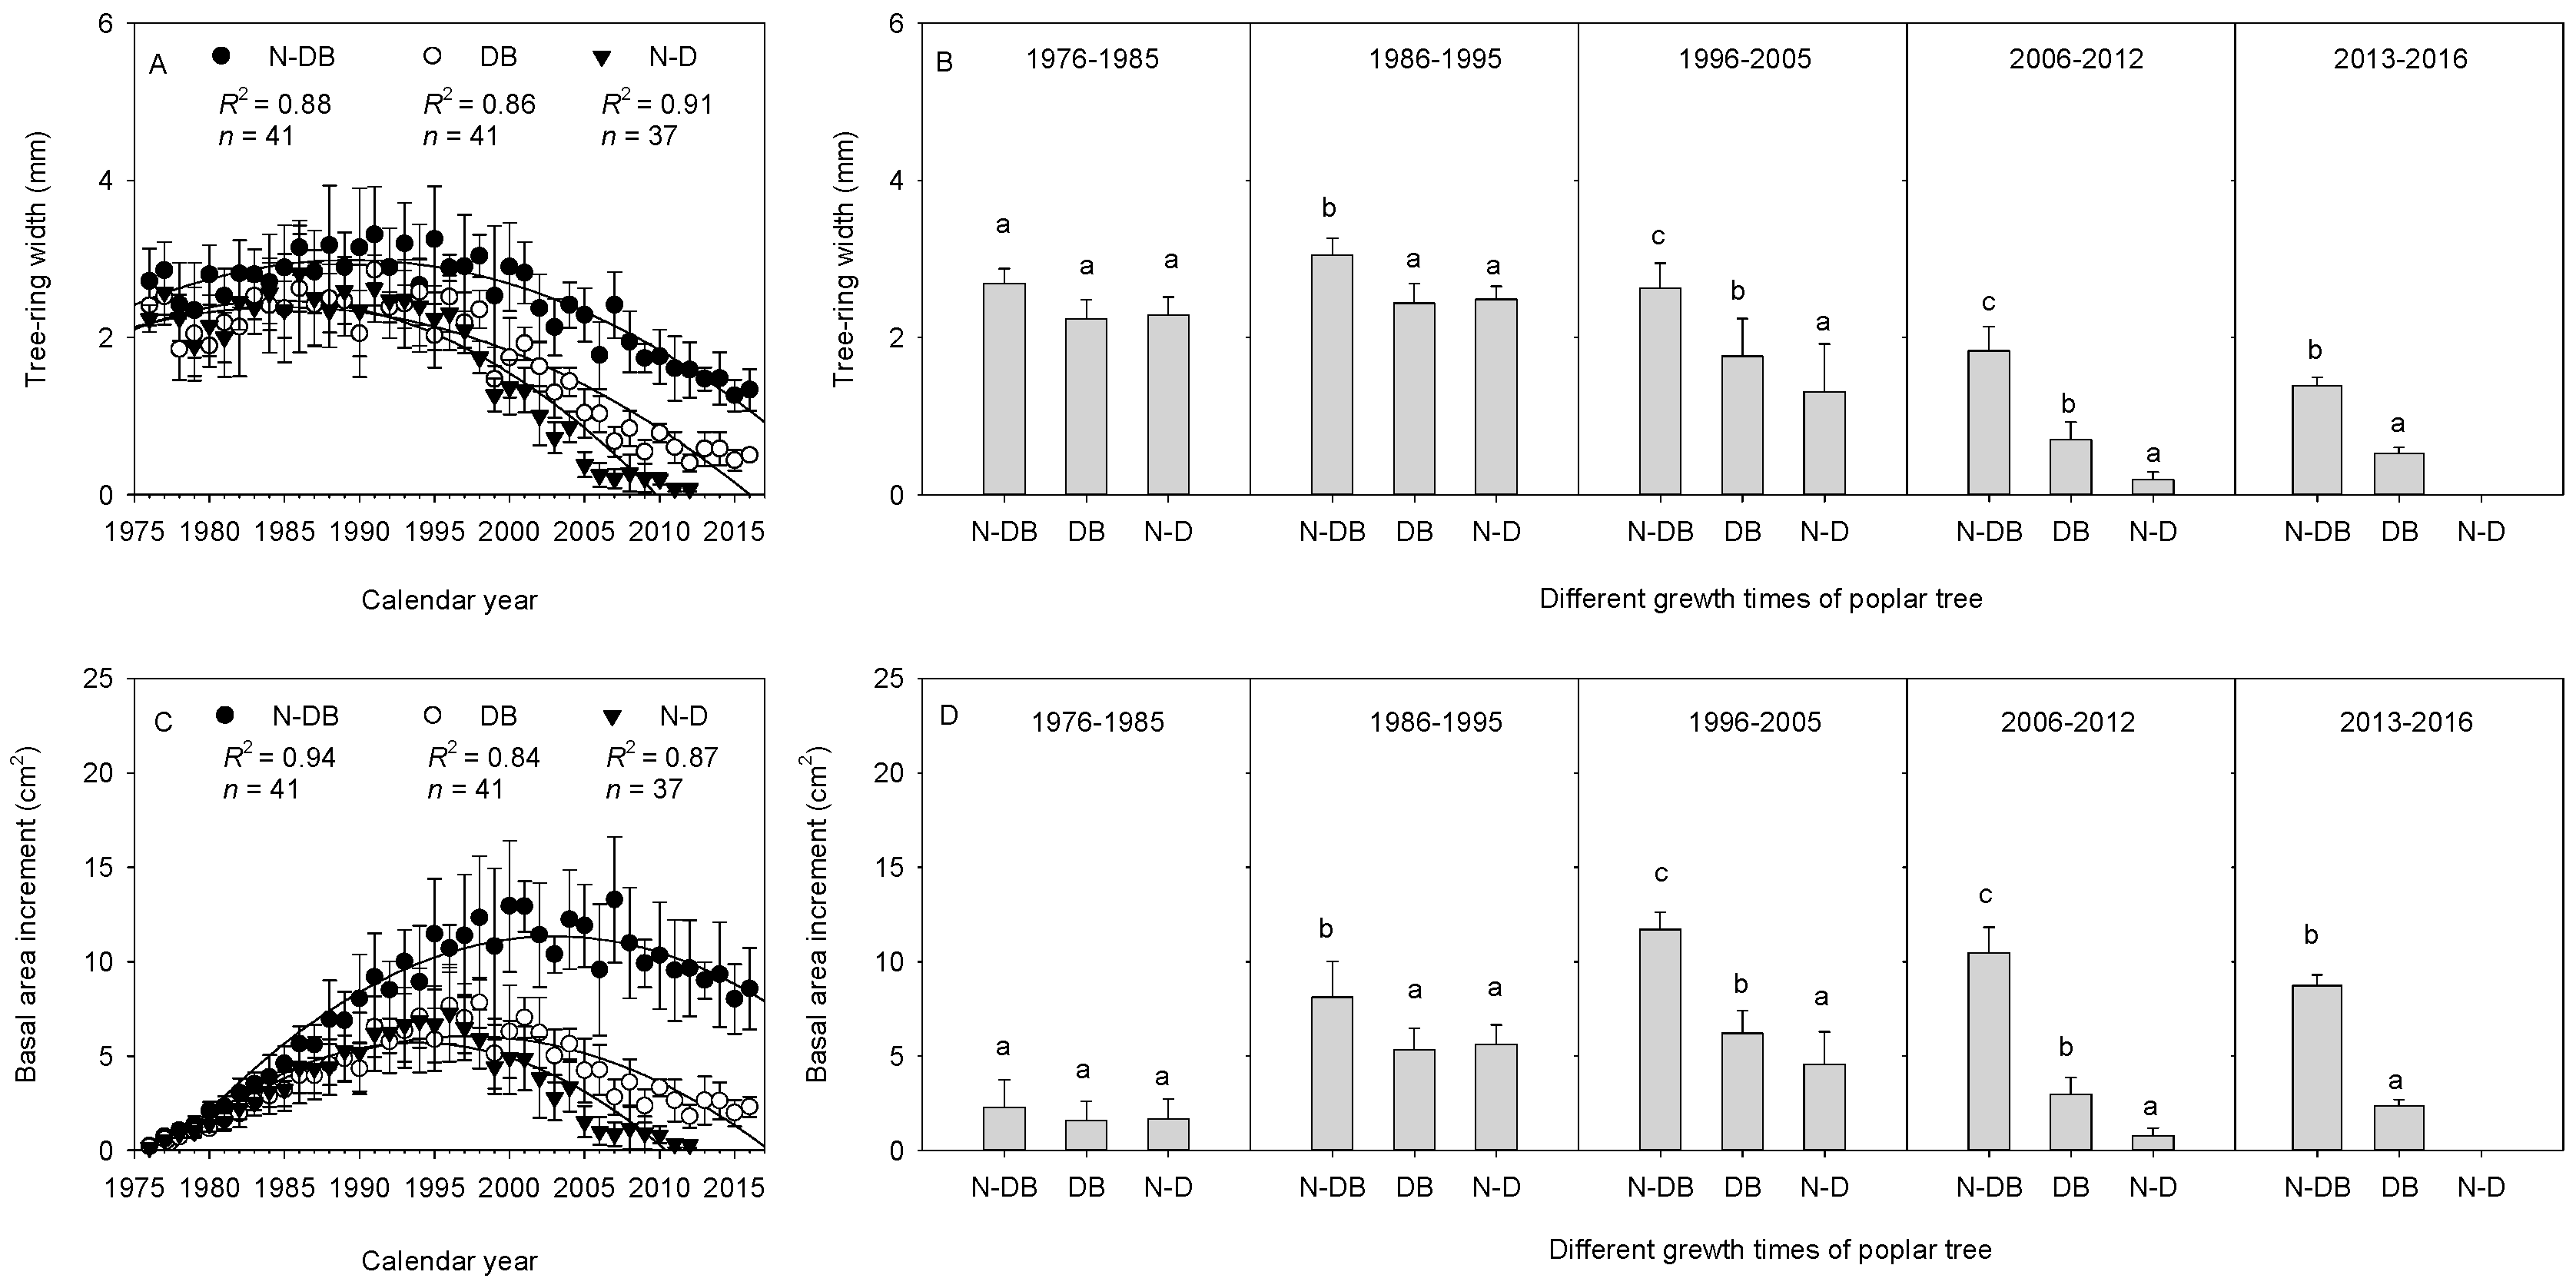
3.2. Relationship between Poplar Growth and Dieback

Surveys found that the county had planted 1.02 × 10⁵ hectares of shelterbelts. Of these, 8.11 × 10⁴ hectares (79.5%) of stands experienced dieback, with 3.39 × 10⁴ hectares (33.2%) now dead or nearly dead. The non-dieback group (Figure 4) had a mean DBH of 19.66 ± 2.36 cm, compared with 11.61 ± 2.31 cm in the die-off group. The trees with 20%, 40%, 60%, and 80% dieback levels had mean DBH of 13.05 ± 2.42, 14.52 ± 1.98, 15.43 ± 2.77, and 16.01 ± 2.70 cm, respectively. A linear correlation analysis revealed a highly significant (p < 0.01) inverse relationship between the DBH and the level of dieback, showing that the occurrence of dieback severely restricted tree growth.
The tree-ring width in the now-dead group peaked in 1986 (Figure 5A) and decreased subsequently. The tree-ring width in the other two groups peaked in 1991 and then decreased. For all three groups, the tree-ring width showed a highly significant (all p < 0.01) quadratic relationship with age. The regression curves peaked at 1985 (now-dead, dieback) and 1990 (non-dieback), indicating that the radial growth began to slow down five years earlier in the now-dead and dieback groups than in the non-dieback group. The differences among the three groups were not statistically significant (all p > 0.05) during the first decade (1976–1985) after planting. The tree-ring width in the non-dieback group was significantly greater than that in the now-dead and dieback groups during the second decade (1986–1995), but did not differ between the now-dead and dieback trees. The tree-ring width differed significantly (p < 0.05) among the three groups from the third decade (1996–2005) onward (Figure 5B).
For all three groups, the BAI showed a highly significant (all p < 0.01) quadratic relationship with age. The regression curves peaked at 1994 (now-dead), 1997 (dieback), and 2003 (non-dieback), indicating that the BAI of the now-dead and dieback groups began to slow down nine and six years earlier, respectively, than did the BAI of the non-dieback group. The difference (Figure 5C) in BAI between the now-dead and non-dieback groups was not statistically significant during the first decade, but was significant (p < 0.05) from the second decade onward (Figure 5D). The difference in BAI between the now-dead and dieback groups was statistically significant from the third decade (all p < 0.05).

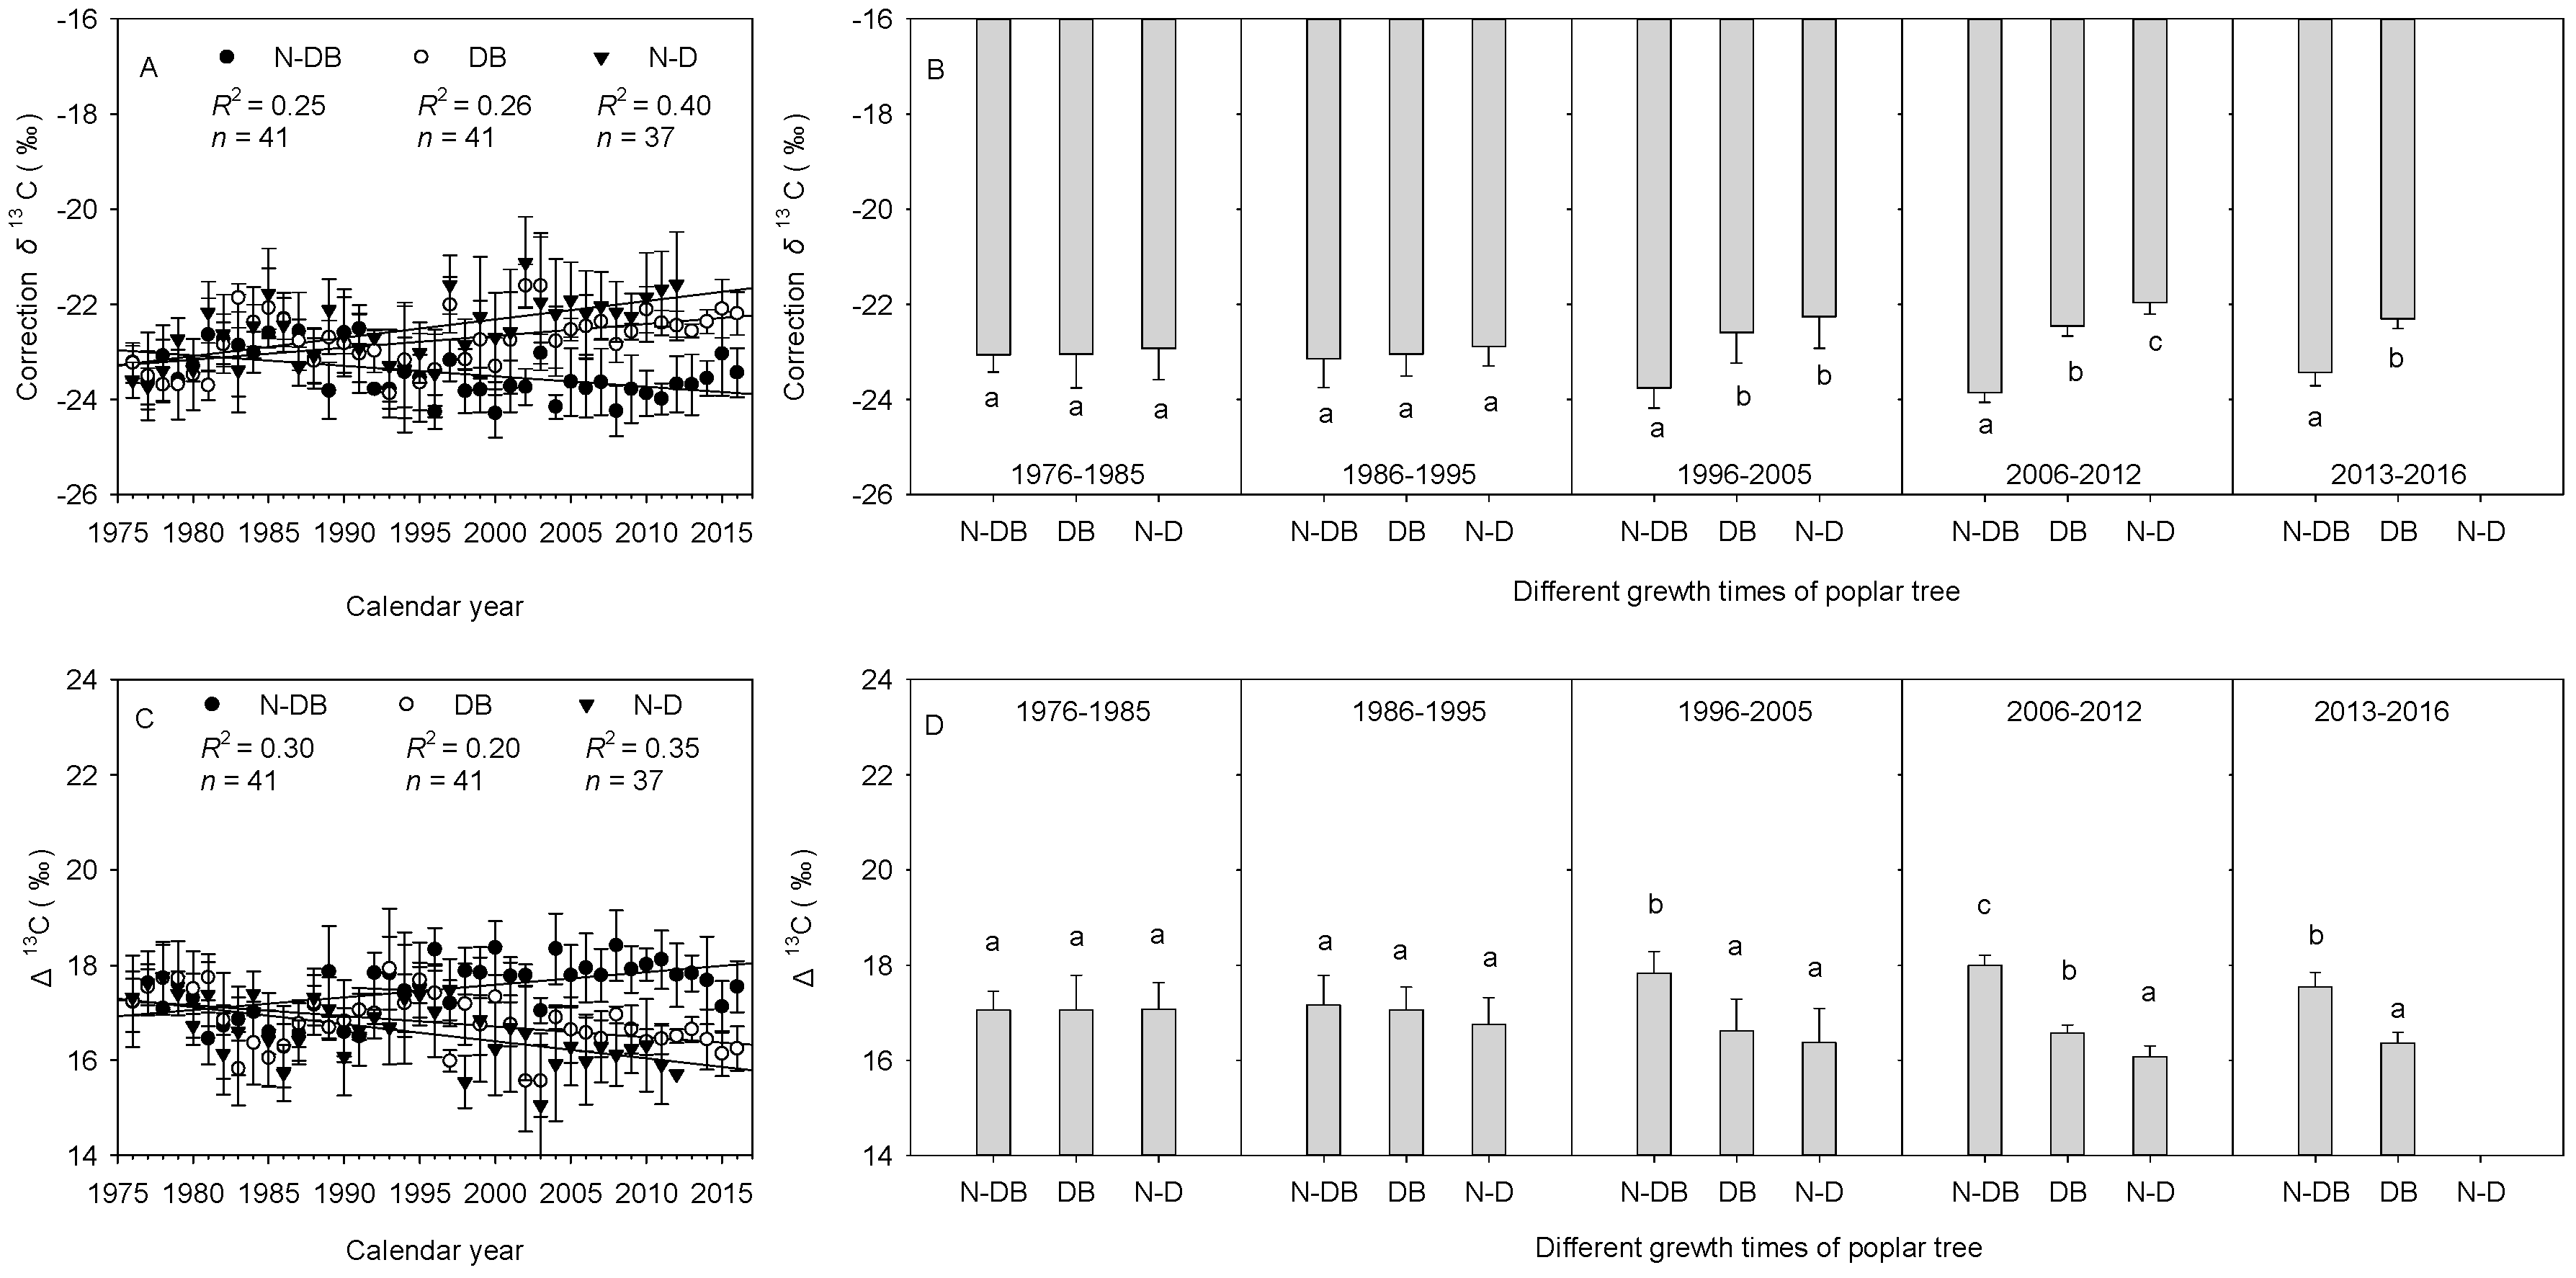
3.3. Differences in Tree-Ring δ13C

After correction for the influence of the Industrial Revolution, the δ13Ccor (Figure 6A) of the now-dead and dieback groups increased gradually over time, whereas that of the non-dieback group decreased over time. The variations in δ13Ccor could be divided into four stages. In the first stage (1976–1995), the three groups had similar trends and no significant difference in δ13Ccor. In the second stage (1996–2005), the non-dieback group had significantly lower δ13Ccor than the other two groups (p < 0.05), but the difference between the now-dead and dieback groups was not significant. In the third stage (2006–2012), the three groups had significant differences in δ13Ccor (p < 0.05). The non-dieback group had significantly lower (p < 0.05) δ13Ccor than the dieback after the now-dead trees died in 2013 (Figure 6B). The Δ13C value of rings (Figure 6C) in the now-dead group varied between 15.06‰ and 17.76‰; that in the dieback group varied between 15.56‰ and 17.90‰; and that in the non-dieback group varied between 16.28‰ and 18.42‰. The Δ13C of now-dead and dieback trees decreased over time, whereas that of non-dieback trees increased over time (Figure 6D). The changes in Δ13C were also divided into four stages and the statistical significance was similar to that of δ13Ccor.

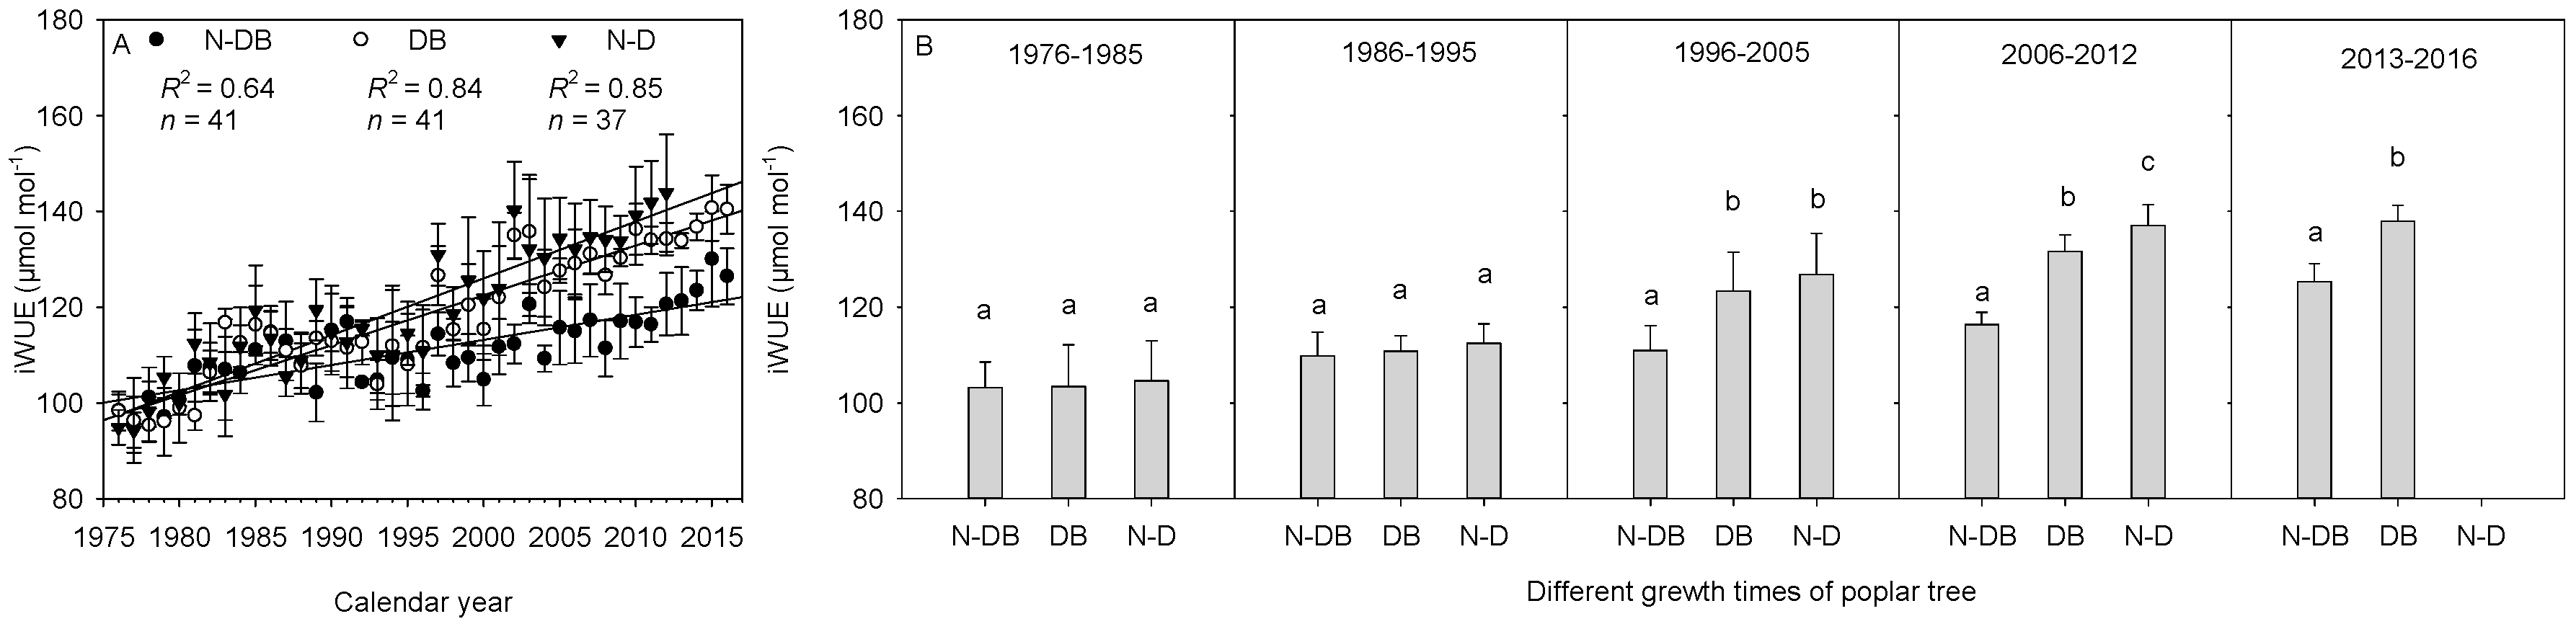
3.4. Differences in iWUE

All three groups showed increasing iWUE with age, with highly significant (all p < 0.01) linear relationships (Figure 7A). The non-dieback group had a significantly lower regression slope (0.52) than those of the other two groups (now-dead: 1.17; dieback: 1.04). The variations in iWUE were divided into four stages. In the first stage (1976–1995), the three groups had similar iWUEs and no significant differences. In the second stage (1996–2005), the iWUEs were significantly higher (p < 0.05) in the now-dead and dieback groups than the non-dieback group, but the difference in iWUE between the now-dead and dieback groups was not significant. In the third stage (2007–2012), the three groups showed significant differences in iWUE. The iWUE was significantly lower (p < 0.05) in the non-dieback group than in the dieback group after now-dead trees died in 2013 (Figure 7B).

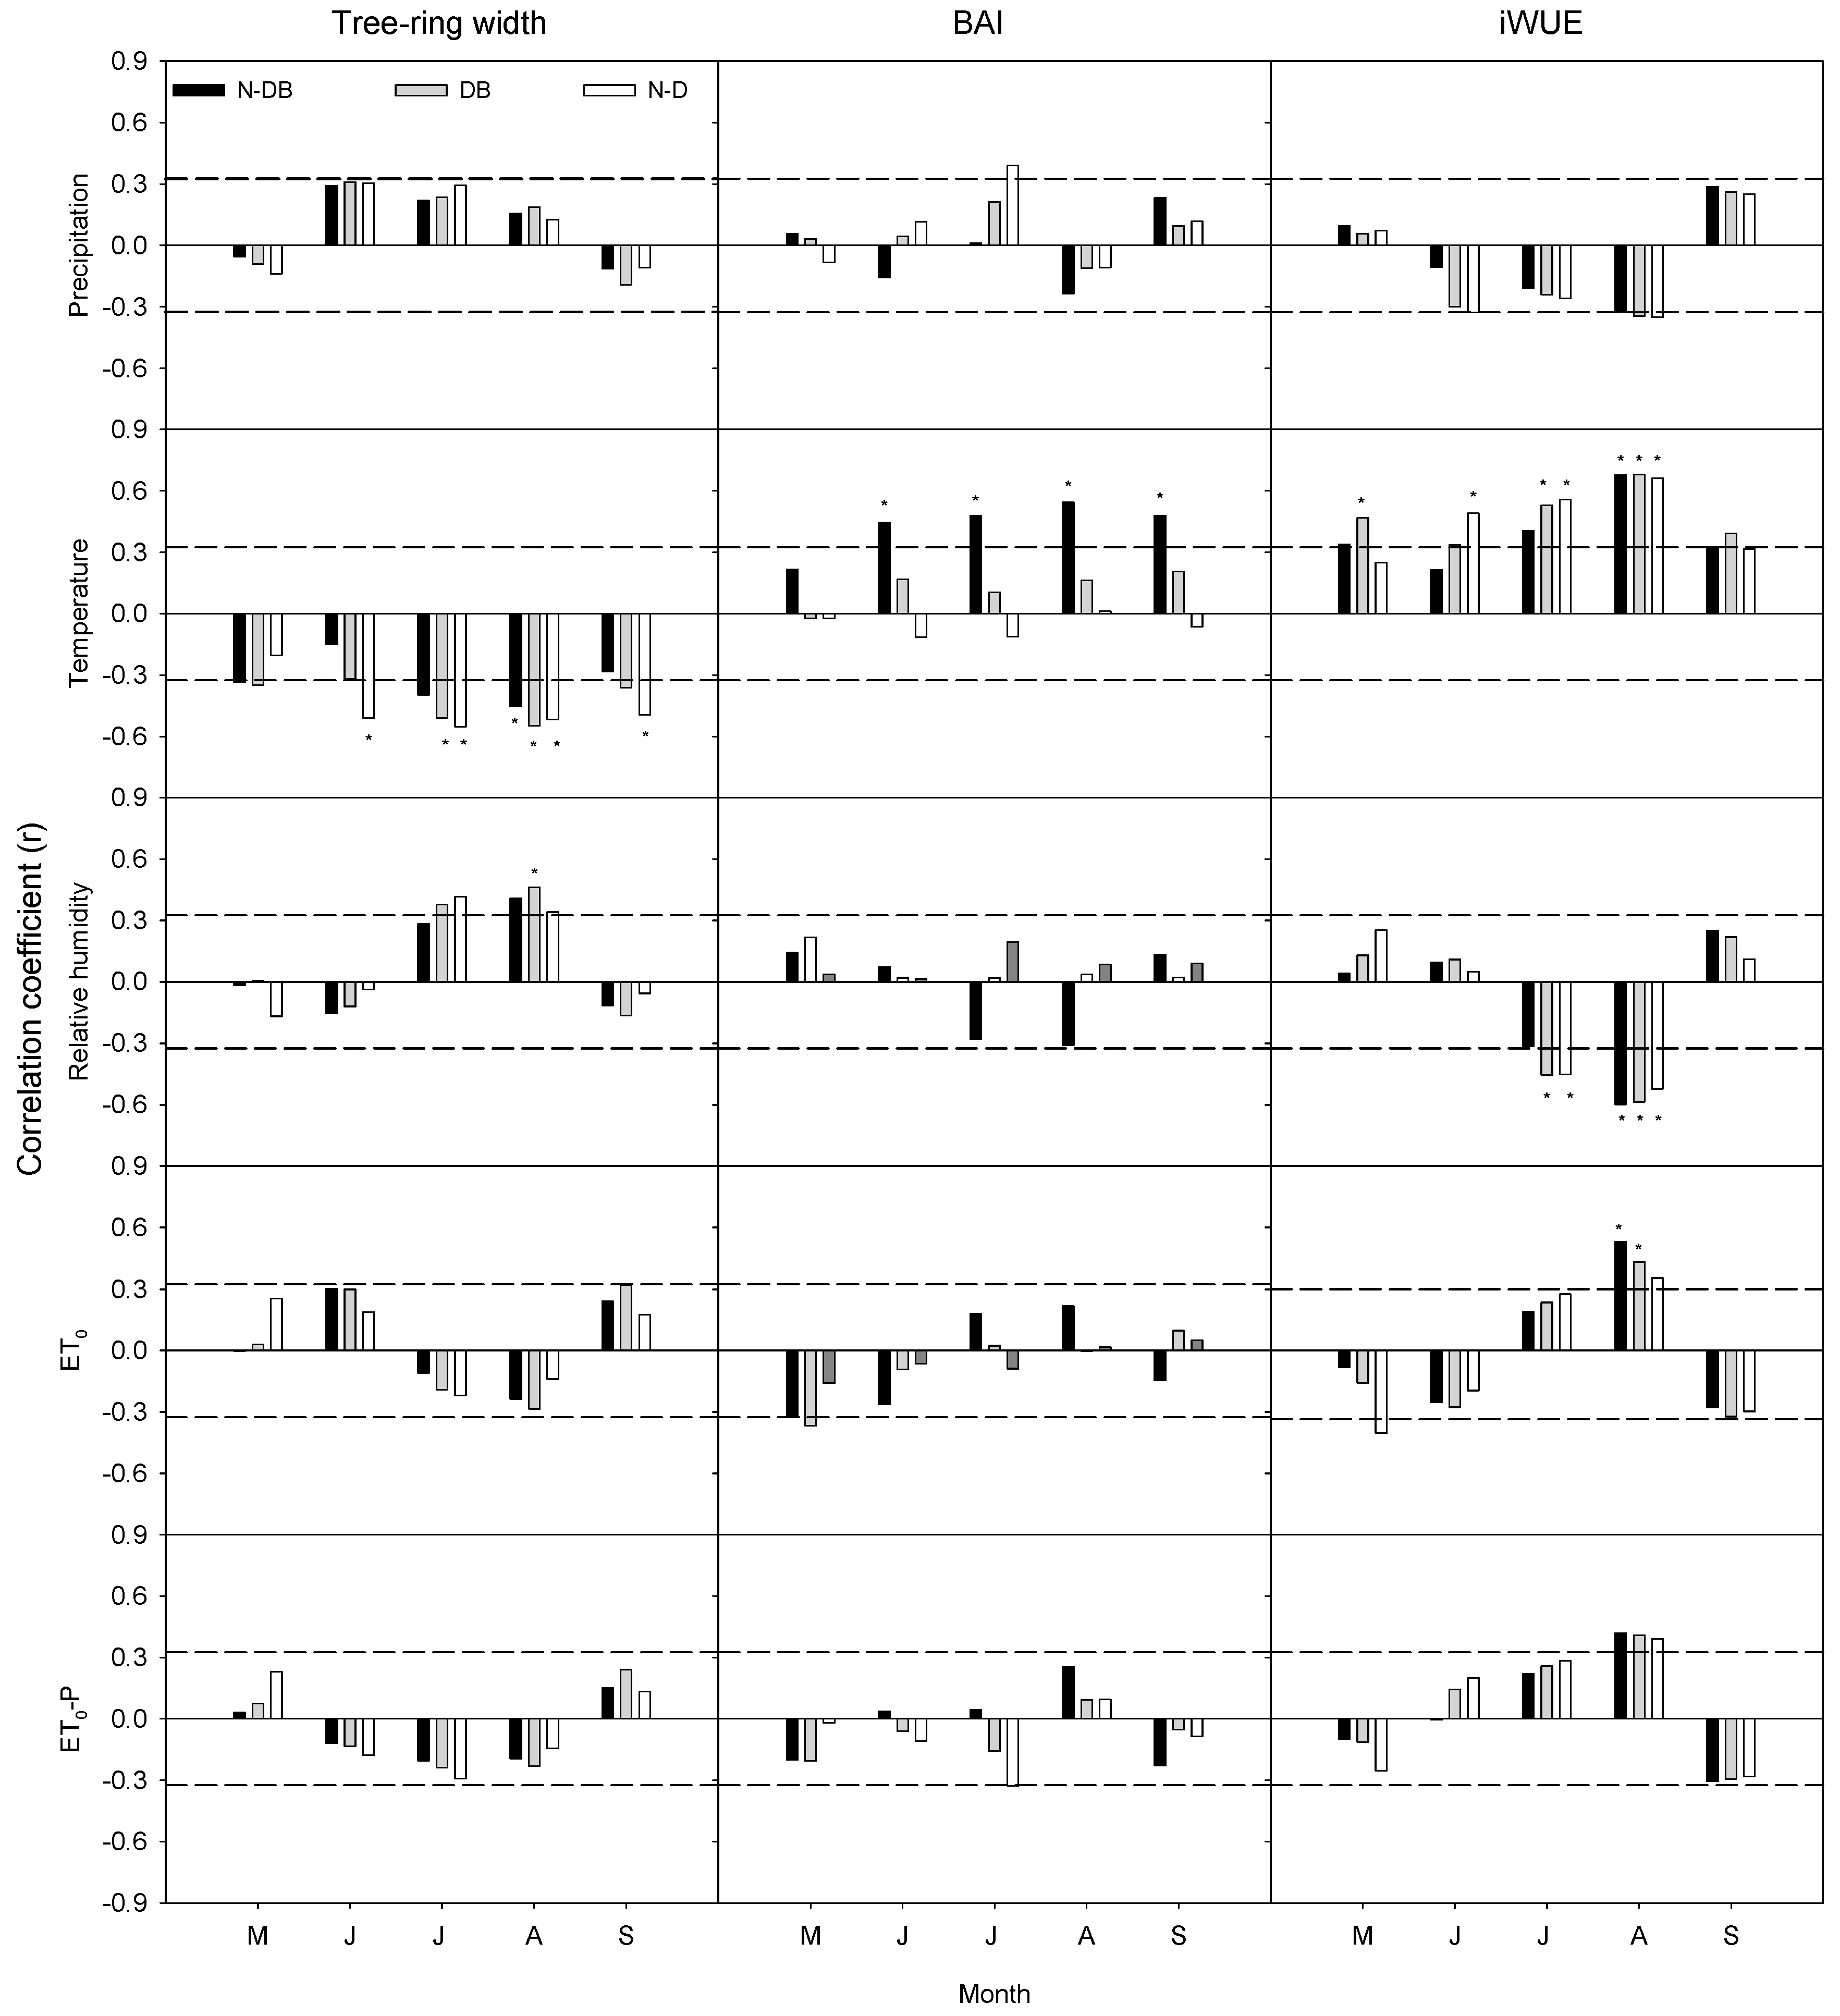
3.5. Relationship between Tree-Ring Records and Environmental Factors

In all three groups, tree-ring width was negatively correlated with temperature (Figure 8). The correlation was highly significant (p < 0.01) from June to September for the now-dead group, significant (p < 0.05) in May, July, August, and September for the dieback group, and significant (p < 0.05) only in July and August for the non-dieback group. These findings indicated that radial growth was more sensitive to temperature in the now-dead and dieback groups than in the non-dieback group. The BAI of the non-dieback group was significantly positively correlated with temperature from June to September (p < 0.01). There was no significant correlation between BAI and temperature for now-dead and dieback groups, indicating that the now-dead and dieback groups did not respond positively to the temperature increase like the non-dieback group did. The correlation between iWUE and temperature for the now-dead group was highly significant (p < 0.01) from June to August, and that for the dieback group was significant (p < 0.05) from May to September, and highly significant (p < 0.01) in May, July and August; that for the non-dieback group was significant (p < 0.05) only in July and August. These results indicated that the iWUE of the now-dead group was the most sensitive to temperature, especially during the vigorous growth period of June, July, and August.
Relative humidity is one of the important factors affecting the growth of poplar trees. In the now-dead and dieback groups, the annual tree-ring width (p < 0.05) was positively associated with relative humidity in July and August, but the iWUE (p < 0.01) was significantly negatively associated with relative humidity in July and August. The annual tree-ring width and iWUE of the non-dieback group were only significantly affected by relative humidity in August (p < 0.05). The iWUE of all three groups was significantly correlated with precipitation, temperature, relative humidity, ET0, and water balance (ET0–P) in August (p < 0.05). These results indicated that, compared with tree-ring width and BAI, iWUE was more sensitive to environmental factors. Thus, during the entire growing season, the environmental factors in August played a key role in the water use of poplar trees.

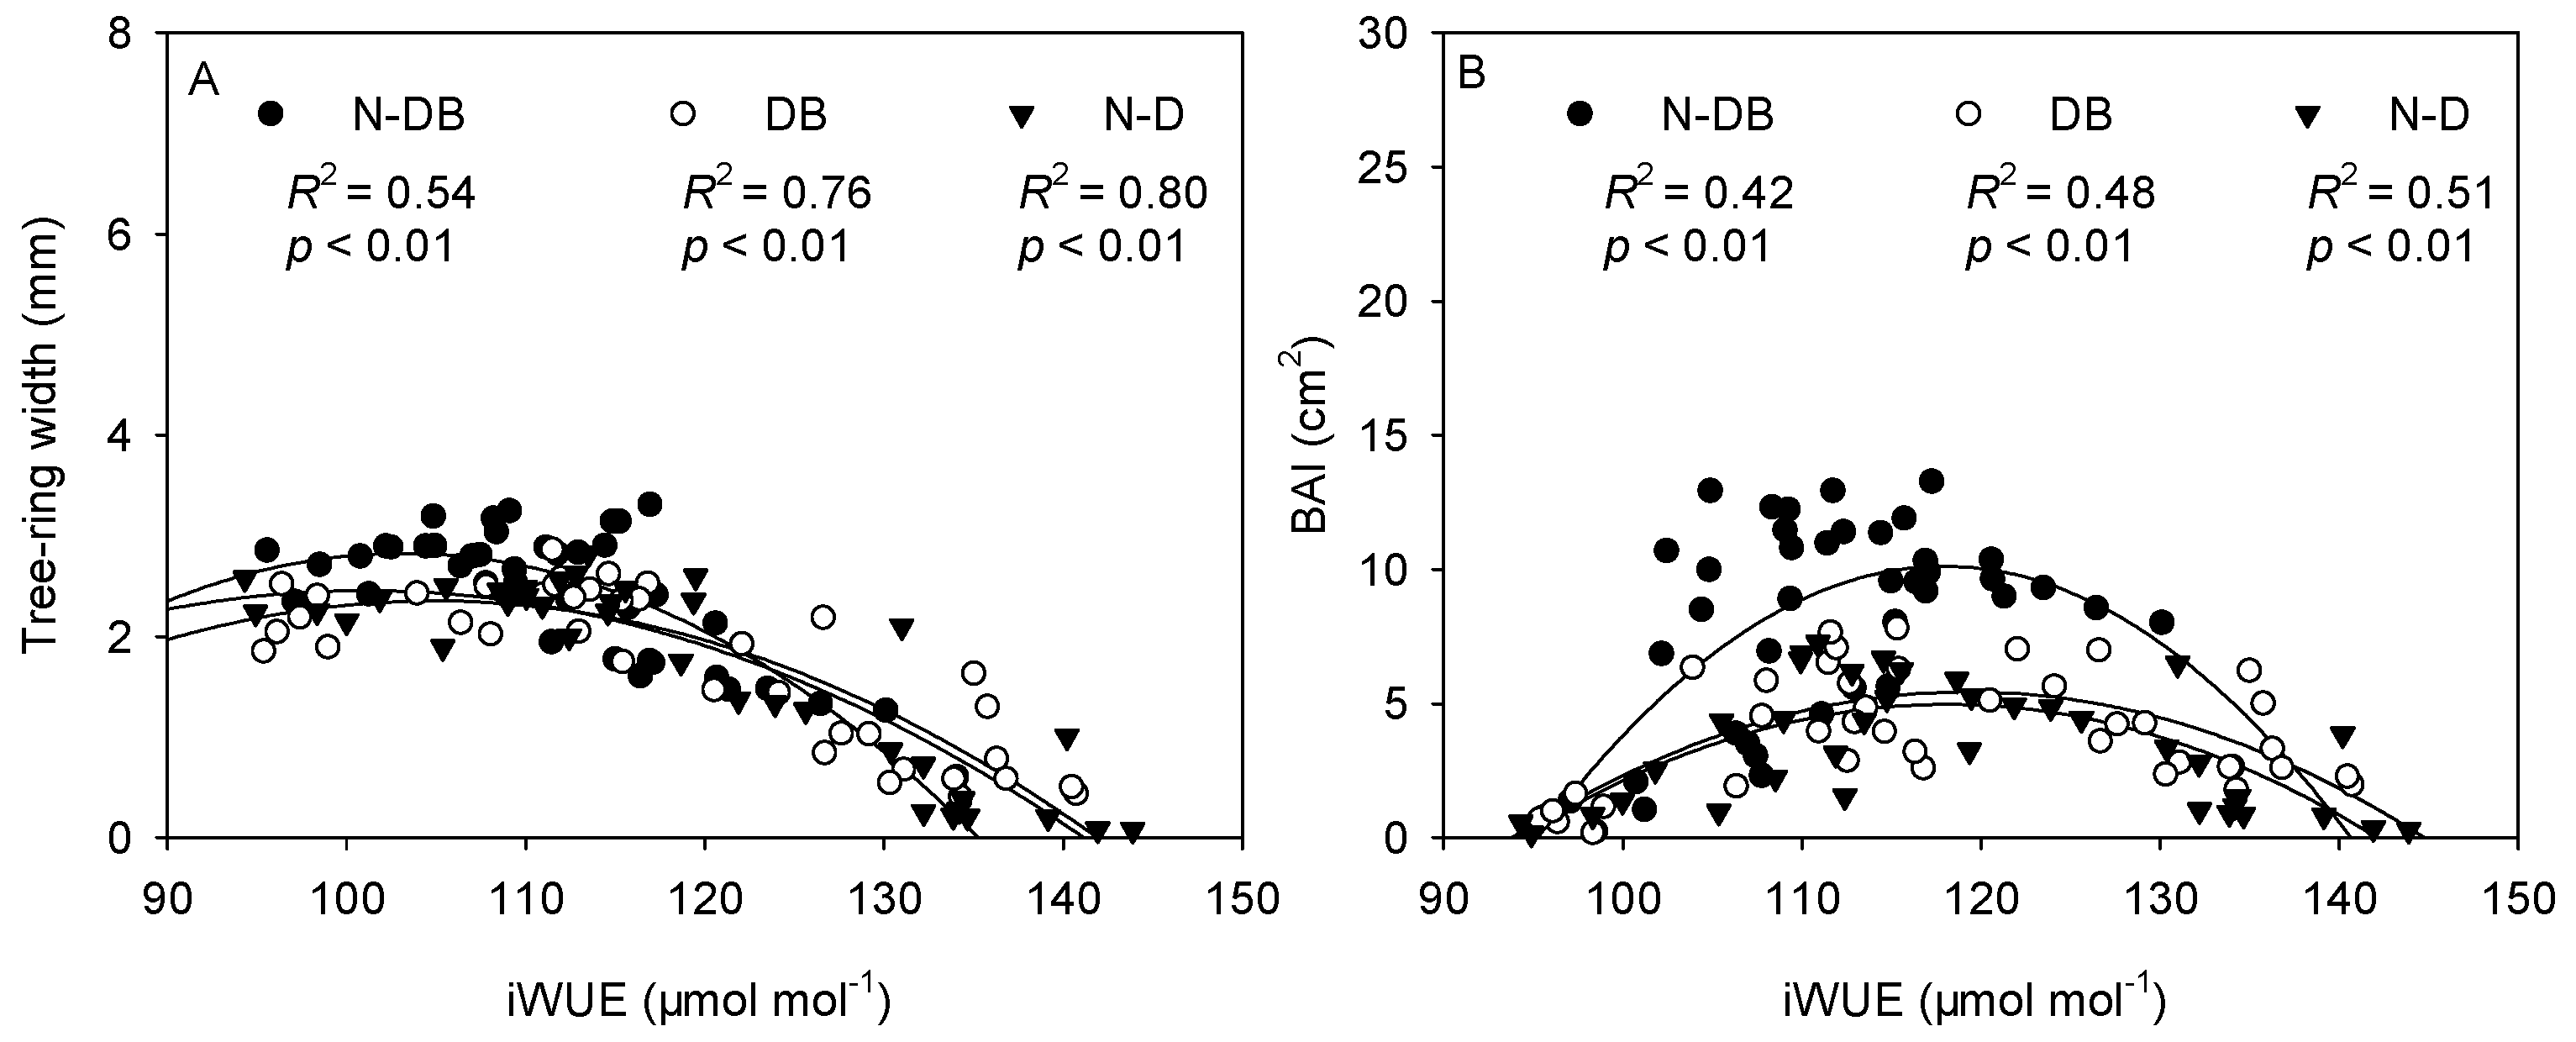
3.6. Relationship between Radial Growth and iWUE

For all three groups, the tree-ring width (Figure 9A) showed a highly significant (p < 0.01) quadratic relationship with iWUE. This indicated that, with increasing iWUE, the radial growth slowed gradually after peaking. The iWUEs were much higher in the now-dead and dieback groups than in the non-dieback group, indicating slower growth of the former two groups. Nevertheless, all regression curves peaked at similar values (now-dead: 105.79, dieback: 106.35, non-dieback: 104.81 μmol mol−1). The BAIs of the three groups (Figure 9B) also showed highly significant (p < 0.01) quadratic relationships with their iWUEs, with regression curves peaking at 117.79 (now-dead), 118.94 (dieback), and 118.06 (non-dieback) μmol mol−1.

4. Discussion

4.1. Differences in Radial Growth before Drought-Induced Death

Earlier studies in many regions have found that increasing temperature and reducing precipitation can intensify drought stress and significantly increase the risk of death among drought-stressed plants [36,37]. The leaf area is a major determinant of the plant water requirement. Under drought stress, a plant can reduce its transpiration area by adjusting the leaf area [38]. This strategy is used by plants to reduce water transpiration from the canopy, and is used by poplar trees to survive drought. The leaf area index (LAI) decreases as drought becomes increasingly severe [39], and trees show progressive changes chronologically [40]: premature leaf senescence, partial dieback of the crown and shoots, and eventually tree mortality after successive droughts [37,41]. In the shelterbelts studied here, these three changes all appeared, and the severity of partial dieback and tree mortality increased steadily over time.
Under water stress, a tree may reduce its vigor or growth rate for long-term survival. A decrease in radial growth was observed before death in 84% of mortality events [42]. In the present study, the now-dead group had the lowest DBH, followed sequentially by the dieback and non-dieback groups. This trend indicates that drought had affected tree growth at the experimental sites. Our finding is consistent with those of an earlier study [27] reporting that Italian oaks killed by drought were smaller and had grown more slowly before death, compared with the surviving ones. In temperate and subalpine forests of northern China, the rate of tree death has frequently been reported to show a U-shaped relationship with tree size (e.g., DBH). The high death rate of smaller trees was explained by competition with taller ones for solar radiation, and that of taller ones was attributed to hydraulic failures associated with the longer distance of water transport [43]. Additionally, a temperature increase or precipitation decrease may create a water imbalance, affecting the local productivity of plants [44]. Consequently, biomass loss occurred before drought-induced death of poplar trees. In the present study, we detected a downward trend in BAI (Figure 5B) and significantly lower BAIs in the now-dead and dieback groups than in the non-dieback group. These are persuasive signs of retarded growth [29]. Plants routinely respond to changes in resource availability via gaining or losing biomass [40], but even a sharp decrease in biomass may not necessarily allow trees to avoid dieback or death. In Zhangbei County, 1997 was very dry (245 mm precipitation), and this extreme drought triggered a divergence in the subsequent fates of poplar trees. Extreme climatic events are known to affect plant growth and mortality [45]. Extreme summer drought has been shown to affect the water relationships and carbohydrate dynamics of woody angiosperms [46,47], causing dieback, hydraulic failure, and death. In the present study, the severity and duration of the drought in 1997 exceeded the tolerance of poplar trees, thus triggering long-term effects such as canopy defoliation and retarded growth. Gao reported that both the timing of onset and severity of drought increased “legacy effects” on tree stem radial growth, which reduced the drought resilience of trees [48]. Other studies have suggested that drought-induced stand changes may negatively affect the composition and ecological services of forests [49].

4.2. Differences in iWUE before Drought-Induced Death

Plants adapt to drought stress via multiple mechanisms such as adjusting growth [50] and increasing iWUE [15,22]. When environmental factors vary, trees change their discrimination among carbon isotopes. Under drought stress, trees close stomata to avoid hydraulic failure; this lowers the intracellular CO2 concentration (Ci) and increases the δ13C, thereby affecting the 13C signature of tree-ring cellulose. In our study, the now-dead group had significantly higher δ13Ccor than the non-dieback group between 1997 and 2007 (Figure 6A); from 2008 onward, the now-dead and dieback groups showed significantly higher δ13Ccor than the non-dieback group. These differences are in line with other reports that declining stands had higher δ13C than healthy ones [20].
We indirectly estimated iWUE from δ13C records of tree rings. The iWUE data can provide an annual archive of gas-exchange and growth. The trees may not only respond to environmental factors, but also their growth status, which would influence their stomatal conductance and photosynthetic rates, thereby altering the iWUE. Earlier studies have found that declining silver fir [14] and Scots pine [16] showed a higher iWUE compared with non-declining trees, but a reverse pattern was observed in Quercus frainetto Ten. [24] and Pinus nigra J.F.Arnold [25]. In our study, the non-dieback group showed a gradually increasing iWUE (Figure 7), whereas the other two groups had approximately two-fold greater regression slopes of increase (compared with that of the non-dieback group). Between 1996 and 2005, the iWUEs were significantly higher in the now-dead and dieback groups than in the non-dieback group. From 2006 to 2012, the three groups showed significant differences in iWUE. These findings suggested that the now-dead and dieback groups experienced more severe environmental stress and relied more on water-saving strategies than did the non-dieback group [51]. Some studies have suggested that drought stress in arid regions forces trees to close stomata, thus reducing CO2 absorption. Consequently, tree growth decelerated despite the increased iWUE [17,52]. This theory is in agreement with the results of the present study.
The iWUE characterizing tree rings is affected by multiple environmental factors such as temperature, precipitation, relative humidity, and ambient CO2 [53]. In all three groups, the iWUE showed a highly significant (p < 0.01) relationship with temperature, presumably because a higher temperature accelerated CO2 assimilation and increased the vapor pressure deficit. Trees partially close stomata to reduce water loss [21], leading to increased δ13C and iWUE. The now-dead and dieback groups had 2.2-fold greater regression slopes than that of the non-dieback group, indicating that the former two groups were more sensitive to temperature changes. Another study on Mediterranean plants found that iWUE was weakly related or unrelated to temperature [19].
All three groups exhibited highly significant quadratic relationships between iWUE and BAI. In comparison, other studies reported positive [17] or negative [54] correlations between the two parameters. When the iWUE was low, BAI increased with iWUE, primarily because of faster photosynthesis rather than reduced stomatal conductance [29]. With a further increase in iWUE, the BAIs of all three groups started to decrease, producing similar peak points (Figure 9B). The inverse relationship between iWUE and BAI reflects a deteriorating environment [52]. The declining trend of BAI was attributable to two factors: (1) the adverse impact of increased temperature on cell growth and proliferation; and (2) insufficient power of increased iWUE to counteract that impact [17].

4.3. Early-Warning Signals of Drought-Induced Death

External stimuli can drive an ecosystem to shift abruptly between alternative states when certain critical transitions or tipping points are exceeded [49]. The critical transitions can be anticipated from preceding warning signals. Global warming and its associated prolonged severe droughts can lead to retardation of tree growth and, beyond tipping points, trigger death. Drought-induced tree death can be considered as a nonlinear change in tree vigor and growth that may occur years after the causative lethal stress has exerted its effect [55]. Other researchers have compared the growth rates of now-dead and non-dieback trees under drought; they observed that the two groups showed statistically significant differences in growth rates five years before the mortality of now-dead trees, and differences were already detectable 10 years before mortality. Therefore, retarded growth for 5–50 years may be considered as a reliable indicator of impending tree death [56]. In our study, the tree-ring width of the now-dead and dieback groups peaked in 1985, whereas that of the non-dieback group peaked in 1990. The BAI quantifies the long-term trend of tree vigor, and therefore, it is a better indicator of biomass changes than is tree-ring width. Early warning signals may potentially be identified from a BAI series, even after tree death. The BAI of the now-dead, dieback, and non-dieback groups peaked in 1994, 1997, and 2003, respectively. The now-dead and dieback groups had remarkably lower tree-ring width and BAI than did the non-dieback group from 17–26 years (1986–1995) preceding death, while the difference between now-dead and dieback trees was significant from 7–16 years (1996–2005) preceding death. This indicated that tree-ring width and BAI can potentially be used as an early warning signal of tree death. Bigler and Veblen [57] reported that subalpine conifers that died during drought had increased early growth rates and large sizes, but shorter longevities. Another study suggested that a high annual growth rate and an abrupt decline were associated with a high death rate [56]. A study linking repeat forest inventories and satellite remote sensing results also indicated the potential use satellite Normalized Difference Vegetation Index data as early warning signals of tree mortality [58].
Saurer et al. [59] compared the experimentally observed changes in δ13C and iWUE with predicted variations. They found that the stomatal conductance and photosynthesis of trees were affected by environmental factors, and that iWUE increased with increasing drought severity [19,60]. In a deteriorating environment, the iWUE of plants increased as a result of reduced stomatal conductance instead of accelerated photosynthesis [52]. In our study, the now-dead and dieback groups exhibited significantly higher iWUEs than those of the non-dieback group from 7 to 16 years (1996–2005) prior to death, and the difference between now-dead and dieback groups was significant from 0 to 6 years (2006–2012) prior to death. Furthermore, divergence of iWUE occurred later about 10 years later than the divergences of tree-ring width and BAI. Poplar tree death occurred about 16 years after the divergence and escalation of iWUE. These findings indicate that an abrupt escalation in iWUE can serve as a warning signal for acceleration of tree decline and drought-induced death in the TNSF shelterbelts of Zhangbei County. Similar research results showed the growth rate of Scots pine had already reduced to some extent already several decades earlier, while iWUE derived from δ13C values was higher [16], indicating a more conservative water-use strategy of now-dead trees compared with that of living trees.

5. Conclusions

Long-term drought may enhance tree decline and mortality. The large-scale decline of poplar trees in the TNSF Program has provided an opportunity to examine the effects of long-term drought on growth and iWUE prior to tree mortality. Our results showed that the DBH was inversely related to the severity of dieback. Among now-dead, dieback, and non-dieback trees, both tree-ring width and BAI showed quadratic relationships with age, with the now-dead and dieback trees reaching peaks earlier than the non-dieback group. The now-dead and dieback groups had significantly higher iWUEs than did the non-dieback trees, indicating a more conservative water-use strategy under drought stress than that of non-dieback trees, possibly at the cost of canopy defoliation and shoot dieback. The drought-affected poplar trees showed lower growth and long-term increases in iWUE prior to tree mortality. Therefore, tree-width, BAI, and iWUE can serve as early warning signals for drought-induced death.

Author Contributions

Conceptualization, S.S., J.Z. and P.M.; Data curation, L.Q., C.H. and C.L.; Formal analysis, S.S.; Funding acquisition, S.S. and P.M.; Investigation, S.S., L.Q. and C.H.; Methodology, S.S., L.Q., C.H. and C.L.; Project administration, S.S., J.Z. and P.M.; Writing—original draft, S.S., L.Q. and P.M.; Writing—review & editing, S.S. and P.M.

Funding

This research was funded by the National Natural Science Foundation of China (grant number: 31470705), the Special Fund for Forest Scientific Research in the Public Welfare (grant number: 201404206) and the Project of Co-Innovation Center for Sustainable Forestry in Southern China of Nanjing Forestry University.

Acknowledgments

The China Meteorological Data Service Center provided meteorological data. We thank Elaine Monaghan, Econ, and Jennifer Smith, from Liwen Bianji, Edanz Editing China (www.liwenbianji.cn/ac), for editing the English text of a draft of this manuscript. Finally, we acknowledge Hongyan Sun for reviewing and improving the manuscript.

Conflicts of Interest

The authors declare no conflict of interest.

References

  1. O’Brien, M.J.; Engelbrecht, B.M.J.; Joswig, J.; Pereyra, G.; Schuldt, B.; Jansen, S.; Kattge, J.; Landhäusser, S.M.; Levick, S.R.; Preisler, Y.; et al. A synthesis of tree functional traits related to drought-induced mortality in forests across climatic zones. J. Appl. Ecol. 2017, 54, 1669–1686. [Google Scholar] [CrossRef]
  2. Trumbore, S.; Brando, P.; Hartmann, H. Forest health and global change. Science 2015, 349, 814–818. [Google Scholar] [CrossRef] [PubMed]
  3. McDowell, N.; Pockman, W.T.; Allen, C.D.; Breshears, D.D.; Cobb, N.; Kolb, T.; Plaut, J.; Sperry, J.; West, A.; Williams, D.G. Mechanisms of plant survival and mortality during drought: Why do some plants survive while others succumb to drought? New Phytol. 2008, 178, 719–739. [Google Scholar] [CrossRef] [PubMed]
  4. Pangle, R.E.; Limousin, J.M.; Plaut, J.A.; Yepez, E.A.; Hudson, P.J.; Boutz, A.L.; Gehres, N.; Pockman, W.T.; McDowell, N.G. Prolonged experimental drought reduces plant hydraulic conductance and transpiration and increases mortality in a piñon-juniper woodland. Ecol. Evol. 2015, 5, 1618–1638. [Google Scholar] [CrossRef] [PubMed] [Green Version]
  5. Plaut, J.A.; Yepez, E.A.; Hill, J.; Pangle, R.; Sperry, J.S.; Pockman, W.T.; McDowell, N.G. Hydraulic limits preceding mortality in a piñon-juniper woodland under experimental drought. Plant Cell Environ. 2012, 35, 1601–1617. [Google Scholar] [CrossRef] [PubMed] [Green Version]
  6. Trifilò, P.; Casolo, V.; Raimondo, F.; Petrussa, E.; Boscutti, F.; Lo Gullo, M.A.; Nardini, A. Effects of prolonged drought on stem non-structural carbohydrates content and post-drought hydraulic recovery in Laurus nobilis L.: The possible link between carbon starvation and hydraulic failure. Plant Physiol. Biochem. 2017, 120, 232–241. [Google Scholar] [CrossRef] [PubMed]
  7. Colangelo, M.; Camarero, J.; Ripullone, F.; Gazol, A.; Sánchez-Salguero, R.; Oliva, J.; Redondo, M. Drought decreases growth and increases mortality of coexisting native and introduced tree species in a temperate floodplain Forest. Forests 2018, 9, 205. [Google Scholar] [CrossRef]
  8. McAvoy, T.; Régnière, J.; St-Amant, R.; Schneeberger, N.; Salom, S. Mortality and recovery of hemlock woolly adelgid (Adelges tsugae) in response to winter temperatures and predictions for the future. Forests 2017, 8, 497. [Google Scholar] [CrossRef]
  9. Grote, R.; Gessler, A.; Hommel, R.; Poschenrieder, W.; Priesack, E. Importance of tree height and social position for drought-related stress on tree growth and mortality. Trees 2016, 30, 1467–1482. [Google Scholar] [CrossRef]
  10. Bennett, A.C.; Mcdowell, N.G.; Allen, C.D.; Anderson-Teixeira, K.J. Larger trees suffer most during drought in forests worldwide. Nat. Plants 2015, 1, 15139. [Google Scholar] [CrossRef] [PubMed] [Green Version]
  11. Holzwarth, F.; Kahl, A.; Bauhus, J.; Wirth, C. Many ways to die—Partitioning tree mortality dynamics in a near-natural mixed deciduous forest. J. Ecol. 2013, 101, 220–230. [Google Scholar] [CrossRef]
  12. Cailleret, M.; Bigler, C.; Bugmann, H.; Camarero, J.J.; Cufar, K.; Davi, H.; Meszaros, I.; Minunno, F.; Peltoniemi, M.; Robert, E.M.; et al. Towards a common methodology for developing logistic tree mortality models based on ring-width data. Ecol. Appl. 2016, 26, 1827–1841. [Google Scholar] [CrossRef] [PubMed]
  13. Gentilesca, T.; Camarero, J.; Colangelo, M.; Nolè, A.; Ripullone, F. Drought-induced oak decline in the western Mediterranean region: An overview on current evidences, mechanisms and management options to improve forest resilience. iFor. Biogeosci. For. 2017, 10, 796–806. [Google Scholar] [CrossRef]
  14. Pellizzari, E.; Camarero, J.J.; Gazol, A.; Sangüesa-Barreda, G.; Carrer, M. Wood anatomy and carbon-isotope discrimination support long-term hydraulic deterioration as a major cause of drought-induced dieback. Glob. Chang. Biol. 2016, 22, 2125–2137. [Google Scholar] [CrossRef] [PubMed]
  15. Lévesque, M.; Siegwolf, R.; Saurer, M.; Eilmann, B.; Rigling, A. Increased water-use efficiency does not lead to enhanced tree growth under xeric and mesic conditions. New Phytol. 2014, 203, 94–109. [Google Scholar] [CrossRef] [PubMed] [Green Version]
  16. Timofeeva, G.; Treydte, K.; Bugmann, H.; Rigling, A.; Schaub, M.; Siegwolf, R.; Saurer, M. Long-term effects of drought on tree-ring growth and carbon isotope variability in Scots pine in a dry environment. Tree Physiol. 2017, 37, 1028–1041. [Google Scholar] [CrossRef] [PubMed]
  17. Urrutia-Jalabert, R.; Malhi, Y.; Barichivich, J.; Lara, A.; Delgado-Huertas, A.; Rodríguez, C.G.; Cuq, E. Increased water use efficiency but contrasting tree growth patterns in Fitzroya cupressoides forests of southern Chile during recent decades. J. Geophys. Res. Biogeosci. 2015, 120, 2505–2524. [Google Scholar] [CrossRef]
  18. Wang, W.; Liu, X.; An, W.; Xu, G.; Zeng, X. Increased intrinsic water-use efficiency during a period with persistent decreased tree radial growth in northwestern China: Causes and implications. For. Ecol. Manag. 2012, 275, 14–22. [Google Scholar] [CrossRef]
  19. Battipaglia, G.; de Micco, V.; Brand, W.A.; Saurer, M.; Aronne, G.; Linke, P.; Cherubini, P. Drought impact on water use efficiency and intra-annual density fluctuations in Erica arborea on Elba (Italy). Plant Cell Environ. 2014, 37, 382–391. [Google Scholar] [CrossRef] [PubMed]
  20. Linares, J.C.; Camarero, J.J. From pattern to process: Linking intrinsic water-use efficiency to drought-induced forest decline. Glob. Chang. Biol. 2012, 18, 1000–1015. [Google Scholar] [CrossRef]
  21. Hartmann, H.; Moura, C.F.; Anderegg, W.R.L.; Ruehr, N.K.; Salmon, Y.; Allen, C.D.; Arndt, S.K.; Breshears, D.D.; Davi, H.; Galbraith, D.; et al. Research frontiers for improving our understanding of drought-induced tree and forest mortality. New Phytol. 2018, 218, 15–28. [Google Scholar] [CrossRef] [PubMed] [Green Version]
  22. Nock, C.A.; Baker, P.J.; Wanek, W.; Leis, A.; Grabner, M.; Bunyavejchewin, S.; Hietz, P. Long-term increases in intrinsic water-use efficiency do not lead to increased stem growth in a tropical monsoon forest in western Thailand. Glob. Chang. Biol. 2011, 17, 1049–1063. [Google Scholar] [CrossRef]
  23. Zhang, X.; Liu, X.; Zhang, Q.; Zeng, X.; Xu, G.; Wu, G.; Wang, W. Species-specific tree growth and intrinsic water-use efficiency of Dahurian larch (Larix gmelinii) and Mongolian pine (Pinus sylvestris var. mongolica) growing in a boreal permafrost region of the Greater Hinggan Mountains, Northeastern China. Agric. For. Meteorol. 2018, 248, 145–155. [Google Scholar] [CrossRef]
  24. Colangelo, M.; Camarero, J.J.; Battipaglia, G.; Borghetti, M.; de Micco, V.; Gentilesca, T.; Ripullone, F. A multi-proxy assessment of dieback causes in a Mediterranean oak species. Tree Physiol. 2017, 37, 617–631. [Google Scholar] [CrossRef] [PubMed]
  25. Petrucco, L.; Nardini, A.; von Arx, G.; Saurer, M.; Cherubini, P. Isotope signals and anatomical features in tree rings suggest a role for hydraulic strategies in diffuse drought-induced die-back of Pinus nigra. Tree Physiol. 2017, 37, 523–535. [Google Scholar] [PubMed]
  26. Sun, S.; He, C.; Qiu, L.; Li, C.; Zhang, J.; Meng, P. Stable isotope analysis reveals prolonged drought stress in poplar plantation mortality of the Three-North Shelter Forest in Northern China. Agric. For. Meteorol. 2018, 252, 39–48. [Google Scholar] [CrossRef]
  27. Colangelo, M.; Camarero, J.J.; Borghetti, M.; Gazol, A.; Gentilesca, T.; Ripullone, F. Size Matters a Lot: Drought-affected Italian oaks are smaller and show lower growth prior to tree death. Front. Plant Sci. 2017, 8, 135. [Google Scholar] [CrossRef] [PubMed]
  28. Hoffmann, W.A.; Marchin, R.M.; Abit, P.; Lau, O.L. Hydraulic failure and tree dieback are associated with high wood density in a temperate forest under extreme drought. Glob. Chang. Biol. 2011, 17, 2731–2742. [Google Scholar] [CrossRef]
  29. Silva, L.C.; Anand, M.; Leithead, M.D. Recent widespread tree growth decline despite increasing atmospheric CO2. PLoS ONE 2010, 5, e11543. [Google Scholar] [CrossRef] [PubMed]
  30. Schleser, G.H.; Anhuf, D.; Helle, G.; Vos, H. A remarkable relationship of the stable carbon isotopic compositions of wood and cellulose in tree-rings of the tropical species Cariniana micrantha (Ducke) from Brazil. Chem. Geol. 2015, 401, 59–66. [Google Scholar] [CrossRef] [Green Version]
  31. McCarroll, D.; Loader, N.J. Stable isotopes in tree rings. Quat. Sci. Rev. 2004, 23, 771–801. [Google Scholar] [CrossRef] [Green Version]
  32. Gagen, M.; Finsinger, W.; Wagner-Cremer, F.; McCarroll, D.; Loader, N.J.; Robertson, I.; Jalkanen, R.; Young, G.; Kirchhefer, A. Evidence of changing intrinsic water-use efficiency under rising atmospheric CO2 concentrations in Boreal Fennoscandia from subfossil leaves and tree ring δ13C ratios. Glob. Chang. Biol. 2011, 17, 1064–1072. [Google Scholar] [CrossRef]
  33. Farquhar, G.D.; O’Leary, M.H.; Berry, J.A. On the relationship between carbon isotope discrimination and the intercellular carbon dioxide concentration in leaves. Funct. Plant Biol. 1982, 9, 121–137. [Google Scholar] [CrossRef]
  34. Farquhar, G.; Richards, R. Isotopic composition of plant carbon correlates with water-use efficiency of wheat genotypes. Funct. Plant Biol. 1984, 11, 539–552. [Google Scholar] [CrossRef]
  35. Allen, R.G.; Pereira, L.S.; Raes, D.; Smith, M. Crop evapotranspiration-guidelines for computing crop water requirements-FAO Irrigation and drainage paper 56. FAO Rome 1998, 300, D05109. [Google Scholar]
  36. Greenwood, S.; Ruiz-Benito, P.; Martínez-Vilalta, J.; Lloret, F.; Kitzberger, T.; Allen, C.D.; Fensham, R.; Laughlin, D.C.; Kattge, J.; Bönisch, G.; et al. Tree mortality across biomes is promoted by drought intensity, lower wood density and higher specific leaf area. Ecol. Lett. 2017, 20, 539–553. [Google Scholar] [CrossRef] [PubMed] [Green Version]
  37. Navarro-Cerrillo, R.; Rodriguez-Vallejo, C.; Silveiro, E.; Hortal, A.; Palacios-Rodríguez, G.; Duque-Lazo, J.; Camarero, J. Cumulative drought stress leads to a loss of growth resilience and explains higher mortality in planted than in naturally regenerated Pinus pinaster stands. Forests 2018, 9, 358. [Google Scholar] [CrossRef]
  38. Delucia, E.H.; Maherali, H.; Carey, E.V. Climate-driven changes in biomass allocation in pines. Glob. Chang. Biol. 2000, 6, 587–593. [Google Scholar] [CrossRef]
  39. Luo, Y.; Su, B.; Currie, W.S.; Dukes, J.S.; Finzi, A.; Hartwig, U.; Hungate, B.; McMurtrie, R.E.; Oren, R.; Parton, W.J.; et al. Progressive nitrogen limitation of ecosystem responses to rising atmospheric carbon dioxide. BioScience 2004, 54, 731–739. [Google Scholar] [CrossRef]
  40. Jump, A.S.; Ruiz-Benito, P.; Greenwood, S.; Allen, C.D.; Kitzberger, T.; Fensham, R.; Martínez-Vilalta, J.; Lloret, F. Structural overshoot of tree growth with climate variability and the global spectrum of drought-induced forest dieback. Glob. Chang. Biol. 2017, 23, 3742–3757. [Google Scholar] [CrossRef] [PubMed] [Green Version]
  41. Galiano, L.; Martínez-Vilalta, J.; Lloret, F. Carbon reserves and canopy defoliation determine the recovery of Scots pine 4 yr after a drought episode. New Phytol. 2011, 190, 750–759. [Google Scholar] [CrossRef] [PubMed] [Green Version]
  42. Cailleret, M.; Jansen, S.; Robert, E.M.R.; Desoto, L.; Aakala, T.; Antos, J.A.; Beikircher, B.; Bigler, C.; Bugmann, H.; Caccianiga, M.; et al. A synthesis of radial growth patterns preceding tree mortality. Glob. Chang. Biol. 2017, 23, 1675–1690. [Google Scholar] [CrossRef] [PubMed]
  43. Chen, H.; Fu, S.; Monserud, R.; Gillies, I. Relative size and stand age determine Pinus banksiana mortality. For. Ecol. Manag. 2008, 255, 3980–3984. [Google Scholar] [CrossRef]
  44. Juday, G.P.; Alix, C.; Grant, T.A. Spatial coherence and change of opposite white spruce temperature sensitivities on floodplains in Alaska confirms early-stage boreal biome shift. For. Ecol. Manag. 2015, 350, 46–61. [Google Scholar] [CrossRef]
  45. Niu, S.; Luo, Y.; Li, D.; Cao, S.; Xia, J.; Li, J.; Smith, M.D. Plant growth and mortality under climatic extremes: An overview. Environ. Exp. Bot. 2014, 98, 13–19. [Google Scholar] [CrossRef]
  46. Churakova, O.; Lehmann, M.; Saurer, M.; Fonti, M.; Siegwolf, R.; Bigler, C. Compound-specific carbon isotopes and concentrations of carbohydrates and organic acids as indicators of tree decline in mountain pine. Forests 2018, 9, 363. [Google Scholar] [CrossRef]
  47. Nardini, A.; Casolo, V.; Dal Borgo, A.; Savi, T.; Stenni, B.; Bertoncin, P.; Zini, L.; McDowell, N.G. Rooting depth, water relations and non-structural carbohydrate dynamics in three woody angiosperms differentially affected by an extreme summer drought. Plant Cell Environ. 2016, 39, 618–627. [Google Scholar] [CrossRef] [PubMed]
  48. Gao, S.; Liu, R.; Zhou, T.; Fang, W.; Yi, C.; Lu, R.; Zhao, X.; Luo, H. Dynamic responses of tree-ring growth to multiple dimensions of drought. Glob. Chang. Biol. 2018, 1–12. [Google Scholar] [CrossRef] [PubMed]
  49. Camarero, J.J.; Gazol, A.; Sangüesa-Barreda, G.; Oliva, J.; Vicente-Serrano, S.M. To die or not to die: Early warnings of tree dieback in response to a severe drought. J. Ecol. 2015, 103, 44–57. [Google Scholar] [CrossRef]
  50. McDowell, N.; Allen, C.D.; Marshall, L. Growth, carbon-isotope discrimination, and drought-associated mortality across a Pinus ponderosa elevational transect. Glob. Chang. Biol. 2010, 16, 399–415. [Google Scholar] [CrossRef]
  51. Martin-Benito, D.; Anchukaitis, K.; Evans, M.; del Río, M.; Beeckman, H.; Cañellas, I. Effects of drought on xylem anatomy and water-use efficiency of two co-occurring pine species. Forests 2017, 8, 332. [Google Scholar] [CrossRef]
  52. Lévesque, M.; Rigling, A.; Bugmann, H.; Weber, P.; Brang, P. Growth response of five co-occurring conifers to drought across a wide climatic gradient in Central Europe. Agric. For. Meteorol. 2014, 197, 1–12. [Google Scholar] [CrossRef]
  53. Rezaie, N.; D’Andrea, E.; Bräuning, A.; Matteucci, G.; Bombi, P.; Lauteri, M. Do atmospheric CO2 concentration increase, climate and forest management affect iWUE of common beech? Evidences from carbon isotope analyses in tree rings. Tree Physiol. 2018. [Google Scholar] [CrossRef] [PubMed]
  54. Silva, L.C.R.; Anand, M. Probing for the influence of atmospheric CO2 and climate change on forest ecosystems across biomes. Glob. Ecol. Biogeogr. 2013, 22, 83–92. [Google Scholar] [CrossRef]
  55. Huang, M.; Wang, X.; Keenan, T.F.; Piao, S. Drought timing influences the legacy of tree growth recovery. Glob. Chang. Biol. 2018, 24, 3546–3559. [Google Scholar] [CrossRef] [PubMed]
  56. Das, A.J.; Battles, J.J.; Stephenson, N.L.; van Mantgem, P.J. The relationship between tree growth patterns and likelihood of mortality: A study of two tree species in the Sierra Nevada. Can. J. For. Res. 2007, 37, 580–597. [Google Scholar] [CrossRef]
  57. Bigler, C.; Veblen, T.T. Increased early growth rates decrease longevities of conifers in subalpine forests. Oikos 2009, 118, 1130–1138. [Google Scholar] [CrossRef]
  58. Rogers, B.M.; Solvik, K.; Hogg, E.H.; Ju, J.; Masek, J.G.; Michaelian, M.; Berner, L.T.; Goetz, S.J. Detecting early warning signals of tree mortality in boreal North America using multiscale satellite data. Glob. Chang. Biol. 2018, 24, 2284–2304. [Google Scholar] [CrossRef] [PubMed]
  59. Saurer, M.; Siegwolf, R.T.W.; Schweingruber, F.H. Carbon isotope discrimination indicates improving water-use efficiency of trees in northern Eurasia over the last 100 years. Glob. Chang. Biol. 2004, 10, 2109–2120. [Google Scholar] [CrossRef]
  60. Sangüesa-Barreda, G.; Linares, J.C.; Julio Camarero, J. Drought and mistletoe reduce growth and water-use efficiency of Scots pine. For. Ecol. Manag. 2013, 296, 64–73. [Google Scholar] [CrossRef] [Green Version]
Figure 1. Location of Three-North Shelter Forest and experimental sites in Zhangbei County, Hebei Province, China. Red dots: sampling sites for analysis of relationship between poplar growth and dieback. Triangles: sampling sites for analysis of tree rings and carbon isotopes. Red star: County town.
Forests 09 00564 g001
Figure 2. Variations in mean precipitation (A), temperature (B), relative humidity (C), potential evapotranspiration (ET0) (D), and water balance (ET0-P) (E) at a monthly timescale from 1976 to 2016. Also shown are variations in precipitation (F), temperature (G), relative humidity (H), ET0 (I), and ET0-P (J) during poplar tree growth.
Forests 09 00564 g002
Figure 3. Changes in groundwater depth from 1995 to 2016.
Forests 09 00564 g003
Figure 4. Relationship between diameter at breast height and dieback rate.
Forests 09 00564 g004
Figure 5. Differences in tree-ring width (A,B) and basal area increment (C,D) among now-dead (N-D), dieback (DB) and non-dieback (N-DB) poplar trees at different growth times. Lower case letters indicate significant differences (p < 0.05).
Forests 09 00564 g005
Figure 6. Difference in δ13Ccor (A,B) and carbon isotope discrimination ∆13C (C,D) among now-dead (N-D), dieback (DB), and non-dieback (N-DB) poplar trees at different growth times. Lower case letters indicate significant differences (p < 0.05).
Forests 09 00564 g006
Figure 7. Difference in intrinsic water-use efficiency (A,B) among now-dead (N-D), dieback (DB), and non-dieback (N-DB) poplar trees at different growth times. Lower case letters indicate significant differences (p < 0.05).
Forests 09 00564 g007
Figure 8. Relationships between tree-ring parameters (tree-ring width; BAI, iWUE) and monthly climatic factors for non-dieback (filled bar), dieback (grey bar), and now-dead (empty bar) tree groups in growth season (May–September). Months abbreviated in uppercase letters correspond to years during tree-ring formation. Dashed lines represent threshold values for statistical significance (p < 0.05). Asterisks (*) indicate significant correlation at p < 0.01.
Forests 09 00564 g008
Figure 9. Differences in tree-ring width (A) and basal area increments (B) in relation to intrinsic water-use efficiency among now-dead (N-D), dieback (DB), and non-dieback (N-DB) poplar tree groups.
Forests 09 00564 g009

