Projected Future Distribution of Tsuga canadensis across Alternative Climate Scenarios in Maine, U.S


1
Unity College, School of Environmental Citizenship, 90 Quaker Hill Rd., Unity, ME 04988, USA
2
School of Forest Resources, University of Maine, 201 Nutting Hall, Orono, ME 04469, USA
3
The Woods Hole Research Center, 149 Woods Hole Rd., Falmouth, MA 02540, USA
*
Author to whom correspondence should be addressed.
Forests 2017, 8(8), 285; https://doi.org/10.3390/f8080285
Submission received: 2 June 2017
/
Revised: 4 August 2017
/
Accepted: 4 August 2017
/
Published: 6 August 2017
Abstract
:Climate change is having an impact on forest ecosystems around the world and is expected to alter the suitable habitat of individual tree species. Forest managers require resources about potential impacts of climate change at the regional scale to aid in climate mitigation efforts. By understanding the geographic distribution of changes in suitable habitat, migration corridors can be identified for conservation and active management. With the increased availability of climate projection data, ancillary Geographic Information Systems data, and field observations, modeling efforts at the regional scale are now possible. Here, we modeled and mapped the continuous distribution of Tsuga canadensis throughout the state of Maine at the regional scale(30 m) with high precision (89% of pixels had a coefficient of variation ≤ 4.0%). The random forest algorithm was used to create a strong prediction of suitable habitat for the years 2050 and 2100 from both high and low emission climate projections. The results clearly suggest a significant gain in suitable habitat for Tsuga canadensis range with a general northwest expansion.
1. Introduction
Climate change has the potential to be an influential driver of future changes in forest structure and species composition. In the Northeastern United States, mean annual temperatures have increased by 0.8 °C over the last century, with estimates that warming will continue to increase from 2.1 to 5.3 °C by 2100 [1]. Climate change will likely alter changes in biogeochemical cycling, resulting in potentially dramatic changes in net primary productivity and forest composition [2,3]. Climate change-driven shifts in species geographic ranges are expected, and latitudinal migrations of tree species have been documented recently [4]. These climate-driven alterations will be coupled with the effects of other disturbances such as forest pests and pathogens, forest management practices such as timber harvesting, and habitat fragmentation. Consequently, it is important to understand the geographic distribution of suitable habitat for tree species and possible migration corridors to inform forest management strategies to mitigate the effects of climate change and help to ensure regeneration success.
Foundational tree species that exhibit old-growth characteristics are of particular interest because of their high biomass and contributions to stand structure [5]. Tsuga canadensis is considered a foundational tree species as a late-successional conifer that shapes stand microclimate and influences community and ecosystem characteristics. Its deep shade and acidic litter affects vegetation organization, successional dynamics, species diversity, and microenvironmental characteristics [6]. Tsuga canadensis-dominated forests represent unique characteristics that serve as critical wildlife habitat in the northeast [7]. Tsuga canadensis can persist for long periods in light limited conditions, but established trees will still take advantage of gaps in the forest canopy due to disturbance. Tsuga canadensis has historically been a common component in forests in the eastern U.S. although recently the species has been experiencing a decline due to Adelges tsugae (hemlock woolly adelgid, HWA)—an invasive, aphid-like pest introduced to the United States from Asia [8]. HWA can be found in 15 states along the eastern seaboard from Georgia to Maine [9].Albani et al. [10] predict that HWA will continue to move northward and will be established throughout Tsuga canadensis’ range in Maine over the next 30 years.
Tree species distribution models look at site characteristics that are essential components of their current habitat and then project where these characteristics are likely to occur in the future. Suitable habitat and tree species distributions have recently been produced for the U.S. at varying resolutions [11,12,13], often at landscape scale, for example, Iverson’s [13] tree atlas has a resolution of 20 km. Forest management often takes place at the regional scale (i.e., 30 m) and forest managers, although they have been increasingly able to incorporate climate change considerations into their decision making, require practical ways in which to implement modeling results [14]. Many of these modeling efforts are made possible by the accessibility of spatial datasets, including field data as well as products derived from remote sensing that describe ecological and climatic conditions.
For example, the U.S. Forest Service Forest Inventory and Analysis National database consists of long-term forest monitoring research plots established through stratified systematic sampling across public and private lands [1]. These data are available to researchers and include information on tree species composition and structure.
Representative Concentration Pathways (RCP) 4.5 scenario was developed by the Global Change Assessment Model (GCAM) modeling team at the Pacific Northwest National Laboratory’s Joint Global Change Research Institute (JGCRI) in the United States. This is a stabilization scenario where radiative forcing does not exceed 4.5 watts-m2 by the year 2100. The RCP 8.5 scenario models the highest greenhouse gas (GHG) emission. It was developed using the MESSAGE model and the IIASA Integrated Assessment Framework by the International Institute for Applied Systems Analysis, Austria [15].
From these different scenarios, it is possible to create geographically referenced grids containing forecasted temperature and precipitation values at coarse spatial scales—e.g., 12 km. Finer-scale environmental variables shown to directly affect the distribution of forest tree species can be used to scale-down these coarse predictions to higher resolution (800 m) data for regional climate change assessments [16]. For example, NASA’s Earth Exchange (NEX) Global Daily Downscaled Projections (GDDP) depict maximum and minimum air temperature and precipitation that represent conditions in the 21st century (2006–2099) under two different RCPs, RCP 4.5 (low carbon emission) and RCP 8.5 (high carbon emission). These two different climate change scenarios were used in this modeling effort in order to capture the full range of what emissions level may be in the future. These projections suggest that Maine will experience a significant increase in air temperature under both scenarios, lengthening the growing season in Maine by one to two days per decade [17]. Forecasted changes in tree species composition in the eastern U.S. note a pronounced affect in the northern regions [12]. This previous work also point out the need for high resolution modeling of climate variables along with contributing environmental gradients that definespecies habitat.
This work describes an approach to modeling suitable habitat for Tsuga canadensis under two different climate scenarios: RCP 4.5, and RCP 8.5 and two time steps (mid-century, century) at high resolution (30 m). The models used in this research rely on model calibrations described in earlier work by Dunckel et al. [18], where we predicted the current distribution (as a percent of total stand basal area) of Tsuga canadensis in Maine using over 3000 field reference plots and 11 predictor variables derived from satellite imagery and ancillary GIS data with an overall prediction accuracy of 83%. Climate variables, particularly average yearly maximum and minimum temperatures, were found to be positively correlated with hemlock occurrence. As a result, the geographic extent of future shifts in the range of Tsuga canadensis was modeled using forecasted values for temperature and precipitation obtained through climate models under various climate scenarios. The specific research objectives of this work were to: (1) map the future distribution of Tsuga canadensis habitat at high resolution (30 m); (2) identify critical threshold values that determine Tsuga canadensis suitable habitat; and (3) identify potential migration corridors for conservation efforts. Given the increased temperature and precipitation, suitable habitat for Tsuga canadensis was expected to increase in all climate scenarios examined.
2. Materials and Methods
2.1. Study Area
The state of Maine (~86,156 km2) is located in the northeast corner of the New England region of the U.S. It is bordered by the Canadian provinces of Quebec and New Brunswick, the Atlantic Ocean, and by New Hampshire (Figure 1; 42°58′ N to 47°28′ N and 66°57′ W to 71°5′ W). Maine is nearly 90% forested and dominated by mixed northern hardwood stands comprised of over 62 tree species. The most prevalent of these species being Abies balsamea (L.) Mill; Acer ruburm (L.); Acer saccharum (Marshall); Picea rubens (Sarg.); Picea glauca (Moench) Voss; Picea Mariana (Mill.) Britton, Sterns and Poggenburg; Betula alleghaniensis (Britt.); and Fagus grandifolia (Ehrh.). Maine forests, sometimes referred to as the “Acadian Forest”, are bordered by boreal forests to the north and central hardwood forests to the south.
2.2. Model Calibrations
Model calibrations were conducted using the predictive model described in Dunckel et al. [18], which used over 3000 field reference plots and 11 predictor variables to predict and map Tsuga canadensis distribution throughout Maine, U.S. at 30 m resolution (Figure 1). The reference plots were largely (n = 2607) provided by the United States Forest Service (USFS), Federal Inventory and Analysis (FIA) program. Each plot consists of four 1/24 acre (0.02 ha) fixed-radius (24.0 foot, 7.3 m) subplots. Field data are collected at the plot-level and include forest type, tree species, tree diameter at breast height (dbh), tree height, and condition (for more information on the FIA program and a complete list of data collected please visit: www.fia.fs.fed.us).
The predictor variables can be organized into five broad categories: climate, elevation, satellite imagery, biomass, and soils. Climate variables including average annual precipitation, average annual maximum temperature, and average annual minimum temperature estimated by the Oregon State University’s PRISM Climate Group [19]. These data represent 30-year normal estimates for 1981–2010 in raster data (grid) at a resolution of ~800 m. Although these data are at a much coarser scale than the other eight predictors (10–30 m), it was decided to make predictions at 30 m resolution reasoning that climate variables do not vary drastically at finer scales. Climate variables (i.e., temperature, precipitation) were consistently among the most important predictors for Tsuga canadensis (R2 = 0.47) and these were the only variables changed in the future scenarios, while the other predictor variables remained constant. This approach was used to limit range shifts and ensure realistic predictions [11].
2.3. Data Processing
NASA’s downscaled forecasted climate variables were processed as netCDF files using ArcGIS Version 10.3.1 (Environmental Research Systems Institute (ERSI), Redlands, CA, USA). The netCDF data format contains space/time, or four-dimensional, information and each netCDF file contain 12 layers, one for each month. The open-source Python programming language was used to facilitate the reduction of both precipitation and temperature spatial values in the time dimension. Two custom scripts utilizing Esri’s Arcpy Python module were written to bin precipitation values monthly and temperature values yearly throughout the time series [20]. The downscaled NASA climate variables are comparable with the climate data used to calibrate the models in that they exist at the same spatial resolution and we were able to calculate 30-year normal averages to match historical PRISM data.
Two thousand random points were generated across the State of Maine using ArcGIS V 10.3.1. These points were used to extract corresponding values for temperature, precipitation, and Tsuga canadensis basal area. This way we were able to compare the four model outputs with the climate variables and establish threshold values to guide the selection of migration corridors.
2.4. Model Processing
Multivariate tree-based regression models have evolved with improved accuracy in predicting forest structural attributes [21]. The random forest algorithm, first introduced by Brieman [22], draws a bootstrap sample Z of size N from the training data set (with replacement) so that each tree is constructed with a random subset of the data. This process reduces prediction variance of trees, decreases bias (if the trees are sufficiently deep) and increases accuracy through decreased correlation. For this analysis, the ‘randomForest’ package [23] in the freeware statistical program R Version 3.1.3 (R Development Core Team, Vienna, Austria) [24] was used to predict future Tsuga canadensis future distribution. Maps were produced using the ‘modelMap’ package [25] in R Version 3.1.3 [24], depicting the distribution of Tsuga canadensis at 30 m resolution under two different climate scenarios and two different 30-year increments (Figure 2).
2.5. Migration Corridor
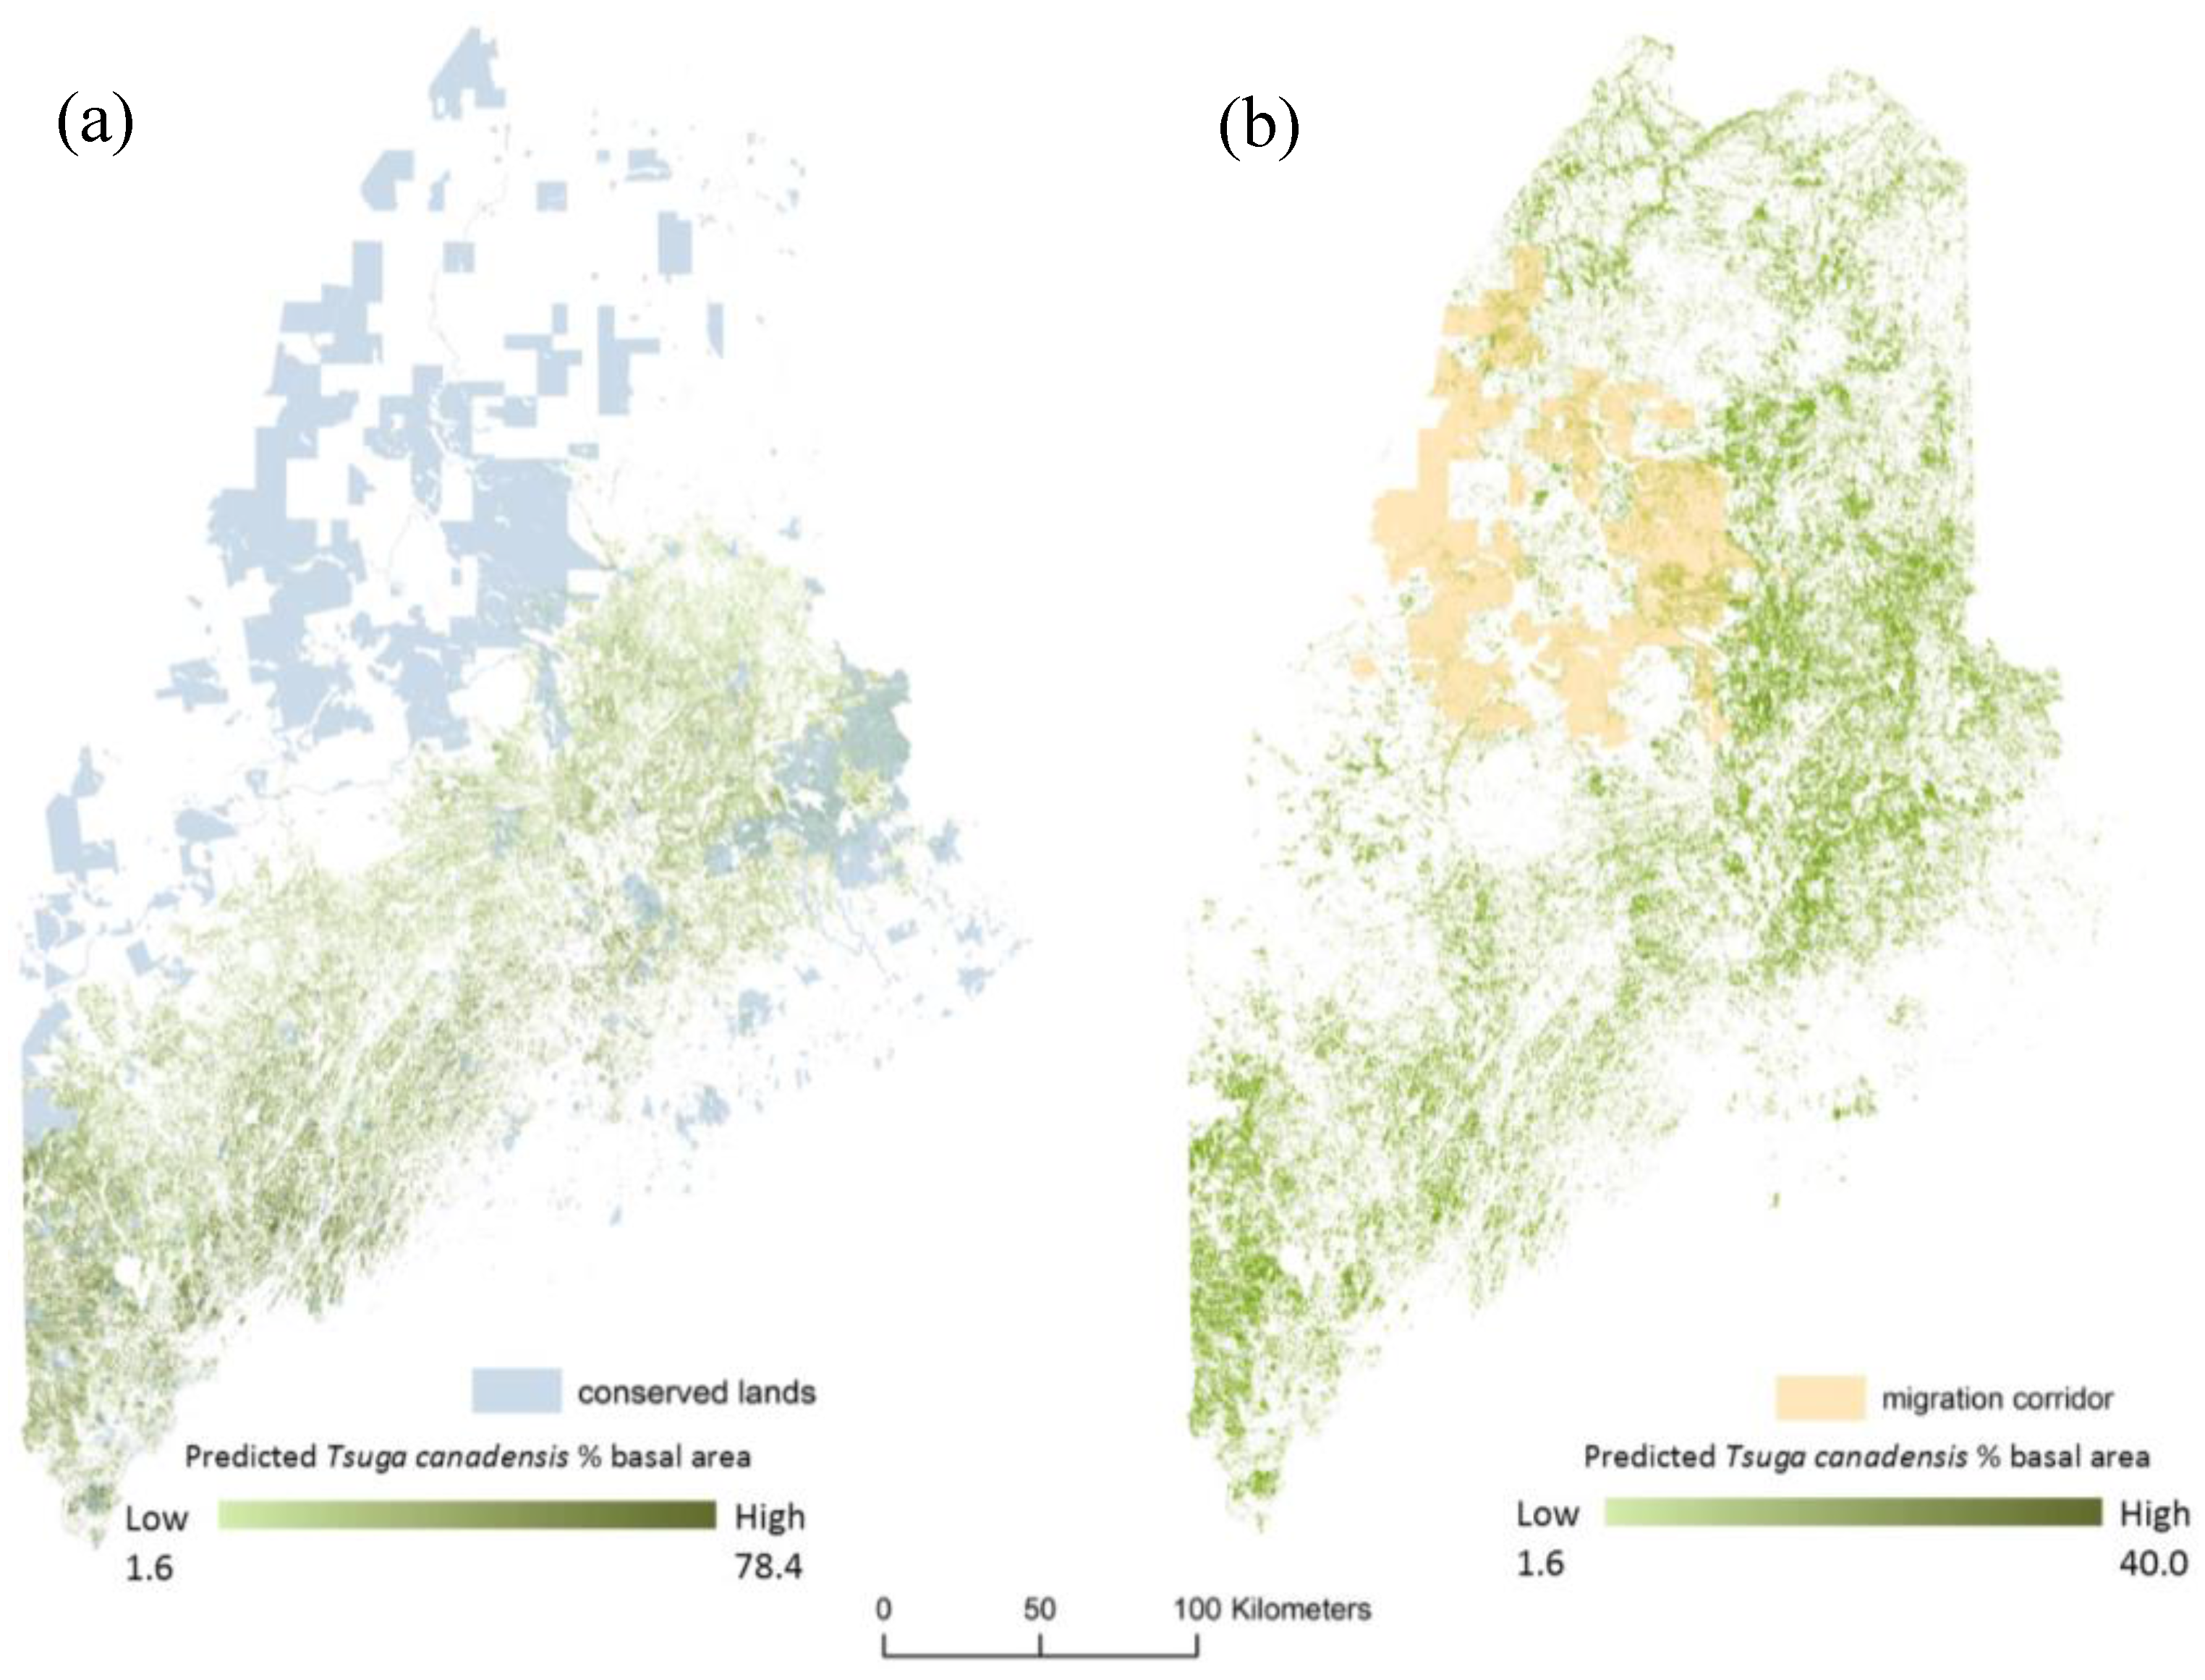
In our pursuit to provide practical decision-making tools, we identified forest management migration corridors by finding the spatial coincidence of currently conserved lands, climate threshold values, and future suitable habitat. To identify the most suitable corridors, we only included pixels with an estimated Tsuga canadensis relative basal area of ≥16%. The model using RCP 8.5 for the year 2050 was used in the corridor assessment since this year provides management relevance and RCP 8.5 more closely matches current emission trends [11]. The conserved lands data layer reflects Maine land in federal, state, municipal and non-profit ownership with easements, obtained from Maine GIS data catalog [26].
2.6. Validation
Although traditional forms of model and map validity (i.e., reserving a subset of field data to calculate residuals) are not available when working with future estimates, it is possible to create uncertainty maps based on model predictions [27]. The random forest model uses the mean of all trees to predict a continuous variable, these individual tree predictions can be used to calculate the mean, standard deviation and the coefficient of variation (i.e., the standard deviations divided by the mean) within each pixel as a measure of uncertainty [25]. We used the coefficient of variation as a measure of map uncertainty for RCP 8.5 in the year 2050 to provide a helpful assessment for forest managers. Mapping the coefficient of variation can provide a better visualization of spatial regions of higher uncertainty [25].
3. Results
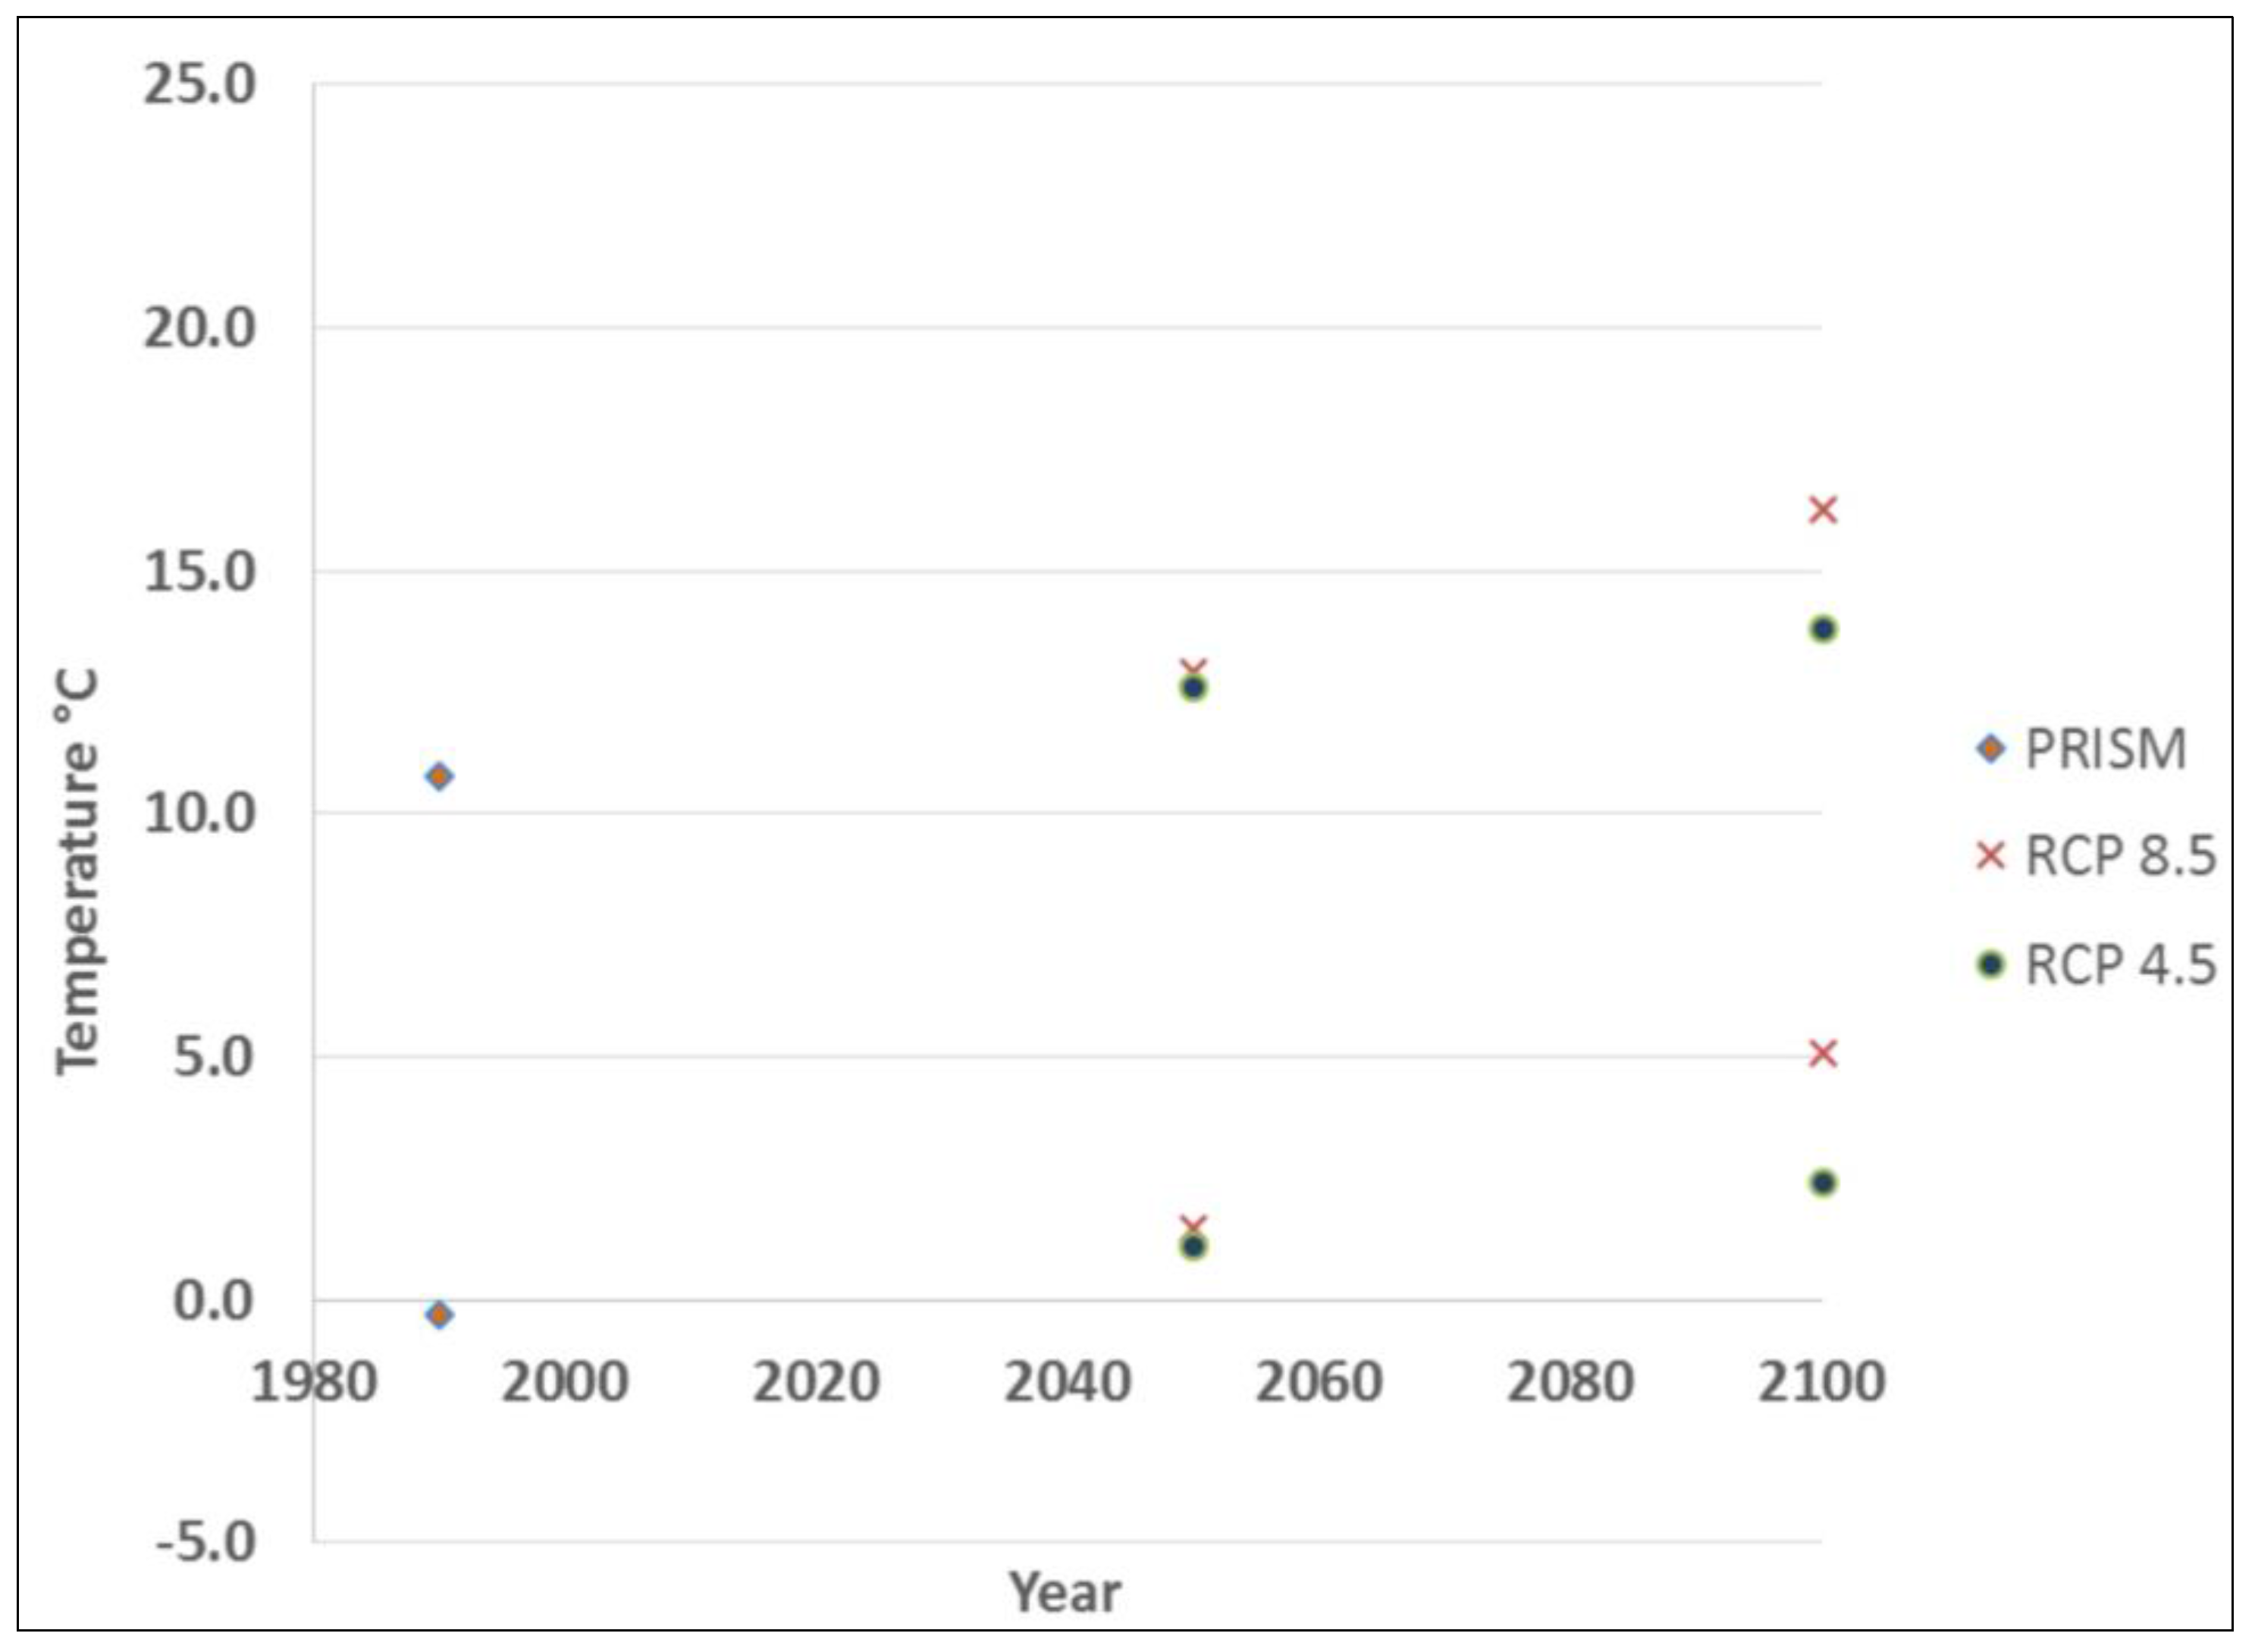
Based on the current predictive model [18], Tsuga canadensis occupies a 241 km band running southwest to northeast along the coast, with little-to-no occurrence beyond this belt (Figure 1). Tsuga canadensis-dominated stands appeared predominantly in the southern region of the state. The historic climate data used to calibrate the Tsuga canadensis predictive model had a mean (30-year normal) maximum and minimum temperature of 10.8 °C and −0.3 °C, respectively, leading up to the year 1990. The projected mid-century mean (30-year normal) maximum and minimum temperature under RCP 4.5 was 12.6 °C and 1.1 °C, respectively, increasing by the end of the century to 12.9 °C and 1.5 °C (Figure 3). The projected mid-century mean (30-year normal) maximum and minimum temperatures under RCP 8.5 were 12.9 °C and 1.5 °C, respectively, increasing by the end of the century to 16.2 °C and 5.1 °C (Figure 3).
Precipitation estimates follow this same trend, with an historic mean annual (30-year normal) value of 1155 mm in 1990 (Figure 3). The projected mid-century mean precipitation under RCP 4.5 was 1160 mm, increasing by the end of the century to 1199 mm. The projected mean precipitation under RCP 8.5 was 1172 mm, increasing by the end of the century to 1260 mm, which represents the greatest change in a 30-year period considered in this analysis (Figure 4).
With an increase in mean maximum temperature by mid-century of 1.8 °C (RCP 4.5), our model predicts an increase of ~38% in suitable habitat for Tsuga canadensis in Maine (Figure 5). The predicted range shifts from a maximum latitude of 45.900° to the northern most limits of Maine at 47.400°—a distance of 170 km. The distribution appears somewhat uniform with little changes in suitable habitat after 2050 under RCP 4.5 or RCP 8.5 (Figure 5).
Unsuitable habitat (not present) for Tsuga canadensis drops to only 2 km under RCP 4.5. According to the model results, the area currently absent of Tsuga canadensis (64,319 km2) will be suitable habitat for the species by 2050. Tsuga canadensis dominated areas are projected to decrease steadily over time and with increasing temperatures (Table 1). The low levels of Tsuga Canadensis (1–15% basal area) increase significantly under both RCP 4.5 and RCP 8.5 by 2050 while more dense stands (16–30% and >30% basal area) are predicted to see greatest gains in suitable habitat under RCP 4.5 by 2050 and lesser gains over time and under RCP 8.5 (Table 1).
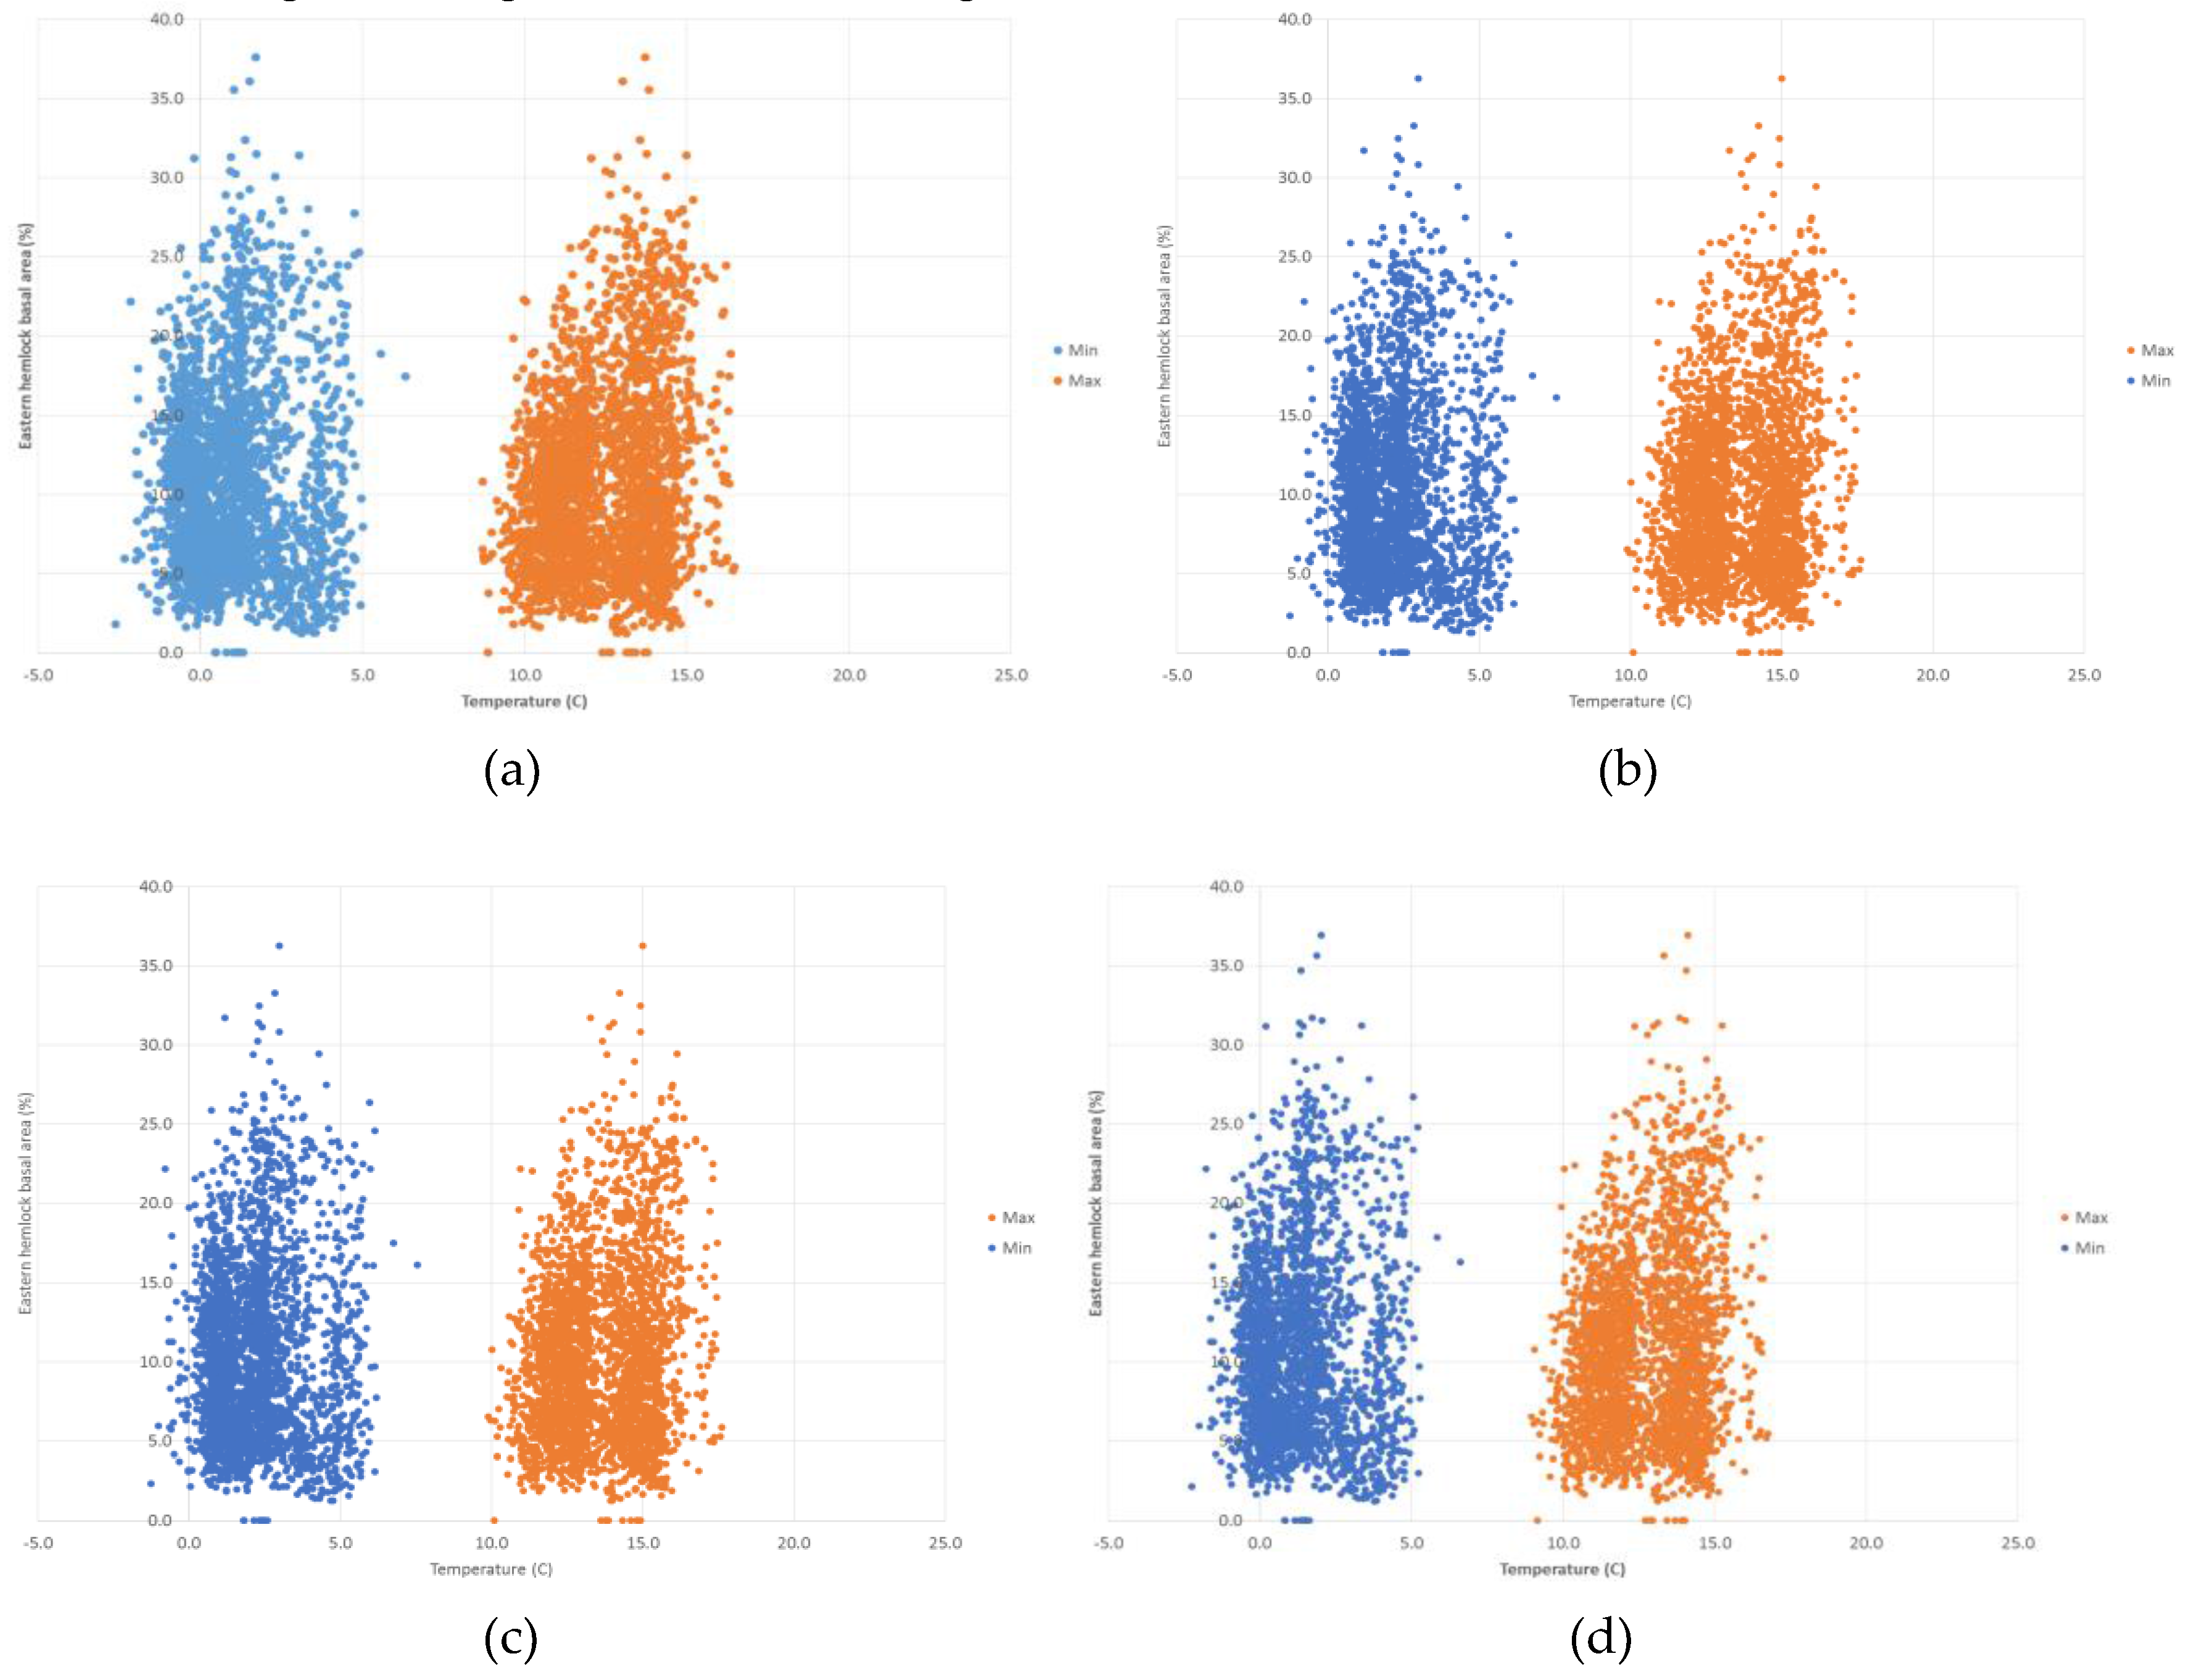
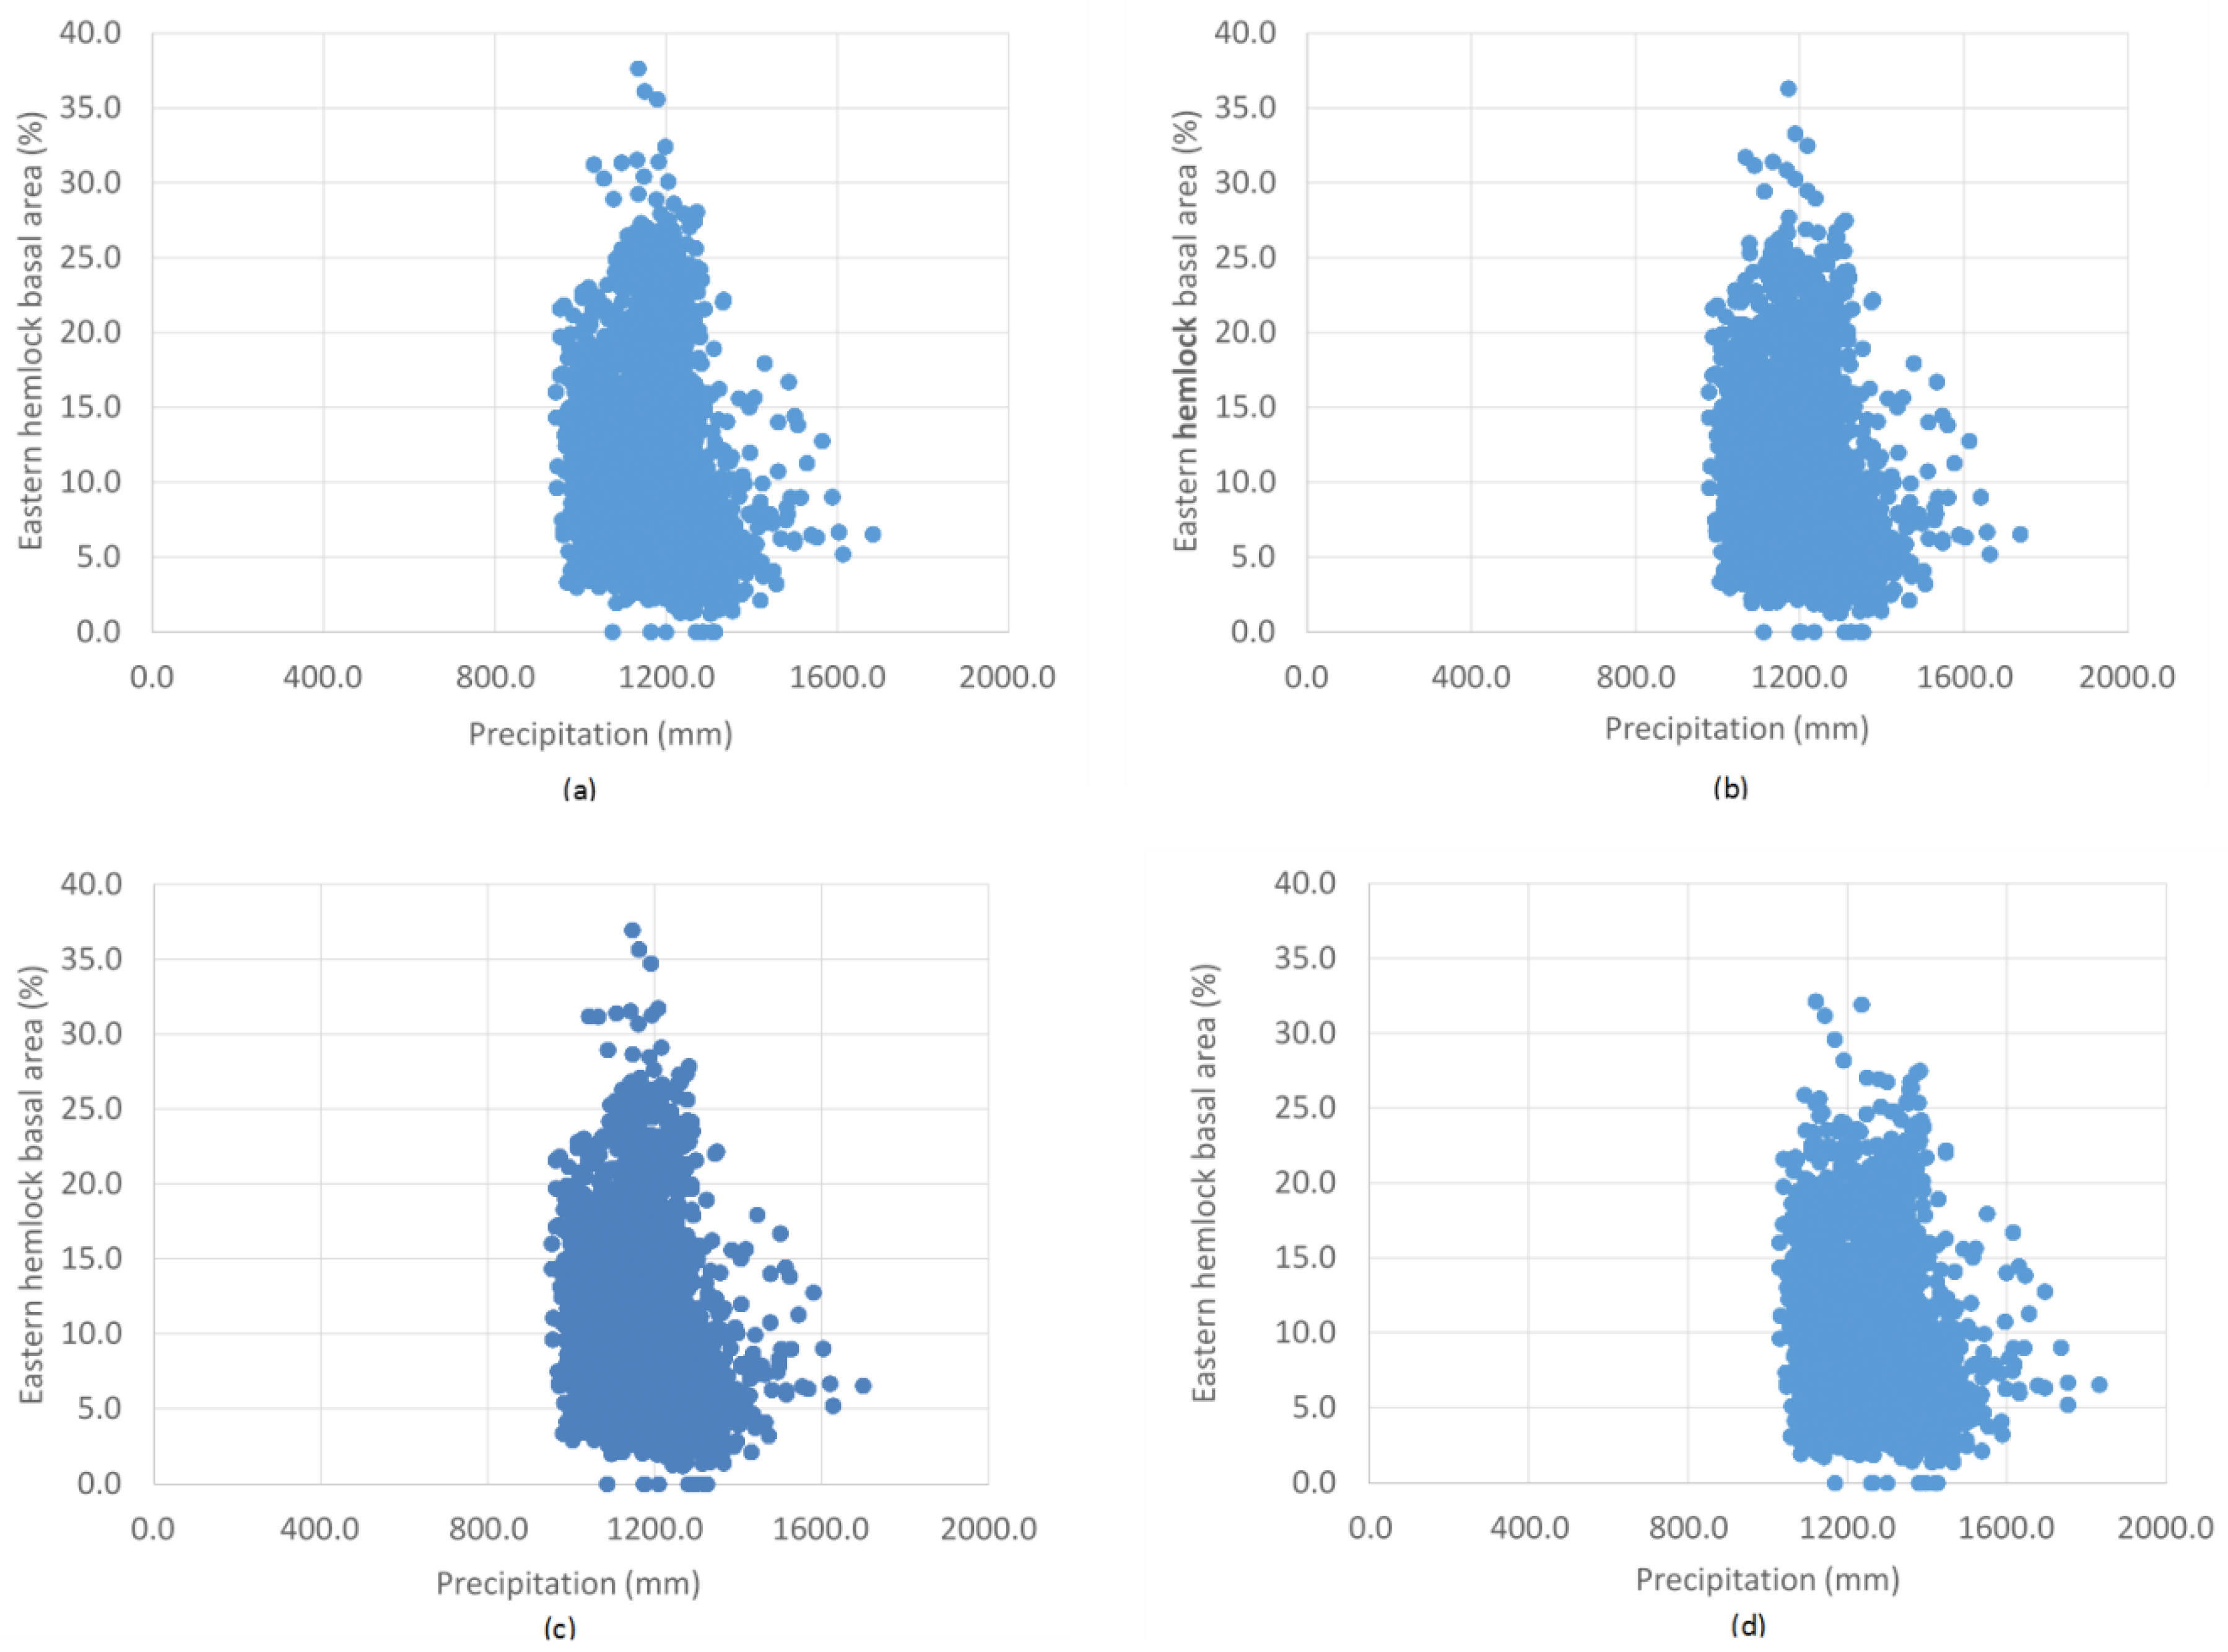
The random forest model predicts the presence of Tsuga canadensis with a threshold average maximum temperature of 10.6 °C, below which Tsuga canadensis ceased to be predicted. A similar threshold exists for a minimum temperature of 2.8 °C. The highest predictions of Tsuga canadensis basal area are in locations with a mean maximum temperature of 12 to 15 °C and a mean minimum temperature of 0 to 5 °C (Figure 6). There does appear to be a threshold value for temperature, where there is a drop in the most dense Tsuga canadensis stands from 37% to 33% by 2100 under RCP 8.5 (Figure 6d). The distribution of Tsuga canadensis appears to remain somewhat uniform across the increases in annual average precipitation predicted under RCP 4.5 and 8.5 (Figure 7). However, there is a noticeable decline in the maximum basal area found within the distribution of these points in the year 2100 under RCP 8.5 (Figure 7d).
The predicted trajectory of expansion for Tsuga canadensis suitable habitat covers a large geographic extent and crosses land currently protected under various conservation easements that can be managed as migration corridors (Figure 8).
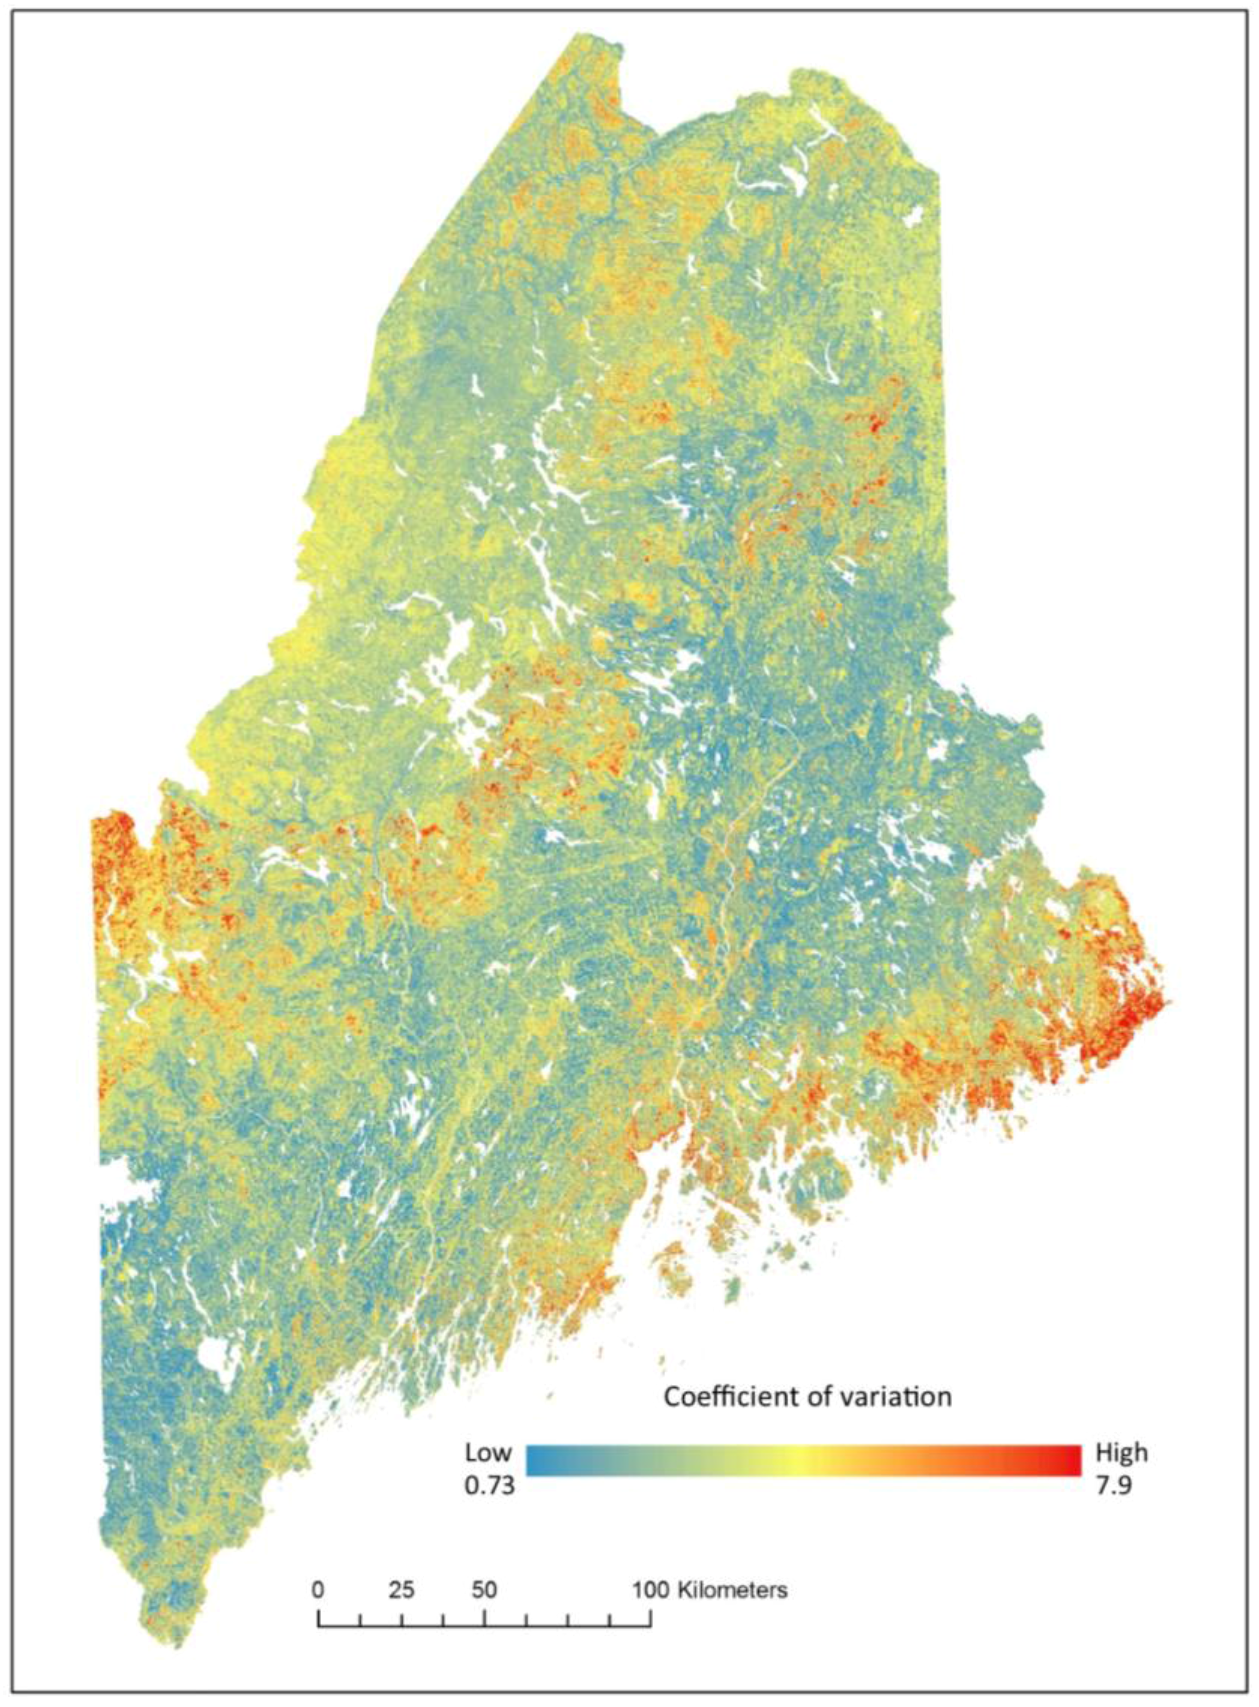
The uncertainty map shows relatively low levels of uncertainty throughout the study area where 42% of pixels have a value <1.0 and 89% of pixels have a coefficient of variation ≤4.0% (Figure 9). The areas with the highest uncertainty correspond with areas containing low levels of Tsuga canadensis (Figure 5 and Figure 9).
4. Discussion
The changing climate will likely permeate major changes in forest structure and composition. Such changes are already being reported and modeling results predict a general trend of habitat suitability expansion northward for tree species [11,13,28]. Overall, our findings are consistent with this trend, suggesting that Tsuga canadensis will find more suitable habitat across Maine, which will generally support relatively low tree density. Under both climate scenarios explored (RCP 4.5 and RCP 8.5), our model predicted that Tsuga canadensis would gain nearly 38% of its current extent in Maine by the year 2050 and this would persist through 2100. An interesting trend in the data is the change in area in the two most extreme categories of abundance; absent, and >30% Tsuga canadensis basal area. These models predict lower concentrations (% basal area) of Tsuga canadensis than were seen in the original model, suggesting that Tsuga canadensis could be more dispersed throughout the landscape and will be found less-frequently in pure stands in the future. These results point to the importance of modeling abundance (continuous distribution) rather than the broader presence–absence-only models that could overestimate small marginal populations [29].
Model predictions of >25% Tsuga canadensis basal area appear to be more responsive to changes in minimum and maximum temperature. The models also suggest that the highest predictions of Tsuga canadensis basal area have a maximum temperature ≤15 °C and minimum temperature ≤5 °C. The temperature thresholds found in these modeling results may be a driving force in the redistribution of Tsuga canadensis in the coming years. Although Tsuga canadensis appears to gain suitable habitat across its geographic range under all climate scenarios, there does appear to be consensus that this will be accompanied by a decrease in abundance in any given geographicarea [13]. The results presented in this study can be used to inform the conservation of migration corridors for tree species by understanding the forecasted suitable habitat for Tsuga canadensis.
Changes in climate will be accompanied by other ecological changes such as an anticipated increase in drought events and a decrease in insect winter mortality. Tsuga canadensis, although frequent cone producers, have low seed viability and require warm, moist soil conditions, with high density overstory [30]. Tsuga canadensis seeds are particularly sensitive to drought events; one study reports a 60% decrease in seed viability after only 2 h of drying, and 80% mortality after 6 h of drying [30]. Not unlike many other species, Tsuga canadensis is facing the combined threats of climate change and invasive species as disturbance agents. The hemlock woolly adelgid (HWA; Adelges tsugae) is also projected to spread across the limits of the state by 2050.
Recent research found that the rate of tree species latitudinal migrations were, on average, <50% of that required to keep pace with the spatial velocity of climate change [31] suggesting that migration success of individual species will require active management. The management of Tsuga canadensis in particular, may include site preparation [30] and the removal of the pervasive competitor, Fagus grandifolia saplings, which are shade tolerant and also susceptible to beech bark disease [5]. Forest and natural resource managers have called for information on climate change effects that is easily accessible and easy to interpret and implement [14]. The migration corridor identified in this study should be one step in this direction.
There will be other changes that occur in response to climate change that will affect the distribution of tree species that were not considered in our habitat suitability model. These changes include, but are not limited to; land use, forest management, and soil moisture availability. These changes will undoubtedly impact species migration and regeneration, but the major drivers of tree species distributions are generally climate variables which can adequately describe suitable habitat using future estimates with the inclusion of other site characteristics that remain fixed. The conservation and active management of migration corridors may be one practical approach to mitigating the effects of climate change.
5. Conclusions
The threshold temperature values evident in the suitable habitat models imply that future work should be carried out to investigate what thresholds exist for the more dominant and economically important species in Maine. The methods used here can be extended to other species and other geographic extents. This work adds to the growing body of evidence that climate change will have a substantial impact on forest ecosystems. Major geographic changes in suitable habitat for tree species will occur within the next 30 years. This shift is taking place more rapidly than many species are migrating. Consequently, active management strategies will be required to conserve individual tree species.
Acknowledgments
This project was supported by the USDA National Institute of Food and Agriculture, Hatch (or McIntire-Stennis, Animal Health, etc.) project #ME0-041516 and through the Maine Agricultural & Forest Experiment Station; Maine Agricultural and Forest Experiment Station Publication #3541. Actual plot locations were obtained through an MOU with the FIA program USDA, Forest Service Northern Research station. The authors would like to thank Richard McCullough and Patrick Jantz for their help securing the data used in this study as well as Steve Sader, Robert Lilieholm, and Kate Beard-Tisdale for feedback on prior drafts.
Author Contributions
K.D. conceived and designed this study with consultation from Aaron Weiskittel and Greg Fiske. K.D. produced modeling results, analyzed data, and created all figures and tables. K.D. and A.W. prepared the manuscript. G.F. provided technical assistance, data, and is the author of the customized python scripts used to process netCDF files.
Conflicts of Interest
The authors declare no conflict of interest.
References
- Campbell, J.L.; Rustad, L.E.; Boyer, E.W.; Christopher, S.F.; Driscoll, C.T.; Fernandez, I.J.; Groffman, P.M.; Houle, D.; Kiekbusch, J.; Magill, A.H.; et al. Consequences of climate change for biogeochemical cycling in forests of northeastern North America. Can. J. For. Res. 2009, 39, 264–284. [Google Scholar] [CrossRef]
- Weiskittel, A.R.; Crookston, N.L.; Radtke, P.J. Linking climate, gross primary productivity, and site index across forests of the western United States. Can. J. For. Res. 2011, 41, 1710–1721. [Google Scholar] [CrossRef]
- Chiang, J.-M.; Iverson, L.R.; Prasad, A.; Brown, K.J. Effects of climate change and shifts in forest composition on forest net primary production. J. Integr. Plant Biol. 2008, 50, 1426–1439. [Google Scholar] [CrossRef] [PubMed]
- Renwick, K.M.; Rocca, M.E. Temporal context affects the observed rate of climate-driven range shifts in tree species. Glob. Ecol. Biogeogr. 2014, 24, 44–51. [Google Scholar] [CrossRef]
- Gottesman, A.J.; Keeton, W.S. Regeneration responses to management for old-growth characteristics in northern hardwood-conifer forests. Forests 2017, 8, 45. [Google Scholar] [CrossRef]
- Orwig, D.A.; Foster, D.R. Forest response to the introduced hemlock woolly adelgid in southern New England, USA. J. Torrey Bot. Soc. 1998, 125, 60–73. [Google Scholar] [CrossRef]
- Orwig, D.A.; Foster, D.R.; Mausel, D.L. Landscape patterns of hemlock decline in New England due to the introduced hemlock woolly adelgid. J. Biogeogr. 2002, 29, 1475–1487. [Google Scholar] [CrossRef]
- Ellison, A.M.; Bank, M.S.; Clinton, B.D.; Colburn, E.A.; Elliott, K.; Ford, C.R.; Foster, D.R.; Kloeppel, B.D.; Knoepp, J.D.; Lovett, G.M.; et al. Loss of foundation species: Consequences for the structure and dynamics of forested ecosystems. Front. Ecol. Environ. 2005, 3, 479–486. [Google Scholar] [CrossRef]
- Stadler, B.; Müller, T.; Orwig, D.; Cobb, R. Hemlock woolly adelgid in New England forests: Canopy impacts transforming ecosystem processes and landscapes. Ecosystems 2005, 8, 233–247. [Google Scholar] [CrossRef]
- Albani, M.; Moorcroft, P.R.; Ellison, A.M.; Orwig, D.A.; Foster, D.R. Predicting the impact of hemlock woolly adelgid on carbon dynamics of eastern United States forests. Can. J. For. Res. 2010, 40, 119–133. [Google Scholar] [CrossRef]
- Rogers, B.M.; Jantz, P.; Goetz, S.J. Vulnerability of eastern US tree species to climate change. Glob. Chang. Biol. 2017, 23, 3302–3320. [Google Scholar] [CrossRef] [PubMed]
- Zolkos, S.; Jantz, P.; Cormier, T.; Iverson, L.; McKenney, D.; Goetz, S. Projected tree species redistribution under climate change: Implications for ecosystem vulnerability across protected areas in the eastern United States. Ecosystems 2015, 18, 202–220. [Google Scholar] [CrossRef]
- Iverson, L.R.; Prasad, A.M.; Matthews, S.N.; Peters, M. Estimating potential habitat for 134 eastern US tree species under six climate scenarios. For. Ecol. Manag. 2008, 254, 390–406. [Google Scholar] [CrossRef]
- Maria, K.J.; Louis, R.I.; Jon, F.; Stephen, D.H.; Matt, D.; Scott, T.; Brad, H.; Christopher, W.S. Assessing stand-level climate change risk using forest inventory data and species distribution models. J. For. 2017, 115, 222–229. [Google Scholar]
- International Institute for Applied Systems Analysis (IIASA). Encyclopedia of Operations Research and Management Science; IIASA: Laxenburg, Austria, 2013; pp. 805–806. [Google Scholar]
- Ahmed, K.F.; Wang, G.; Silander, J.; Wilson, A.M.; Allen, J.M.; Horton, R.; Anyah, R. Statistical downscaling and bias correction of climate model outputs for climate change impact assessment in the U.S. northeast. Glob. Planet. Chang. 2013, 100, 320–332. [Google Scholar] [CrossRef]
- Hayhoe, K.; Wake, C.P.; Huntington, T.G.; Luo, L.; Schwartz, M.D.; Sheffield, J.; Wood, E.; Anderson, B.; Bradbury, J.; DeGaetano, A.; et al. Past and future changes in climate and hydrological indicators in the US Northeast. Clim. Dyn. 2007, 28, 381–407. [Google Scholar] [CrossRef]
- Dunckel, K.; Weiskittel, A.; Fiske, G.; Sader, S.A.; Latty, E.; Arnett, A. Linking remote sensing and various site factors for predicting the spatial distribution of eastern hemlock occurrence and relative basal area in Maine, USA. For. Ecol. Manag. 2015, 358, 180–191. [Google Scholar] [CrossRef]
- PRISM Climate Group. PRISM Climate Data; PRISM Climate Group: Oregon State University, Corvallis, OR, USA, 2004. [Google Scholar]
- Fiske, G. Python Code for netCDF Processing. Available online: http://www.prism.oregonstate.edu (accessed on 2 June 2017).
- Walker, W.S.; Kellndorfer, J.M.; LaPoint, E.; Hoppus, M.; Westfall, J. An empirical InSAR-optical fusion approach to mapping vegetation canopy height. Remote Sens. Environ. 2007, 109, 482–499. [Google Scholar] [CrossRef]
- Briemen, L. Random Forests. Mach. Learn. 2001, 45, 5–23. [Google Scholar]
- Liaw, A.; Weiner, M. Classification and regression by random forest. R News 2002, 2, 18–22. [Google Scholar]
- R Core Team. R: A Language and Environment for Statistical Computing; R Foundation for Statistical Computing: Vienna, Austria, 2014. [Google Scholar]
- Freeman, E. ModelMap: An R Package for Modeling and Map Production Using Random Forest and Stochastic Gradient Boosting; USDA Forest Service, Rocky Mountain Research Station: Ogden, UT, USA, 2009. [Google Scholar]
- Maine Office of GIS. Maine Office of GIS Data Catalog. Available online: http://www.maine.gov/megis (accessed on 2 June 2017).
- Baccini, A.; Goetz, S.J.; Walker, W.S.; Laporte, N.T.; Sun, M.; Sulla-Menashe, D.; Hackler, J.; Beck, P.S.A.; Dubayah, R.; Friedl, M.A.; et al. Estimated carbon dioxide emissions from tropical deforestation improved by carbon-density maps. Nat. Clim. Chang. 2012, 2, 182–185. [Google Scholar] [CrossRef]
- Coops, N.C.; Waring, R.H.; Plowright, A.; Lee, J.; Dilts, T.E. Using remotely-sensed land cover and distribution modeling to estimate tree species migration in the Pacific northwest region of north America. Remote Sens. 2016, 8, 65. [Google Scholar] [CrossRef]
- Ashcroft, M.B.; King, D.H.; Raymond, B.; Turnbull, J.D.; Wasley, J.; Robinson, S.A. Moving beyond presence and absence when examining changes in species distributions. Glob. Chang. Biol. 2017, 23, 2929–2940. [Google Scholar] [CrossRef] [PubMed]
- Godman, R.M.; Lancaster, K. Eastern Hemlock. Available online: https://www.na.fs.fed.us/spfo/pubs/silvics_manual/Volume_1/tsuga/canadensis.htm (accessed on 2 June 2017).
- Sittaro, F.; Paquette, A.; Messier, C.; Nock, C.A. Tree range expansion in eastern North America fails to keep pace with climate warming at northern range limits. Glob. Chang. Biol. 2017, 23, 3292–3301. [Google Scholar] [CrossRef] [PubMed]
Figure 1.
The estimated current distribution of Tsuga canadensis (% basal area) by level II ecoregions at 30 m resolution throughout the state of Maine (a). Maine is located in the northeastern corner of the U.S. (b); Zoom 1 shows relatively low levels of Tsuga canadensis (% basal area) (c); and Zoom 2 shows coastal region with higher levels of Tsuga canadensis (% basal area) (d).

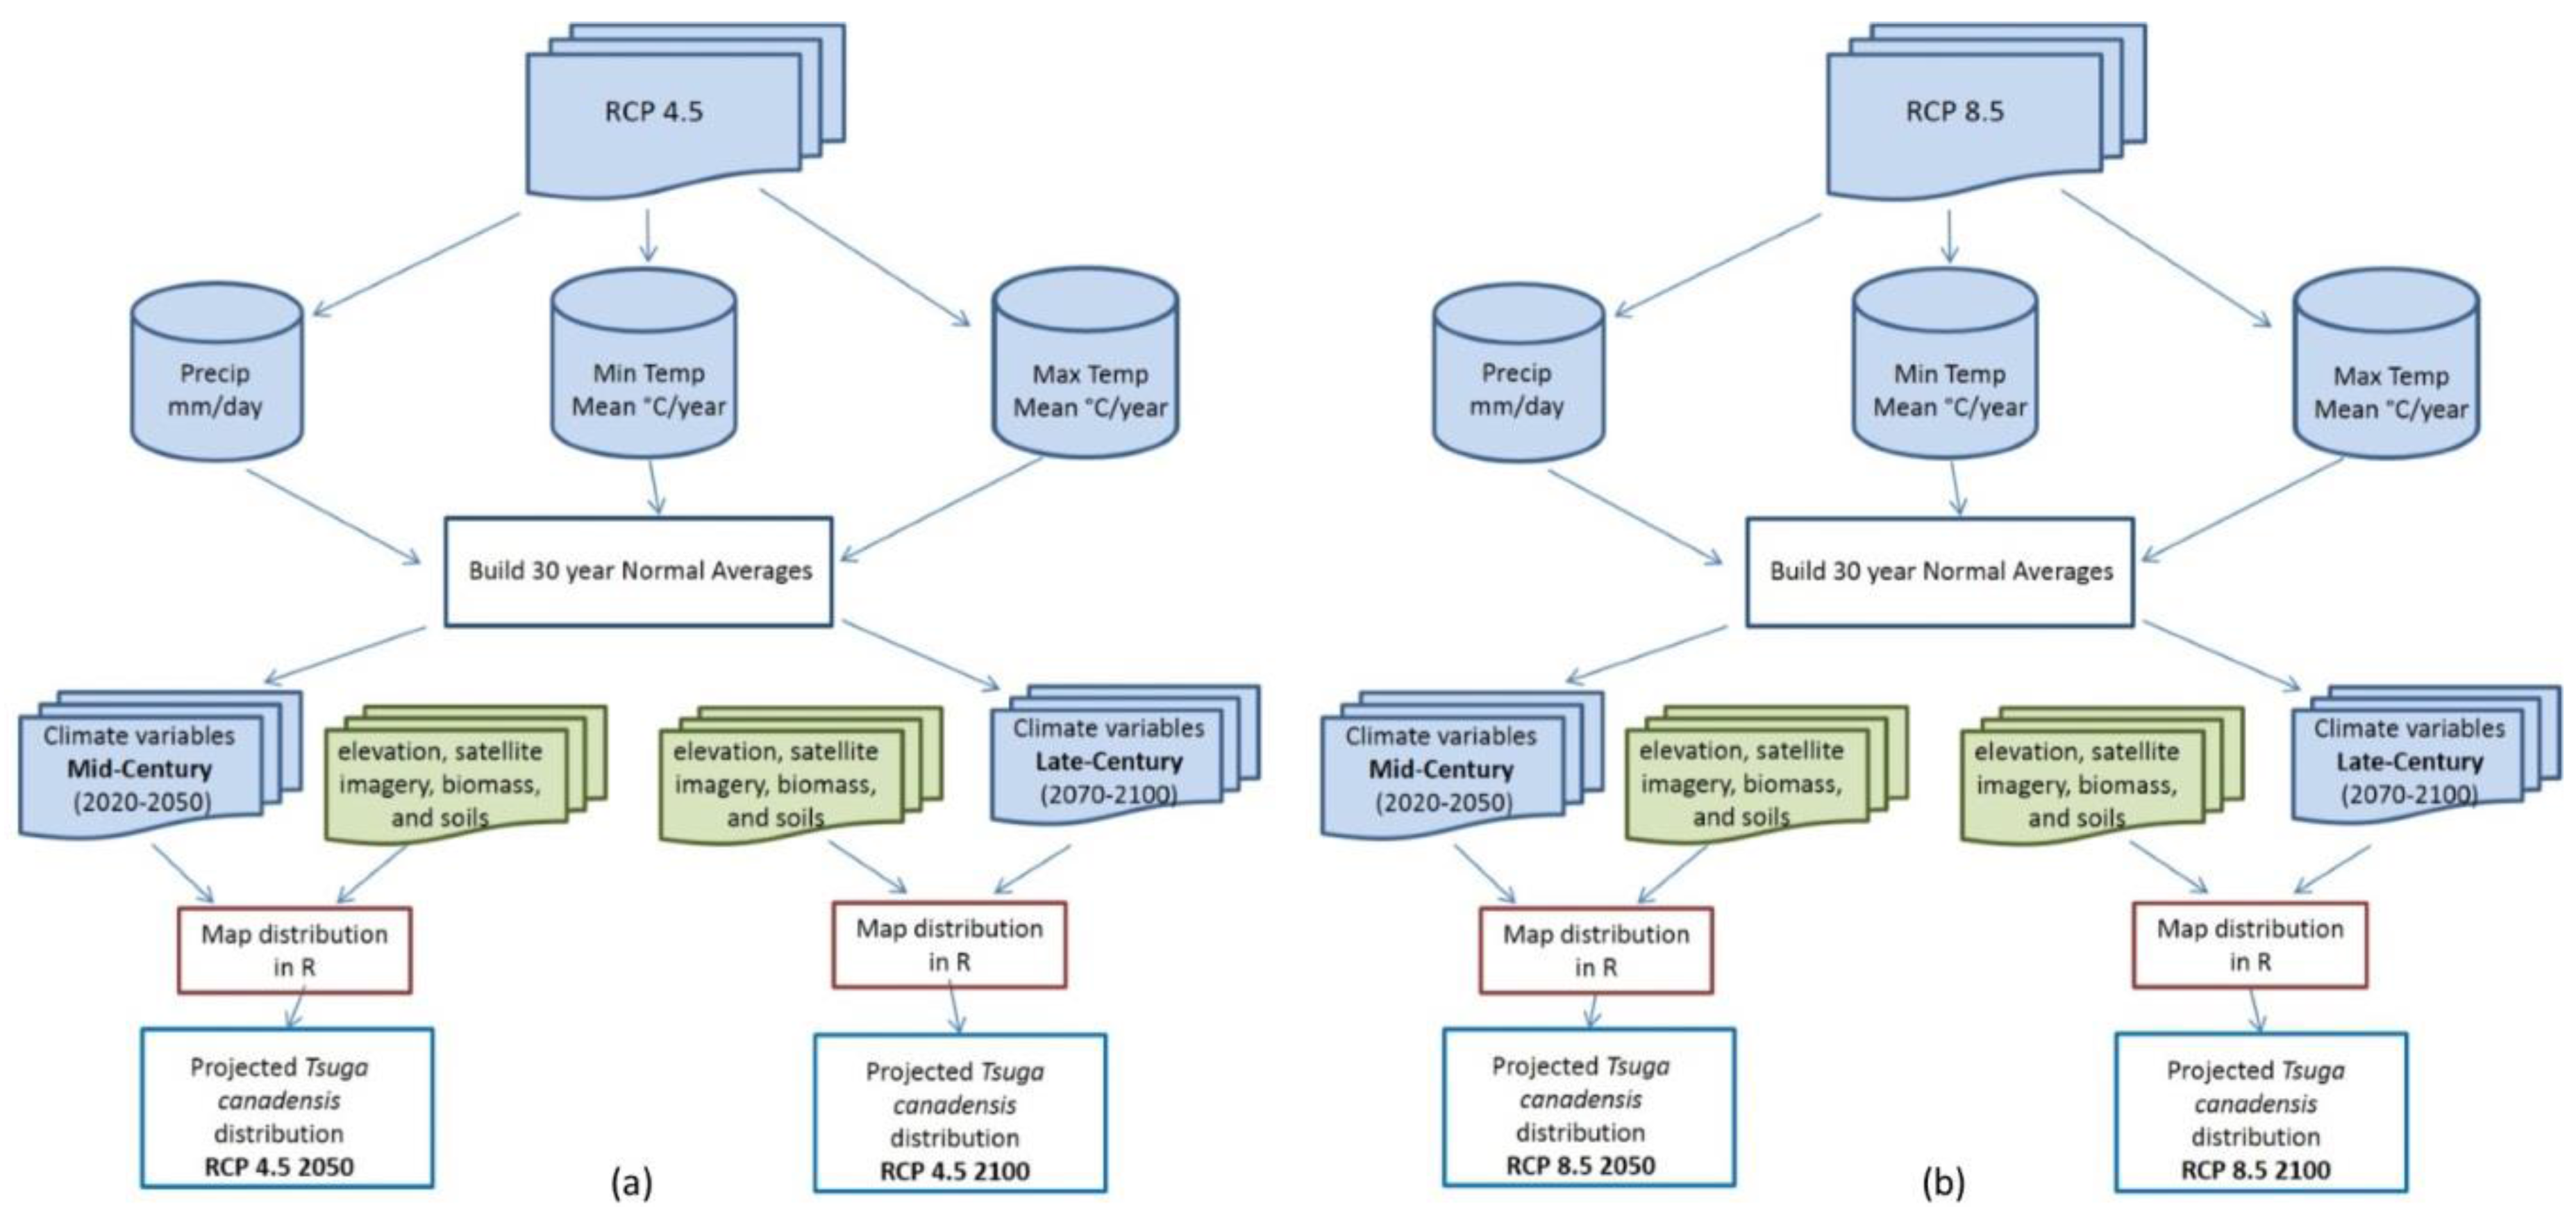
Figure 2.
The general work flow used to process raw netCDF files (available from NASA) into 30 years normal averages that more precisely mirror the PRISM climate data used in Tsuga canadensis current distribution model along with the other predictor variables (green) that remained constant, resulting in four map outputs. (a) Representative Concentration Pathways (RCP) 4.5 2050, RCP 4.5 2100 and (b) RCP 8.5 2050, RCP 8.5 2100.

Figure 3.
Historical and predicted average annual precipitation levels across Maine, U.S. displayed as 30 years normal using PRISM data (1990), RCP 4.5 (2050, 2100) and RCP 8.5 (2050, 2100).
Figure 3.
Historical and predicted average annual precipitation levels across Maine, U.S. displayed as 30 years normal using PRISM data (1990), RCP 4.5 (2050, 2100) and RCP 8.5 (2050, 2100).
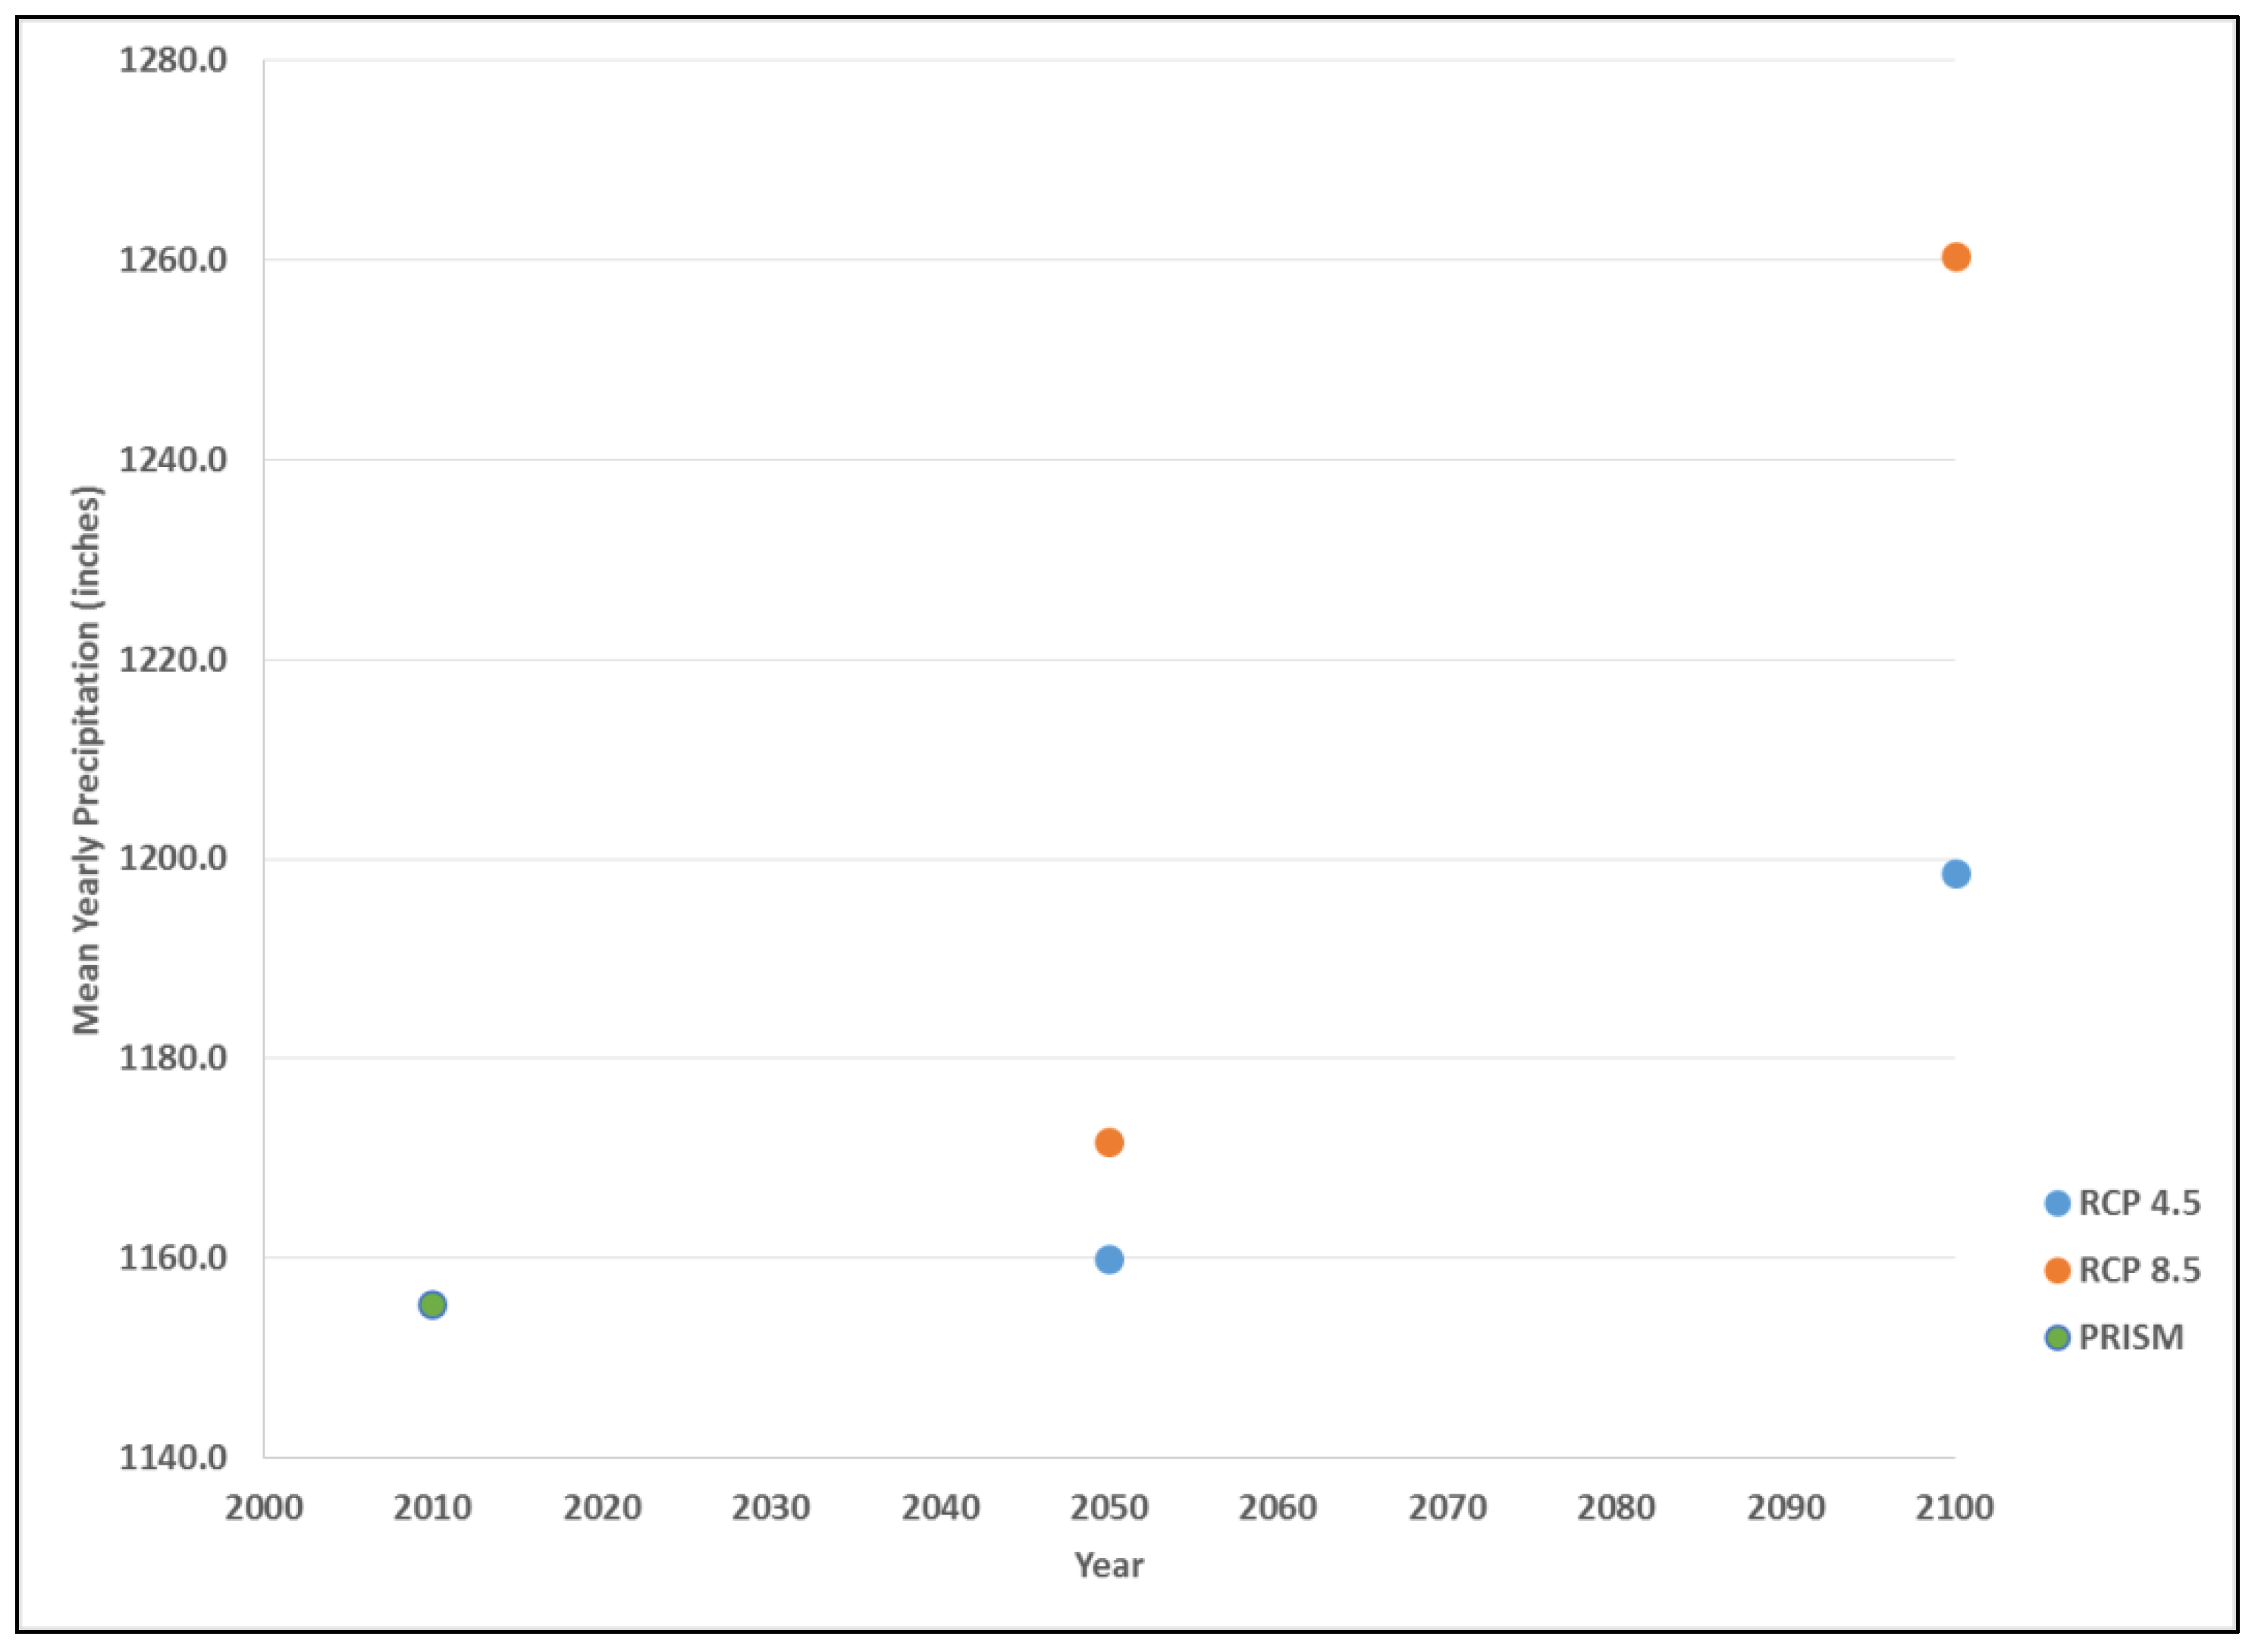
Figure 4.
Thirty year normal minimum and maximum temperature for: PRISM data (1990), RCP 4.5 (2050, 2100), and RCP 8.5 (2050, 2100).
Figure 4.
Thirty year normal minimum and maximum temperature for: PRISM data (1990), RCP 4.5 (2050, 2100), and RCP 8.5 (2050, 2100).

Figure 5.
Predicted future distribution of Tsuga canadensis suitable habitat for various climate change scenarios including: (a) RCP 4.5 (2050), (b) RCP 4.5 2100, (c) RCP 8.5 (2050), and (d) RCP 8.5 (2100).
Figure 5.
Predicted future distribution of Tsuga canadensis suitable habitat for various climate change scenarios including: (a) RCP 4.5 (2050), (b) RCP 4.5 2100, (c) RCP 8.5 (2050), and (d) RCP 8.5 (2100).
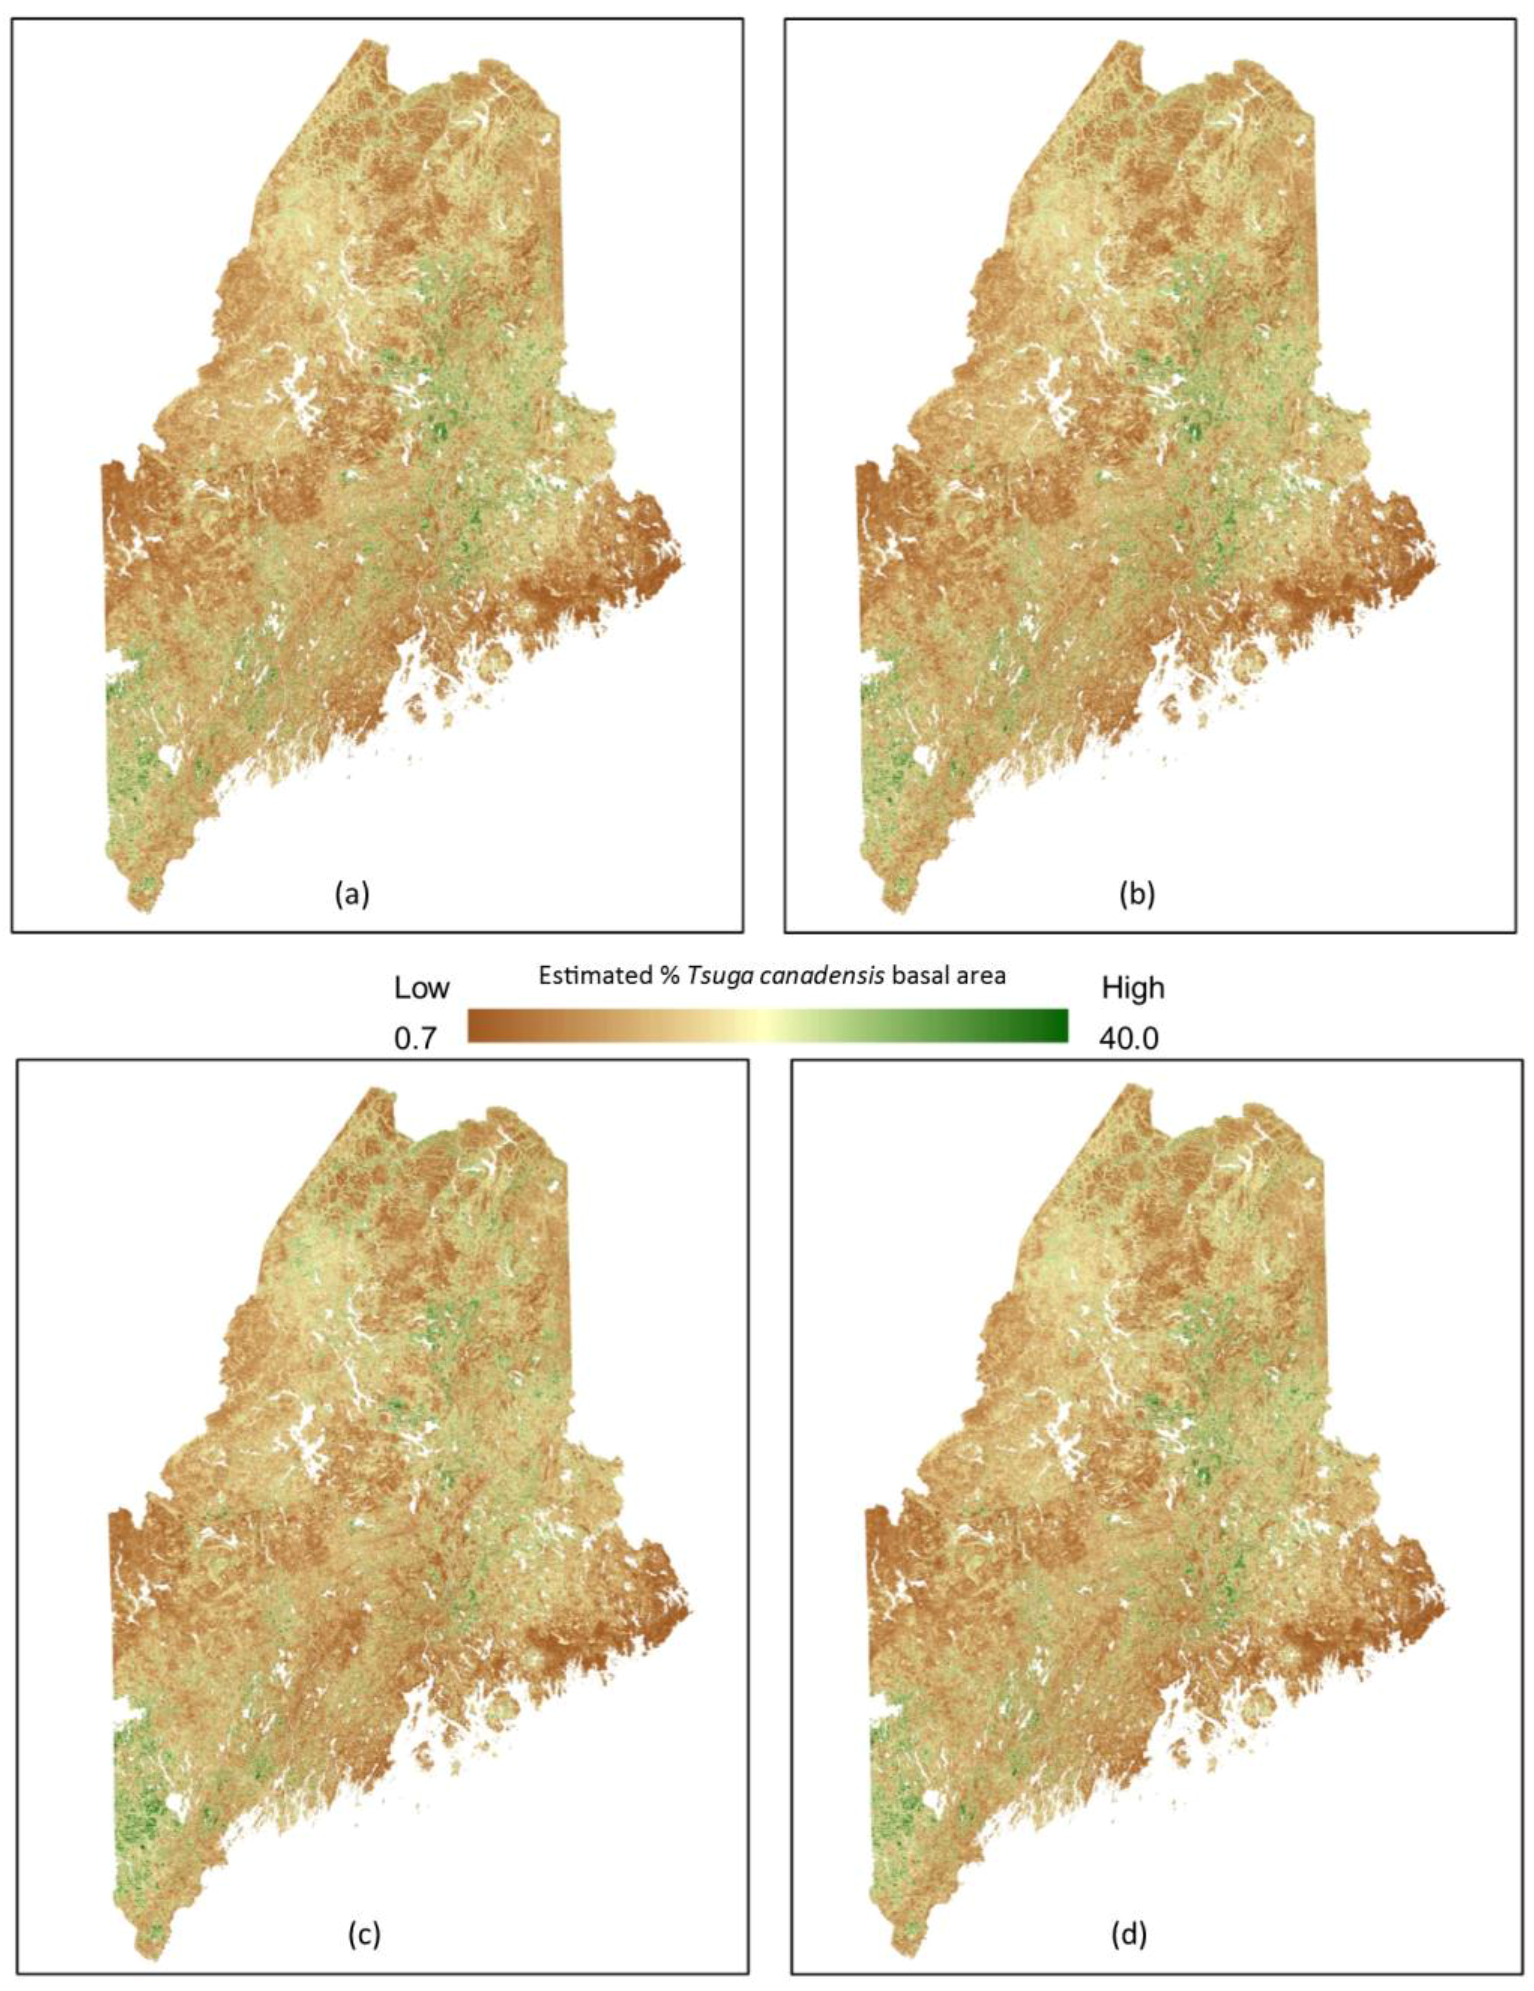
Figure 6.
Projected values for Tsuga canadensis basal area and minimum and maximum temperature for (a) RCP 4.5 (2050), (b) RCP 4.5 (2100), (c) RCP 8.5 (2050), and (d) RCP 8.5 (2100).
Figure 6.
Projected values for Tsuga canadensis basal area and minimum and maximum temperature for (a) RCP 4.5 (2050), (b) RCP 4.5 (2100), (c) RCP 8.5 (2050), and (d) RCP 8.5 (2100).

Figure 7.
The range of precipitation and corresponding Tsuga canadensis basal area values of 2000 randomly generated points across Maine for (a) RCP 4.5 (2050), (b) RCP 4.5 (2100), (c) RCP 8.5 (2050), and (d) RCP 8.5 (2100).
Figure 7.
The range of precipitation and corresponding Tsuga canadensis basal area values of 2000 randomly generated points across Maine for (a) RCP 4.5 (2050), (b) RCP 4.5 (2100), (c) RCP 8.5 (2050), and (d) RCP 8.5 (2100).

Figure 8.
The estimated distribution for Tsuga canadensis as a percent of total stand basal for (a) current estimates (2010) with conserved lands, and (b) predicted distribution for 2050 under RCP 8.5 (high) along with conserved lands that can be managed as migration corridors.
Figure 8.
The estimated distribution for Tsuga canadensis as a percent of total stand basal for (a) current estimates (2010) with conserved lands, and (b) predicted distribution for 2050 under RCP 8.5 (high) along with conserved lands that can be managed as migration corridors.

Figure 9.
Prediction uncertainty of Tsuga canadensis relative basal area for RCP 8.5 in the year 2050 mapped as a coefficient of variation (%) of all trees used in the random forest algorithm.
Figure 9.
Prediction uncertainty of Tsuga canadensis relative basal area for RCP 8.5 in the year 2050 mapped as a coefficient of variation (%) of all trees used in the random forest algorithm.

Table 1.
Tsuga canadensis abundance as a measure of % total stand basal area across the state of Maine using current estimates (2010) provided by Dunckel et al., 2015, with predictions under RCP 4.5 (2050, 2100) and RCP 8.5 (2050, 2100).
Table 1.
Tsuga canadensis abundance as a measure of % total stand basal area across the state of Maine using current estimates (2010) provided by Dunckel et al., 2015, with predictions under RCP 4.5 (2050, 2100) and RCP 8.5 (2050, 2100).
| Tsuga canadensis (% basal area) | Year | |||||||||
|---|---|---|---|---|---|---|---|---|---|---|
| 2010 | 2050 | 2100 | ||||||||
| RCP 4.5 | RCP 8.5 | RCP 4.5 | RCP 8.5 | |||||||
| km2 | m2 ha−1 | km2 | m2 ha−1 | km2 | m2 ha−1 | km2 | m2 ha−1 | km2 | m2 ha−1 | |
| Not present | 64,319 | 0.804 | 2 | 0 | 2 | 0 | 1 | 0 | 0 | 0 |
| 1–15 | 6689 | 0.084 | 64,722 | 0.809 | 65,220 | 0.815 | 66,465 | 0.831 | 68,484 | 0.856 |
| 16–30 | 6703 | 0.084 | 14,392 | 0.180 | 13,933 | 0.174 | 12,770 | 0.160 | 10,820 | 0.135 |
| >30 | 1622 | 0.020 | 217 | 0.003 | 178 | 0.002 | 97 | 0.001 | 29 | 0.000 |
© 2017 by the authors. Licensee MDPI, Basel, Switzerland. This article is an open access article distributed under the terms and conditions of the Creative Commons Attribution (CC BY) license (http://creativecommons.org/licenses/by/4.0/).
Share and Cite
MDPI and ACS Style
Dunckel, K.; Weiskittel, A.; Fiske, G. Projected Future Distribution of Tsuga canadensis across Alternative Climate Scenarios in Maine, U.S. Forests 2017, 8, 285. https://doi.org/10.3390/f8080285
AMA Style
Dunckel K, Weiskittel A, Fiske G. Projected Future Distribution of Tsuga canadensis across Alternative Climate Scenarios in Maine, U.S. Forests. 2017; 8(8):285. https://doi.org/10.3390/f8080285
Chicago/Turabian StyleDunckel, Kathleen, Aaron Weiskittel, and Greg Fiske. 2017. "Projected Future Distribution of Tsuga canadensis across Alternative Climate Scenarios in Maine, U.S" Forests 8, no. 8: 285. https://doi.org/10.3390/f8080285
Note that from the first issue of 2016, this journal uses article numbers instead of page numbers. See further details here.